 Huasha Qi1,2Xiuxiu Sun1,2
 Wuping Yan1,3
 Hang Ye4Jiali Chen1,2
 Jing Yu5Dai Jun6Chunmei Wang1,2
 Tengfei Xia1,2Xuan Chen1,2Dongliang Li1,2
 Daojun Zheng1,2*
- 1Hainan, Academy of Agricultural Sciences, Sanya Institute, Sanya, China
- 2Key Laboratory of Tropic Special Economic Plant Innovation and Utilization, National Germplasm Resource Chengmai Observation and Experiment Station, Institute of Tropical Horticulture Research, Hainan Academy of Agricultural Sciences, Haikou, China
- 3School of Agricultural Sciences, Jiangxi Agricultural University, Nanchang, China
- 4Guangxi Key Laboratory of Special Non-Wood Forest Cultivation and Utilization, Improved Variety and Cultivation Engineering Research Center of Oil-Tea Camellia in Guangxi, Guangxi Forestry Research Institute, Nanning, China
- 5College of Horticulture, Hainan University, Haikou, China
- 6Qionghai Tropical Crop Service Center, Qionghai, China
Tea-oil Camellia is one of the four woody oil crops in the world and has high ecological, economic and medicinal values. However, there are great differences in the classification and merging of tea-oil Camellia Sect. Oleifera species, which brings difficulties to the innovative utilization and production of tea-oil Camellia resources. Here, ISSR, SRAP and chloroplast sequence markers were analyzed in 18 populations of tea-oil Camellia Sect. Oleifera species to explore their phylogenetic relationships and genetic diversity. The results showed that their genetic diversity were low, with mean H and π values of 0.16 and 0.00140, respectively. There was high among-population genetic differentiation, with ISSR and SRAP markers showing an Fst of 0.38 and a high Nm of 1.77 and cpDNA markers showing an Fst of 0.65 and a low Nm of 0.27. The C. gauchowensis, C. vietnamensis and Hainan Island populations formed a single group, showing the closest relationships, and supported being the same species for them with the unifying name C. drupifera and classifying the resources on Hainan Island as C. drupifera. The tea-oil Camellia resources of Hainan Island should be classified as a special ecological type or variety of C. drupifera. However, cpDNA marker-based STRUCTURE analysis showed that the genetic components of the C. osmantha population formed an independent, homozygous cluster; hence, C. osmantha should be a new species in Sect. Oleifera. The C. oleifera var. monosperma and C. oleifera populations clustered into two distinct clades, and the C. oleifera var. monosperma populations formed an independent cluster, accounting for more than 99.00% of its genetic composition; however, the C. oleifera populations contained multiple different cluster components, indicating that C. oleifera var. monosperma significantly differs from C. oleifera and should be considered the independent species C. meiocarpa. Haplotype analysis revealed no rapid expansion in the tested populations, and the haplotypes of C. oleifera, C. meiocarpa and C. osmantha evolved from those of C. drupifera. Our results support the phylogenetic classification of Camellia subgenera, which is highly significant for breeding and production in tea-oil Camellia.
Introduction
Within genus Camellia of family Theaceae, the more than 30 species of tea-oil Camellia are woody, oil-bearing tree species with a high content of seed oil that is widely processed into skin and health care products and edible oil (Chen et al., 2022). China is their place of origin and the main country where they are produced. Tea-oil Camellia is a major woody edible oil crop in China with a cultivated area of approximately 466 ha (Zhang et al., 2021). The tea-oil contained in the seed kernels of tea-oil Camellia fruit was listed as a healthy edible oil by the United Nations Food and Agricultural organization (FAO) in 2004. Tea oil is rich in squalene, vitamin E, Camellia glycosides and unsaturated fatty acids (Ma et al., 2011; Xiao et al., 2017). The content of unsaturated fatty acids in the edible oil is higher, reaching approximately 90%, and the content of oleic acid can reach approximately 87%. Tea oil is referred to as “Oriental olive oil” (Ye et al., 2020; Lin et al., 2022).
Sect. Oleifera belongs to genus Camellia of family Theaceae, and C. oleifera, C. vietnamensis, C. gauchowensis, and C. oleifera var. monosperma in this group are the main cultivated tea-oil species in China. At present, the main classification systems for Camellia, the Zhang (1998) system and the Min (1999) system, are based on morphology. Due to the morphological similarity among Camellia species and the rich diversity of the species in different regions, the two taxonomic systems provide different views regarding the taxonomic status of different Camellia species, including Camellia species in Sect. Oleifera. For example, there are five species and one variant of Sect. Oleifera under the Zhang Hongda system, including C. gauchowensis, C. lanceoleosa, C. sasanqua, C. oleifera, C. vietnamensis and C. oleifera. var. monosperma; however, there are 6 species under the Min Tianlu system in Flora of China (English version; Min and Bruce, 2007), in which C. oleifera var. monosperma is merged with C. oleifera, C. gauchowensis is combined with C. vietnamensis and these species are collectively referred to as C. drupifera. To clarify the taxonomic relationships among Camellia species, scholars have analyzed the phylogenetic relationships among different Camellia species using molecular taxonomy, such as taxonomies based on molecular markers (Shi et al., 1998; Vijayan et al., 2009; Li et al., 2020) and cpDNA (Yang et al., 2014, 2016), but there are no reports of the molecular evaluation and identification of the genetic relationships between Sect. Oleifera species. Disputes over classification have made the innovative utilization of tea-oil Camellia resources and production of tea-oil Camellia difficult.
Hainan Island is the southernmost edge of the distribution of tea-oil Camellia resources in China, characterized by a unique tropical-island climate appropriate for tea-oil Camellia and the isolation barrier formed by the Qiongzhou Strait (Ye et al., 2020). The tea-oil Camellia resources on Hainan Island are rich in significant morphological specialization (Zheng et al., 2016; Zhang et al., 2017). Our research showed that there are excellent tea-oil Camellia resources on Hainan Island with large fruit, thin skin and a high oil yield. The quality of tea oil from Hainan Island is also different from that in the main production areas in mainland China. These resources provide important genetic material for the breeding and improvement of tea-oil Camellia in China. Their excellent qualities have attracted considerable attention from researchers (Yao et al., 2019; Zhang et al., 2019; Xu et al., 2020; Ye et al., 2020, 2021). However, from the perspective of academia and production, the classification of tea-oil Camellia resources on Hainan Island is not clear.
Intersimple sequence repeat (ISSR) and sequence-related amplified polymorphism (SRAP) markers are two types of dominant markers that have been widely used in the identification and evaluation of plant populations (Hiremath et al., 2021; Song et al., 2021). Because of the maternal inheritance of plant cpDNA, it carries traces of the entire evolutionary history of plants (Ren et al., 2019), and cpDNA analysis is one of the main molecular methods used in studies of plant taxonomic identification and evolutionary origins (Almerekova et al., 2021; Hirota et al., 2021). In the present work, ISSR and SRAP markers and cpDNA sequence markers were used to study the genetic differentiation and relationships of C. oleifera, C. vietnamensis, C. gauchowensis, and C. oleifera var. monosperma along with C. osmantha, a new species of Camellia, and the tea-oil Camellia resources on Hainan Island. Our aims were: 1. to clarify the phylogenetic relationships among C. oleifera, C. vietnamensis, C. gauchowensis and C. oleifera. var. monosperma; 2. to determine whether C. osmantha can be considered a new independent species of Sect. Oleifera; 3. to identify and classify tea-oil Camellia resources on Hainan Island, including the species of these resources and whether they may represent an independent species or a specific taxonomic group within a species; and 4. to evaluate the genetic diversity and genetic differentiation among tea-oil Camellia resource populations from Sect. Oleifera species, including whether there is frequent gene flow among them.
Materials and methods
Plant materials collection
We collected samples from 18 populations, including four populations of C. vietnamensis and two populations of C. oleifera. var. monosperma, two populations of C. oleifera, two populations of C. gauchowensis, one population of C. osmantha and seven populations of tea-oil Camellia resources on Hainan Island, all of which are old seedling forest populations. The JXP and FY6 populations of C. sinensis from Jiangxi and Fujian, respectively, China, were used as an outgroup.
In the sampling of each population, the individual interval was greater than 15 meters. A total of 8 healthy young leaves were selected from each sample, washed with 75% alcohol, and immediately placed in silica gel for drying and sealing for subsequent molecular experiments. See Figure 1 and Supplementary Table 1 for basic information such as the number of individual plants collected and population information. During the chloroplast sequence analysis, five germplasm materials were randomly selected from each population.
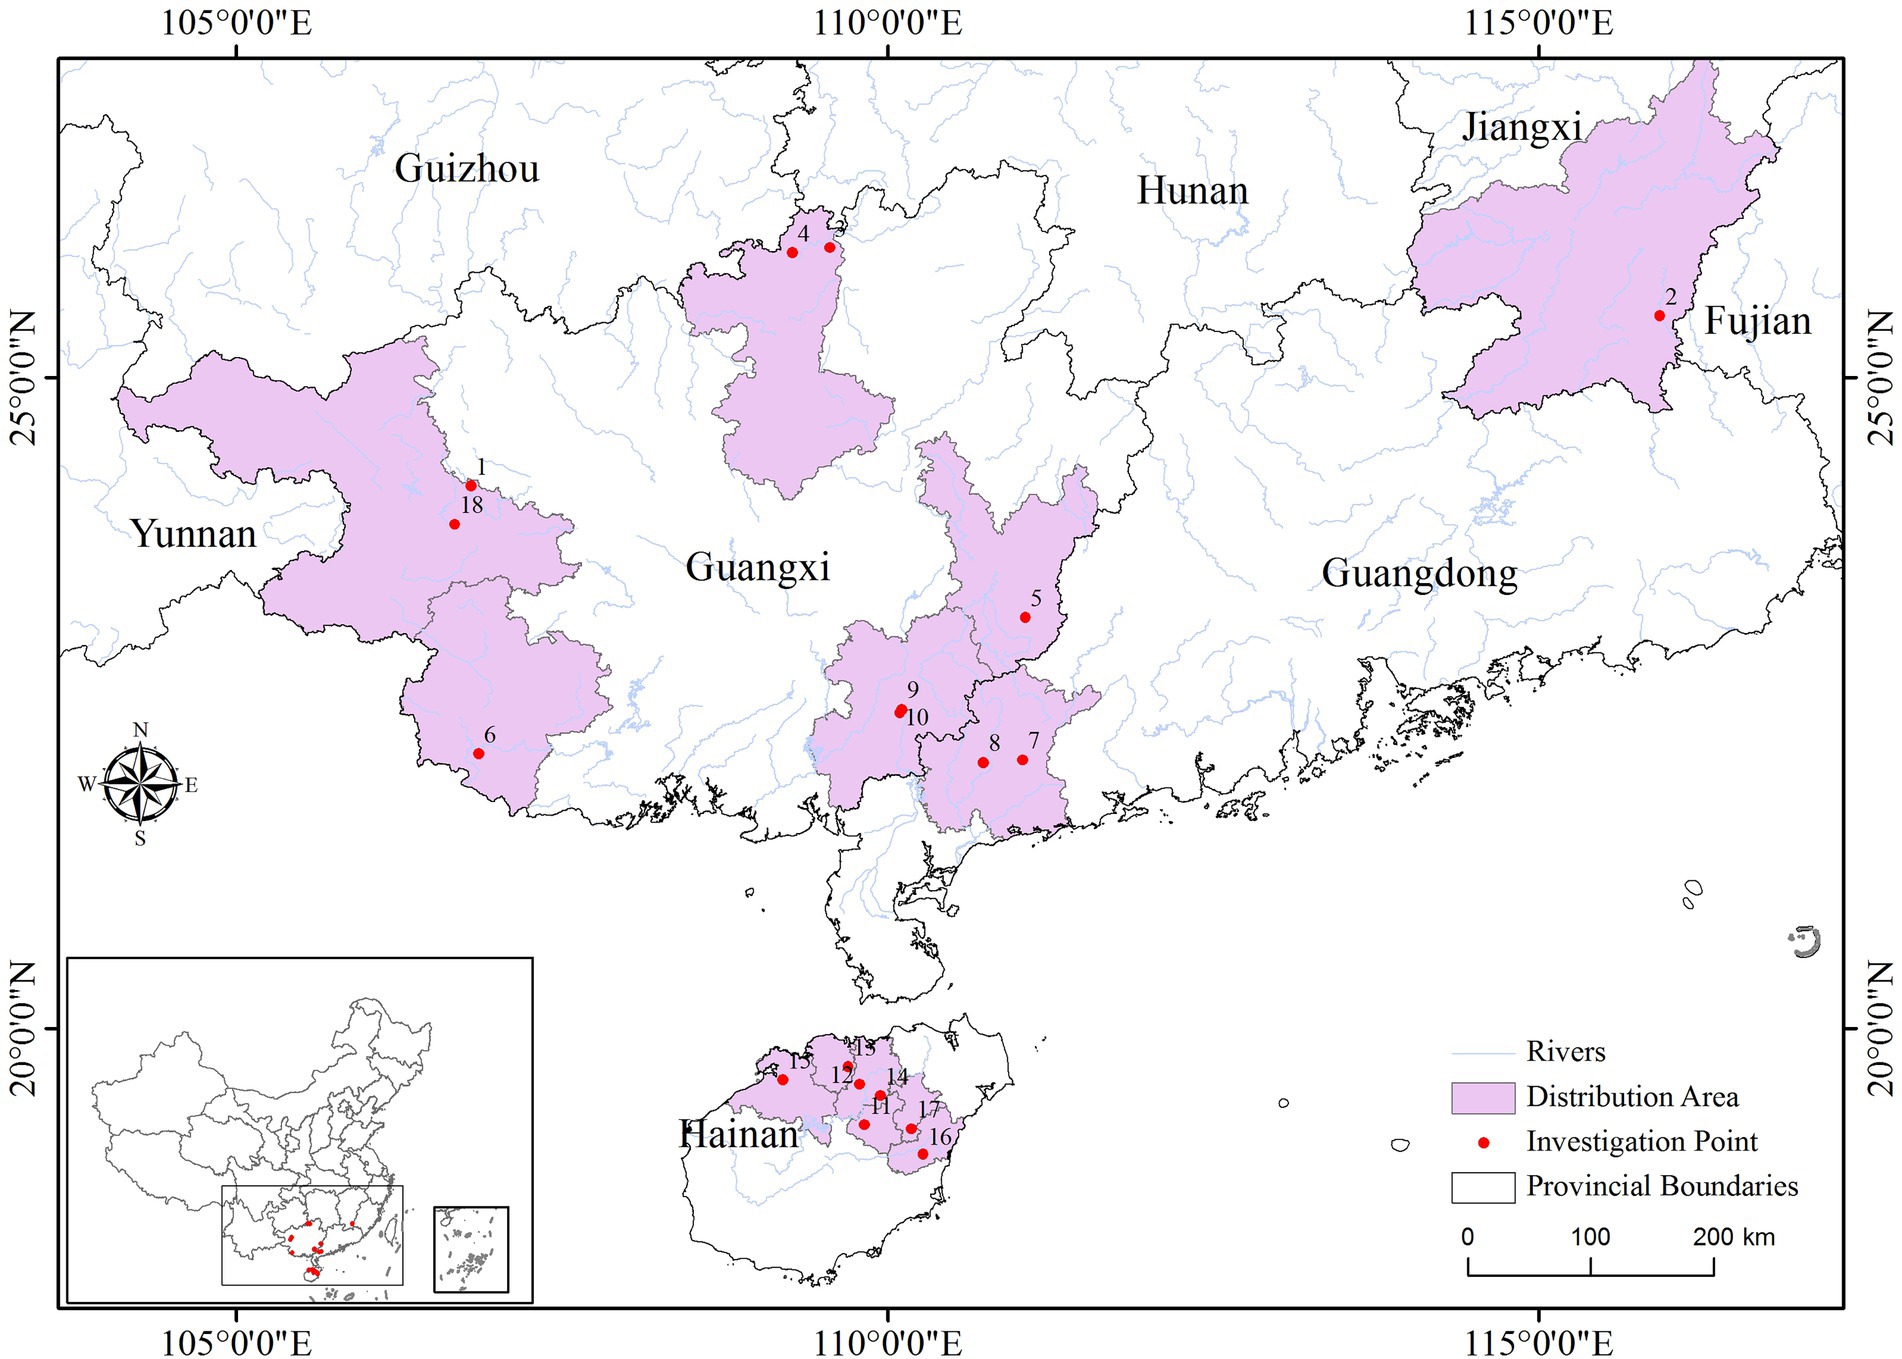
Figure 1. Sampling and distribution.
ISSR-PCR analysis
We performed ISSR-PCR to analyze 413 accessions from the 18 populations of Camellia spp. using 14 primers (Supplementary Table 2) and 2× San Taq PCR Mix (Sangon, Shanghai, China) following the manufacturer’s protocol. The PCR cycling conditions were as follows: initial denaturation at 94°C for 5 min; 40 cycles of denaturation at 94°C for 45 s, annealing at 53°C (or at primer-specific temperatures, see Supplementary Table 2) for 45 s and extension at 72°C for 1.5 min; with a final extension step at 72°C for 7 min.
Sequence-related amplified polymorphism-PCR analysis
Sequence-related amplified polymorphism-PCR was performed to analyze 413 accessions from the 18 populations of Camellia spp. with 22 primer pairs (Supplementary Table 2). Following Qi et al. (2020), the PCR cycling conditions were as follows: initial denaturation at 94°C for 5 min; followed by 35 cycles of denaturation at 94°C for 60 s, annealing at 55°C (or at primer-specific temperatures, see Supplementary Table 2) for 60 s and extension at 72°C for 1.5 min; with a final extension step at 72°C for 7 min. Products were resolved on 1.5% agarose gels.
Assessment of chloroplast sequence markers
Chloroplast genome sequencing was performed on all samples to screen single-base-variant ectopic sites and insertion/deletion sites. Five pairs of chloroplast gene fragment sequences were independently used. The amplified chloroplast gene fragment products were sequenced by Tianyihuiyuan Gene Technology Co., Ltd. Wuhan, China.
The amplification programs were as follows: pre-denaturation at 94°C for 5 min; 40 cycles of denaturation at 94°C for 1 min, annealing at 60°C for 1 min (annealing at primer temperatures, see Supplementary Table 3), and extension at 72°C for 1.5 min; and a final extension at 72°C for 10 min, followed by storage at 4°C. The volume of the reverse transcription reaction system was 30 μl, including 40 ng template DNA, 0.20 mmol/l dNTPs, 0.60 μMol/l primers, and 4.00U Taq DNA polymerase.
Statistical analysis
Quantification of amplified bands
Clearly visible and repeatable bands were recorded as “1,” and the absence of a band at a particular position was recorded as “0.” Therefore, original matrices were established using the 0 and 1 scores. The amplification bands of each primer were counted, and the percentage of polymorphism (PPB) of each primer was calculated. The MXComp program in 02 software was used for the Mantel statistical test (1967) to analyze ISSR and SRAP data to compare the correlation between the two genetic similarity coefficient matrices.
Analysis of genetic diversity
Assuming valid Hardy–Weinberg equilibrium (HWE; Jubair et al., 2021; Graffelman and Weir, 2022; Yarar et al., 2022), we used POPGENE 1.32 software to analyze the original ISSR-PCR and SRAP-PCR data and determine genetic diversity indexes, including the percentage of polymorphic sites (P), observed number of alleles (Na), effective number of alleles (Ne), Shannon’s information index (I), and Nei’s gene diversity (H). DnaSP software was used to for the haploid analysis of 5 chloroplast sequences in different individuals and populations. The number of polymorphic sites (S), number of haplotypes (h), haplotype diversity (Hd), nucleotide diversity (π) and average number of nucleotide differences (K) were recorded.
To determine the degree of variation in genetic diversity among the test populations, the Na, Ne, H, I, and p values of the 18 populations were analyzed based on the coefficient of variation (CV), CV = (SD/mean) × 100%. To compare and evaluate the differences in genetic diversity among the populations, the Pearson correlation coefficients between ISSR markers and SRAP markers were analyzed using SPSS20 to verify the consistency of the results.
Relatedness and kinship analysis
To clarify the genetic relationships between populations and species from tea-oil Camellia. we performed the following steps: (1). Assuming that marker A was in Hardy–Weinberg equilibrium (HWE), POPGENE1.32 software was used to calculate the Nei’s genetic distance (GD) between the tested populations. (2). GenAlEx 6.5 software was used to analyze Fst and Nm based on cpDNA. (3). NTSYS-PC (2.02j) and MEGA6 were used to cluster the test populations by principal component analysis (PCA) and phylogenetic tree (Unweighted pair group method with arithmetic means, UPGMA tree; Neighbor-joining, NJ tree) analysis. (4) Based on the Bayesian selection allele frequency association model, STRUCTURE 2.3.2 was used to analyze the genetic composition of different individuals in the 18 tea-oil Camellia populations. After running this analysis, STRUCTURE 2.3.2 software was used to obtain the average L(K) value corresponding to each K value to determine the optimal K value (Evanno et al., 2005).
Phylogenetic relatedness and haplotype network analyses
DnaSP 5.0 was used to assess the number of haplotypes and the haplotype diversity of cpDNA in each group. A Neighbor-joining tree was constructed based on chloroplast haplotypes with MEGA6 software. The cpDNA haplotypes and their frequencies in each population are illustrated in pie charts. We used geographic information system (GIS) tools to map the sites of each population. NETWORK 5.0011 was used to construct a haplotype network diagram. The results were visualized by Cytoscape.
Analysis of historical population dynamics
To assess historical population dynamics, the mismatch distribution was estimated using DnaSP 5.0. For Tajima’s neutrality test, Tajima’s D values were tested for significant deviations from the null hypothesis of neutral evolution and constant population size.
Results
Primer amplification results among populations
A total of 198 bands were obtained from 14 ISSR primers, and the number of bands generated with each primer ranged from 11 to 17 (average 14.14), with an average percentage of polymorphism of 97.96% (91.67–100%). For SRAP markers, 291 bands were obtained, with an average PPB of 95.08% (76.92–100%), and the number of bands generated with each primer ranged from 8 (ME12-EM3) to 18 (ME8-EM1; average 9.18).
A total of five chloroplast sequences were obtained for this study, and the information of each sequence and its primers is shown in Supplementary Table 3. The aligned length of the five cpDNA sequence fragments was 2,971 base pairs (bp), with a total of 63 polymorphic sites (S), and the number of haplotypes (h) was 90 (Supplementary Table 3). The sequence fragment lengths of ZDJ43, ZDJ78, ZDJ87, ZDJ124 and ZDJ193 were 519, 726, 517, 616, and 593 bp, and they included 4, 23, 13, 17 and 6 polymorphic sites, respectively. The total h of the five aligned cpDNA sequence fragments was 53, ranging from 3 to 19, with an average of 10.60 (Supplementary Table 3).
Genetic diversity of the 18 tested populations
The results of the Mantel test showed that there was a positive correlation between the genetic similarity coefficient matrices of ISSR and SRAP (r = 0.70). A correlation analysis (Pearson test) of the genetic diversity indexes of each population calculated based on the two marker types was carried out, and it was found that there was a significant positive correlation between the genetic diversity index data of the two markers, with Pearson correlation coefficients of 0.81 (p < 0.01) for Na and I with P, and 0.79 (p < 0.01) for both Ne and H. This showed that there was high consistency in the analyses of the 18 tested populations based on ISSR and SRAP markers. In the analysis and the discussion presented later in this paper, the comprehensive ISSR and SRAP data are used for analysis.
The results of ISSR and SRAP analyses showed that (Table 1), under Hardy–Weinberg equilibrium, the total genetic diversity of the tested populations was relatively high, with Na, Ne, H, I and p values of 1.97, 1.39, 0.25, and 0.39 and 96.52%, respectively, but the average level was lower, with Na, Ne, H, I and p values of 1.46, 1.28, 0.16, 0.24, and 46.47%, respectively. The ranges of H, I and PPB among the 18 populations were 0.13–0.22, 0.20–0.32, and 36.20–60.12%, respectively. The highest genetic variation was observed in the CKX population, with H, I and p values of 0.22, 0.32 and 60.12%, respectively, followed by the HCX population, whereas 7 populations on Hainan Island (JX, ZX, LS, XYL, MNL, MP, and FH) showed the lowest genetic variation, with H, I and p values lower than 0.14, 0.22 and 43.15%, respectively. The genetic variation levels among the tested populations were quite different, and the CV values of H, I and P were 16.32, 15.66 and 15.17%, respectively.
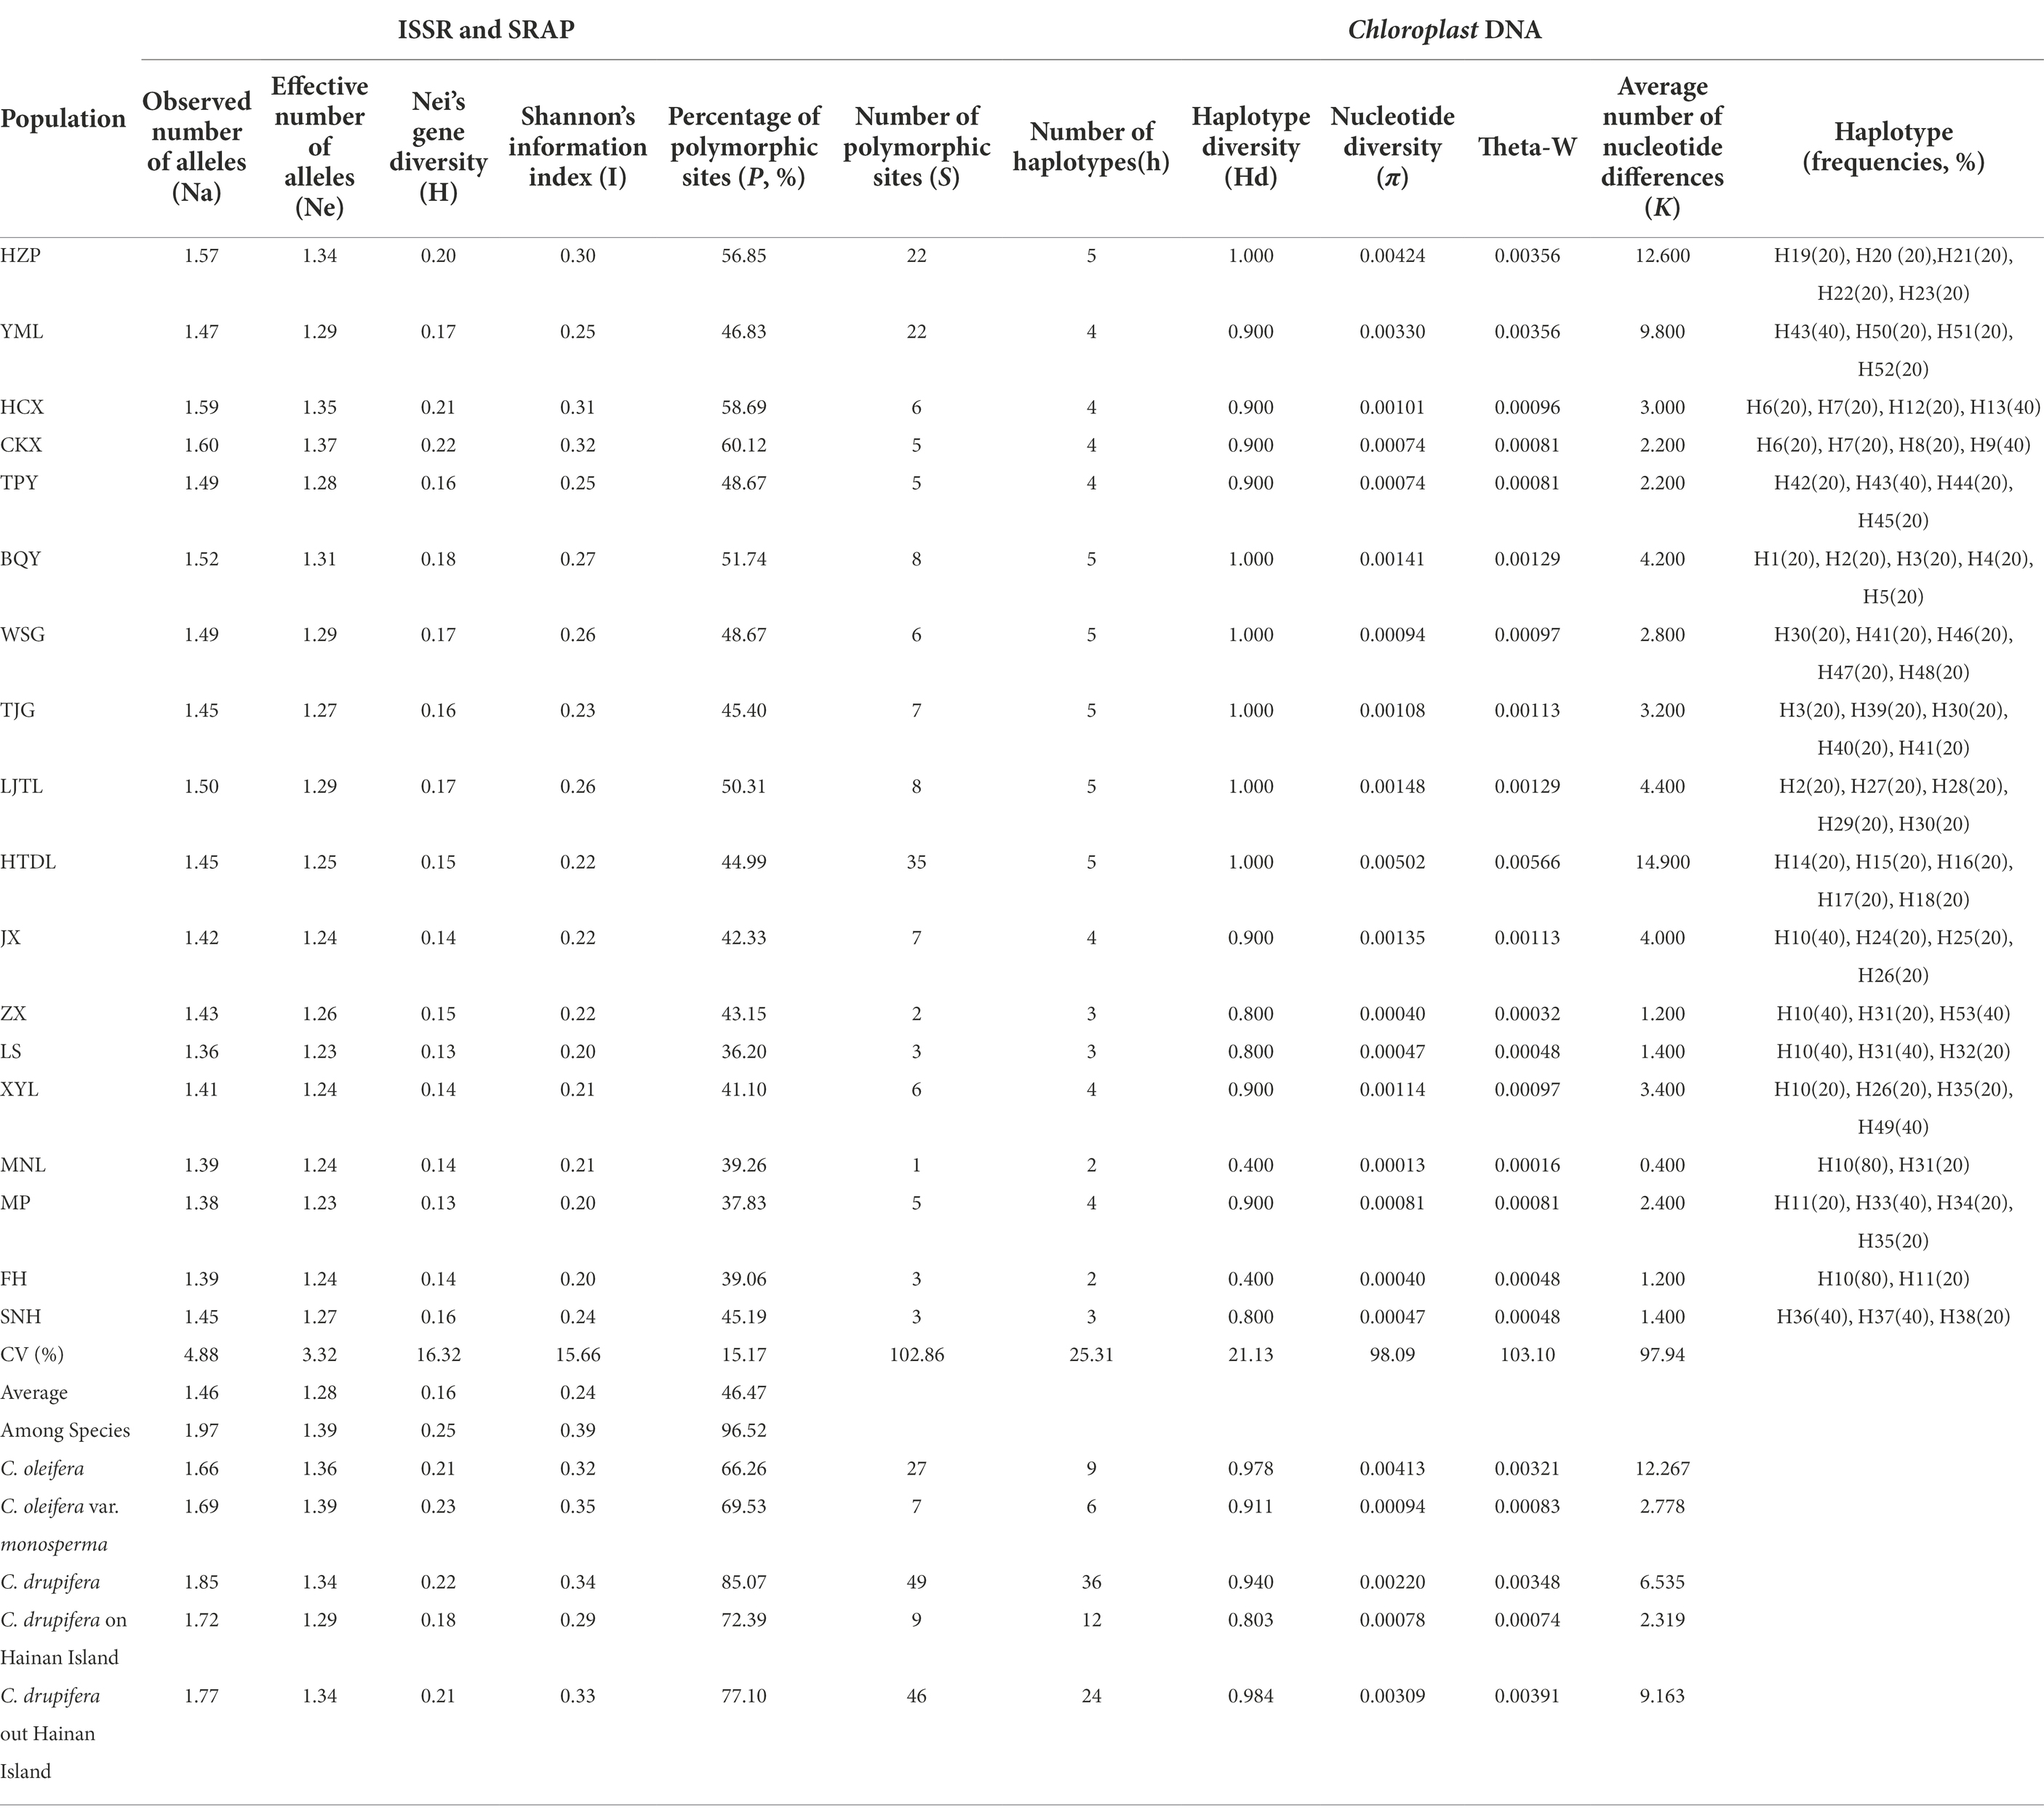
Table 1. Genetic diversity of the 18 tested populations of tea-oil Camellia resources in Sect. Oleifera based on ISSR, SRAP and chloroplast sequence markers.
The results of analyzing the five chloroplast sequences showed (Table 1) that the total genetic diversity level of the tested populations was low, the π and theta-W values were 0.00388 and 0.00418, respectively; and the average π and theta-W values were only 0.00139 and 0.00138, respectively. The HTDL population showed a higher S value of 35, with a π of 0.00502, indicating high genetic diversity. The next highest genetic diversity was observed for the HZP and YML populations, in which the S values were 22 and 22 and the π values were 0.00424 and 0.00330, respectively. However, the genetic diversity of the tested HCX, CKX, TPY, ZX, LS, MNL, MP and FH populations showed lower levels.
Genetic differentiation among the 18 tested populations of tea-oil Camellia resources in Sect. Oleifera
The results of genetic differentiation analysis among the 18 tested populations (Table 2) showed that the genetic differentiation assessed based on ISSR and SRAP markers was lower among populations than within populations, and only 38% of the genetic variation occurred in the populations. At the cpDNA level, the genetic differentiation among populations was greater than that within populations, with 65% of differentiation being found among populations and 35% within populations, indicating that at the cpDNA level, most of the population genetic variation occurred between populations. Based on ISSR and SRAP analysis, Nm among populations was 1.77, indicating strong gene flow. However, in the chloroplast sequence analysis, Nm among populations was only 0.27, indicating that there was very low gene flow among populations at the cpDNA level.
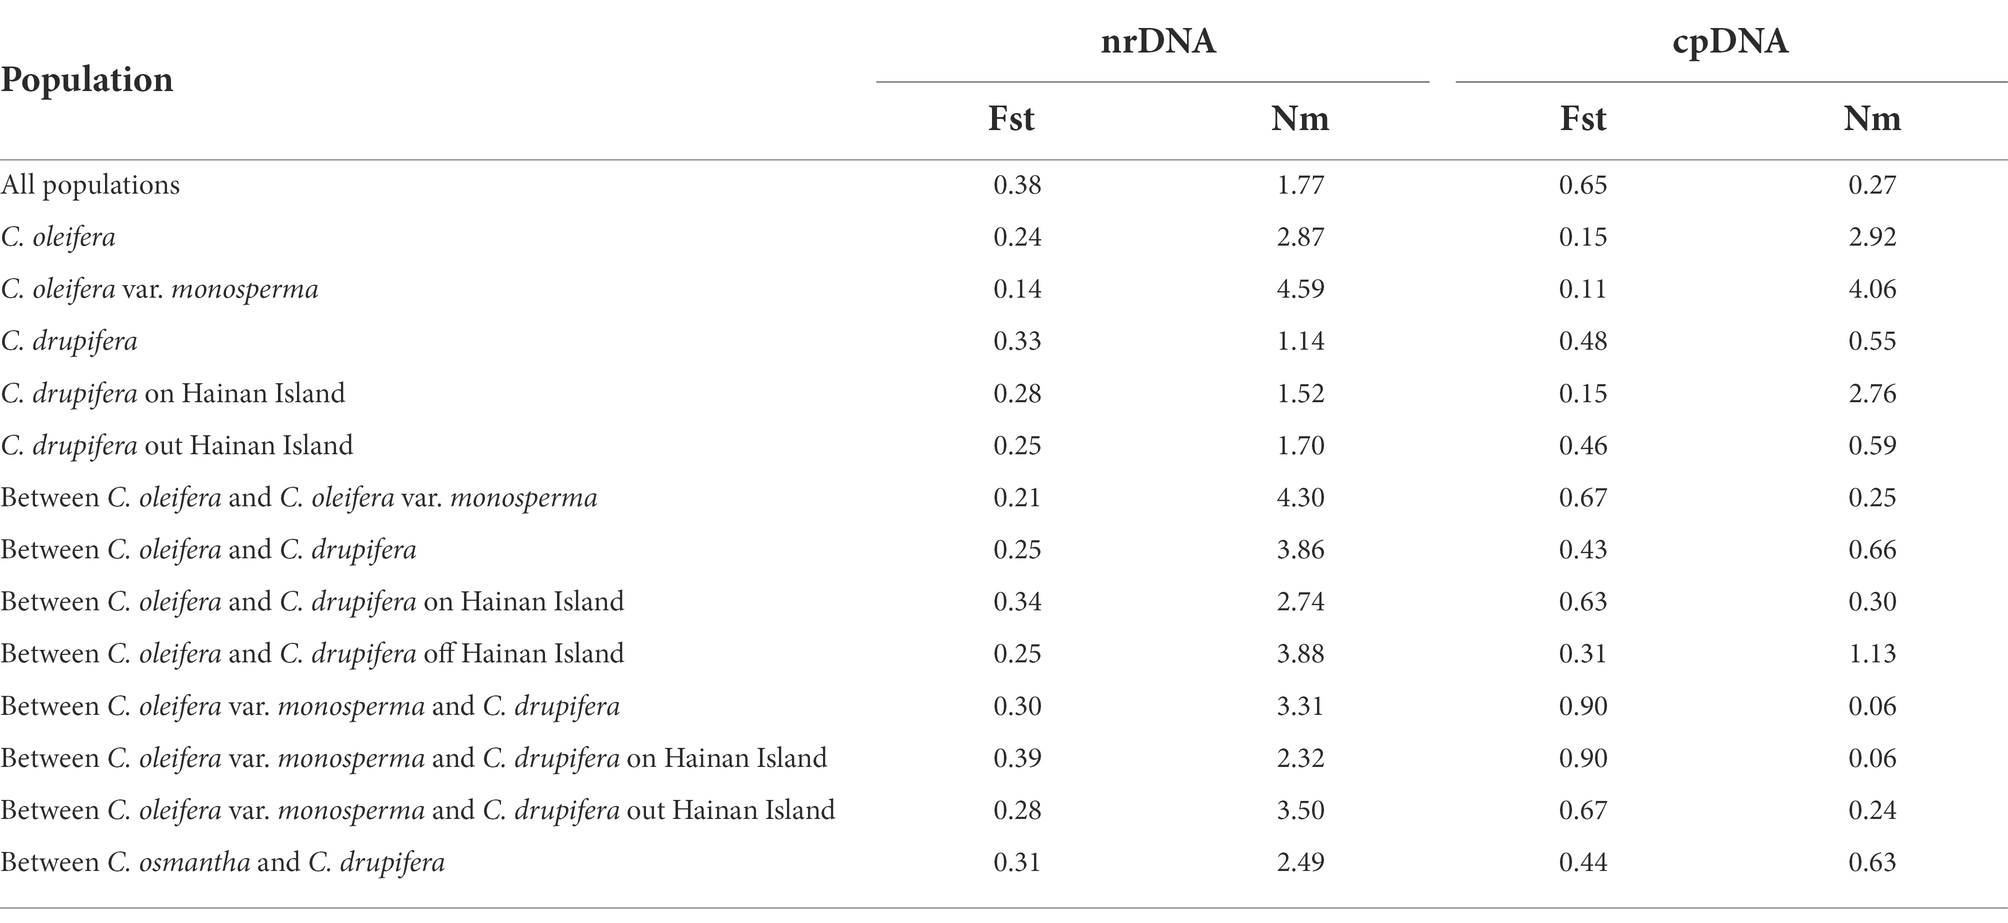
Table 2. Genetic differentiation coefficients among the tested populations.
Genetic relationship and structure analyses among the 18 tested populations of tea-oil Camellia resources in Sect. Oleifera
The Mantel test results showed that there was a significant positive correlation between the nuclear ribosomal DNA (ISSR and SRAP) and cpDNA genetic distance matrices (r = 0.72), with high consistency. In the ISSR and SRAP analyses (Supplementary Table 4), the Nei’s genetic distance (GD) between the tested populations varied from 0.026 to 0.199, with an average of 0.118. The HCX population of C. oleifera var. monosperma showed the most distant genetic relationship from the tea-oil Camellia resources on Hainan Island (MP and FH), with GDs of 0.198 and 0.199, respectively. In the cpDNA analysis, the GD between the tested populations varied from 0 to 0.009, with an average GD of 0.0028, while the GD between the populations on Hainan Island was only 0 or 0.001, and the genetic distance between the C. oleifera. var. monosperma populations and other populations was relatively large (generally 0.007).
Based on the ISSR and SRAP data, a phylogenetic tree among the 18 tested populations was constructed via the unweighted pair group method with arithmetic means (UPGMA) method, and the 18 tested populations were grouped into four categories (Figure 2). Among these populations, two populations of C. oleifera. var. monosperma (GD = 0.060) and two populations of C. oleifera (GD = 0.081) were clustered into group a and group b, respectively. C. osmantha constituted group c, and its average GD from the other groups was 0.155, ranging from 0.129 to 0.182. Group d was composed of 13 populations of C. gauchowensis and C. vietnamensis and from Hainan Island. Seven populations on Hainan Island were first clustered into subgroup 4–1, and the genetic distance between the populations was relatively small, with an average GD of 0.065. Subcategory 4–2 was composed of a mixed cluster of the populations of C. gauchowensis and C. vietnamensis, with an average GD value of 0.107.
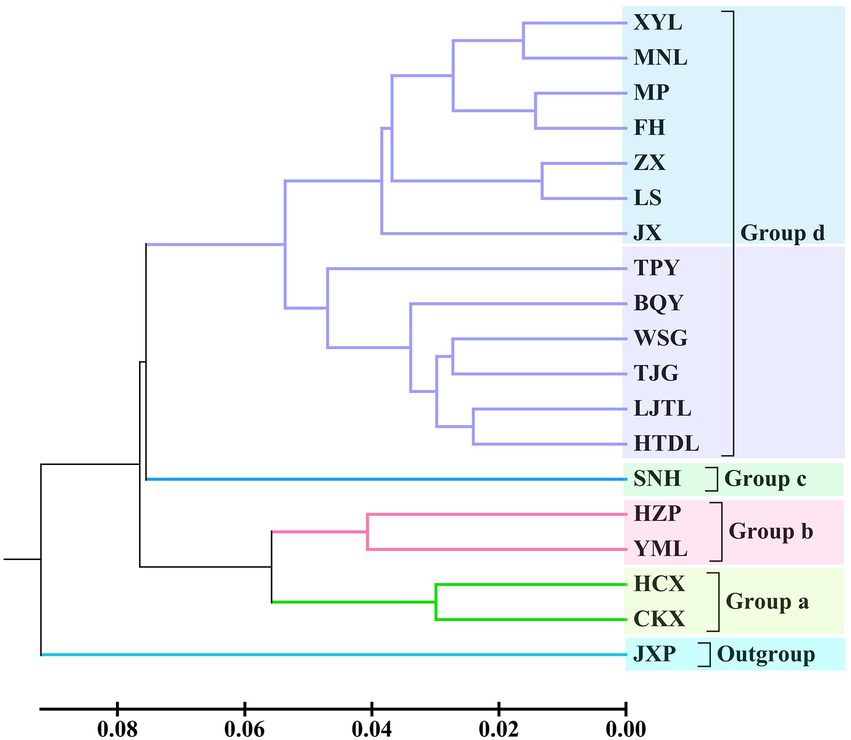
Figure 2. UPGMA dendrogram of the 18 tested populations based on ISSR and SRAP markers.
According to UPGMA tree clustering based on cpDNA, the 18 tested populations were clustered into three groups (Figure 3; Supplementary Table 4). Two populations of C. oleifera. var. monosperma constituted Group A. C. oleifera populations HZP, YML and TPY were included in Group B (GD = 0.001–0.003, average GD = 0.0017). Lastly, Group C consisted of C. osmantha, C. gauchowensis, C. vietnamensis, and populations on Hainan Island (GD = 0.0009), among which seven populations on Hainan Island were first clustered into a small subgroup.
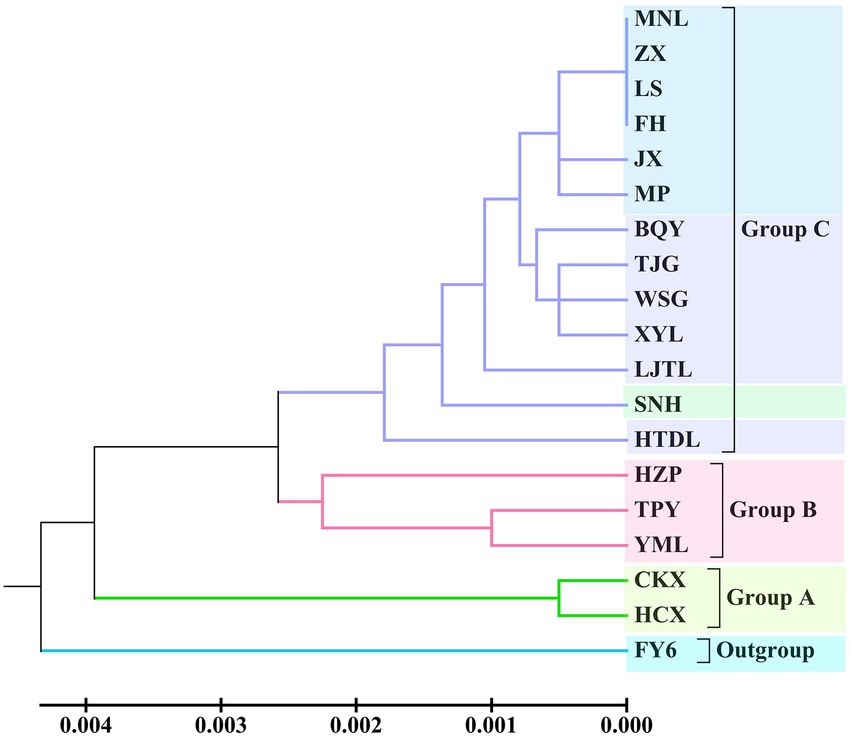
Figure 3. UPGMA dendrogram of the 18 tested populations based on cpDNA.
PCA of the ISSR and SRAP data showed that the tested populations could be divided into five clusters. The cumulative contribution of the first three principal components was 69.01% (Dim-1 = 35.06, Dim-2 = 17.62), indicating that the clustering results were reliable. Among these populations, C. oleifera (HZP and YML) and C. oleifera var. monosperma (HCX and CKX) were aggregated into Cluster a and Cluster b, respectively (Figure 4); Cluster c consisted solely of C. osmantha (SNH); Cluster d included all of the Hainan Island populations (XYL, MP, MNL, FH, ZX, LS, and JX); and Cluster e consisted of the C. vietnamensis and C. gauchowensis populations. In the two-dimensional plot, Cluster d was found to be located in the middle of all the classification groups, which is the closest to Cluster e. The clustering results were basically consistent with the UPGMA trees constructed for all 18 tested populations.
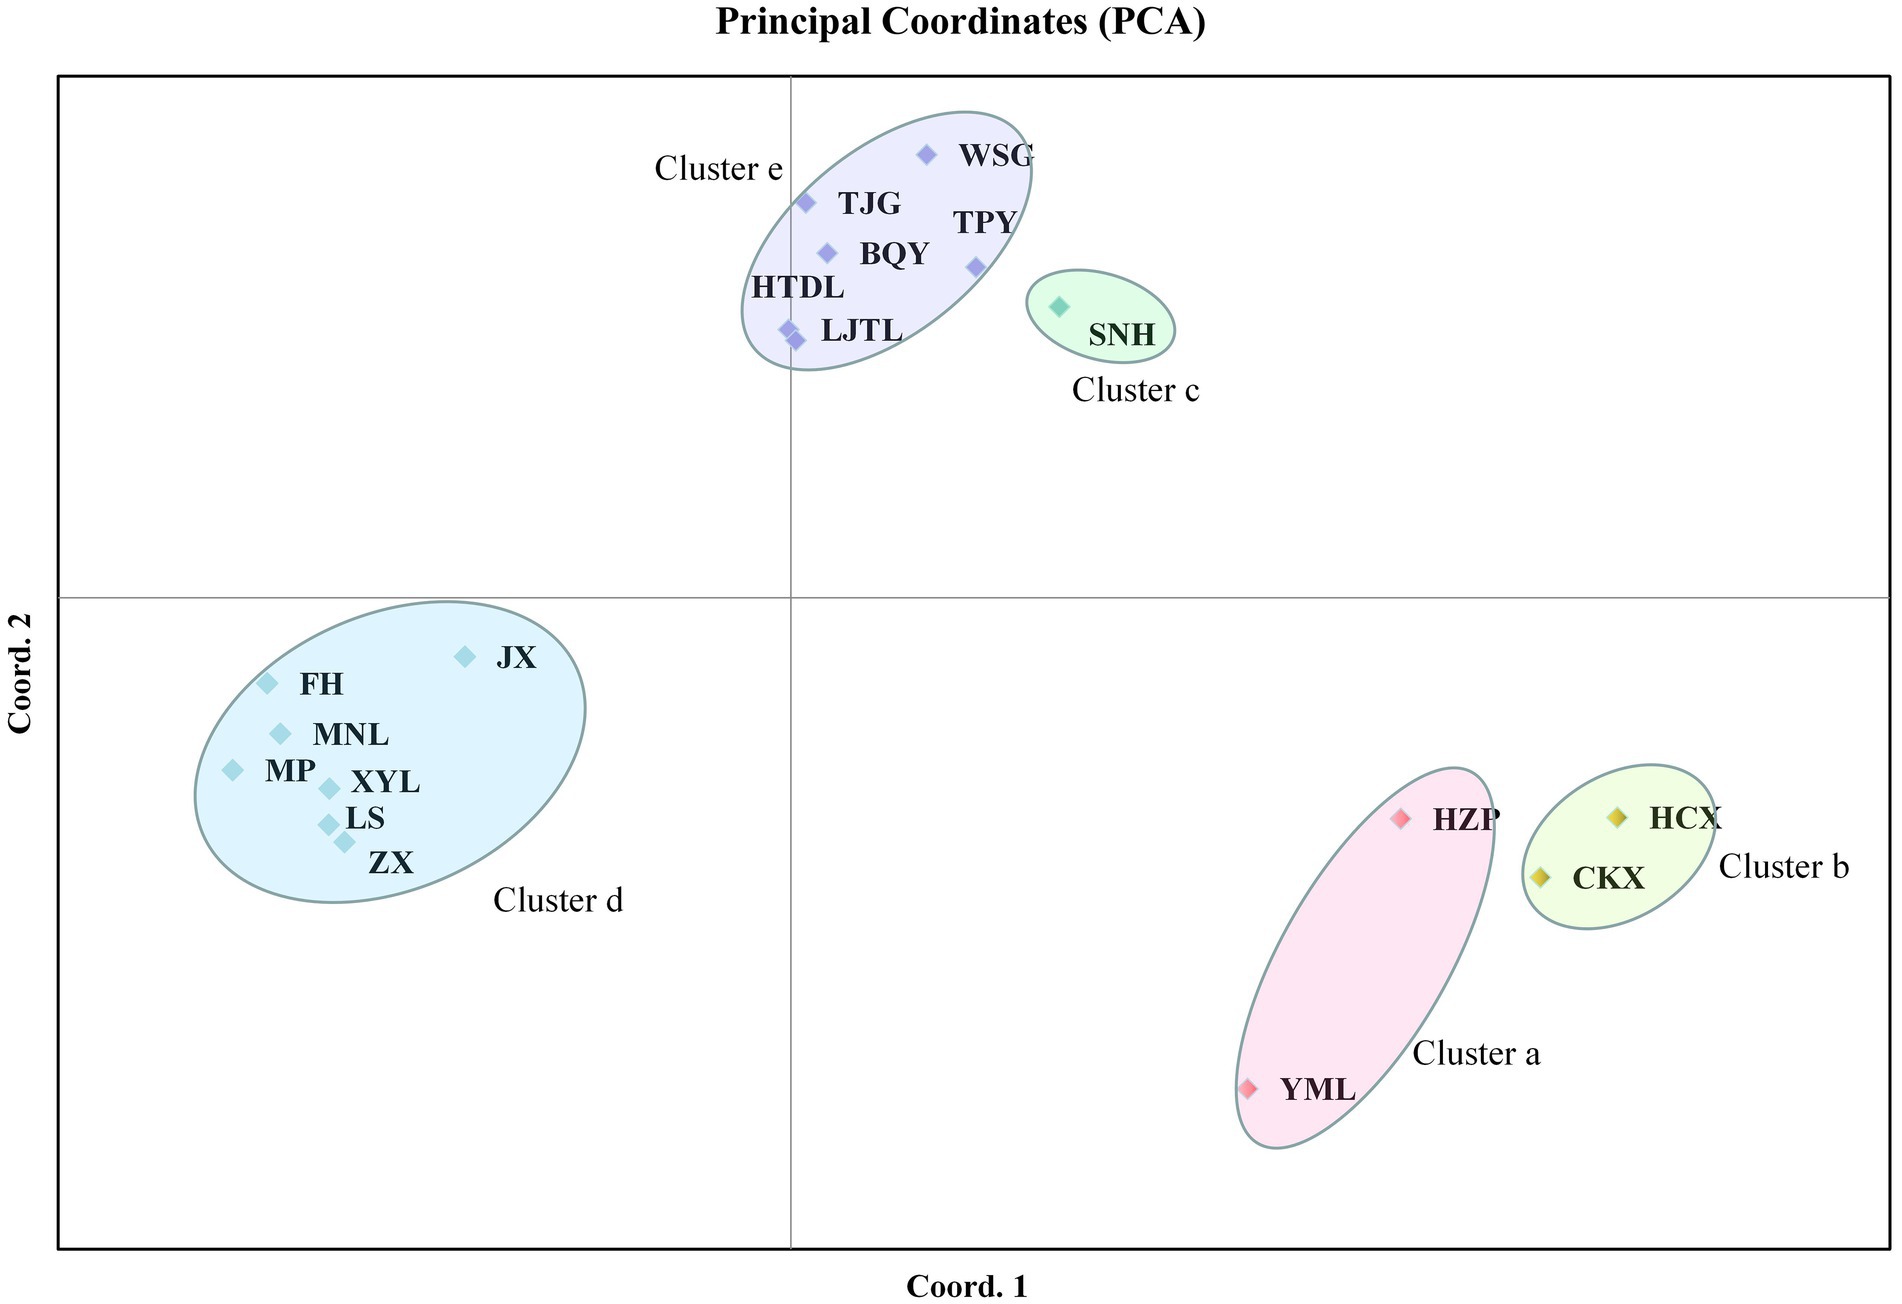
Figure 4. Principal component analysis (PCA) of the 18 tested populations based on ISSR and SRAP markers.
The results of PCA based on cpDNA showed that the tested populations could be divided into four clusters. The cumulative contribution of the first three principal components was 82.50% (Dim-1 = 53.14, Dim-2 = 17.47), indicating that the clustering results were reliable. The two populations of C. oleifera. Var. monosperma (HCX and CKX) were grouped into Cluster A (Figure 5); Cluster B consisted of TPY, HZP and YML; and Cluster C included populations in Hainan, C. osmantha (SNH), C. vietnamensis and C. gauchowensis.
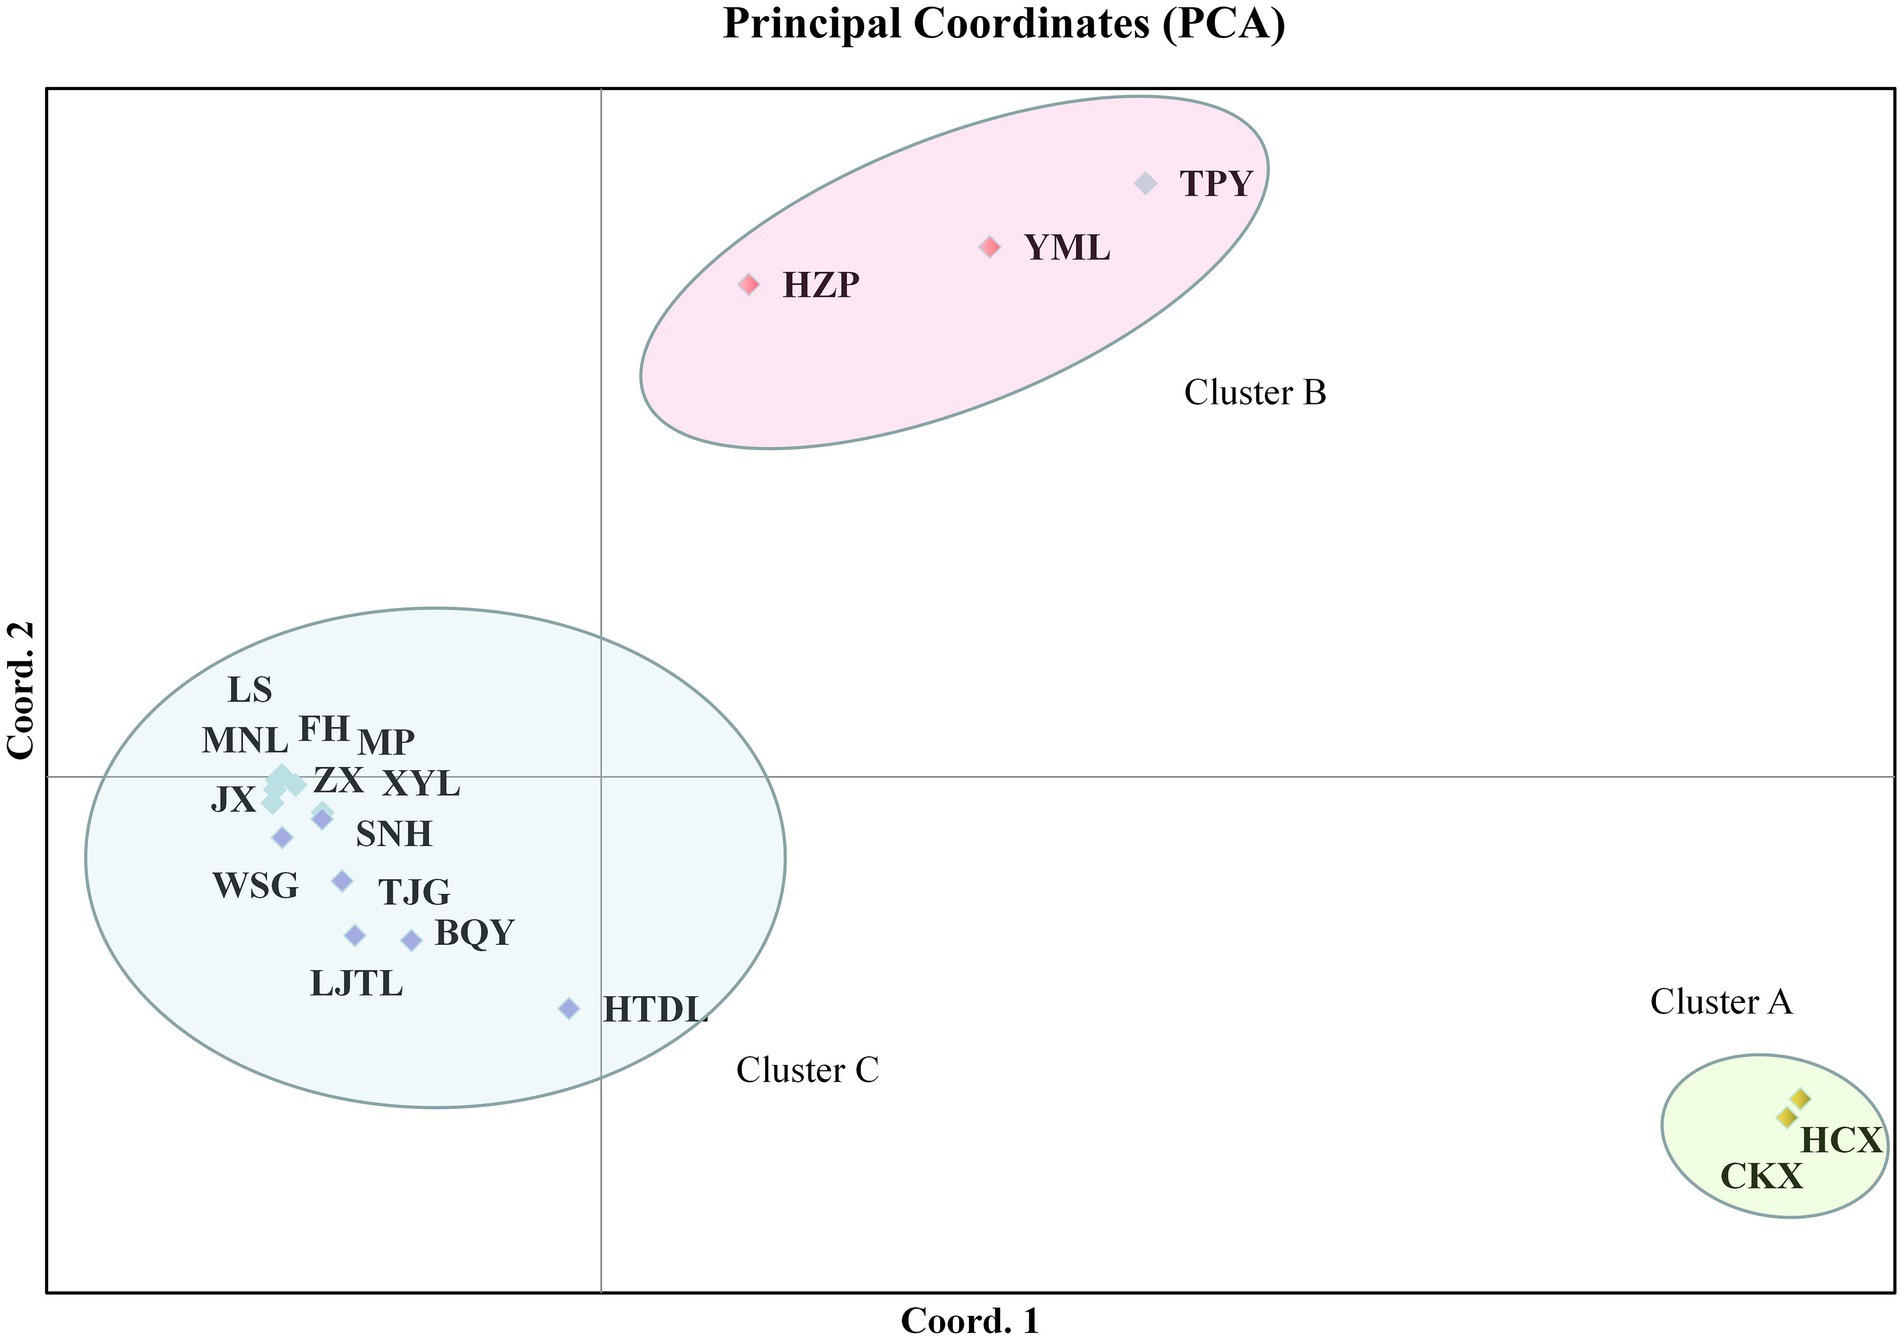
Figure 5. Principal component analysis (PCA) of the 18 tested populations based on cpDNA.
According to PCA clustering, the TPY population tended to belong to the C. vietnamensis cluster based on the ISSR and SRAP markers but to the C. oleifera cluster (cluster C) according to the cpDNA data.
A model-based Bayesian cluster analysis was performed in STRUCTURE to visualize the genetic structure of the 18 tested populations. The results showed that the delta K value was largest when the K value was 2 (Supplementary Figures 1, 2), indicating that K = 2 was the best value and that all the tested materials could be divided into two clusters: Cluster 1 and Cluster 2 (Figures 6, 7). Clusters 1 (red) and 2 (green) represent the different genetic material contributed by each population.
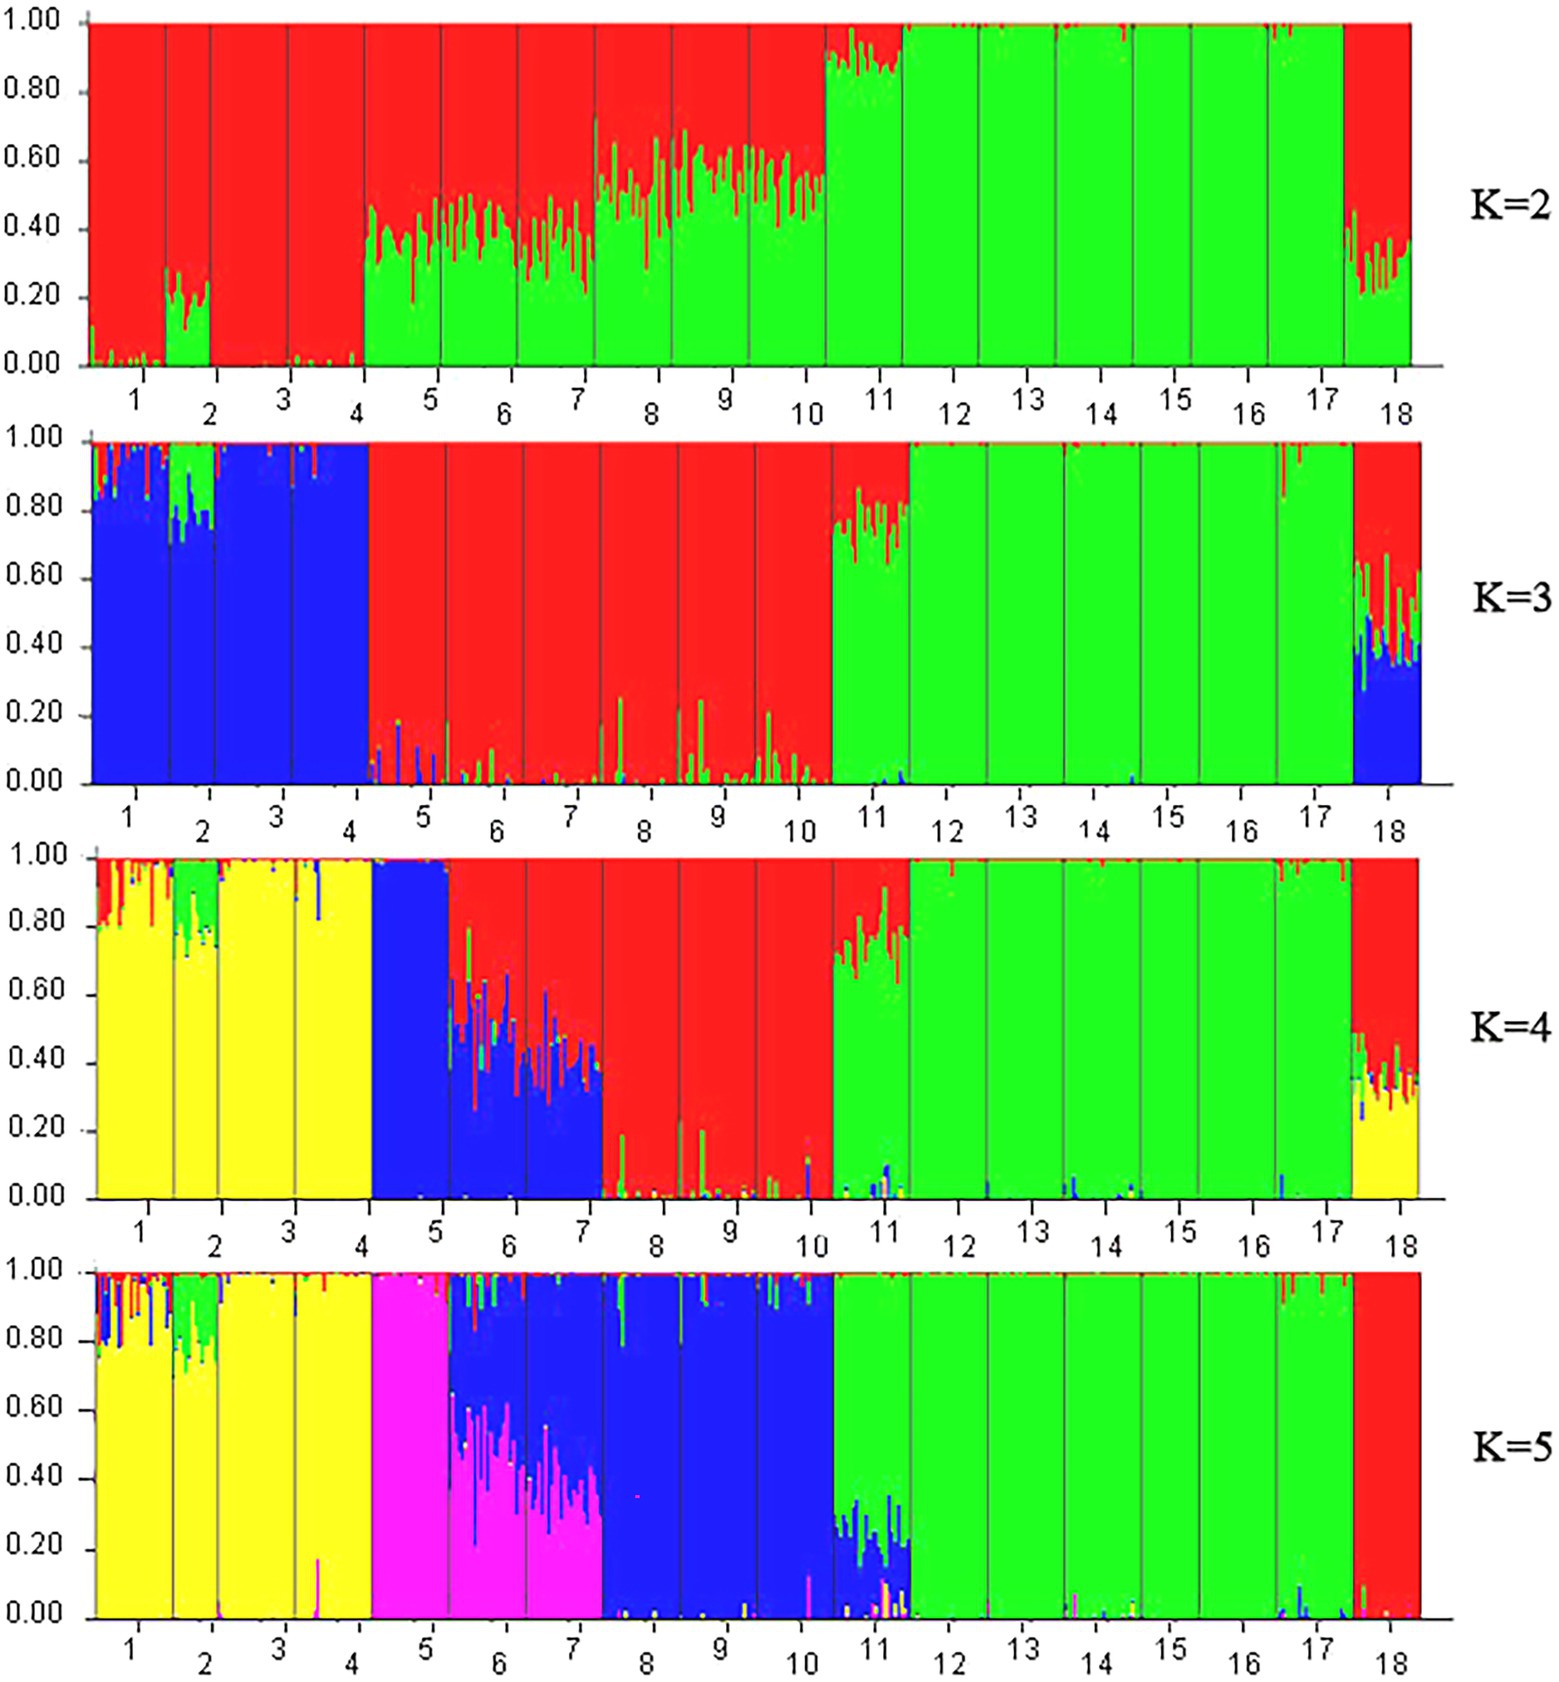
Figure 6. STRUCTURE analysis based on Bayesian clustering according to ISSR and SRAP data. Nos. 1–18 represent populations HZP, YML, HCX, CKX, TPY, BQY, WSG, TJG, LJTL, HTDL, JX, ZX, LS, XYL, MNL, MP, FH, and SNH, respectively.
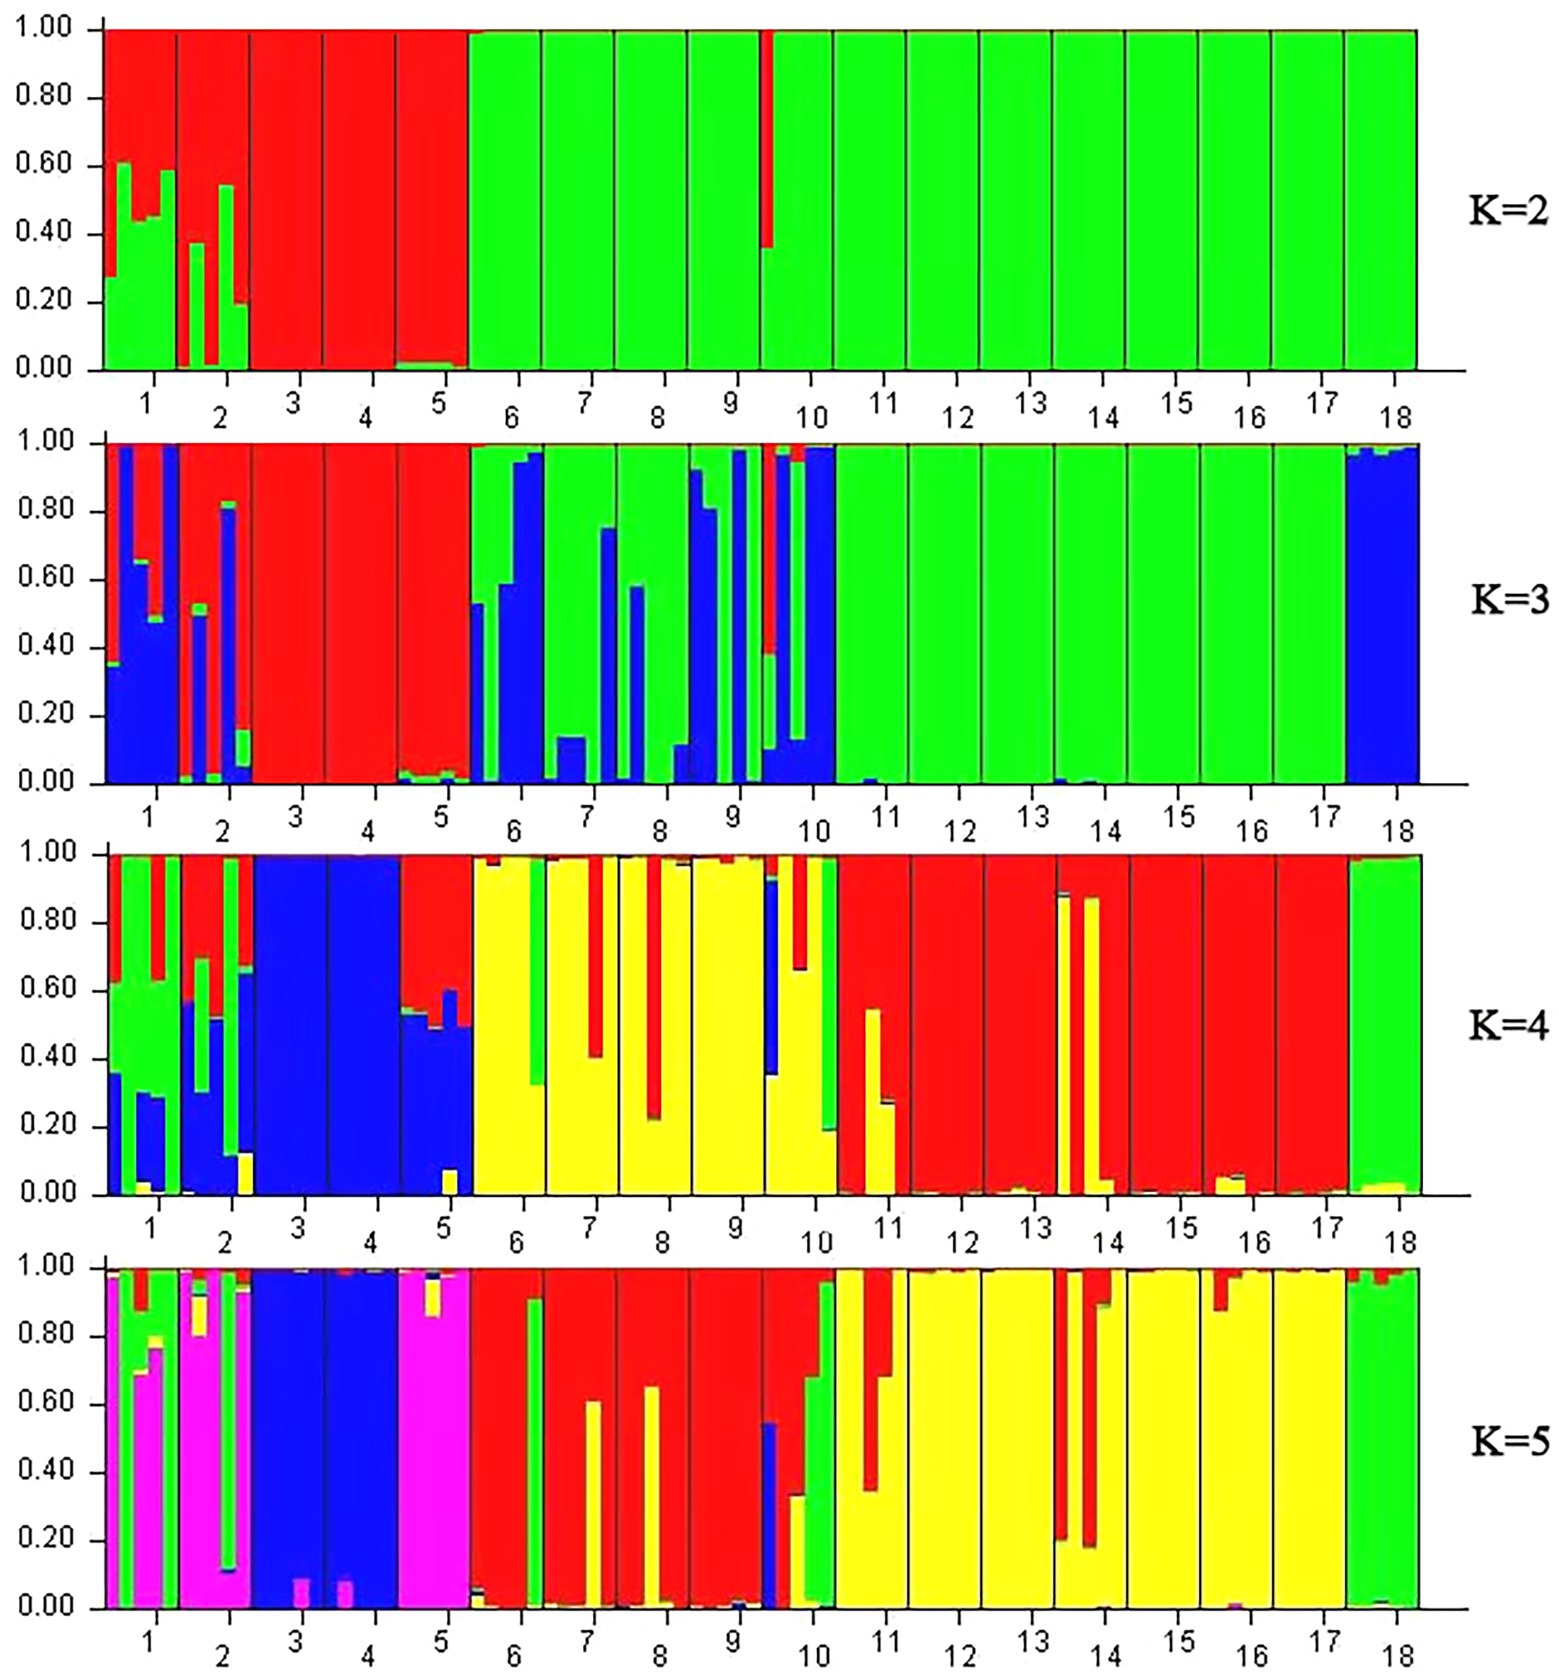
Figure 7. STRUCTURE analysis based on Bayesian clustering according to cpDNA data. Note: Nos. 1–18 represent populations HZP, YML, HCX, CKX, TPY, BQY, WSG, TJG, LJTL, HTDL, JX, ZX, LS, XYL, MNL, MP, FH, and SNH, respectively.
For the ISSR and SRAP data, when K = 2, 6 populations among the seven populations from Hainan Island accounted for more than 99.1% of the genetic material from Cluster 2, and only 89.5% of the genetic material in the JX population came from Cluster 2 (Figure 6). A total of 98.4 and 80.0% of the genetic material of HZP and YML individuals, respectively, in the C. oleifera populations was classified into Cluster 1; more than 99.2% of the genetic material of the HCX and CKX individuals in the C. oleifera var. monosperma populations came from Cluster 1. Approximately 50.0% of the genetic material of the C. vietnamensis and C. gauchowensis individuals came from Cluster 1 and Cluster 2, respectively. A total of 69.6% of the genetic material of the C. osmantha individuals came from Cluster 1, and 30.4% came from Cluster 2. These results indicate that when K = 2, the genetic material of individuals of the Hainan Island populations and C. oleifera. var. monosperma is simple, while the genetic information of individuals of the C. osmantha, C. vietnamensis and C. gauchowensis populations is complex. When K = 3, the genetic components of C. oleifera and C. oleifera. var. monosperma came mainly from Cluster 3, and a small amount of the genetic components of C. oleifera individuals came from Cluster 1 and Cluster 2. The main genetic components of Cluster 1 and Cluster 2 came from the C. gauchowensis, C. vietnamensis, and Hainan populations. When K = 4 and K = 5, the main genetic components of the BQY and WSG populations came from C. oleifera (37.2–58.6%), showing significant complexity; the HCX and CKX individuals of C. oleifera. var. monosperma were highly homozygous, and the majority of the genetic material of C. oleifera HZP and YML individuals came from the same cluster as C. oleifera. var. monosperma but was mixed with other cluster components. When K = 4 and K = 5, the seven tested populations on Hainan Island showed a high degree of homozygosity, and 6 populations presented more than 97.5% homozygosity; JX represented the sole exception, showing 73.0% (K = 4) and 74.4% (K = 5) homozygosity. C. osmantha presented significant complexity when K = 2–4, as nearly 50% of the genetic components came from two different clusters, whereas when K = 5, it was 99.2% homozygous.
Based on the cpDNA data (Figure 7), when K = 2, while the genetic material of C. oleifera individuals (HZP and YML populations) were diverse and accounted for between 23.1 and 76.9% of the material in Cluster 1 and Cluster 2, respectively, the genetic components of the remaining 16 populations came from a single source. The individuals of HCX, CKX and TPY accounted for more than 99.7% of the genetic material from Cluster 1, and those of BQY, WSG, TJG, LJTL, HTDL, JX, ZX, LS, XYL, MNL, MP, FH and SNH accounted for more than 86.8% of the genetic material from Cluster 2. When K = 3, the genetic components of the HCX, CKX and TPY populations, the Hainan populations, and the C. osmantha population came from three different clusters, showing a high degree of homozygosity (more than 97.2% of the genetic material). The genetic components of the C. oleifera population came mainly from the populations of C. oleifera. var. monosperma and C. osmantha, while the genetic components of the BQY, WSG, TJG, LJTL, and HTDL populations came mainly from the Hainan and C. osmantha populations, all of which showed significant complexity. When K = 4 and K = 5, the population genetic material of C. oleifera, C. gauchowensis and C. vietnamensis was observed to be complex and contained genetic components from the Hainan Island, C. oleifera. var. monosperma and C. osmantha populations. Among the Hainan Island populations, genetic exchange was observed only between C. gauchowensis and C. vietnamensis. Similarly, the populations of C. oleifera. var. monosperma and C. osmantha maintained relatively high homozygosity of their genetic components. When K = 4, the genetic material of HCX, CKX and SNH accounted for 99.6, 99.6 and 96.2%, respectively, whereas when K = 5, the genetic material of HCX, CKX and SNH accounted for 97.5, 97.5 and 96.4%, respectively.
Haplotype phylogenetic relationships among the 18 tested populations
Fifty-three haplotypes were detected among the five combined cpDNA sequences of the test population, and the geographic distribution, phylogenetic tree and topological structure of the 53 haplotypes were constructed (Figures 8–10). In the phylogenetic tree (NJ tree), the 53 haplotypes could be divided into four branches. Haplotypes H6 to H9 and H12 to H14 were clustered into branch 1, in which all haplotypes except for H14 from the HTDL population came from the C. oleifera var. monosperma HCX and CKX populations, located in northern Guangxi (Figure 8). The haplotypes that made up branch 2 were all derived from a subset of the haplotypes of the HZP and YML populations of C. oleifera and all haplotypes of the TPY population. Branch 3 consisted of two subbranches, in which all haplotypes from SNH, H18 of HTDL and H5 of BOY formed subbranch A, and subbranch B was composed of H20, H23 of HZP and H51 of YML. Branch 4 included all haplotypes of the Hainan, C. gauchowensis and C. vietnamensis populations except for H5 of BOY and H18 and H14 of HTDL. All of these haplotypes except for H49 in the Hainan population are clustered into a small subbranch located at the bottom of the phylogenetic tree. Finally, the relationships between the ancestral and derived cpDNA haplotypes were also analyzed in a TCS network diagram (shown in Figure 10).
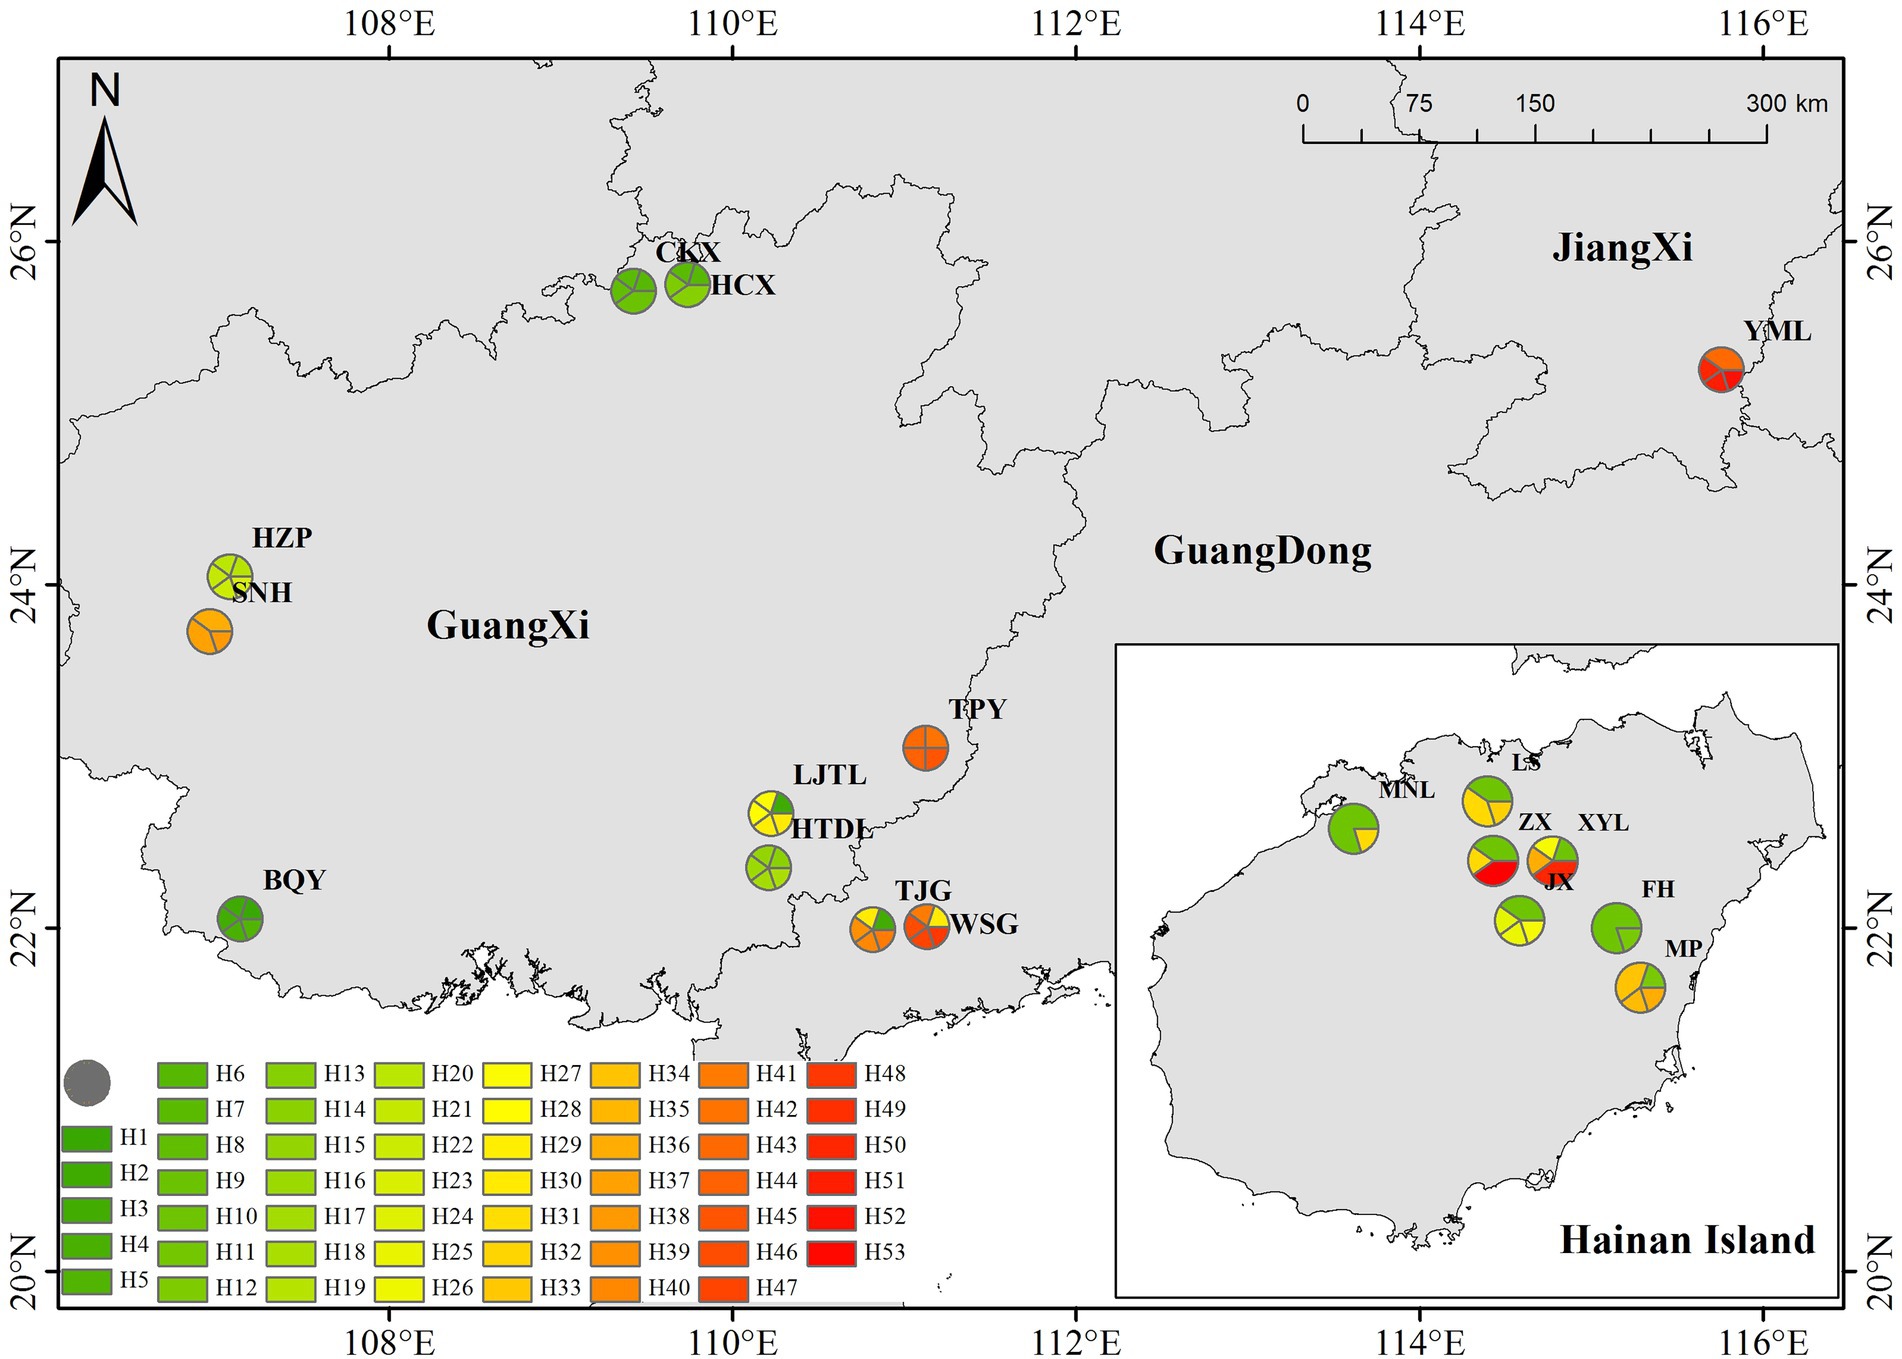
Figure 8. Distribution of cpDNA haplotypes in 53 ribotypes of the test populations.
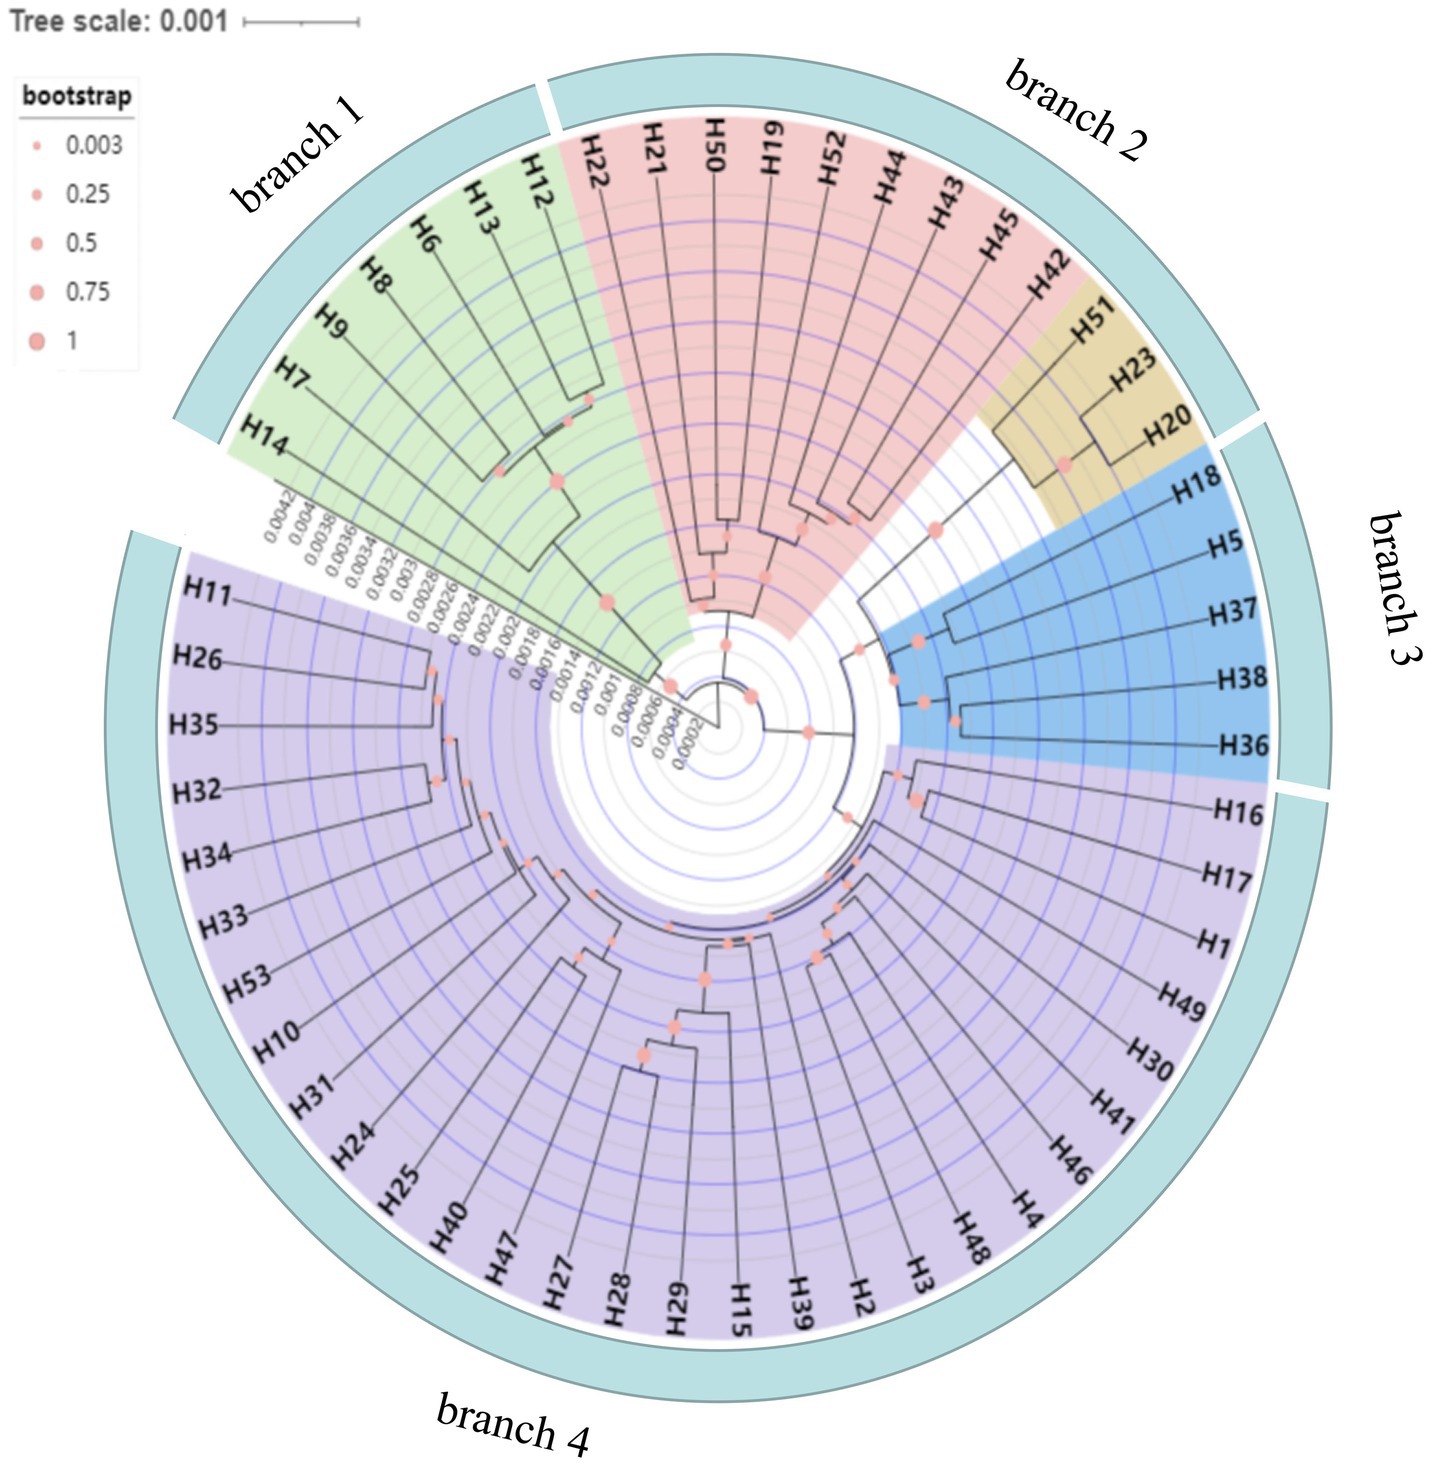
Figure 9. Neighbor-Joining (NJ) dendrogram of the 53 cpDNA haplotypes of the test populations.
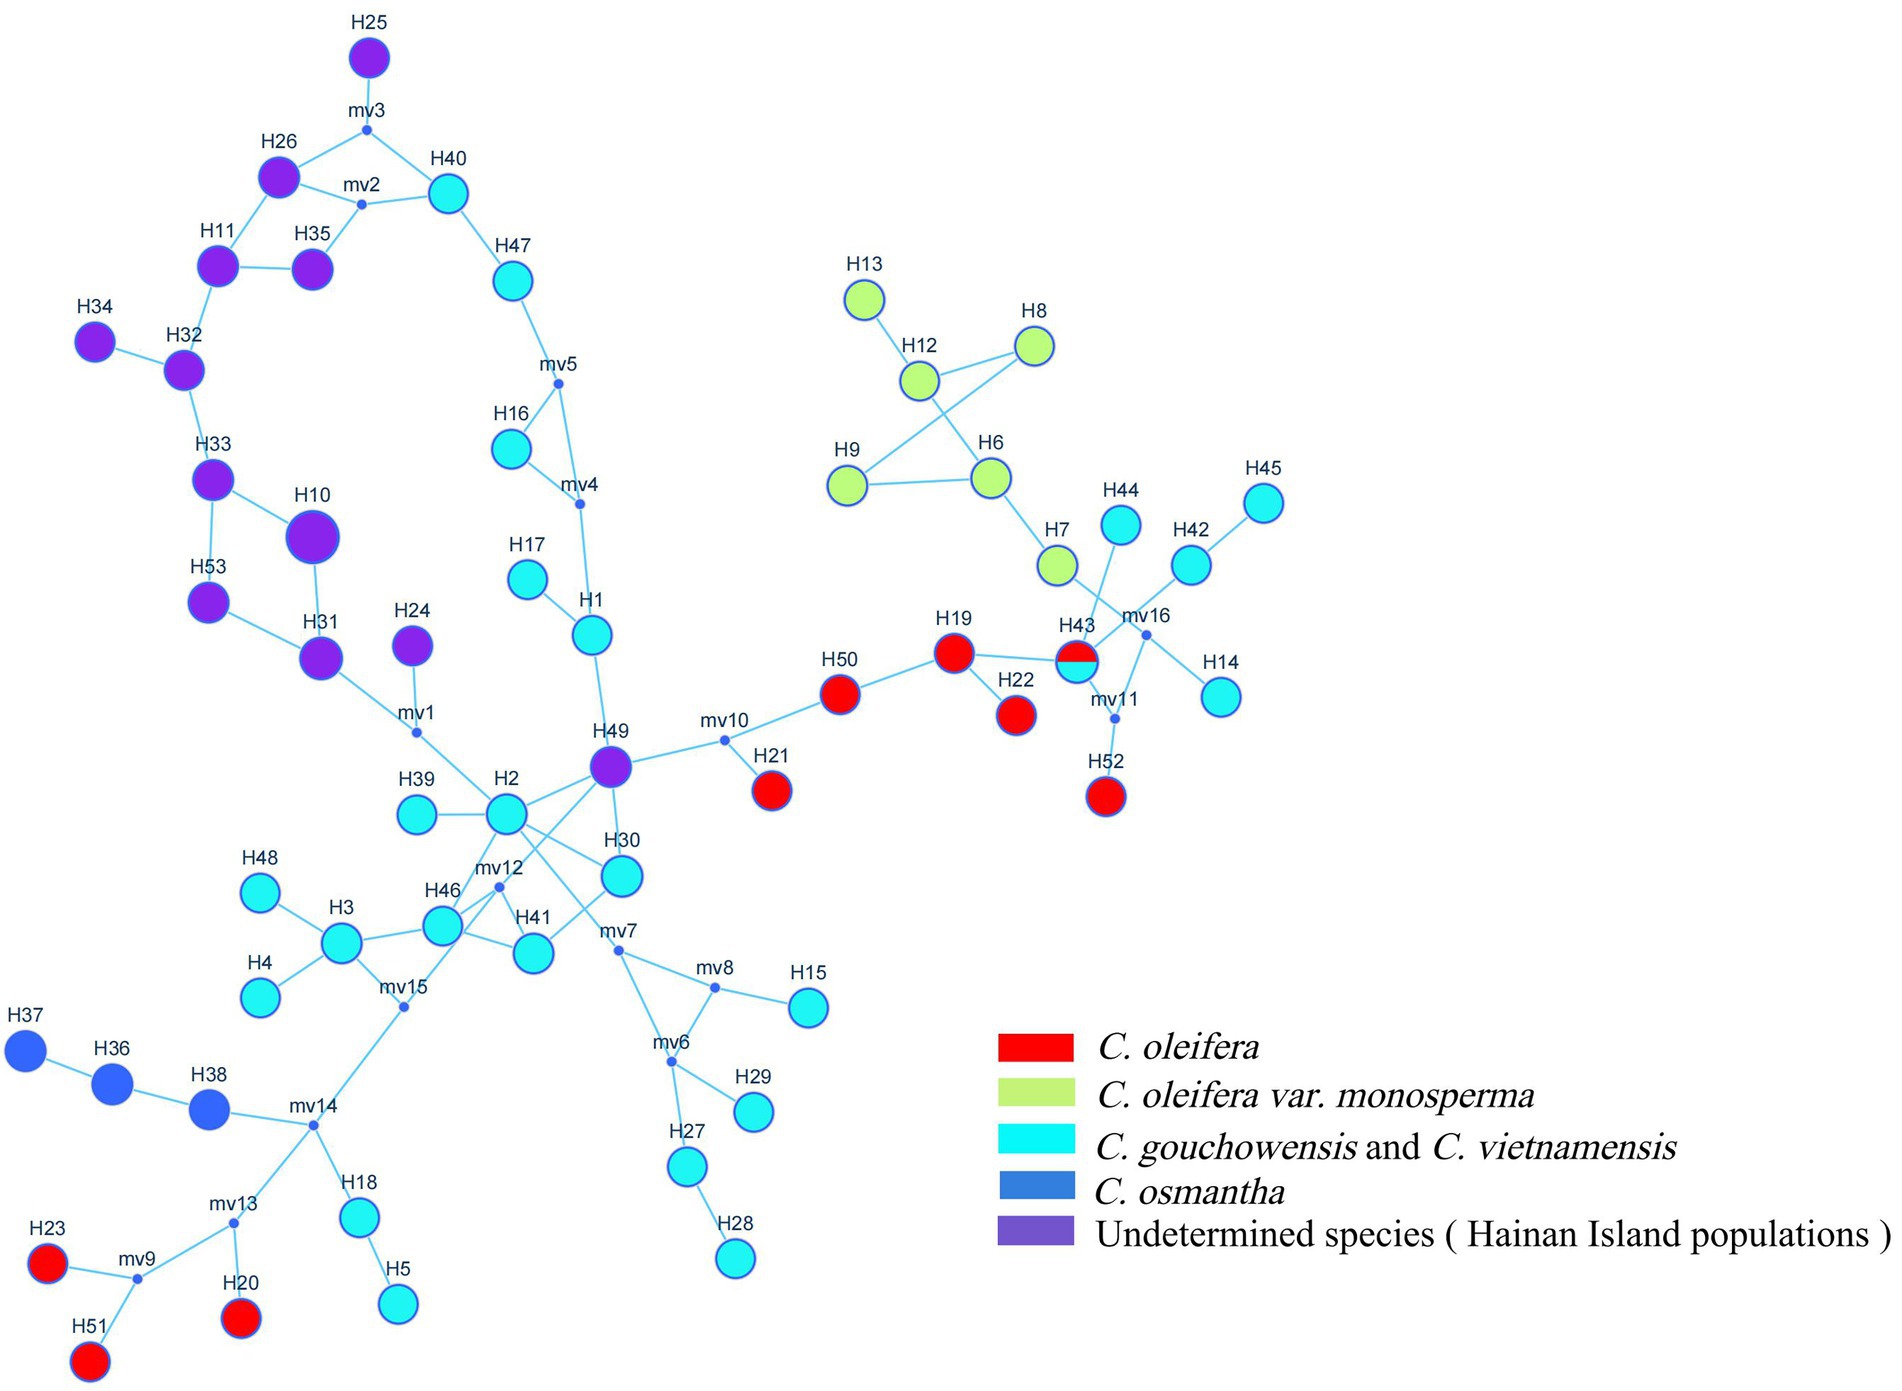
Figure 10. TCS network of the 53 cpDNA haplotypes of the test populations.
According to the positions of the haplotypes in the network (Figure 10), H2 located in a central position within the network, was inferred to be the ancestral haplotype, and H12 and H26 form a small radiation. Most of the remaining haplotypes showed only one or two mutations relative to the other haplotypes. According to the geographical distribution of the haplotypes (Figure 8), haplotypes H30, H31 and H43 were shared in three different populations, and H2, H3, H6, H7, H11, H26, H3, H35 and H41 were shared in two different populations. H10 was the most widely shared haplotype, being distributed in six populations, FH, JX, LS, MNL, XYL, and ZX, so it was inferred to be the ancestral haplotype. The C. vietnamensis (H2) and Hainan (H10) populations could be the origin of the ancestral haplotype.
Analysis of the historical dynamics of the test populations
Based on cpDNA sequence data, DnaSP software was used to analyze the mismatch distribution of the tested populations to determine whether the tested population experienced a rapid expansion event (Figure 11; Supplementary Table 5). The results showed no single peak in the distribution of chloroplast gene mismatches (Freq. Exp), indicating that the tested populations represented a model of recalcitrance to expansion, having experienced no obvious expansion. The results of Tajima’s neutrality test for the five chloroplast fragments showed a Tajima’s D value of −0.41555 (p > 0.10) and an Fu’s Fs value of −0.51948, and the Tajima’s D values were not significantly negative. These results indicated that all of the tested loci presented neutral evolution and that the tested populations had not experienced a rapid expansion event. This was completely consistent with the results of the mismatch distribution analysis.
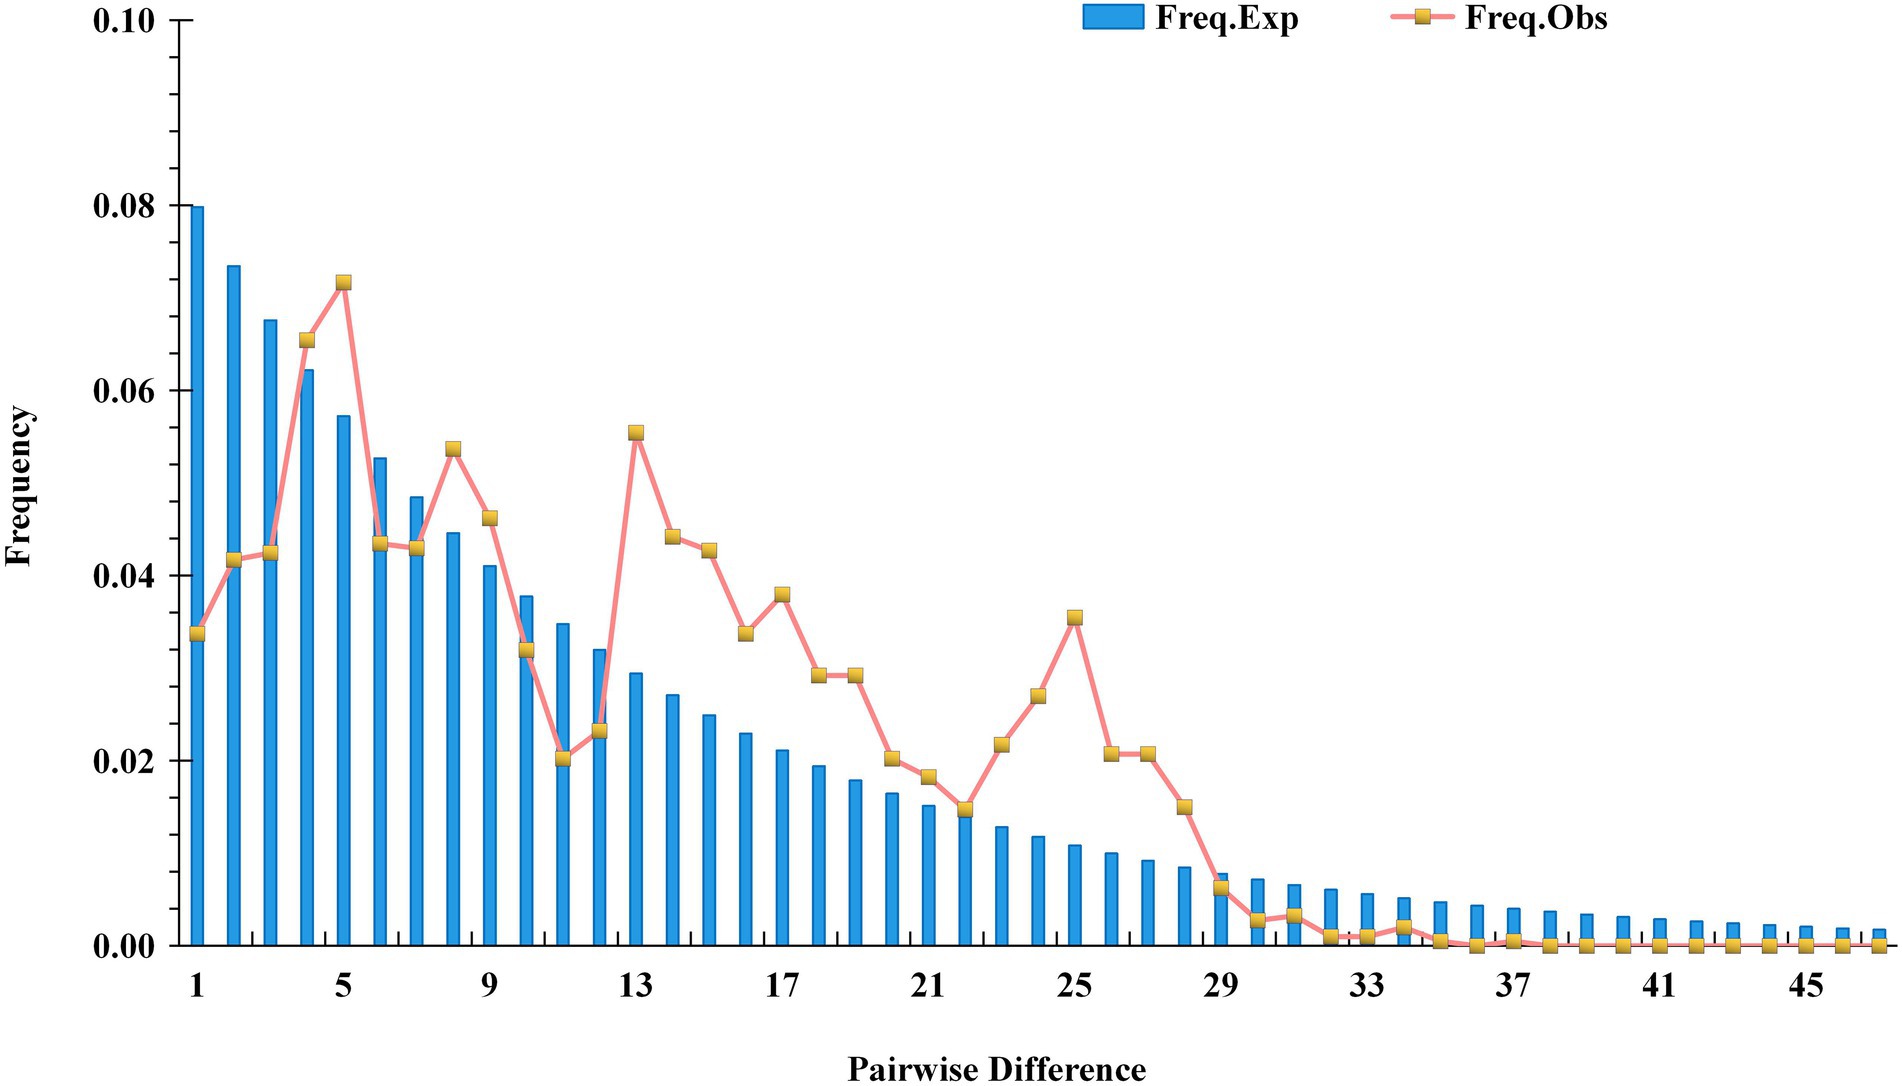
Figure 11. Mismatch distribution plots for the test populations.
Discussion
Relationships among the tea-oil Camellia species from Sect. Oleifera
The classification of C. oleifera. var. monosperma
According to the Zhang Hongda system in Flora of China (Chinese version; Zhang, 1998), C. oleifera. var. monosperma is a variant of C. oleifera. In Flora of China (English version; Min and Bruce, 2007), C. oleifera. var. monosperma was a synonym, rather than a variant of C. oleifera. In this study, the results of the UPGMA dendrogram analysis and PCA based on either ISSR and SRAP data or cpDNA genetic information divided the C. oleifera var. monosperma populations and C. oleifera populations into significantly different groups (Figures 2–5). The two populations of C. oleifera var. monosperma in the PCA graph are located on the far right according to the one-dimensional coordinates. The genetic differentiation between the C. oleifera var. monosperma and C. oleifera populations based on cpDNA was especially large, with an Fst value of 0.67 and a gene flow value of 0.251 (Table 2). In the STRUCTURE analysis based on either ISSR and SRAP or cpDNA genetic information, when K = 2–5, the C. oleifera. var. monosperma populations were divided into an independent group accounting for more than 99.00% of the genetic composition, while the C. oleifera populations always contained genetic compositions from different clusters (Figures 6, 7). According to the cpDNA marker analysis in particular, the genetic components of the C. oleifera populations came from multiple clusters. For example, for K values from 2 to 4, the average percentages of individual genetic material in the C. oleifera populations were 64.80, 48.05 and 29.25%, respectively, and when K = 5, no genetic components of C. oleifera. var. monosperma were observed. Furthermore, five chloroplast sequence haplotypes were detected in the two C. oleifera. var. monosperma populations, which were of the same origin, clustered into the same branch and showed no crossing with the haplotypes of the other tested populations. According to our field survey results and the description in the Flora of China (Chinese version), C. oleifera. var. monosperma exhibits small leaves, small flowers, small fruit, mostly single seeds, a thin peel and a high oil content of its fruit, which are significantly different from the characteristics of C. oleifera. C. oleifera. var. monosperma is the second most commonly cultivated tea-oil Camellia species in China after C. oleifera and is mainly distributed in Fujian, Jiangxi, and Guangxi. Most producers and researchers refer to this species as C. meiocarpa.
Therefore, regardless of the above molecular analysis results, phenotypic differences, and industrial development and research needs, C. oleifera var. monosperma should be considered an independent species named C. meiocarpa (in the following section, both are called C. meiocarpa). Thus, it should not be simply classified within C. oleifera (Min and Bruce, 2007), which is consistent with the findings of Huang (2011), Liu (2010), and Xie (2013).
The relationship between C. vietnamensis and C. gauchowensis
In the Flora of China (Chinese version), C. vietnamensis and C. gauchowensis are located in relatively distant taxonomic positions, relative to classification status of C. vietnamensis and C. oleifera (Zhang, 1998). In this study, both the UPGMA clustering and PCA results showed that the C. gauchowensis and C. vietnamensis populations were included in the same group (Figures 2–5), with a low average GD of 0.072 according to ISSR and SRAP markers and a low average GD of 0.0018 according to cpDNA markers (Supplementary Tables 2, 3). The genetic material components of these two species were also relatively consistent in the STRUCTURE analysis. These results indicated that the populations of C. gauchowensis and C. vietnamensis presented the closest relationship.
One key morphological difference between C. gauchowensis and C. vietnamensis in morphological taxonomy is whether or not current-year branchlets are glabrous. Under the Zhang Hongda system in Flora of China (Chinese version), the current-year branchlets and leaves of C. gauchowensis are glabrous, while they are gray-brown pubescent for C. vietnamensis. Under the Min Tianlu system in Flora of China (English version), the current-year branchlets of both C. gauchowensis and C. vietnamensis (both of which are revised names of C. drupifera) are glabrous (Min and Bruce, 2007). However, our field survey data showed that most of the branchlets were hairy in all C. gauchowensis and C. vietnamensis populations, and only a few populations had individual plants with hairless branchlets. Therefore, based on the above analysis results, we believe that C. gauchowensis and C. vietnamensis should be merged into the same species and renamed C. drupifera, which is supported by the Flora of China (English version; Min and Bruce, 2007). However, this conclusion is inconsistent with the analysis results by Xie (2013) based on AFLP markers, suggesting that C. gauchowensis is more closely related to C. oleifera than C. vietnamensis.
Relationships between C. osmantha and the other tea-oil species from Sect. Oleifera
C. osmantha was once considered a variant of C. oleifera due to the similarity of its leaf and bud morphology to that of C. oleifera. According to a morphological and taxonomic evaluation conducted by Ye et al., C. osmantha is a new species belonging to Sect. Paracamellia of Camellia. Its main morphological features are short columns, slightly fragrant flowers, small fruit and many single seeds (Ma et al., 2012). Due to the large plant size, high fruit yield, thin fruit skin and high oil content of C. osmantha, it has been promoted as the main cultivated species in Guangxi, China. The results of UPGMA clustering and PCA based on ISSR and SRAP data in this study showed that the C. osmantha population was an independent group located between C. oleifera and C. drupifera, with a closer relationship to C. drupifera (GD = 0.1665 for C. osmantha with C. oleifera and GD = 0.1510 for C. osmantha with C. drupifera; Figures 2, 4; Supplementary Table 4).
According to the cpDNA data, C. osmantha was clustered with C. drupifera in the phylogenetic tree and two-dimensional PCA map (Figures 3, 5), but the genetic distance between C. osmantha and all C. drupifera populations (average GD = 0.0024) was significantly larger than that among the C. drupifera populations (average GD = 0.0012; Supplementary Table 4). Furthermore, in a STRUCTURE analysis performed with K values of 2 to 4, C. osmantha was a mixed component of C. meiocarpa and C. drupifera, whereas when K ≥ 5, C. osmantha formed an independent cluster (more than 99% of genetic components) according to ISSR and SRAP data (Figure 6). According to the cpDNA data, when K = 2, C. osmantha belonged to the same cluster as C. drupifera (more than 99% of genetic components); at K values of 3 to 5, C. osmantha formed an independent cluster (more than 99% of genetic components; Figure 7). Considering the results of the morphological and molecular data analysis as well as tea-oil production requirements, we suggest that C. osmantha can be classified as an independent taxonomic unit, it is closely related to C. drupifera and it belongs to Sect. Oleifera of the Camellia genus.
Molecular identification of tea-oil Camellia germplasm resources on Hainan Island
The phylogenetic tree and PCA results of this study showed that all of the Hainan populations were clustered with the C. drupifera populations and that they presented the closest relationship with C. drupifera among all the tested populations (mean GDs from C. drupifera populations, C. oleifera populations, C. meiocarpa populations, and C. osmantha populations of 0.1069, 0.1504, 0.1768, and 0.1640, respectively, according to ISSR and SRAP data and 0.0016, 0.0030, 0.007, and 0.0022 according to cpDNA data). Further analysis based on cpDNA, ISSR and SRAP data showed that the populations from Hainan Island (except for the XYL population in the cpDNA data analysis) clustered together first and were located at the very edge in both the phylogenetic tree and PCA results (Figures 2–5). A STRUCTURE analysis conducted with K = 2–5 showed that the populations from Hainan Island were all located in independent clusters with high genetic component percentages (approximately 98.0%, except for JX and XYL, which presented values of approximately 75.0%). Accordingly, we suggest that the tea-oil Camellia resources on Hainan Island belong to C. drupifera.
There was a closer genetic relationship among the populations from Hainan Island, with mean GDs of 0.065 based on nrDNA and 0–0.001 based on cpDNA, and they showed a relatively simple genetic background, with the lowest genetic diversity identified (average H of only 0.138, average π of 0.0047) and high gene flow (Nm = 1.52 for ISSR and SRAP, Nm = 2.76 for cpDNA). These populations exhibited significant genetic differentiation from and limited gene flow with the populations of C. drupifera, C. oleifera, C. meiocarpa, with cpDNA-based Nm values of 0.55, 0.298 and 0.057, respectively (Table 2). The above analysis showed that the tea-oil Camellia resources on Hainan Island constitute a special group that differs from all of the tested off-island populations. This difference may be caused by the homogenized habitat conditions on the island (Binks et al., 2019; Gai et al., 2021) as well as the limited hybridization and genetic introgression with off-island tea-oil Camellia resources due to the isolation of the island (Li et al., 2020). Therefore, we suggest that the Hainan tea-oil Camellia resources belong to a special ecological type or variant of C. drupifera. Based on some significant phenotypic differences and molecular information, Xu et al. (2020) identified a new species of tea-oil Camellia on Hainan Island, named C. hainanica.
Genetic diversity of tea-oil Camellia germplasm resources from Sect. Oleifera of Camellia
Nybom (2004) counted 60 papers applying RAPD markers and four applying ISSR markers in plants and found that the average H value of the examined plants was 0.22. The H values of the 18 populations of the present study revealed by ISSR and SRAP markers ranged from 0.13 to 0.22, with an average of 0.16, indicating that the tested populations showed low genetic diversity (Table 1). The π values of the tested populations revealed by the five chloroplast sequences varied widely, ranging from 0.00013 to 0.00502, with an average value of 0.00140 (Table 1). This is similar to the levels of genetic diversity observed in other Camellia species, such as Camellia huana (π of 0.00042; Li et al., 2020), Camellia flavida (π of 0.00157; Wei et al., 2017), and Camellia nitidissima (π of 0.00082; Lu et al., 2020). However, the π values of most species are between 0.0020 and 0.0058 (Chen et al., 2012; Xing et al., 2017), relative to which the genetic diversity level of the population tested herein is low.
In this study, the genetic diversity index differed greatly among the 18 populations. The CV values of the H, I, π and Theta-W indexes between the populations were 16.32, 15.66, 98.09 and 103.10%, respectively (Table 1). The genetic diversity of the C. oleifera population was found to be relatively high regardless of whether the analysis was based on ISSR and SRAP or cpDNA data, with average H and π values of 0.185 and 0.00377, respectively, while the population on Hainan Island showed the lowest genetic diversity, with average H and π values of only 0.14 and 0.00067, respectively. C. oleifera shows the largest distribution and cultivation areas among tea-oil Camellia species, and there are frequent opportunities for gene exchange with multiple closely related species in the same area, resulting in the high genetic diversity of C. oleifera. In addition, the diverse habitat conditions in various regions have a positive impact on the high genetic diversity of this species (Feng et al., 2014). As mentioned above, the low genetic diversity of the populations on Hainan Island may be related to the lack of opportunities for gene exchange and introgression caused by island isolation as well as natural selection within the homogeneous habitat of the island (Li et al., 2020).
Genetic differentiation and communication within Sect. Oleifera of Camellia
It is generally believed that an Fst > 0.25 indicates relatively high genetic differentiation among populations (Wright, 1978). In the present study, analyses based on nrDNA markers (ISSR and SRAP markers) and cpDNA sequence markers revealed Fst values of 0.38 and 0.65, respectively, among the tested populations, indicating high genetic differentiation among the tested populations (Table 2). According to analyses based on ISSR and SRAP markers, the majority of genetic variation exists within the populations (62%), which is consistent with the existence of abundant phenotypic variation within a population (Yang et al., 2018; Xia et al., 2022). Among the tested populations, Nm was 1.77 based on ISSR and SRAP analysis (Table 1), and this value greater than 1.00 indicated good gene exchange between the populations (Slatkin, 1987). This finding may be explained by the frequent gene exchange caused by the good hybrid affinity between the tested species during their introduction and cultivation and the homogenization of artificial selection during the cultivation process (Lu et al., 2015). cpDNA is maternally inherited and evolves slowly; the gene flow of cpDNA among the tested populations was low, with an Nm of only 0.25, and the majority of genetic variation occurred between the populations (up to 65%). The gene flow between the populations of C. meiocarpa and C. drupifera was only 0.06, with a differentiation coefficient up to 0.90, while the degree of genetic differentiation between C. oleifera and C. drupifera (Fst = 0.43; Nm = 0.66) was higher than that between the C. oleifera and C. meiocarpa (Fst = 0.67; Nm = 0.25) low. Further analysis showed that the genetic distance between the tested populations was positively correlated with geographic distance (r was 0.7590 for ISSR and SRAP markers and 0.5488 for cpDNA markers), revealing that geographic distance factors play a role in population genetic analysis and gene exchange.
Preliminary study of the origin and evolution of tea-oil Camellia germplasm resources from Sect. Oleifera
cpDNA sequences provide important information for analyzing the origin and evolution of resources because of their maternal inheritance and good evolutionary conservation (Chao et al., 2021; Cheng and Houston, 2021). The discussion presented in this paragraph is based on cpDNA sequence information only. Tajima’s D values and the results of mismatch distribution analysis showed that the tested populations had not experienced obvious expansion events, and their population evolution was characterized by a model of recalcitrance to expansion (Figure 11; Supplementary Table 5). The results of STRUCTURE analysis showed that under the best K value of 2, more than 86.8% of the genetic components of all individuals of C. drupifera in the BQY, WSG, TJG, LJTL, HTDL, JX, ZX, LS, XYL, MNL, MP, and FH populations belonged to Cluster 2; similarly, more than 99% of the genetic components of individuals in the C. meiocarpa populations (HCX and CKX) came from Cluster 1, and 47.3 and 23.1% of the genetic components of the C. oleifera HZP and YML populations, respectively, came from Cluster 2. When K = 3 and K = 4, the populations of C. oleifera still showed a heterozygous composition of their genetic material, while the C. meiocarpa populations and the populations of Hainan Island presented a more homozygous composition (Figure 7). Thus, the C. drupifera populations from Hainan Island and the C. meiocarpa populations had a relatively uniform genetic background. The phylogenetic tree and PCA diagrams showed that the populations of C. oleifera were located between those of C. drupifera and C. meiocarpa (Figures 3, 5). In summary, we suggest that the C. drupifera population is a relatively primitive group in the context of the evolutionary relationships of the tested species, and C. oleifera may have evolved from the hybridization of C. drupifera and C. meiocarpa. Our field investigation showed that C. meiocarpa has small flowers, leaves and fruit, whereas most C. drupifera plants present large flowers, leaves and fruit, and C. oleifera presents an intermediate morphology. C. oleifera and C. osmantha are mostly hexaploid, C. meiocarpa is mostly tetraploid, and C. drupifera is mostly heptaploid or octoploid. These results also support our view regarding the evolution of C. oleifera. Further analysis of haplotype phylogenetic relationships also showed that the haplotypes of C. oleifera, C. osmantha and C. meiocarpa all evolved from the haplotypes of C. drupifera. H2 and H49 of C. drupifera held the central positions among all the haplotypes in the TCS network (Figure 10).
Regardless of whether the analysis was based on ISSR and SRAP data or cpDNA data, when K = 2, 3, 4, or 5, most of the genetic components of the seven populations from Hainan Island belonged to an independent cluster (Figures 6, 7). This result implies that the population resources on Hainan Island represent a relatively homozygous C. drupifera group. The populations on Hainan Island were located at the edges of both the phylogenetic tree and the PCA map. We believe that the germplasm resources of C. drupifera originated from Hainan Island, China. After their introduction to mainland China, there was a high possibility of hybridization with other closely related species, forming a complex genetic group in mainland China. Due to the small number of populations and loci tested in this study, the relevant results need further study and verification.
The exchange of genetic material in plant species is an important driver of plant evolution (Stebbins, 1959; Soltis et al., 2014; Hübner et al., 2019; Steensels et al., 2021), whereas geographic isolation prevents gene exchange among populations (Gao et al., 2015; Di Santo and Hamilton, 2021). Based on the above analysis, we believe that interspecific hybridization caused by outbreeding and the high compatibility of tea-oil Camellia germplasm resources, the obstruction of gene communication caused by geographic distance, and artificial selection are important factors in the evolution of the species in Sect. Oleifera.
Conclusion
According phylogenetic tree analysis, PCA and STRUCTURE analysis results, we believe that C. oleifera. var. monosperma is an independent species, with the suggested name C. meiocarpa. The analysis supported C. gouchowensis and C. vietnamensis were the same species with the unifying name C. drupifera. We further suggest that the tea-oil germplasm resources on Hainan Island represent an ecological type or a variant of C. drupifera, and C. osmantha is a new species in Sect. Oleifera of the Camellia genus showing the closest relationship to C. drupifera. Preliminary analysis showed that the tested populations did not experience obvious expansion events and indicated that C. oleifera may have evolved from the hybridization of C. drupifera and C. meiocarpa. C. drupifera was observed to be a relatively primitive group according to the evolutionary relationships of the tested species. The genetic diversity of the tested populations was low and the genetic differentiation among these populations was significant. The geographical distance factor played an important role in the genetic differentiation and gene exchange of the tested populations.
Data availability statement
The original contributions presented in the study are included in the article/Supplementary material, further inquiries can be directed to the corresponding author.
Author contributions
DZ designed and supervised the project. HQ, HY, DJ, XC, and DL prepared the samples and performed the experiments. HQ, XS, WY, JC, JY, CW, and TX analyzed the data. HQ wrote the manuscript. DZ and HQ revised the manuscript. All authors contributed to the article and approved the submitted version.
Funding
The authors received specific funding for this work from the National Natural Science Foundation of China (31860082), the Project of Sanya Yazhou Bay Science and Technology City (SCKJ-JYRC-202258), the Science and Technology Innovation Project in the Hainan Academy of Agricultural Sciences (HAAS2022KJCX01), and the Project for Technology Development of Hainan Provincial Scientific Research Institutions (SQ2021JSKF0004 and SQKY2022-004).
Conflict of interest
The authors declare that the research was conducted in the absence of any commercial or financial relationships that could be construed as a potential conflict of interest.
Publisher’s note
All claims expressed in this article are solely those of the authors and do not necessarily represent those of their affiliated organizations, or those of the publisher, the editors and the reviewers. Any product that may be evaluated in this article, or claim that may be made by its manufacturer, is not guaranteed or endorsed by the publisher.
Supplementary material
The Supplementary material for this article can be found online at: https://www.frontiersin.org/articles/10.3389/fpls.2022.996731/full#supplementary-material
Footnotes
References
Almerekova, S., Genievskaya, Y., Abugalieva, S., Sato, K., and Turuspekov, Y. (2021). Population structure and genetic diversity of two-rowed barley accessions from Kazakhstan based on SNP genotyping data. Plan. Theory 10:2025. doi: 10.3390/plants10102025
Binks, R. M., Gibson, N., Ottewell, K. M., Macdonald, B., and Byrne, M. (2019). Predicting contemporary range-wide genomic variation using climatic, phylogeographic and morphological knowledge in an ancient, unglaciated landscape. J. Biogeogr. 46, 503–514. doi: 10.1111/jbi.13522
Chao, C. T., Kuo, C. C., Chang, J. T., Chai, M. W., and Liao, P. C. (2021). Evolution of floral characters and biogeography of Heloniadeae (Melanthiaceae): an example of breeding system shifts with inflorescence change. Sci. Rep. 11:21494. doi: 10.1038/s41598-021-01049-0
Chen, J., Guo, Y., Hu, X., and Zhou, K. (2022). Comparison of the chloroplast genome sequences of 13 oil-tea camellia samples and identification of an undetermined oil-tea camellia species from Hainan province. Front. Plant Sci. 12:798581. doi: 10.3389/fpls.2021.798581
Chen, S. C., Zhang, L., Zeng, J., Shi, F., Yang, H., Mao, Y. R., et al. (2012). Geographic variation of chloroplast DNA in Platycarya strobilacea (Juglandaceae). J. Syst. Evol. 50, 374–385. doi: 10.1111/j.1759-6831.2012.00210.x
Cheng, Y. C., and Houston, R. (2021). Evaluation of the trnK-matK-trnK, ycf3, and accD-psal chloroplast regions to differentiate crop type and biogeographical origin of Cannabis sativa. Int. J. Legal Med. 135, 1235–1244. doi: 10.1007/s00414-021-02518-x
Di Santo, L. N., and Hamilton, J. A. (2021). Using environmental and geographic data to optimize ex situ collections and preserve evolutionary potential. Conserv. Biol. 35, 733–744. doi: 10.1111/cobi.13568
Evanno, G., Regnaut, S., and Goudet, J. (2005). Detecting the number of clusters of individuals using the software structure: a simulation study. Mol. Ecol. 14, 2611–2620. doi: 10.1111/j.1365-294x.2005.02553.x
Feng, X., Wang, Y., and Gong, X. (2014). Genetic diversity, genetic structure and demographic history of Cycas simplicipinna (Cycadaceae) assessed by DNA sequences and SSR markers. BMC Plant Biol. 14:187. doi: 10.1186/1471-2229-14-187
Gai, Z., Zhai, J., Chen, X., Jiao, P., Zhang, S., Sun, J., et al. (2021). Phylogeography reveals geographic and environmental factors driving genetic differentiation of populus sect. Turanga in Northwest China. Front. Plant Sci. 12:705083. doi: 10.3389/fpls.2021.705083
Gao, Y. D., Harris, A. J., and He, X. J. (2015). Morphological and ecological divergence of Lilium and Nomocharis within the Hengduan Mountains and Qinghai-Tibetan plateau may result from habitat specialization and hybridization. BMC Evol. Biol. 15:147. doi: 10.1186/s12862-015-0405-2
Graffelman, J., and Weir, B. S. (2022). The transitivity of the hardy-Weinberg law. Forensic Sci. Int. Genet. 58:102680. doi: 10.1016/j.fsigen.2022.102680
Hiremath, C., Philip, R., and Sundaresan, V. (2021). Molecular characterization of India ginseng Withania somnifera (L) using ISSR markers. Mol. Biol. Rep. 48, 3971–3977. doi: 10.1007/s11033-021-06397-8
Hirota, S. K., Yasumoto, A. A., Nitta, K., Tagane, M., Miki, N., Suyama, Y., et al. (2021). Evolutionary history of Hemerocallis in Japan inferred from chloroplast and nuclear phylogenies and levels of interspecific gene flow. Mol. Phylogenetics Evol. 164:107264. doi: 10.1016/j.ympev.2021.107264
Huang, Y. (2011). Analysis of genetic diversity of camellia meiocarpa and study on introgreeive hybridization. dissertation. Beijing: Chinese Academy of Forestry.
Hübner, S., Bercovich, N., Todesco, M., Mandel, J. R., Odenheimer, J., Ziegler, E., et al. (2019). Sunflower pan-genome analysis shows that hybridization altered gene content and disease resistance. Nat. Plants 5, 54–62. doi: 10.1038/s41477-018-0329-0
Jubair, S., Tucker, J. R., Henderson, N., Hiebert, C. W., Badea, A., Domaratzki, M., et al. (2021). GPTransformer: a transformer-based deep learning method for predicting Fusarium related traits in barley. Front. Plant Sci. 12:761402. doi: 10.3389/fpls.2021.761402
Li, S., Liu, S. L., Pei, S. Y., Ning, M. M., and Tang, S. Q. (2020). Genetic diversity and population structure of camellia huana (Theaceae), a limestone species with narrow geographic range, based on chloroplast DNA sequence and microsatellite markers. Plant Divers. 42, 343–350. doi: 10.1016/j.pld.2020.06.003
Lin, P., Wang, K. L., Wang, Y. P., Hu, Z. K., Yan, C., Huang, H., et al. (2022). The genome of oil-camellia and population genomics analysis provide insights into seed oil domestication. Genome Biol. 23:14. doi: 10.1186/s13059-021-02599-2
Liu, J. J. (2010). Collection and Conservation on the Genetic Resources of Camellia oleifera for the Genetic Affinity Molecular Identification. Fuzhou: Fujian Agriculture and Forestry University.
Lu, Y. J., Chen, C., Wang, R. H., Egan, A. N., and Fu, C. X. (2015). Effects of domestication on genetic diversity in Chimonanthus praecox: evidence from chloroplast DNA and amplified fragment length polymorphism data. J. Syst. Evol. 53, 239–251. doi: 10.1111/jse.12134
Lu, X., Chen, H., Wei, S., Bin, X., Ye, Q., and Tang, S. (2020). Chloroplast and nuclear DNA analyses provide insight into the phylogeography and conservation genetics of Camellia nitidissima (Theaceae) in southern Guangxi. China. Tree Genet. Genomes 16:8. doi: 10.1007/s11295-019-1390-1
Ma, J., Ye, H., Rui, Y., Chen, G., and Zhang, N. (2011). Fatty acid composition of Camellia oleifera oil. J. Verbraucherschutz Leb. 6, 9–12. doi: 10.1007/s00003-010-0581-3
Ma, J. L., Ye, H., and Ye, C. X. (2012). A new species of camellia sect. Paracamellia. Guihaia 32, 753–755. doi: 10.3969/j.issn.1000-3142.2012.06.007
Min, T. L. (1999). A systematic synopsis of the genus camellia. Plant Divers. 21, 149–159. doi: 10.3969/j.issn.2095-0845.1999.02.004
Min, T. L., and Bruce, B. (2007). “Camellia,” in Flora of China. Vol. 12. eds. Z. Y. Wu, P. H. raven, and D. Y. Hong (Beijing and St. Louis: Science Press and Missouri Botanical Garden Press).
Nybom, H. (2004). Comparison of different nuclear DNA markers for estimating intraspecific genetic diversity in plants. Mol. Ecol. 13, 1143–1155. doi: 10.1111/j.1365-294x.2004.02141.x
Qi, H. S., Chen, J. L., Yang, L. R., Sun, X. X., Zheng, D. J., and Yu, J. (2020). Optimization of SRAP-PCR system and screening of effective primers for Camellia oleifera Abel. Mol. Plant Breed. 18, 3273–3281. doi: 10.13271/j.mpb.018.003273
Ren, F. M., Wang, Y. W., Xu, Z. C., Li, Y., Xin, T. Y., Zhou, J. G., et al. (2019). DNA barcoding of corydalis, the most taxonomically complicated genus of Papaveraceae. Ecol. Evol. 9, 1934–1945. doi: 10.1002/ece3.4886
Shi, S. H., Tang, S. Q., Chen, Y. Q., Qu, L. H., and Chang, H. T. (1998). Phylogenetic relationships among eleven yellow-flowered camellia species based on random amplified polymorphic DNA. Acta Phytotaxon. Sin. 36, 317–322.
Slatkin, M. (1987). Gene flow and the geographic structure of natural populations. Science 236, 787–792. doi: 10.1126/science.3576198
Soltis, D. E., Visger, C. J., and Soltis, P. S. (2014). The polyploidy revolution then and now: Stebbins revisited. Am. J. Bot. 101, 1057–1078. doi: 10.3732/ajb.1400178
Song, M.-F., Guan, Y.-H., Zhang, Y., Li, H.-T., Zhang, L.-X., and Zhang, Z.-L. (2021). Genetic diversity assessment of a chinese medicinal endemic species, Aspidopterys obcordata var. obcordata, by combined molecular marker methods (ISSR & SRAP). Biochem. Genet. 59, 283–299. doi: 10.1007/s10528-020-10001-2
Stebbins, G. L. (1959). The role of hybridization in evolution. Proc. Am. Philos. Soc. 10, 551–568. doi: 10.1046/j.1365-294x.2001.01216.x
Steensels, J., Gallone, B., and Verstrepen, K. J. (2021). Interspecific hybridization as a driver of fungal evolution and adaptation. Nat. Rev. Microbiol. 19, 485–500. doi: 10.1038/s41579-021-00537-4
Vijayan, K., Zhang, W. J., and Tsou, C. H. (2009). Molecular taxonomy of camellia (Theaceae) inferred from nrITS sequences. Am. J. Bot. 96, 1348–1360. doi: 10.3732/ajb.0800205
Wei, S. J., Lu, Y. B., Ye, Q. Q., and Tang, S. Q. (2017). Population genetic structure and phylogeography of Camellia flavida (Theaceae) based on chloroplast and nuclear DNA sequences. Front. Plant Sci. 8:718. doi: 10.3389/fpls.2017.00718
Wright, S. (1978). Variability Within and Among Natural Populations. The University of Chicago Press, Chicago, IL.
Xia, T. F., Sun, X. X., Chen, J. L., Ma, G. Y., Wang, C. M., Qi, H. S., et al. (2022). Leaves phenotypic diversity analysis of tea-oil camellia germplasm in Hainan Island. Mol. Plant Breed., 1–18.
Xiao, X., He, L., Chen, Y., Wu, L., Wang, L., and Liu, Z. (2017). Anti-inflammatory and antioxidative effects of Camellia oleifera Abel components. Future Med. Chem. 9, 2069–2079. doi: 10.4155/fmc-2017-0109
Xie, Y. T. (2013). Study on intraspecific type classification, evaluation and genetic relationships of Camellia meiocarpa. dissertation. Beijing: Chinese Academy of Forestry.
Xing, R., Gao, Q. B., Zhang, F. Q., Fu, P. C., Wang, J. L., Yan, H. Y., et al. (2017). Genetic variation and phylogenetic relationships of the ectomycorrhizal Floccularia luteovirens on the Qinghai-Tibet plateau. J. Microbiol. 55, 600–606. doi: 10.1007/s12275-017-7101-4
Xu, Z. G., Yuan, D. Y., Tang, Y. C., Wu, L., and Zhao, Y. L. (2020). Camellia hainanica (theaceae) a new species from Hainan, supported from morphological characters and phylogenetic analysis. Pak. J. Bot. 52, 1–8. doi: 10.30848/pjb2020-3(31)
Yang, H., Wei, C. L., Liu, H. W., Wu, J. L., Li, Z. G., Zhang, L., et al. (2016). Genetic divergence between Camellia sinensis and its wild relatives revealed via genome-wide SNPs from RAD sequencing. PLoS One 11:e0151424. doi: 10.1371/journal.pone.0151424
Yang, J. B., Yang, S. X., Li, H. T., Yang, J., and Li, D. Z. (2014). Comparative chloroplast genomes of camellia species. PLoS One 8:e73053. doi: 10.1371/journal.pone.0073053
Yang, L. R., ZL, Z., Chen, J. L., Chen, X., Ji, Q. M., and Zheng, D. J. (2018). The quantitative characters and diversity of oil tea fruit in Hainan province. Non-Wood For. Res. 2, 69–76. doi: 10.29011/2638-0013.100013
Yao, G. L., He, W., Wu, Y. G., Chen, J., Hu, X. W., and Yu, J. (2019). Structure and functional properties of protein from defatted Camellia oleifera seed cake: effect of hydrogen peroxide decolorization. Int. J. Food Prop. 22, 1283–1295. doi: 10.1080/10942912.2019.1642355
Yarar, G., Kocak, M., Denli, N., Cavagnaro, P. F., and Yildiz, M. (2022). Determination of the effective radiation dose for mutation breeding in purple carrot (Daucus carota L.) and possible variations formed. Mol. Biol. Rep. 49, 5219–5228. doi: 10.1007/s11033-021-06618-0
Ye, Z., Wu, Y., Muhammad, U. H., Yan, W, Z., Yu, J., Zhang, J., et al. (2020). Complementary transcriptome and proteome profiling in the mature seeds of Camellia oleifera from Hainan Island. PLoS One 15:e0226888. doi: 10.1371/journal.pone.0226888
Ye, Z., Yu, J., Yan, W., Zhang, J., Yang, D., Yao, G., et al. (2021). Integrative iTRAQ-based proteomic and transcriptomic analysis reveals the accumulation patterns of key metabolites associated with oil quality during seed ripening of Camellia oleifera. Hortic. Res. 8:157. doi: 10.1038/s41438-021-00591-2
Zhang, H. D. (1998). “Camellia,” in Flora of China. eds. H. D. Zhang and S. X. Ren (Beijing: Science Press).
Zhang, X. Y., Tong, H. L., Han, Z. Q., Huang, L., Tian, J., Fu, Z. X., et al. (2021). Cytological and morphology characteristics of natural microsporogenesis within Camellia oleifera. Physiol. Mol. Biol. Plants 27, 959–968. doi: 10.1007/s12298-021-01002-5
Zhang, W., Zhao, Y., Yang, G., Peng, J., Chen, S., and Xu, Z. (2019). Determination of the evolutionary pressure on Camellia oleifera on Hainan Island using the complete chloroplast genome sequence. PeerJ 7:7210. doi: 10.7717/peerj.7210
Zhang, W., Zhao, Y., Yang, G., Tang, Y., and Xu, Z. (2017). Characterization of the complete chloroplast genome sequence of Camellia oleifera in Hainan, China. Mitochondrial DNA B Resour. 2, 843–844. doi: 10.1080/23802359.2017.1407687
Keywords: tea-oil Camellia, Camellia Sect. Oleifera, germplasm resources, genetic relationships and diversity, classification
Citation: Qi H, Sun X, Yan W, Ye H, Chen J, Yu J, Jun D, Wang C, Xia T, Chen X, Li D and Zheng D (2022) Genetic relationships and low diversity among the tea-oil Camellia species in Sect. Oleifera, a bulk woody oil crop in China. Front. Plant Sci. 13:996731. doi: 10.3389/fpls.2022.996731
Edited by:
Aliki Kapazoglou, Hellenic Agricultural Organization DEMETER, GreeceReviewed by:
Zujun Yang, University of Electronic Science and Technology of China, ChinaEvangelia V. Avramidou, National Agricultural Research Foundation, Greece
Copyright © 2022 Qi, Sun, Yan, Ye, Chen, Yu, Jun, Wang, Xia, Chen, Li and Zheng. This is an open-access article distributed under the terms of the Creative Commons Attribution License (CC BY). The use, distribution or reproduction in other forums is permitted, provided the original author(s) and the copyright owner(s) are credited and that the original publication in this journal is cited, in accordance with accepted academic practice. No use, distribution or reproduction is permitted which does not comply with these terms.
*Correspondence: Daojun Zheng, ZGFvanVuemhAMTYzLmNvbQ==