 Jin Zhang
 Shengmeng Wang
 Xinyi Wu
 Le Han1
 Yangjun Wen
- 1College of Science, Nanjing Agricultural University, Nanjing, China
- 2Key Laboratory of Crop Genetics and Germplasm Enhancement, Nanjing Agricultural University, Nanjing, China
Rice, which supports more than half the population worldwide, is one of the most important food crops. Thus, potential yield-related quantitative trait nucleotides (QTNs) and QTN-by-environment interactions (QEIs) have been used to develop efficient rice breeding strategies. In this study, a compressed variance component mixed model, 3VmrMLM, in genome-wide association studies was used to detect QTNs for eight yield-related traits of 413 rice accessions with 44,000 single nucleotide polymorphisms. These traits include florets per panicle, panicle fertility, panicle length, panicle number per plant, plant height, primary panicle branch number, seed number per panicle, and flowering time. Meanwhile, QTNs and QEIs were identified for flowering times in three different environments and five subpopulations. In the detections, a total of 7~23 QTNs were detected for each trait, including the three single-environment flowering time traits. In the detection of QEIs for flowering time in the three environments, 21 QTNs and 13 QEIs were identified. In the five subpopulation analyses, 3~9 QTNs and 2~4 QEIs were detected for each subpopulation. Based on previous studies, we identified 87 known genes around the significant/suggested QTNs and QEIs, such as LOC_Os06g06750 (OsMADS5) and LOC_Os07g47330 (FZP). Further differential expression analysis and functional enrichment analysis identified 30 candidate genes. Of these candidate genes, 27 genes had high expression in specific tissues, and 19 of these 27 genes were homologous to known genes in Arabidopsis. Haplotype difference analysis revealed that LOC_Os04g53210 and LOC_Os07g42440 are possibly associated with yield, and LOC_Os04g53210 may be useful around a QEI for flowering time. These results provide insights for future breeding for high quality and yield in rice.
Introduction
Rice (Oryza sativa L.), one of the most important food crops, supports more than half the population in the world. Therefore, rice is crucial to improving the safety, quality, stability, and sustainability of the global food supply (Muthayya et al., 2014). In China, rice production is second only to maize, accounting for 31.64% of the total grain produced in 2020 (http://www.stats.gov.cn/tjsj/ndsj/, accessed on June 2022). Moreover, from 1994 to 2020, rice accounted for 27.17% of the total grain produced in the world, which is 657.85 million tons per year (http://www.fao.org/faostat/en/#data/QC/visualize, accessed on June 2022). There is an urgent, ongoing global demand for highly productive rice varieties due to growth in the human population in particular in developing nations, in which rice is the primary source of calories (Toriyama, 2005); climate change; and the labor-, land-, and water-intensive nature of rice cultivation (Greenland, 1997). Furthermore, climate has an impact on the most crucial traits of rice, such as production and quality. Weather catastrophes are becoming increasingly severe across the world because of accelerating global climate change, which poses a significant challenge to the production of sustainable food. Developing resilient crops is an efficient strategy for coping with climate change. A wealth of plant breeding and genomic resources have been developed by the scientific community to assist in this endeavor, including high-quality genome sequences (Goff et al., 2002; Yu et al., 2002), dense SNP maps (McNally et al., 2009; Ebana et al., 2010; Huang et al., 2010), extensive germplasm collections (Ebana et al., 2008; McNally et al., 2009; Agrama et al., 2010), and public databases of genomic information (Tanaka et al., 2008; McNally et al., 2009; Huang et al., 2010; Youens-Clark et al., 2011). Yet despite the emergence of these scientific resources, traditional quantitative trait locus linkage mapping is most often used to understand the genetic structures of complex traits in rice.
Genome-wide association study (GWAS) mapping enables the simultaneous screening of huge numbers of accessions for genetic variation in a variety of complex traits. Humongous genetic variants for agronomic and economic traits have been extensively studied using single-locus GWAS methods, such as MLM (Zhang et al., 2005; Yu et al., 2006), EMMA (Kang et al., 2008), and GEMMA (Zhou and Stephens, 2012). Such single-locus GWAS methods have a limited ability in detecting quantitative trait nucleotides (QTNs) with marginal effects that are affected by the polygenic background and stringent Bonferroni correction (Wang et al., 2016). Even if adjusting for polygenic background enhances the statistical power of QTN detection, it is still difficult to identify the majority of small-effect QTNs related to complex traits using single-locus GWAS methods.
To address the issue in single-locus GWAS methods, multi-locus GWAS methods were developed as a multidimensional method of genome analysis, which simultaneously estimate the effects of all markers (Cui et al., 2018). In particular, to address the selection of cofactors in multi-locus GWAS models with millions of markers, researchers have proposed MLMM (Segura et al., 2012), FarmCPU (Liu et al., 2016), mrMLM (Wang et al., 2016), pLARmEB (Zhang et al., 2017), and FASTmrEMMA (Wen et al., 2018). However, the dominance (d) or QTN-by-environment interaction (QEI) were not fully considered in the above models. Moreover, when additive (a) and dominance (d) effects, additive-by-environment (a×e) interaction, dominance-by-environment (d×e) interaction, and their polygenic backgrounds are simultaneously included as random effects in a mixed model of genome-wide analysis, there are 10 variance components, which creates a huge computational burden.
To improve calculation efficiency, a mixed model with three variance components was combined with mrMLM to establish a new methodological framework, namely, 3VmrMLM, that identifies all types of loci and estimates their effects while controlling all possible polygenic backgrounds (Li et al., 2022a). In GWAS, QEI can be used extensively to explore the genetic structures of complex traits to meet the needs of phenotypic plasticity research and global climate change. 3VmrMLM was expanded to cover QEI using the same thinking as in QTN detection models.
The data set of 413 rice accessions with 44,000 SNPs from the Rice Diversity database (www.ricediversity.org, accessed on April 2022) is suitable for GWAS, which has been performed by many researchers. Although this data set contains a wealth of information, including data on yield-related traits closely related to human life, phenotypic data on a given trait in different locations, and data on different subpopulations with the same trait, it has been seldom studied for further both QTN and QEI detection simultaneously. Therefore, in this study, we reanalyzed eight yield-related traits in this natural population of 413 rice accessions using the proposed multi-locus method, 3VmrMLM. Our goals were to detect the significant QTNs and QEIs related to rice yield, mine candidate genes, speed up molecular marker-assisted breeding, and increase rice production.
Material and methods
Phenotypic data and statistical analysis
We used 3VmrMLM (Li et al., 2022a, 2022b) to reanalyze 413 accessions with 36,901 SNPs in rice (Oryza sativa L.) in Zhao et al. (2011) to detect significant QTNs and QEIs for eight yield-related traits. Phenotypic data were downloaded from the Rice Diversity database (www.ricediversity.org, accessed on April 2022). The yield-related agronomic traits were florets per panicle (FPP), panicle fertility (PF), panicle length (PL), panicle number per plant (PNPP), plant height (PH), primary panicle branch number (PPBN), seed number per panicle (SNPP), and flowering time in three environments, Aberdeen (FTAB), Arkansas (FTAR), and Faridpur (FTF). In Zhao et al. (2011), detailed information on the experimental designs is described. Flowering time at the three locations (FTAB, FTAR, and FTF) was used to detect QEIs for multi-environment analysis and also to detect QTNs for single-environment analysis. The other seven traits were phenotyped at the same locations for single-environment analysis to detect QTNs in this study.
To illustrate the variability of gene-environment interactions in subpopulations in rice, we also analyzed rice flowering time in FTAB, FTAR, and FTF for five subpopulations derived from Zhao et al. (2011), including Admixed (ADMIX), Australia (AUS), Indica (IND), Temperate japonica (TEJ), and Tropical japonica (TRJ), with sample sizes of 43, 50, 52, 69, and 78, respectively.
To visualize all eight traits, descriptive statistical analysis for each phenotypic data was performed, including the mean, minimum, maximum, range, standard deviation, and coefficient of variation (CV) for each trait (Table 1). Pearson correlation analysis (Figure 1) for all phenotypic data was performed in R version 4.1.2 (https://www.r-project.org/).
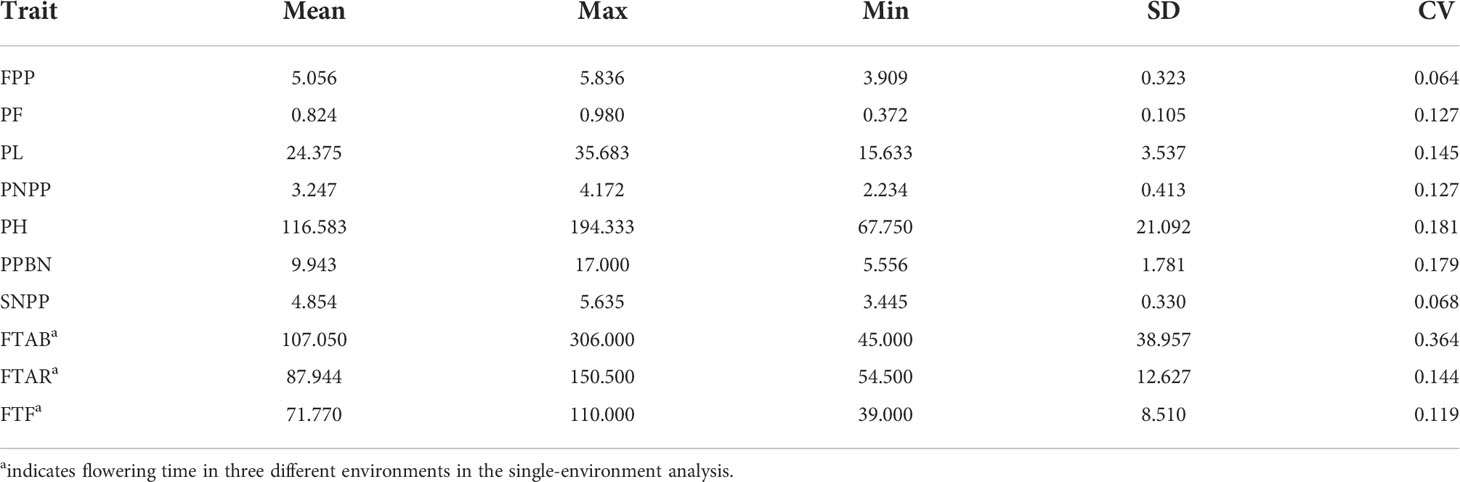
Table 1 Statistical analysis of eight rice yield-related traits.

Figure 1 Distribution of eight yield-related traits in rice and Pearson coefficients. FTAB, FTAR, and FTF are the flowering time in three different environments in the single-environment analysis. Linear regression statistics between the two traits are below the diagonal, the diagonal histogram represents the distribution of each trait, and correlation coefficients are above the diagonal (positive numbers represent positive correlations, negative numbers represent negative correlations).
Genotypic data
Genotypic data for the 413 rice accessions were obtained from the Rice Diversity database (www.ricediversity.org, accessed on April 2022). The data set consisted of a well-distributed 36,901 SNP array across the 12 chromosomes of rice with call rate > 70% and minor allele frequency > 0.01 (Zhao et al., 2011). To visualize the genotype in this study, Figures 2A, B illustrate the distribution of the minor allele frequency and the density distribution of loci on each chromosome. These were relatively uniform, which indicates that this data set is suitable for genetics dissection in rice.
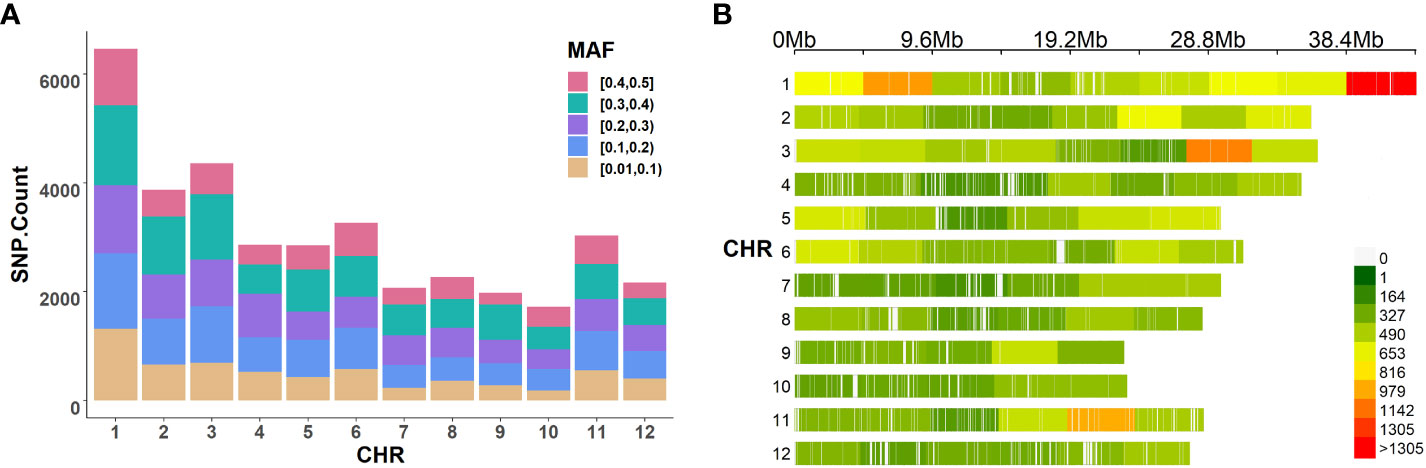
Figure 2 The distribution of SNPs in rice. (A) The distribution of minor allele frequency. (B) The density distribution of SNPs.
Gwas
The IIIVmrMLM software (Li et al., 2022b) of 3VmrMLM method (Li et al., 2022a) was downloaded from github (https://github.com/YuanmingZhang65/IIIVmrMLM). We performed QTN and QEI detection using the IIIVmrMLM function, specifying the parameters of “=Single_env” for the QTN detection model and “=Multi_env” for the QEI detection model. The thresholds of significant and suggested QTN or QEI were set at P-value = 0.05/m and LOD = 3.00, respectively, where m is the number of markers (Li et al., 2022a).
SNP annotation and the identification of known genes
The China Rice Data Center database (https://ricedata.cn/, accessed on June 2022) was used to annotate the genes around significant/suggested QTNs and QEIs identified by 3VmrMLM. For all identified loci, regions within 200 kb were used to search for known genes (which were reported in previous studies and identified by 3VmrMLM simultaneously) according to linkage disequilibrium decay.
Functional enrichment analysis and the identification of candidate genes
We performed differential expression analysis using the online tool GEO2R (https://www.ncbi.nlm.nih.gov/geo/geo2r/, accessed on September 2022) on four data sets (GSE19024, GSE21396, GSE136746, and GSE166053) from the Gene Expression Omnibus database (https://www.ncbi.nlm.nih.gov/geo/, accessed on September 2022). The datasets contain transcriptomic data related to rice development. Differentially expressed genes (DEGs) were screened by adjusted P-values less than 0.05, and then intersected with genes around significant/suggested QTNs or QEIs to obtain DEGs significantly associated with the target traits. For the functional annotation analysis, information of the above DEGs related to the target traits was submitted to the web-based tool DAVID (https://david.ncifcrf.gov/home.jsp, accessed on September 2022) to perform Kyoto Encyclopedia of Genes and Genomes functional enrichment analysis. Fisher’s exact test (P < 0.05) was used to select enrichment KEGG pathways. Genes that were enriched in these significant pathways were considered as candidate genes.
Tissue specific expression and blast of homologous genes in Arabidopsis
The database Rice Genome Annotation Project (http://rice.uga.edu/, accessed on September 2022) was used to investigate the expression of all candidate genes in various tissues to further illustrate the association between genes and phenotypic variations. The R package pheatmap was used to create a heatmap of the FPKM expression of the candidate genes. Protein sequence information of the candidate genes was submitted to the Rice Genome Annotation Project (http://rice.uga.edu/analyses_search_blast.shtml, accessed on September 2022) to mine homologous Arabidopsis genes.
Analysis of haplotype and phenotypic difference
To validate the associated loci between candidate genes and traits, the HaploView software package (http://www.broad.mit.edu/mpg/haploview/; Barrett et al., 2005) was used to perform linkage disequilibrium and haplotype block analyses and to estimate the frequency of haplotype populations in candidate genes. For each gene, significant variations were used for haplotype division, and the phenotypic differences between haplotypes was analyzed via t test using the t.test function in R.
Results
Phenotypic variation
Eight yield-related traits (including FPP, PF, PL, PNPP, PH, PPBN, SNPP, and flowering time in FTAB, FTAR, and FTF) were reanalyzed to determine whether there exists any significant genetic variation in these traits across 413 rice accessions. Descriptive statistics for all traits are listed in Table 1. Let us consider CV as an example, for flowering time in each single-environment, FTAB had the highest CV at 36.4%, which indicates that flowering time at Aberdeen had the largest variation. Furthermore, the CVs for FTAR and FTF were 14.4% and 11.9%, both relatively large, which indicates large variation and environmentally sensitive for flowering time. In addition, the CVs for the other six traits (PF, PL, PNPP, PH, PPBN, and SNPP) were 12.7%, 14.5%, 12.7%, 18.1%, 17.9%, and 6.8%, and FPP had the lowest CV at 6.4%.
Pearson correlation coefficients (PCCs) were calculated among the eight traits (Figure 1). FPP and PNPP were negatively correlated (PCC = –0.33), and a negative correlation was also observed between FPP and PF (PCC = –0.11). FPP was positively correlated with PPBN (PCC = 0.7) and SNPP (PCC = 0.83). In addition, PL was positively correlated with PH (PCC = 0.64), SNPP (PCC = 0.34), and FPP (PCC = 0.39), which indicates the close genetic relationship between panicle length and panicle number. With regard to flowering time across environments, FTAB was positively correlated with FTAR (PCC = 0.74) and FTF (PCC = 0.50), and FTAR and FTF were positively correlated (PCC = 0.54). These results demonstrate that the eight rice traits play a crucial role in controlling the rice yield and significantly correlate to one another.
Identification of QTNs for yield-related traits using 3VmrMLM
We reanalyzed all eight yield-related traits using the single-environment QTN detection model in 3VmrMLM to identify QTNs, where flowering time was measured in three different environments. A total of 165 significant/suggested QTNs (Supplementary Table S1; Supplementary Figure S1) were detected as associated with at least one of the eight yield-related traits. Of these QTNs, 17, 16, 16, 21, 23, 17, 15, 15, 18, and 7 QTNs (Supplementary Table S1; Supplementary Figure S1) were associated with FPP, PF, PL, PNPP, PH, PPBN, SNPP, FTAB, FTAR, and FTF, respectively. The proportion of total phenotypic variance explained by QTNs for each single trait were 72.61%, 73.29%, 75.48%, 51.99%, 64.17%, 71.64%, 58.55%, 58.04%, 77.07%, and 44.60% calculated by the R package IIIVmrMLM. It shows that most QTNs had only additive effects. Note that some QTNs, such as id3005865 for FPP, id5014747 for PF, and id4007762 for PH, had both additive and dominance effects.
A total of 17 QTN hotspots (Supplementary Table S1; Supplementary Figure S1A) were detected as significantly associated with FPP, with P-values of 2.19E-32~7.60E-07 and LOD scores of 5.31~31.66, respectively. A total of 16 QTNs (Supplementary Table S1; Supplementary Figure S1B) associated with PF were detected with P-values of 1.08E-44~1.07E-06 and LOD scores of 4.97~32.90. A total of 16 QTNs (Supplementary Table S1; Supplementary Figure S1C) were associated with PL, with P-values of 2.33E-56~1.02E-05 and LOD scores of 4.23~54.34, and id7004886 located on chromosome 7 had the maximum phenotypic variance explained at 22.04% (Supplementary Table S1). Moreover, 21 QTNs (Supplementary Table S1; Supplementary Figure S1D) associated with PNPP were detected with P-values of 1.78E-37~9.71E-06. For PH, 23 QTNs (Supplementary Table S1; Supplementary Figure S1E) were detected with P-values of 1.15E-38~7.60E-05 and LOD scores of 3.40~37.94. A total of 18 QTNs (Supplementary Table S1; Supplementary Figure S1F) were detected as associated with PPBN; they were widely located on chromosomes 1, 2, 4, and 9, with P-values of 2.05E-39~1.31E-05 and LOD scores of 4.13~37.47. Among these QTNs, id1009181 located on chromosome 1 explained 16.03% of the phenotypic variance. For SNPP, 15 QTNs (Supplementary Table S1; Supplementary Figure S1G) were detected with P-values of 3.95E-41~2.11E-05 and LOD scores of 3.93~39.18. For the three flowering time environments, 30 QTNs (Supplementary Table S1; Supplementary Figure S1H–J) were detected on all chromosomes except chromosome 12 were detected, with P-values of 1.15E-32~2.17E-05 and LOD scores of 1.40~11.30. id4000121, ud7002024, and id4004217 explained the maximum phenotypic variance, which were 14.47%, 11.30%, and 7.75%, respectively.
Known genes around significant/suggested QTNs
We compared genomic regions of 165 significant/suggested QTNs (200 kb up- and down-stream of each significant/suggested QTN) to the genomic positions of reported genes related to rice yield. A total of 73 known genes were around the significant/suggested QTNs, including 9, 7, 3, 14, 17, 6, 6, 2, 7, and 2 known genes for FPP, PF, PL, PNPP, PH, PPBN, SNPP, FTAB, FTAR, and FTF, respectively (Table 2; Supplementary Figure S1). Marker id1019150 located on chromosome 1 around LOC_Os01g54810 was simultaneously associated with PL and PH (Table 2; Supplementary Figure S1). Moreover, id1002863 and id7004587 around LOC_Os01g07480 and LOC_Os07g41250, respectively, on chromosomes 1 and 7 were associated with FPP and SNPP (Table 2; Supplementary Figure S1). It is interesting that a QTN can overlap with multiple known genes (e.g., three genes, LOC_Os02g45054, LOC_Os02g45070, and LOC_Os02g45110 were simultaneously around id2012042 on chromosome 2, Table 2; Supplementary Figure S1). sd1 is associated with PH (Zhao et al., 2011). Moreover, OsRA2, located on chromosome 1 and simultaneously associated with FPP and SNPP, modifies panicle architecture by regulating pedicel length (Leran et al., 2014; Lu et al., 2017). OsPTR4 controls FPP and SNPP (Leran et al., 2014).
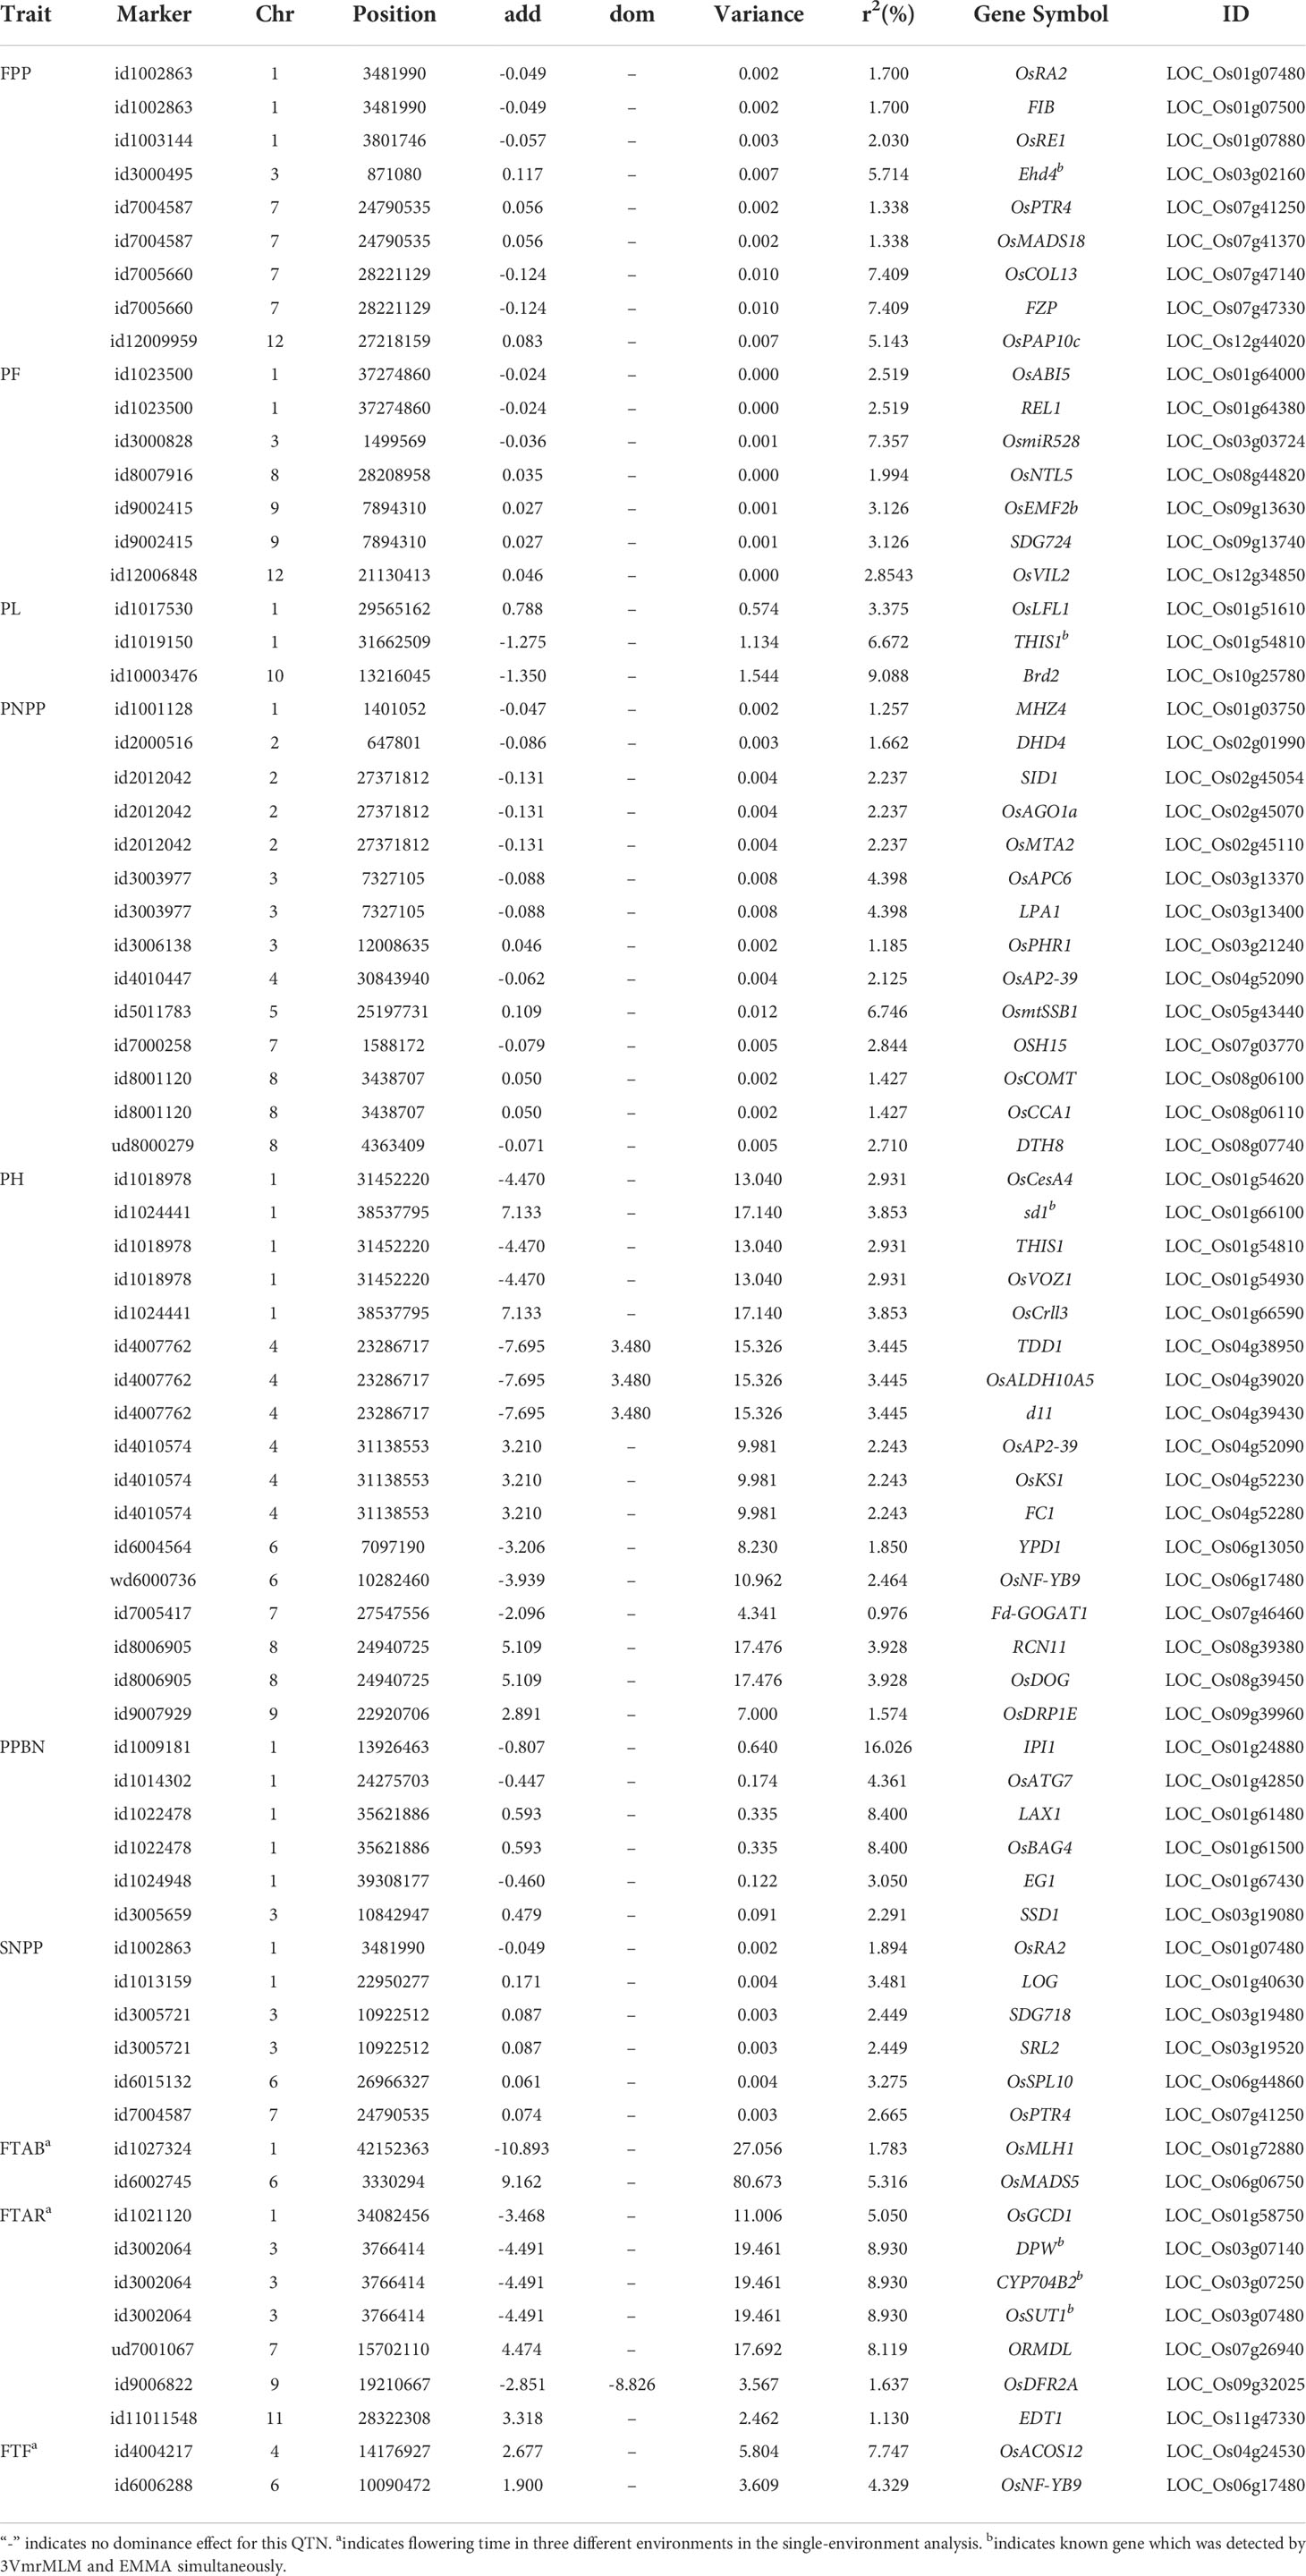
Table 2 Known genes identified for rice yield-related traits using the QTN detection model in 3VmrMLM.
Detection of QEIs for rice flowering time using 3VmrMLM
In the multi-environment analysis, flowering time at three locations (Aberdeen, Arkansas, and Faridpur) was reanalyzed using the QEI detection model in 3VmrMLM to identify QEIs. A total of 21 significant/suggested QTNs (Table 3; Supplementary Figure S2A) and 13 significant/suggested QEIs (Table 4; Supplementary Figure S2B) were simultaneously detected. Among them, id6006118 located on chromosome 6 had additive-by-environment interaction and dominance-by-environment interaction in all three environments.
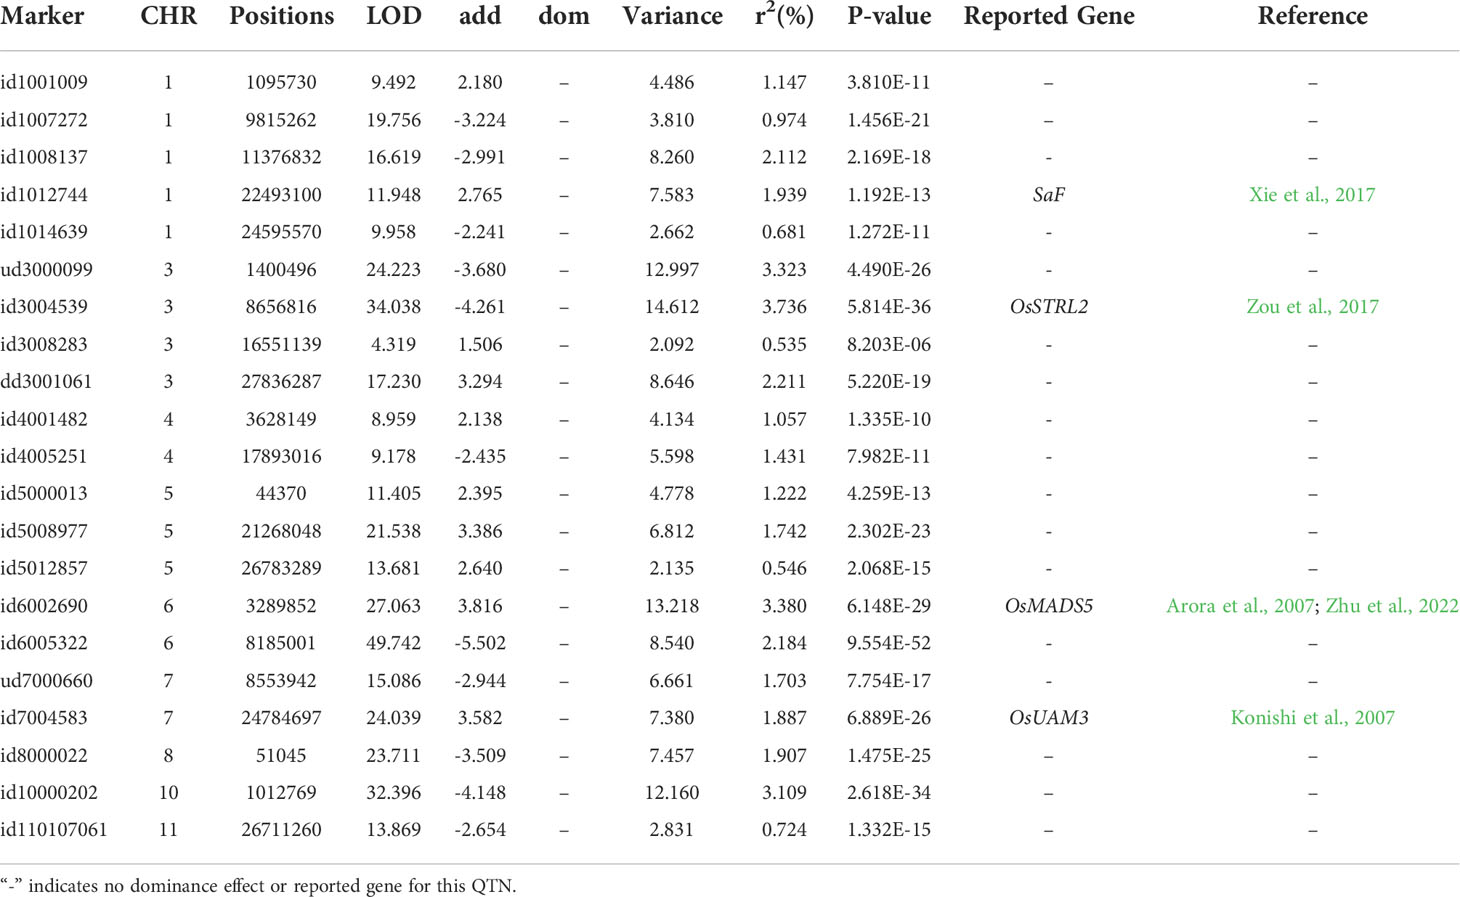
Table 3 Significant/suggested QTNs for rice flowering time in three environments detected using the QTN-by-environment detection model in 3VmrMLM.
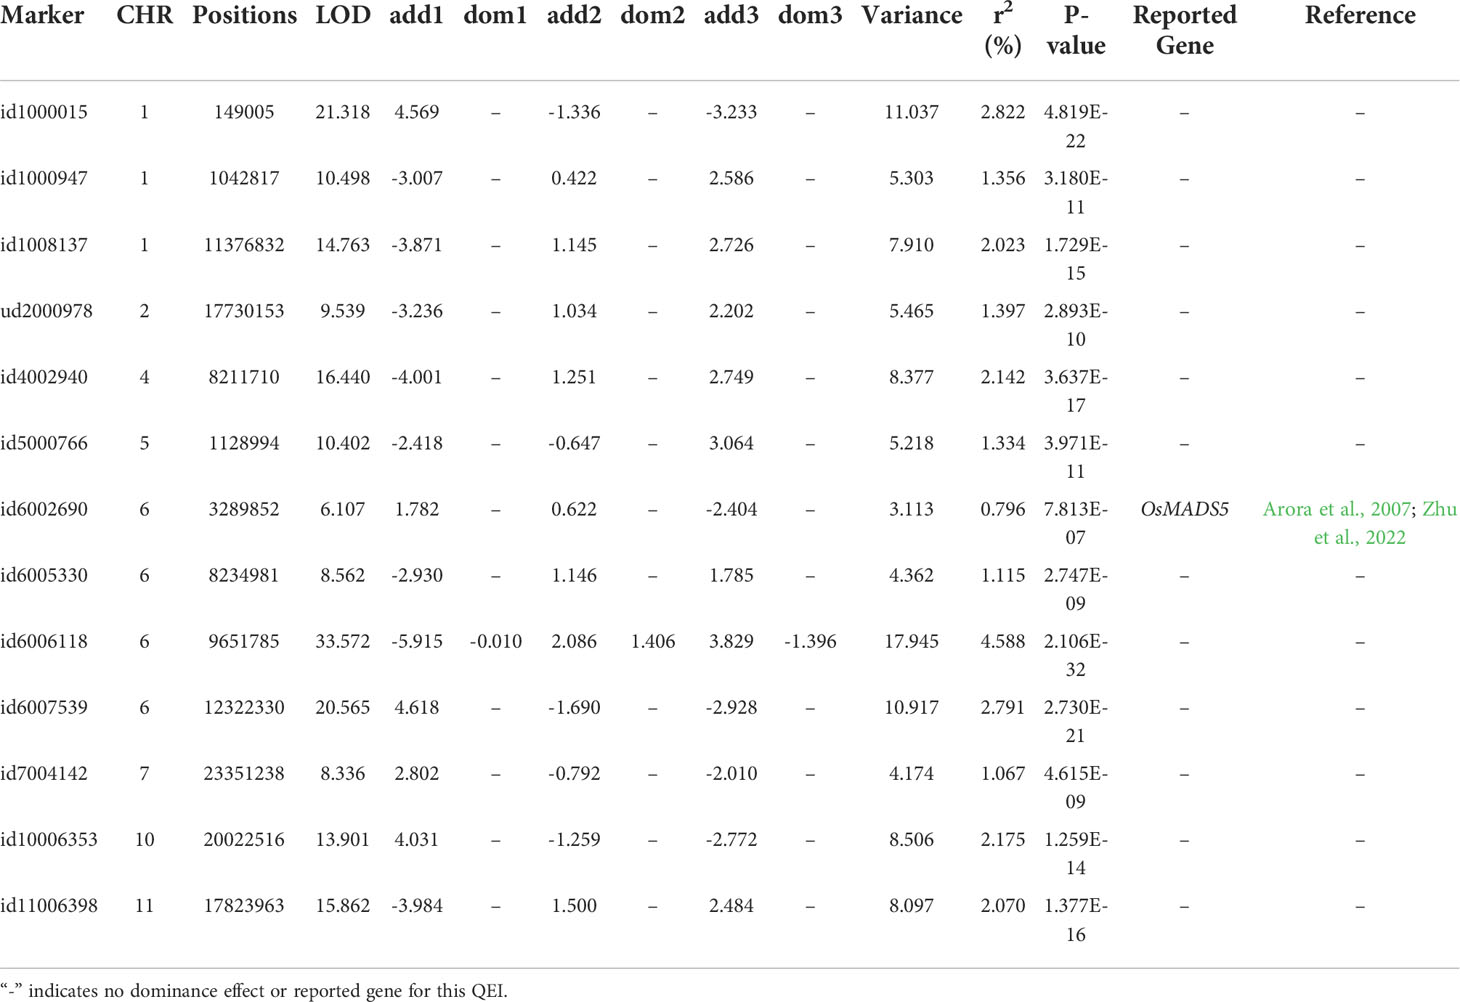
Table 4 Significant/suggested QEIs for rice flowering time in three environments detected using the QTN-by-environment detection model in 3VmrMLM.
We compared genomic regions of the significant/suggested QTNs or QEIs (200 kb up- and down-stream around the significant/suggested QTNs or QEIs) to the positions of previously reported genes related to rice flowering time. 4 QTNs (Table 3; Supplementary Figure S2A) and 1 QEI (Table 4; Supplementary Figure S2B) overlapped with the known genes. Notably, id6002690, which was adjacent to LOC_Os06g06750 (OsMADS5), was demonstrated to have both QTN and QEI effects. Microarray-based expression profiling and genome-wide molecular characterization of the genes that encode the MADS-box transcription factor family was presented by Arora et al. (2007). OsMADS5 in this gene family is associated with the development of inflorescence. Recently, Zhu et al. (2022) also revealed the function of OsMADS5 in the development of inflorescence and showed that OsMADS5 is involved in limiting branching and promoting the transition to spikelet meristem identity, partly by repressing RCN4 expression.
For five different subpopulations (ADMIX, AUS, IND, TEJ, and TRJ), flowering time in FTAB, FTAR, and FTF was also analyzed to illustrate the variability in gene-environment interactions. A total of 25 QTNs and 15 QEIs (Supplementary Table S2; Supplementary Figures S2C–L) were simultaneously detected with the multi-environment detection model in 3VmrMLM, including 3, 3, 6, 9, and 4 QTNs and 4, 2, 4, 3, and 2 QEIs for ADMIX, AUS, IND, TEJ, and TRJ, respectively. Note that there was no overlap in QEI between different subpopulations, which may indicate that these QEIs come from different ecological adaptations.
Functional enrichment analysis of candidate genes
In addition to the aforementioned significant/suggested QTNs and QEIs with known genes, we also detected several new QTNs and QEIs that have not been reported in previous studies, such as id2005901, id6007721, id12008098, and id9001769 (Supplementary Table S1; Supplementary Figure S1). To identify the candidate genes, we considered genes in regions 200 kb up- and down-stream around each significant/suggested QTN and QEI, including all studies of population and each subpopulation. There are about 8000 genes within these 200kb regions, of which 755 are DEGs that show different expression between test and control groups of rice accessions.
In the Kyoto Encyclopedia of Genes and Genomes analysis, 30 genes significantly involved in 4 biological processes (terpenoid backbone biosynthesis, butanoate metabolism, carbon metabolism, and alanine, aspartate and glutamate metabolism) were defined as candidate genes. Figure 3A shows results for the candidate genes in the rectangular boxes, the most significant pathways are marked in red.
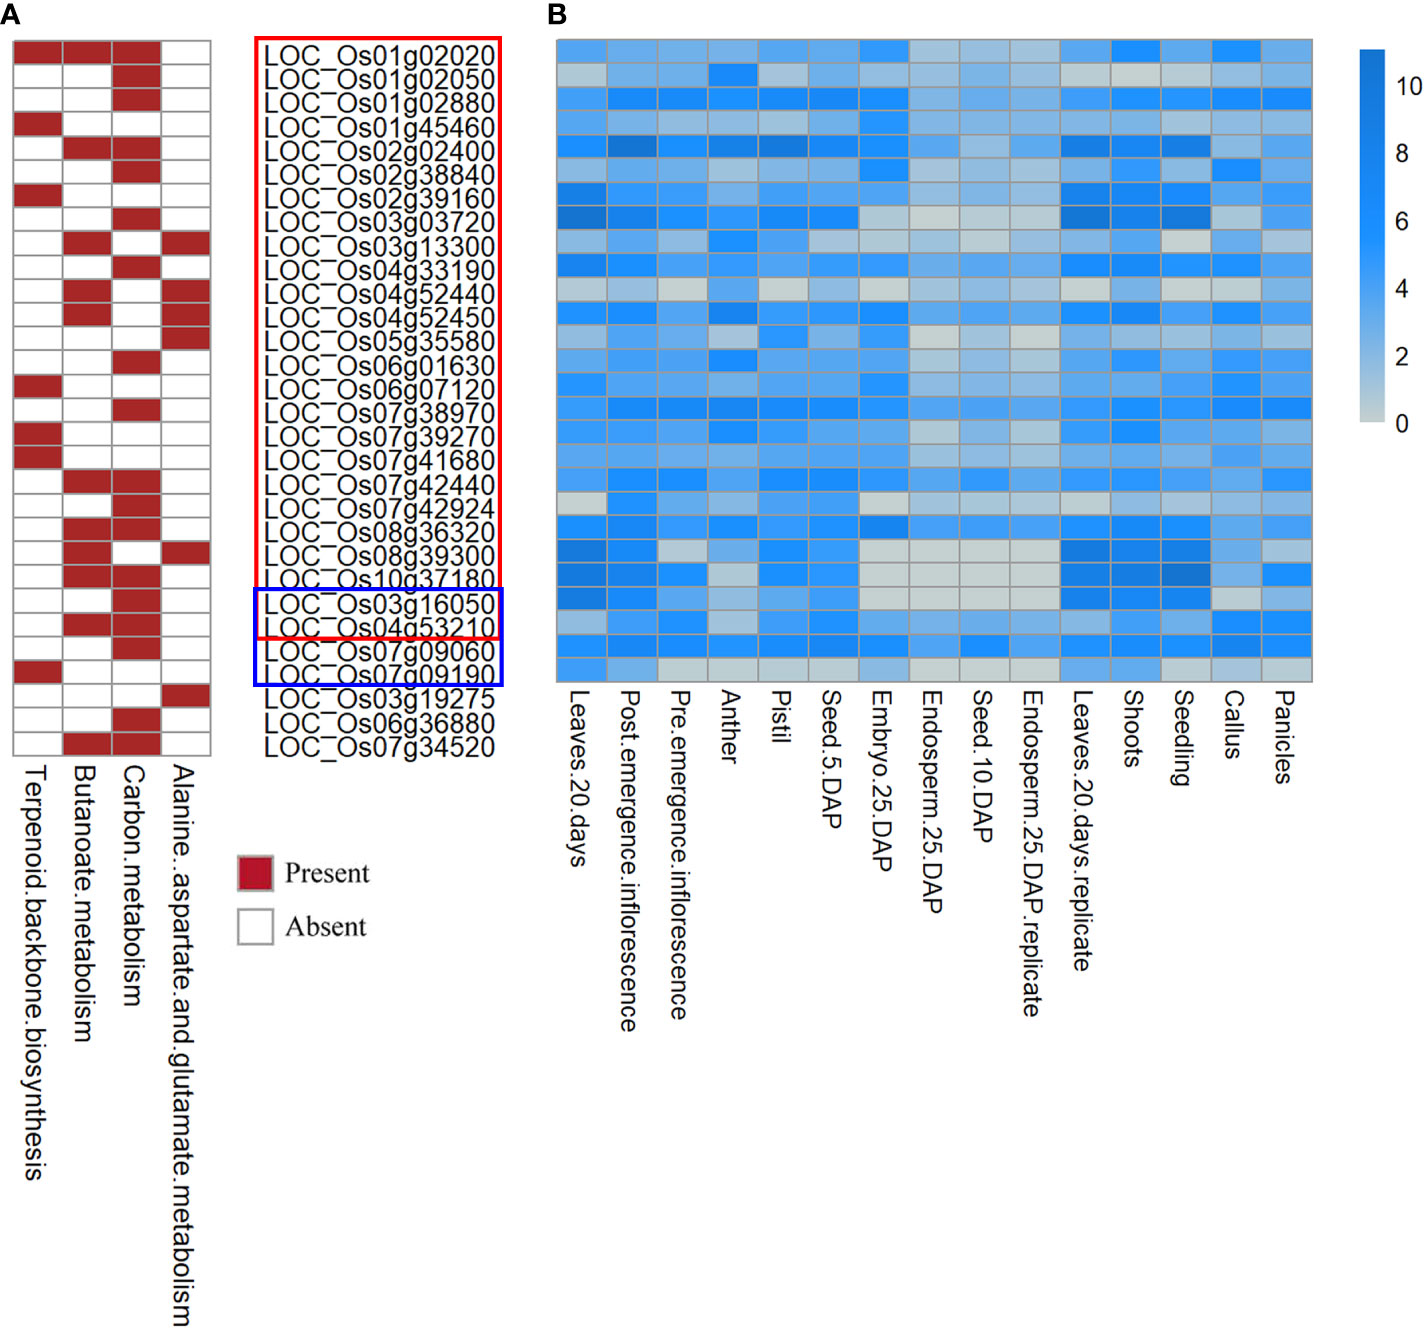
Figure 3 Heatmap of the functional enrichment analysis and tissue-specific expression analysis. (A) Heatmap of the functional enrichment analysis for the candidate genes. (B) Heatmap of FPKM expression for the part of candidate genes. The y-axis is log2(FPKM+1). Candidate genes in the red box correspond to QTNs. Blue box: QEIs for flowering time, remaining: candidate genes not expressed in specific tissue.
The results of the functional enrichment analysis (Figure 3A) showed that some candidate genes around the new QTNs and QEIs were involved in many biological and metabolic processes during rice growth, which have not been reported in previous studies, such as flower development, which indicates that these candidate genes have a non-negligible influence on the target traits. For example, LOC_Os01g02020 (Figure 3A), a candidate gene detected in PH and SNPP, was involved in terpenoid backbone biosynthesis, butanoate metabolism, and carbon metabolism. In addition, the candidate gene LOC_Os04g52450 (Figure 3A) was directly involved in butanoate metabolism and in alanine, aspartate, and glutamate metabolism. Moreover, some candidate genes detected in the multi-environment analysis for each subpopulation, including LOC_Os03g16050 for IND, LOC_Os04g53210 for AUS, and LOC_Os07g09060 and LOC_Os07g09190 for TRJ (Figure 3A), were involved in a series of biological and metabolic processes.
Expression profile of candidate genes
The Rice Genome Annotation Project database (http://rice.uga.edu) demonstrates the expression of the candidate genes in various tissues or organs, including shoots, roots, seeds, leaves, panicles, anthers, pistils, post-emergence, pre-emergence, and embryos. The heatmap of the candidate genes presented in Figure 3B shows the FPKM expression of the candidate genes in tissues and organs.
For QTN, LOC_Os04g52450 and LOC_Os08g36320 had high expression in leaves, panicles, shoots, and seedlings in rice (Figure 3B). Furthermore, LOC_Os03g16050 had the highest expression in pre-emergence inflorescence, leaves, shoots, and seedlings. Some earlier studies (Zhao et al., 2011; Weng et al., 2014) suggested that inflorescence, anthers, pistils, and panicles play important roles in regulating yield.
For QEIs of flowering time, LOC_Os03g16050, LOC_Os04g53210, LOC_Os07g09060 had high expression in post-emergence inflorescence and pre-emergence inflorescence, which might indicate a potential association between these candidate genes and flowering time (Figure 3B).
Among the 30 candidate genes, LOC_Os03g19275, LOC_Os06g36880, and LOC_Os07g34520 were not expressed in panicles or inflorescence; thus, these genes were not considered in further analyses. Among the 27 candidate genes identified here after tissue-specific expression analysis, 19 candidate genes are listed in Table 5 for their homologous Arabidopsis genes.
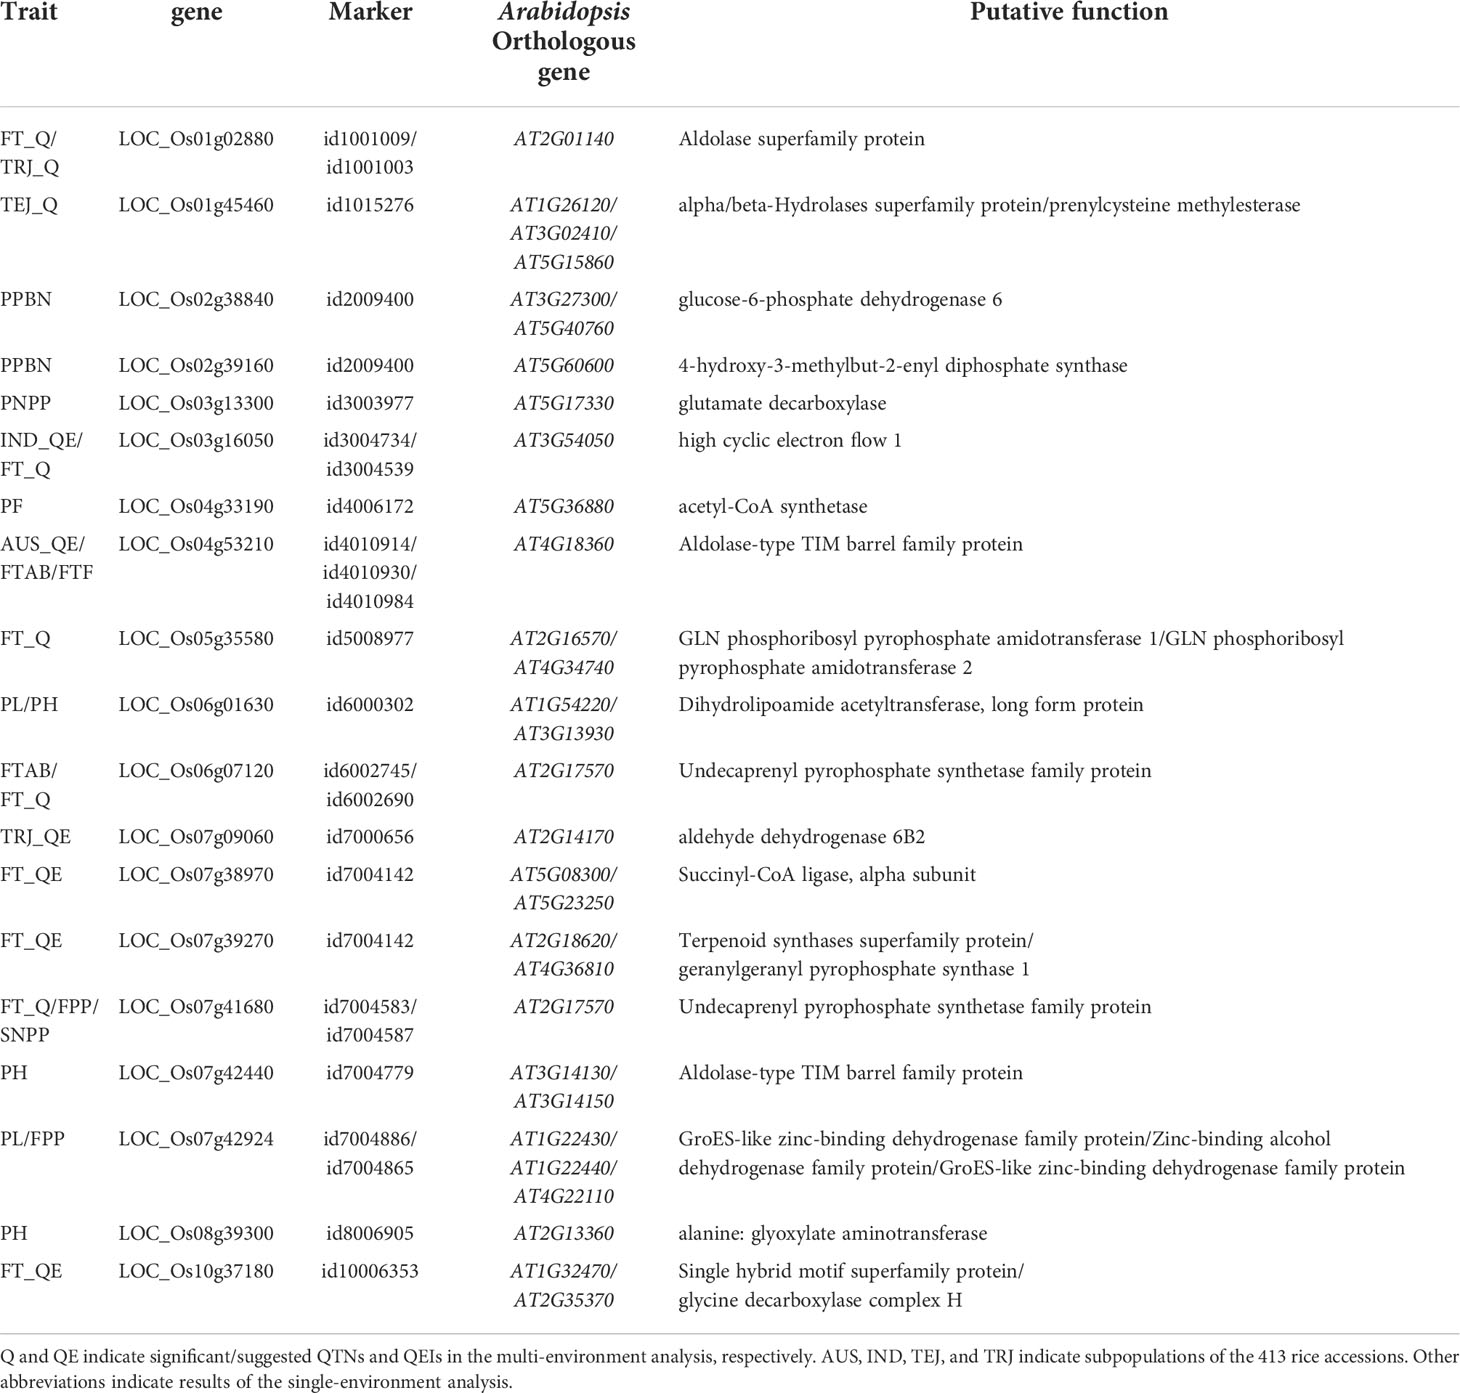
Table 5 Orthologous information of candidate genes with higher tissue expression.
Haplotype and phenotypic difference analysis of candidate genes
To further verify the association between the candidate genes and target traits, we performed haplotype analysis of the candidate genes using SNPs within the candidate genes and 2 kb upstream of the candidate genes. LOC_Os04g53210 (CDS coordinates [5′-3′]: 31688717 ~ 31692592) was analyzed to reveal the intragenic variation affecting the rice yield and to identify favorable haplotypes. Figure 4A shows the linkage disequilibrium and haplotype block with two SNPs (id4010894 at 31688182 bp and id4010904 at 31691252 bp). The 413 accessions were classified into 4 haplotypes based on these two SNPs (id4010894 and id4010904). Among these haplotypes, haplotypes TT and CT had the highest mean phenotypic values of FTAB (109.54) and FTF (78.25), respectively, whereas haplotype TC presented the lowest FTAB (87.33) and FTF (60.00; Figures 4B, C). A t test showed that significant differences in FTAB and FTF existed between haplotypes CT and TT (P-values = 4.93E-02 and 3.84E-04, respectively). There was also a significant difference in FTF between haplotypes CT and CC (P-values = 1.23E-04). Therefore, we infer the candidate gene LOC_Os04g53210 to be associated with flowering in rice.
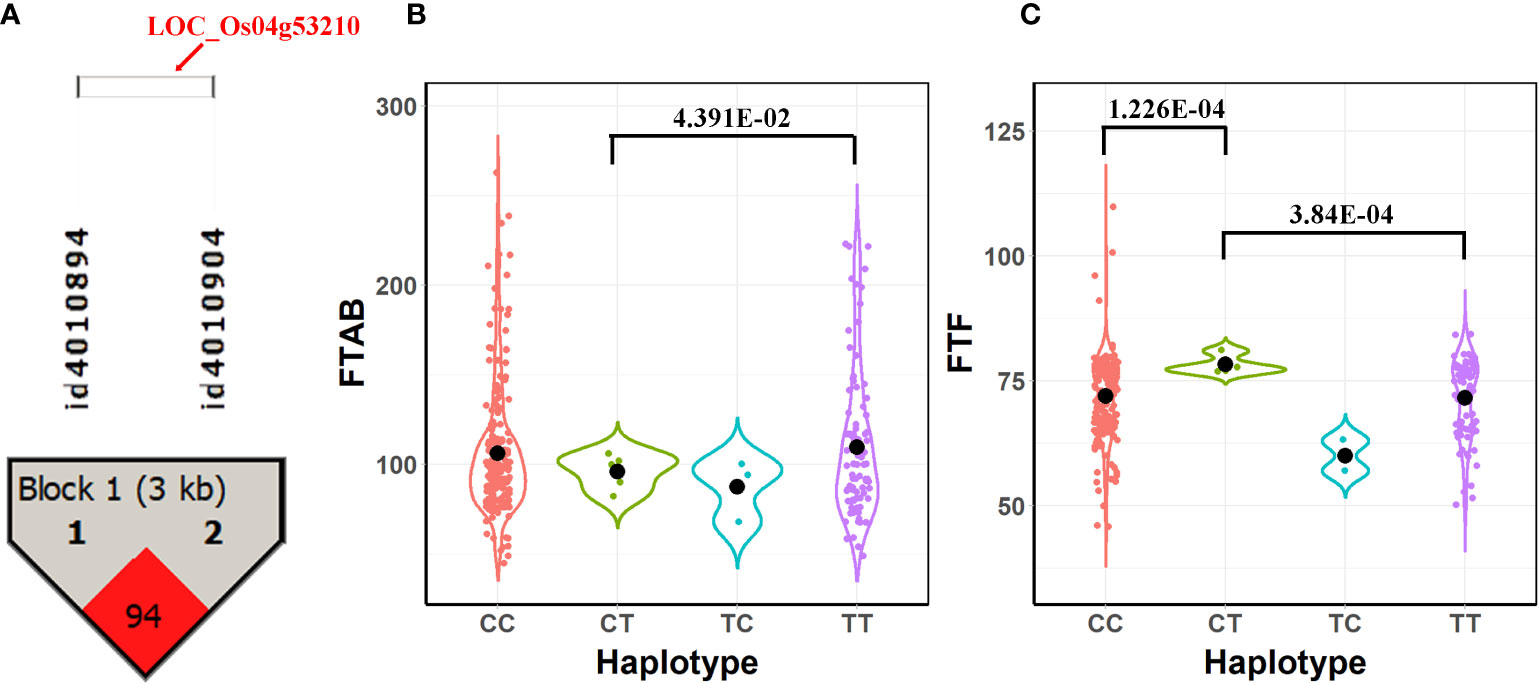
Figure 4 Results of haplotype and phenotypic difference analysis for the candidate gene LOC_Os04g53210. (A) Linkage disequilibrium and haplotype block with two SNPs inside for LOC_Os04g53210. (B) Comparison of FTAB among haplotypes CT, CC, TC, and TT. (C) Comparison of FTF among haplotypes CT, CC, TC, and TT.
LOC_Os04g53210 was also detected in the multi-environment analysis for the AUS subpopulation. Supplementary Figure S3A shows the differences in phenotype among the 4 haplotypes. Supplementary Figure S3B shows the results of the haplotype block and phenotype difference in LOC_Os07g42440, which was detected in PH. We infer that the candidate gene LOC_Os04g53210 might be a gene-environment interaction for flowering time and that LOC_Os07g42440 might be associated with yield in rice.
Discussion
Classic single-locus methods, such as MLM and general linear model (GLM), have been used extensively to detect genetic variants in many cereals (Price et al., 2006; Sant’Ana et al., 2018; He et al., 2019). However, these models suffer from multiple test corrections (e.g., Bonferroni correction) for critical values and neglect the overall effects of multiple loci (Zhong et al., 2021). For example, many robust quantitative trait loci, in particular small-effect quantitative trait loci, are missing because of the stringent threshold (Zhang et al., 2005). Therefore, multi-locus GWAS models, which are relatively closer to the real genetic architecture of animals and plants, have been developed. Geneticists developed these models to reduce the bias associated with estimating effects by controlling the population structure and polygenic background (Zhang et al., 2005; Yu et al., 2006; Zhang et al., 2010). In this study, a multi-locus GWAS method 3VmrMLM was used to detect QTNs for eight yield-related traits in 413 rice varieties with 36,901 SNPs. We detected 17, 16, 16, 21, 23, 17, 15, 15, 18, and 7 significant/suggested SNPs and 9, 7, 3, 14, 17, 6, 6, 2, 7, and 2 known genes for FPP, PF, PL, PNPP, PH, PPBN, SNPP, FTAB, FTAR, and FTF, respectively, using the QTN detection model in 3VmrMLM (Supplementary Table S1). Furthermore, we compared 3VmrMLM to a single-locus method, EMMA (Kang et al., 2008) by Zhao et al. (2011). We detected 4, 3, 3, 6, 5, 2, 1, 14, 6, and 2 QTNs by EMMA; thus, 3VmrMLM detected more significant QTNs than EMMA. Among these significant QTNs, 1, 1, 1, 1, 1, 0, 0, 1, 1, and 0 were detected by the two methods simultaneously, including id3000495, id2004552, id1019150, id12008894, id1101154, id8006573, and id3002064. 1, 0, 2, 1, 1, 0, 0, 1, 3, and 1 known gene were detected by EMMA, which were less than 3VmrMLM. Among these known genes, 6 were detected by EMMA and 3VmrMLM simultaneously, including End4, TH1S1, sd1, DPW, CYP704B2, and OsSUT1 (Table 2). In addition to these 6 known genes, we identified 3 candidate genes for EMMA by performing differential expression analysis and functional enrichment analysis, and there was no overlap in candidate genes between the two methods. Moreover, the QTNs detected by 3VmrMLM explained a higher proportion of total phenotypic variance (72.61%, 73.29%, 75.48%, 51.99%, 64.17%, 71.64%, 58.55%, 77.07%, and 44.60%) than those detected by EMMA (17.1%, 8.1%, 10.9%, 7%, 38.6%, 6%, 0.1%, 31.3%, and 8.1%), except for FTAB. Overall, the multi-locus GWAS method are flexible to detect more QTNs and validate more known genes and candidate genes than the single-locus GWAS method.
The contribution of QEI to the genetic analysis of complex traits in plant, animal, and human genetics is growing. As a result of accelerating global climate change, weather disasters in a variety of regions are becoming increasingly severe, posing a substantial obstacle to sustainable food production. An efficient way of adapting to climate change is to develop climate-resilient crops. However, it is first necessary to detect QEIs and mine their genes. In addition, the environment has an impact on important traits, such as quality, yield, adaptability, and resistance, but studies on physiological effects, molecular mechanisms, and functional analyses of QEI genes under a variety of environments are not insightful enough because of the algorithms used. Moreover, joint analysis of multiple environments can enhance statistical power and experimental accuracy in the detection of QTN and QEI. In this study, three flowering time environments were used to identify QEIs for rice using a multi-environment detection model in 3VmrMLM, and 21, 3, 3, 6, 9, and 4 QTNs and 13, 4, 2, 4, 3, and 2 QEIs were detected for all populations and each subpopulation (Tables 3, 4; Supplementary Table S2).
Pleiotropy was verified in this study. Among all the 165 significant/suggested QTNs for the eight traits detected using the QTN detection model in 3VmrMLM, some QTNs were significantly associated with more than one trait. 5 QTNs simultaneously related to FPP and SNPP were detected because of the strong correlation (PCC = 0.83) between these two traits, including id1002863, id3000495, id6009226, id7004587, and id11010822. Around these 5 QTNs, genes the OsRA2, Ehd4, and OsPTR4 genes were identified (Gao et al., 2013; Lu et al., 2017; Huang et al., 2019). Id2005901 located on chromosome 2 was associated with both FPP and PPBN (PCC = 0.70). For PH and PL with a positive correlation (PCC = 0.64), id6000302 located on chromosome 6 was simultaneously detected. Moreover, id11011548 located on chromosome 11 was found to affect both PH and FTAR (PCC = 0.47), where the EDT1 gene was identified (Bai et al., 2019).
Among the total of 117 genes around the significant/suggested QTNs and QEIs in this study, 87 were known genes that have been reported in previous studies. For these known genes with QTN effects (Table 2), sd1is associated with PH (Zhao et al., 2011). OsMADS18 from the MADS-box transcription factor family affects panicle development (Kobayashi et al., 2012). Moreover, OsRA2, located on chromosome 1, which simultaneously affects FPP and SNPP, modifies panicle architecture by regulating pedicel length (Lu et al., 2017). Notably, OsMADS5 was demonstrated to have both QTN effect and QEI effect, which was associated with inflorescence development in several previous studies (Arora et al., 2007; Zhu et al., 2022).
In addition to the above-mentioned 87 known genes, 30 candidate genes around the significant/suggested QTNs and QEIs that have not previously been reported were also detected in this study. These candidate genes were shown to be involved in many biological processes of rice growth, which indicates underlying associations between the identified candidate genes and the target traits (Figure 3A). Among these 30 candidate genes, 27 candidate genes had high expression in specific tissues, such as panicles and inflorescence (Figure 3B). In addition, 19 candidate genes associated with different traits had homologous genes in Arabidopsis (Table 5). LOC_Os04g53210 and LOC_Os07g42440 were demonstrated to be potentially associated with flowering and yield, respectively, by haplotype and phenotypic difference analysis (Figure 4; Supplementary Figure S3B). LOC_Os04g53210 especially might be a key gene in gene-environment interaction for flowering time (Supplementary Figure S3A).
3VmrMLM represents a significant advancement in GWAS methodologies and practical applications. First, 3VmrMLM correctly detects both QTNs and QEIs and produces unbiased estimations of their effects, unlike current GWAS methods that only detect QTNs and estimate genetic effects (Li et al., 2022a). Second, despite the fact that Feldmann et al. (2021) discovered that the phenotypic variance explained and the percentage of marker-associated genetic variance of large-effect loci were overestimated in analyses of complex traits, maximum likelihood estimation using ANOVA with the linear invariance property theoretically guarantees accurate loci detection and unbiased estimation of effects. Moreover, 3VmrMLM uses a compressed mixed model with three variance components to overcome the huge computational burden in traditional GWAS models. Therefore, 3VmrMLM is a good choice for detecting QTNs and QEIs associated with rice yield-related traits.
Conclusion
In this study, a compressed mixed model with three variance components in GWAS, 3VmrMLM, was used to detect QTNs and QEIs related to rice yield traits. A total of 165 QTNs were identified. Moreover, 75 known genes were identified adjacent to the QTNs based on genome annotation and previous studies. In terms of QTN-by-environment detection, 21, 3, 3, 6, 9, and 4 QTNs and 13, 4, 2, 4, 3, and 2 QEIs were detected for all populations and each subpopulation. Moreover, 12 known genes were identified adjacent to the QTNs and QEIs. As a result of further differential expression and functional enrichment analysis, 30 candidate genes were detected. LOC_Os04g53210 and LOC_Os07g42440 were confirmed as main candidate genes by tissue-specific expression analysis, comparison of homologous Arabidopsis genes, and haplotype and phenotypic difference analysis. LOC_Os04g53210 might be useful in gene-environment interaction for a flowering time trait. These results could be helpful for detecting genes related to rice yield.
Data availability statement
The datasets presented in this study can be found in online repositories. The names of the repository/repositories and accession number(s) can be found in the article/Supplementary Material.
Author contributions
JZ and SW drafted the manuscript. JZ, SW, XW, LH, and YW analyzed the data. YJW and JZ conceived the study and were in charge of direction and planning. All authors contributed to the article and approved the submitted version.
Funding
This research was supported by grants from the National Natural Science Foundation of China (32070688, 32270694, 31701071), the Postdoctoral Science Foundation of Jiangsu (2020Z330), and the Fundamental Research Funds for the Central Universities (JCQY202108).
Conflict of interest
The authors declare that the research was conducted in the absence of any commercial or financial relationships that could be construed as a potential conflict of interest.
Publisher’s note
All claims expressed in this article are solely those of the authors and do not necessarily represent those of their affiliated organizations, or those of the publisher, the editors and the reviewers. Any product that may be evaluated in this article, or claim that may be made by its manufacturer, is not guaranteed or endorsed by the publisher.
Supplementary material
The Supplementary Material for this article can be found online at: https://www.frontiersin.org/articles/10.3389/fpls.2022.995609/full#supplementary-material
Supplementary Figure 1 | Manhattan plots of the single-environment analysis for eight yield-related traits of rice. FTAB, FTAR, and FTF are the flowering time in three different environments. Pink text: known genes for the corresponding significant/suggested SNPs.
Supplementary Figure 2 | Manhattan plots of the multi-environment analysis for the flowering time of rice. (A, B) Manhattan plots of QTNs and QTN-by-environment interactions for all populations. (C–L) Manhattan plots of QTNs and QTN-by-environment interactions for each subpopulation. Pink text: known genes for the corresponding significant/suggested SNPs.
Supplementary Figure 3 | Results of haplotype and phenotypic difference analysis for the candidate genes. (A) LOC_Os04g53210. (B) LOC_Os07g42440.
References
Agrama, H. A., Yan, W., Jia, M., Fjellstrom, R., McClung, A. M. J. N. S. (2010). Genetic structure associated with diversity and geographic distribution in the USDA rice world collection. Natural Sci. 2 (04), 247. doi: 10.4236/ns.2010.24036
Arora, R., Agarwal, P., Ray, S., Singh, A. K., Singh, V. P., Tyagi, A. K., et al. (2007). MADS-box gene family in rice: genome-wide identification, organization and expression profiling during reproductive development and stress. BMC Genomics 8, 242. doi: 10.1186/1471-2164-8-242
Bai, W., Wang, P., Hong, J., Kong, W., Xiao, Y., Yu, X., et al. (2019). Earlier degraded Tapetum1 (EDT1) encodes an ATP-citrate lyase required for tapetum programmed cell death. Plant Physiol. 181 (3), 1223–1238. doi: 10.1104/pp.19.00202
Barrett, J. C., Fry, B., Maller, J., Daly, M. J. (2005). Haploview: Analysis and visualization of LD and haplotype maps. Bioinformatics 21, 263–265. doi: 10.1093/bioinformatics/bth457
Cui, Y. R., Zhang, F., Zhou, Y. L. (2018). The application of multi-locus GWAS for the detection of salt-tolerance loci in rice. Front. Plant Sci. 9. doi: 10.3389/fpls.2018.01464
Ebana, K., Kojima, Y., Fukuoka, S., Nagamine, T., Kawase, M. (2008). Development of mini core collection of Japanese rice landrace. Breed. Sci. 58 (3), 281–291. doi: 10.1270/jsbbs.58.281
Ebana, K., Yonemaru, J., Fukuoka, S., Iwata, H., Kanamori, H., Namiki, N., et al. (2010). Genetic structure revealed by a whole-genome single-nucleotide polymorphism survey of diverse accessions of cultivated Asian rice (Oryza sativa l.). Breed. Sci. 60 (4), 390–397. doi: 10.1270/jsbbs.60.390
Feldmann, M. J., Piepho, H. P., Bridges, W. C., Knapp, S. J. (2021). Average semivariance yields accurate estimates of the fraction of marker-associated genetic variance and heritability in complex trait analyses. PLos Genet. 17 (8), e1009762. doi: 10.1371/journal.pgen.1009762
Gao, H., Zheng, X. M., Fei, G., Chen, J., Jin, M., Ren, Y., et al. (2013). Ehd4 encodes a novel and oryza-genus-specific regulator of photoperiodic flowering in rice. PLos Genet. 9 (2), e1003281. doi: 10.1371/journal.pgen.1003281
Goff, S. A., Ricke, D., Lan, T. H., Presting, G., Wang, R., Dunn, M., et al. (2002). A draft sequence of the rice genome (Oryza sativa l. ssp. japonica). Science 296 (5565), 92–100. doi: 10.1126/science.1068275
Greenland, D. J. (1997). The sustainability of rice farming (Cab International), Wallingford, Oxon, UK.
He, L. Q., Xiao, J., Rashid, K. Y., Yao, Z., Li, P. C., Jia, G. F., et al. (2019). Genome-wide association studies for pasmo resistance in flax (Linum usitatissimum l.). Front. Plant Sci. 9. doi: 10.3389/fpls.2018.01982
Huang, W., Nie, H., Feng, F., Wang, J., Lu, K., Fang, Z. (2019). Altered expression of OsNPF7.1 and OsNPF7.4 differentially regulates tillering and grain yield in rice. Plant Sci. 283, 23–31. doi: 10.1016/j.plantsci.2019.01.019
Huang, X. H., Wei, X. H., Sang, T., Zhao, Q. A., Feng, Q., Zhao, Y., et al. (2010). Genome-wide association studies of 14 agronomic traits in rice landraces. Nat. Genet. 42 (11), 961–U976. doi: 10.1038/ng.695
Kang, H. M., Zaitlen, N. A., Wade, C. M., Kirby, A., Heckerman, D., Daly, M. J., et al. (2008). Efficient control of population structure in model organism association mapping. Genetics 178 (3), 1709–1723. doi: 10.1534/genetics.107.080101
Kobayashi, K., Yasuno, N., Sato, Y., Yoda, M., Yamazaki, R., Kimizu, M., et al. (2012). Inflorescence meristem identity in rice is specified by overlapping functions of three AP1/FUL-like MADS box genes and PAP2, a SEPALLATA MADS box gene. Plant Cell 24 (5), 1848–1859. doi: 10.1105/tpc.112.097105
Konishi, T., Takeda, T., Miyazaki, Y., Ohnishi-Kameyama, M., Hayashi, T., O’Neill, M. A., et al. (2007). A plant mutase that interconverts UDP-arabinofuranose and UDP-arabinopyranose. Glycobiology 17 (3), 345–354. doi: 10.1093/glycob/cwl081
Leran, S., Varala, K., Boyer, J. C., Chiurazzi, M., Crawford, N., Daniel-Vedele, F., et al. (2014). A unified nomenclature of NITRATE TRANSPORTER 1/PEPTIDE TRANSPORTER family members in plants. Trends Plant Sci. 19 (1), 5–9. doi: 10.1016/j.tplants.2013.08.008
Liu, X., Huang, M., Fan, B., Buckler, E. S., Zhang, Z. (2016). Iterative usage of fixed and random effect models for powerful and efficient genome-wide association studies. PLos Genet. 12 (2), e1005767. doi: 10.1371/journal.pgen.1005767
Li, M., Zhang, Y. W., Zhang, Z. C., Xiang, Y., Liu, M. H., Zhou, Y. H., et al. (2022a). A compressed variance component mixed model for detecting QTNs and QTN-by-environment and QTN-by-QTN interactions in genome-wide association studies. Mol. Plant 15 (4), 630–650. doi: 10.1016/j.molp.2022.02.012
Li, M., Zhang, Y. W., Xiang, Y., Liu, M. H., Zhang, Y. M. (2022b). IIIVmrMLM: The r and c++ tools associated with 3VmrMLM, a comprehensive GWAS method for dissecting quantitative traits. Mol. Plant 15 (8), 1251–1253. doi: 10.1016/j.molp.2022.06.002
Lu, H., Dai, Z., Li, L., Wang, J., Miao, X., Shi, Z. (2017). OsRAMOSA2 shapes panicle architecture through regulating pedicel length. Front. Plant Sci. 8. doi: 10.3389/fpls.2017.01538
McNally, K. L., Childs, K. L., Bohnert, R., Davidson, R. M., Zhao, K., Ulat, V. J., et al. (2009). Genomewide SNP variation reveals relationships among landraces and modern varieties of rice. Proc. Natl. Acad. Sci. United States America 106 (30), 12273–12278. doi: 10.1073/pnas.0900992106
Muthayya, S., Sugimoto, J. D., Montgomery, S., Maberly, G. F. (2014). An overview of global rice production, supply, trade, and consumption. Ann. N Y Acad. Sci. 1324, 7–14. doi: 10.1111/nyas.12540
Price, A. L., Patterson, N. J., Plenge, R. M., Weinblatt, M. E., Shadick, N. A., Reich, D. (2006). Principal components analysis corrects for stratification in genome-wide association studies. Nat. Genet. 38 (8), 904–909. doi: 10.1038/ng1847
Sant’Ana, G. C., Pereira, L. F. P., Pot, D., Ivamoto, S. T., Domingues, D. S., Ferreira, R. V., et al. (2018). Genome-wide association study reveals candidate genes influencing lipids and diterpenes contents in coffea arabica l. Sci. Rep. 8, 465. doi: 10.1038/s41598-017-18800-1
Segura, V., Vilhjalmsson, B. J., Platt, A., Korte, A., Seren, U., Long, Q., et al. (2012). An efficient multi-locus mixed-model approach for genome-wide association studies in structured populations. Nat. Genet. 44 (7), 825–U144. doi: 10.1038/ng.2314
Tanaka, T., Antonio, B. A., Kikuchi, S., Matsumoto, T., Nagamura, Y., Numa, H., et al. (2008). The rice annotation project database (RAP-DB): 2008 update. Nucleic Acids Res. 36, D1028–D1033. doi: 10.1093/nar/gkm978
Toriyama, K. (2005). Rice is life scientific perspectives for the 21st century. (Tsukuba, Japan:Proceedings of the World Rice Research Conference).
Wang, S. B., Feng, J. Y., Ren, W. L., Huang, B., Zhou, L., Wen, Y. J., et al. (2016). Improving power and accuracy of genome-wide association studies via a multi-locus mixed linear model methodology. Sci. Rep. 6, 19444. doi: 10.1038/srep19444
Weng, X. Y., Wang, L., Wang, J., Hu, Y., Du, H., Xu, C. G., et al. (2014). Grain number, plant height, and heading Date7 is a central regulator of growth, development, and stress response. Plant Physiol. 164 (2), 735–747. doi: 10.1104/pp.113.231308
Wen, Y. J., Zhang, H. W., Ni, Y. L., Huang, B., Zhang, J., Feng, J. Y., et al. (2018). Methodological implementation of mixed linear models in multi-locus genome-wide association studies. Briefings Bioinf. 19 (4), 700–712. doi: 10.1093/bib/bbx028
Xie, Y., Niu, B., Long, Y., Li, G., Tang, J., Zhang, Y., et al. (2017). Suppression or knockout of SaF/SaM overcomes the sa-mediated hybrid male sterility in rice. J. Integr. Plant Biol. 59 (9), 669–679. doi: 10.1111/jipb.12564
Youens-Clark, K., Buckler, E., Casstevens, T., Chen, C., DeClerck, G., Derwent, P., et al. (2011). Gramene database in 2010: updates and extensions. Nucleic Acids Res. 39, D1085–D1094. doi: 10.1093/nar/gkq1148
Yu, J., Hu, S. N., Wang, J., Wong, G. K. S., Li, S. G., Liu, B., et al. (2002). A draft sequence of the rice genome (Oryza sativa l. ssp indica). Science. 296 (5565), 79–92, doi: 10.1126/science.1068037
Yu, J. M., Pressoir, G., Briggs, W. H., Bi, I. V., Yamasaki, M., Doebley, J. F., et al. (2006). A unified mixed-model method for association mapping that accounts for multiple levels of relatedness. Nat. Genet. 38 (2), 203–208. doi: 10.1038/ng1702
Zhang, Z. W., Ersoz, E., Lai, C. Q., Todhunter, R. J., Tiwari, H. K., Gore, M. A., et al. (2010). Mixed linear model approach adapted for genome-wide association studies. Nat. Genet. 42 (4), 355–U118. doi: 10.1038/ng.546
Zhang, J., Feng, J. Y., Ni, Y. L., Wen, Y. J., Niu, Y., Tamba, C., et al. (2017). pLARmEB: integration of least angle regression with empirical bayes for multilocus genome-wide association studies. Heredity 118 (6), 517–524. doi: 10.1038/hdy.2017.8
Zhang, Y. M., Mao, Y., Xie, C., Smith, H., Luo, L., Xu, S. J. G. (2005). Mapping quantitative trait loci using naturally occurring genetic variance among commercial inbred lines of maize (Zea mays l). Genetics 169, 2267–2275. doi: 10.1534/genetics.104.033217
Zhao, K., Tung, C. W., Eizenga, G. C., Wright, M. H., Ali, M. L., Price, A. H., et al. (2011). Genome-wide association mapping reveals a rich genetic architecture of complex traits in Oryza sativa. Nat. Commun. 2, 467. doi: 10.1038/ncomms1467
Zhong, H., Liu, S., Sun, T., Kong, W., Deng, X., Peng, Z., et al. (2021). Multi-locus genome-wide association studies for five yield-related traits in rice. BMC Plant Biol. 21 (1), 364. doi: 10.1186/s12870-021-03146-8
Zhou, X., Stephens, M. (2012). Genome-wide efficient mixed-model analysis for association studies. Nat. Genet. 44 (7), 821–U136. doi: 10.1038/ng.2310
Zhu, W. W., Yang, L., Wu, D., Meng, Q. C., Deng, X., Huang, G. Q., et al. (2022). Rice SEPALLATA genes OsMADS5 and OsMADS34 cooperate to limit inflorescence branching by repressing the TERMINAL FLOWER1-like gene RCN4. New Phytol. 233 (4), 1682–1700. doi: 10.1111/nph.17855
Keywords: 3VmrMLM, gwas, QTN-by-environment interaction, yield traits, rice
Citation: Zhang J, Wang S, Wu X, Han L, Wang Y and Wen Y (2022) Identification of QTNs, QTN-by-environment interactions and genes for yield-related traits in rice using 3VmrMLM. Front. Plant Sci. 13:995609. doi: 10.3389/fpls.2022.995609
Received: 16 July 2022; Accepted: 27 September 2022;
Published: 17 October 2022.
Edited by:
Zhenyu Jia, University of California, Riverside, United StatesReviewed by:
Jia Wen, University of North Carolina at Chapel Hill, United StatesJianfang Zuo, Huazhong Agricultural University, China
HaiYan Lü, Henan Agricultural University, China
Copyright © 2022 Zhang, Wang, Wu, Han, Wang and Wen. This is an open-access article distributed under the terms of the Creative Commons Attribution License (CC BY). The use, distribution or reproduction in other forums is permitted, provided the original author(s) and the copyright owner(s) are credited and that the original publication in this journal is cited, in accordance with accepted academic practice. No use, distribution or reproduction is permitted which does not comply with these terms.
*Correspondence: Yangjun Wen, d2VueWFuZ2p1bkBuamF1LmVkdS5jbg==
†These authors have contributed equally to this work