- 1Molecular Breeding Laboratory, Arid Land Research Center, Tottori University, Tottori, Japan
- 2Department of Biotechnology, Ebonyi State University, Abakaliki, Abakaliki, Ebonyi, Nigeria
- 3International Platform for Dryland Research and Education, Tottori University, Tottori, Japan
- 4Agricultural Research Corporation, Wad Medani, Sudan
- 5French Associates Institute for Agriculture and Biotechnology of Drylands, Jacob Blaustein Institutes for Desert Research, Ben-Gurion University of the Negev, Beer-Sheva, Israel
- 6Graduate School of Environmental and Life Science, Okayama University, Okayama, Japan
- 7Department of Life Sciences, Ben-Gurion University, Beer-Sheva, Israel
Transposable elements (TEs) constitute ~80% of the complex bread wheat genome and contribute significantly to wheat evolution and environmental adaptation. We studied 52 TE insertion polymorphism markers to ascertain their efficiency as a robust DNA marker system for genetic studies in wheat and related species. Significant variation was found in miniature inverted-repeat transposable element (MITE) insertions in relation to ploidy with the highest number of “full site” insertions occurring in the hexaploids (32.6 ± 3.8), while the tetraploid and diploid progenitors had 22.3 ± 0.6 and 15.0 ± 3.5 “full sites,” respectively, which suggested a recent rapid activation of these transposons after the formation of wheat. Constructed phylogenetic trees were consistent with the evolutionary history of these species which clustered mainly according to ploidy and genome types (SS, AA, DD, AABB, and AABBDD). The synthetic hexaploids sub-clustered near the tetraploid species from which they were re-synthesized. Preliminary genotyping in 104 recombinant inbred lines (RILs) showed predominantly 1:1 segregation for simplex markers, with four of these markers already integrated into our current DArT-and SNP-based linkage map. The MITE insertions also showed stability with no single excision observed. The MITE insertion site polymorphisms uncovered in this study are very promising as high-potential evolutionary markers for genomic studies in wheat.
Introduction
Wheat (Triticum spp.) is a cereal crop of major importance globally which provides about 20% of the calories consumed by man (FAO, 2015); and is a foremost source of vegetable protein in the human diet relative to other major cereal crops such as maize or rice (Wheat-Wikipedia, n.d.). The increased production of cereals such as wheat is urgently needed to meet the demand gap for global food supply by the year 2050 (Tester and Langridge, 2010) when 60%–70% increase in the food production is required to feed the projected rapid increase in population (Silva, 2018). Allohexaploid bread wheat (Triticum aestivum, 2n = 6x = 42, AABBDD) is of relatively recent origin, having evolved ~8,500 years ago following two separate interspecific hybridization events involving three diploid donor species (n = 7; Leach et al., 2014). First, the tetraploid (pasta) wheat (T. turgidum L. ssp. durum; 2n = 4x = 28, AABB) arose from a hybridization event between T. urartu (2n =2x = 14, AA) and another yet unknown wild diploid relative of Aegilops speltoides (2n = 2x = 14, BB) about 0.5 million years ago (Dvorak and Akhunov, 2005; Yaakov et al., 2012; Ogbonnaya et al., 2013). The cultivated T. turgidum then crossed with Aegilops tauschii, a wild diploid relative (2n = 2x = 14, DD) resulting in the modern day allohexaploid bread wheat with its 42 chromosomes distributed in the A, B and D homoeologous sets contributed by the three diploid progenitors.
Several phylogenetic studies have been undertaken over the years to characterize the taxonomic relationships between members of the Triticum (wheat)—Aegilops complex. Polymorphic transposable element (TE) insertion sites have recently been shown to be a promising tool for the analysis of the phylogenetic relationships in wheat (Konovalov et al., 2010; Yaakov et al., 2012, 2013). TE-based DNA marker systems showed relative superiority over other marker systems in resolving phylogenetic relationships due largely to their high variability and informativeness (Konovalov et al., 2010), but such relative superiority might be dependent on the TE activity level during the course of evolution and their ability to generate insertion site polymorphisms.
In plant species, DNA-marker systems based on different TEs [e.g., miniature inverted-repeat transposable element (MITEs), long terminal repeat (LTR) elements, CACTA transposons, etc.] have been exploited for various genetic studies (Hirsch and Springer, 2017; Morata et al., 2018; Quesneville, 2020). MITEs are thought to be a peculiar type of non-autonomous Class II TE, activated by transposases encoded by their related autonomous elements, which might have enhanced their rapid amplification to potentially generate high copy numbers, though the mechanism of their amplification is yet unknown (Casacuberta and Santiago, 2003; Fattash et al., 2013; Chen et al., 2014). However, recent efforts by Castanera et al. (2021) suggested a replicative mechanism underlying the amplification dynamics of MITEs. MITEs typically have relatively short sequences (generally < 600 bp), large copy numbers, an AT-rich sequence, contain terminal inverted repeats (TIRs) and flanked by two short direct repeats referred to as target site duplications (TSD; Casacuberta and Santiago, 2003; Yaakov et al., 2012, 2013; Fattash et al., 2013; Chen et al., 2014; Li et al., 2014). Plant MITEs are categorized into two main families, Habinger/Tourist-like and Mariner/Stowaway-like, besides several other minor families. Recent genome-wide analysis of MITEs based on genome drafts of four wheat and related species [polyploids: T. aestivum and T. turgidum ssp. dicoccoides, and diploids: Ae. tauschii and T. urartu] involving 239,126 retrieved MITE insertions showed the Stowaway-like superfamily as the most abundant (83.4%) in the wheat genome, followed by Tourist-like superfamily (4.9%), Mutator (2.7%), with 8.9% being unknown; and novel wheat-unique family named “Inbar” belonging to the Stowaway-like superfamily, was also identified in this large-scale study (Keidar-Friedman et al., 2018). The relative on the most abundant MITEs in the wheat genome was found to be the Stowaway-like family (62.6%), followed by the Tourist-like family (12.1%), while all other families were not found. The relatively small size and high copy numbers of MITEs facilitate their invasiveness and frequent insertion into genomic regions such as promoters, untranslated regions, introns or coding sequences of genes; though they are thought to predominate in the non-coding regions of eukaryotic genes (Han and Wessler, 2010; Li et al., 2014). MITEs are often inserted within gene-rich euchromatic regions and frequently found associated with genes (Wessler et al., 1995; Yasuda et al., 2013; Chen et al., 2014).
Insertion site polymorphisms generated by MITEs can be a valuable molecular marker system for exploitation in various genetic and breeding studies (Monden et al., 2009; Shirasawa et al., 2012; Yaakov et al., 2012; Yaakov and Kashkush, 2012; Mondal et al., 2014; Wang et al., 2020). The simple inheritance of MITE insertion site polymorphisms, their low cost of detection, their dominant and/or co-dominant nature, and their ability to generate polymorphisms even between closely related genomes makes them suitable DNA markers for studying genetic diversity, association mapping and trait mapping.
In this study, 52 TE insertion polymorphism markers selected from 13 Stowaway-like MITE families (Yaakov et al., 2012) were investigated to ascertain their efficiency for exploitation as a robust DNA marker system for genetic diversity, linkage analysis and evolutionary studies in wheat. Furthermore, our investigation of the excision frequency of 16 polymorphic MITE markers in one of the parents of our mapping population (T. aestivum cv. Chinese Spring) revealed a putative stable inheritance, which is promising for genetic linkage analysis, evolutionary studies and as a useful tool for wheat molecular breeding.
Materials and methods
Plant materials and DNA extraction
In this study, we used 17 Triticum and Aegilops accessions (Table 1). In the initial amplification and isolation of MITE fragments, we used five accessions that are indicated by bold interface in Table 1. After the initial screening and isolation, we used an additional 12 accessions to study the variation in MITE insertions and phylogenetic analysis. T. carthlicum and Ae. tauschii are the parents of SHW ABD4 (Table 1). Syn.72 is an amphidiploid between Langdon and Ae. tauschii acc. PI508262. MSD-original #1, MSD-2 waxless and MSD-5 heat tolerant are multiple synthetic derivative lines selected from the original multiple synthetic derivatives population, the waxless and heat-tolerant subpopulations, respectively (Tsujimoto et al., 2015; Elbashir et al., 2017). The genomic DNA of all plants was isolated from fresh young leaf tissue (~0.5 g) using a modified CTAB-based miniprep extraction method. Briefly, 0.5 g of freshly harvested young wheat leaf samples were collected into a 2-ml eppendorf tube (frozen in liquid nitrogen) and kept at −80°C until ground into a fine powder (under liquid nitrogen) using the MicroMixer. A 1-ml pre-heated (65°C) 3% CTAB extraction buffer [containing 3% (w/v) CTAB, 1.4 M NaCl, 0.1 M Tris–HCl (pH 8.0), 0.02 M EDTA (pH 8.0), and 1% (v/v) β-Mercaptoethanol] was added to the ground frozen tissue and mixed briefly by tube inversions; and then tissue homogenization was carried out in a water bath set at 55°C for 30 min. Following tissue homogenization, 800 μl of Chloroform: Isoamyl alcohol (CI, 24:1) was added and gently but thoroughly mixed for 5 min, before centrifugation at 5,000 rpm for 5 min at room temperature. The supernatant was transferred to a new tube; and DNA precipitated with 0.8 × volume isopropanol, and hooked with a Pasteur pipette into a fresh 1.5-ml eppendorf tube. The hooked DNA was washed with 1-ml 70% ethanol and centrifuged at 8,000 rpm for 5 min at room temperature using a microcentrifuge. The supernatant was decanted, and the tubes air-dried. The isolated DNA was dissolved in 500 μl of 0.1 × Tris–HCl (pH 8.0), and 1.5 μl RNAse A (20 mg/ml stock) was added to each tube and incubated at 37°C for 30 min. An equal volume (500 μl) of Chloroform: Isoamyl alcohol (CI, 24:1) was further added and thoroughly mixed by gentle inversion several times. Centrifugation was carried out at 8,000 rpm for 10 min at room temperature and the supernatant carefully transferred to fresh tubes. DNA was precipitated by adding 2× vol of ice-cold absolute ethanol, and the tubes mixed well (by several inversions) and placed at −20°C for 1 h or overnight. The DNA was hooked with a Pasteur pipette into 1.5-ml eppendorf tube and washed with 1-ml 70% ethanol; and centrifuged at 7,000 rpm for 5 min at room temperature. The supernatant was removed, and the DNA air-dried and resuspended in 100 ul of 0.1 × Tris–HCl (pH 8.0). DNA concentration and quality were determined using a Nanodrop spectrophotometer and further confirmed by agarose gel electrophoresis.
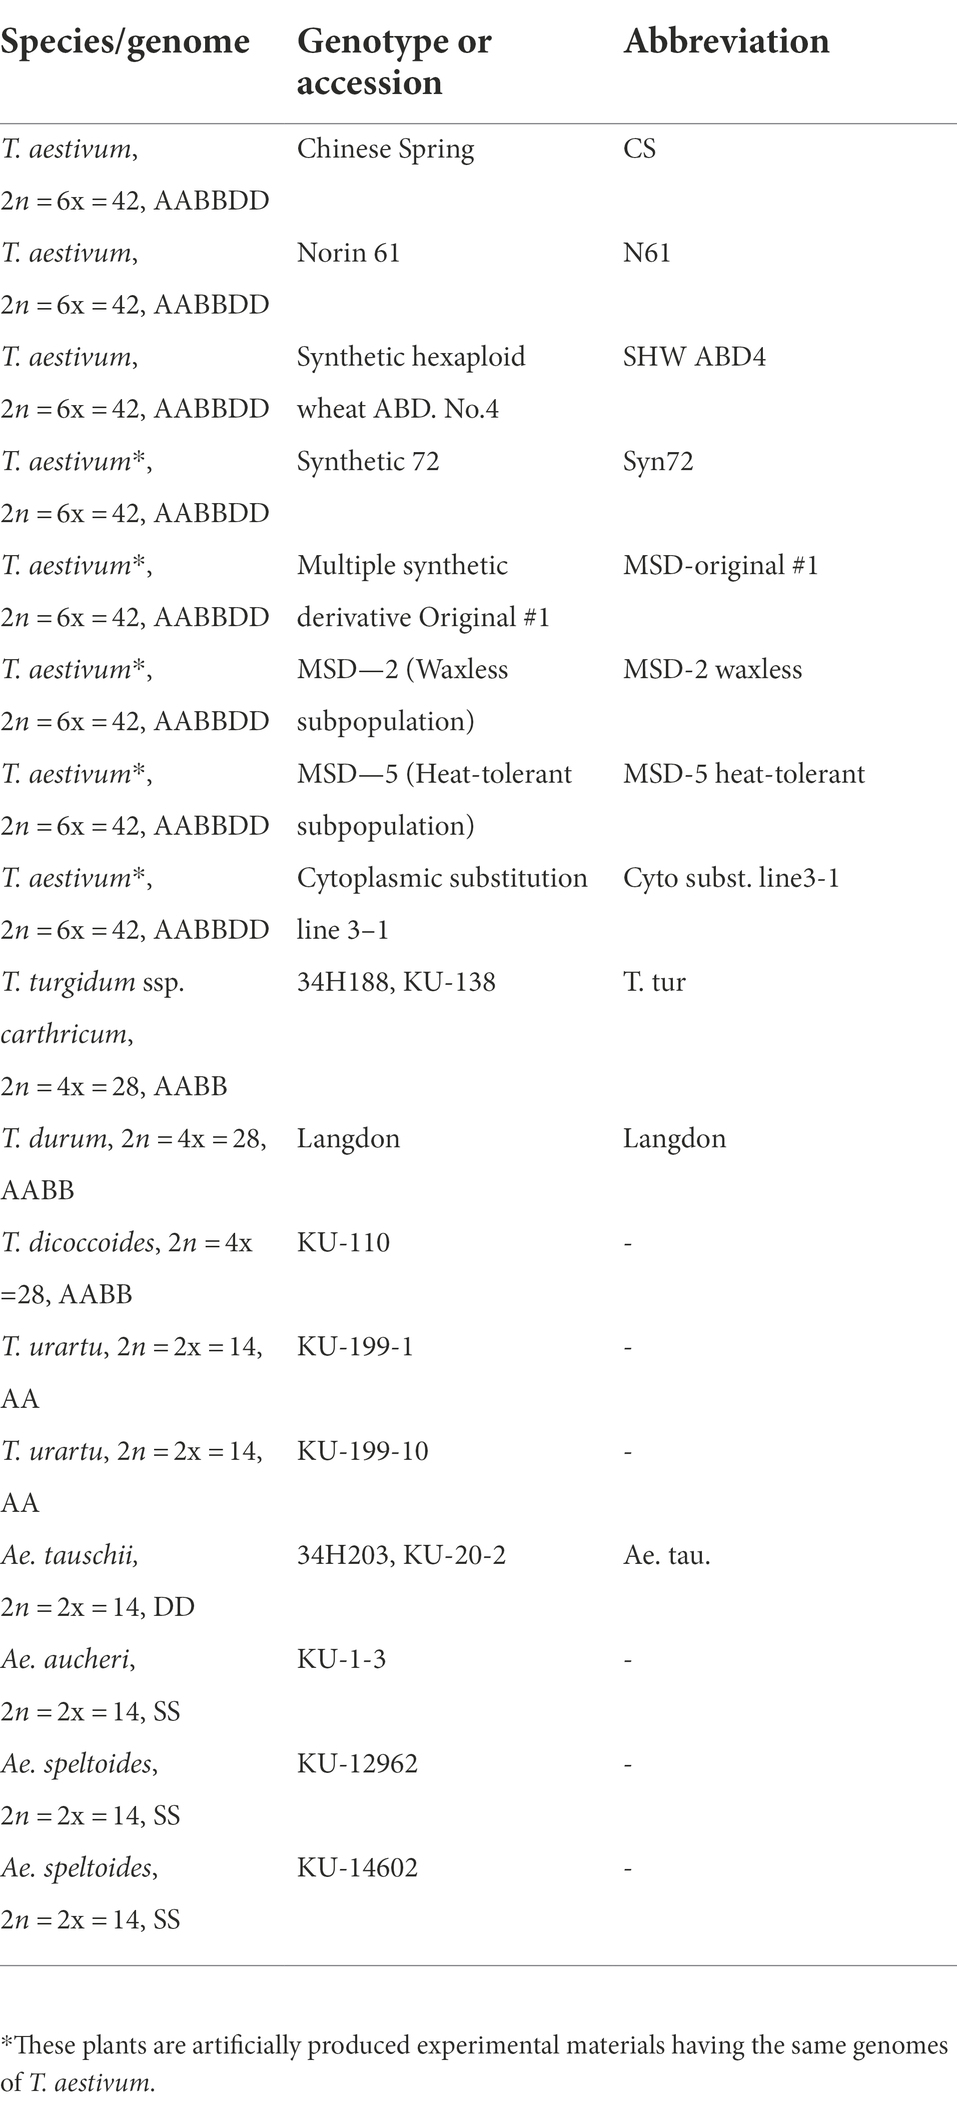
Table 1. List of plant materials used for the amplification and isolation of MITE fragments and study of the distribution of MITE insertions and evolutionary relationships in the Triticum–Aegilops complex.
PCR amplification of MITE fragments
A total of 52 primer pairs designed from flanking sequences surrounding intact MITEs (Yaakov et al., 2012) were used for the amplification of MITE fragments in this study (see Supplementary Table S1). PCR for amplification of MITE fragments was performed in a total reaction volume of 25 μl, containing 12.5 μl PCR Master Mix (Promega), 1.0 μl of genomic DNA (~50 ng/μl), 1.25 μl of each site-specific primer (6.1 pmol/μl) and 9.0 μl MilliQ water. The PCR was performed in a thermal cycler (GeneAmp PCR System 9,700, Applied Biosystems) using touchdown annealing temperature conditions as follows: initial denaturation at 94°C for 3 min; then 35 cycles with annealing decreasing by 2°C: 5 cycles of 94°C for 1 min, 60°C for 1 min, 72°C for 90 s; 5 cycles of 94°C for 1 min, 58°C for 1 min, 72°C for 90 s; 5 cycles of 94°C for1 min, 56°C for 1 min, 72°C for 90 s; followed by 20 cycles of 94°C for 1 min, 54°C for 1 min, 72°C for 90 s; and a final extension step at 72°C for 4 min. MITEs amplicons were size-separated using 1.5% agarose (Nippon gene, Japan) gel at 100 V for 25 min and stained with ethidium bromide. Stained gels were visualized under UV light and photographed using a gel documentation system.
Genotyping of RILs with polymorphic MITE fragments
Preliminary genotyping of PCR-SCAR MITE markers in a wheat recombinant inbred lines (RILs) mapping population and its parental genotypes (CS and SHW ABD4) was performed using five polymorphic primers from four Stowaway-like MITE families: Thalos, Athos, Minos, and Eos). PCR for this analysis was carried out using a total reaction volume of 11.0 μl containing 5.5 μl PCR Master Mix, 4.0 μl of genomic DNA (~3.125 ng/μl), 0.3 μl of each polymorphic MITE primer (6.1 pmol/μl), and 0.9 μl MilliQ water. The thermal cycling conditions were as described above, and amplicons were separated on 1.5% agarose gel at 100 V for 25 min and documented as described above. The easily scorable bands were analyzed and integrated into our wheat genetic linkage map.
Determining MITEs excision frequency
MITEs excision was assessed in 129 plants of T. aestivum cv. CS by PCR using 16 polymorphic CS-specific insertion sites from 9 MITEs families: Thal-EU835982, Thal-EU835981, Thal-CQ169689; Fort-AY663392, Fort-EU835980; Atho-AM932680, Atho-AB201447, Atho-DQ517494; Oleu-AF325198; Mino-FN564434; Eos-FN564434; Pan-DQ871219; Pan-FN564434; Phoebus-102; Polyphemus-110, and Polyphemus-111 (see Supplementary Table S1 for details of these primer sequences). PCR was carried out in a total reaction volume of 13 μl containing 6.5 μl PCR Master Mix, 2.0 μl of genomic DNA (~12.5 ng/μl), 0.625 μl of each polymorphic insertion site - primer (6.1 pmol/μl) and 2.25 μl MilliQ water. The thermal cycling conditions were as described above, and amplicons were separated on 1.5% agarose gel at 100 V for 25 min and documented as described above.
Statistical analysis
Analysis of similarity (ANOSIM) was conducted to confirm the statistical differences between the different genome types and ploidy levels. Phylogenetic analysis was performed based on Jaccard similarity and then a group average hierarchical clustering was conducted based on a SIMPROF test with 99,999 simulations (alpha < 0.05) using PRIMER6 (PRIMER-E).1 Furthermore, a principal component analysis (PCA) was conducted on the similarity to statistically reveal the degree of dissimilarity between hexaploids, tetraploids, and diploids.
Results
Amplification of MITE fragments and their isolation in wheat and related species
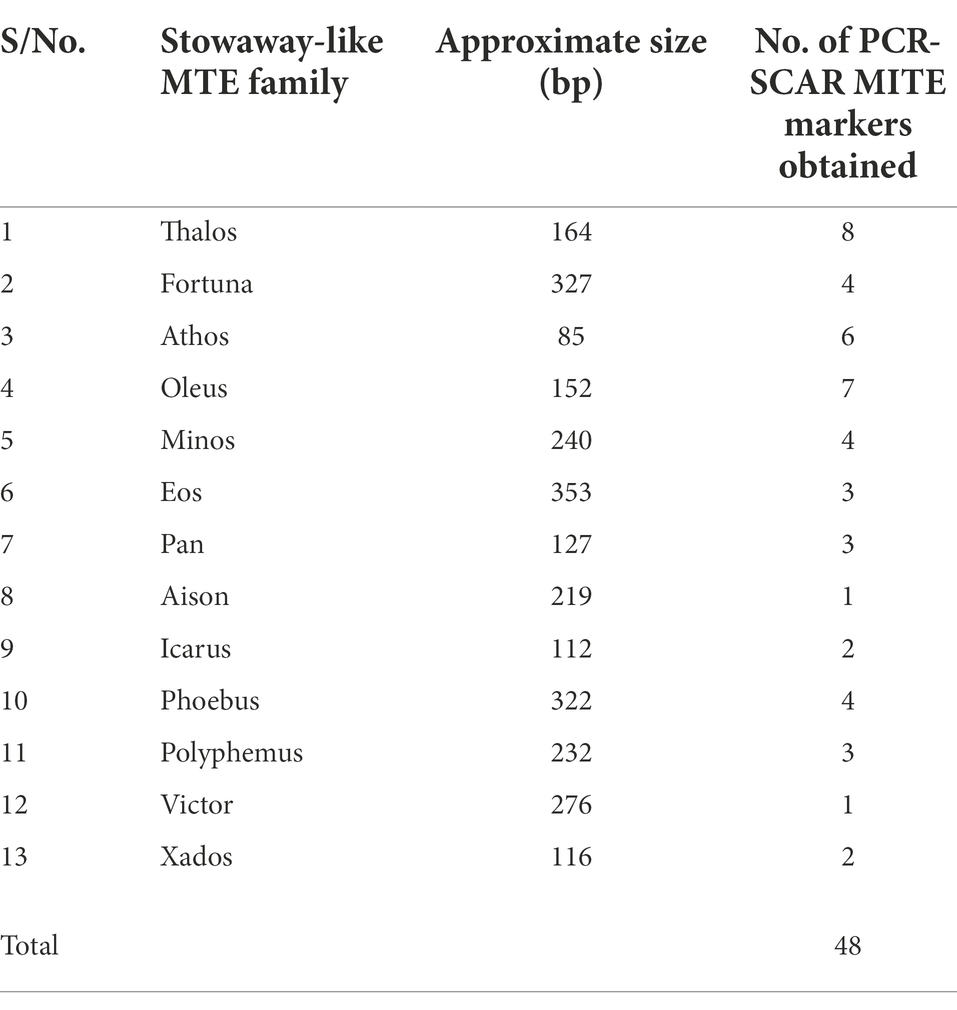
Five genotypes, CS, SHW ABD4, Norin 61, 34H188, and 34H203 (Table 1) were initially used to detect the presence/absence of MITE fragments and facilitate their isolation via PCR. Of the 52 tested MITE primer pairs selected from 13 Stowaway-like families (Yaakov et al., 2012; Supplementary Table S1), 48 primer pairs produced amplified products in at least one of the tested genotypes, while four primer pairs did not yield amplified products in any of the tested genotypes which suggested a lack of insertion sites. As has been previously reported (Yaakov et al., 2012), the majority of amplified MITE sequences used in this study were from the B genome (59%, i.e., 17 of the 29 MITE sequences with known chromosomal location), while 12 of the 29 MITE sequences were from the A (6 MITE sequences, 21%) and D (6 MITE sequences, 21%) genomes. The DNA fragments produced from the 48 amplified PCR-SCAR MITE markers contained DNA sequences from 13 Stowaway-like MITE families (Yaakov et al., 2012; Supplementary Table S1), as shown in Table 2.
The primer pairs used in this study were designed by Yaakov et al. (2012) to amplify the MITE insertions and their flanking host sequences to produce the expected full amplicon size, which is termed “full site” (i.e., the size of the MITE insertion plus the flanking sequences), compared to an “empty site,” i.e., without a MITE insertion, in which the amplicon will be relatively shorter in size, consisting of only the flanking sequence. An example of a site-specific PCR for Thalos (Thal-GQ169689 in Supplementary Table S1), which was inserted in the 11th intron of the plastid glutamine synthetase 2 (GS2) gene, is shown in Figure 1. In this case (Figure 1), the expected “full site” is 519 bp-long, while the “empty site” is 367 bp-long. While the hexaploids CS and N61 had the “full site” fragment containing the MITE insertion, ABD 4, T. durum and Ae tauschii lacked the MITE insertion. Very faint bands corresponding to the size of the empty site were observed in the hexaploid species (CS and N61), which could be a footprint probably due to the loss of the fragment in a small percentage of the cells in the tissue. Sequence comparison of the isolated site-specific PCR fragment from CS (“full site”), Ae tauschii (“empty site”) and a database sequence (bread wheat, Thal-GQ169688) confirmed that the fragment differences in the gel are due to the presence or absence of this Thalos element (Figure 2.). Other examples of MITE amplified fragments observed in this study are shown in Figure 3.
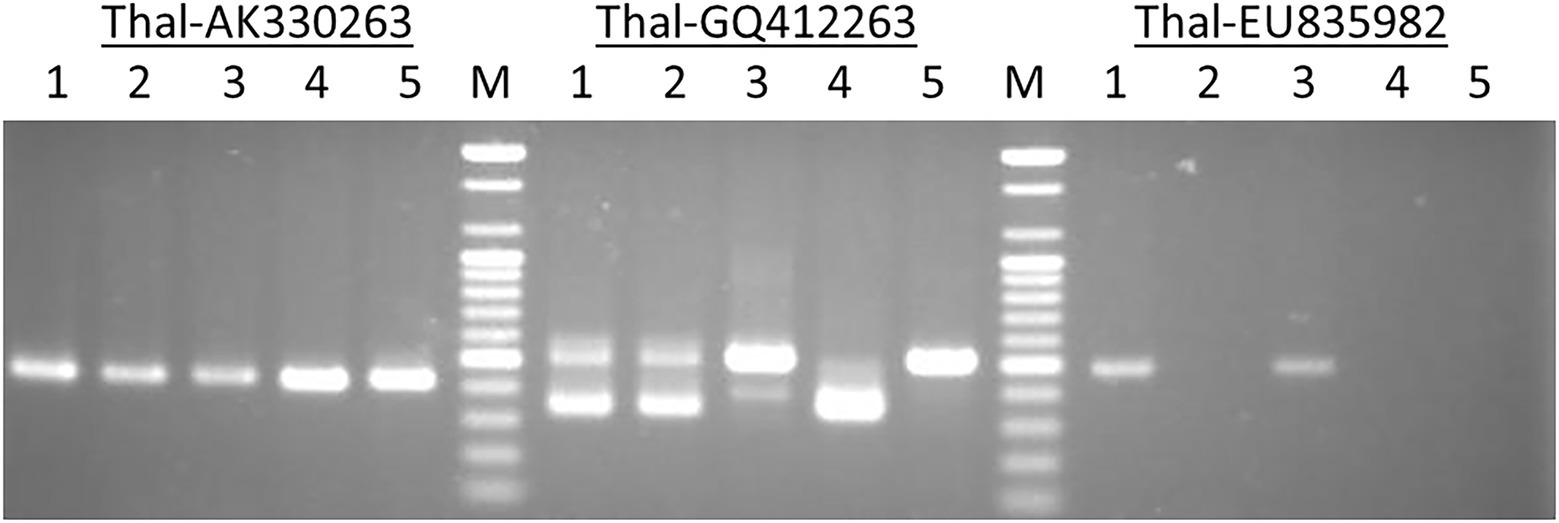
Figure 1. An example of a site-specific PCR for Thalos (Thal-GQ169689) that was inserted in the 11th intron of the plastid glutamine synthetase 2 (GS2) gene in five accessions. The expected “full site,” i.e., the larger band of ~519 bp was found only in the hexaploid Chinese Spring and Norin 61 (Lanes 1 and 3). The Synthetic hexaploid wheat (Lane 2) along with the tetraploid T. turgidum (Lane 4) and the diploid Ae. tauschii (Lane 5) lacked the full insertion site and only the “empty site,” i.e., the lower band of ~367 bp was found.
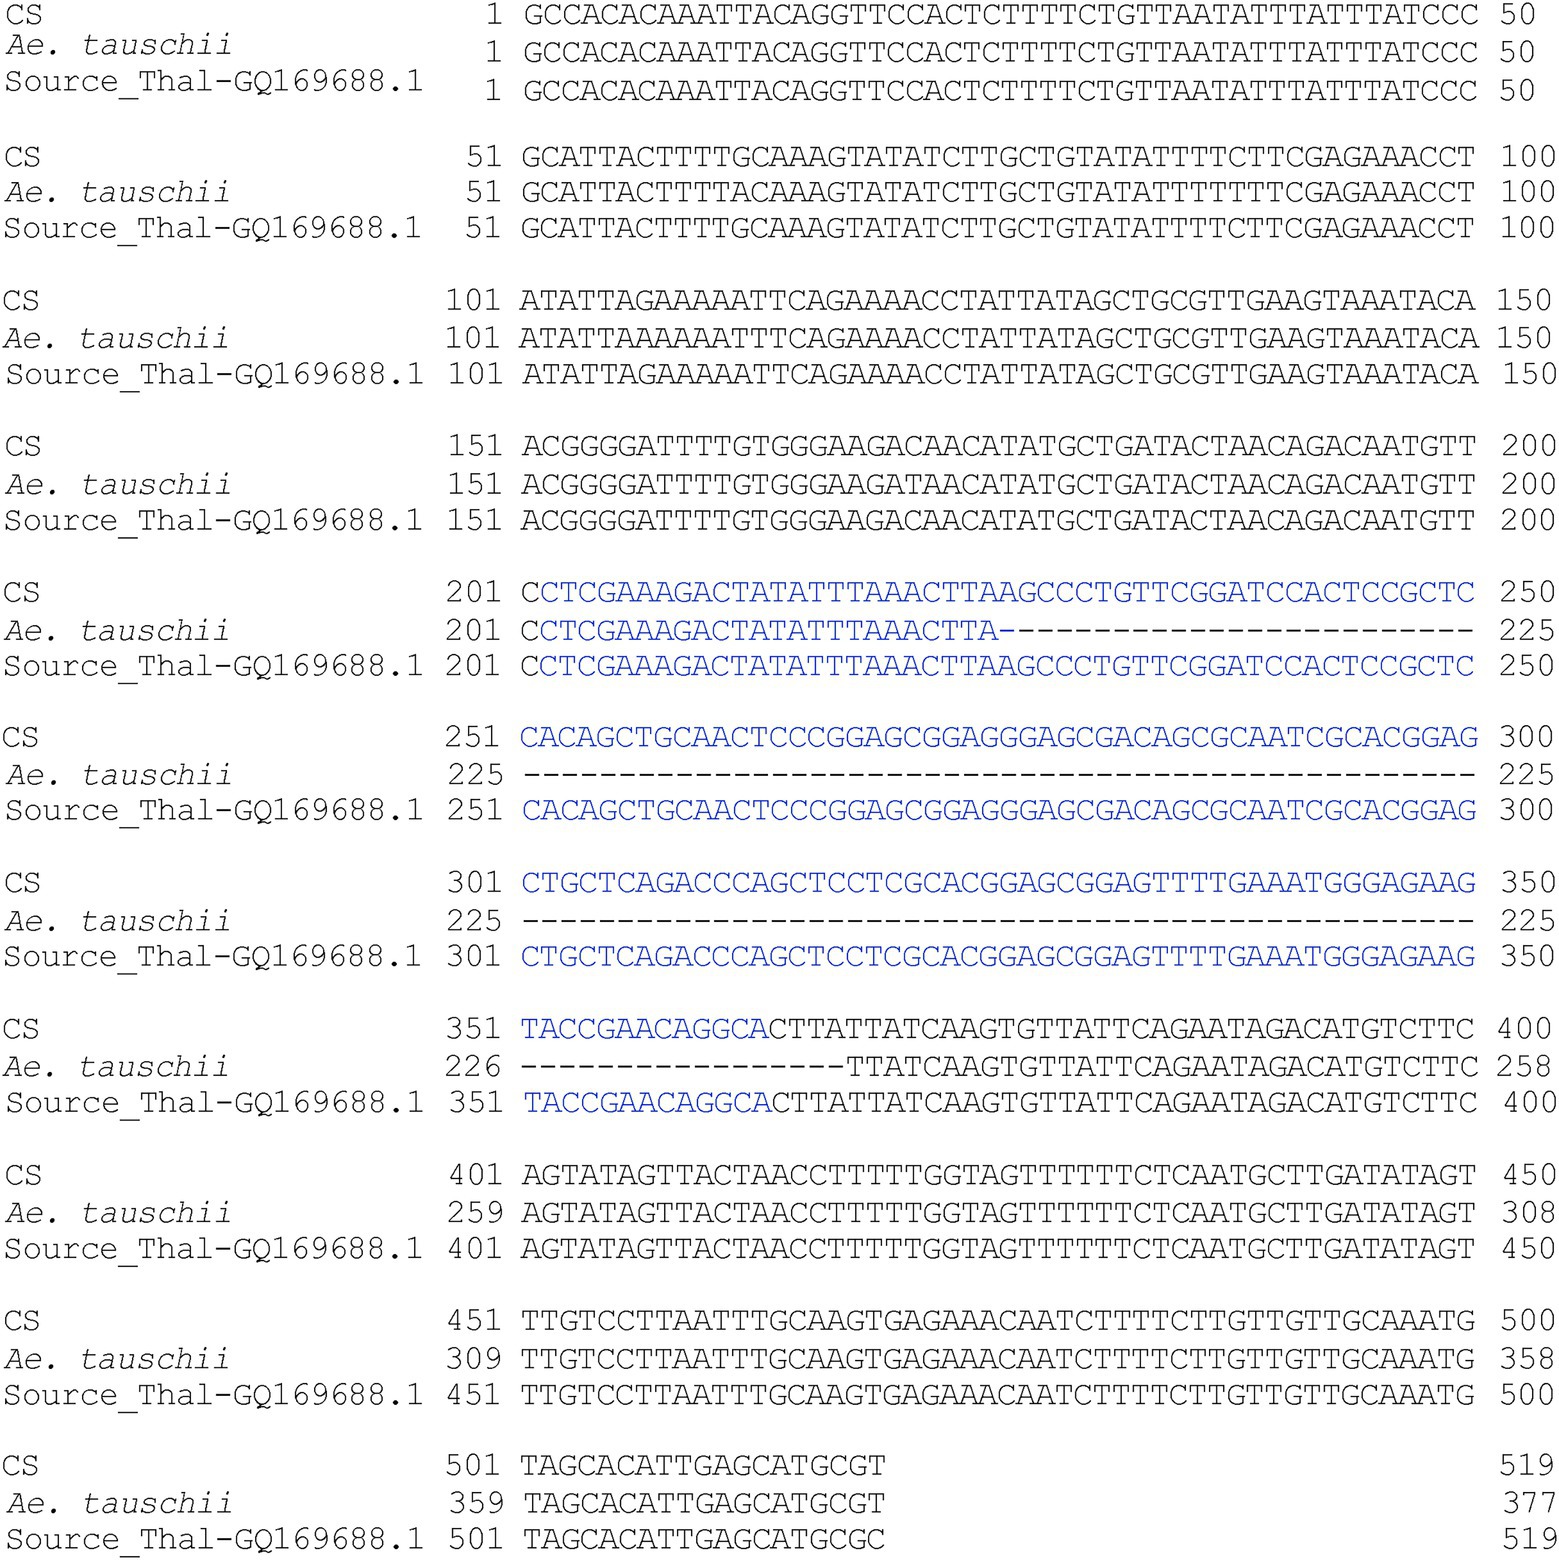
Figure 2. Multiple sequence alignment of sequenced amplified fragments (see Figure 3) corresponding to Triticum aestivum cv. Chinese Spring, Ae. tauschii and the best match NCBI database (Thal-GQ169688) bread wheat sequence. The Thalos element is indicated in blue letters, while the flanking sequences are indicated in black letters. The two T. aestivum cultivars Chinese Spring and the NCBI database (bread wheat) have the element, while the Ae. tauschii accession lacked it.
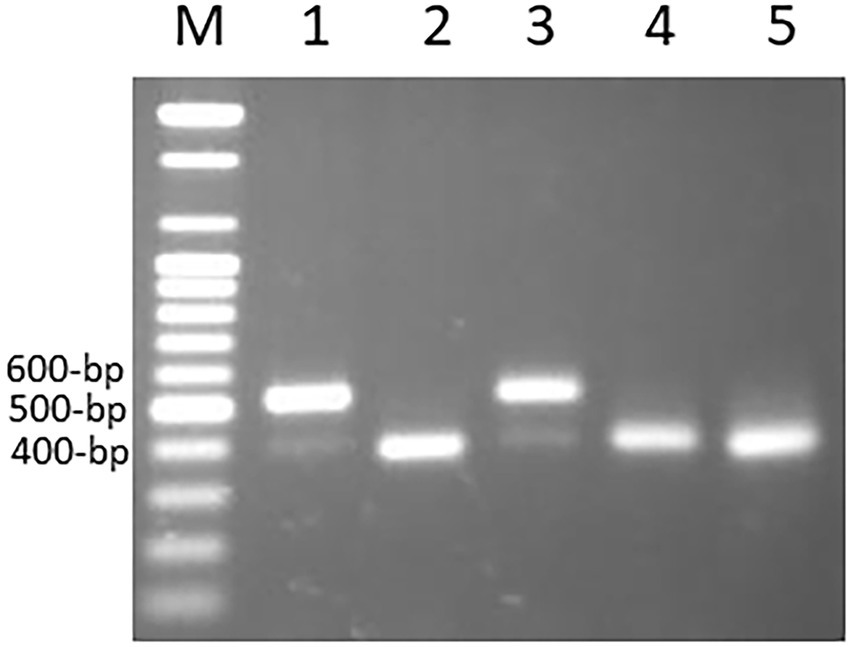
Figure 3. An example of amplified MITE fragments observed in five Triticum–Aegilops accessions with three MITE primers (Thal-AK330263, Thal-GQ412263, andThal-EU835982). The five accessions are: (1) Chinese Spring; (2) SHW ABD 4; (3) Norin 61; (4) T. turgidum; (5) Ae. tauschii.
Distribution of MITEs in 17 accessions of wheat and related species and evolutionary relationships inferred by MITE insertion polymorphisms
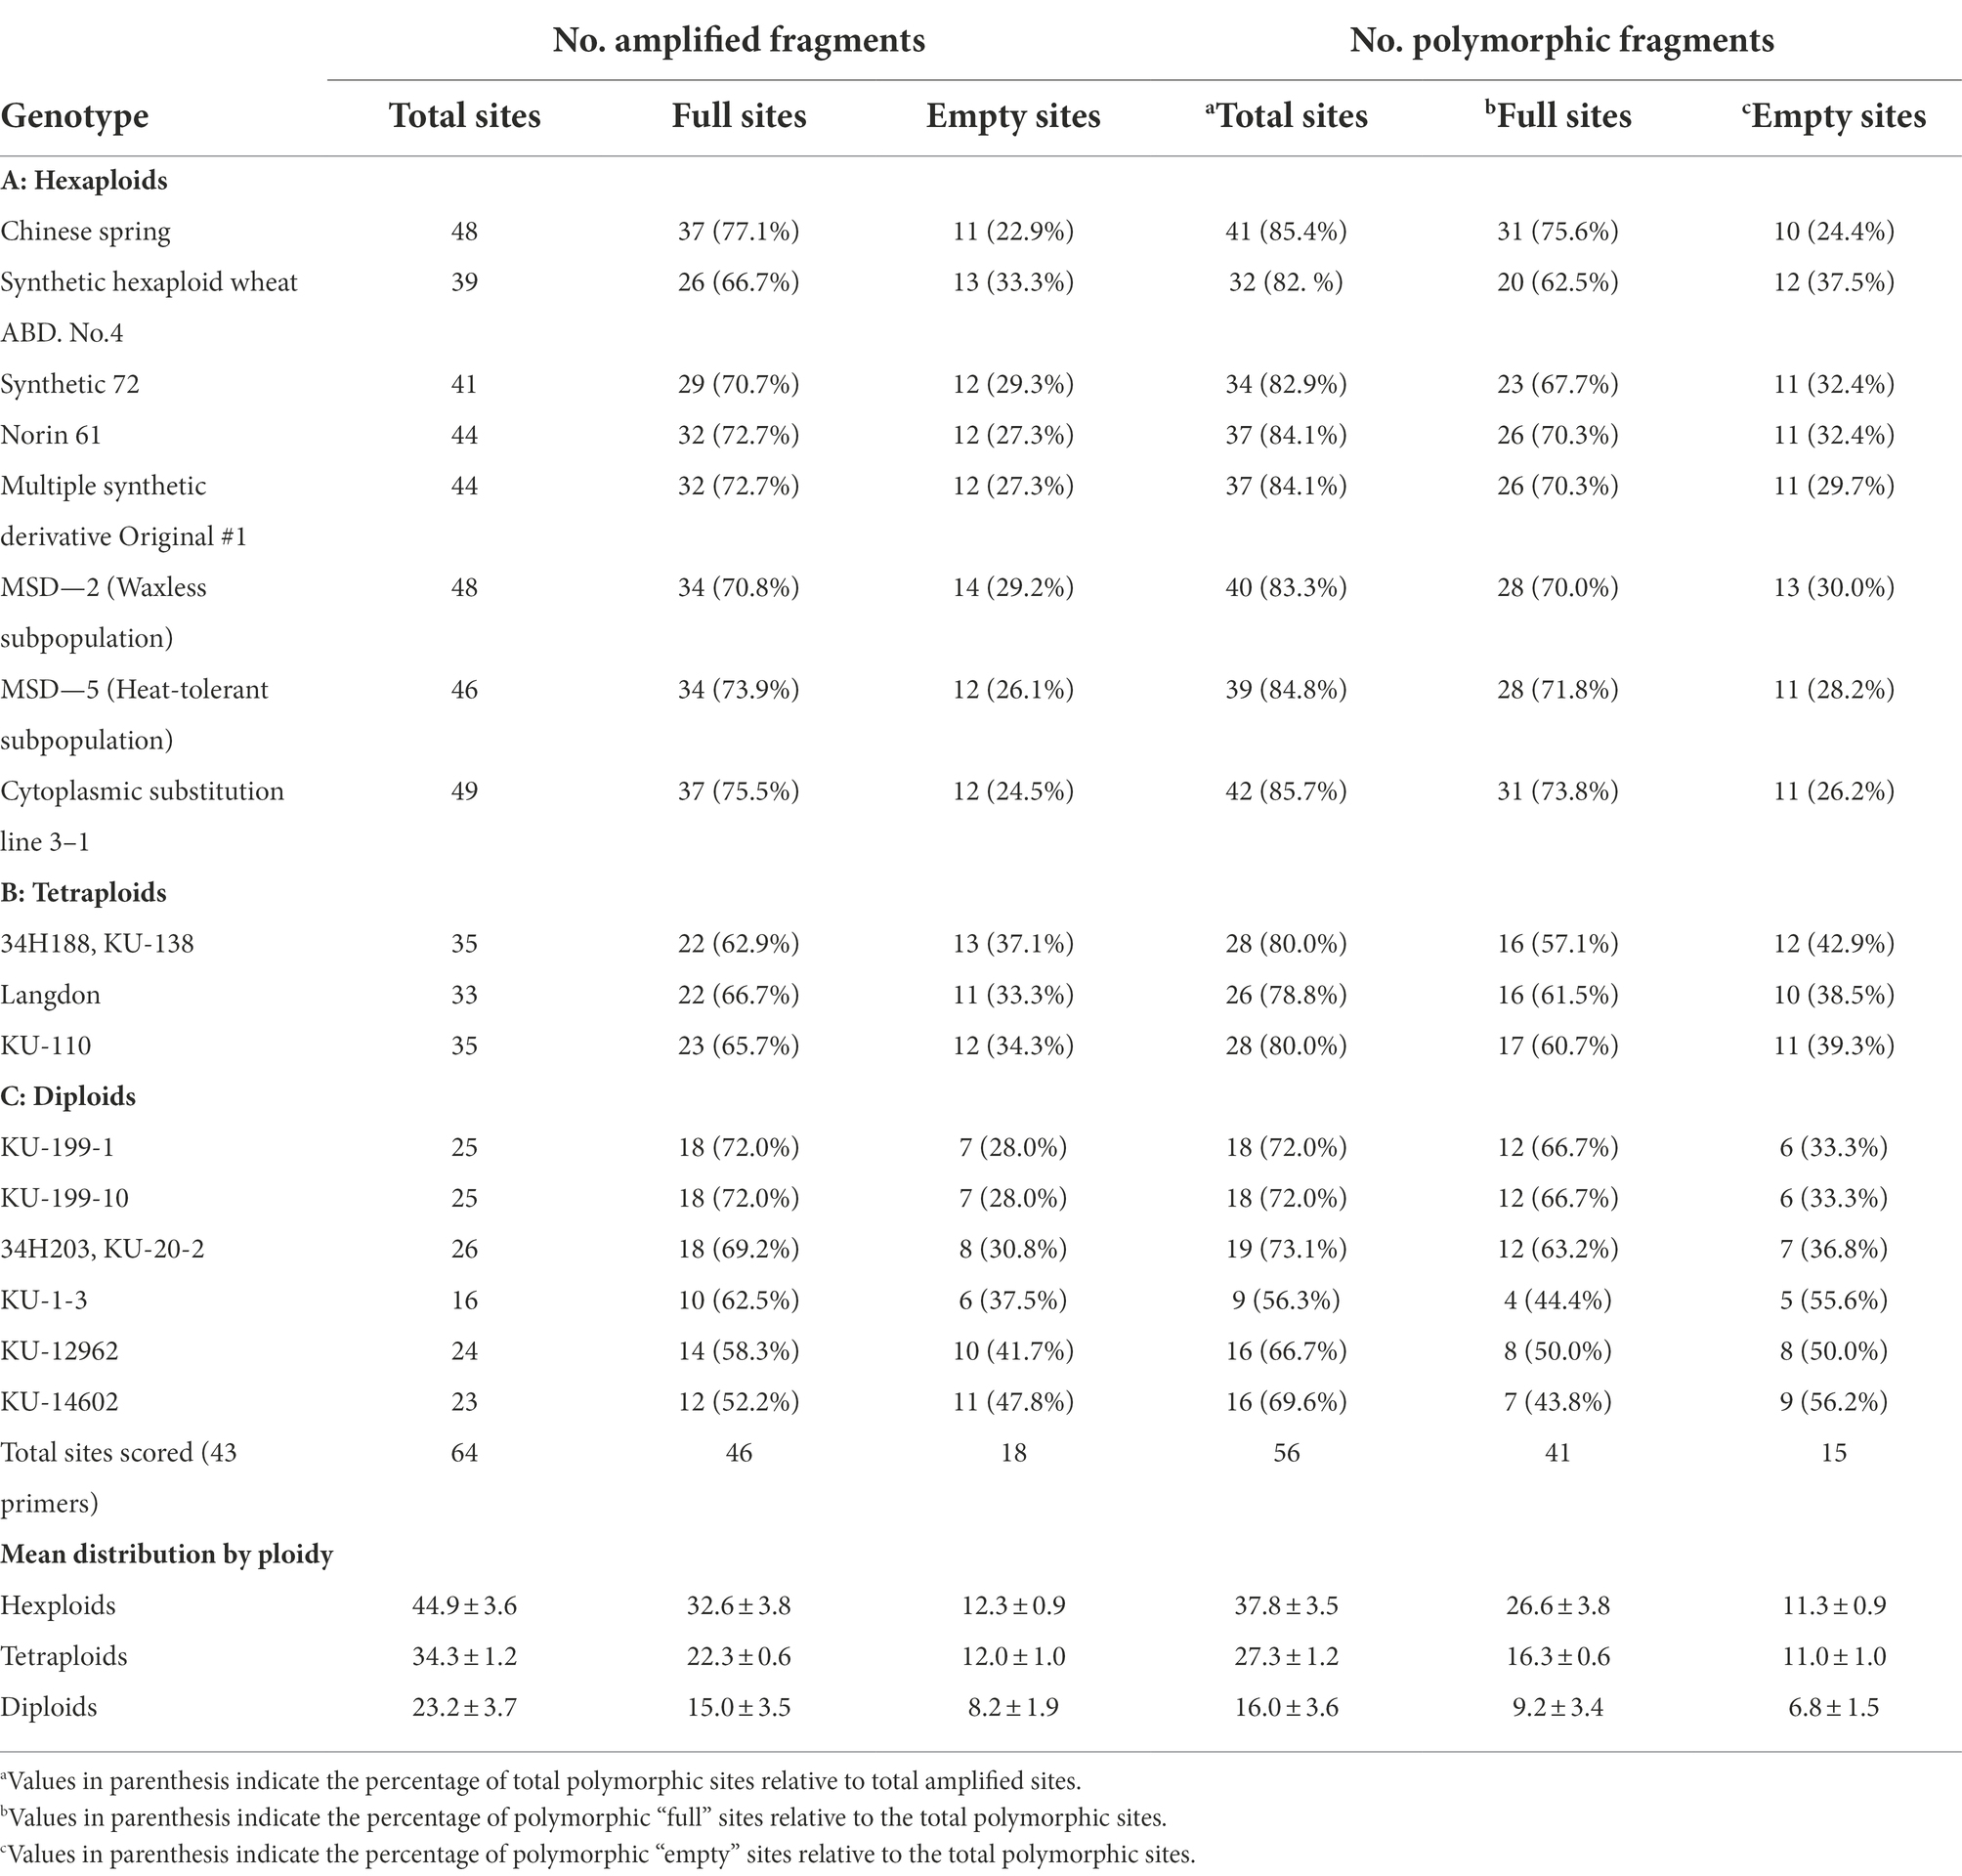
To assess MITE dynamics and determine whether the proliferation of MITEs was of recent origin in allohexaploid wheat, 17 accessions of wheat and related species comprising hexaploids, tetraploids and their diploid progenitors were genotyped with the 43 MITE primer pairs. Of the 43 markers studied, five (12%) were monomorphic, indicating that they may be of fossil origin. Different patterns of MITE insertion polymorphisms in relation to ploidy and/or genome type were also observed (Figure 4). MITE insertion numbers (i.e., abundance) increased with ploidy level (Table 3). The total number of amplified “full sites” ranged from 26 [in SHW ABD4 (AABBDD)] to 37 [in CS (AABBDD) and its cytoplasmic substitution line 3-1(AABBDD)], 22 [in 34H188 (T. turgidum, AABB) and Langdon (T. durum, AABB)] to 23 [in KU-110 (T. dicoccoides, AABB)], and 10 [in KU-1-3 (Ae. aucheri, SS)] to 18 [in KU-199-1 and KU-199-10 (T. urartu, AA); and 34H203 (KU-20-2, Ae. tauschii, DD)] as shown in Table 3. Significant variation in “full site” fragments was found among the hexaploids and the BB genome group of the diploids, unlike the AABB and AA/DD genome groups which showed little or no variation in full sites (Table 3). The proportion of polymorphic bands among these accessions ranged from 44 to 76% in Ae. speltoides (KU-14602) and T. aestivum cv. CS, respectively. An analysis of similarity (ANOSIM) was conducted to further investigate differences at the genomes or polyploid levels. ANOSIM revealed a high degree of dissimilarity between some hexaploids, tetraploids and diploids (p < 5% and R > 0.75). A high MITE proliferation was observed in allohexaploid bread wheat (32.6 ± 3.8 insertion sites) relative to the tetraploid (22.3 ± 0.6 sites) and diploid (15.0 ± 3.5 sites) progenitors, which lends support to the notion that rapid activation of transposons occurred recently after the formation of wheat.
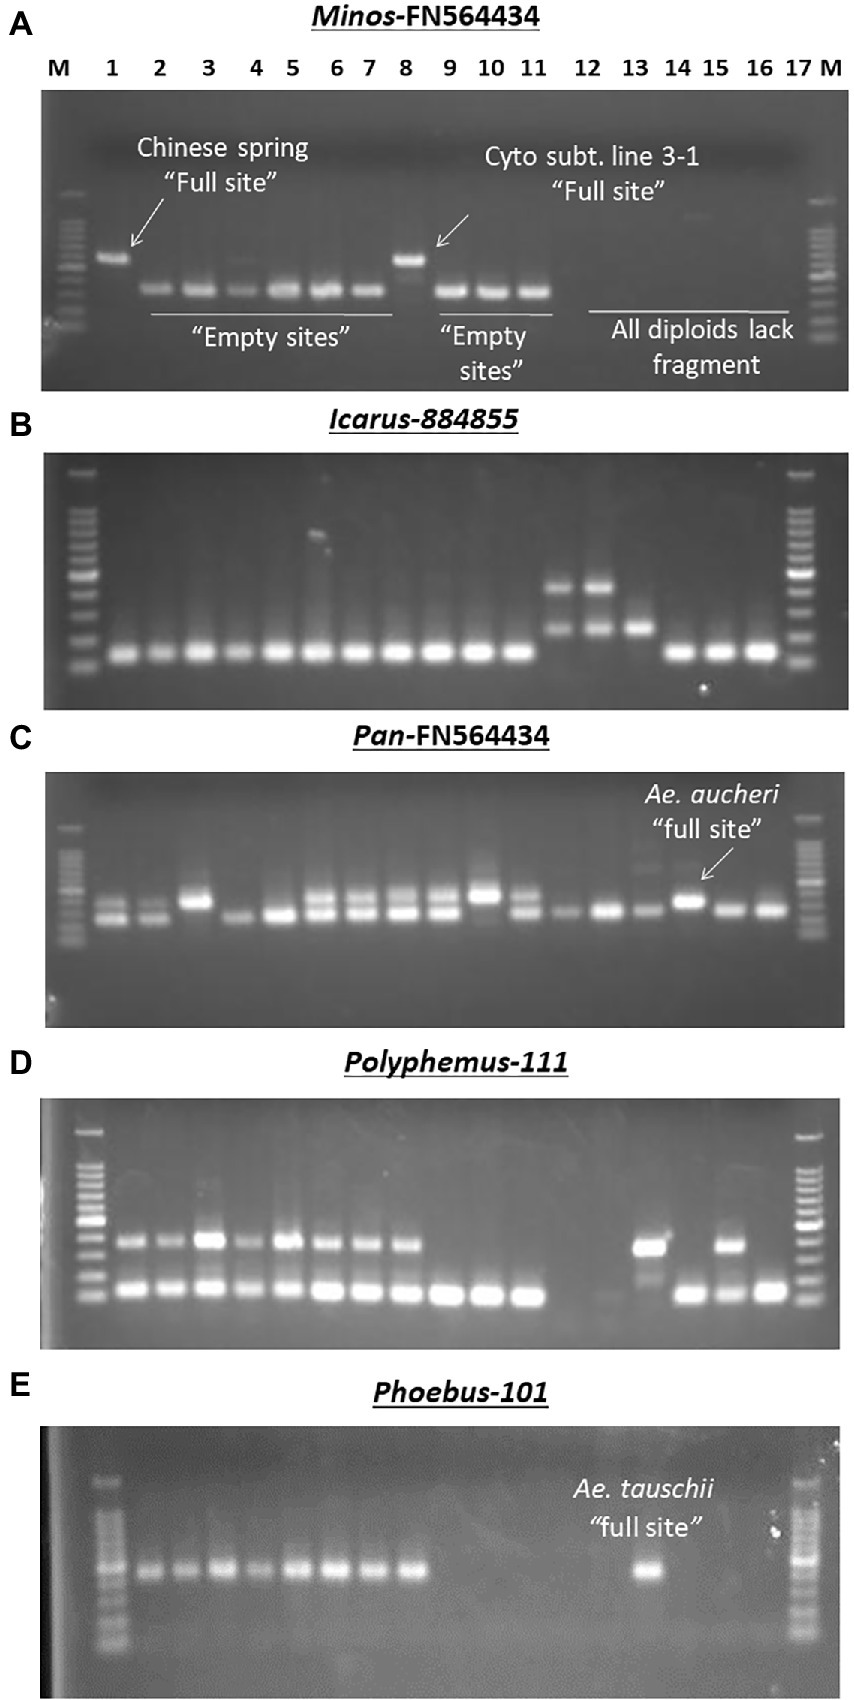
Figure 4. Examples of different MITE insertion polymorphism patterns observed in 17 accessions of wheat and related species in relation to ploidy and/or genome types. (A) Amplification patterns observed with Minos-FN564434: in this case, only the hexaploid cv. Chinese Spring (Lane 1) and its Cytoplasmic substitution line 3–1 (lane 8) had the Minos element, termed as “full site”; the rest of the hexaploid accessions and the tetraploids had only the “empty site,” while all the diploids (lanes 12–17) showed band absence. (B) Amplification patterns observed with Icarus-884,855: all the hexaploid and tetraploid accessions (lanes 1–11) and the SS diploid types (lanes 15–17) lacked the Icarus element with only the “empty site” present; in addition to the Icarus element present in Ae. tauschii (DD, lane 14), the two T. urartu (AA, lanes 12 and 13) possessed an additional ~450 bp-long unique fragment. (C) Amplification patterns observed with Pan–FN564434; all the hexaploid and tetraploid accessions [lanes 1–11, except Norin 61 and MSD-Original #1 (lanes 4 and 5, respectively)] had the Pan element; while all the diploids (lanes 12–17) except Ae. aucheri diploid accession (KU-1-3, lane 15) showed band absence. The relatively lower fragment position of the Pan element in KU-1-3 seems to suggest some sequence deletion in this accession. (D) Amplification patterns observed with Polyphemus-111; all the hexaploid accessions (lanes 1–8), Ae. tauschii (lane 14) and an accession of Ae. speltoides (lane 16) had the Polyphemus element; the tetraploid accessions (lanes 9–11) and Ae. aucheri (lane 15) had only the empty site, while the two T. urartu accessions (lanes 12 and 13) accessions showed band absence. (E) Amplification patterns observed with Phoebus 101; all the hexaploid accessions (lanes 1–8), along with the diploid Ae. tauschii (lane 14) had the Phoebus element; the tetraploid accessions (lanes 9–11) and the other diploid accessions lacked the element.
The observed promising amplification of the MITE fragments in the subset of five accessions (as indicated above) enabled us to subsequently extend a survey of the MITE insertion polymorphisms in a relatively larger set of accessions of wheat and related species shown in Table 1; and different patterns of MITE insertion polymorphisms observed in the 17 accessions of wheat and related species of ploidy and/or genome types shown in Figure 4. Figure 4B, for instance, showed a ~450 bp-long fragment unique to the two T. urartu accessions, which might possibly be due to element dimer, which are known to form rapidly during periods of active transposition (McGurk and Barbash, 2018), thereby leading to site duplication in T. urartu.
To further confirm the suitability of the MITE markers to explain the polymorphism between the different accessions tested, phylogenetic trees were produced and PCA analysis was conducted based on the polymorphic “full sites” (Figures 5A,B), which revealed different strata of evolutionary relationships in the Triticum–Aegilops complex. Generally, the accessions were grouped in five groups in relation to their ploidy and genome constitution: AA, BB or SS, DD, AABB, AABBDD (Figures 5A,B). Within the hexaploids group (Group 1), an original accession of multiple synthetic derivatives was neatly separated from the other accessions including its MSD-2 waxless and MSD-5 heat-tolerant offshoots that are in sub-cluster along with Norin 61, CS and its cytoplasmic substitution line 3–1 (Figures 5A,B). The synthetics were closer to the tetraploids from which they were re-synthesized in Group 2. Group 3 is made up only of diploid accessions comprising of three distantly separated sub-clades in relation to their genome constitution: Ae tauschii (DD), T. urartu (AA) and Ae. aucheri and Ae. speltoides (SS). Among the diploid progenitors, our results indicated that, Ae. tauschii (DD) is more genetically distant from the other diploid species, followed by T. urartu (AA) and then the SS or BB genome type (Ae. aucheri and Ae. speltoides, which were sub-clustered together; Figures 5A,B). The principal component analysis clearly revealed the relationship among the accessions in relation to their genome groups and ploidy; with the first two principal components explaining 59.7% of the total variation (Figure 5B; Supplementary Table S2). The genomic distribution, as well as the genetic relationships detected by these MITEs insertion polymorphisms, is consistent with the known evolutionary history and phylogenetic relationships in wheat.
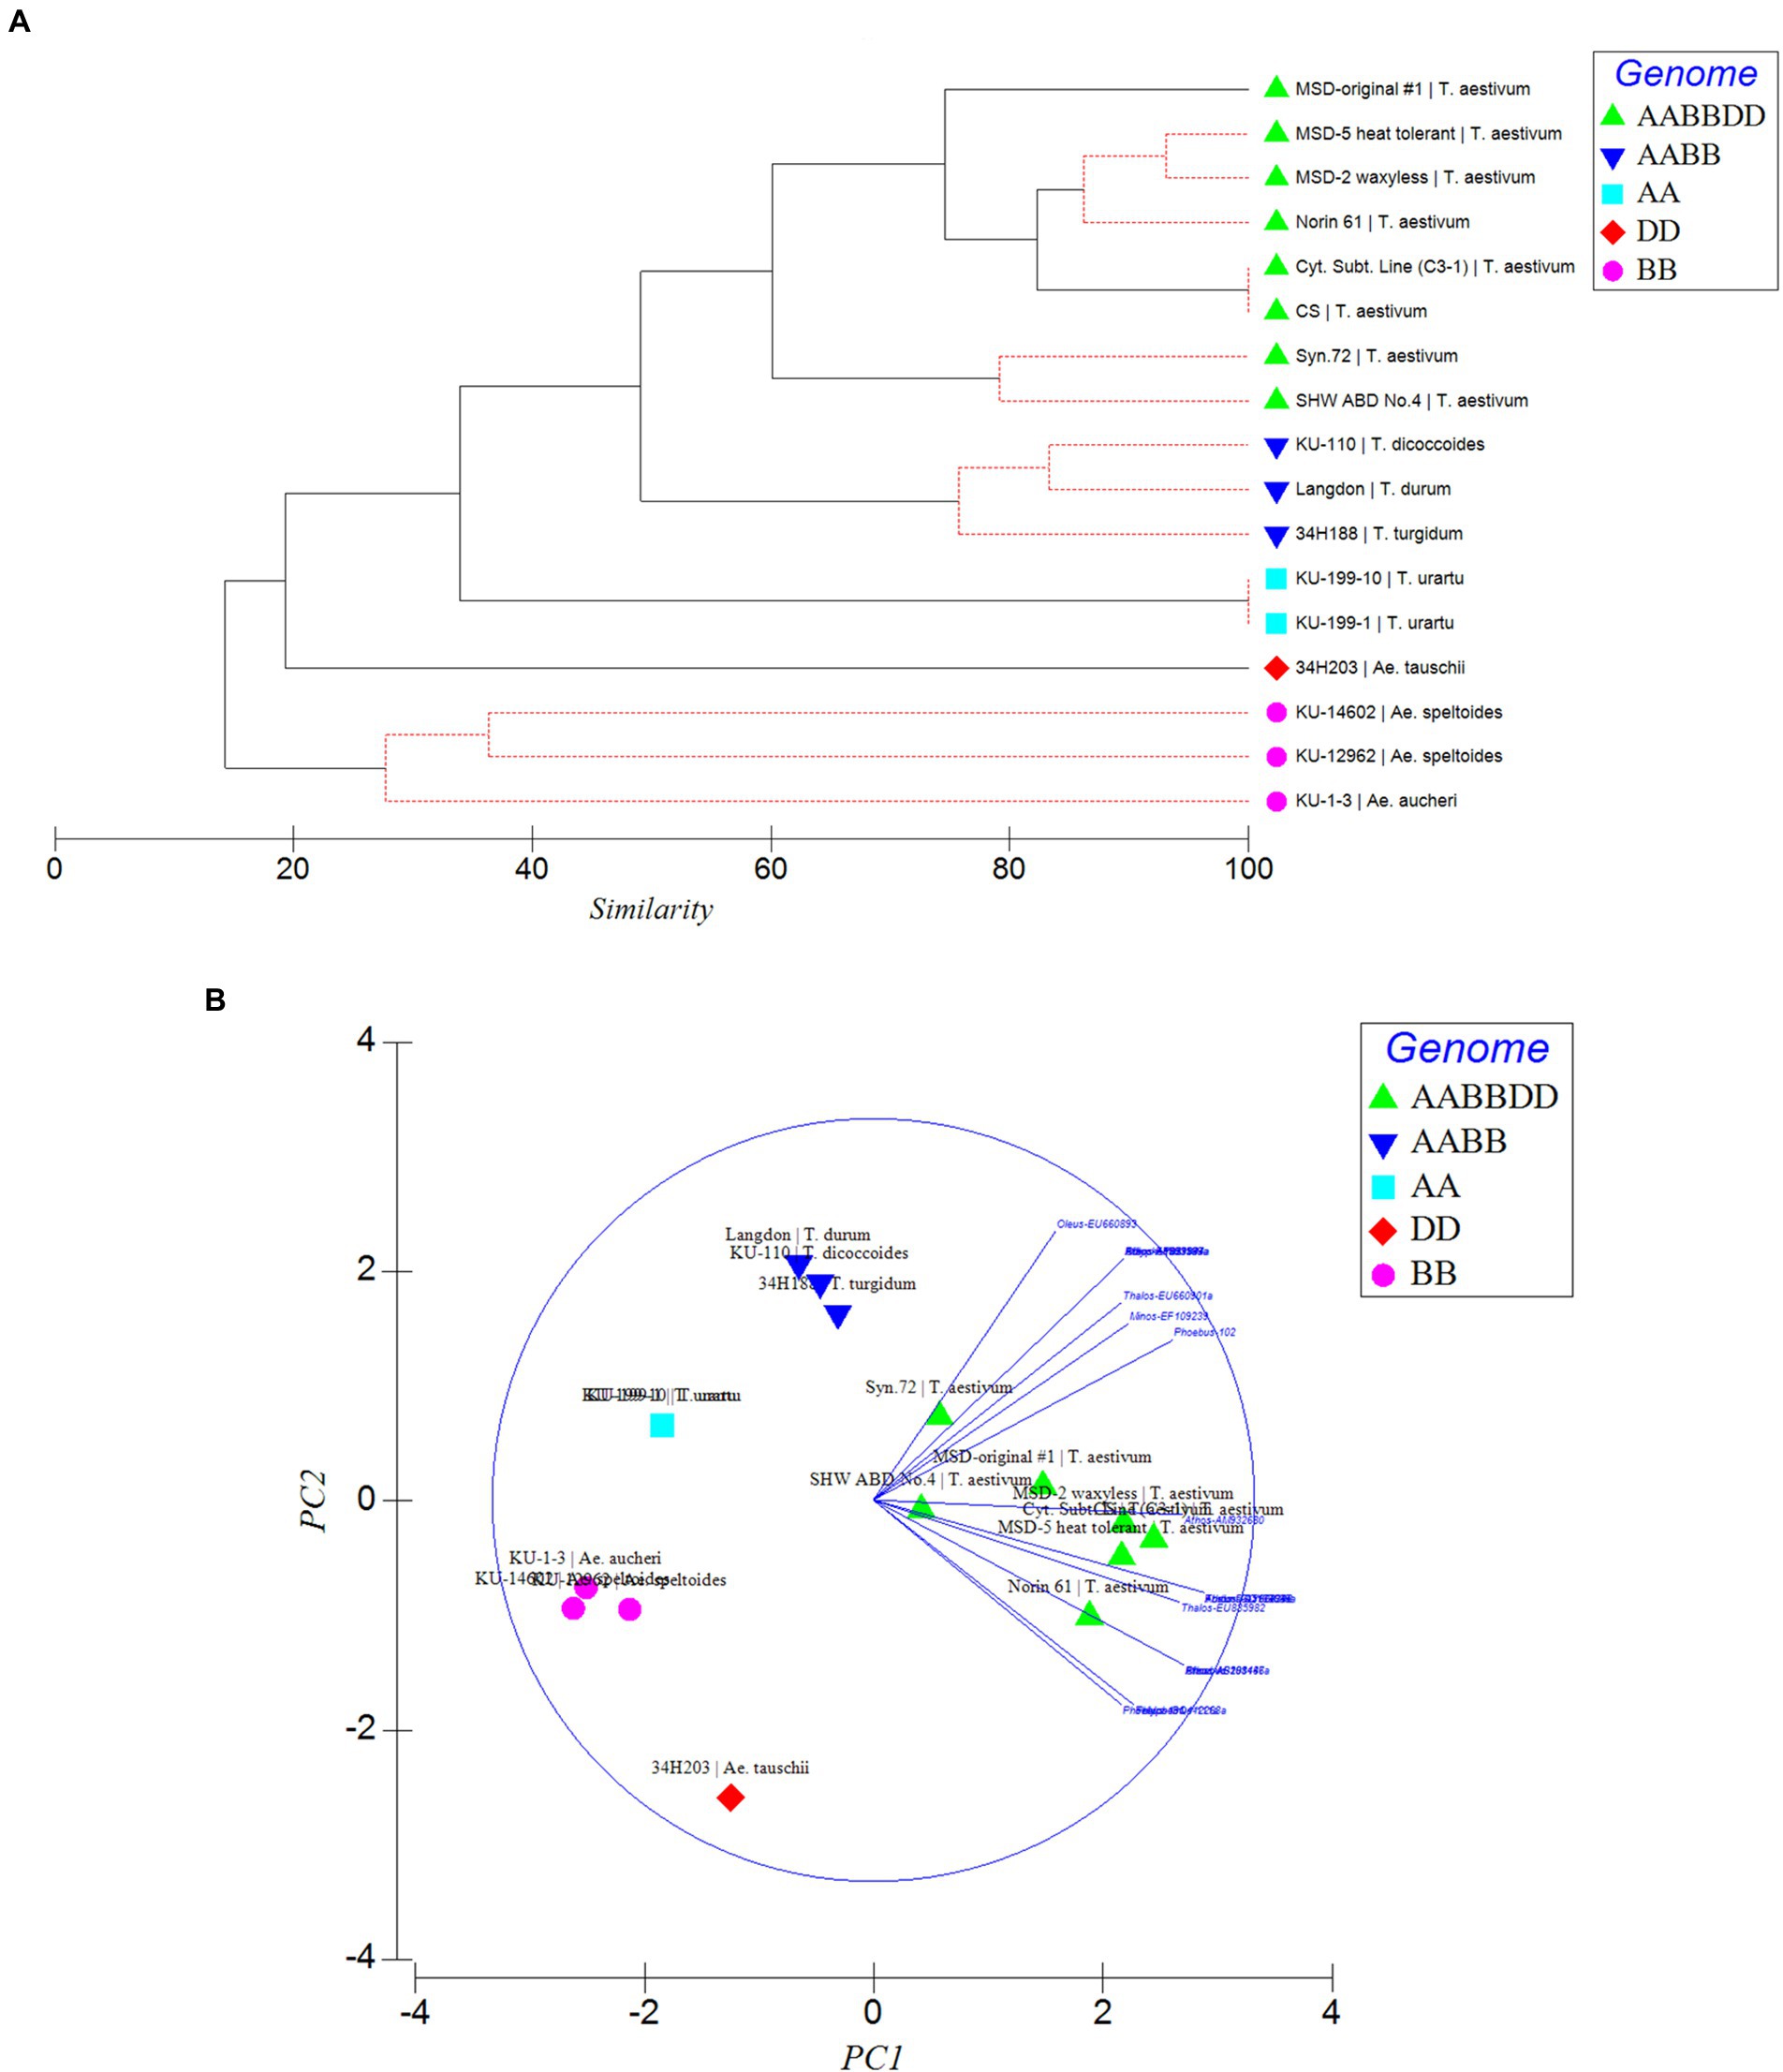
Figure 5. Phylogenetic relationships (A) and Principal component analysis (PCA; B) inferred by MITE insertion polymorphisms in the Triticum–Aegilops complex based on polymorphic “full” sites. Different strata of evolutionary relationships were inferred according to ploidy and genome types.
Stability of MITE insertions in the genome of wheat cv. CS
As stable inheritance of transposable elements is a desirable feature for their usefulness as a valuable DNA marker system, we investigated the possible excision of MITEs in the wheat genome using CS, one of the parents of our mapping population. As shown in Table 3, the highest frequency of polymorphic MITE insertion sites was observed in this cultivar. With 16 polymorphic MITE markers ×129 plants amounting to a total of 2,064 sites investigated for possible excision, no single excision was observed in this wheat accession, i.e., the frequency of insertion stability was 100% (data not shown). This observation indicates the value of these MITEs as valuable molecular markers in wheat.
MITE insertion polymorphism rate in parents of our mapping cross, preliminary genotyping in a RIL population, and linkage mapping
Of a total of 48 amplified MITE markers assayed, 15 primer pairs yielded polymorphic bands between the two parents of our intraspecific mapping cross (CS and ABD4), indicating a 31% polymorphism rate. Of these polymorphic primer pairs, 10 and four showed presence/absence and co-dominant inheritance, respectively, while one primer pair produced both presence/absence/co-dominant fragments between the two parents. Preliminary genotyping using five polymorphic PCR-SCAR MITE primers in our mapping cross-population of 104 RILs yielded six scorable bands with five showing the expected 1:1 segregation ratio for simplex markers, while one of the two markers scored from Athos-DQ5176494 with an approximate size of 277 bp fitted a 3:1 ratio for a duplex × nulliplex marker (Table 4). An example of the segregation of MITE markers in a RIL mapping population is shown in Supplementary Figure 1. Interestingly, a high frequency of simplex alleles (83%) was observed with these MITE markers, which indicates the potential usefulness of these stable MITEs for efficient mapping of this complex allohexaploid genome. Four of the six scorable MITE markers obtained for the preliminary genotyping of a RIL mapping population (Table 4) have already been integrated into our current DArT-and SNP-based linkage mapping constructed. The reported chromosomal location of these tested markers was confirmed by our linkage mapping effort, while the location of a hitherto unassigned MITE marker [TE 30–2, Minos-EF567062] which mapped to chromosome 5D was established from our linkage mapping studies.
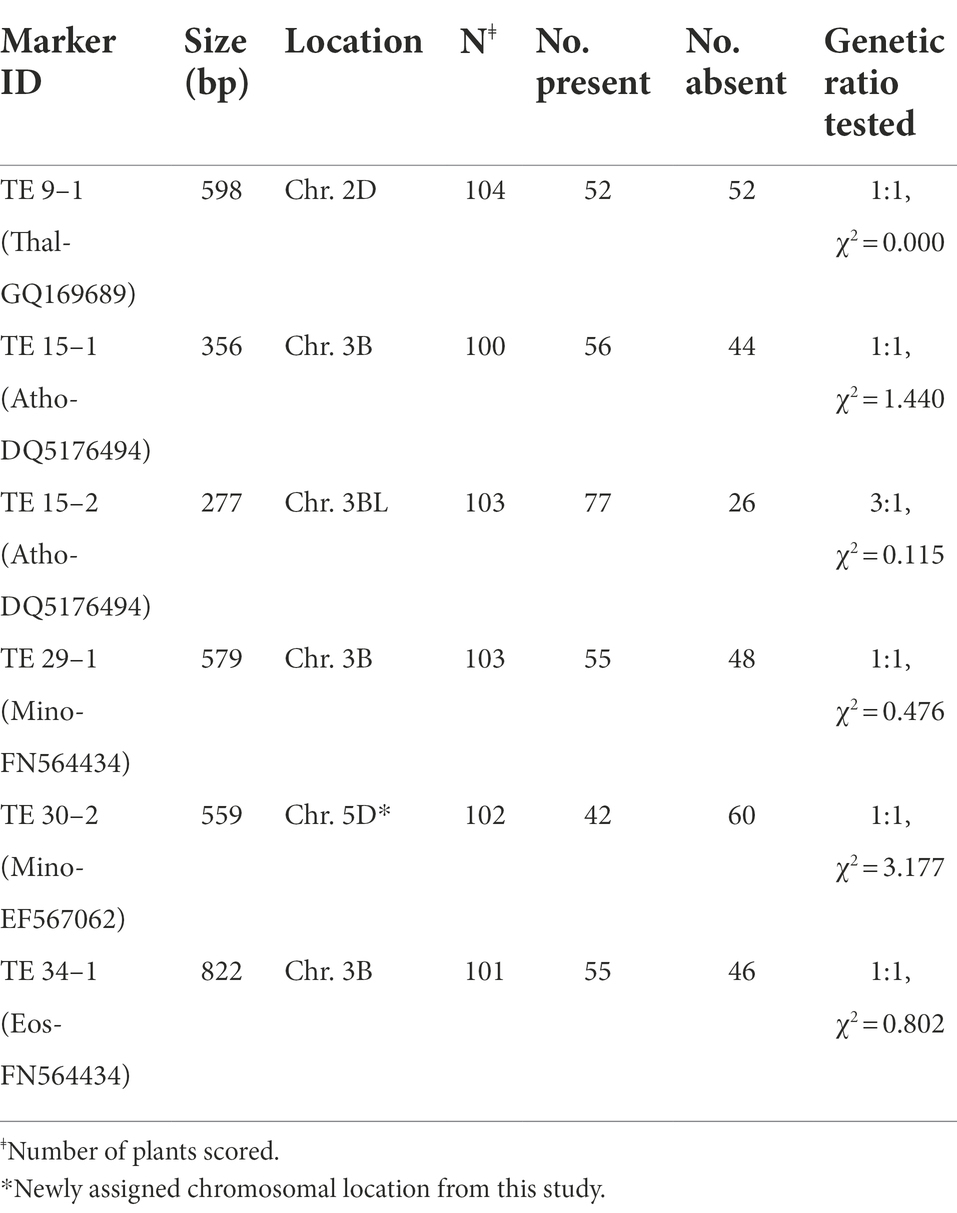
Table 4. MITE marker identity, size, chromosomal location, and segregation ratio tested in a Chinese Spring (P1) × SHW ABD No.4 (P2) RIL mapping population.
Discussion
We utilized a set of published MITE markers from 13 Stowaway-like families, whose main advantage is derived from the presence or absence of a small-sized element that can be easily assayed (Shirasawa et al., 2012; Yaakov et al., 2012) for genomic studies in wheat and related species. The simple inheritance of MITEs, their relatively inexpensive and co-dominant assay method, as well as their relatively high polymorphism rate (even between closely related taxa) make MITE markers highly promising for exploitation in different aspects of genomic studies. The potential of MITE insertion polymorphisms as an efficient DNA marker system has been demonstrated in several plant species including wheat (Yaakov et al., 2012, 2013), groundnut (Shirasawa et al., 2012; Gayathri et al., 2018), rice (Monden et al., 2009), barley (Lyons et al., 2008) and Brassica species (Sampath et al., 2014). The MITE markers tested in this study have been reportedly shown to be in association with genes or coding sequences with insertions occurring in introns of known genes, repetitive regions or in intergenic regions (Yaakov et al., 2012; Supplementary Table S1). In this study, similarly to the previous report in wheat by Yaakov et al. (2012), we found these MITE insertional polymorphisms as highly efficient evolutionary markers suited for inferring evolutionary relationships in the Triticum–Aegilops complex, genome analysis and linkage mapping in wheat.
MITEs have been known to be found often in close proximity to or within gene-rich euchromatic regions, where they might alter the expression and function of the associated gene(s) (Jiang et al., 2004; Naito et al., 2009). An in-silico study by Sabot et al. (2005) showed that ~43% of the MITE insertions occurred in association with wheat genes. Moreover, Yaakov et al. (2012) found 60% of the wheat MITEs used in this study to be associated with genes, with ~51% of the insertions occurring in the introns (Supplementary Table S1). Such insertions of active MITEs in gene-rich regions might drive the evolution of novel genes in wheat, thereby leading to altered phenotypes. For instance, Gorafi et al. (2016) showed a MITE insertion in the promoter region of Vrn-1A allele annulled the vernalization requirement of a wheat introgression line. Dai et al. (2021) revealed significant marker-trait associations for five agronomically important traits uncovered by 10 polymorphic markers generated from six MITE specific primer pairs in a diversity panel of 126 Brassica napus genotypes. A recent study on the variability of root system architecture in five subspecies of Spanish T. turgidum L. revealed differences in unique MITE insertion in the TtDro1B gene useful for the reliable differentiation of the subspecies turgidum from the durum and polonicum types (González et al., 2021). Thus, further genetic studies with these MITE markers will provide insights for uncovering useful variation in the genes associated with the activity of these MITE insertions (as shown in Supplementary Table S1) for the molecular breeding of wheat.
The distribution of MITE insertions in relation to different ploidy and genome types (Table 3), revealed the activity of MITEs during evolution. The large difference in observed MITE insertion sites among the hexaploids (26–37 insertion sites), tetraploids (22–23 insertion sites) and their diploid progenitors (10–18 insertions sites), as well as between the diploid genome types (e.g., 10–14 full sites in the SS versus 18 full sites in the AA and DD genome types) which suggest that MITEs might have undergone a recent rapid activation in wheat following the allopolyploidization events. This observation is consistent with the recent report of Keidar-Friedman et al. based on whole genome analysis where the distribution of a total of 239,126 retrieved MITE insertions were found to be 48.2% (in hexaploids), 32,7% (in tetraploid T. turgidum) and 9.6% (in diploids, av. from T. urartu and Ae. tauschii). Based on the abundance of Stowaway-like MITEs in wheat group 7 chromosomes, where more of the 2026 MITEs analyzed were found in 7D (35.79%) relative to the 7A (28.87%) and 7B (35.24%), Lu et al. (2014) suggested that the A and B sub-genomes might have eliminated some repetitive elements during the double hybridization events in allohexaploid wheat. Our present study also revealed more Stowaway-like MITE insertions in the D sub-genome relative to the S (or B) sub-genome, but similar numbers of insertion sites were found between the D and A sub-genomes. However, a de novo search for MITEs of the entire assembled wheat genome v2 using the MITETracker software enabled the discovery of 6,013 MITE families in the wheat genome, with the MITEs distributed along the chromosomes and associated with gene-rich regions (Crescente et al., 2018). Of the 125,800 different MITEs discovered across the wheat genome based on the MITETracker, the B sub-genome was more MITEs-rich (40.14%) followed by the A sub-genome (32.81%) with the D sub-genome (27.05%) being the least (Crescente et al., 2018). It seems that this situation of the relative abundance of MITEs accords with the general tendency of TEs in allohexaploid wheat, as Wicker et al. (2022) analyzed long terminal repeat (LTR) retrotransposons (full-length) and found the B sub-genome to be relatively more abundant in the TEs studied, followed by the A sub-genome and then D sub-genome. In future studies, it would be worthwhile to clarify the evolutionary consequences of the relative abundance of MITE insertions in the different sub-genomes in allohexaploid wheat and the potential implications of the likely altered function of associated genes in future wheat breeding.
Phylogenetic and PCA analysis based on the detected MITE insertion site polymorphisms revealed high genetic divergence that clearly classified the accessions in the Triticum–Aegilops complex consistent with the known evolutionary history of wheat, and sub-grouped the different accessions according to their specific genome types (SS, AA, DD, AABB, AABBDD). This study showed the efficiency of these evolutionary markers in producing high-resolution phylogenetic trees that sub-grouped the accessions according to their specific genome types, consistent with the findings of Yaakov et al. (2012), thereby lending further support to the hypothesis that MITEs were recently active and proliferated in a species-unique fashion. Our observation indicated MITE activity in recently synthesized allohexaploid wheat (including the multiple synthetic derivatives, MSD; Table 1) high polymorphisms in MITE insertion sites especially between the MSD (32–34 sites), a primary synthetic wheat allohexaploid (Syn. 72, 29 sites) and synthetic hexaploid wheat (SHW ABD4, 26 sites). As shown in the phylogenetic tree and PCA (Figures 5A,B), the MSD accessions were clustered in Group 1 with the original MSD line #1 being uniquely separated, while the Syn.72 and ABD4 were sub-clustered in a group close to the tetraploid accessions (Group 2) from which these two accessions were derived. Collectively, our results suggest that MITE transposition activity occurred throughout the course of wheat evolution with rapid activation occurring more recently and might provide further insights in efforts at studying wheat biodiversity and TE-associated gene introgression (Yaakov et al., 2012).
Our study on the stability of the PCR–SCAR MITE markers investigated in this study using T. aestivum cv. CS, one of the parents of our mapping population, revealed that they are quite stable in the wheat genome. Similar findings on the stable inheritance of AhMITE1 (frequency of de novo excision = 0.00023, Shirasawa et al., 2012) and the rice mPing (0.00023, in 96 EG4 plants under normal conditions, Monden et al., 2009), which indicated their value as excellent molecular markers for linkage analysis, had been reported. No single element excision was found in 129 next-generation cv. CS plants investigated with 16 polymorphic MITE primer pairs, which suggested that element excision will not be a concern in the utility of these markers for linkage analysis in wheat.
Our field observations showed that the cv. CS usually presents stable phenotypes which might explain the lack of observed MITE excision; however, the wheat cv. Norin 33 tends to show a sort of genetic instability (Watanabe, 1962), that may be due to TE activity. As a future strategy, it will be useful to characterize the transposition activity in this known genetically unstable cv. Norin 33 relative to other more stable genotypes such as CS (and possibly SHW ABD4) using the multiplexed transposon display technique or high-throughput sequencing to identify new active transposons or their insertions in wheat.
The PCR-SCAR MITE markers demonstrated effectiveness in detecting insertion length polymorphisms in a CS × SHW ABD4 RIL mapping population developed from an intraspecific cross. The two parental lines were genetically partitioned into main clusters on the dendrogram, thereby suggesting a high degree of genetic divergence between them. The observed MITEs polymorphism rate of 31% detected between the two T. aestivum parents highlights the high potential of the MITEs in uncovering polymorphisms for the linkage mapping of bread wheat. Moreover, the stable MITEs showed seemingly simple inheritance and with a very high frequency of simplex markers (83% markers with a 1:1 segregation ratio, Table 3) that are potentially useful for the efficient mapping of the complex allohexaploid wheat. It generally seems that TE-based markers such as those based on insertional polymorphisms detectable by PCR-SCAR primers designed from their conserved flanking sequences or their multiplexed assay derivatives [e.g., MITE transposon display, Sequence-specific amplified polymorphism (SSAP), etc.], have a tendency to generate simplex markers that are even more suitable for the molecular mapping of complex polyploid genomes. A study in sweet potato (Monden et al., 2015) based on Rtsp-1 retrotransposon insertion polymorphisms found an abundance of simplex markers (~90%) which enhanced the mapping efficiency of the genetically complex autohexaploid sweet potato. In bent grass, a MITE-display analysis using four selective primer pairs (Amundsen et al., 2011) uncovered a total of 139 polymorphic markers, of which 28 markers fitted the expected 1:1 or 3:1 genetic ratio with the simplex marker types being the most abundant (~81.4%). Based on a RIL population of 104 individuals, four simplex MITE markers developed from our preliminary genotyping effort (TE 29–1, Minos-FN564434–Chr. 3B; TE 34–1, Eos-FN564434–Chr. 3B; TE 15–1, Athos-DQ5176494–Chr. 3B; and TE 30–2, Minos-EF567062–Chr. 5D) were integrated into our current DArT-and SNP-based linkage map being constructed. The reported chromosomal location of Minos-FN564434, Eos-FN564434 and Athos-DQ517494 in chromosome 3B was confirmed by our linkage mapping effort, while the chromosomal location of one of the MITE markers [Minos-EF567062, mapped to chromosome 5D (data not shown)] was, to the best of our knowledge, established for the first time from our linkage mapping studies.
Overall, these MITE markers which are simply inherited and well resolved on short gel runs in 1.5% normal agarose gels, that can be substituted with an automated system to increase the efficiency and reduce time, are very promising as cost-effective markers for exploitation in the genome analysis and evolutionary studies in wheat. Several sequences of these MITE fragments have been used to design transposon display primers to extend the frontiers of this research for the rapid genotyping of the wheat genome. Our preliminary transposon display-based MITE genotyping results using two selective primer pairs (data not shown) generated a large number of bands in the accessions tested. Thus, the MITE markers used in this study are promising and will potentially serve as a robust resource for several applications in wheat genetics and molecular breeding including biodiversity and evolutionary studies, linkage analysis, association mapping and MITE-associated modification of gene expression.
Data availability statement
The original contributions presented in the study are included in the article/Supplementary material, further inquiries can be directed to the corresponding authors.
Author contributions
BU, YG, YM, and HT: conceptualization. BU: experimentation. BY, KK, and BU: annotation of sequences and primer design. BU and YM: methodology. BU and YG: data curation. BU, BY, and YG: formal analysis. BY and KK: software. BU, YG, BY, YM, KK, and HT: interpretation of data. BU: writing—original draft. BU, YG, YM, BY, KK, and HT: writing—review and editing. HT: genetic resources, funding acquisition, and project administration. All authors contributed to the article and approved the submitted version.
Conflict of interest
The authors declare that the research was conducted in the absence of any commercial or financial relationships that could be construed as a potential conflict of interest.
Publisher’s note
All claims expressed in this article are solely those of the authors and do not necessarily represent those of their affiliated organizations, or those of the publisher, the editors and the reviewers. Any product that may be evaluated in this article, or claim that may be made by its manufacturer, is not guaranteed or endorsed by the publisher.
Supplementary material
The Supplementary material for this article can be found online at: https://www.frontiersin.org/articles/10.3389/fpls.2022.995586/full#supplementary-material
SUPPLEMENTARY FIGURE 1 | An example of the segregation of a MITE marker (Minos-FN564434) in 104 Chinese Spring (P1) x SHW ABD. No.4 (P2) RIL mapping population. The genotypes of the two parental lines (CS and SHW) are shown.
Footnotes
References
Amundsen, K., Rotter, D., Huaijun, M. L., Messing, J., Jung, G., Belanger, F., et al. (2011). Miniature inverted-repeat transposable element identification and genetic marker development in Agrostis. Crop. Sci. 51, 854–861. doi: 10.2135/cropsci2010.04.0215
Casacuberta, J. M., and Santiago, N. (2003). Plant LTR-retrotransposons and MITEs: control of transposition and impact on the evolution of plant genes and genomes. Gene. 311, 1–11. doi: 10.1016/S0378-1119(03)00557-2
Castanera, R., Vendrell-Mir, P., Amelie Bardil, A., Marie-Christine Carpentier, M.-C., Panaud, O., and Casacuberta, J. M. (2021). Amplification dynamics of miniature inverted-repeat transposable elements and their impact on rice trait variability. Plant J. 107, 118–135. doi: 10.1111/tpj.15277
Chen, J., Hu, Q., Zhang, Y., Lu, C., and Kuang, H. (2014). P-MITE: a database for plant miniature inverted-repeat transposable elements. Nucleic Acids Res. 42, D1176–D1181. doi: 10.1093/nar/gkt1000
Crescente, J. M., Zavallo, D., Helguera, M., and Vanzetti, L. S. (2018). MITE tracker: an accurate approach to identify miniature inverted-repeat transposable elements in large genomes. BMC Bioinformatics 19:348. doi: 10.1186/s12859-018-2376-y
Dai, S., Hou, J., Qin, M., Dai, Z., Jin, X., Zhao, S., et al. (2021). Diversity and association analysis of important agricultural trait based on miniature inverted-repeat transposable element specific marker in Brassica napus L. Oil Crop Sci. 6, 28–34. doi: 10.1016/j.ocsci.2021.03.004
Dvorak, J., and Akhunov, E. D. (2005). Tempos of gene deletions and duplications and their relationship to recombination rate during diploid and polyploidy evolution in the Aegilops – Triticum alliance. Genetics. 171, 323–332. doi: 10.1534/genetics.105.041632
Elbashir, A. A. E., Gorafi, Y. S. A., Tahir, I. S. A., Kim, J.-S., and Tsujimoto, H. (2017). Wheat multiple synthetic derivatives: a new source for heat stress tolerance adaptive traits. Breed. Sci. 67, 248–256. doi: 10.1270/jsbbs.16204
FAO (2015). Food and Agriculture Organization of the United Nations. Available at: http://faostat3 fao.org/home/index.html
Fattash, I., Rooke, R., Wong, A., Hui, C., Luu, T., Bhardwaj, P., et al. (2013). Miniature inverted-repeat transposable elements MITEs0: discovery, distribution and activity. Genome 56, 475–486. doi: 10.1139/gen-2012-0174
Gayathri, M., Shirasawa, K., Varshney, R. K., Pandey, M. K., and Bhat, R. S. (2018). Development of AhMITE1 markers through genome-wide analysis in peanut (Arachis hypogaea L.). BMC. Res. Notes 11:10. doi: 10.1186/s13104-017-3121-8
González, J. M., Rodrigo Cañas, R., Cabeza, A., Ruiz, M., Giraldo, P., and Loarce, Y. (2021). Study of variability in root system architecture of Spanish Triticum turgidum L. subspecies and analysis of the presence of a MITE element inserted in the TtDro1B gene: evolutionary implications. Agronomy 11:2294. doi: 10.3390/agronomy11112294
Gorafi, Y. S. A., Eltayeb, E. L., and Tsujimoto, H. (2016). Alteration of wheat vernalization requirement by alien chromosome-mediated transposition of MITE. Breed. Sci. 66, 181–190. doi: 10.1270/jsbbs.66.181
Han, Y., and Wessler, S. R. (2010). MITE-hunter: a program for discovering miniature inverted-repeat transposable elements from genomic sequences. Nucleic Acids Res 38:e199. doi: 10.1093/nar/gkq862
Hirsch, C. D., and Springer, N. M. (2017). Transposable element influences on gene expression in plants. Biochim. Biophys. Acta. 1860, 157–165. doi: 10.1016/j.bbagrm.2016.05.010
Jiang, N., Feschotte, C., Zhang, X. Y., and Wessler, S. R. (2004). Using rice to understand the origin and amplification of miniature inverted repeat transposable elements (MITEs). Curr. Opin. Plant Biol. 7, 115–119. doi: 10.1016/j.pbi.2004.01.004
Keidar-Friedman, D., Bariah, I., and Kashkush, K. (2018). Genome-wide analyses of miniatureinverted-repeattransposableelementsrevealsnewinsightsinto the evolutionof theTriticum-Aegilops group. PLoS One 13:e0204972. doi: 10.1371/journal.pone.0204972
Konovalov, F. A., Goncharov, N. P., Goryunova, S., Shaturova, A., Proshlyakova, T., and Kudryavtsev, A. (2010). Molecular markers based on LTR retrotransposons BARE-1 and Jeli uncover different strata of evolutionary relationships in diploid wheats. Mol. Genet. Genomics. 283, 551–563. doi: 10.1007/s00438-010-0539-2
Leach, L., Belfield, E. J., Jiang, C., Brown, C., Mithani, A., and Harberd, N. P. (2014). Patterns of homoeologous gene expression shown by RNA sequencing in hexaploid bread wheat. BMC Genomics 15:276. doi: 10.1186/1471-2164-15-276
Li, J., Wang, Z., Peng, H., and Liu, Z. (2014). A MITE insertion into the 3′-UTR regulates the transcription of TaHSP16.9 in common wheat. Crop J. 2, 381–387. doi: 10.1016/j.cj.2014.07.001
Lu, Y.-Z., Wang, L., Yue, H., Wang, M.-X., Deng, P.-C., Edwards, D., et al. (2014). Comparative analysis of stowaway-like miniature inverted repeat transposable elements in wheat group 7 chromosomes: abundance, composition and evolution. J. Syst. Evol. 52, 743–749. doi: 10.1111/jse.12113
Lyons, M., Cardle, L., Rostoks, N., Waugh, R., and Flavell, A. J. (2008). Isolation, analysis and marker utility of novel miniature inverted repeat transposable elements from the barley genome. Mol. Genet. Genomics. 280, 275–285. doi: 10.1007/s00438-008-0363-0
McGurk, M. P., and Barbash, D. A. (2018). Double insertion of transposable elements provides a substrate for the evolution of satellite DNA. Genome Res. 28, 714–725. doi: 10.1101/gr.231472.117
Mondal, S., Hande, P., and Badigannavar, A. M. (2014). Identification of transposable element markers for a rust (Puccinia arachidis Speg.) resistance gene in cultivated peanut. J. Phytopathol. 162, 548–552. doi: 10.1111/jph.12220
Monden, Y., Hara, T., Okada, Y., Jahana, O., Kobayashi, A., Tabuchi, H., et al. (2015). Construction of a linkage map based on retrotransposon insertion polymorphisms in sweet potato via high-throughput sequencing. Breed. Sci. 65, 145–153. doi: 10.1270/jsbbs.65.145
Monden, Y., Naito, K., Okumoto, Y., Saito, H., Oki, N., Tsukiyama, T., et al. (2009). High potential of a transposon mPing as a marker system in japonica × japonica cross in Rice. DNA Res. 16, 131–140. doi: 10.1093/dnares/dsp004
Morata, J., Marin, F., Payet, J., and Casacuberta, J. M. (2018). Plant lineage-specific amplification of transcription factor binding motifs by miniature inverted-repeat transposable elements (MITEs). Genome Biol. Evol. 10, 1210–1220. doi: 10.1093/gbe/evy073
Naito, K., Zhang, F., Tsukiyama, T., Saito, H., Hancock, C. N., Richardson, A. O., et al. (2009). Unexpected consequences of a sudden and massive transposon amplification on rice gene expression. Nature 461, 1130–1134. doi: 10.1038/nature08479
Ogbonnaya, F., Abdalla, O., Mujeeb-Kazi, A., Kazi, A. G., Xu, S. S., Gosman, N., et al. (2013). Synthetic Hexaploids: harnessing species of the primary gene pool for wheat improvement. Plant Breed. Rev. 37, 35–122. doi: 10.1002/9781118497869.ch2
Quesneville, H. (2020). Twenty years of transposable element analysis in the Arabidopsis thaliana genome. Mob. DNA 11:28. doi: 10.1186/s13100-020-00223-x
Sabot, F., Guyot, R., Wicker, T., Chantret, N., Laubin, B., Chalhoub, B., et al. (2005). Updating of transposable element annotations from large wheat genomic sequences reveals diverse activities and gene associations. Mol. Genet. Genomics. 274, 119–130. doi: 10.1007/s00438-005-0012-9
Sampath, P., Murukarthick, J., Izzah, N. K., Lee, J., Choi, H.-I. I., Shirasawa, K., et al. (2014). Genome-wide comparative analysis of 20 miniature inverted-repeat transposable element families in Brassica rapa and B. oleracea. PLoS One 9:e94499. doi: 10.1371/journal.pone.0094499
Shirasawa, K., Hirakawa, H., Tabata, S., Hasegawa, M., Kiyoshima, H., Suzuki, S., et al. (2012). Characterization of active miniature inverted-repeat transposable elements in the peanut genome. Theor. Appl. Genet. 124, 1429–1438. doi: 10.1007/s00122-012-1798-6
Silva, G. (2018). Feeding the World in 2050 and Beyond – Part 1: Productivity Challenges. U.S.A.: Michigan State University Extension.
Tester, M., and Langridge, P. (2010). Breeding technologies to increase crop production in a changing world. Science. 327, 818–822. doi: 10.1126/science.1183700
Tsujimoto, H., Sohail, Q., and Matsuoka, Y. (2015). “Broadening the genetic diversity of common and durum wheat for abiotic stress tolerance breeding,” in Advances in Wheat Genetics: From Genome to Field. eds. Y. Ogihara, S. Takumi, and H. Handa (Tokyo: Springer), 233–238.
Wang, J., Lu, N., Yi, F., and Xiao, Y. (2020). Identification of transposable elements in conifer and their potential application in breeding. Evol. Bioinforma. 16, 117693432093026–117693432093024. doi: 10.1177/1176934320930263
Watanabe, Y. (1962). Studies on the cytological instabilities of common wheat. (in Japanese). Rep. Tohoku Agric. Exp. Stat. 23, 69–152.
Wessler, S. R., Bureau, T. E., and White, S. E. (1995). LTR-retrotranposons and MITEs: important players in the evolution of plant genomes. Curr. Opin. Genet. Dev. 5, 814–821. doi: 10.1016/0959-437X(95)80016-X
Wheat-Wikipedia Available at: https://en.wikipedia.org/wiki/Wheat#cite_note-7 (Accessed May 2016).
Wicker, T., Stritt, C., Sotiropoulous, A. G., Poretti, M., Pozniak, C., Walkowiak, S., et al. (2022). Transposable element populations shed light on the evolutionary history of wheat and the complex co-evolution of autonomous and non-autonomus retrotransposons. Adv. Genet 3:2100022. doi: 10.1002/ggn2.202100022
Yaakov, B., Ben-David, S., and Kashkush, K. (2013). Genome-wide analysis of stowaway-like MITEs in wheat reveals high sequence conservation, gene association, and genomic diversification. Plant Physiol. 161, 486–496. doi: 10.1104/pp.112.204404
Yaakov, B., Ceylan, E., Domb, K., and Kashkush, K. (2012). Marker utility of miniature inverted-repeat transposable elements for wheat biodiversity and evolution. Theor. Appl. Genet. 124, 1365–1373. doi: 10.1007/s00122-012-1793-y
Yaakov, B., and Kashkush, K. (2012). Mobilization of stowaway-like MITEs in newly formed allohexaploid wheat species. Plant Mol. Biol. 80, 419–427. doi: 10.1007/s11103-012-9957-3
Keywords: transposable elements, mite, DNA markers, Dryland, wheat, genome analysis
Citation: Ubi BE, Gorafi YSA, Yaakov B, Monden Y, Kashkush K and Tsujimoto H (2022) Exploiting the miniature inverted-repeat transposable elements insertion polymorphisms as an efficient DNA marker system for genome analysis and evolutionary studies in wheat and related species. Front. Plant Sci. 13:995586. doi: 10.3389/fpls.2022.995586
Edited by:
Ruslan Kalendar, University of Helsinki, FinlandReviewed by:
Yolanda Loarce, University of Alcalá, SpainEva Satovic Vuksic, Rudjer Boskovic Institute, Croatia
Copyright © 2022 Ubi, Gorafi, Yaakov, Monden, Kashkush and Tsujimoto. This is an open-access article distributed under the terms of the Creative Commons Attribution License (CC BY). The use, distribution or reproduction in other forums is permitted, provided the original author(s) and the copyright owner(s) are credited and that the original publication in this journal is cited, in accordance with accepted academic practice. No use, distribution or reproduction is permitted which does not comply with these terms.
*Correspondence: Benjamin Ewa Ubi, dWJpLmJlbmphbWluQHRvdHRvcmktdS5hYy5qcA==; Hisashi Tsujimoto, dHN1amltQHRvdHRvcmktdS5hYy5qcA==
 Benjamin Ewa Ubi
 Yasir Serag Alnor Gorafi
 Beery Yaakov
 Yuki Monden
 Khalil Kashkush
 Hisashi Tsujimoto