 Johanna Leppälä
 Frank Gaupels
 Enjun Xu
 Luis O. Morales
 Jörg Durner
 Mikael Brosché
- 1Organismal and Evolutionary Biology Research Programme, Viikki Plant Science Centre, Faculty of Biological and Environmental Sciences, University of Helsinki, Helsinki, Finland
- 2Institute of Biochemical Plant Pathology, Helmholtz Zentrum München, German Research Center for Environmental Health, Neuherberg, Germany
High doses of ozone (O3) and nitrogen dioxide (NO2) cause damage and cell death in plants. These two gases are among the most harmful air pollutants for ecosystems and therefore it is important to understand how plant resistance or sensitivity to these gases work at the molecular level and its genetic control. We compared transcriptome data from O3 and NO2 fumigations to other cell death related treatments, as well as individual marker gene transcript level in different Arabidopsis thaliana accessions. Our analysis revealed that O3 and NO2 trigger very similar gene expression responses that include genes involved in pathogen resistance, cell death and ethylene signaling. However, we also identified exceptions, for example RBOHF encoding a reactive oxygen species producing RESPIRATORY BURST OXIDASE PROTEIN F. This gene had increased transcript levels by O3 but decreased transcript levels by NO2, showing that plants can identify each of the gases separately and activate distinct signaling pathways. To understand the genetics, we conducted a genome wide association study (GWAS) on O3 and NO2 tolerance of natural Arabidopsis accessions. Sensitivity to both gases seem to be controlled by several independent small effect loci and we did not find an overlap in the significantly associated regions. Further characterization of the GWAS candidate loci identified new regulators of O3 and NO2 induced cell death including ABH1, a protein that functions in abscisic acid signaling, mRNA splicing and miRNA processing. The GWAS results will facilitate further characterization of the control of programmed cell death and differences between oxidative and nitrosative stress in plants.
1 Introduction
Ozone (O3) and nitrogen dioxide (NO2) are common air pollutants that occur in the troposphere, the lowest part of the Earth’s atmosphere. In high concentrations, they cause damage to plants and animals (Middleton, 1961; Brunekreef and Holgate, 2002; Ainsworth, 2017). O3 and nitrogen oxides are amongst the three most harmful air pollutants in terms of damage to ecosystems (The European Environment Agency, 2020). Low to intermediate ppb (parts per billion) levels of O3 are harmful to plants (McGrath et al., 2015). However, NO2 is less toxic than O3, causing reduced plant growth and lesion formation at concentrations in the high ppb to low ppm (parts per million) range (Taylor and Eaton, 1966; Kasten et al., 2016). Several studies indicate large-scale yield loss due to O3 pollution in agriculturally important species, including maize, soybean, rice and wheat (McGrath et al., 2015; Feng et al., 2022b).
The mechanisms leading to damage and cell death after exposure to high levels of O3 are better understood than those of NO2. Both gases enter the plants through the stomatal pores. In the apoplastic space, O3 forms reactive oxygen species (ROS), including superoxide and hydrogen peroxide (Vainonen and Kangasjarvi, 2015). Whether plants tolerate the amount of ROS produced by O3 or initiate cell death depends on antioxidant capacity and the balance of stress hormone signaling. Increased production of ethylene promotes O3 induced cell death in several plant species (Tuomainen et al., 1997; Overmyer et al., 2000; Vahala et al., 2003), whereas jasmonic acid (JA) protects from O3 damage (Rao et al., 2000; Xu et al., 2015a). Salicylic acid (SA) is involved in both promotion of O3 induced cell death as well as activation of defence response to O3 (Rao and Davis, 1999; Xu et al., 2015b). The role of hormones in O3 responses has been studied with A. thaliana mutants such as the JA receptor mutant coi1, and the ethylene overproducing mutant eto1, that are both O3 sensitive (Rao et al., 2002; Xu et al., 2015a). After entering the apoplast, NO2 rapidly reacts with water to produce nitrate, nitrite, nitric oxide (NO), and protons. Especially nitrite and NO are important drivers of NO2 induced cell death in A. thaliana (Kasten et al., 2016). Mutant analyses suggested that signaling by SA enhanced NO2 tolerance whereas JA does not regulate NO2 induced cell death (Kasten et al., 2016). Small molecule antioxidants such as ascorbic acid (vitamin C) are important scavengers of ROS and RNS in plant tissues. Accordingly, the ascorbic acid deficient mutant vtc1 is sensitive to both O3 as well as NO2 (Conklin et al., 1996; Kasten et al., 2016).
Plants produce ROS and reactive nitrogen species (RNS) as second messengers to regulate growth and development, stress responses and long-distance signaling (Waszczak et al., 2018; Hancock and Neill, 2019; Castro et al., 2021). In plant-pathogen signaling, both ROS and NO acts as signal molecules, and are proposed to participate in an amplification loop to enhance signaling (Wang et al., 2018). Further, the balance between ROS and NO signaling regulates programmed cell death (PCD) (Delledonne et al., 2001; Wendehenne et al., 2014) Therefore, at least some effects of O3 and NO2 (or their reactive derivatives) relates to activation of cellular signaling processes. This assumption is supported by increased transcript levels of pathogen responsive and PCD related genes by both O3 and NO2 (Xu et al., 2015a; Mayer et al., 2018). Consequently, exposure to these gasses leads to the establishment of basal pathogen resistance in A. thaliana against the bacterial pathogen Pseudomonas syringae (Sharma et al., 1996; Mayer et al., 2018). Infection with avirulent pathogens elicit the hypersensitive defence response (HR) culminating in localized PCD, thought to restrict pathogen growth (Delledonne et al., 2001; Gaupels et al., 2011; Wang et al., 2013). O3- and NO2-triggered cell death is remarkably similar to HR-PCD since it is also dependent on simultaneous signaling by NO and ROS and is accompanied by the accumulation of fluorescent compounds in dying leaf tissues (Overmyer et al., 2005; Ahlfors et al., 2009; Kasten et al., 2016). Hence, O3 and NO2 cause leaf damage at least partially by activation of PCD (Gandin et al., 2021; Hussain et al., 2022).
Although the damaging effects of O3 and NO2 have been assessed in several studies, much less is known about the genetic factors controlling tolerance of plants to these pollutants. Regulation of O3 and NO2 responses in A. thaliana has mostly been studied in the genetic background Col-0 (Overmyer et al., 2008; Frank et al., 2019). Natural accessions of A. thaliana show large variation in their O3 sensitivity (Brosche et al., 2010). For instance, Cvi-0 is very sensitive but Col-0 rather tolerant to 300-350 ppb O3 for 6 h (Brosche et al., 2010). By studying naturally occurring variation for stress tolerance in multiple accessions, instead of a mutant approach in a single genetic background, it is possible to gain broader understanding of the underlying genetics. Natural variation can be explored with a genome wide association study (GWAS). This approach takes advantage of naturally occurring genetic recombination events to associate phenotypes of accessions with single nucleotide polymorphisms (SNPs) in close genomic vicinity of causative genes. The 1001 Genomes project has provided genome sequences of more than a thousand natural A. thaliana accessions and this data is available for use as genetic markers for GWAS (Alonso-Blanco et al., 2016).
To further understand how O3 and NO2 regulates defence signaling and cell death, we used two complementary approaches; transcriptome analysis and GWAS. The transcriptional responses to O3 and NO2 treatments were previously analysed individually (Brosche et al., 2014; Xu et al., 2015a; Mayer et al., 2018), and here we systematically identify the regulatory context of O3 and NO2. In a comparison of different transcriptome datasets, we found very high overlaps of differentially expressed genes regulated by O3 and NO2. With real time quantitative PCR (qPCR) we confirmed that both gasses activated similar signaling in different A. thaliana accessions. However, we also identified a marker gene with differential O3 versus NO2 response, demonstrating that A. thaliana can activate precise signal activation to each gas. We continued with GWAS for O3 and NO2 leaf damage with up to 372 A. thaliana natural accessions. We identified 12 genomic loci associated with O3 and NO2 induced leaf damage. Experiments with T-DNA knock-out mutants suggest functions of several GWAS-derived candidate genes in O3 and NO2 sensitivity.
2 Materials and methods
2.1 Plant material
Altogether 372 A. thaliana accessions (Supplementary Table S1) were selected so that their genotypes were available from 250k SNP chip (Atwell et al., 2010). The accessions were a subset of the 1135 accessions sequenced by the 1001 Genomes Consortium (http://1001genomes.org/), and the population structure was described earlier (Alonso-Blanco et al., 2016). The seeds for natural accessions were obtained from the Nottingham Arabidopsis Stock Centre (Supplementary Table S1). Mutant seeds were obtained from the Nottingham Arabidopsis Stock Centre or were donated by Dr. Patricia Conklin (vtc1-1), Dr. Heribert Hirt (mpk6), Dr. John Turner (coi1-16) or were EMS mutants from Helsinki (rcd1-1, slac1-1 (Overmyer et al., 2000; Vahisalu et al., 2008)).
2.2 Growth conditions
Experiments were performed in Helsinki and Munich. Plants in Helsinki were grown in 1:1 peat-vermiculite under 280 µmol m2 s-1 white light irradiance, 12 h : 12 h light-dark –cycle, 23°C/19°C (day/night) temperature and 70%/90% relative humidity. In Munich plants were grown in 5:1 Floradur propagation substrate - quartz sand, in walk-in size chambers, under 250 μmol m2 s-1; PAR, 12 h : 12 h light-dark –cycle, 23°C/18°C (day/night) temperature and 70%/90% relative humidity. Plants grew faster in Munich than in Helsinki, possibly due to small differences in light and soil quality. However, plants were exposed to O3 in Munich and Helsinki at a similar developmental stage (estimated by counting leaf numbers of the control plants Col-0 and Cvi-0). Therefore, plants were treated with O3 approximately 4 days younger in Munich than in Helsinki.
2.2.1 O3 fumigations in Helsinki
372 accessions at the age of 23 days were exposed to 400 ppb of O3 for 6 has described previously (Brosche et al., 2010). All treatments were started in the morning after approximately 2 h of light exposure. There were 8 plants of each genotype in one replicate. 23 accessions with controls could be treated simultaneously. Each genotype was present in two to three replicates. The O3 phenotype was scored as number of injured leaves from all leaves relative to damage in Col-0.
2.2.2 O3 fumigations in Munich
All 127 accessions were treated simultaneously in a single fumigation chamber. Five 19 days-old plants of every accession were fumigated for 6 h with 350 ppb of O3. The experiment was replicated twice.
2.2.3 NO2 fumigations in Munich
Three 24-28 days-old plants of 216 accessions were exposed to NO2 for 1 h in an air-tight fumigation chamber as reported earlier (Frank et al., 2019). Plants were short-term fumigated for 1 h with 10, 20 and 30 ppm of NO2. This range of concentrations was chosen as sensitive plants were damaged already with 10 ppm whereas tolerant plants displayed only weak symptoms even after 30 ppm of NO2. The NO2 phenotype was scored as percent leaf area damaged (0% = score 1, <25% = score 2, 25-50% = 3, 50-75% = 4, >75% = 5). A cumulative score (scale from 3 to 15) from all three fumigations was used in further analyses. The experiment was repeated three times.
2.3 Analysis of public gene expression data
Hierarchical clustering was done with publicly available data (Supplementary Table S2). The raw data were processed with robust multiarray average normalization using Bioconductor limma and affy packages in R. Gene expression was summarized by calculating log2 ratio of the treatment/mutant and control/wild type expression. Bayesian hierarchical clustering method was used (as described in (Wrzaczek et al., 2010)) with 1000 bootstrap resampling.
To compare similarities in O3 and NO2 transcriptomes we used data from exposures of A. thaliana Col-0 to 350 ppb O3 for 2 h (RNA-seq analysis) (Xu et al., 2015a; Xu et al., 2015b) and 10 ppm NO2 for 1 h (microarray analysis) (Mayer et al., 2018), or a NO experiment with the donor S-nitrosocysteine (1 mM, 6 h timepoint) (Hussain et al., 2016). Analysis of RNA-seq data is described in the Supplementary Methods. GO-term enrichment was performed in R (R Core Team, 2018), version 3.5.0, using the package clusterProfiler (Yu et al., 2012). Venn diagrams were constructed using jvenn software (Bardou et al., 2014).
2.4 Real time reverse transcriptase quantitative PCR (qPCR)
Nine accessions were grown for qPCR analysis in Munich facilities in similar environmental and soil conditions as for GWAS. Plants were treated with 350 ppb O3 or 10 ppm NO2 at the age of three weeks. Three plants per genotype were collected and pooled in liquid nitrogen 2 h after the start of fumigations. RNA isolation, cDNA synthesis and qPCR were performed as described (Xu et al., 2015a). Normalization of the data was performed in qBase 2.0 [Biogazelle, (Hellemans et al., 2007)], with three reference genes SAND, TIP41 and YLS8 (Czechowski et al., 2005) The whole experiment was replicated three times. Primer sequences and amplification efficiencies can be found in Supplementary Table S3.
2.5 Genome-wide association studies
The GWA analyses were performed for the maximum numbers of phenotyped accessions for each trait, as well as separately for the set of accessions that was shared between all three experiments (119 accessions). The phenotype data from NO2 treatment was nearly normally distributed but the phenotype data from both O3 experiments were skewed as there were more tolerant accessions compared to sensitive. No transformations were used as these did not provide normality for the phenotypic data. Before the full genome data was available, the O3 datasets were analysed with 250K SNP array data (Kim et al., 2007; Atwell et al., 2010) with EMMAX (Kang et al., 2010), from where some candidate genes were identified based on their biological function. The main GWA analyses of the damage screens were conducted in GWA-portal (http://gwas.gmi.oeaw.ac.at/, predecessor GWAPP by (Seren et al., 2012)), where imputed full genome data (Cao et al., 2011; Gan et al., 2011; Long et al., 2013), could be used for association analysis. The numbers of investigated SNPs were 4.1 million for 119 common accessions (O3 and NO2), 5.5 million for 372 accessions (O3 Helsinki), 4.3 million for 127 accessions (O3 Munich) and 4.9 million for 216 accessions (NO2). The average SNP density in our GWA analyses was around one SNP per 25 base pairs, which should provide a very good coverage of the genome, even though linkage disequilibrium decays rapidly (on average within 10 kb (Kim et al., 2007)). We did not perform filtering based on minor allele frequency, but included all the SNPs in the analysis, as we wanted to include rare variants that play a role in O3 sensitivity (Jakobson et al., 2016). Both non-parametric Kruskal-Wallis and accelerated mixed model (AMM) approaches were used. As variants truly associated with the traits of interest may occur in certain populations and therefore be correlated with population structure, we present data from Kruskal-Wallis tests, which does not correct for the population structure. AMM uses a linear mixed model approach that was developed by Kang et al. which corrects for population structure and genetic relatedness in association mapping (Kang et al., 2008; Kang et al., 2010).
2.6 Ion leakage of T-DNA mutant lines
To verify genomic regions identified by GWA, T-DNA lines (in Col-0 accession) of candidate genes were tested for O3 and NO2 sensitivity. As candidate genes we included all the genes that had SNPs in high linkage disequilibrium (r2 > 0.8) with the Bonferroni corrected significant SNPs, as well as two genes that were selected based on their biological functions from the analysis with 250K SNP array data (Table 1). The mutant lines are described in more detail in Supplementary Table S4. The T-DNA mutant lines were selected to have inserts in exons and were confirmed by PCR to be homozygous for the insert (PCR primers used for genotyping in Supplementary Table S4). Plants for ion leakage experiments were grown as described earlier and fumigated with O3 (350 ppb, 6 h) in Helsinki and NO2 (10 ppm for 6 h or 30 ppm for 1 h) in Munich. Ion leakage was performed as earlier (Brosche et al., 2014; Kasten et al., 2016). The experiments were repeated at least three times. Statistical analysis of the ion leakage measurements was done with linear mixed models in R 3.4.3 (R Core Team, 2018), with lme4 package. As several mutant lines were compared to the same control (Col-0), we used Dunnett’s test, with multcomp package, to evaluate which comparisons were significant.
Table 1 Identified GWAS candidate genes, -log10 P-value of the most significant SNP in the regions, minor allele frequency and count of the most significant SNPs, significant differences in ion leakage measurements of the candidate gene mutants relative to Col-0 control after NO2 and O3 fumigations.
3 Results
3.1 O3 and NO2 trigger the expression of genes related to cell death and pathogen resistance
ROS and RNS act as signals in plant stress responses, pathogen resistance, and PCD (Delledonne et al., 2001; Wang et al., 2013; Xu et al., 2015a; Mayer et al., 2018). To place O3- and NO2-induced transcriptome changes into the context of PCD, we performed Bayesian hierarchical clustering with all genes from the gene ontology (GO) category cell death (Figure 1A). Transcriptome datasets included both air pollutants, cell death in lesion mimic mutants, pathogen infection and hormone treatments (for a full list of experiments see Supplementary Table S2). The three resulting clusters (Figure 1A) contained genes with strongly increased (cluster I), decreased (II), or weakly increased (III) transcript levels. In cluster I, there were large similarities between exposure to 350 ppb O3 (2 h), 10 ppm NO2 (1 h), pathogen infections (Botrytis cinerea, Pseudomonas syringae pv. maculicola) and lesion mimic mutants that undergo spontaneous cell death (acd11, mkk1 mkk2, siz1, ssi2). This highlights that the O3 and NO2 treatments trigger similar signaling pathways as those activated during pathogen infection and cell death.
Figure 1 Comparison of O3 and NO2 transcriptional profiles. (A) Bayesian hierarchical clustering of genes from the gene ontology category cell death. Datasets were selected from NO2 and O3 treatments, pathogen and hormone treatments, and lesion mimic mutants that develop PCD lesions (see Supplementary Table 2 for more details). Values are log2 -transformed fold changes in gene expression. Magenta and green indicate increased and decreased (respectively) gene expression compared to untreated or wild type control plants. (B) Comparison of differentially expressed genes after O3 2 h and NO2 1 h (see also Supplementary Table S5). (C) Overlap in significantly enriched GO Biological processes between O3 and NO2.
To explore the overlap in transcriptional regulation between O3 and NO2, we used transcriptome data from exposures of A. thaliana Col-0 to 350 ppb O3 for 2 h (Xu et al., 2015b) and 10 ppm NO2 for 1 h (Mayer et al., 2018) (Supplementary Table S5). In this comparison 1534 genes were >2-fold up- and 1016 genes down-regulated by both gases (Figure 1B), i.e >55% of the genes regulated by NO2 were also responsive to O3 and vice versa. GO term enrichment analysis revealed that O3 and NO2 activated similar biological processes (Figure 1C) including “regulation of immune response”, “regulation of plant-type hypersensitive response”, “respiratory burst”, and “response to ethylene”. In sum, O3 and NO2 transcriptionally regulate largely overlapping sets of genes involved in pathogen resistance, cell death, and ethylene signaling.
As NO is a main component in RNS signaling (Delledonne et al., 2001; Kasten et al., 2016), we also made transcriptome comparisons between O3 and treatment with the NO-donor S-nitrosocysteine (Hussain et al., 2016). Similar to the O3-NO2 comparison, O3 and S-nitrosocysteine regulated genes showed a large overlap with more than 6000 genes regulated by both treatments (Supplementary Figure S1A). GO enrichment showed that many aspects of defense signaling (including “phosphorelay signal transduction system”, “response to ROS” and “regulation of response to biotic stimulus”) were found among the genes with increased expression by both treatments (Supplementary Table S6).
3.2 O3- and NO2-induced defence transcriptional responses is similar between A. thaliana natural accessions, with notable exceptions
One drawback in the re-analysis of transcriptome data from different laboratories is that the experiments are heterogeneous in terms of plant growth conditions and treatments. Moreover, the transcriptome data shown in Figure 1 mainly originate from experiments with A. thaliana Col-0, and thus, might not reflect the natural variation within A. thaliana accessions. To address these issues, we grew and treated a set of accessions under controlled conditions followed by transcript level analysis using real time quantitative PCR (qPCR). The selected accessions covered different O3 sensitivities (e.g. Ts-1 is O3 tolerant and Cvi-0 O3 sensitive), natural habitats, and genetic distances (Cvi-0 is more distantly related to other accessions [Alonso-Blanco et al., 2016)]. The plants were treated with 350 ppb O3 and 10 ppm NO2 as these treatments induced largely overlapping sets of genes in Col-0 (Figure 1).
For qPCR analysis (Figure 2), we selected marker genes from the GO category cell death that also has been used as marker genes for the stress hormones SA, JA and ethylene. The ethylene/JA marker genes CEJ1 (COOPERATIVELY REGULATED BY ETHYLENE AND JASMONATE 1) and RAP2.6 (RELATED TO AP2.6 (Krishnaswamy et al., 2011)) had increased transcript levels and were regulated similarly by both gases in all accessions. The SA marker gene GRX480 (GLUTAREDOXIN 480; (Caarls et al., 2015) and systemic signaling FMO1 (FLAVIN-DEPENDENT MONOOXYGENASE 1 (Hartmann et al., 2018), had increased transcript levels by both treatments, which were significantly higher by O3 compared to NO2. Transcript levels for RBOHF (RESPIRATORY BURST OXIDASE HOMOLOG F), encoding a ROS producing enzyme, increased after O3 but decreased after NO2 treatment (Figure 2). This represented the most contrasting effect of the two gases.
Figure 2 Transcript levels after NO2 and O3 treatments in different accessions. Transcript levels of five marker genes was measured with qPCR in natural accessions of A. thaliana 2 h after treatments with NO2 (left column) and O3 (right column). Log2 –transformed fold change of marker genes in natural accessions are shown from three biological replicates. Statistical analysis was performed with a linear mixed model (P < 0.05). Letters from a to e represent comparison of NO2 treatment effect, and letters from A to D O3 treatment effect, on different genotypes. Asterisks (*) represent statistical differences between NO2 and O3 treatments on each genotype. Error bars display standard deviation. The accessions were selected to include genotypes with differential NO2 and O3 damage phenotypes (see also Figure 3A).
Overall, four of five studied marker genes had increased transcript levels by both pollutants with O3 having a slightly stronger impact than NO2. There were no major differences between tolerant or sensitive accessions. For instance, the tolerant accession Ost-0 showed very similar transcript profiles as the sensitive accession Cvi-0. Taken together, Figures 1, 2 support the conclusion that O3 and NO2 trigger the expression of similar sets of defence- and cell death-related genes also in different A. thaliana accessions. However, the very contrasting regulation of RBOHF (increased transcript levels by O3 and decreased transcript levels by NO2), show that in addition to common signaling pathways induced by both gases, there is a mechanism by which A. thaliana can perceive and initiate signaling that is unique for O3 versus NO2.
3.3 O3- and NO2-induced leaf symptoms are similar between accessions
Natural accessions show a wide range of O3 tolerance versus sensitivity (Brosche et al., 2010). As the transcriptome data (Figure 1B, Supplementary Tables S5 and S6) has high overlap in O3 and NO2 induced biological mechanisms, we evaluated whether different accessions developed similar damage to O3 and NO2. Ts-1, Ost-0, and Col-0 were tolerant while Bsch-0, Li-3, and Cvi-0 were sensitive to both pollutants. NFA-8 and Shahdara had intermediate phenotypes, e.g. Shahdara was clearly sensitive to O3 in Helsinki conditions, less so in Munich and neither sensitive nor tolerant for NO2. Je-0 had a differential phenotype since it was rather tolerant to NO2 but clearly sensitive to O3 (Figure 3A).
Figure 3 O3 injury and NO2 injury phenotypes of different accessions. (A) Images of clean air control, 6h of 10 ppm of NO2 treated and 6h of 350 ppb O3 treated accessions in Munich. (B) Overlap of accessions used in the different O3 and NO2 treatments. (C) O3 injury phenotypes (percentage of damaged leaves relative to Col-0) in Munich of the 119 common accessions are plotted against O3 injury phenotypes in Helsinki. (D) NO2 injury phenotypes (cumulative score) are plotted against O3 injury phenotypes in Munich. The O3 phenotypes are from two biological repeats of O3 fumigations (350 ppm, 6h), with 5 plants (Munich) or 8 plants (Helsinki) per accession (see Supplementary Table S7 for the scores for each accession). O3 sensitivity was quantified as O3‐induced visible leaf injury (number of leaves with damage/total leaves, displayed as percentages and normalized to Col-0). The NO2 phenotypes are visible injury scores from three fumigations (10, 20 and 30 ppm) with 3 plants per accession. The cumulative score is on a scale from 3 to 15. Spearman’s correlation coefficients (rs) are presented on the bottom right corner (C, D). The accessions Col-0 and Cvi-0, which were included in all treatments and repeats, are highlighted in blue and red, respectively.
We extended the investigation of O3- and NO2-related leaf phenotypes to large sets of accessions (Supplementary Table S1). Independent O3 damage screens took place in Helsinki where 372 accessions were treated for 6 h with 400 ppb O3 and in Munich where 127 accessions received 350 ppb O3 for 6 h. In both experiments results of the damage score (% of leaf area damaged) did not show normal distribution because tolerant accessions were overrepresented. In Munich, 216 accessions were treated with 10, 20, or 30 ppm NO2 for 1 h. This treatment scheme facilitated a fine-tuned and nearly normally distributed rating of NO2 leaf damage.
A subset of 119 accessions was common for all three experiments (Figure 3B), which allowed us to compare damage from O3 and NO2, as well as the comparison of O3 damage at two different facilities. Altogether, the tested accessions exhibited large phenotypic variation after fumigation with O3 or NO2 (Figure 3, Supplementary Table S7). Scatter plots revealed a significant correlation in the extent of lesion formation between both O3 experiments (Spearman’s correlation coefficient rs = 0.45, P = 2.4 x 10⁻⁷, Figure 3C). Likewise, the phenotypes caused by the O3 and NO2 fumigations in Munich showed a good correlation (rs =0.32, P = 3.7 x 10⁻⁴, Figure 3D) although several accessions had differential sensitivities to both pollutants including Je-0 (Figure 3A, see Supplementary Table S7 for further examples).
3.4 Identification of candidate genes involved in phenotypic responses to O3 and NO2 using GWAS
We used the leaf damage scores for the 119 accessions common to all three fumigation screens to perform GWAS, and to identify and compare SNPs associated with O3- and NO2-induced phenotypes. From GWAS, the P-values are a measure of association strength between SNPs and leaf damage of the different accessions. The analysis included both the non-parametric Kruskal-Wallis (KW) test and the accelerated mixed model (AMM) analysis that corrects for population structure. As a final outcome, this led to the identification of genes containing SNPs - or being within high linkage disequilibrium (LD) of SNPs - that were significantly associated with the damage score (Figure 4 and Table 1). Overall, Bonferroni-adjusted AMM statistics identified three significant SNPs (with -log10 P-values higher than 8) from the three O3 and NO2 experiments with the common 119 accessions (Figure 4A). In the Helsinki dataset, a single associated SNP was found in the 5’ UTR of AT3G61410 coding for a U-box kinase family protein. Two of these SNPs were significantly associated with O3 induced leaf damage in the Munich dataset (Figure 4A), where the smallest P-value SNPs were in an intergenic region closest to a gene with unknown function AT2G43795 and adjacent to MPK6 (MAP KINASE 6).
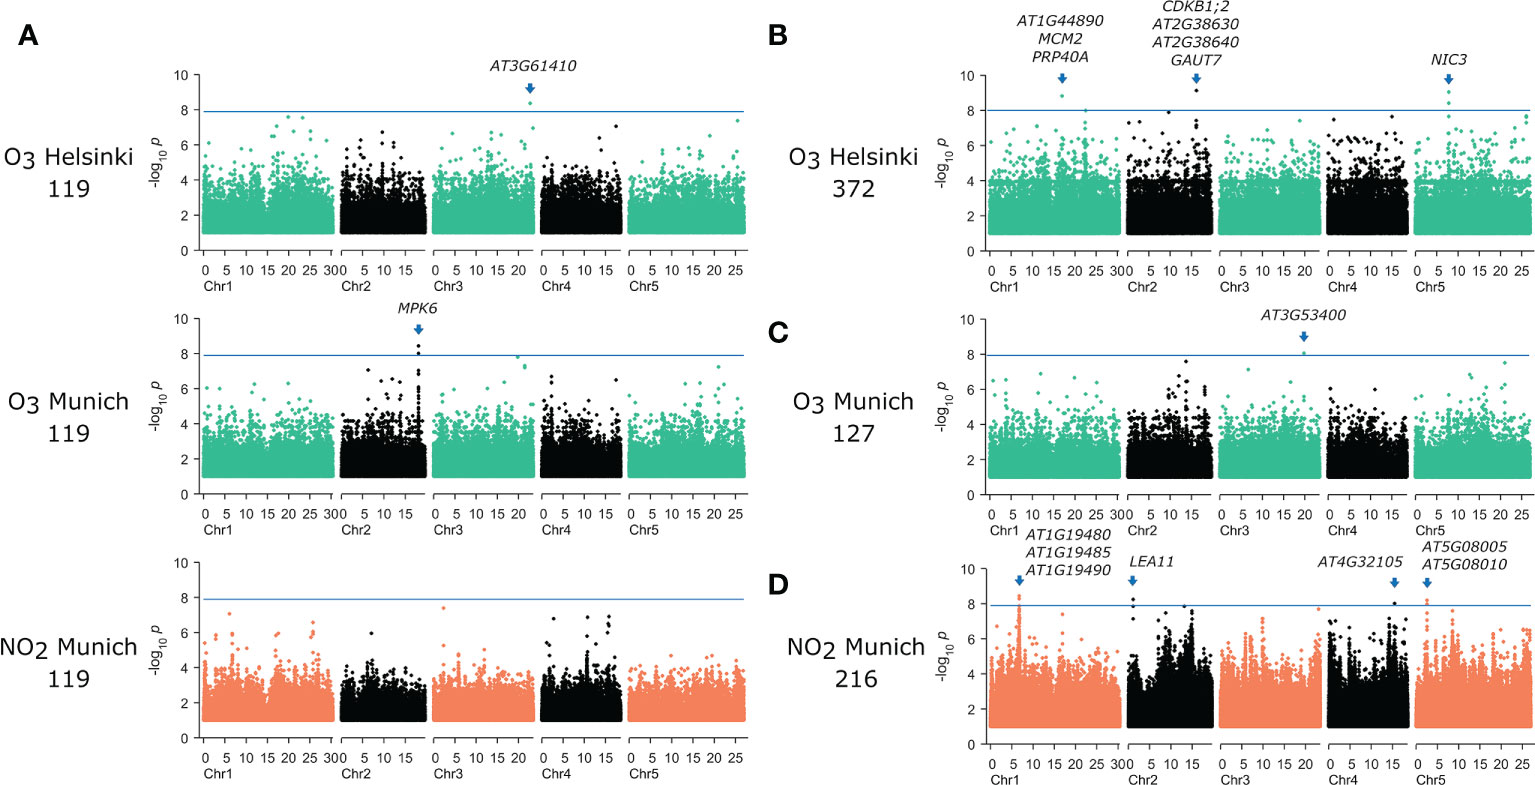
Figure 4 Manhattan plots of GWAS results. Results (A) from accelerated mixed model (AMM) analysis with the common set of 119 accessions in the three different experiments, (B) with 372 accessions treated with O3 in Helsinki, (C) 127 accessions treated with O3 in Munich and (D) results from non-parametric Kruskall-Wallis tests (KW) of 216 accessions treated with NO2. The horizontal line corresponds to Bonferroni corrected P < 0.05 significance threshold. Genes with significant SNPs are marked with an arrow. The SNPs are plotted according to their physical order in the chromosomes. The Mb distance is marked in below each chromosome.
Subsequently, GWAS was performed on each individual dataset, with full number of accessions phenotyped, which identified additional SNPs significantly associated with O3-induced leaf phenotypes (Table 1). The AMM analysis of the O3/Helsinki full dataset (372 accessions) uncovered several non-synonymous SNPs in the coding sequence of NIC3 (NICOTINAMIDASE 3), two significant SNPs upstream of the 5’ UTR of PRP40A (PRE-MRNA-PROCESSING PROTEIN 40A), and one significant SNP upstream of AT1G44890. Localized between the latter two genes, MCM2 (MINICHROMOSOME MAINTENANCE 2) exhibited a high linkage disequilibrium (LD) with the respective SNPs. Further SNPs were found in an intergenic region of chromosome 2 between the two genes AT2G38630 and AT2G38640. All these SNPs had low minor allele frequencies (MAF) < 0.03, and thus represent rare SNPs in the studied set of accessions. AMM analysis of the O3/Munich full dataset (127 accessions) detected an additional SNP associated with the extent of O3-induced leaf damage in the 3’ UTR of AT3G53400. However, GWAS with the KW test did not result in the identification of SNPs in either O3 datasets (Supplementary Table S8).
GWAS of the full NO2 dataset with 216 accessions did not reveal any significant SNPs using AMM analysis (Supplementary Table S8). However, when applying the KW test tens of SNPs in chromosome 1 showed significant association with the leaf damage score. The smallest P-value SNPs were localized in genes coding for a DNA glycosylase (AT1G19480), Transducin/WD40 repeat-like superfamily (AT1G19485), and a basic-leucine zipper transcription factor (AT1G19490). Other significantly phenotype-associated SNPs were in the coding sequences of AT2G03740 and AT4G32105 and on chromosome 5 between the genes AT5G08005 and AT5G08010.
We performed an additional GWAS with genotype data from a 250K SNP array (Kim et al., 2007; Atwell et al., 2010). Here, several genes, including ABH1 (ABA HYPERSENSITIVE 1/CAP-BINDING PROTEIN 80) and CNGC1 (CYCLIC NUCLEOTIDE GATED CHANNEL 1) were associated with O3 damage (Supplementary Figure S2, Table 1).
In GWAS multiple testing correction is commonly used to provide fewer false positives (here Bonferroni adjustment). To allow comparisons between treatments, in subsequent analysis we also included SNPs with lower P-values. SNPs from the two O3 experiments revealed no common SNPs with -log10 P-values > 8, whereas 3 SNPs and 341 SNPs were shared with -log10 P-values > 6 and > 4 (Figure 5A, Supplementary Table S8). Altogether 47 (O3 Helsinki) and 63 (O3 Munich) SNPs showed -log10 P-values > 6 and 1716 and 1681 SNPs showed -log10 P-values > 4, respectively. Surprisingly, plotting the GWAS results of the NO2 experiment against those of the O3 experiments showed no shared SNPs with -log10 P-values > 4 (Figures 5B, C). In sum, the GWAS indicated very few genomic regions containing SNPs that have strong associations with O3 or NO2 leaf damage. Instead, there were many weak associations with O3 and NO2 sensitivity, and no overlap of SNPs between O3 and NO2 treatments.
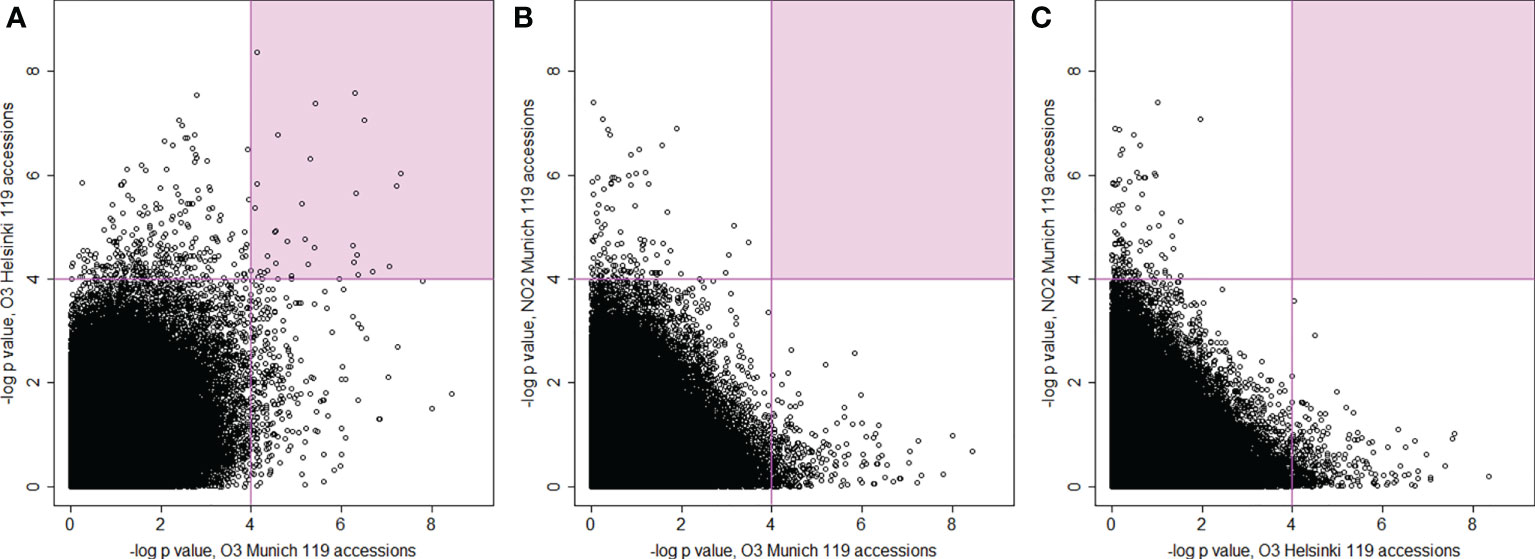
Figure 5 Scatterplots for the comparison and correlations between –log10 P-values of SNPs from genome-wide association analysis (AMM) between the three experiments with 119 common accessions. (A) plotted P-values from O3 fumigations conducted in Munich (x-axis) and in Helsinki (y-axis), (B) plotted P-values from O3 fumigations in Munich (x-axis) and NO2 fumigations (y-axis), (C) plotted P-values from O3 fumigations in Helsinki (x-axis) and NO2 fumigations (y-axis). The areas with the smallest P-values (–log10 P-value > 4) have coloured background.
3.5 Phenotyping of T-DNA insertion lines and O3 sensitive mutants
We identified T-DNA insertion mutants for several GWAS candidate genes (for location of T-DNA inserts within the genes, see Supplementary Figure S3). We mainly selected based on P-values (Table 1), but for P-values with lower significance we also included candidate genes with biological functions related to plant defense responses. We measured the extent of damage as relative ion leakage after treatment for 6 h with 350 ppb O3 or 10 ppm NO2 (Table 1, Figure 6 and original data in Supplementary Table S9). Relative ion leakage provides a better presentation of the data as the O3 experiment was done in Helsinki and the NO2 experiment in Munich. Col-0 was set as the baseline as all the mutants were in Col-0 background. Therefore, mutant line more sensitive than Col-0 have positive ion leakage values and more tolerant negative values.
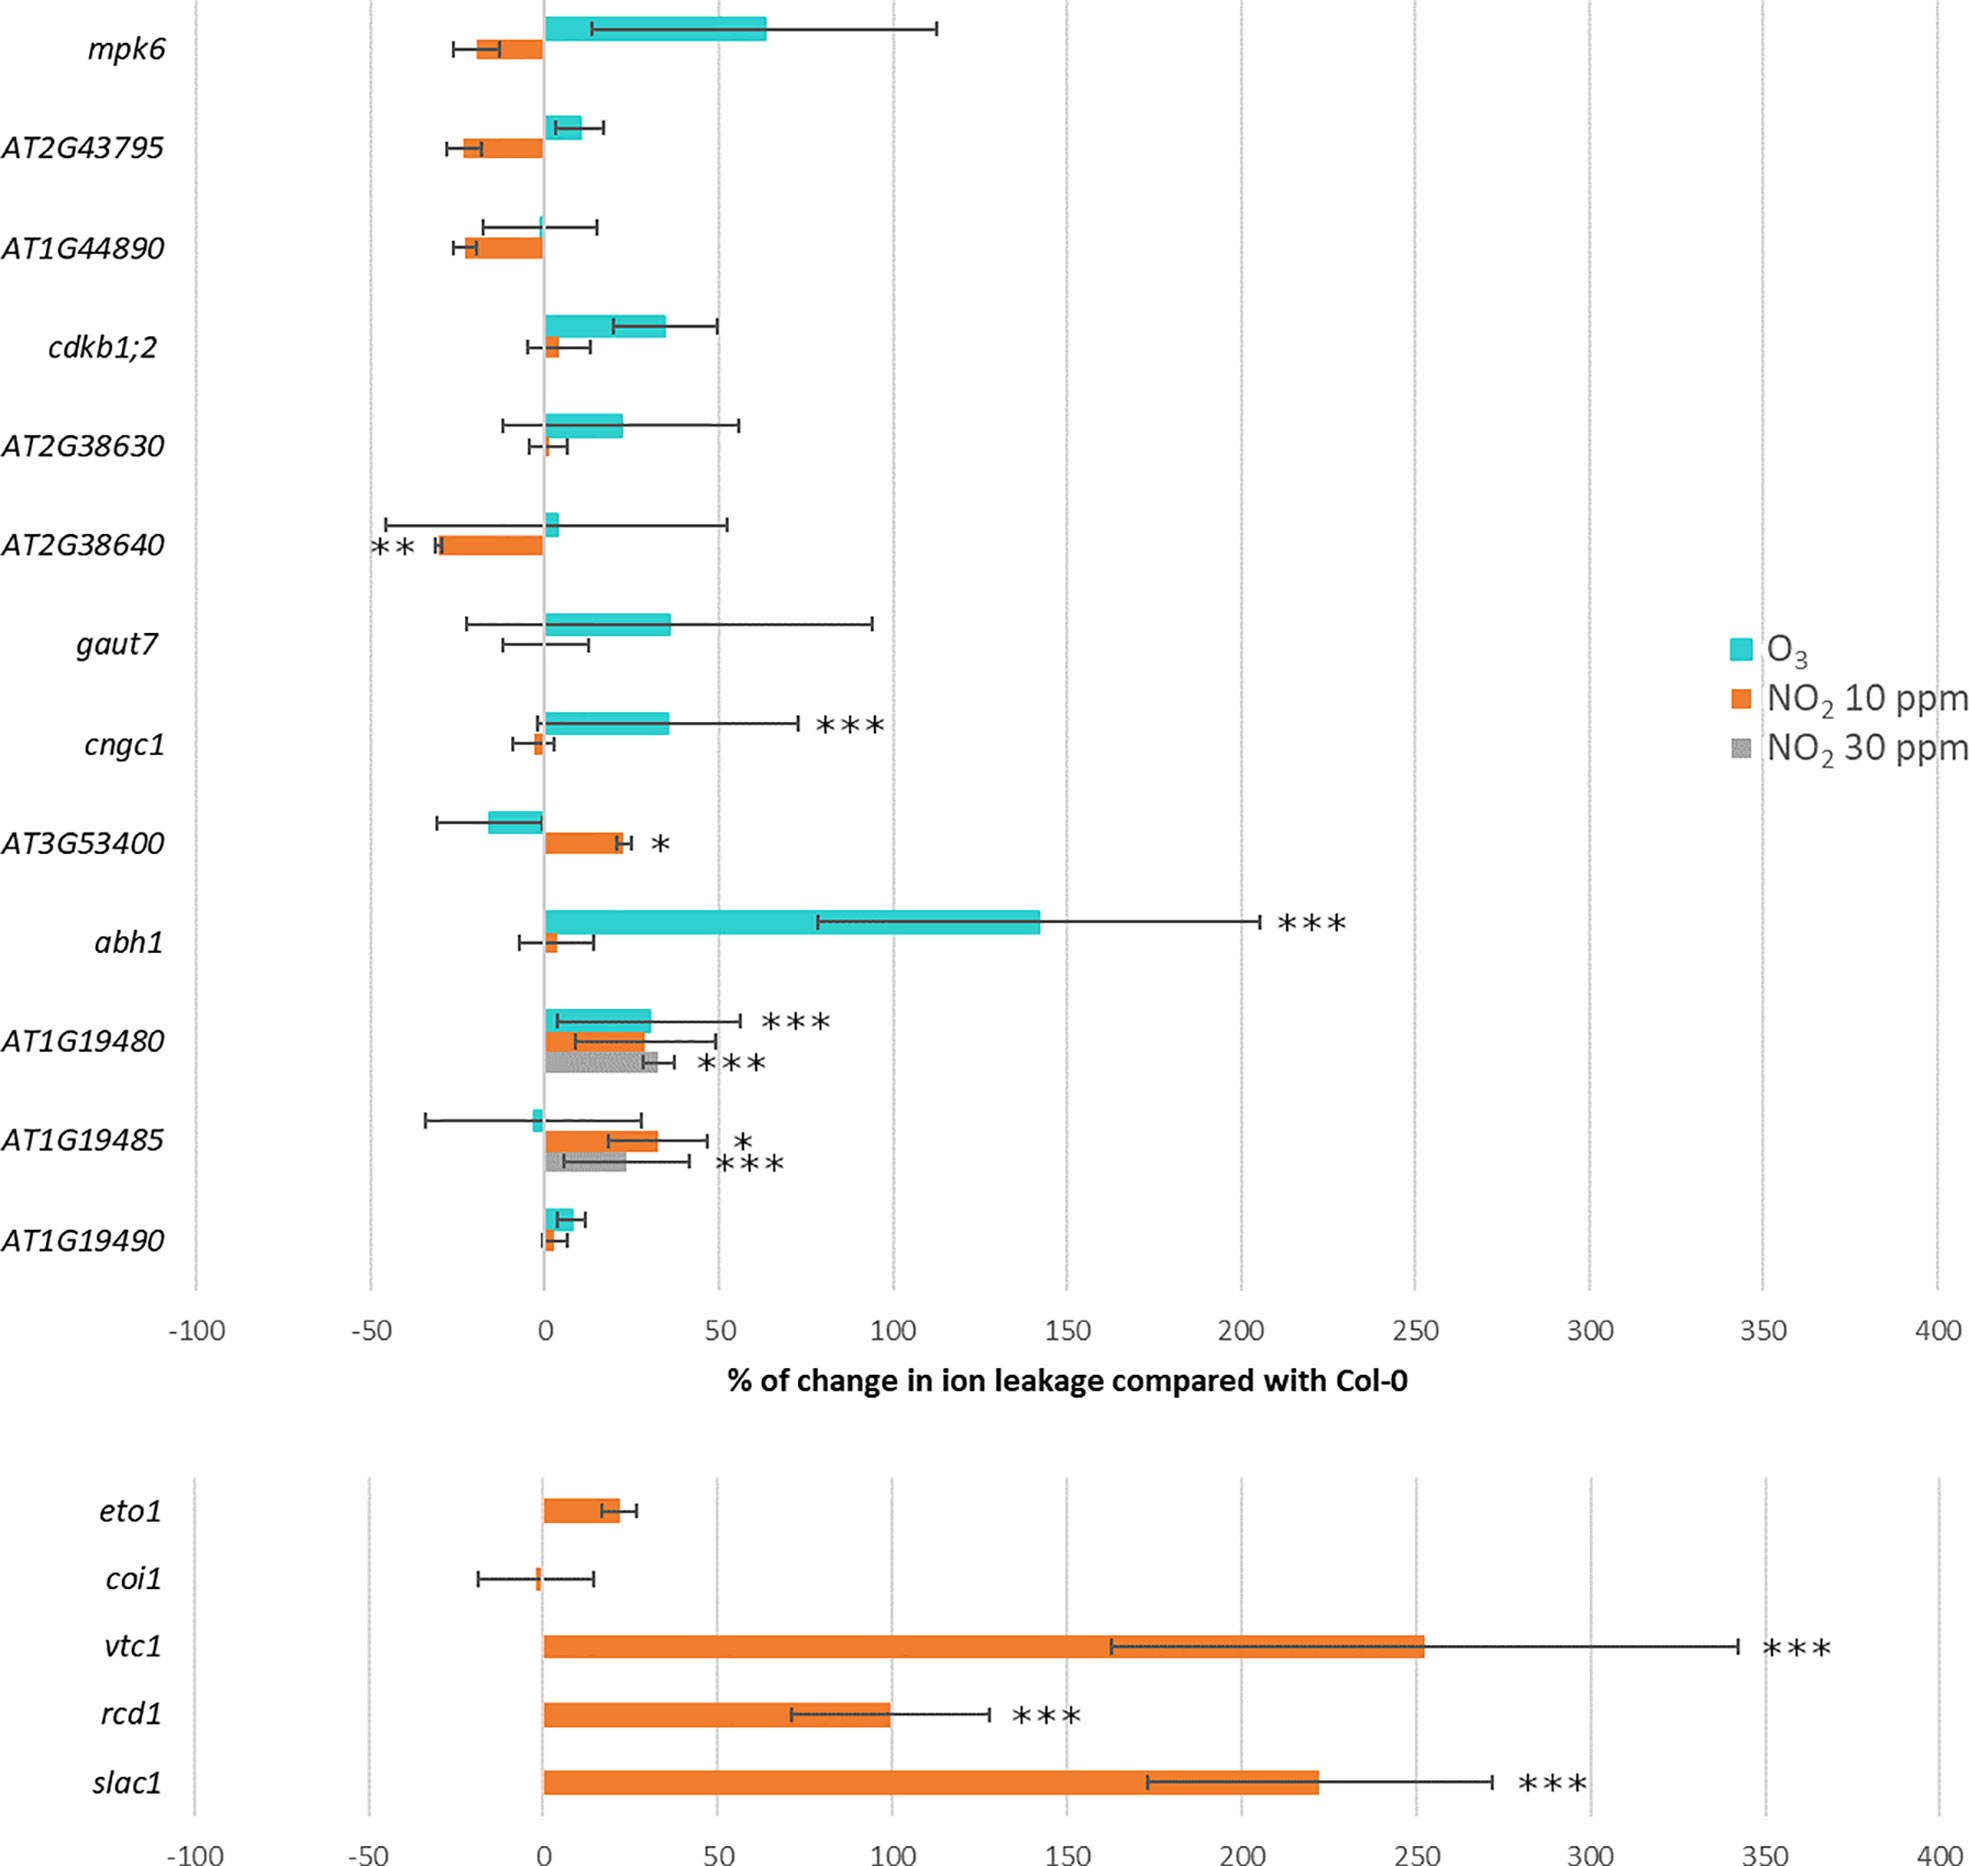
Figure 6 Percentage of change in ion leakage in GWAS candidate mutants (the upper part) and known O3 sensitive mutants (the lower part of the figure) relative to Col-0. Treatment with 350 ppb of O3 for 6h is marked in turquoise, 10 ppm of NO2 for 6h in orange and 30 ppm of NO2 for 1h in gray. Statistical significance is marked with asterisks: ***P < 0.001, **P < 0.01 and *P < 0.05.
Of the selected O3 candidate genes, abh1 and cngc1 were O3 sensitive (Supplementary Figure S4), whereas At3g53400 was NO2 sensitive and At2g38640 more tolerant to NO2 than the background accession Col-0. For mpk6 and five other mutants no significant change in ion leakage was observed compared to Col-0. Among the three NO2 candidate genes tested, mutant lines with T-DNA insertions in AT1G19480 and AT1G19485 were O3 and NO2 sensitive, respectively. Next, we asked whether higher NO2 concentrations would improve the detection of altered mutant phenotypes. Therefore, we exposed Col-0 to 30 ppm NO2 which resulted in 50-65% ion leakage. With this treatment two tested NO2 candidate were shown to be NO2 sensitive (AT1G19480 and AT1G19485). While we could measure statistically significant changes in ion leakages for some of the mutants selected from GWAS candidates, overall these changes were small compared to the cell death found in O3 or NO2 sensitive mutants in Col-0 background (Brosche et al., 2014; Xu et al., 2015a; Kasten et al., 2016). This is in line with the overall GWAS results, i.e. O3 and NO2 damage in natural accessions are associated with many small effect loci rather than major effect loci.
Previously published O3 sensitive mutants include ascorbate-deficient vtc1 (Conklin et al., 1996), ethylene overproducer eto1 (Rao et al., 2002), transcriptional co-regulator rcd1 (Overmyer et al., 2000; Brosche et al., 2014), JA receptor coi1 (Xu et al., 2015a) and guard cell S-anion channel slac1 (Vahisalu et al., 2008). To allow a direct comparison of damage in mutants for GWAS candidates with the previously identified mutants, we used five O3 sensitive mutants and performed ion leakage with 10 ppm NO2 (we did not repeat the O3 damage for these mutants, as they are extensively characterized in previous publications). The rcd1, vtc1 and slac1 mutants were strongly NO2 sensitive, whereas eto1 and coi1 were not (Figure 6). Kasten et al. (2016) tested 30 ppm NO2 dose for these mutants and eto1 showed a NO2 sensitivity phenotype whereas coi1 was similar to Col-0. In sum, the phenotyping of GWAS T-DNA mutant lines and O3 sensitive mutants indicated that O3- and NO2-induced leaf damage was controlled by partially overlapping sets of genes. However, there were also exceptions, as the O3 sensitive coi1 was tolerant to NO2.
4 Discussion
O3 has emerged as a large threat to agricultural production in Asia, including wheat and rice (Feng et al., 2022b). Further understanding of the genetic basis of plant sensitivity to air pollutants is required to guide breeding programs aimed at providing plants with improved tolerance (Frei, 2015). O3 tolerance and sensitivity traits are present in different genotypes and mapping populations of wheat (Feng et al., 2022a), maize (Choquette et al., 2019), rice (Frei et al., 2008) as well as A. thaliana [this study (Brosche et al., 2010; Jakobson et al., 2016; Morales et al., 2021)]. Combined genetic analysis with physiological traits has identified some of the mechanisms behind differential O3 sensitivity; for example, a mutation that leads to more open stomata in the A. thaliana accession Cvi-0 leads to higher O3 uptake and O3 damage (Brosche et al., 2010; Jakobson et al., 2016). Variation in photosynthetic parameters offers another possibility to follow O3 sensitivity traits (Choquette et al., 2019; Morales et al., 2021). Here we used the two air pollutants O3 and NO2 in A. thaliana to further understand their impact on regulation of signaling pathways and PCD. Ultimately, this could provide new mechanisms for tolerance that could be targeted in plant breeding programs.
4.1 O3- versus NO2-induced transcriptional responses
Exposure of Col-0 to 10 ppm NO2 for 1 h or 350 ppb O3 for 2 h resulted in massive transcriptional changes (Xu et al., 2015b; Mayer et al., 2018). Both gases regulated largely overlapping sets of genes involved in ROS, ethylene signaling, pathogen resistance, and cell death (Figure 1B, Supplementary Tables S5 and S6). This is consistent with the rapid accumulation of ROS, NO, and ethylene in O3-exposed tobacco (Ederli et al., 2006). ROS and RNS bursts were also observed after NO2 fumigation of A. thaliana (Kasten et al., 2016). Plants produce ROS and RNS molecules as signaling molecules to regulate local and systemic long distance defence responses (Wang et al., 2013; Waszczak et al., 2018; Hancock and Neill, 2019; He et al., 2022). Accordingly, O3 and NO2 both increase transcript levels for pathogen responsive genes (Xu et al., 2015a; Mayer et al., 2018). In sum, O3 and NO2 probably act both as donors (i.e. to generate) as well as inducers of simultaneous ROS and RNS bursts that ultimately lead to the onset of defence responses.
We focused on the GO category cell death and performed Bayesian hierarchical clustering with O3 and various NO related treatments (Figure 1A). This revealed similar expression profiles in both O3 tolerant (Col-0, C24) and sensitive accessions (Cvi-0, Te). To corroborate this finding, we analysed transcript levels for five cell death related marker genes in a side-by-side comparison of nine accessions treated with 350 ppb O3 or 10 ppm NO2 for 2 h (Figure 2). Both gases increased transcript levels of FMO1, GRX480, CEJ1, and RAP2.6 that function in defence signaling (Krishnaswamy et al., 2011; Caarls et al., 2015; Hartmann et al., 2018). Importantly, RBOHF was differentially regulated with increased transcript levels after O3, but decreased after NO2 treatment (Figure 2). RBOHF, but not RBOHD, was previously implicated as a regulator of O3 cell death (Xu et al., 2015a), hence differential use of ROS produced from RBOHs could be a mechanism to regulate cell death in response to different signals. The transcript level variation between the accessions was independent of their O3 or NO2 sensitivity. For instance, the O3 tolerant accession Ts-1 showed comparable gene regulation as the sensitive accession Cvi-0. Taken together, Figures 1, 2 support the conclusion that O3 and NO2 regulate the expression of largely overlapping sets of defence-related genes also in different A. thaliana accessions. This implies that the mechanism(s) used by A. thaliana to perceive ROS (O3) and RNS (NO2) are conserved in genetically distant A. thaliana accessions. Initial NO perception in A. thaliana takes place via targeted degradation of group VII ethylene response factors (ERFs) (Gibbs et al., 2014). Further down-stream signaling is proposed to be mediated by several other transcription factors, including RAP2.6 (Imran et al., 2018; Leon et al., 2020). Since RAP2.6 transcript levels were enhanced by both O3 and NO2, it represents a target for both ROS and RNS signaling.
There was one exception to the common transcriptional response by O3 and NO2, RBOHF was differentially regulated, with increased transcript levels after O3, but decreased after NO2 treatment (Figure 2). In both plant stress, PCD and developmental responses, the RBOH proteins produce superoxide as signaling molecules (Castro et al., 2021). Out of the ten A. thaliana RBOHs, RBOHD and RBOHF are the main producers of ROS during various aspects of defence signaling (Castro et al., 2021). RBOHF was previously implicated as a regulator of O3 cell death (Xu et al., 2015a), and in ROS transcriptional responses (Willems et al., 2016). ROS from RBOHD and RBOHF are also required to execute cell death in pathogen HR and progression of cell death lesions (Torres et al., 2002; Torres et al., 2005). Differential use of ROS produced from distinct RBOHs could be a mechanism to regulate cell death in response to different signals. The opposite regulation RBOHF transcript levels were present in all tested accessions (Figure 2), this means that A. thaliana can activate distinct signaling pathways from O3 versus NO2. Further analysis of the promoter region of RBOHF could lead to identification of e.g. transcription factor(s) and promoter elements that regulate this specific signaling pathway with contrasting regulation by O3 and NO2.
4.2 Use of GWAS to identify genes regulating O3 and NO2 cell death
Improvement of plant varieties by breeding could help to reduce yield losses due to pollutant-induced leaf damage. Plant breeding can be guided by the results from quantitative trait loci (QTL) or association mapping studies (Frei, 2015; Ueda et al., 2015; Begum et al., 2020). Here, we used A. thaliana natural accessions to identify genes involved in regulation of lesion formation after O3 and NO2 exposure. We performed GWAS on two independent O3 screens and one NO2 screen. 119 accessions were investigated in all three experiments. Initial GWAS runs focused only on 119 accessions assuming that at least some genetic loci would be associated with both O3- as well as NO2-induced leaf phenotypes. However, this approach did not reveal any significant SNPs shared between the O3 and NO2 screens (Figure 4).
Even with standardized growth conditions, growth and molecular responses of A. thaliana show differences between different laboratories (Massonnet et al., 2010). To explore these differences, we performed the phenotyping of O3 tolerance at two different facilities (Helsinki and Munich). Replication of GWAS is common in human studies but relatively rare in other organisms. As we repeated our O3 GWAS at two different facilities, this can give some insight into what to expect from GWAS replications in A. thaliana. There was some phenotypic variation, but also a significant positive correlation between the same accessions in the two O3 experiments. Importantly, we found noticeable overlap in small P-value GWAS SNPs between the two O3 datasets (Figure 5A, 341 shared SNPs with -log10 P-values > 4), which emphasizes that A. thaliana has a robust genetic response to O3. For instance, the most significant SNP for the common 119 accessions in Helsinki (AT3G61410) had also a small P-value in Munich (–log10 P-value = 4.1). Furthermore, by combining results from shared small P-value SNPs from GWAS replications, additional candidate genes can be selected for further study. This would be especially useful as many traits of interest are controlled by several small effect genes, for which SNPs may not reach significance level after correction for multiple testing.
Subsequently, we analysed the datasets individually and we found 12 genomic loci significantly associated with the extent of leaf damage (Figure 5 and Table 1) but again none of these loci was shared between the NO2 and O3 screens. GWAS for O3 tolerance has previously been performed in rice (Ueda et al., 2015), which identified 16 loci with rather weak phenotypic associations (P<0.0001). Similarly, in a study with 150 wheat varieties statistics indicated weak associations between SNPs and O3-induced phenotypes because the determined P-values were rarely below 0.0001 (Begum et al., 2020). Classical QTL mapping studies indicated that several genes in different chromosomal locations control O3 sensitivity in A. thaliana (Brosche et al., 2010; Xu et al., 2015b; Jakobson et al., 2016). These findings argue for O3 and NO2 phenotypes being determined by multiple small-effect loci that are detectable either by QTL-mapping families with contrasting parental phenotypes (which gives the possibility to identify rare alleles in A. thaliana populations) or by using large numbers of accessions in GWAS to improve statistical sensitivity (and more likely to identify common alleles). Accordingly, GWAS with O3 screening data from 127 accessions (Munich screen) resulted in the identification of only a single significantly associated genomic region (only SNPs in one gene in high linkage disequilibrium with the most significant SNP) whereas data from 372 accessions (Helsinki screen) revealed 3 associated genomic regions (with SNPs in 8 genes in high LD with the most significant SNPs). Hence, future screens should include as many of the >1000 sequenced accessions (Alonso-Blanco et al., 2016), as possible to identify more genes linked to O3- and NO2-associated phenotypes and assess whether there is reasonable overlap in the genetics underlying responses to both pollutants. However, with the current datasets we could not find significantly, or even among small P-value (Figures 5B, C), overlapping SNPs and thus it appears that O3 versus NO2 induced lesions are controlled by different genetic loci.
Based on the GWAS results we screened 13 T-DNA knock-out mutants for candidate genes (Table 1 and Figure 6). Five mutants were sensitive and one mutant tolerant as compared to wild-type plants. ABH1 is a gene coding for a nuclear mRNA cap-binding protein that participates in abscisic acid signaling and mRNA processing (Hugouvieux et al., 2001; Laubinger et al., 2008). CNGC1 is an ion channel likely functioning in calcium signaling (Sunkar et al., 2000). The mutant for At1g19480 was sensitive to both 10 ppb O3 as well as 30 ppm NO2 (Figure 6). AT1G19480 might be involved in DNA repair that is an important process in ROS-exposed plants (Nisa et al., 2019). CPuORF46 (AT3G53400) encode an upstream open reading frame (uORF) which can conditionally regulate translation of the main ORF, and has been shown to be responsive to heat stress (Causier et al., 2022). Future research can characterize the physiological mechanisms causing the NO2- and O3-phenotypes in these mutants including measurements of the stomatal aperture, transcriptional changes, stress hormone levels, and antioxidant status.
Both O3 and NO2 cause formation of PCD lesions, with similarities to pathogen HR (Overmyer et al., 2005; Kasten et al., 2016). To further compare how O3 and NO2 regulate lesion formation we used the O3 sensitive vtc1 and slac1 (Conklin et al., 1996; Vahisalu et al., 2008). Both mutants displayed stronger cell death and increased ion leakage upon exposure to NO2 than any other mutant tested in the current study (Figure 6B). The vtc1 mutant is ascorbate-deficient whereas slac1 has an increased stomatal aperture and impaired responses to signals leading to stomatal closure. Hence, antioxidant levels and stomatal regulation restricting entry of air pollutants into the plant are important common determinants of both O3 and NO2 toxicity.
Overall, using O3 and NO2 we show that ROS and RNS have largely overlapping transcriptional responses, but at the same time, they also have distinct signaling roles as exemplified by the contrasting transcriptional regulation of RBOHF. Similarly, mutant analysis also revealed mutants that were sensitive to both gasses as well as mutants sensitive to only one gas. No common SNPs were identified by the GWAS analysis suggesting that natural variation in the strength of PCD induced by the gasses is caused by different small effect genes. Due to the relative simplicity of applying O3 or NO2 to plants in controlled growth conditions, further studies with these gasses will allow dissection of ROS and RNS signaling pathways in plant stress and PCD regulation. Identification of novel PCD regulators can aid in development of strategies to combat the negative effects of air pollution. Figure 7 illustrates connections between O3 and NO2 and other stresses that can initiate defence signaling and PCD.
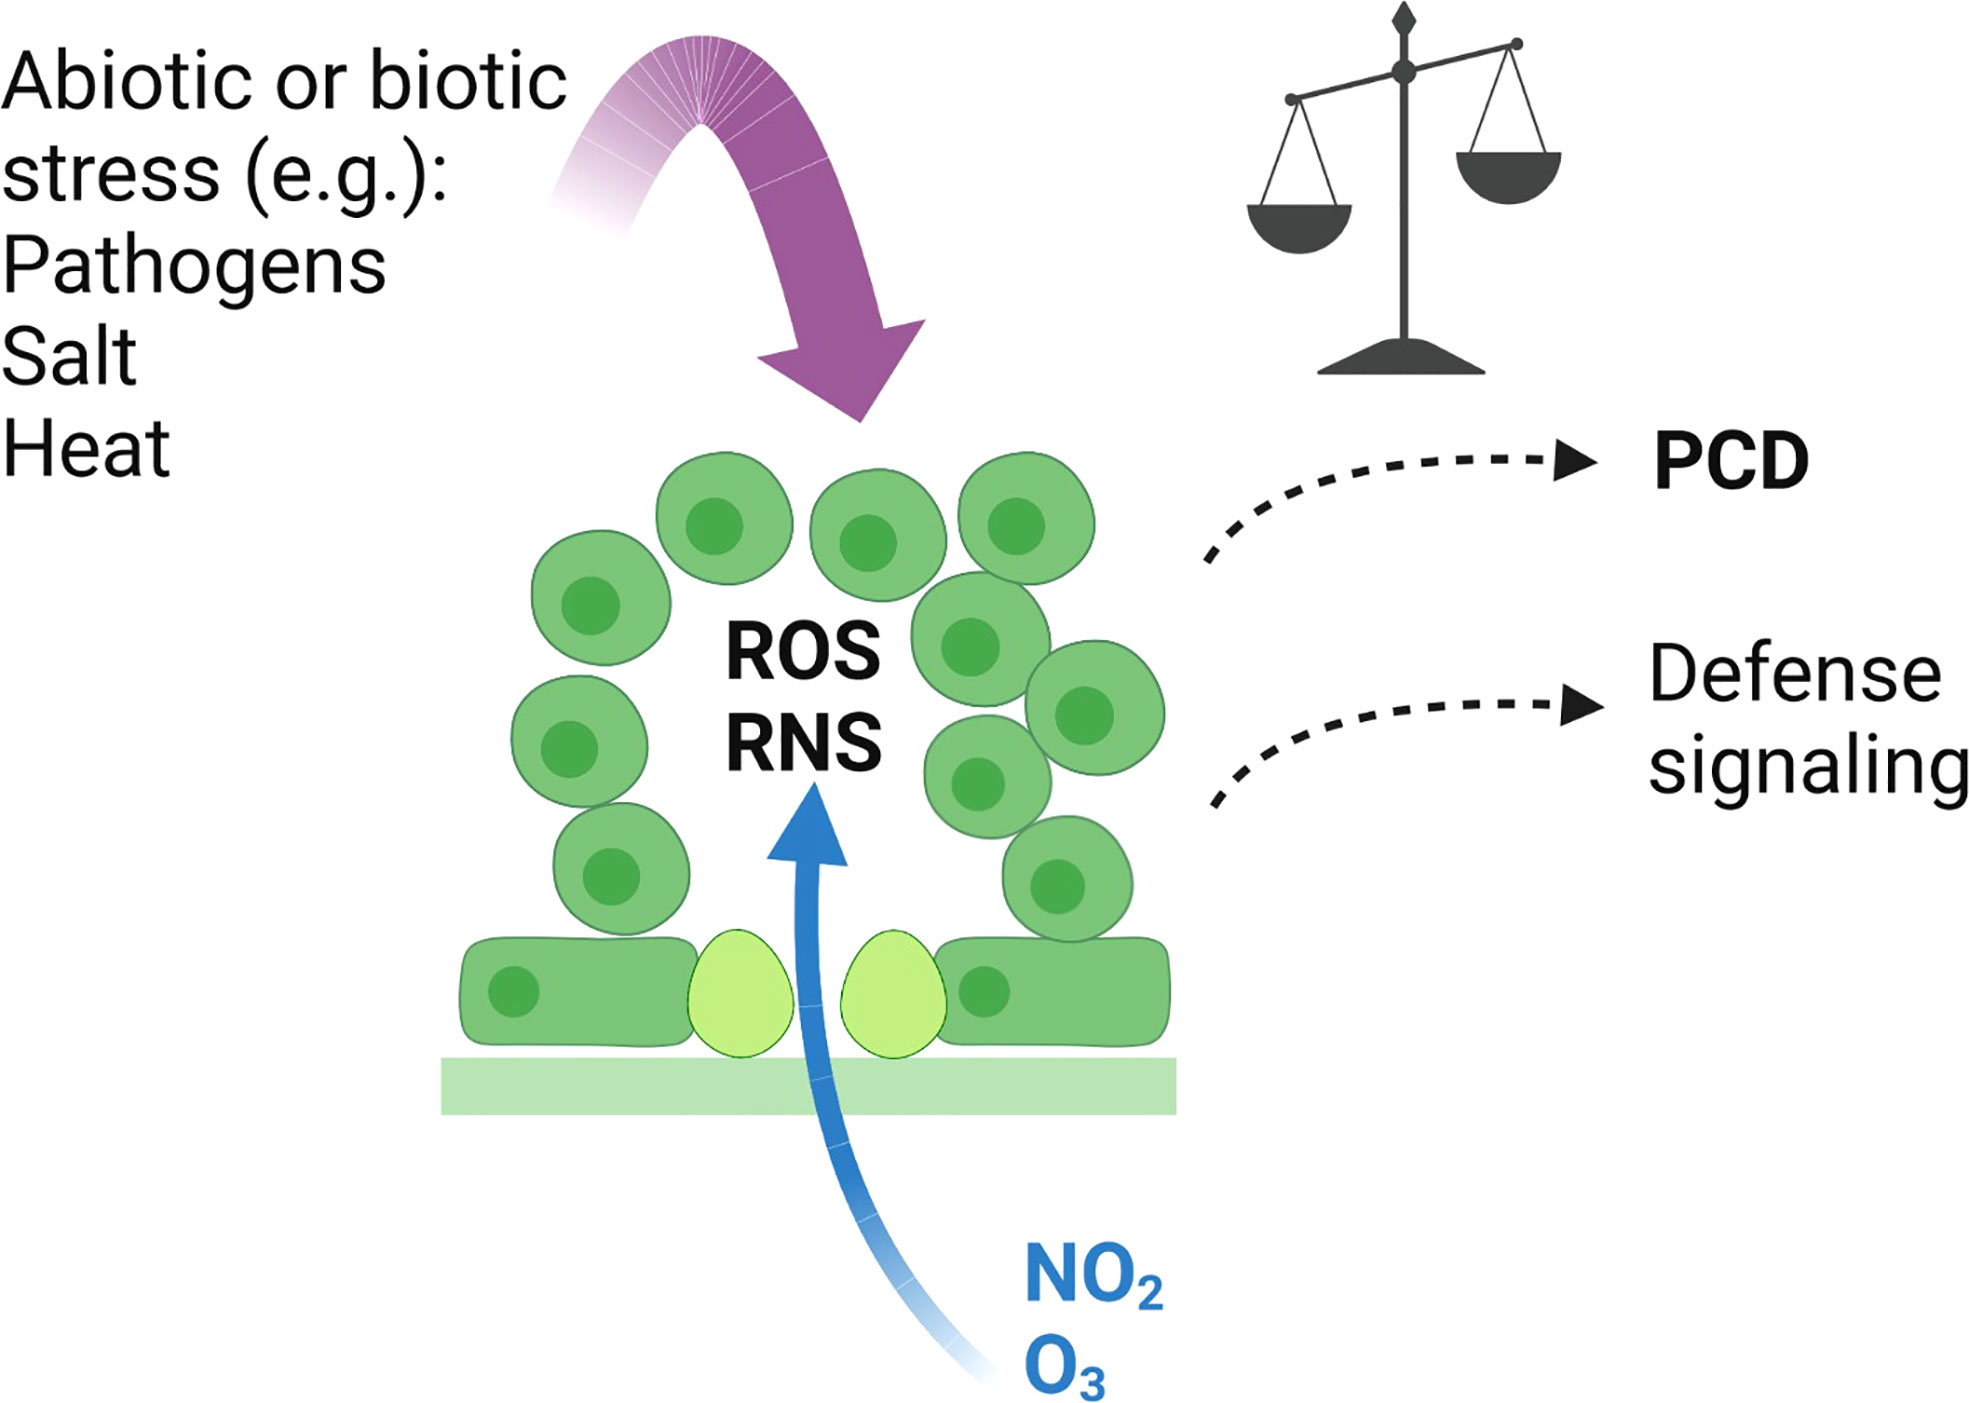
Figure 7 Signalling events initiated by O3 and NO2. O3 and NO2 enter the plant through stomata, and in the apoplast break down into ROS (including H2O2 and O2.-), and RNS (including NO). This initiates various signalling pathways leading to large-scale transcriptional changes, where O3 and NO2 mostly regulate the same set of genes (Figure 1). In sensitive genotypes, PCD is activated leading to leaf damage. Whether PCD is activated depends on the balance of ROS and RNS signalling (Delledonne et al., 2001; Ahlfors et al., 2009), the antioxidant capacity to remove ROS and RNS (Conklin et al., 1996; Kasten et al., 2016), hormone signalling (Xu et al., 2015a; Kasten et al., 2016) and other to be discovered mechanisms. Placement of new candidate PCD regulators identified from GWAS into signalling pathways will require additional studies. The application of O3 and NO2 leads to a clearly defined subcellular source of ROS and RNS in the apoplast. Multiple other abiotic and biotic stresses also lead to active ROS and RNS signalling (Wendehenne et al., 2014; Waszczak et al., 2018; He et al., 2022; Hussain et al., 2022). However, in response to stress the production site of ROS and RNS can come from multiple parts of the cell including apoplast, chloroplast and mitochondria (Waszczak et al., 2018; Hancock and Neill, 2019; Castro et al., 2021). Created with BioRender.com.
Data availability statement
The original contributions presented in the study are included in the article and supplementary material. Raw data used for re-analysis of microarray and RNA-seq data are described in detail in Materials and Methods and in Supplementary Table S2.
Author contributions
JL, FG, JD, and MB initiated and designed the experiments. JL and FG performed the experiments. JL, FG, EX, LM, and MB analyzed the data. JL, FG, and MB wrote the manuscript and all authors commented and approved the submitted version.
Funding
For funding, in Helsinki, we acknowledge a grant number 307335 from the Academy of Finland, for Centre of Excellence in Molecular Biology of Primary Producers. The gas exposure screens in Munich were supported by the European Plant Phenotyping Network (EPPN, Project No. 28443).
Acknowledgments
We would like to acknowledge Tuomas Puukko for excellent qPCR lab work and Omid Safronov for help with analysis of RNA-seq data. Minna Koskela, Valtteri Norkola, Anna Huusari, Valtteri Lehtonen and Adrien Gauthier are thanked for assistance with plants. Hans Lang and Andreas Albert are thanked for technical help with the experiments. Lauri Vaahtera and Folmer Bokma are acknowledged for help with the figures.
Conflict of interest
The authors declare that the research was conducted in the absence of any commercial or financial relationships that could be construed as a potential conflict of interest.
Publisher’s note
All claims expressed in this article are solely those of the authors and do not necessarily represent those of their affiliated organizations, or those of the publisher, the editors and the reviewers. Any product that may be evaluated in this article, or claim that may be made by its manufacturer, is not guaranteed or endorsed by the publisher.
Supplementary material
The Supplementary Material for this article can be found online at: https://www.frontiersin.org/articles/10.3389/fpls.2022.994779/full#supplementary-material
References
Ahlfors, R., Brosche, M., Kollist, H., Kangasjarvi, J. (2009). Nitric oxide modulates ozone-induced cell death, hormone biosynthesis and gene expression in arabidopsis thaliana. Plant J. 58 (1), 1–12. doi: 10.1111/j.1365-313X.2008.03756.x
Ainsworth, E. A. (2017). Understanding and improving global crop response to ozone pollution. Plant J. 90 (5), 886–897. doi: 10.1111/tpj.13298
Alonso-Blanco, C., Andrade, J., Becker, C., Bemm, F., Bergelson, J., Borgwardt, K. M., et al. (2016). 1,135 genomes reveal the global pattern of polymorphism in arabidopsis thaliana. Cell 166 (2), 481–491. doi: 10.1016/j.cell.2016.05.063
Atwell, S., Huang, Y. S., Vilhjalmsson, B. J., Willems, G., Horton, M., Li, Y., et al. (2010). Genome-wide association study of 107 phenotypes in arabidopsis thaliana inbred lines. Nature 465 (7298), 627–631. doi: 10.1038/nature08800
Bardou, P., Mariette, J., Escudie, F., Djemiel, C., Klopp, C. (2014). Jvenn: an interactive Venn diagram viewer. BMC Bioinf. 15, 293. doi: 10.1186/1471-2105-15-293
Begum, H., Alam, M. S., Feng, Y., Koua, P., Ashrafuzzaman, M., Shrestha, A., et al. (2020). Genetic dissection of bread wheat diversity and identification of adaptive loci in response to elevated tropospheric ozone. Plant Cell Environ. 43 (11), 2650–2665. doi: 10.1111/pce.13864
Brosche, M., Blomster, T., Salojarvi, J., Cui, F., Sipari, N., Leppala, J., et al. (2014). Transcriptomics and functional genomics of ROS-induced cell death regulation by RADICAL-INDUCED CELL DEATH1. PLos Genet. 10 (2), e1004112. doi: 10.1371/journal.pgen.1004112
Brosche, M., Merilo, E., Mayer, F., Pechter, P., Puzorjova, I., Brader, G., et al. (2010). Natural variation in ozone sensitivity among arabidopsis thaliana accessions and its relation to stomatal conductance. Plant Cell Environ. 33 (6), 914–925. doi: 10.1111/j.1365-3040.2010.02116.x
Brunekreef, B., Holgate, S. T. (2002). Air pollution and health. Lancet 360 (9341), 1233–1242. doi: 10.1016/S0140-6736(02)11274-8
Caarls, L., Pieterse, C. M. J., Van Wees, S. C. M. (2015). How salicylic acid takes transcriptional control over jasmonic acid signaling. Front. Plant Sci. 6. doi: 10.3389/fpls.2015.00170
Cao, J., Schneeberger, K., Ossowski, S., Guenther, T., Bender, S., Fitz, J., et al. (2011). Whole-genome sequencing of multiple arabidopsis thaliana populations. Nat. Genet. 43 (10), 956–U960. doi: 10.1038/ng.911
Castro, B., Citterico, M., Kimura, S., Stevens, D. M., Wrzaczek, M., Coaker, G. (2021). Stress-induced reactive oxygen species compartmentalization, perception and signalling. Nat. Plants 7 (4), 403–412. doi: 10.1038/s41477-021-00887-0
Causier, B., Hopes, T., McKay, M., Paling, Z., Davies, B. (2022). Plants utilise ancient conserved peptide upstream open reading frames in stress-responsive translational regulation. Plant Cell Environ. 45 (4), 1229–1241. doi: 10.1111/pce.14277
Choquette, N. E., Ogut, F., Wertin, T. M., Montes, C. M., Sorgini, C. A., Morse, A. M., et al. (2019). Uncovering hidden genetic variation in photosynthesis of field-grown maize under ozone pollution. Global Change Biol. 25 (12), 4327–4338. doi: 10.1111/gcb.14794
Conklin, P. L., Williams, E. H., Last, R. L. (1996). Environmental stress sensitivity of an ascorbic acid-deficient arabidopsis mutant. Proc. Natl. Acad. Sci. USA 93 (18), 9970–9974. doi: 10.1073/pnas.93.18.9970
Czechowski, T., Stitt, M., Altmann, T., Udvardi, M.K., Scheible, W.-R. (2005). Genome-wide identification and testing of superior reference genes for transcript normalization in arabidopsis. Plant Physiol. 139, 5–17. doi: 10.1104/pp.105.063743
Delledonne, M., Zeier, J., Marocco, A., Lamb, C. (2001). Signal interactions between nitric oxide and reactive oxygen intermediates in the plant hypersensitive disease resistance response. Proc. Natl. Acad. Sci. USA 98 (23), 13454–13459. doi: 10.1073/pnas.231178298
Ederli, L., Morettini, R., Borgogni, A., Wasternack, C., Miersch, O., Reale, L., et al. (2006). Interaction between nitric oxide and ethylene in the induction of alternative oxidase in ozone-treated tobacco plants. Plant Physiol. 142 (2), 595–608. doi: 10.1104/pp.106.085472
European Environment Agency (2020). Air quality in Europe — 2020 report (Luxembourg: Publications Office of the European Union).
Feng, Y., Nguyen, T. H., Alam, M. S., Emberson, L., Gaiser, T., Ewert, F., et al. (2022a). Identifying and modelling key physiological traits that confer tolerance or sensitivity to ozone in winter wheat. Environ. pollut. 304, 119251. doi: 10.1016/j.envpol.2022.119251
Feng, Z. Z., Xu, Y. S., Kobayashi, K., Dai, L. L., Zhang, T. Y., Agathokleous, E., et al. (2022b). Ozone pollution threatens the production of major staple crops in East Asia. Nat. Food 3 (1), 47–4+. doi: 10.1038/s43016-021-00422-6
Frank, U., Kublik, S., Mayer, D., Engel, M., Schloter, M., Durner, J., et al. (2019). A T-DNA mutant screen that combines high-throughput phenotyping with the efficient identification of mutated genes by targeted genome sequencing. BMC Plant Biol. 19, 539. doi: 10.1186/s12870-019-2162-7
Frei, M. (2015). Breeding of ozone resistant rice: Relevance, approaches and challenges. Environ. pollut. 197, 144–155. doi: 10.1016/j.envpol.2014.12.011
Frei, M., Tanaka, J. P., Wissuwa, M. (2008). Genotypic variation in tolerance to elevated ozone in rice: dissection of distinct genetic factors linked to tolerance mechanisms. J. Exp. Bot. 59 (13), 3741–3752. doi: 10.1093/jxb/ern222
Gandin, A., Dizengremel, P., Jolivet, Y. (2021). Integrative role of plant mitochondria facing oxidative stress: The case of ozone. Plant Physiol. Biochem. 159, 202–210. doi: 10.1016/j.plaphy.2020.12.019
Gan, X., Stegle, O., Behr, J., Steffen, J. G., Drewe, P., Hildebrand, K. L., et al. (2011). Multiple reference genomes and transcriptomes for arabidopsis thaliana. Nature 477 (7365), 419–423. doi: 10.1038/nature10414
Gaupels, F., Spiazzi-Vandelle, E., Yang, D., Delledonne, M. (2011). Detection of peroxynitrite accumulation in arabidopsis thaliana during the hypersensitive defense response. Nitric. Oxide-Biol. Chem. 25 (2), 222–228. doi: 10.1016/j.niox.2011.01.009
Gibbs, D. J., Isa, N. M., Movahedi, M., Lozano-Juste, J., Mendiondo, G. M., Berckhan, S., et al. (2014). Nitric oxide sensing in plants is mediated by proteolytic control of group VII ERF transcription factors. Mol. Cell 53 (3), 369–379. doi: 10.1016/j.molcel.2013.12.020
Hancock, J. T., Neill, S. J. (2019). Nitric oxide: Its generation and interactions with other reactive signaling compounds. Plants-Basel 8 (2), 41. doi: 10.3390/plants8020041
Hartmann, M., Zeier, T., Bernsdorff, F., Reichel-Deland, V., Kim, D., Hohmann, M., et al. (2018). Flavin monooxygenase-generated n-hydroxypipecolic acid is a critical element of plant systemic immunity. Cell 173 (2), 456–469. doi: 10.1016/j.cell.2018.02.049
He, N. Y., Chen, LS., Sun, AZ., Zhao, Y., Yin, S.-N., Guo, F.-Q. (2022). A nitric oxide burst at the shoot apex triggers a heat-responsive pathway in arabidopsis. Nat. Plants 8, 434–450. doi: 10.1038/s41477-022-01135-9
Hellemans, J., Mortier, G., De Paepe, A., Speleman, F., Vandesompele, J. (2007). qBase relative quantification framework and software for management and automated analysis of real-time quantitative PCR data. Genome Biol. 8 (2), R19. doi: 10.1186/gb-2007-8-2-r19
Hugouvieux, V., Kwak, J. M., Schroeder, J. I. (2001). An mRNA cap binding protein, ABH1, modulates early abscisic acid signal transduction in arabidopsis. Cell 106 (4), 477–487. doi: 10.1016/S0092-8674(01)00460-3
Hussain, A., Mun, B.-G., Imran, Q. M., Lee, S.-U., Adamu, T. A., Shahid, M., et al. (2016). Nitric oxide mediated transcriptome profiling reveals activation of multiple regulatory pathways in arabidopsis thaliana. Front. Plant Sci. 7. doi: 10.3389/fpls.2016.00975
Hussain, A., Shah, F., Ali, F., Yun, B.-W. (2022). Role of nitric oxide in plant senescence. Front. Plant Sci. 13. doi: 10.3389/fpls.2022.851631
Imran, Q. M., Hussain, A., Lee, S.-U., Mun, B.-G., Falak, N., Loake, G. J., et al. (2018). Transcriptome profile of NO-induced arabidopsis transcription factor genes suggests their putative regulatory role in multiple biological processes. Sci. Rep. 8, 771. doi: 10.1038/s41598-017-18850-5
Jakobson, L., Vaahtera, L., Toldsepp, K., Nuhkat, M., Wang, C., Wang, Y.-S., et al. (2016). Natural variation in arabidopsis cvi-0 accession reveals an important role of MPK12 in guard cell CO2 signaling. PLos Biol. 14 (12), e2000322. doi: 10.1371/journal.pbio.2000322
Kang, H. M., Sul, J. H., Service, S. K., Zaitlen, N. A., Kong, S.-y., Freimer, N. B., et al. (2010). Variance component model to account for sample structure in genome-wide association studies. Nat. Genet. 42 (4), 348–U110. doi: 10.1038/ng.548
Kang, H. M., Zaitlen, N. A., Wade, C. M., Kirby, A., Heckerman, D., Daly, M. J., et al. (2008). Efficient control of population structure in model organism association mapping. Genetics 178 (3), 1709–1723. doi: 10.1534/genetics.107.080101
Kasten, D., Mithoefer, A., Georgii, E., Lang, H., Durner, J., Gaupels, F. (2016). Nitrite is the driver, phytohormones are modulators while NO and H2O2 act as promoters of NO2-induced cell death. J. Exp. Bot. 67 (22), 6337–6349. doi: 10.1093/jxb/erw401
Kim, S., Plagnol, V., Hu, T. T., Toomajian, C., Clark, R. M., Ossowski, S., et al. (2007). Recombination and linkage disequilibrium in arabidopsis thaliana. Nat. Genet. 39 (9), 1151–1155. doi: 10.1038/ng2115
Krishnaswamy, S., Verma, S., Rahman, M. H., Kav, N. N. V. (2011). Functional characterization of four APETALA2-family genes (RAP2.6, RAP2.6L, DREB19 and DREB26) in arabidopsis. Plant Mol. Biol. 75 (1-2), 107–127. doi: 10.1007/s11103-010-9711-7
Laubinger, S., Sachsenberg, T., Zeller, G., Busch, W., Lohmann, J. U., Raescht, G., et al. (2008). Dual roles of the nuclear cap-binding complex and SERRATE in pre-mRNA splicing and microRNA processing in arabidopsis thaliana. Proc. Natl. Acad. Sci. USA 105 (25), 8795–8800. doi: 10.1073/pnas.0802493105
Leon, J., Costa-Broseta, A., Castillo, M. C. (2020). RAP2.3 negatively regulates nitric oxide biosynthesis and related responses through a rheostat-like mechanism in arabidopsis. J. Exp. Bot. 71 (10), 3157–3171. doi: 10.1093/jxb/eraa069
Long, Q., Rabanal, F. A., Meng, D., Huber, C. D., Farlow, A., Platzer, A., et al. (2013). Massive genomic variation and strong selection in arabidopsis thaliana lines from Sweden. Nat. Genet. 45 (8), 884–890. doi: 10.1038/ng.2678
Massonnet, C., Vile, D., Fabre, J., Hannah, M. A., Caldana, C., Lisec, J., et al. (2010). Probing the reproducibility of leaf growth and molecular phenotypes: A comparison of three arabidopsis accessions cultivated in ten laboratories. Plant Physiol. 152 (4), 2142–2157. doi: 10.1104/pp.109.148338
Mayer, D., Mithoefer, A., Glawischnig, E., Georgii, E., Ghirardo, A., Kanawati, B., et al. (2018). Short-term exposure to nitrogen dioxide provides basal pathogen resistance. Plant Physiol. 178 (1), 468–487. doi: 10.1104/pp.18.00704
McGrath, J. M., Betzelberger, A. M., Wang, S., Shook, E., Zhu, X.-G., Long, S. P., et al. (2015). An analysis of ozone damage to historical maize and soybean yields in the united states. Proc. Natl. Acad. Sci. USA 112 (46), 14390–14395. doi: 10.1073/pnas.1509777112
Middleton, J. T. (1961). Photochemical air pollution damage to plants. Annu. Rev. Plant Physiol. 12, 431–448. doi: 10.1146/annurev.pp.12.060161.002243
Morales, L. O., Shapiguzov, A., Safronov, O., Leppala, J., Vaahtera, L., Yarmolinsky, D., et al. (2021). Ozone responses in arabidopsis: beyond stomatal conductance. Plant Physiol. 186 (1), 180–192. doi: 10.1093/plphys/kiab097
Nisa, M.-U., Huang, Y., Benhamed, M., Raynaud, C. (2019). The plant DNA damage response: Signaling pathways leading to growth inhibition and putative role in response to stress conditions. Front. Plant Sci. 10. doi: 10.3389/fpls.2019.00653
Overmyer, K., Brosche, M., Pellinen, R., Kuittinen, T., Tuominen, H., Ahlfors, R., et al. (2005). Ozone-induced programmed cell death in the arabidopsis radical-induced cell death1 mutant. Plant Physiol. 137 (3), 1092–1104. doi: 10.1104/pp.104.055681
Overmyer, K., Kollist, H., Tuominen, H., Betz, C., Langebartels, C., Wingsle, G., et al. (2008). Complex phenotypic profiles leading to ozone sensitivity in arabidopsis thaliana mutants. Plant Cell Environ. 31 (9), 1237–1249. doi: 10.1111/j.1365-3040.2008.01837.x
Overmyer, K., Tuominen, H., Kettunen, R., Betz, C., Langebartels, C., Sandermann, H., et al. (2000). Ozone-sensitive arabidopsis rcd1 mutant reveals opposite roles for ethylene and jasmonate signaling pathways in regulating superoxide-dependent cell death. Plant Cell 12 (10), 1849–1862. doi: 10.1105/tpc.12.10.1849
Rao, M. V., Davis, K. R. (1999). Ozone-induced cell death occurs via two distinct mechanisms in arabidopsis: the role of salicylic acid. Plant J. 17 (6), 603–614. doi: 10.1046/j.1365-313X.1999.00400.x
Rao, M. V., Lee, H., Creelman, R. A., Mullet, J. E., Davis, K. R. (2000). Jasmonic acid signaling modulates ozone-induced hypersensitive cell death. Plant Cell 12 (9), 1633–1646. doi: 10.1105/tpc.12.9.1633
Rao, M. V., Lee, H., Davis, K. R. (2002). Ozone-induced ethylene production is dependent on salicylic acid, and both salicylic acid and ethylene act in concert to regulate ozone-induced cell death. Plant J. 32 (4), 447–456. doi: 10.1046/j.1365-313X.2002.01434.x
R Core Team (2018). R: A language and environment for statistical computing. (Vienna, Austria: R Foundation for Statistical Computing). Available at: https://www.R-project.org/.
Seren, U., Vilhjalmsson, B. J., Horton, M. W., Meng, D., Forai, P., Huang, Y. S., et al. (2012). GWAPP: A web application for genome-wide association mapping in arabidopsis. Plant Cell 24 (12), 4793–4805. doi: 10.1105/tpc.112.108068
Sharma, Y. K., Leon, J., Raskin, I., Davis, K. R. (1996). Ozone-induced responses in arabidopsis thaliana: The role of salicylic acid in the accumulation of defense-related transcripts and induced resistance. Proc. Natl. Acad. Sci. USA 93 (10), 5099–5104. doi: 10.1073/pnas.93.10.5099
Sunkar, R., Kaplan, B., Bouche, N., Arazi, T., Dolev, D., Talke, I. N., et al. (2000). Expression of a truncated tobacco NtCBP4 channel in transgenic plants and disruption of the homologous arabidopsis CNGC1 gene confer Pb2+ tolerance. Plant J. 24 (4), 533–542. doi: 10.1046/j.1365-313x.2000.00901.x
Taylor, O. C., Eaton, F. M. (1966). Suppression of plant growth by nitrogen dioxide. Plant Physiol. 41 (1), 132–135. doi: 10.1104/pp.41.1.132
Torres, M. A., Dangl, J. L., Jones, J. D. G. (2002). Arabidopsis gp91(phox) homologues AtrbohD and AtrbohF are required for accumulation of reactive oxygen intermediates in the plant defense response. Proc. Natl. Acad. Sci. USA 99 (1), 517–522. doi: 10.1073/pnas.012452499
Torres, M. A., Jones, J. D. G., Dangl, J. L. (2005). Pathogen-induced, NADPH oxidase-derived reactive oxygen intermediates suppress spread of cell death in arabidopsis thaliana. Nat. Genet. 37 (10), 1130–1134. doi: 10.1038/ng1639
Tuomainen, J., Betz, C., Kangasjarvi, J., Ernst, D., Yin, Z. H., Langebartels, C., et al. (1997). Ozone induction of ethylene emission in tomato plants: regulation by differential accumulation of transcripts for the biosynthetic enzymes. Plant J. 12 (5), 1151–1162. doi: 10.1046/j.1365-313X.1997.12051151.x
Ueda, Y., Frimpong, F., Qi, Y., Matthus, E., Wu, L., Hoeller, S., et al. (2015). Genetic dissection of ozone tolerance in rice (Oryza sativa l.) by a genome-wide association study. J. Exp. Bot. 66 (1), 293–306. doi: 10.1093/jxb/eru419
Vahala, J., Ruonala, R., Keinanen, M., Tuominen, H., Kangasjarvi, J. (2003). Ethylene insensitivity modulates ozone-induced cell death in birch. Plant Physiol. 132 (1), 185–195. doi: 10.1104/pp.102.018887
Vahisalu, T., Kollist, H., Wang, Y.-F., Nishimura, N., Chan, W.-Y., Valerio, G., et al. (2008). SLAC1 is required for plant guard cell s-type anion channel function in stomatal signalling. Nature 452 (7186), 487–U415. doi: 10.1038/nature06608
Vainonen, J. P., Kangasjarvi, J. (2015). Plant signalling in acute ozone exposure. Plant Cell Environ. 38 (2), 240–252. doi: 10.1111/pce.12273
Wang, C. X., Liu, R. Y., Lim, G. H., de Lorenzo, L., Yu, K. S., Zhang, K., et al. (2018). Pipecolic acid confers systemic immunity by regulating free radicals. Sci. Adv. 4 (5), eaar4509. doi: 10.1126/sciadv.aar4509
Wang, Y., Loake, G. J., Chu, C. (2013). Cross-talk of nitric oxide and reactive oxygen species in plant programed cell death. Front. Plant Sci. 4. doi: 10.3389/fpls.2013.00314
Waszczak, C., Carmody, M., Kangasjarvi, J. (2018). Reactive oxygen species in plant signaling. Annu. Rev. Plant Biology Vol. 69 69, 209–236. doi: 10.1146/annurev-arplant-042817-040322
Wendehenne, D., Gao, Q.-m., Kachroo, A., Kachroo, P. (2014). Free radical-mediated systemic immunity in plants. Curr. Opin. Plant Biol. 20, 127–134. doi: 10.1016/j.pbi.2014.05.012
Willems, P., Mhamdi, A., Stael, S., Storme, V., Kerchev, P., Noctor, G., et al. (2016). The ROS wheel: Refining ROS transcriptional footprints. Plant Physiol. 171 (3), 1720–1733. doi: 10.1104/pp.16.00420
Wrzaczek, M., Brosche, M., Salojarvi, J., Kangasjarvi, S., Idanheimo, N., Mersmann, S., et al. (2010). Transcriptional regulation of the CRK/DUF26 group of receptor-like protein kinases by ozone and plant hormones in arabidopsis. BMC Plant Biol. 10, 95. doi: 10.1186/1471-2229-10-95
Xu, E., Vaahtera, L., Brosche, M. (2015a). Roles of defense hormones in the regulation of ozone-induced changes in gene expression and cell death. Mol. Plant 8 (12), 1776–1794. doi: 10.1016/j.molp.2015.08.008
Xu, E., Vaahtera, L., Horak, H., Hincha, D. K., Heyer, A. G., Brosche, M. (2015b). Quantitative trait loci mapping and transcriptome analysis reveal candidate genes regulating the response to ozone in arabidopsis thaliana. Plant Cell Environ. 38 (7), 1418–1433. doi: 10.1111/pce.12499
Keywords: genome wide association study, cell death, ozone, nitrogen dioxide, gene expression, stress responses
Citation: Leppälä J, Gaupels F, Xu E, Morales LO, Durner J and Brosché M (2022) Ozone and nitrogen dioxide regulate similar gene expression responses in Arabidopsis but natural variation in the extent of cell death is likely controlled by different genetic loci. Front. Plant Sci. 13:994779. doi: 10.3389/fpls.2022.994779
Received: 15 July 2022; Accepted: 26 September 2022;
Published: 19 October 2022.
Edited by:
Francois Bouteau, Université Paris Cité, FranceReviewed by:
Piotr Gawroński, Warsaw University of Life Sciences-SGGW, Warsaw, PolandBhaskar Gupta, Government General Degree College, Singur, India
Rajesh Singhal, Indian Grassland and Fodder Research Institute (ICAR), India
Copyright © 2022 Leppälä, Gaupels, Xu, Morales, Durner and Brosché. This is an open-access article distributed under the terms of the Creative Commons Attribution License (CC BY). The use, distribution or reproduction in other forums is permitted, provided the original author(s) and the copyright owner(s) are credited and that the original publication in this journal is cited, in accordance with accepted academic practice. No use, distribution or reproduction is permitted which does not comply with these terms.
*Correspondence: Johanna Leppälä, am9oYW5uYS5sZXBwYWxhQGx1a2UuZmk=; Mikael Brosché, bWlrYWVsLmJyb3NjaGVAaGVsc2lua2kuZmk=
†Present address: Johanna Leppälä, Natural Resources Institute Finland, Ounasjoentie 6, 96200 Rovaniemi, Finland
Enjun Xu, Institute of Botany, Chinese Academy of Sciences, 100093 Beijing, China
Luis O. Morales, School of Science and Technology, Life Science Center, Örebro University, 70182 Örebro, Sweden
‡These authors have contributed equally to this work