
94% of researchers rate our articles as excellent or good
Learn more about the work of our research integrity team to safeguard the quality of each article we publish.
Find out more
ORIGINAL RESEARCH article
Front. Plant Sci., 01 December 2022
Sec. Plant Development and EvoDevo
Volume 13 - 2022 | https://doi.org/10.3389/fpls.2022.990221
This article is part of the Research TopicModel Organisms in Plant Developmental Biology — their effectiveness and limitationsView all 14 articles
 Liting Chen†
 Yuanyuan Yan†
 Huifeng KeZihao Zhang
 Chengsheng Meng
 Limei Ma
 Zhengwen Sun
 Bin Chen
 Zhengwen LiuGuoning Wang
 Jun Yang
 Jinhua Wu
 Zhikun Li
 Liqiang WuGuiyin Zhang
 Yan Zhang
 Xingfen Wang
 Zhiying Ma*
SEP genes are famous for their function in the morphological novelty of bisexual flowers. Although the diverse functions of SEP genes were reported, only the regulatory mechanisms underlying floral organ development have been addressed. In this study, we identified SEP-like genes in Gossypium and found that SEP3 genes were duplicated in diploid cotton varieties. GhSEP4.1 and GhSEP4.2 were abundantly transcribed in the shoot apical meristem (SAM), but only GhSEP4.2 was expressed in the leaf vasculature. The expression pattern of GhSEPs in floral organs was conserved with that of homologs in Arabidopsis, except for GhSEP2 that was preponderantly expressed in ovules and fibers. The overexpression and silencing of each single GhSEP gene suggested their distinct role in promoting flowering via direct binding to GhAP1 and GhLFY genomic regions. The curly leaf and floral defects in overexpression lines with a higher expression of GhSEP genes revealed the concentration-dependent target gene regulation of GhSEP proteins. Moreover, GhSEP proteins were able to dimerize and interact with flowering time regulators. Together, our results suggest the dominant role of GhSEP4.2 in leaves to promote flowering via GhAP1-A04, and differently accumulated GhSEP proteins in the SAM alternately participate in forming the dynamic tetramer complexes to target at the different loci of GhAP1 and GhLFY to maintain reproductive growth. The regulatory roles of cotton SEP genes reveal their conserved and diversified functions.
Flowering is critical for angiosperms to evolve into the largest land plant lineage. The origin of this plant morphological novelty has been connected to the expansion of MADS-box genes during evolution. MADS-box proteins and their cofactors contribute to a large protein–protein interaction (PPI) network that is essential to virtually every aspect of plant reproductive development (Theissen, 2001; Smaczniak et al., 2012; Theissen et al., 2016).
The synteny studies of MADS-box genes across the plant kingdom have identified angiosperm-specific MADS-box gene clades including FLOWERING LOCUS C (FLC)-, SQUAMOSA (SQUA)-, and SEPALLATA (SEP)-like genes that share a common origin of gymnosperm AGAMOUS-LIKE6 (AGL6)-like genes (Ruelens et al., 2013; Zhao et al., 2017). SEP-like genes encode the floral E-function proteins serving as hubs within the MADS PPI network to drive the formation of distinct tetrameric complexes that are proposed to facilitate the origin of angiosperm flowers (Theissen and Saedler, 2001; Zahn et al., 2005; Theissen and Melzer, 2007; Ruelens et al., 2017).
SEP genes participate in every step of reproductive growth ranging from the initiation of inflorescence meristems to the determination of floral organs. In Arabidopsis, four SEP genes function redundantly according to the severe developmental defects of sep multiple mutants rather than single mutants (Pelaz et al., 2000; Ditta et al., 2004). All floral organs are converted to sepals in the sep1 sep2 sep3 triple mutant or show leaf-like structures in the sep1 sep2 sep3 sep4 quadruple mutant, whereas they are not significantly perturbated in the sep1 sep2 sep4 mutant (Pelaz et al., 2000; Ditta et al., 2004). The phenotypic variations of SEP mutants prove the role of SEP4 in sepal determination and the dominant role of SEP3 in determining the inner three whorls of a flower. These four proteins are capable to assemble other MADS-box proteins to form homotetrameric or heterotetrameric complexes that recognize two distanced CArG-boxes, the consensus MADS-domain binding motif (Immink et al., 2009; Melzer et al., 2009; Jetha et al., 2014). FLORAL BINDING PROTEIN2 (FBP2) and FBP5 (SEP-like genes in petunia) are required for B, C, and D genes to specify petal, stamen, carpel, and ovule development (Vandenbussche et al., 2003b). The SEP homologous in rice, tomato, soybean, birch, poplar, orchid, and lotus has been reported to participate in floral organogenesis and the identity of floral and inflorescence meristem (Pnueli et al., 1994; Lemmetyinen et al., 2004; Cseke et al., 2005; Cui et al., 2010; Gao et al., 2010; Huang et al., 2014; Pan et al., 2014; Morel et al., 2019; Lin et al., 2020).
Although the plant homeotic E class genes are highly conserved in flower development, plenty of evidence suggests a functional diversity of SEP-like genes. In Arabidopsis, SEP3 is expressed in the floral organs of the inner three whorls, while the expression of SEP1, SEP2, and SEP4 is activated earlier than SEP3 in the floral meristem before the emergence of the organ primordia, and SEP4 is detectable in all above-ground vegetative organs (Ma et al., 1991; Flanagan and Ma, 1994; Ditta et al., 2004). The temporal and spatial expression differences suggest the roles of SEP genes in regulating plant growth, which is in line with the early flowering and terminal flower phenotypes of 35S:SEP3 (Pelaz et al., 2001; Castillejo et al., 2005). Some SEP3-like genes promote flowering when constitutively expressed in Arabidopsis or tobacco including FBP2, TaMADS1, LILY MADS BOX GENE3 (LMADS3), OsMADS7/8, BpMADS1, and NsMADS3 (Kang et al., 1997; Jang et al., 1999; Elo et al., 2001; Ferrario, 2003; Tzeng et al., 2003; Zhao et al., 2006), whereas the silencing or knockdown of SEP3-like genes rarely causes changes in flowering time except the late flowering phenotype caused by the simultaneous silencing of OsMADS7 and 8 (Cui et al., 2010). However, the function of SEP1/2/4-like genes in flowering time control is rarely reported. The SEP1/2 homolog in poplar (PTM3) promotes tobacco flowering when overexpressed (Cseke et al., 2005). The overexpression of PlacSEP genes from Platanus acerifolia in Arabidopsis consistently promote floral transition except for PlacSEP1.2 (Zhang et al., 2017). IiSEP4 in Isatis indigotica promotes the flowering of Arabidopsis via its interaction with the SHORT VEGETATIVE PHASE (SVP) to upregulate FLOWERING LOCUS T (FT) expression (Pu et al., 2020). The molecular mechanism of SEP genes in flowering time control is still unclear.
MADS box proteins form different complexes that perform diverse functions. The floral quartet model (FQM) poses the floral organ specification that is built on the tetrameric complexes glued by SEP proteins with different ABCD transcription factors to finely determine each whorl of a flower (Theissen et al., 2016). Dynamic tetramers with different binding affinity respond for the differential target gene regulation (Jetha et al., 2014). The broader involvement of SEP3 than SEP4 is supported by that SEP3 is capable to bind to a wider range of distance between two CArG-box motifs (Jetha et al., 2014). Furthermore, a large-scale analysis of protein interactions in Arabidopsis suggests that flowering time regulators, such as SVP, SUPPESSOR OF OVEREXPRESSION of CO 1 (SOC1), AGAMOUS-LIKE24 (AGL24) and APETALA1 (AP1), interact with SEP3 or SEP2 to form ternary complexes (De Folter et al., 2005; Immink et al., 2009). Protein interactions between SEPs and flowering time regulators are also identified in other species (Leseberg et al., 2008; Pu et al., 2020). The SVP-like genes are also regulated by SEP3 homologs in Arabidopsis and rice (Kaufmann et al., 2009; Khanday et al., 2016). Chromatin immunoprecipitation sequencing (ChIPSeq) data reveal the same binding loci of SEP3 as AP1 to the SOC1 promoter (Liu et al., 2007; Kaufmann et al., 2009), suggesting a regulation of SEP3 and AP1 on SOC1 transcription. Moreover, floral patterning is regulated by flowering time genes SOC1, SVP, and AGL24, targeted by SEP3 (Liu et al., 2009). These fragments indicate a complex regulation of flowering time genes and SEP genes, which is essential for sequential developmental regulation from vegetative to reproductive growth.
Cotton fiber is the backbone of textile. Fiber development is the last step of cotton reproductive growth in which sequential development determines the success of fiber production. Early-maturing cotton is characterized by a short growth period, dwarf and compact plant architecture. They are becoming increasingly important for farmers to improve economic benefits through mechanical harvesting and double cropping. Early maturity is an important target trait of cotton breeding, and studies on flowering are the key to breed early-maturity varieties. The flowering time integrators of FT, SOC1, and LEAFY (LFY) play conserved functions to promote flowering in Gossypium hirsutum (Li et al., 2013; Liu et al., 2021; Ma and Yan, 2022). Genes involved in the photoperiod and gibberellin synthesis were reported to regulate cotton flowering time (Hao et al., 2021; Li et al., 2021a; Li et al., 2022). The MYB transcription factor (GhAPL) and epigenomic regulation (DNA methylation and histone deacetylation) are also involved in cotton flowering time control (Song et al., 2017; Zhang et al., 2021). However, the regulatory mechanism is largely unknown. In this study, we cloned cotton SEP-like genes from G. hirsutum (GhSEPs). The expression, overexpression, gene silencing, and interaction determination analysis found that GhSEPs (GhSEP proteins) promoted floral transition via interacting with their cofactors to form different protein tetramers that dynamically targeted the downstream genes directly via different loci, including GhAP1 and GhLFY. This provides a molecular mechanism of how SEP-like genes regulate flowering time in cotton.
The cotton varieties CCRI50, Jiumian2, TM-1, and Yumian8 used in this study were preserved in Hebei Agricultural University and grown in a greenhouse (16 h light/8 h dark, 28°C day/25°C night) for experiments. The TM-1 variety was grown for tissue-specific analysis. The roots of the seedlings at the cotyledon stage and the stem, leaf, and SAM of seedlings at two true leaf stages (TLSs) were sampled, respectively. The calycle, sepal, petal, stamen, pistil, and ovule were collected 0 day postanthesis (DPA). Fibers were separated from ovules at 5 DPA. Two early-maturity cotton varieties CCRI50 [whole growth period (WGP) in Yellow River Basin Region (YRBR) is 110 days] and Jiumian2 (WGP in YRBR is 114 days) and two late-maturity cotton varieties TM-1 (WGP in YRBR is 135 days) and Yumian8 (WGP in YRBR is 136 days) were used for temporal expression analysis. A total of 10 shoot apexes were collected, respectively, at two, three, four, and five TLSs. The Arabidopsis and tobacco plants were grown in a plant growth chamber under 16 h light/8 h dark, 22°C. The whole seedlings of Arabidopsis homozygous plants were collected for expression analysis. All samples were immediately frozen in liquid nitrogen for further analysis.
The four Arabidopsis SEP1/2/3/4 protein sequences were downloaded from the TAIR (https://www.arabidopsis.org/) and then blast against the published genomes of G. hirsutum on CottonFGD (https://cottonfgd.org/). The protein sequences and functional annotations were filtered for the protein family database (Pfam) identifiers of the MADS and K domains (PF00319 and PF01486), respectively. The candidate GhSEPs were confirmed with HMMER 3.0 and the Batch CD-Search service. The homologous genes of SEP in Gossypium (G. raimondii, G. arboretum, and G. barbadense) were determined in the same way.
The phylogenetic trees were constructed by MEGA 7.0 using the neighbor-joining (NJ) method with 1,000 bootstrap replications and default parameters and then displayed with the online iTOL tool (https://itol.embl.de/) (Kumar et al., 2016; Letunic and Bork, 2019). Segmental and tandem duplications were detected by MCScanX with default parameters. Homologous genes between the At and Dt subgenomes were determined using the bidirectional best hit method in BLAST. The duplication events were fetched and then displayed with TBtools (Chen et al., 2020).
Plant total RNA was extracted using RNA Easy Fast Plant Kit (TIANGEN Beijing, China). DNase treatment was performed with RNase-free DNase (TIANGEN, Beijing, China) before purification. The cDNA was synthesized using cDNA Synthesis SuperMix (TRANS, Beijing, China). Gene transcription was detected by quantitative real-time PCR (qPCR) using AugeGreen™ Master Mix for HRM (US EVERBRIGHT, Suzhou, China) on the ABI 7500 PCR Detection System (USA). Gene-specific primers for qPCR were verified for its specificity according to the single peak in the melting curve and are listed in Table S1. The relative expression level was calculated using the 2-△Ct formula. The expression was normalized to AtTUB2 (AT5G62690) in Arabidopsis and GhHis3 (GhM_D03G0424.1) in cotton and shown as relative values to the maximal gene expression level set at 100%. Three biological repeats were applied on each sample, and three technical repeats were performed on each reaction. The standard deviation (SD) of three biological repeats was calculated. R.E.L. stands for the relative expression level.
The coding regions of GhSEPs were cloned (primers listed in Table S1) and purified by the E.Z.N.A.® Gel Extraction Kit (Omega Bio-tek, Norcross, Georgia, USA). The resulting fragments were ligated into vector pGreen0229 with a 35S promoter. The constructs were introduced into Agrobacterium tumefaciens strain GV3101 and transformed to Arabidopsis wild-type (WT) plants (Columbia) using the floral dip method. For each GhSEP gene, at least 25 T1 individual lines were obtained and confirmed by genotyping for the exogenous fragment. Then, five homozygous T3 lines were randomly selected and saved for a detailed observation of phenotypes. Expression analysis was performed on the seedlings of homozygous plants.
The 2kb promoter sequence of each GhSEP was cloned and, finally, the genome regions of GhSEP1A, GhSEP2D, GhSEP3.1A, GhSEP4.1D, and GhSEP4.2D were obtained and inserted into the pGreen-GUS vector to generate pro:GhSEP-GUS constructs. Then, the construct was transformed into Arabidopsis using the methods described above. The homozygous lines were used for the histochemical assays of GUS activity. Different tissues were collected for GUS staining, including 13-day-old seedlings and cauline leaves, inflorescence, and floral organs from 6-week-old plants. Samples were immersed in the staining solution (Coolaber, Beijing, China) and incubated at 37°C overnight. Then, the samples were decolored in 70% (v/v) ethanol twice until the negative-control material (WT) turned white. Stained and cleared specimens were visualized and photographed using a stereoscope (AxioCam ICc 5; Carl Zeiss, Jena, Germany).
To elucidate the subcellular localization of GhSEP proteins, the coding region without a stop codon was fused with GFP to generate a 35S:GhSEP-GFP construct. A. tumefaciens strain GV3101 carrying plasmid 35S:GhSEP-GFP was infiltrated into the abaxial surface of leaves of 4-week-old N. benthamiana plants. The infiltrated leaves were detected for GFP fluorescent by a confocal microscope (FV10i; Olympus, Tokyo, Japan) after 48 h infiltration. The cell nuclei were indicated by staining with 40,6-diamidino2-phenylindole (DAPI).
Due to the similarity of the GhSEPs’ coding region, we chose the 3’UTR region (265/268/263/242/259-bp DNA fragment of GhSEP1/GhSEP2/GhSEP3.1/GhSEP4.1/GhSEP4.2) for PCR amplification. The fragments were inserted into the tobacco rattle virus (TRV) binary vector pYL156 (pTRV2). In addition, the pTRV1 and pTRV2:GhSEP vectors were coinfiltrated into the cotyledons of cotton CCRI50 to generate more than 40 individual silencing lines for each GhSEP gene. The same number of negative control plants were meanwhile generated by the infiltration of pTRV1 and pTRV2 empty vectors. To estimate the silencing effect, pTRV : CLA1 was applied as a positive control. The expression of each GhSEP gene was detected in the SAM from randomly selected five silencing plants and five control plants when the photobleaching phenotype was obvious in the positive control (Figure S1). The gene expression was calculated as 2-△Ct normalizing to GhHis3. The SAM of another five silencing and negative-control plants were collected at four TLSs for the freezing section. The remaining plants were grown for the observation of phenotypes that were statistically analyzed with at least 20 plants. The experiments were repeated three times, and the SD of the silencing effect was calculated with three biological repeats using Student’s t-test.
The SAM of VIGS plants were embedded in Optical Cutting Temperature (OCT) compound (Leica Wetzlar, Germany) and fast-frozen in liquid nitrogen. Then, the samples were cross-sectioned by the freezing microtome (7500; Leica, Wetzlar, Germany) and the serial sections were expanded on a plus on a slide (CITOGLAS, Beijing, China) followed by observation under a microscope (DM2500; Leica Wetzlar, Germany).
The SAM of the early- and late-maturity cotton mentioned above was sampled and dehydrated in ethanal serial solutions (from 20% (v/v) to 100%). The tissues were visualized by adding eosin in 70% ethanal. Then, the tissues were incubated in a serial solution of ethanal/histonclear and histonclear/paraffin chips. The samples were finally embedded in the paraffin for section using a microtome (Leica, HistoCore AUTOCUT, Germany). The paraffin ribbon was expanded on plus on slides, and the paraffin was removed by a serial solution of ethanal/histonclear. The morphological characteristics of the SAM at each period were recorded and photographed under a microscope (DM2500; Leica, Germany).
The coding regions of candidate genes were cloned into pGADT7 (AD) and pGBKT7 (BD) vectors (Clontech, San Francisco, California, USA). The two-hybrid assay was performed according to the Matchmaker® Gold Yeast Two-Hybrid System (Clontech San Francisco, California, USA).
The open reading frames (ORFs) of full-length genes were inserted into separate pSAT1A-nEYFP-N1 and pSAT1-cEYFP-C1-B vectors and then transformed into Agrobacterium (GV3103). These Agrobacteria were coinfiltrated into Nicotiana benthamiana leaves. The florescence signals were detected under confocal microscopy (FV10i; Olympus, Tokyo, Japan).
The coding region of GhSEP2 and GhSEP4.2 were cloned into a 35S:-6HA vector (pGreen). The mesophyll protoplasts transient expression system (Li et al., 2021b) was applied for the ChIP assay. The fifth leaves and shoot apexes from TM-1 at five TLSs were collected and sliced into fine filaments followed by gentle digestion for 9 h (1.5% cellulose, 0.4% macerozyme, 0.5 mol·L-1 mannitol, 20 mmol·L-1 KCl, 20 mmol·L-1 MES, 10 mmol·L-1 CaCl2, and 1.0 g·L-1 BSA) to extract protoplasts. The plasmids 35S:GhSEP2-6HA and 35S:GhSEP4.2-6HA were transiently expressed in the protoplast by 40% PEG under isotonic pressure maintained by 0.5 mol·L-1 mannitol. Then, the protoplasts were cultured with a WI buffer (4 mmol·L-1 MES, 0.5 mol·L-1 mannitol, 20 mmol·L-1 KCl) in the dark for 16 h. More than 10-15 million cells were collected and fixed in 1% formaldehyde on ice for 20 min. The nuclei were isolated and sonicated to produce DNA fragments approximately 500 base pairs. Nucleoprotein was then immunoprecipitated by an anti-HA antibody conjugated with agarose (Sigma, St. Louis, Missouri, USA). The DNA fragments were purified by the E.Z.N.A.® Gel Extraction Kit (Omega Bio-tek, USA). Western blot was applied to detect the fusion protein using an HA antibody (Invitrogen, USA). The relative enrichment of each fragment was determined by qRT-PCR. Primers used for the ChIP assay are listed in Table S1. The enrichment fold of each fragment was calculated first by normalizing the amount of a target DNA fragment against GhHis3 as an internal control and then by normalizing the value for transgenic protoplasts against non-transformed protoplasts. The SD of three biological repeats was calculated.
The MADS box family is highly conserved in the MADS-box domain. To distinguish SEP-like genes from other MADS family members in Gossypium, the four Arabidopsis SEP protein sequences were blasted against the published genomes. The results were filtered referring to the sequence similarity and the identified members of the cotton MADS-box family (Ren et al., 2017; Nardeli et al., 2018). Then, the selected sequences were confirmed by the phylogenetic tree constructed with SEP homologs (Table S2) and named according to the members in the same subgroup (Figure 1A and Table S3). Finally, 12 SEP-like genes were identified and distributed equally in the At and Dt subgenomes, which were named according to the sequence similarity (Figure S2A and Table S4). Consistent with the protein sequence similarity of each homologous gene pair in the Gh genome, their gene structures were conserved (Figures S2B, C). The GhSEPs contained MADS-box and K-box domains, and their C-terminals possessed a characterized SEP I motif and SEP II motif (Figures S2A, D) (Zahn et al., 2005; Pan et al., 2014). We also found conserved motifs between the cotton and Arabidopsis SEP1/2 and SEP3 proteins, respectively, designated as the SEP1 motif and SEP3 motif, respectively (Figure S2A).
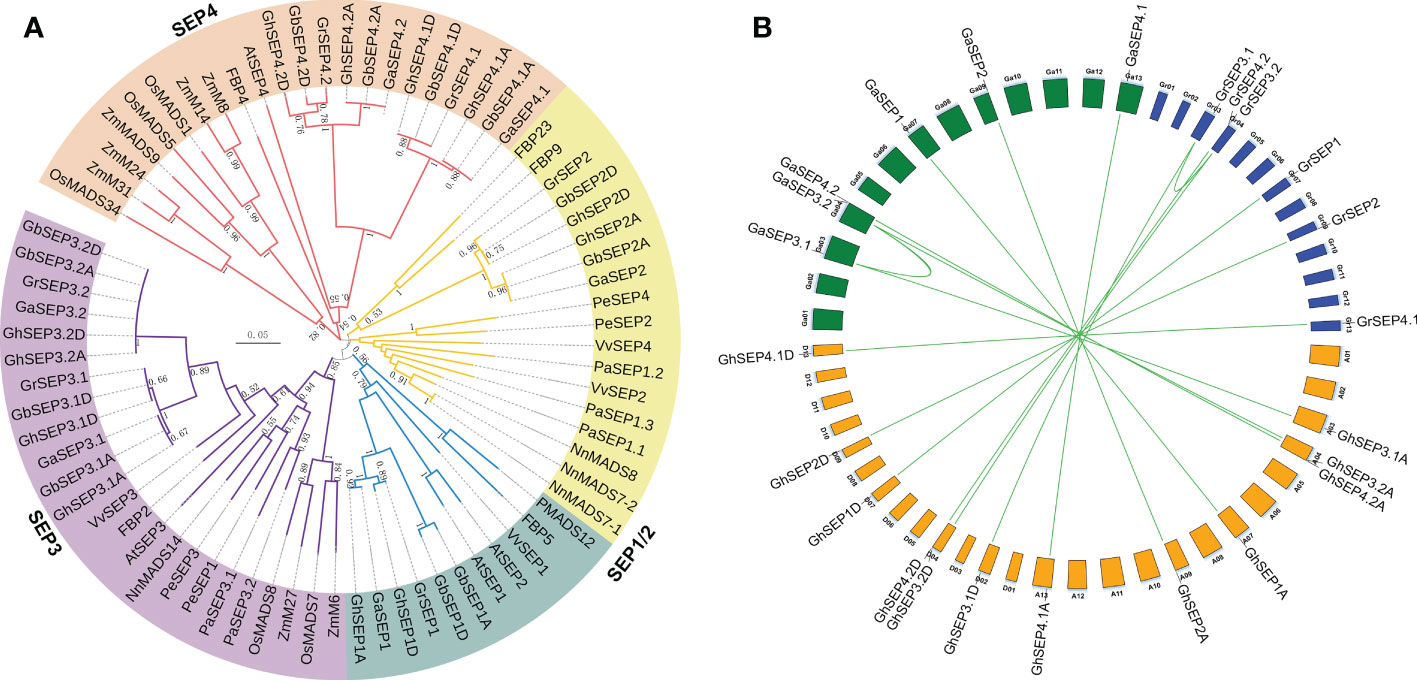
Figure 1 Evolution analysis of cotton SEP-like genes. (A) Phylogenetic relationships of SEP-like proteins from Gossypium barbadense, G. hirsutum, G. raimondii, G. arboreum, Arabidopsis thaliana, Petunia hybrid, Oryza sativa, Phalaenopsis equestris, Vitis vinifera, Zea mays, Nelumbo nucifera, and Platanus acerifolia. (B) Duplication events among SEP genes in diploid and tetraploid cotton varieties. Curves indicate segmental duplications. Lines link homologous genes between diploid and tetraploid genomes.
The phylogenetic tree was clustered into four groups (Figure 1A). The SEP3 group was closer to the SEP1 group, and the two groups were then rooted with the SEP2 group. The SEP4 group was located in a single evolutionary branch. Only the SEP3 group contained genes from all the chosen species, and other SEP-like genes in different species were clustered irregularly to other groups, suggesting that SEP3-like genes were mostly conserved in the angiosperm. Interestingly, SEP4-like genes in Gossypium were closely clustered with the rest of monocot SEP-like genes except for SEP3, indicating a different evolution of SEP4-like genes. These results supported that SEP-like genes originated from a single MADS gene and then extended during the whole genome duplication events followed by the evolution of diverse functions (Smaczniak et al., 2012; Chen et al., 2017; Zhao et al., 2017). To further elucidate the evolution of SEPs in the Gossypium species, their synteny was analyzed. The results showed the segmental duplications of SEP3 genes in the diploid Gr and Ga genomes (Figure 1B), and the diploid SEP3 sequences were highly similar to the SEP3 genes in the tetraploid Gh genome (Figure S2A). Therefore, we speculate that SEP genes in the tetraploid Gh genome originated from their diploid progenitors.
The expression pattern of GhSEPs was studied first using the transcriptomic data obtained from CottonFGD (Hu et al., 2019). The transcripts of GhSEP homologies from At and Dt subgenomes displayed a consistent expression pattern in the heat map (Figure S3A). GhSEP1/2/3.1 were highly transcribed during fiber development, whereas GhSEP4s were undetectable in the ovule or fiber. GhSEP1 transcribed relatively higher during seed germination, and GhSEP4.1 could be induced by cold, drought, and salt stress. However, the transcriptomic data lacked information about the GhSEP3.2 gene, so we further compared the transcription of GhSEP genes in our unpublished transcriptomic data of the leaf and SAM during cotton floral transition (Figure S3B). The similar expression of GhSEP homologies from At and Dt subgenomes was also observed. Additionally, GhSEP genes displayed higher expression after floral transition (at five TLSs), especially in the SAM. The transcripts of GhSEP3.2A and D were not expressed in the leaf and SAM. The expression of GhSEPs were further examined in vegetative and reproductive tissues. Due to the extraordinarily high sequence similarity of homologies in At and Dt subgenomes, their transcripts were detected together and shown as GhSEP1, GhSEP2, GhSEP3.1, GhSEP4.1, and GhSEP4.2. The expression pattern of GhSEPs was different in flowers from the outside to the inner whorl (Figure S3C), which is similar as their homologies in Arabidopsis. GhSEP4.1 and GhSEP4.2 were expressed in the calycle. Except for GhSEP3.1, the other GhSEPs were expressed in the sepal. All the GhSEPs participated in the development of the petal and stamen. Only GhSEP3.1 showed considerable transcripts in the pistil. Noticeably, GhSEP2 expression raised up in the fiber, suggesting a novel function of cotton SEP genes in fiber development. In the SAM, GhSEPs consistently displayed higher expression, especially GhSEP4.1 and GhSEP4.2 (Figure 2A). In addition, GhSEP2 and GhSEP3.1 transcription in the SAM was relatively lower. Only GhSEP4.2 showed a much higher expression in the vegetative tissues of leaves. Since SEP-like genes have been shown to control flowering time, we monitored the expression of GhSEPs in developing seedlings. Before expression analysis, the cytological morphology of the SAM was observed in early- and late-maturity cottons to illustrate the occurrence of floral transition. The eminence of the SAM was obvious in the early-maturity cotton CCRI50 and Jiumian2 when the fourth true leaf flattened, while the eminence was just visible in the SAMs of TM-1 and Yumian8 at five TLSs, suggesting a proximate 5-day delay of the floral transition in late-maturity cotton varieties (Figure 2B). Consistent with the occurrence of floral transition, the expression of GhSEPs was upregulated at the four TLSs in the early-maturity cotton varieties, while their expression only increased slightly in late-maturity cotton varieties. The GhSEP expression level was gradually increased along with the floral transition (Figure 2C), suggesting that they promote flowering time. In line with this, a higher expression level of GhSEPs was detected in the early-maturity cotton varieties than the late ones during floral transition (Figure S3D). The transcription of GhSEPs in tissue and developing seedlings suggested redundant roles in floral organ development and flowering time control.
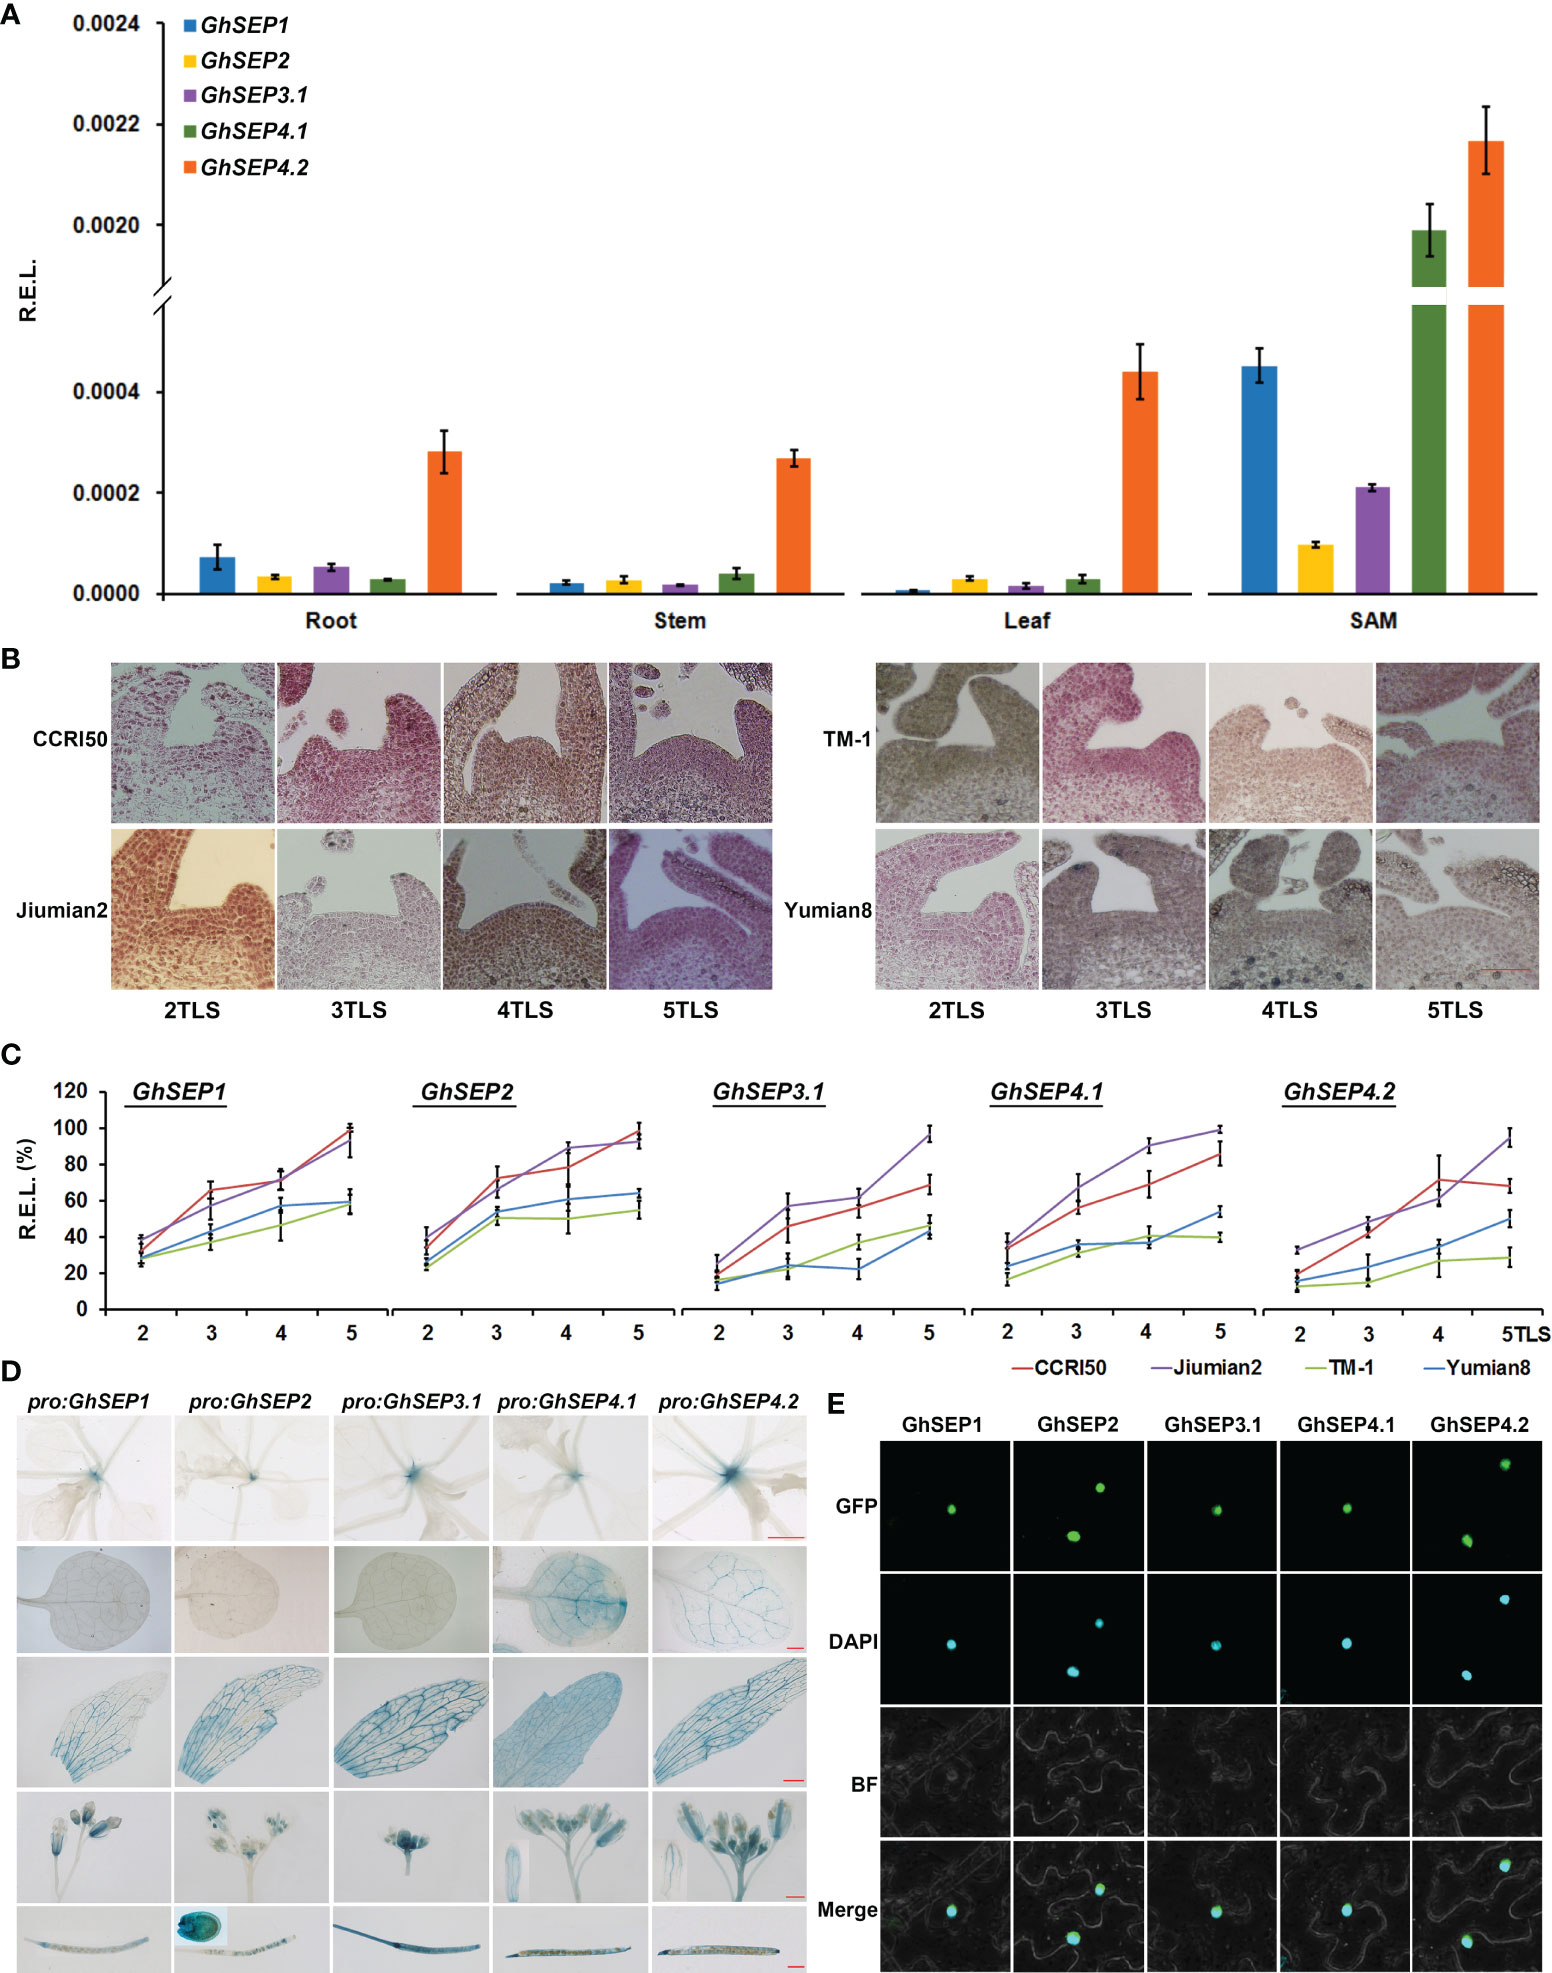
Figure 2 Expression patterns and subcellular localization of GhSEPs. (A) Expression of GhSEP genes in different tissues of TM-1. (B) Morphological changes of the shoot apical meristem (SAM) during the seedling development of early-(CCRI50 and Jiumian2) and late-maturity (TM-1 and Yumian8) varieties. Scale bar stands for 100 μm. (C) Temporal expression of GhSEPs in developing seedlings of the four varieties. (D) GUS activity in pro:GhSEP-GUS transgenic Arabidopsis plants in 15-day-old seedlings, cauline leaves, flowers, and seeds. Scale bars stand for 1 mm. (E) Subcellular localization of GhSEP-GFP proteins. GhHis3 was used as internal controls for qPCR. Error bars denote standard deviation (SD).
Furthermore, we cloned the 2 kb upstream promoters of GhSEP1A, GhSEP2D, GhSEP3.1A, GhSEP4.1D, and GhSEP4.2D whose coding regions were obtained for functional study. GUS reporter lines were constructed driven by these promoters to mimic a detailed expression of GhSEP genes in Arabidopsis (Figure 2D). GUS signals were only observed in the SAM in pro:GhSEP1/2/3.1-GUS Arabidopsis lines. GhSEP4.2 was expressed in the vascular bundle. GUS signals in pro:GhSEP4.1-GUS were observed in the whole leaf. After bolting, GUS signals were all detected in cauline leaves, flowers, and siliques. Interestingly, GhSEP4.1 and GhSEP4.2 displayed a consistent expression pattern in the cauline leaf and sepal as in the true leaf. The GUS signal of pro:GhSEP3.1-GUS was strong in the reproductive organ. GhSEP2 showed unique transcription in ovules consisting of the qPCR results. It worth noticing that the GhSEP4.1 transcriptional level in Arabidopsis leaves shown by GUS staining is not consistent with the low expression level in TM-1 cotton leaves detected by qPCR (Figures 2A, D). The dynamic transcription of GhSEP genes in a plant life cycle indicated at least partially independent functions.
Then, the coding region of each GhSEP gene was cloned and overexpressed with GFP in the tobacco epidermal cells. Consistent with their roles as a transcription factor, the fluorescent signals of the GhSEPs-GFP were detectable in the nuclei (Figure 2E).
In summary, the overlapping and distinguished expression patterns of GhSEPs suggested functional redundancy and diversity. GhSEP4s might function dominantly during floral transition, and each GhSEP gene was likely to participate differently in the formation of each whorl of flowers. The prevalent expression of GhSEP2 in ovule indicated a novel function.
To elucidate the function of GhSEPs, their coding sequences were amplified and the resulting fragments shared the same sequences with GhSEP1A, GhSEP2D, GhSEP3.1A, GhSEP4.1D, and GhSEP4.2D after blasting against the G. hirsutum genome. Considering the high sequence similarity of GhSEP homologies in At and Dt subgenomes, the above sequences of GhSEP genes were overexpressed in Arabidopsis for functional study. There were more than 25 individual T1 lines of each GhSEP gene that flowered uniformly earlier than WT plants (Figures 3A, B). Some individuals even flowered with two rosette leaves (Figure S4A). Five lines of each transgene were randomly selected for transcriptional and phenotypic analysis. The results showed that the flowering time of transgenic plants reduced up to half of the WT plants (Figure 3B) and the flowering phenotype was closely associated with the expression levels in 35S:GhSEPs (Figure 3C), suggesting that GhSEPs promoted flowering time in a dosage-dependent manner.
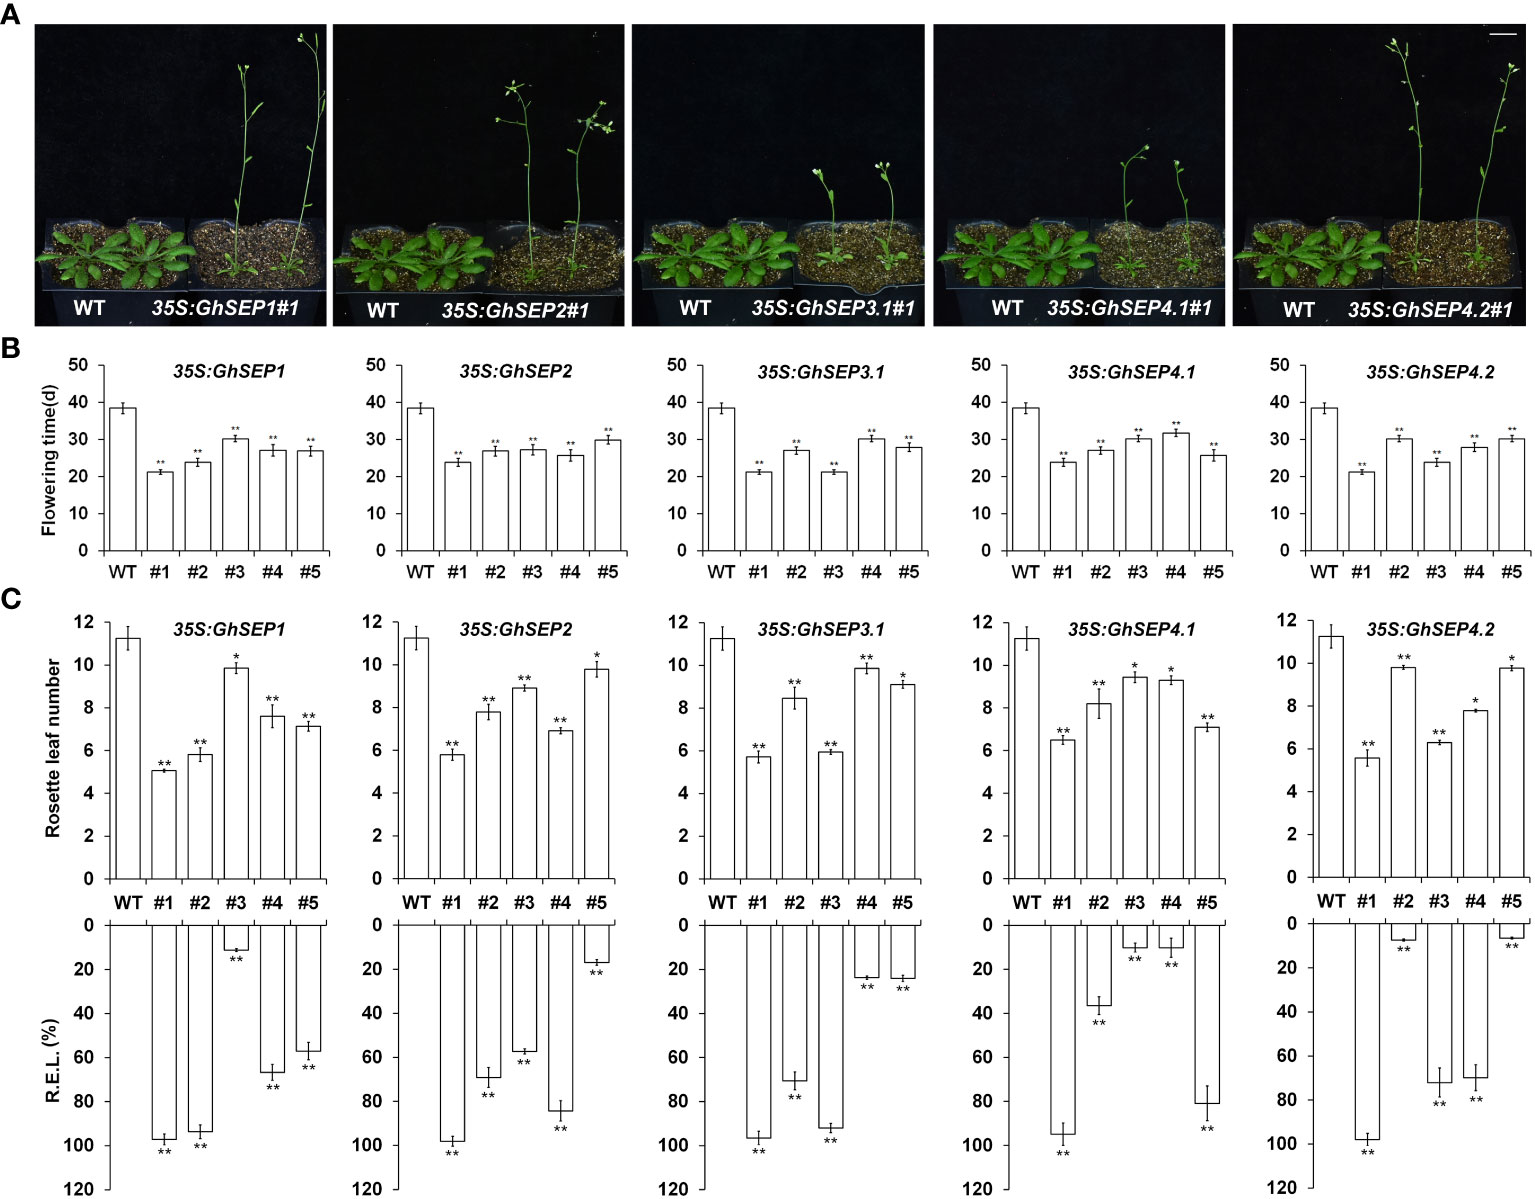
Figure 3 Phenotypes of 35S:GhSEPs transgenic Arabidopsis plants. (A, B) 35S:GhSEPs flowered earlier than wild-type (WT) plants under the long-day (LD) conditions. The same WT plants served as the controls of the transgenic plants for taking photos in A. Scale bar stands for 1 cm. (C) Upregulation of GhSEPs in independent 35S:GhSEP transgenic plants is related to the degree of early flowering under LD conditions. Asterisks indicate significant differences (Student’s t-test, *p ≤ 0.05, **p ≤ 0.01). Error bars denote SD.
Next, due to the similarity of the GhSEPs’ coding sequences, specific fragments from the 3’ UTR of each GhSEP gene were amplified and constructed into the pTRV vector for the virus-induced gene silencing (VIGS) assay applied on an early-maturity cotton CCRI50 to silence the native GhSEP genes. The silencing effects were examined in the SAM (Figure 4A). VIGS caused a decreased expression of the relative gene in the silencing plants of TRV : GhSEP3.1, TRV : GhSEP4.1, and TRV : GhSEP4.2. However, the silencing of GhSEP1 and GhSEP2 was synchronal due to high sequence similarity. The silencing efficiency of each gene was above 70%. Compared with the control group, the silencing of GhSEPs delayed cotton squaring and flowering time (Figures 4B and S5A). The cross-section of the shoot apex at four TLSs demonstrated floral and inflorescence meristems of the control plants indicating the stage of reproductive growth, whereas the SAMs of TRV : GhSEPs were still flattened and only leaf primordia were observed, suggesting that the floral transition has not yet occurred (Figure 4C). A statistical analysis of the traits reflecting cotton maturity suggested that the silencing of GhSEPs resulted in a significant delay of maturity and the effects of GhSEP3.1/4.1/4.2 were comparable (Figure 4D). The late-maturity phenotypes of TRV : GhSEP1 and TRV : GhSEP2 were more severe, which might be resulted from the synchronal silencing of GhSEP1 and GhSEP2. These results described the participation of cotton SEP-like genes in floral transition in a dosage-dependent manner.
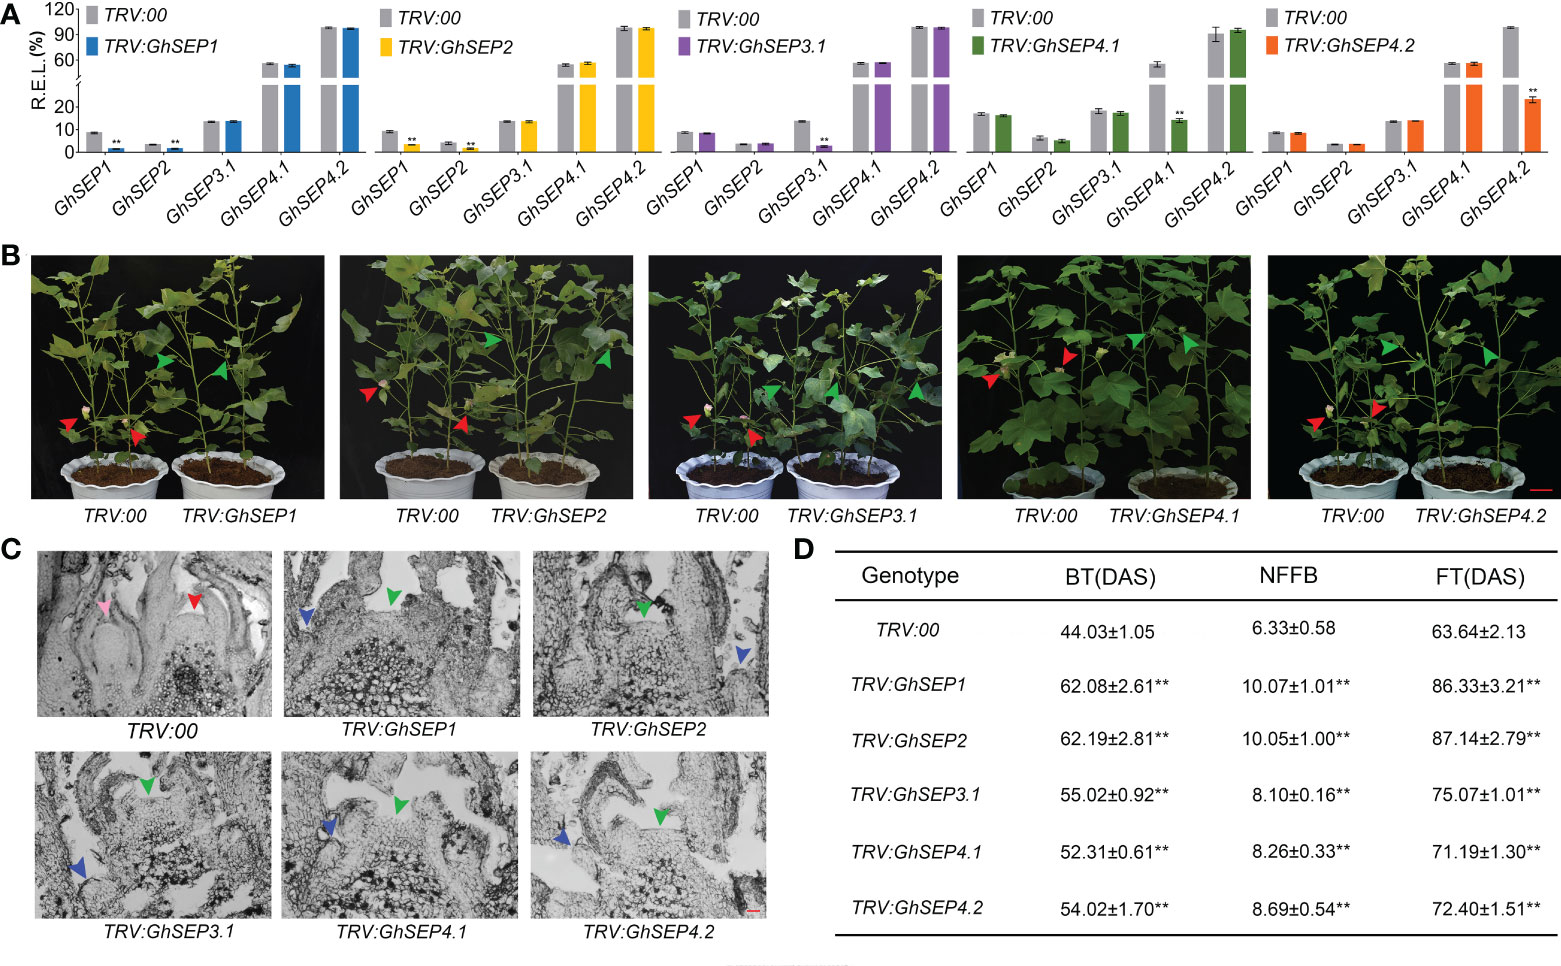
Figure 4 Phenotypes of virus-induced gene-silencing plants of TRV : GhSEPs. (A) Relative expression of each GhSEP gene in cotton silencing lines. Asterisks indicate significant differences according to Student’s t-test at p ≤ 0.01. Error bars denote SD. (B) Silencing of GhSEPs delayed the flowering of cotton. The green and red arrows represented the buds and flowers, respectively. The same control plants were used in the checking of the silencing plants of GhSEP1, GhSEP3.1, and GhSEP4.2 for taking photos. Scale bar stands for 10 cm. (C) Section of the shoot apexes at four TLSs of control and silencing plants. The inflorescence meristem and floral meristem are labeled by red and pink arrows. Blue and green arrows point the young leaf and SAM. Scale bar stands for 1 mm. (D) Statistics of traits related to the early maturity of cotton silencing and control plants. Data were shown as the average ± SD. Asterisks indicate significant differences according to Student’s t-test at p ≤ 0.01. BT, budding time; NFFB, node of the first fruit branch; FT, flowering timing; DAS, days after sowing.
SEP genes are well known as the E function in floral development. Therefore, the organ morphological phenotypes were observed in the overexpression of Arabidopsis and the silencing of cotton plants. Some homozygous plants of 35S:GhSEPs produced curly leaves (Figure S4B). The expression of GhSEPs in those lines were much higher compared with the lines that possessed normal rosette leaves and flowered later (Figure 3). However, the homozygous 35S:GhSEPs consistently showed no significant perturbation of a flower (Figure S4C). Similarly, the silencing of any GhSEPs in the cotton plants had no effects on floral development (Figure S5B). However, some heterozygotes of the Arabidopsis 35S:GhSEPs T1 plants produced abnormal flowers with absent sepals from a leaf-like structure that was similar to bracts (Figure S4A). Moreover, terminal flowers were observed in some individuals. These plants flowered extremely early and failed to produce any seeds. These severe phenotypes could be caused by the higher expression level of any GhSEPs. These results suggested that GhSEPs acted in a dosage-dependent manner.
To elucidate the regulatory mechanism of GhSEPs, the expression of flowering-time genes was first detected in 35S:GhSEPs Arabidopsis plants. The transcription of LFY and AP1 was dramatically upregulated in each of the GhSEP overexpression lines. In addition, the expression of the other flowering time regulators FT, SOC1, CONSTANS (CO), and AGL24 was increased significantly (Figure S6). Although GhSEPs shed similar effects on LFY and AP1 transcription, they upregulated the other detected genes differently in the overexpression lines. GhSEP1 and GhSEP4.1 were likely to perform similarly in flowering time control that SOC1 expression change was weaker than FT, CO, and AGL24. GhSEP2 had an even effect on the examined flowering time genes. Only FT transcriptional increase was violent in the 35S:GhSEP3.1 lines. Additionally, GhSEP4.2 regulated FT and SOC1 at the similar level that was stronger than the regulation of CO and AGL24. The discrepancy of the effects of GhSEPs on flowering time regulators indicated the distinct roles of each GhSEP in flowering time control. Then, the expression trends of LFY, AP1, FT, and SOC1 were monitored in Arabidopsis developing seedlings. AP1 and LFY expression increased rapidly 5 days after germination of the 35S:GhSEPs plants, while they remained at a relatively low level in the WT plants, suggesting that the floral transition occurred earlier in the 35S:GhSEPs plants. However, the expression trends of FT and SOC1 were similar in the GhSEP overexpression and WT plants, except for the FT expression trend in the 35S:GhSEP4.1 (Figure 5A). These results suggested that the upregulation of SOC1 and FT in the 35S:GhSEP plants might be indirect.
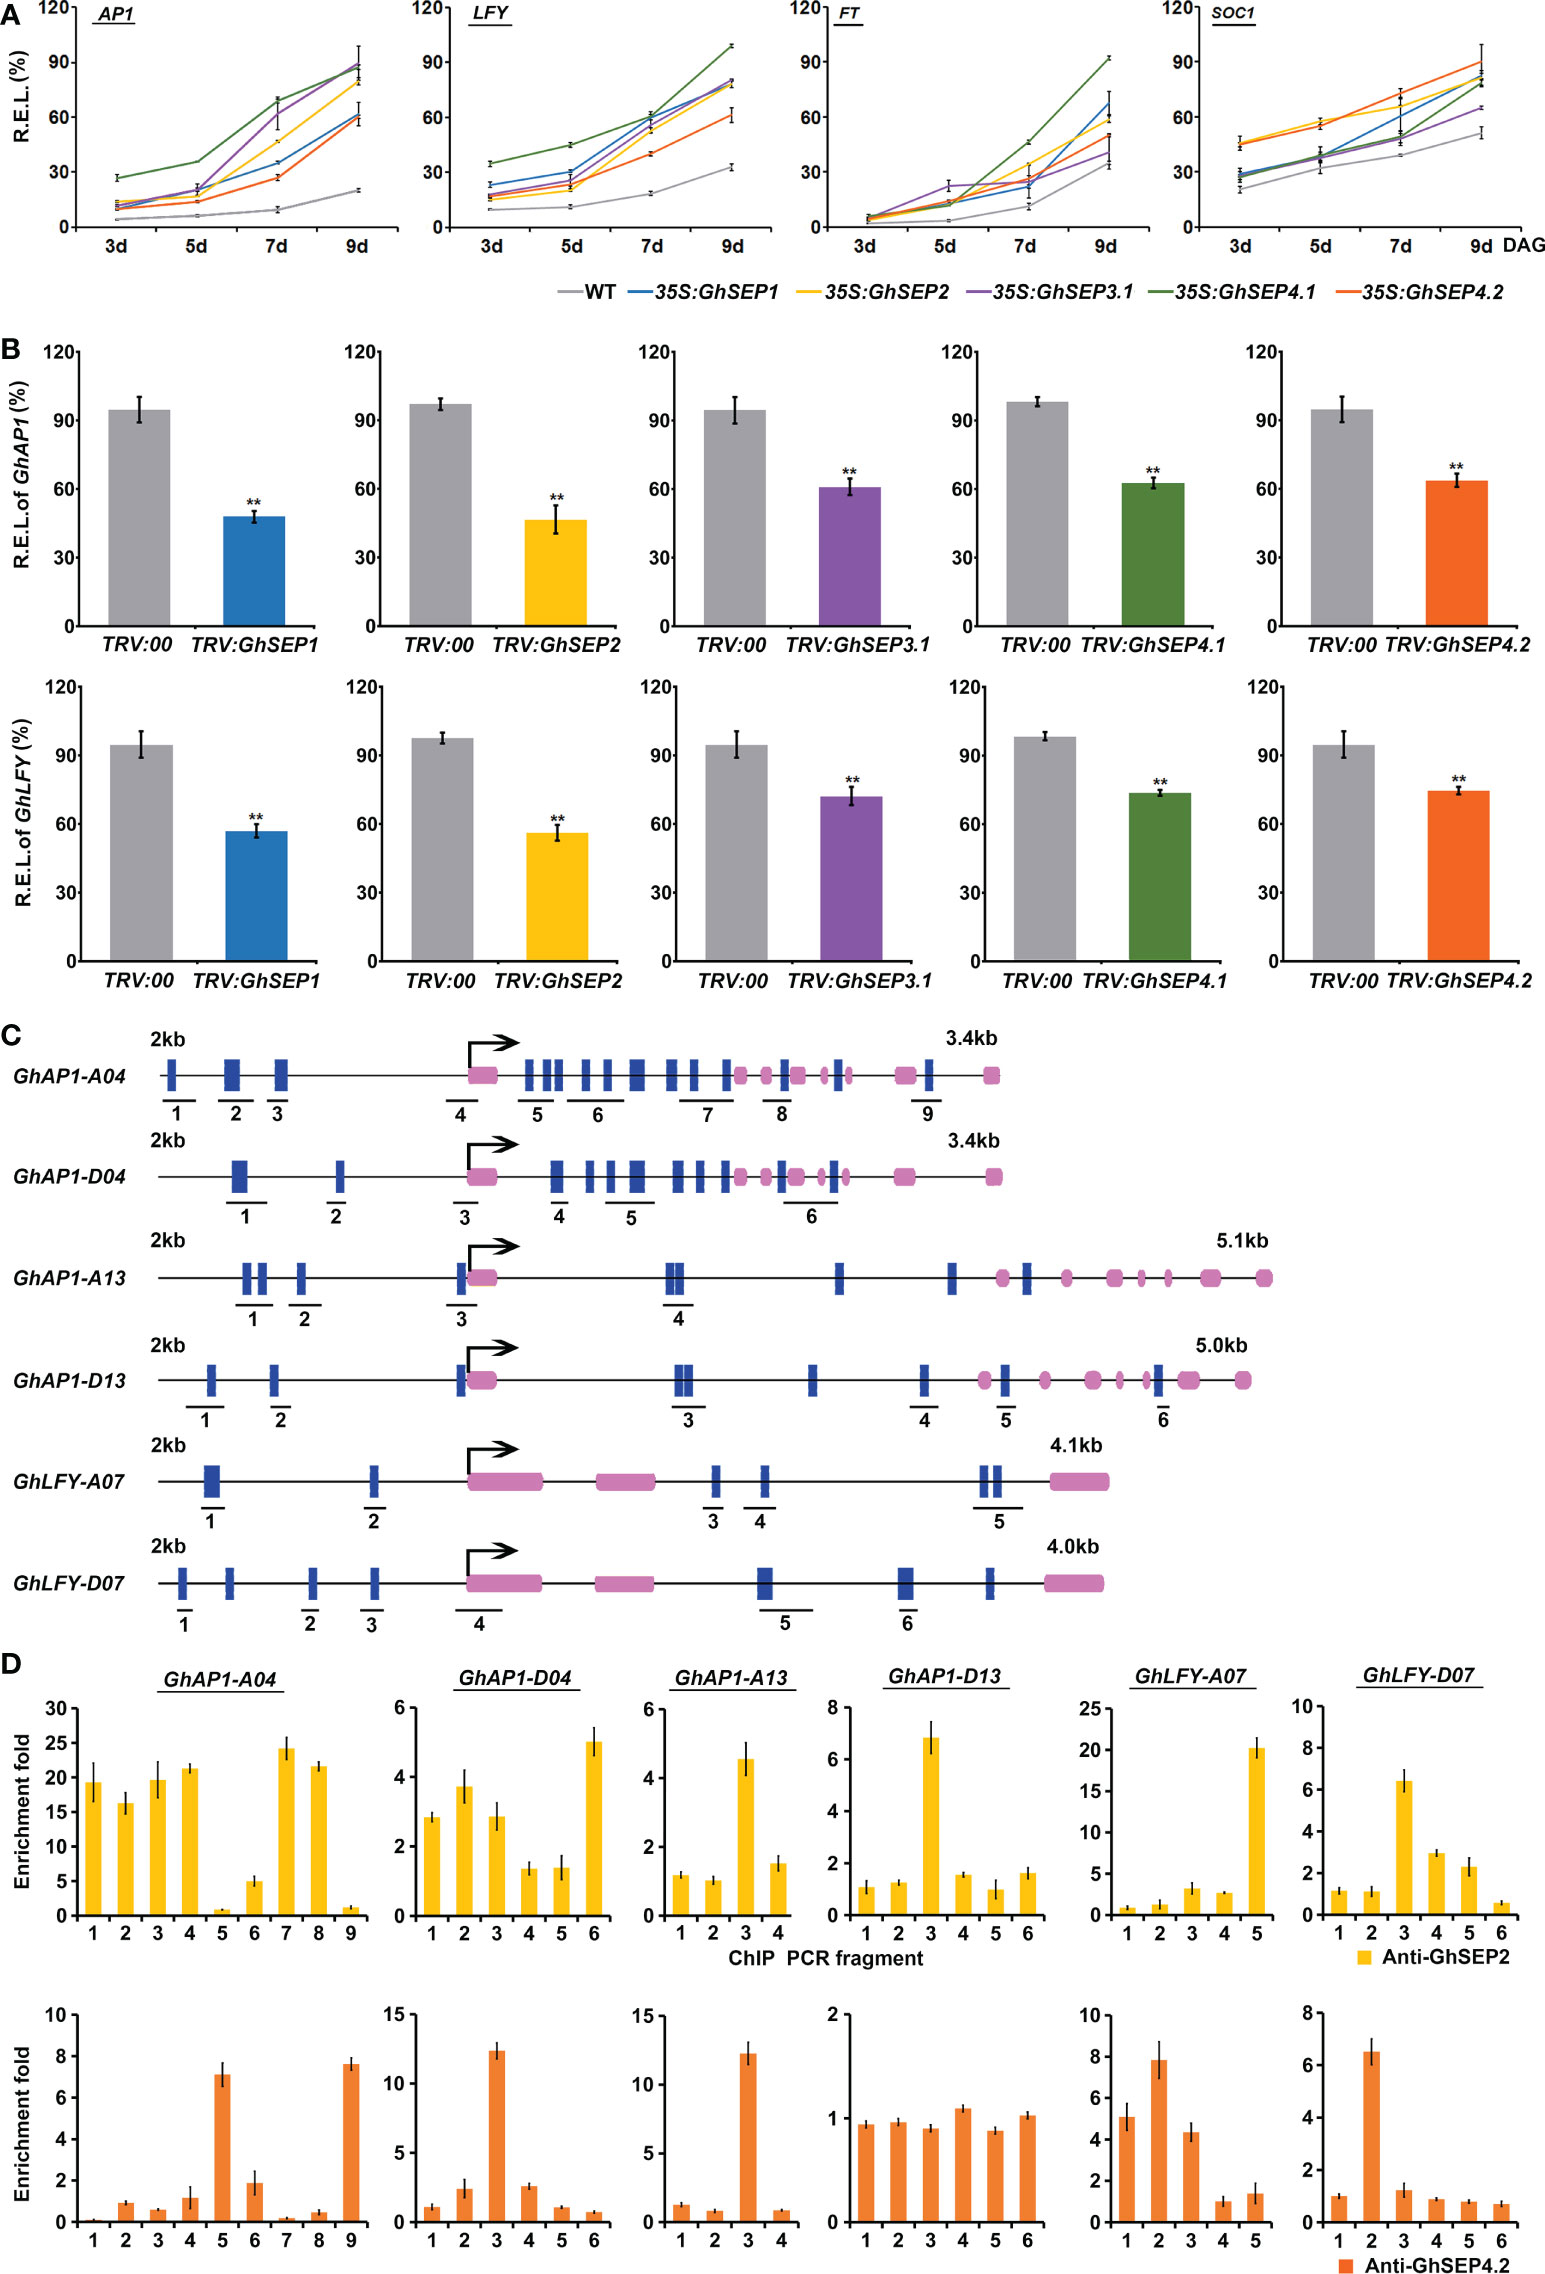
Figure 5 GhSEPs directly regulate GhAP1 and GhLFY. (A) Temporal expression of AtAP1, AtLFY, AtFT, and AtSOC1 in Arabidopsis developing seedlings of WT and 35S:GhSEP plants. (B) Expression of GhAP1 and GhLFY in cotton-silencing lines and control plants. Asterisks indicate significant differences according to Student’s t-test at p ≤ 0.01. (C) Prediction of the CArG box in the genome regions of GhAP1 and GhLFY. Exons are represented by purple boxes, and the other genomic regions are represented by black lines. Blue boxes indicate the sites containing either a single mismatch or a perfect match to the consensus binding sequence (CArG-box) of MADS-domain proteins. The number under the schematic diagram means the DNA fragments designed for the ChIP analysis of the GhSEP binding site as shown in (D). kb, kilobase. (D) ChIP analysis of GhSEP binding to the GhAP1 and GhLFY genomic regions. Error bars denote SD.
Furthermore, the expression of flowering time genes was analyzed in the TRV : GhSEP silencing plants (Figure 5B). Consistent with the expression change in Arabidopsis, the silencing of GhSEPs all caused significant expression decreases of GhAP1 and GhLFY, among which the same expression variation was found in TRV : GhSEP1 and TRV : SEP2 that was greater than that in TRV : GhSEP3.1 and TRV : GhSEP4s, which was probably due to the cosilencing effects on GhSEP1/2. However, GhFT and GhSOC1 expression was undisturbed by the effective silence of GhSEPs (Figure S5C), which supported our speculation on the transcriptional increases of SOC1 and FT in the 35S:GhSEPs of Arabidopsis.
Therefore, LFY and AP1 might be the downstream target genes of GhSEPs in the regulation of flowering time. To prove this, ChIP analysis was performed to examine the direct binding of GhSEPs to the GhLFY and GhAP1 genomic DNA. In the upland cotton genome, there were four copies of GhAP1 and two copies of GhLFY whose transcriptional regulation regions were different from each other. Thus, the CArG-box elements were predicted on their whole genome regions. The results showed that GhAP1-A04 and -D04 contained denser CArG-boxes, especially in the first introns (Figure 5C). Considering the higher expression of GhSEP4.2 in cotton leaves (Figure 2A) and the specific expression of GhSEP2 in the seed and fiber (Figure 2D and S3C), the DNA fragments bound with GhSEP2-HA and GhSEP4.2-HA were extracted from cotton protoplasts overexpressing the fusion proteins (Figure S7), respectively. The results suggested that GhSEP2 was strongly bound to the genomic region of GhAP1-A04 around the start codon and the other two regions distributed in balance of the up- and downstream of the start codon (Figure 5D). The binding distribution of GhSEP2 to the GhAP1-D04 was similar to that of GhAP1-A04, but the fold enrichment was quite lower than GhAP1-A04. Fold enrichments were also detected at a low level around the start codon of GhAP1-A13 and the middle region of the first intron of GhAP1-D13. GhSEP2 was also strongly bound to GhLFY-A07 at the end of second intron and weakly bound to the genomic region near the stat codon of GhLFY-D07. Different from GhSEP2, GhSEP4.2 did not bind to GhAP1-D13 and displayed no binding superiority to the other GhAP1 and GhLFYs. Two binding regions were detected located at the first and last introns of GhAP1-A04 and 1.8 kb up- and downstream of the start codon of GhLFY-A07. GhSEP4.2 was bound to the transcription start region of GhAP1-D04 and GhAP1-A13 and the 1 kb upstream of the start codon in the GhLFY-D07 genome. Additionally, it seemed that GhSEP2 binding affinity was stronger than GhSEP4.2, which is supported by in vitro EMSA results (Jetha et al., 2014), and GhSEPs were likely to loop DNA that was explained by the separated CArG-boxes in two binding sites (Melzer et al., 2009).
DNA looping is formed with the binding of MADS tetramers (Theissen and Saedler, 2001). Hence, the protein interaction of GhSEPs were analyzed. First, we failed to study the dimerization between GhSEPs in two directions in yeast cells due to the strong self-activation of GhSEP2. Subsequently, the homodimers and heterodimers of GhSEPs were visualized by the bimolecular fluorescence complementation (BiFC) assay (Figure 6A). All the GhSEP proteins were capable to form heterodimers between each other, and homodimerizations were observed, except for GhSEP2. Then, the interaction between GhSEPs and flowering time regulators were tested, including GhAP1 (GhM_A13G0958), GhSOC1.4 (GhM_A11G0098), and GhSVP.5 (GhM_A12G1181). Strong interactions between GhSEPs and GhAP1, GhSOC1.4, and GhSVP.5 were detected both in the yeast two-hybrid assay and BiFC analysis (Figures 6B, C). These results suggested that GhSEPs were able to form tetramers with flowering time regulators and themselves.
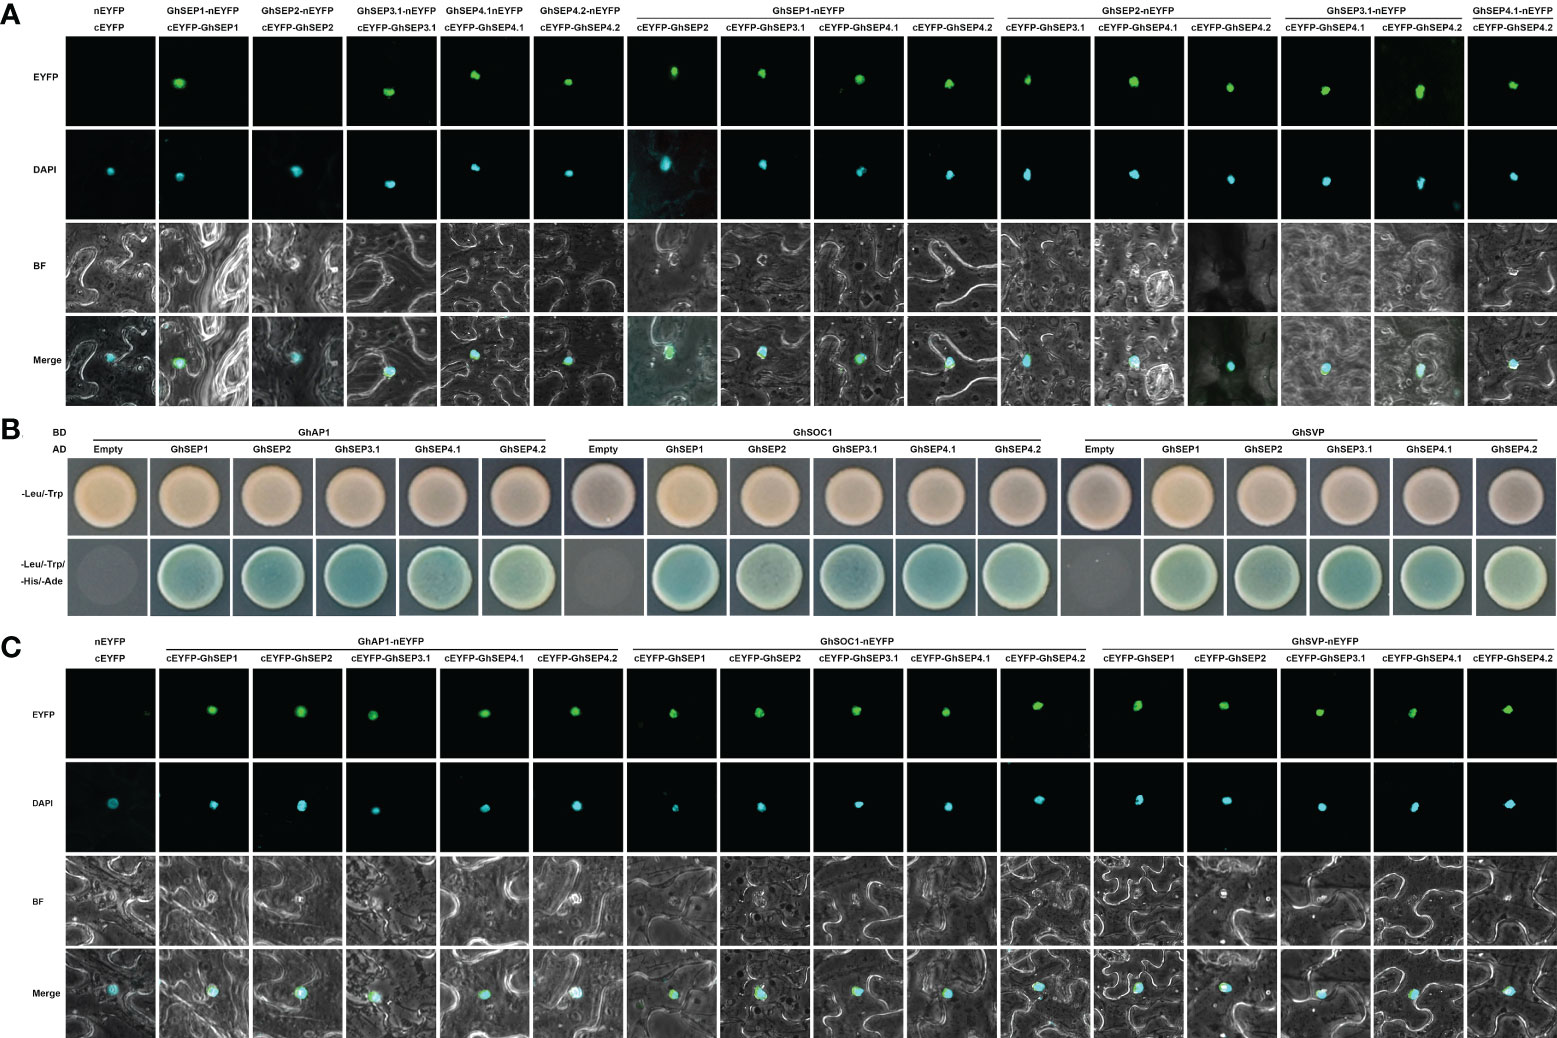
Figure 6 Protein interaction between GhSEP proteins and flowering time regulators. (A) Interaction between GhSEP proteins detected by the bimolecular fluorescence complementation (BiFC) assay. (B) Interaction of GhSEP proteins and flowering time regulators detected by the yeast two-hybrid assay. (C) Interaction of GhSEP proteins and flowering time regulators detected by the BiFC assay.
Plant MADS-box transcription factors play essential roles in almost every developmental process. Many MADS-box genes have conserved functions across the angiosperms, but some have evolved novel functions in specific species. The morphological diversity of flower organs is closely related to functional divergence within the MADS-box genes. An evolutionary analysis of the MADS genes in plants points out a close link of SEP-like genes’ origination with angiosperm evolution, especially in the formation of bisexual flowers (Zahn et al., 2005; Theissen and Melzer, 2007; Ruelens et al., 2017). The overexpression of cotton SEP-like genes affected inflorescence and floral development (Figure S4A), which is conserved in the angiosperm. Aside from floral development, the flowering time variation was observed in the overexpressing and silencing plants of a single GhSEP (Figures 3, 4), revealing the roles of GhSEPs in promoting flowering. However, the mutation or silencing of single SEP-like genes in Arabidopsis, petunia, orchid, rice, and tomato does not affect flowering time although an overexpression of them causes the early flowering of Arabidopsis (Ditta et al., 2004; Matsubara et al., 2008; Pan et al., 2014; Wu et al., 2018; Zhang et al., 2018). These phenotypes suggested that the function of GhSEPs in floral development is largely redundant, but their function in flowering time control is less redundant.
SEP-like genes share a most recent common ancestor with AGL6 and AP1 genes 296 MYA (Shen et al., 2019) and duplicated in the whole genome duplication event in flowering plants (Zhao et al., 2017). It could be observed in the phylogenetic tree of MADS-box genes that the lineages of SEP-, SQUA-, FLC-, and AGL6-like genes are nested within a strongly supported superfamily by evolutionary conserved tandem duplications between SEP1 and SQUA, as well as SEP3 and FLC (Ruelens et al., 2013; Zhao et al., 2017). Syntenic relationships are also supported by the conserved tandems of SEP-SOC1 and SEP-SVP in the angiosperm (Zhao et al., 2017). The evolutionary evidence all points to a close relation of SEP-like genes with MADS flowering time regulators. The members of the SOC1-, SVP-, FLC-, and SQUA-like genes are generally the regulators of floral transition that determines the flowering time and reproductive success (Bowman et al., 1993; He, 2012). Additionally, the functional characterization of gymnosperm AGL6- and SOC1-like genes CjMADS14 and CjMADS15 show their conserved function in flowering time control (Katahata et al., 2014). Consistently, the clusters of SVP, AG, AP1, and SOC1 genes diverge sequentially in this order to form the SEP genes in the lineage of cotton MADS genes (Nardeli et al., 2018), suggesting that cotton MADS transcription factors evolute conservedly. Therefore, we speculate that the function in the flowering time control of GhSEP genes was preserved from the ancestor during evolution.
It has always been considered that SEP-like genes in angiosperms are clustered into two groups: the SEP1/2/4 and SEP3 (Shen et al., 2019). However, cotton SEP4 genes diverged independently with AtSEP4 and monocot SEP-like genes other than SEP3 orthologs (Figure 1A). In the SEP4 clade, OsMADS34, OsMADS1, and OsMADS5 contribute to the origin of distinct grass inflorescences and spikelets (Gao et al., 2010; Meng et al., 2017), whereas the other cotton SEP genes were clustered with SEP1/2/3 orthologs that function as flowering time promoters and floral organ determinators (Chung et al., 1994; Ferrario, 2003; Zhang et al., 2017; Lin et al., 2020). The sequence diversity and different conserved motifs in the C terminal of GhSEPs also supported the functional divergency (Figure S2) (Vandenbussche et al., 2003a). Consistently, the expression of each GhSEP gene differed spatially and temporally (Figure 2), suggesting that they have diverse functions. Hence, we propose that the neofunctionalization and redundancy that occurred following gene duplication jointly contribute to the functions of GhSEPs (Zahn et al., 2006).
Dosage dependency is common in the regulation of quantitative traits. This principle coincided with the early flowering phenotype of Arabidopsis overexpression lines varied along with the expression level of GhSEPs (Figure 3C). The sterile 35S:GhSEPs plants flowered with only two or fewer leaves (Figure S4A), which was reasonably caused by the excessive transcription levels of GhSEPs. Under these circumstances, floral defects were visible. In Arabidopsis, the inactivation of one SEP1 allele in a sep2 sep3 double-mutant background converts the normal flowers to severe abnormalities in ovule development (Favaro et al., 2003). A further reduction of SEP1 activity in the sep1 sep2 sep3 triple mutant results in flowers consisting of sepals only (Pelaz et al., 2000). The flower formation is fully disturbed in sep1 sep2 sep3 sep4 quadruple mutants that only leaf-like organs exist (Ditta et al., 2004). The defects of rice spikelet progress in osmads1-z osmads5-3 osmads34-1 triple mutants compared with double mutants osmads1-z osmads5-3 and osmads1-z osmads34-1 (Wu et al., 2018). The phenotypic evidence all reveals that the function of SEP proteins in floral development depends on their concentration.
The in vitro binding assay of SEPs and CArG fragments proved that protein concentration affects the binding affinity of SEPs and their cooperative complexes (Jetha et al., 2014; Rumpler et al., 2018), which lay a molecular foundation of the concentration-dependent regulation of SEP proteins to their target genes. Furthermore, the regulation of zygotic genes by maternal-effect genes during the Drosophila development sets a paradigmatic example for concentration-dependent target gene regulation (Lander, 2007). Whether SEP protein concentration is responsible for different target gene regulation lacks evidence. The Arabidopsis GhSEP overexpression lines could be summarized into three types according to the phenotypes (Figure 3). Type I only flowered earlier, and GhSEP expression levels were the lowest in the plants compared to the other transgenic lines. In Type II plants, the transcripts of GhSEPs were more abundant than Type I plants and curled leaves were additionally observed. Type III plants further demonstrated floral organ defects due to the excessive expression. The phenotypic variation is controlled by different genes downstream of GhSEPs. Therefore, a relatively minor accumulation of GhSEP proteins suffice to promote flowering, but the function in floral development requires more abundant GhSEPs.
Although the FQM describes the mechanism of SEP in floral development, the regulatory mechanism in flowering time control remains unclear. The overexpression of SEP3 causes similar phenotypes as 35S:AP1 to promote the flowering of Arabidopsis, which could be masked by an elevated expression of LFY. As a floral meristem identity gene, LFY is a downstream of SEP3 (Castillejo et al., 2005), and the activation of LFY will, in turn, accelerate floral transition (Moon et al., 2005). OsMADS7 (also named OsMADS45) is a SEP3 homolog. The overexpression of OsMADS7 can overcome photoperiod to upregulate Hd3a and RFT1 simultaneously resulting in early flowering (Wang et al., 2013). The expression changes of FT, SOC1, CO, LFY, and AP1 in 35S:GhSEPs were consistent with the overexpression lines of other SEP orthologs (Figure S6) (Tzeng et al., 2003; Pu et al., 2020). However, the expression trend of FT and SOC1 in the 35S:GhSEP plants remained the same as in the WT, whereas the transcriptional elevation of LFY and AP1 advanced suggesting earlier floral transition (Figure 5A). Meanwhile, the late flowering phenotype induced by the decrease of GhSEP expression was only related to the expression changes of GhAP1 and GhLFY (Figures 5B and S5C). Thus, AP1 and LFY were the downstream genes of GhSEPs in flowering time control. A genome-wide identification of AtSEP3 and OsMADS1 (SEP4 homolog) targets both demonstrate the direct binding of them to the gibberellic acid (GA) biosynthesis genes to regulate the GA level that is involved in regulating flowering time (Kaufmann et al., 2009; Khanday et al., 2016). Thus, the expression changes of other flowering time genes in 35S:GhSEP plants might be due to the regulation of GA biosynthesis.
Previous studies revealed the transcription of GhAP1 in the leaf and SAM (Cheng et al., 2021), whereas GhLFY expression was mainly detected in the SAM (Li et al., 2013). Only GhSEP4.2 displayed commensurate expression in leaf with GhAP1 (Figure 7A). Thus, we hypothesize that GhAP1 is one of the targets of GhSEP4.2 in the leaf, where GhSEP4.2 interacts with GhSOC1, GhSVP, and itself to form tetramers (Figure 7B). In the SAM, GhSEPs were highly expressed at different time forming dynamic tetramers (Figure 7B). GhSEP4.1 and GhSEP4.2 were mainly expressed in the inflorescence meristem and maintained reproductive growth. They were also expressed earlier in the floral meristem to determine the formation of the calycle, sepal, and petals. GhSEP1 was then expressed to participate in the growth of the sepal, petal, and stamen. GhSEP2 and GhSEP3.1 were expressed latest to regulate petal and stamen formation. In addition, the pistil determination only involved GhSEP3.1. GhSEP2 expression was upregulated in the ovule when the fiber initiates. The fine-tuning of the transcription of GhSEP genes was essential for their function in reproductive growth, and the resulting protein tetramers, in turn, regulated different target genes in the SAM.
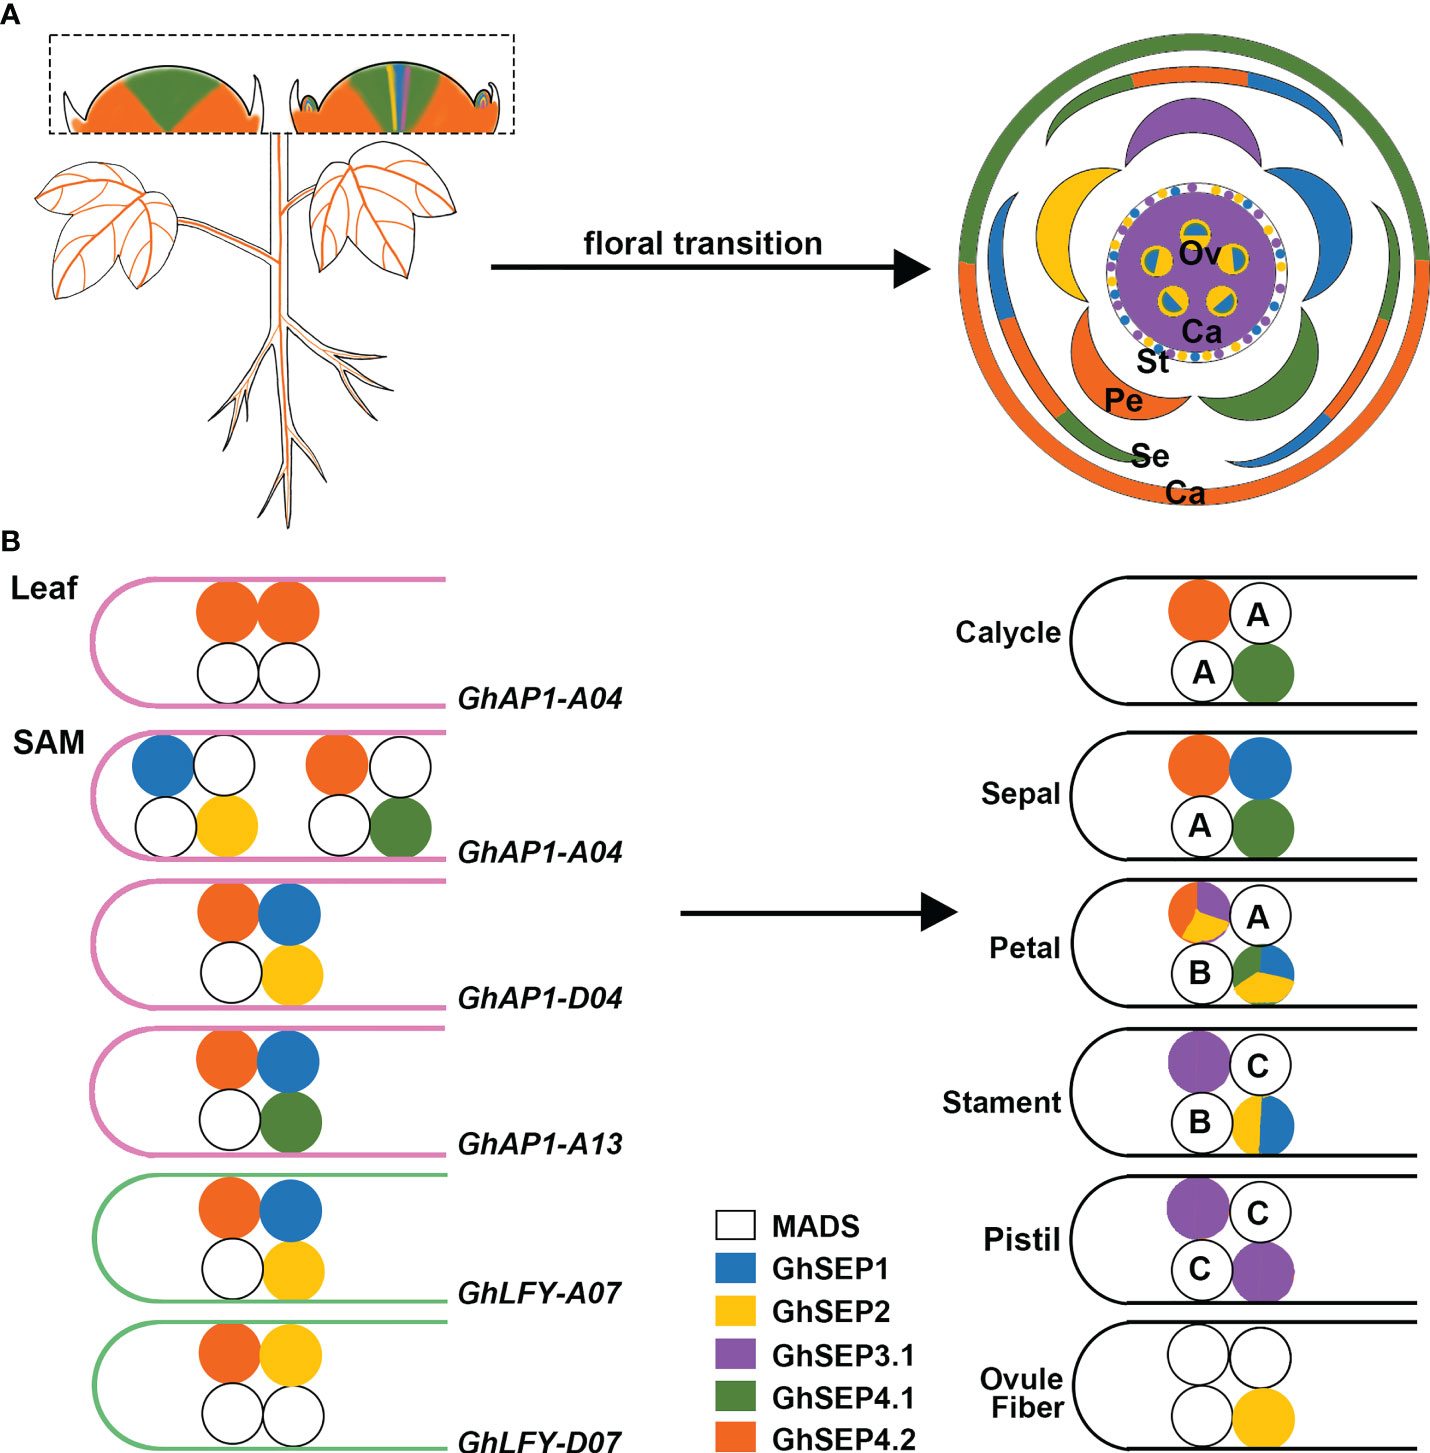
Figure 7 The proposed model of the GhSEP regulatory mechanism. (A) Spatial and temporal expression dynamic of GhSEP genes during reproductive growth. Ca, calycle; Se, sepal; Pe, petal; St, stamen; Pi, pistil; Ov, ovule. (B) Speculation of protein complexes involving different GhSEP proteins and their target loci. A, B, and C indicate the ABC genes. In the model, GhSEP genes are transcribed sequentially in the leaf and SAM resulting in dynamic protein tetramers containing other MADS proteins to directly regulate different target genes to promote floral transition and regulate the reproductive growth in the SAM.
MADS proteins form tetramers to loop DNA, and this process requires only a limited amount of interaction energy between the DNA-bound dimer (Melzer et al., 2009; Jetha et al., 2014). According to this principle, GhSEP4.2 binds to GhAP1-A04 easier than other GhAP1 regions as two separated binding sites were identified with an equal enrichment (Figures 5D and Figure 7). GhSEP4.1/4.2 accumulated dramatically due to their numerous transcripts, which is the same as Arabidopsis SEP4 that transcribes earliest in the SAM (Ditta et al., 2004). The transcriptional superiority usually contributes to a dominant role. However, GhSEP4.2 bindings in GhAP1 genome region were comparatively weaker than GhSEP2 binding to GhAP1-A04 (Figure 5D). Moreover, GhSEP2 was unable to self-dimerize (Figure 6A). GhSEP2 binding to GhAP1-A04 must be coordinated. GhSEP1, whose expression was higher in the SAM, was considered rather than GhSEP4.2 because the binding sites of GhSEP2 did not overlap with that of GhSEP4.2. Inferring from these, GhSEP1 and GhSEP2 regulate GhAP1 dominantly on A04 loci (Figure 7B). Furthermore, the binding sites of GhSEP4.2 coincide with that of GhSEP2 on GhAP1-D04 and -A13. They form a heterodimer to regulate these two loci. Separated binding sites suggested a loop of GhAP1-D04. However the weak binding of GhSEP2 on GhAP1-A13 should be strengthened via other GhSEPs. GhSEP4.1, GhSEP4.2, or GhSEP1, rather than GhSEP2, might cooperate with the regulation on GhAP-A13 due to their stronger interaction ability. Meanwhile, the binding on GhAP1-D13 was only detected by GhSEP2 with a relatively low enrichment indicating a weak regulation of GhSEPs on this locus. Next, the binding superiority for GhLFY was also in the At subgenome. Heterodimerization is responsible for the strong binding. The similar enrichment and nearby binding sites of GhSEP2 and GhSEP4.2 suggested a cobinding on GhLFY-D07 (Figure 5D). This regulatory model also needs the participation of flowering time regulators, such as GhSOC1 and GhSVP (Figures 6B,C). Members in a tetramer constrained each other to achieve a fine-tuning of the reproductive success of cotton to produce fibers.
Overall, the proposed model described a sequential developmental regulation from vegetative to reproductive growth linked by the temporal and spatial expression of GhSEP genes whose function is largely dependent on the cofactors to form different complexes dynamically to target different downstream genes. It provides new insights into the sequential regulation of cotton flowering and reproductive growth that contribute to fiber production.
The original contributions presented in the study are included in the article/Supplementary Material. Further inquiries can be directed to the corresponding author.
ZM and YY supervised the project. YY conceived and designed the experiment. LC performed most of the experiments. YY and LC analyzed the data and wrote the paper. CM assisted in bioinformatic analysis. ZZ worked with the ChIP experiment. HK, LM, ZS, BC, ZWL, GW, JY, JW, ZKL, LW, GZ, YZ, and XW helped with the preparation of plant materials and expression analysis. All authors contributed to the article and approved the submitted version.
This work was supported by Natural Science Foundation of Hebei Province (grant no. C2020204079), National Natural Science Foundation of China (grant no. 31801410), Supporting Project of Hebei Agricultural University (grant no. ZD201601, PT2018004), and Top Talent Project of Hebei Province to ZM (031601801).
The authors declare that the research was conducted in the absence of any commercial or financial relationships that could be construed as a potential conflict of interest.
All claims expressed in this article are solely those of the authors and do not necessarily represent those of their affiliated organizations, or those of the publisher, the editors and the reviewers. Any product that may be evaluated in this article, or claim that may be made by its manufacturer, is not guaranteed or endorsed by the publisher.
The Supplementary Material for this article can be found online at: https://www.frontiersin.org/articles/10.3389/fpls.2022.990221/full#supplementary-material
Supplementary Figure 1 | Photobleaching phenotype of the positive control.
Supplementary Figure 2 | Sequence analysis of GhSEP genes.
Supplementary Figure 3 | Expression of GhSEP genes.
Supplementary Figure 4 | Phenotypes of 35S:GhSEP transgenic Arabidopsis lines.
Supplementary Figure 5 | Phenotypes and expression of flowering time regulators in GhSEP silencing plants.
Supplementary Figure 6 | Expression of flowering time regulators in 35S:GhSEPs.
Supplementary Figure 7 | Detection of fusion proteins by Western blot.
Supplementary Table 1 | Primer list.
Supplementary Table 2 | List of the proteins used in the phylogenetic tree.
Supplementary Table 3 | List of SEP-like genes in G. hirsutum.
Supplementary Table 4 | Sequence similarity of SEP-like genes in G. hirsutum.
Bowman, J. L., Alvarez, J., Weigel, D., Meyerowitz, E. M., Smyth, D. R. (1993). Control of flower development in arabidopsis thaliana by APETALA1 and interacting genes. Development 119, 721–743. doi: 10.1242/dev.119.3.721
Castillejo, C., Romera-Branchat, M., Pelaz, S. (2005). A new role of the arabidopsis SEPALLATA3 gene revealed by its constitutive expression. Plant J. 43, 586–596. doi: 10.1111/j.1365-313X.2005.02476.x
Chen, C., Chen, H., Zhang, Y., Thomas, H. R., Frank, M. H., He, Y., et al. (2020). TBtools: An integrative toolkit developed for interactive analyses of big biological data. Mol. Plant 13, 1194–1202. doi: 10.1016/j.molp.2020.06.009
Cheng, X., Wang, H., Wei, H., Gu, L., Hao, P., Sun, H., et al. (2021). The MADS transcription factor GhAP1.7 coordinates the flowering regulatory pathway in upland cotton (). Gene 769, 145235. doi: 10.1016/j.gene.2020.145235
Chen, F., Zhang, X., Liu, X., Zhang, L. (2017). Evolutionary analysis of MIKC(c)-type MADS-box genes in gymnosperms and angiosperms. Front. Plant Sci. 8, 895. doi: 10.3389/fpls.2017.00895
Chung, Y. Y., Kim, S. R., Finkel, D., Yanofsky, M. F., An, G. (1994). Early flowering and reduced apical dominance result from ectopic expression of a rice MADS box gene. Plant Mol. Biol. 26, 657. doi: 10.1007/BF00013751
Cseke, L. J., Cseke, S. B., Ravinder, N., Taylor, L. C., Shankar, A., Sen, B., et al. (2005). SEP-class genes in populus tremuloides and their likely role in reproductive survival of poplar trees. Gene 358, 1–16. doi: 10.1016/j.gene.2005.05.035
Cui, R., Han, J., Zhao, S., Su, K., Wu, F., Du, X., et al. (2010). Functional conservation and diversification of class e floral homeotic genes in rice (Oryza sativa). Plant J. 61, 767–781. doi: 10.1111/j.1365-313X.2009.04101.x
De Folter, S., Immink, R. G., Kieffer, M., Parenicova, L., Henz, S. R., Weigel, D., et al. (2005). Comprehensive interaction map of the arabidopsis MADS box transcription factors. Plant Cell 17, 1424–1433. doi: 10.1105/tpc.105.031831
Ditta, G., Pinyopich, A., Robles, P., Pelaz, S., Yanofsky, M. F. (2004). The SEP4 gene of arabidopsis thaliana functions in floral organ and meristem identity. Curr. Biol. 14, 1935–1940. doi: 10.1016/j.cub.2004.10.028
Elo, A., Lemmetyinen, J., Turunen, M. L., Tikka, L., Sopanen, T. (2001). Three MADS-box genes similar to APETALA1 and FRUITFULL from silver birch (Betula pendula). Physiol. Plant 112, 95–103. doi: 10.1034/j.1399-3054.2001.1120113.x
Favaro, R., Pinyopich, A., Battaglia, R., Kooiker, M., Borghi, L., Ditta, G., et al. (2003). MADS-box protein complexes control carpel and ovule development in arabidopsis. Plant Cell 15, 2603–2611. doi: 10.1105/tpc.015123
Ferrario, S. (2003). The MADS-box gene FBP2 is required for SEPALLATA function in petunia. Plant Cell 15, 914–925. doi: 10.1105/tpc.010280
Flanagan, C. A., Ma, H. (1994). Spatially and temporally regulated expression of the MADS-box gene AGL2 in wild-type and mutant arabidopsis flowers. Plant Mol. Biol. 26, 581–595. doi: 10.1007/BF00013745
Gao, X., Liang, W., Yin, C., Ji, S., Wang, H., Su, X., et al. (2010). The SEPALLATA-like gene OsMADS34 is required for rice inflorescence and spikelet development. Plant Physiol. 153, 728–740. doi: 10.1104/pp.110.156711
Hao, P., Wu, A., Chen, P., Wang, H., Ma, L., Wei, H., et al. (2021). GhLUX1 and GhELF3 are two components of the circadian clock that regulate flowering time of gossypium hirsutum. Front. Plant Sci. 12. doi: 10.3389/fpls.2021.691489
He, Y. (2012). Chromatin regulation of flowering. Trends Plant Sci. 17, 556–562. doi: 10.1016/j.tplants.2012.05.001
Huang, F., Xu, G., Chi, Y., Liu, H., Xue, Q., Zhao, T., et al. (2014). A soybean MADS-box protein modulates floral organ numbers, petal identity and sterility. BMC Plant Biol. 14, 89. doi: 10.1186/1471-2229-14-89
Hu, Y., Chen, J., Fang, L., Zhang, Z., Ma, W., Niu, Y., et al. (2019). Gossypium barbadense and gossypium hirsutum genomes provide insights into the origin and evolution of allotetraploid cotton. Nat. Genet. 51, 739–748. doi: 10.1038/s41588-019-0371-5
Immink, R. G. H., Tonaco, I. A. N., De Folter, S., Shchennikova, A., Van Dijk, A. D. J., Busscher-Lange, J., et al. (2009). SEPALLATA3: the 'glue' for MADS box transcription factor complex formation. Genome Biol. 10, R24. doi: 10.1186/gb-2009-10-2-r24
Jang, S., Hong, M. Y., Chung, Y. Y., An, G. (1999). Ectopic expression of tobacco MADS genes modulates flowering time and plant architecture. Molecules Cells 9, 576–586.
Jetha, K., Theißen, G., Melzer, R. (2014). Arabidopsis SEPALLATA proteins differ in cooperative DNA-binding during the formation of floral quartet-like complexes. Nucleic Acids Res. 42, 10927–10942. doi: 10.1093/nar/gku755
Kang, H. G., Jang, S., Chung, J. E., Cho, Y. G., An, G. (1997). Characterization of two rice MADS box genes that control flowering time. Molecules Cells 7, 559–566.
Katahata, S.-I., Futamura, N., Igasaki, T., Shinohara, K. (2014). Functional analysis of SOC1-like and AGL6-like MADS-box genes of the gymnosperm cryptomeria japonica. Tree Genet. Genomes 10, 317–327. doi: 10.1007/s11295-013-0686-9
Kaufmann, K., Muiño, J., Jauregui, R., Ca, A., Smaczniak, C., Krajewski, P., et al. (2009). Target genes of the MADS transcription factor SEPALLATA3: integration of developmental and hormonal pathways in the arabidopsis flower. PloS Biol. 7, e1000090. doi: 10.1371/journal.pbio.1000090
Khanday, I., Das, S., Chongloi, G. L., Bansal, M., Grossniklaus, U., Vijayraghavan, U. (2016). Genome-wide targets regulated by the OsMADS1 transcription factor reveals its DNA recognition properties. Plant Physiol. 172, 372–388. doi: 10.1104/pp.16.00789
Kumar, S., Stecher, G., Tamura, K. (2016). MEGA7: Molecular evolutionary genetics analysis version 7.0 for bigger datasets. Mol. Biol. Evol. 33, 1870–1874. doi: 10.1093/molbev/msw054
Lander, A. D. (2007). Morpheus Unbound: reimagining the morphogen gradient. Cell 128, 245–256. doi: 10.1016/j.cell.2007.01.004
Lemmetyinen, J., Hassinen, M., Elo, A., Porali, I., Keinonen, K., Makela, H., et al. (2004). Functional characterization of SEPALLATA3 and AGAMOUS orthologues in silver birch. Physiol. Plant 121, 149–162. doi: 10.1111/j.0031-9317.2004.00303.x
Leseberg, C. H., Eissler, C. L., Wang, X., Johns, M. A., Duvall, M. R., Mao, L. (2008). Interaction study of MADS-domain proteins in tomato. J. Exp. Bot. 59, 2253–2265. doi: 10.1093/jxb/ern094
Letunic, I., Bork, P. (2019). Interactive tree of life (iTOL) v4: recent updates and new developments. Nucleic Acids Res. 47, W256–W259. doi: 10.1093/nar/gkz239
Li, J., Fan, S. L., Song, M. Z., Pang, C. Y., Wei, H. L., Li, W., et al. (2013). Cloning and characterization of a FLO/LFY ortholog in gossypium hirsutum l. Plant Cell Rep. 32, 1675–1686. doi: 10.1007/s00299-013-1479-1
Lin, Z., Cao, D., Damaris, R. N., Yang, P. (2020). Genome-wide identification of MADS-box gene family in sacred lotus (Nelumbo nucifera) identifies a SEPALLATA homolog gene involved in floral development. BMC Plant Biol. 20, 497. doi: 10.1186/s12870-020-02712-w
Liu, H., Huang, X., Ma, B., Zhang, T., Sang, N., Zhuo, L., et al. (2021). Components and functional diversification of florigen activation complexes in cotton. Plant Cell Physiol. 62, 1542–1555. doi: 10.1093/pcp/pcab107
Liu, C., Xi, W., Shen, L., Tan, C., Yu, H. (2009). Regulation of floral patterning by flowering time genes. Dev. Cell 16, 711–722. doi: 10.1016/j.devcel.2009.03.011
Liu, C., Zhou, J., Bracha-Drori, K., Yalovsky, S., Ito, T., Yu, H. (2007). Specification of arabidopsis floral meristem identity by repression of flowering time genes. Development 134, 1901–1910. doi: 10.1242/dev.003103
Li, X., Wu, Y., Chi, H., Wei, H., Wang, H., Yu, S. (2022). Genomewide identification and characterization of the genes involved in the flowering of cotton. Int. J. Mol. Sci. 23, 7940. doi: 10.3390/ijms23147940
Li, Q., Yu, H., Zhang, Z., Sun, Z., Y., Z., D., Z., et al. (2021b). Optimization of cotton mesophyll protoplast transient expression system. Scientia Agricultura Sin. 54, 4514–4524. doi: 10.3864/j.issn.0578-1752.2021.21.003
Li, L., Zhang, C., Huang, J., Liu, Q., Wei, H., Wang, H., et al. (2021a). Genomic analyses reveal the genetic basis of early maturity and identification of loci and candidate genes in upland cotton (Gossypium hirsutum L.). Plant Biotechnol. J. 19, 109–123. doi: 10.1111/pbi.13446
Matsubara, K., Shimamura, K., Kodama, H., Kokubun, H., Watanabe, H., Basualdo, I. L., et al. (2008). Green corolla segments in a wild petunia species caused by a mutation in FBP2, a SEPALLATA-like MADS box gene. Planta 228, 401–409. doi: 10.1007/s00425-008-0744-y
Ma, L., Yan, Y. (2022). GhSOC1s evolve to respond differently to the environmental cues and promote flowering in partially independent ways. Front. Plant Sci. 13, 882946. doi: 10.3389/fpls.2022.882946
Ma, H., Yanofsky, M. F., Meyerowitz, E. M. (1991). AGL1-AGL6, an arabidopsis gene family with similarity to floral homeotic and transcription factor genes. Genes Dev. 5, 484–495. doi: 10.1101/gad.5.3.484
Melzer, R., Verelst, W., Theissen, G. (2009). The class e floral homeotic protein SEPALLATA3 is sufficient to loop DNA in 'floral quartet'-like complexes in vitro. Nucleic Acids Res. 37, 144–157. doi: 10.1093/nar/gkn900
Meng, Q., Li, X., Zhu, W., Yang, L., Liang, W., Dreni, L., et al. (2017). Regulatory network and genetic interactions established by OsMADS34 in rice inflorescence and spikelet morphogenesis. J. Integr. Plant Biol. 59, 693–707. doi: 10.1111/jipb.12594
Moon, J., Lee, H., Kim, M., Lee, I. (2005). Analysis of flowering pathway integrators in arabidopsis. Plant Cell Physiol. 46, 292–299. doi: 10.1093/pcp/pci024
Morel, P., Chambrier, P., Boltz, V., Chamot, S., Rozier, F., Rodrigues Bento, S., et al. (2019). Divergent functional diversification patterns in the SEP/AGL6/AP1 MADS-box transcription factor superclade. Plant Cell 31, 3033–3056. doi: 10.1105/tpc.19.00162
Nardeli, S. M., Artico, S., Aoyagi, G. M., De Moura, S. M., Da Franca Silva, T., Grossi-De-Sa, M. F., et al. (2018). Genome-wide analysis of the MADS-box gene family in polyploid cotton (Gossypium hirsutum) and in its diploid parental species (Gossypium arboreum and gossypium raimondii). Plant Physiol. Biochem. 127, 169–184. doi: 10.1016/j.plaphy.2018.03.019
Pan, Z. J., Chen, Y. Y., Du, J. S., Chen, Y. Y., Chung, M. C., Tsai, W. C., et al. (2014). Flower development of phalaenopsis orchid involves functionally divergent SEPALLATA-like genes. New Phytol. 202, 1024–1042. doi: 10.1111/nph.12723
Pelaz, S., Ditta, G. S., Baumann, E., Wisman, E., Yanofsky, M. F. (2000). B and c floral organ identity functions require SEPALLATA MADS-box genes. Nature 405, 200–203. doi: 10.1038/35012103
Pelaz, S., Gustafson-Brown, C., Kohalmi, S. E., Crosby, W. L., Yanofsky, M. F. (2001). APETALA1 and SEPALLATA3 interact to promote flower development. Plant J. 26, 385–394. doi: 10.1046/j.1365-313X.2001.2641042.x
Pnueli, L., Hareven, D., Broday, L., Hurwitz, C., Lifschitz, E. (1994). The TM5 MADS box gene mediates organ differentiation in the three inner whorls of tomato flowers. Plant Cell 6, 175–186. doi: 10.2307/3869637
Pu, Z.-Q., Ma, Y.-Y., Lu, M.-X., Ma, Y.-Q., Xu, Z.-Q. (2020). Cloning of a SEPALLATA4-like gene (IiSEP4) in isatis indigotica fortune and characterization of its function in arabidopsis thaliana. Plant Physiol. Biochem. 154, 229–237. doi: 10.1016/j.plaphy.2020.05.031
Ren, Z., Yu, D., Yang, Z., Li, C., Qanmber, G., Li, Y., et al. (2017). Genome-wide identification of the MIKC-type MADS-box gene family in unravels their roles in flowering. Front. Plant Sci. 8, 384. doi: 10.3389/fpls.2017.00384
Ruelens, P., De Maagd, R. A., Proost, S., Theissen, G., Geuten, K., Kaufmann, K. (2013). FLOWERING LOCUS c in monocots and the tandem origin of angiosperm-specific MADS-box genes. Nat. Commun. 4, 2280. doi: 10.1038/ncomms3280
Ruelens, P., Zhang, Z., Van Mourik, H., Maere, S., Kaufmann, K., Geuten, K. (2017). The origin of floral organ identity quartets. Plant Cell 29, 229–242. doi: 10.1105/tpc.16.00366
Rumpler, F., Theissen, G., Melzer, R. (2018). A conserved leucine zipper-like motif accounts for strong tetramerization capabilities of SEPALLATA-like MADS-domain transcription factors. J. Exp. Bot. 69, 1943–1954. doi: 10.1093/jxb/ery063
Shen, G., Yang, C. H., Shen, C. Y., Huang, K. S. (2019). Origination and selection of ABCDE and AGL6 subfamily MADS-box genes in gymnosperms and angiosperms. Biol. Res. 52, 25. doi: 10.1186/s40659-019-0233-8
Smaczniak, C., Immink, R. G., Angenent, G. C., Kaufmann, K. (2012). Developmental and evolutionary diversity of plant MADS-domain factors: insights from recent studies. Development 139, 3081–3098. doi: 10.1242/dev.074674
Song, Q., Zhang, T., Stelly, D. M., Chen, Z. J. (2017). Epigenomic and functional analyses reveal roles of epialleles in the loss of photoperiod sensitivity during domestication of allotetraploid cottons. Genome Biol. 18, 99. doi: 10.1186/s13059-017-1229-8
Theissen, G. (2001). Development of floral organ identity: stories from the MADS house. Curr. Opin. Plant Biol. 4, 75–85. doi: 10.1016/S1369-5266(00)00139-4
Theissen, G., Melzer, R. (2007). Molecular mechanisms underlying origin and diversification of the angiosperm flower. Ann. Bot. 100, 603–619. doi: 10.1093/aob/mcm143
Theissen, G., Melzer, R., Rumpler, F. (2016). MADS-domain transcription factors and the floral quartet model of flower development: linking plant development and evolution. Development 143, 3259–3271. doi: 10.1242/dev.134080
Theissen, G., Saedler, H. (2001). Plant biology. floral quartets. Nature 409, 469–471. doi: 10.1038/35054172
Tzeng, T.-Y., Hsiao, C.-C., Chi, P.-J., Yang, C.-H. (2003). Two lily SEPALLATA-like genes cause different effects on floral formation and floral transition in arabidopsis. Plant Physiol. 133, 1091–1101. doi: 10.1104/pp.103.026997
Vandenbussche, M., Theissen, G., Van De Peer, Y., Gerats, T. (2003a). Structural diversification and neo-functionalization during floral MADS-box gene evolution by c-terminal frameshift mutations. Nucleic Acids Res. 31, 4401–4409. doi: 10.1093/nar/gkg642
Vandenbussche, M., Zethof, J., Souer, E., Koes, R., Tornielli, G. B., Pezzotti, M., et al. (2003b). Toward the analysis of the petunia MADS box gene family by reverse and forward transposon insertion mutagenesis approaches: B, c, and d floral organ identity functions require SEPALLATA-like MADS box genes in petunia. Plant Cell 15, 2680–2693. doi: 10.1105/tpc.017376
Wang, J.-D., Lo, S.-F., Li, Y.-S., Chen, P.-J., Lin, S.-Y., Ho, T.-Y., et al. (2013). Ectopic expression of OsMADS45 activates the upstream genes Hd3a and RFT1 at an early development stage causing early flowering in rice. Botanical Stud. 54, 1–13. doi: 10.1186/1999-3110-54-12
Wu, D., Liang, W., Zhu, W., Chen, M., Ferrandiz, C., Burton, R. A., et al. (2018). Loss of LOFSEP transcription factor function converts spikelet to leaf-like structures in rice. Plant Physiol. 176, 1646–1664. doi: 10.1104/pp.17.00704
Zahn, L. M., Kong, H., Leebens-Mack, J. H., Kim, S., Soltis, P. S., Landherr, L. L., et al. (2005). The evolution of the SEPALLATA subfamily of MADS-box genes: a preangiosperm origin with multiple duplications throughout angiosperm history. Genetics 169, 2209–2223. doi: 10.1534/genetics.104.037770
Zahn, L. M., Leebens-Mack, J. H., Arrington, J. M., Hu, Y., Landherr, L. L., Depamphilis, C. W., et al. (2006). Conservation and divergence in the AGAMOUS subfamily of MADS-box genes: evidence of independent sub- and neofunctionalization events. Evol. Dev. 8, 30–45. doi: 10.1111/j.1525-142X.2006.05073.x
Zhang, J., Hu, Z., Wang, Y., Yu, X., Liao, C., Zhu, M., et al. (2018). Suppression of a tomato SEPALLATA MADS-box gene, SlCMB1, generates altered inflorescence architecture and enlarged sepals. Plant Sci. 272, 75–87. doi: 10.1016/j.plantsci.2018.03.031
Zhang, J., Jia, X., Guo, X., Wei, H., Zhang, M., Wu, A., et al. (2021). QTL and candidate gene identification of the node of the first fruiting branch (NFFB) by QTL-seq in upland cotton (). BMC Genomics 22, 882. doi: 10.1186/s12864-021-08164-2
Zhang, S., Lu, S., Yi, S., Han, H., Liu, L., Zhang, J., et al. (2017). Functional conservation and divergence of five SEPALLATA -like genes from a basal eudicot tree, platanus acerifolia. Planta 245, 1–19. doi: 10.1007/s00425-016-2617-0
Zhao, X. Y., Cheng, Z. J., Zhang, X. S. (2006). Overexpression of TaMADS1, a SEPALLATA-like gene in wheat, causes early flowering and the abnormal development of floral organs in arabidopsis. Planta 223, 698–707. doi: 10.1007/s00425-005-0123-x
Zhao, T., Holmer, R., De Bruijn, S., Angenent, G. C., Van Den Burg, H. A., Schranz, M. E. (2017). Phylogenomic synteny network analysis of MADS-box transcription factor genes reveals lineage-specific transpositions, ancient tandem duplications, and deep positional conservation. Plant Cell 29, 1278–1292. doi: 10.1105/tpc.17.00312
Keywords: SEP-like gene, Gossypium, flowering time control, cotton, concentration-dependent regulation
Citation: Chen L, Yan Y, Ke H, Zhang Z, Meng C, Ma L, Sun Z, Chen B, Liu Z, Wang G, Yang J, Wu J, Li Z, Wu L, Zhang G, Zhang Y, Wang X and Ma Z (2022) SEP-like genes of Gossypium hirsutum promote flowering via targeting different loci in a concentration-dependent manner. Front. Plant Sci. 13:990221. doi: 10.3389/fpls.2022.990221
Received: 09 July 2022; Accepted: 02 November 2022;
Published: 01 December 2022.
Edited by:
Dongfang Wang, Spelman College, United StatesReviewed by:
Yang Zhu, Zhejiang University, ChinaCopyright © 2022 Chen, Yan, Ke, Zhang, Meng, Ma, Sun, Chen, Liu, Wang, Yang, Wu, Li, Wu, Zhang, Zhang, Wang and Ma. This is an open-access article distributed under the terms of the Creative Commons Attribution License (CC BY). The use, distribution or reproduction in other forums is permitted, provided the original author(s) and the copyright owner(s) are credited and that the original publication in this journal is cited, in accordance with accepted academic practice. No use, distribution or reproduction is permitted which does not comply with these terms.
*Correspondence: Zhiying Ma, bXpoeUBoZWJhdS5lZHUuY24=
†These authors have contributed equally to this work
Disclaimer: All claims expressed in this article are solely those of the authors and do not necessarily represent those of their affiliated organizations, or those of the publisher, the editors and the reviewers. Any product that may be evaluated in this article or claim that may be made by its manufacturer is not guaranteed or endorsed by the publisher.
Research integrity at Frontiers
Learn more about the work of our research integrity team to safeguard the quality of each article we publish.