 Qinfu Sun
 Ying Xi
 Youping Wang
95% of researchers rate our articles as excellent or good
Learn more about the work of our research integrity team to safeguard the quality of each article we publish.
Find out more
ORIGINAL RESEARCH article
Front. Plant Sci. , 12 August 2022
Sec. Plant Pathogen Interactions
Volume 13 - 2022 | https://doi.org/10.3389/fpls.2022.986635
This article is part of the Research Topic Molecular crosstalk between oilseed crops and pathogens View all 10 articles
The G-box regulating factors (GRFs) are involved in a wide array of signal transduction pathway and play important roles in plant physiological and developmental processes and stress responses. The GRF proteins have previously been described in several plant species, but not in rapeseed (Brassica napus L.). In this study, we carried out genome-wide analysis of GRFs in B. napus based on the available genome sequence information, and analyzed their expression in different tissues under different hormone treatments and after inoculation with Sclerotinia sclerotiorum. We identified 46 putative BnaGRF genes in rapeseed, unevenly distributed on 18 chromosomes. Like the 14-3-3 proteins in other plant species, the 46 putative BnaGRFs could be classified into two major evolutionary branches: epsilon (ε) group and non-epsilon (non-ε) group. Evolutionary analysis indicated that the BnaGRF gene family expanded in both groups much before speciation. We discovered an expansion of the 14-3-3 gene family that likely occurred during a recent gene duplication event. Collinearity analysis revealed that most of the BnaGRF genes shared syntenic relationships. Global gene expression profiling of BnaGRFs by RNA-seq analysis showed 41.3% (19/46) response to S. sclerotiorum infection, and this response was probably mediated through jasmonic acid (JA) and salicylic acid (SA) signaling pathways. These results provide key insights into the role of 14-3-3s in the biotic stress response and enhance our understanding of their multiple functions in B. napus.
The 14-3-3 proteins were named in 1967 during an extensive study on bovine brain proteins, which were given numerical designations based on the results of column fractionation and electrophoretic mobility assays (Rosenquist et al., 2001). The 14-3-3 proteins are present in all eukaryotic organisms and are expressed in virtually all tissue types (DeLille et al., 2001). Initially, an Arabidopsis thaliana isoform was identified as part of a protein/G-box complex, and therefore named “G box factor 14-3-3” (GF14), and the 14-3-3 isoforms in plants were named G-box regulating factors (GRFs) (Rosenquist et al., 2001). The 14-3-3 proteins participate in several peculiar functions, such as the regulation of primary metabolism, ion transport, cellular trafficking, chloroplast, and mitochondrial enzyme activities (Camoni et al., 2018). Based on gene structure, the encoded plant 14-3-3 proteins are divided into two distinct groups, namely, epsilon (ε) and non-epsilon (non-ε) (Ferl et al., 2002).
An increasing body of evidence suggests that 14-3-3 proteins play an important role in different aspects of plant hormone physiology (Camoni et al., 2018). Research results show that 14-3-3 proteins interact with brassinosteroid (BR) receptor Brassinosteroid-Insensitive1 (BRI1), BRI1 Kinase Inhibitor (BKI1), BRI1 Suppressor phosphatase (BSU1), and the transcription factors BRI1-EMS-Suppressor1 (BES1), and Brassinazole-Resistant1 (BZR1), which act both as negative and positive regulators of BR signaling pathways (Chang et al., 2009; Ryu et al., 2010; Wang et al., 2011). The 14-3-3 proteins function as members of the transcriptional complexes of abscisic acid (ABA)-regulated genes. In embryonic barley roots, 14-3-3 proteins function in the ABA-regulated transcriptional cascade by interacting with bZIP transcription factors ABI1-3 and ABI5 (Schoonheim et al., 2007, 2009). Additionally, 14-3-3 proteins have been reported to regulate the cell expansion by stimulating the H+-ATPase-dependent proton extrusion into the cell wall, which was IAA-dependent regulatory processes. In Arabidopsis, IAA promotes Thr947 phosphorylation and subsequent 14-3-3 binding to H+-ATPase, and is responsible for its activation (Takahashi et al., 2012). 14-3-3 proteins interacted with components of the signaling pathways of gibberellic acid (GA) (Ito et al., 2014), jasmonic acid (JA) (Holtman et al., 2000), salicylic acid (SA) (Yang et al., 2009), and other plant hormones (Jaspert et al., 2011; Yoon and Kieber, 2013; Camoni et al., 2018) as well.
The 14-3-3 proteins participate in many physiological processes of plants, including flowering and chloroplast, stomatal, and root development. In rice, 14-3-3 proteins interact with the FT homolog Hd3a and the OsFD1 transcription factor in the apical cells of shoots to induce the transcription of OsMADS15, leading to flowering (Taoka et al., 2011; Kaneko-Suzuki et al., 2018), while in Arabidopsis, the 14-3-3 ν and μ proteins affect photoperiodic flowering by interacting with CONSTANS, a central regulator of the photoperiod pathway (Mayfield et al., 2007), and regulate root growth and chloroplast development as components of the photosensory system (Mayfield et al., 2012).
Whole-genome studies and reverse genetics approaches revealed that 14-3-3 proteins are involved in plant stress resistance. Genome-wide analysis of 14-3-3 proteins in rice (Chen et al., 2006), soybean (Wang et al., 2019), wheat (Shao et al., 2021), grape (Cheng et al., 2018), and other crops showed that the expression of some 14-3-3 family members is induced, while that of others is repressed by stresses. Overexpression of a wild soybean (Glycine soja) 14-3-3 gene, GsGF14o, in Arabidopsis caused deficits in root hair formation and development, thereby reducing the water intake capacity of the root system (Sun et al., 2014). Heterologous expression of Arabidopsis 14-3-3 gene AtGF14λ in cotton improved stress tolerance under moderate drought conditions by regulating the stomatal aperture of transgenic plants (Yan et al., 2004). In another study, AtGFψ interacted with different ACC SYNTHASE (ACS) isoforms and decreased their stability, functioning as a negative regulator of constitutive freezing tolerance and cold acclimation in Arabidopsis (Catala et al., 2014).
A number of 14-3-3 family members have been reported in different plant species; for example, 13 in Arabidopsis (Rosenquist et al., 2001), 8 in rice (Chen et al., 2006), 16 in soybean (Wang et al., 2019), 17 in tobacco (Konagaya et al., 2004), 12 in Populus (Tian et al., 2015), 8 in sweet orange, 15 in cassava (Chang et al., 2020), 11 in grape (Cheng et al., 2018), 17 in wheat (Shao et al., 2021), 10 in Medicago truncatula (Qin et al., 2016), 16 in mango (Xia et al., 2022), 18 in apple (Zuo et al., 2021), 25 in banana (Li et al., 2016), 9 in Citrus sinensis (Lyu et al., 2021), and 21 in Brassica rapa (Chandna et al., 2016). Despite the documentation of 14-3-3 genes in many plant species and their investigation under different stress conditions, little is known about this gene family in rapeseed (Brassica napus) and its diploid progenitor Brassica oleracea. Only four 14-3-3 genes have been identified in B. napus to date (Zhan et al., 2010). Rapeseed is the second most important oilseed crop in the world, and Sclerotinia stem rot (SSR), which is caused by Sclerotinia sclerotiorum, is a serious problem in the rapeseed industry(Wu et al., 2016). In this study, taking advantage of the completion of the newly assembled rapeseed genome sequence (Song et al., 2020), we systemically identified members of the 14-3-3 gene family in the B. napus genome, performed a comprehensive sequence analysis of these genes, and investigated their function in S. sclerotiorum resistance. Our results demonstrate that the oilseed rape genome contains the highest number of 14-3-3s (46 BnaGRFs) among all plant species investigated to date, and 19 of these genes are likely involved in disease resistance, probably through the SA signaling pathway.
Genome sequence and gene annotations of oilseed rape (B. napus L.) cultivar ‘Zhongshuang11’ (ZS11) were downloaded from the B. napus pan-genome information resource database (BnPIR1). The Hidden Markov Model (HMM) profiles of 14-3-3 domains (PF00244) were obtained from the Protein family database (Pfam2), and was employed as a query to identify all possible BnaGRFs using the HMMER software (V3.0) (Finn et al., 2011). Then, the motif of the candidate protein was confirmed using the online tools SMART,3 CCD,4 and MOTIF Search.5 The length, isoelectric point (pI), and molecular weight (MW) of 14-3-3 proteins were calculated using the online ExPASy program,6 and their subcellular localization was predicted using the online tool WOLFPSORT.7
The genome sequence of B. oleracea was downloaded from Ensembl Plants,8 and B. oleracea 14-3-3 proteins (BolGRFs) were identified using the approaches mentioned above. Additionally, 21 14-3-3 proteins (BraGRFs) in B. rapa were obtained from (Chandna et al., 2016).
To visualize the location of BnaGRFs in the genome and identify syntenic gene pairs, the locations of BnaGRFs were extracted from the gff files of the B. napus genome.9 All protein sequences of B. napus were compared against themselves using the MCScanX tool of the TBtools software (E-value < 1e−10, number of hits ≤5) (Chen et al., 2020), and the duplicated gene groups and tandem duplicates were as described previously (Pi et al., 2021). The chromosomal locations and duplication events of BnaGRFs were visualized using the Circos package of the TBtools software. The ratios of non-synonymous to synonymous substitutions (Ka/Ks) in duplicate gene pairs were used to evaluate the selection pressure (Wang et al., 2010).
To gain insights into the evolutionary relationships among 14-3-3 family members, the structure of BnaGRFs and A. thaliana 14-3-3s (AtGRFs) was visualized using TBtools, based on the information in gff files. The conserved motifs of BnaGRFs and AtGRFs were analyzed using Multiple Expectation Maximization for Motif Elicitation (MEME) (Bailey et al., 2015), and the results were visualized with TBtools.
Amino acid sequences of the 14-3-3 proteins of B. rapa, B. oleracea, B. napus, and A. thaliana were aligned using MAFFT v7.505 with default parameters (Nakamura et al., 2018). Maximum-likelihood phylogenetic trees were generated in the MEGA 11 program using the Neighbor-Joining (NJ) method with 1,000 bootstrap replications. Additionally, phylogenetic analysis of BnaGRFs and AtGRFs was performed for investigating gene structure, while that of only BnaGRFs was performed for visualizing gene expression.
A highly comprehensive time-series analysis of the transcriptome in different tissues, and gene expression pattern under adverse conditions and following different hormone treatments was reported in B. napus cultivar ZS11 (Liu et al., 2021). These data were used in this research. To predict the potential functions of BnaGRFs, the expression patterns were illustrated using HeatMap in TBtools (Chen et al., 2020). The heatmap was constructed by taking Log2 values of the transcripts per kilobase of exon model per million mapped reads (TPM) generated from RNA-seq data. The bars of BnaGRFs on heatmap represent the expressional change after different treatments.
To probe the potential roles of BnaGRFs in resistance to S. sclerotiorum, the expression of BnaGRFs was inspected by RNA-seq in leaves treated with SA, ethylene (ET), hydrogen peroxide (H2O2), and oxalic acid (OA) or inoculated with S. sclerotiorum. Seed germination and seedling cultivation of B. napus cultivar ‘J9712’ were conducted in a greenhouse at 24°C under 16 h light/8 h dark photoperiod. Leaves of 6-week-old plants were sprayed with hormones (1 mM SA, 1 mM ET, or 100 mM H2O2), a chemical (1 mM OA), the toxin secreted by the pathogen S. sclerotiorum, or the solvent for the above compounds (0.01% ethanol; control), and collected at 0, 3, and 6 h after treatment. All samples were immediately frozen in liquid nitrogen and stored at −80°C until needed for RNA extraction (Rahman et al., 2016).
To conduct pathogen inoculation, the leaves of 6-week-old plants were treated with agar disks containing the hyphae of S. sclerotiorum, as described previously (Wu et al., 2013). Briefly, the latest or penultimate fully extended leaves of similar size were excised from 6-week-old plants grown in the field. Nine leaves were collected and placed in a plastic tray (56 cm × 38 cm × 15 cm) with wet-gauze at the bottom of the tray. The mycelial agar plug was inoculated on the middle of each leaf. The inoculated leaves were further sprayed with a fine mist of water, and the plastic tray was covered with plastic film to maintain a high level of relative humidity. The plastic trays with inoculated leaves were kept at 22 ± 2°C in darkness. The leaves were sampled at 0, 6, 12, 24, and 36 h after inoculation.
Leaves were collected at 0, 12, 24, and 36 h post-inoculation, with three biological replicates at each time point. Total RNA was extracted from the leaf samples using the RNA Purification Kit (TransGen, China), according to the manufacturer’s instructions. The quality of RNA was evaluated by agarose gel electrophoresis and with a UV spectrophotometer. High-quality RNA was outsourced to Majorbio company (Shanghai, China) for library construction, RNA-seq, and the identification and analysis of differentially expressed genes (DEGs). The RNA-seq was performed based on Illumina platform. The raw data was filtered with SeqPrep and Sickle, and the clean data were mapped onto the B. napus genomes (AACC10) (Chalhoub et al., 2014) by using TopHat2 software. The expression profiles of DEGs between the treated and control samples were determined by edgeR (Robinson et al., 2010) program based on their relative quantities. Genes with a P-value ≤ 0.01 were recognized as significantly DEGs between the two samples. Transcript levels of BnaGRFs were extracted from the RNA-seq data and shown by HeatMap in TBtools. The heatmap was generated by taking Log2 values of the transcript per million fragments mapped (FPKM) generated from RNA-seq data. The bars of BnaGRFs on heatmap represent the expressional change after different treatments.
The genome of B. napus cultivar ‘ZS11’ was used for the identification of rapeseed 14-3-3 genes. Based on a genome-wide investigation, a total of 46 14-3-3 gene candidates were discovered (Table 1). Each gene was named BnaGRF, followed by a number (e.g., BnaGRF1, BnaGRF2, and BnaGRF3), based on its location on chromosomes A01 to C09. The details of all 46 BnaGRFs are summarized in Table 1. The BnaGRF proteins varied in length from 182 amino acids (aa; BnaGRF28) to 581 aa (BnaGRF23), with an average length of 266.23 aa, the length of 86.95% (40/46) BnaGRFs distribute in 200–300 aa. The MW of BnaGRFs ranged from 20.53 to 65.58 kDa. The pI was less than 7.0 for all BnaGRFs, except BnaGRF1, BnaGRF23, and BnaGRF45, whose pI was 7.01, 9.52, and 9.66, respectively. Subcellular localization prediction analysis showed that BnaGRFs localized to different subcellular compartments, including plasma membrane (12 BnaGRFs), nuclear membrane (11), chloroplast (8), nucleus (5), cytosol (4), Golgi apparatus (3), and mitochondrion (3).
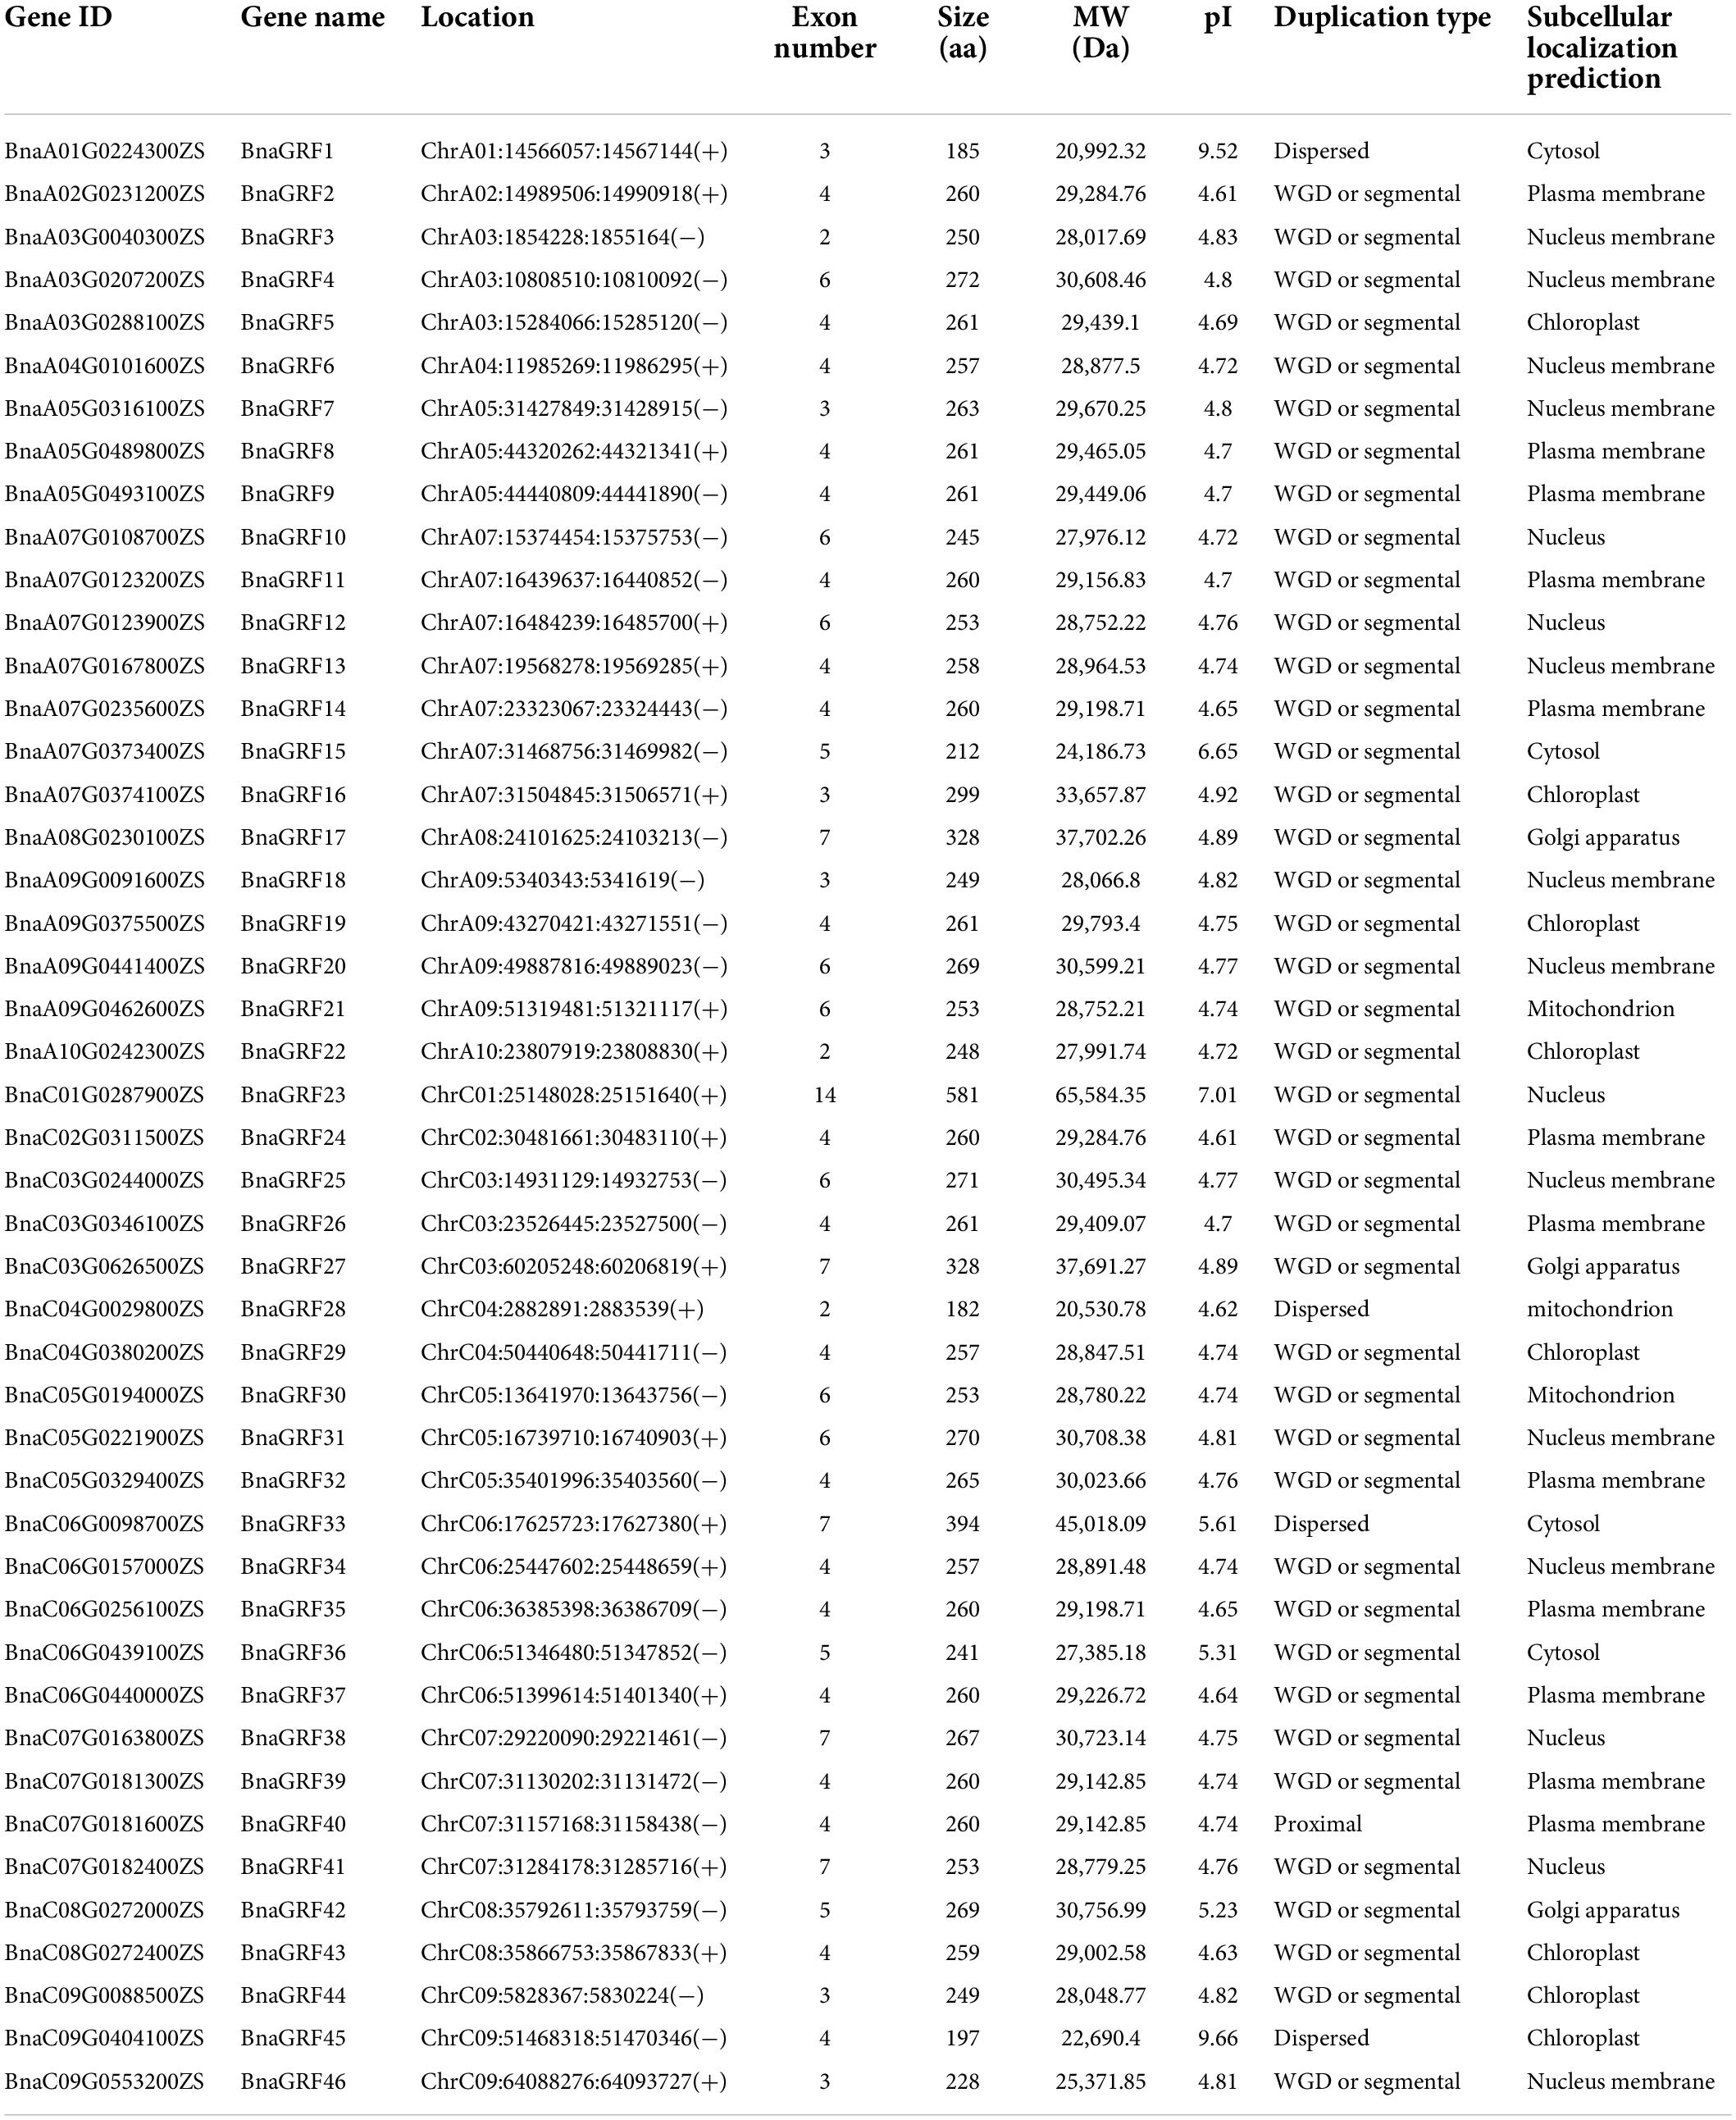
Table 1. Information on rapeseed 14-3-3 genes.
To better understand the 14-3-3 family composition in the tetraploid B. napus, the 14-3-3 genes in its progenitor species B. rapa (BraGRFs) and B. oleracea (BolGRFs) were identified; BolGRFs were identified using approaches similar to those used for BnaGRF identification, while BraGRFs were identified based on the literature reported by Chandna (Chandna et al., 2016). The results showed that the 14-3-3 gene family composition was similar in the two Brassica species, with 21 members in B. rapa and 25 in B. oleracea (Supplementary Table 1). Comparative analysis indicated that the B. napus genome possessed the total copies of 14-3-3s in its two progenitor species, but the A and C subgenomes possessed 22 and 24 BnaGRFs, respectively.
To determine the evolutionary relationships among 14-3-3s, a phylogenetic tree was constructed using the NJ method, based on the full-length amino acid sequence alignment of GRFs of B. rapa, B. oleracea, B. napus, and A. thaliana (Figure 1). All 46 BnaGRFs clustered into two groups (ε and non-ε), with strong bootstrap support. Twenty-nine BnaGRFs clustered into the non-ε group, together with 8 AtGRFs, 15 BraGRFs, and 16 B. oleracea GRFs (BolGRFs), while the remaining 17 BnaGRFs members clustered into the ε group. B. napus inherited most copies of 14-3-3s from its two progenitors, B. rapa and B. oleracea. Some BnaGRFs were highly homologous to BolGRFs; e.g., both BnaGRF12 and BnaGRF41. However, other BnaGRFs, such as BnaGRF22 and BnaGRF46, showed no high-level homology to GRFs in B. rapa and B. oleracea. Thus, this phylogenetic tree revealed that members of the 14-3-3 gene family in B. napus were not fully inherited from its diploid ancestors.

Figure 1. Phylogenetic analysis of the 14-3-3 protein family in Brassica species (B. rapa, B. oleracea, and B. napus) and Arabidopsis thaliana. A total of 46 14-3-3s were divided into two subgroups (ε and non-ε group), according to the evolutionary distance. Blue circles represent the 21 BraGRFs in B. rapa; purple triangles represent the 25 BolGRFs in B. oleracea; orange squares represent the 46 BnaGRFs in B. napus; and green diamonds represent the 13 AtGRFs in Arabidopsis.
The intron-exon structure of 14-3-3s provided potential insight into the functional diversification of BnaGRFs during evolution (Table 1 and Figure 2A). Genes within the same group showed a similar number of introns and exons: 2–4 exons in the non-ε group [with 20 out of 28 genes (68.96%) containing 4 exons] and 5–7 exons in the ε group. The only exceptions were BnaGRF23 in the non-ε group (14 exons) and BnaGRF28 in the ε group (2 exons).
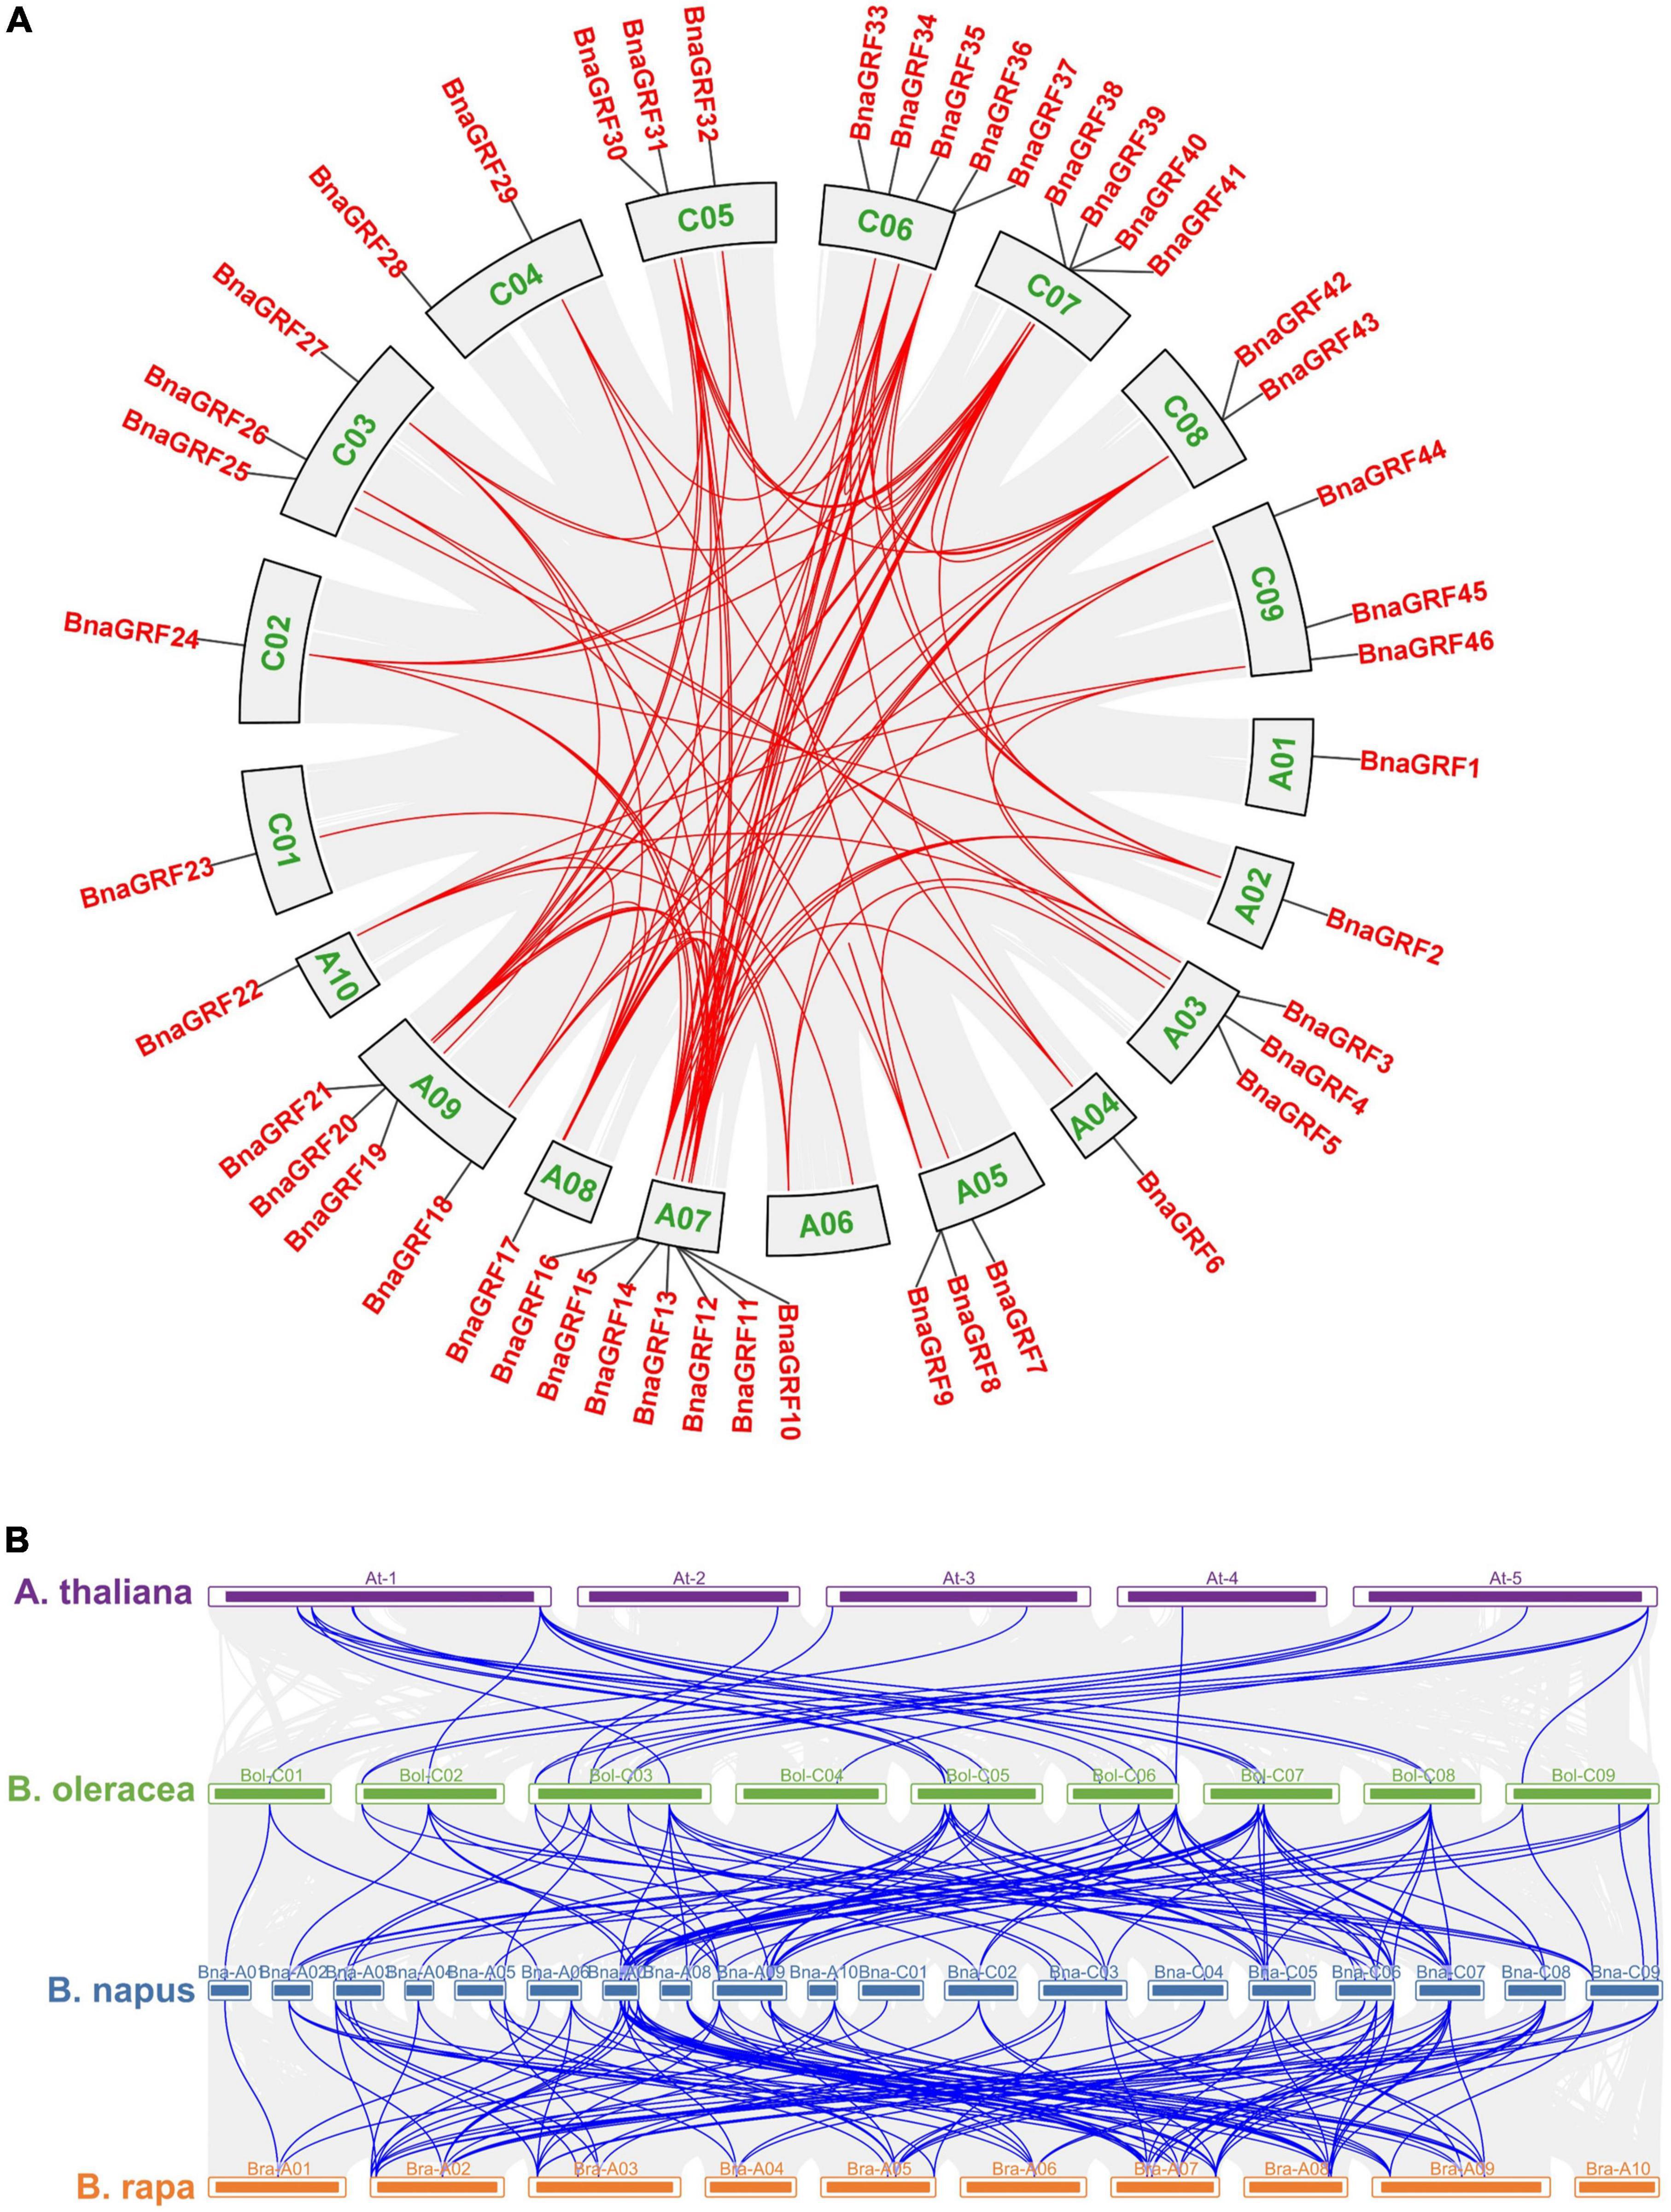
Figure 2. Circular illustrations of the chromosomal dispersal and inter-chromosomal associations of BnaGRFs, and synteny analysis of 14-3-3 genes in B. rapa, B. oleracea, B. napus, and Arabidopsis. (A) Analysis of syntenic relationships among BnaGRF homologs. Red lines inside the schematic view denote the duplicated pairs of BnaGRFs. (B) Analysis of syntenic relationships among BraGRFs, BolGRFs, BnaGRFs, and AtGRFs. Gray line represents the syntenic block in plant genomes, and blue line represents the collinear 14-3-3 gene pair.
Ten conserved motifs were identified in 46 BnaGRFs and 13 AtGRFs (Figure 2B). The majority of BnaGRFs contained motif2, motif3, and motif4, except BnaGRF1, BnaGRF28, BnaGRF45 (which lacked motif2 and motif4), BnaGRF23 (lacked motif2), BnaGRF42 (lacked motif3), and BnaGRF46 (lacked motif4). Most BnaGRFs (40/46) contained motif1, except BnaGRF3, BnaGRF22, and BnaGRF46, all of which clustered in the non-ε group. Motif5 was found in most non-ε group members (21/29), whereas motif8 and motif9 were found in ε group members only. By contrast, AtGRFs showed a more consistent motif distribution than BnaGRFs, with all AtGRFs containing motif1, motif2, motif3, and motif4. Compared with all BnaGRFs, the non-ε group members BnaGRF1, BnaGRF3, BnaGRF22, BnaGRF23, BnaGRF45, and BnaGRF46 as well as the ε group member BnaGRF28 showed considerable differences in intron-exon structure, motif distribution, MW, and pI (Table 1). This variation in gene structure and motif composition among BnaGRFs suggests functional differentiation within and between the two BnaGRFs groups.
The 46 BnaGRF genes were unevenly distributed on 18 of the 19 chromosomes (Figure 3). In total, 22 BnaGRFs (15 non-ε group and 7 ε group) and 24 BnaGRFs (14 non-ε group and 10 ε group) were located in the A and C subgenomes, respectively. Chromosome A07 harbored the most BnaGRF genes (seven), while chromosomes A01, A02, A04, A08, A10, C01, and C02 contained only one BnaGRF gene each. No BnaGRF gene was located on chromosome A06.
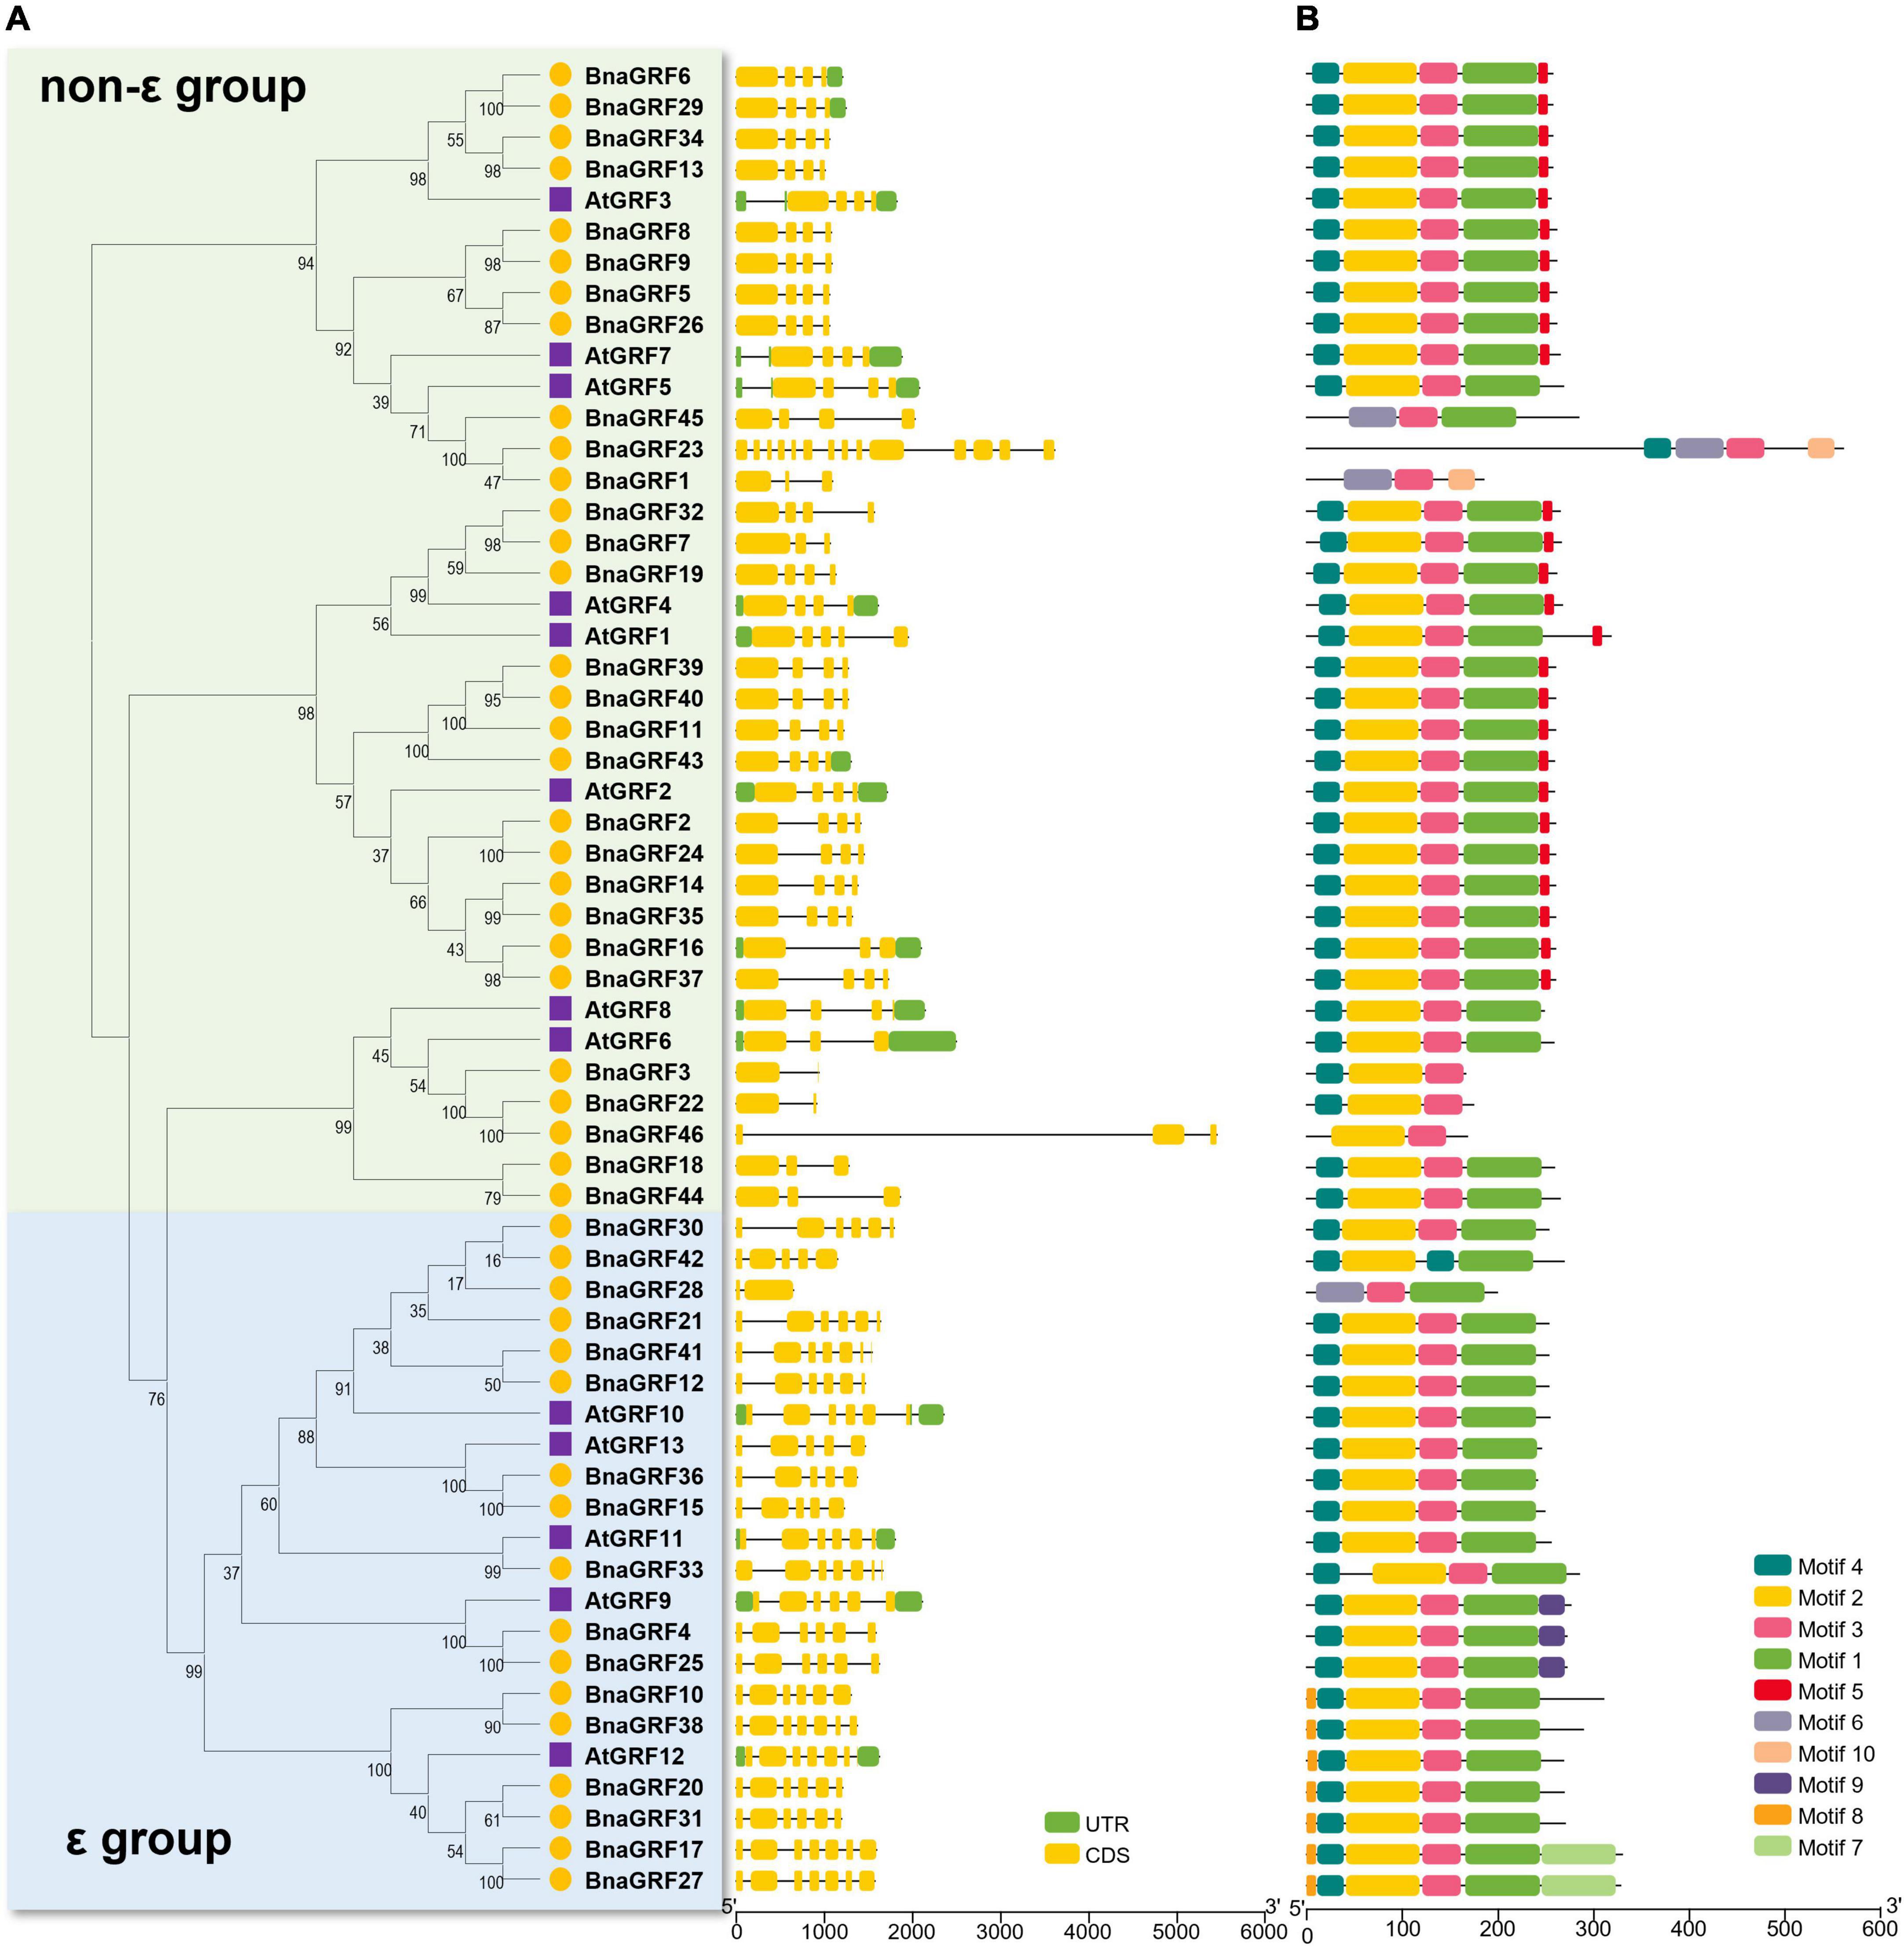
Figure 3. Gene structure and motif analysis of 14-3-3 family genes in B. napus and Arabidopsis. (A) Gene structure of BnaGRFs and AtGRFs. Green color indicates the untranslated regions (UTRs); yellow color represents the coding sequence (CDS) or exons; and black horizontal lines indicate the introns. (B) Conserved domain structures identified in BnaGRFs and AtGRFs. Boxes with different colors indicate different motifs.
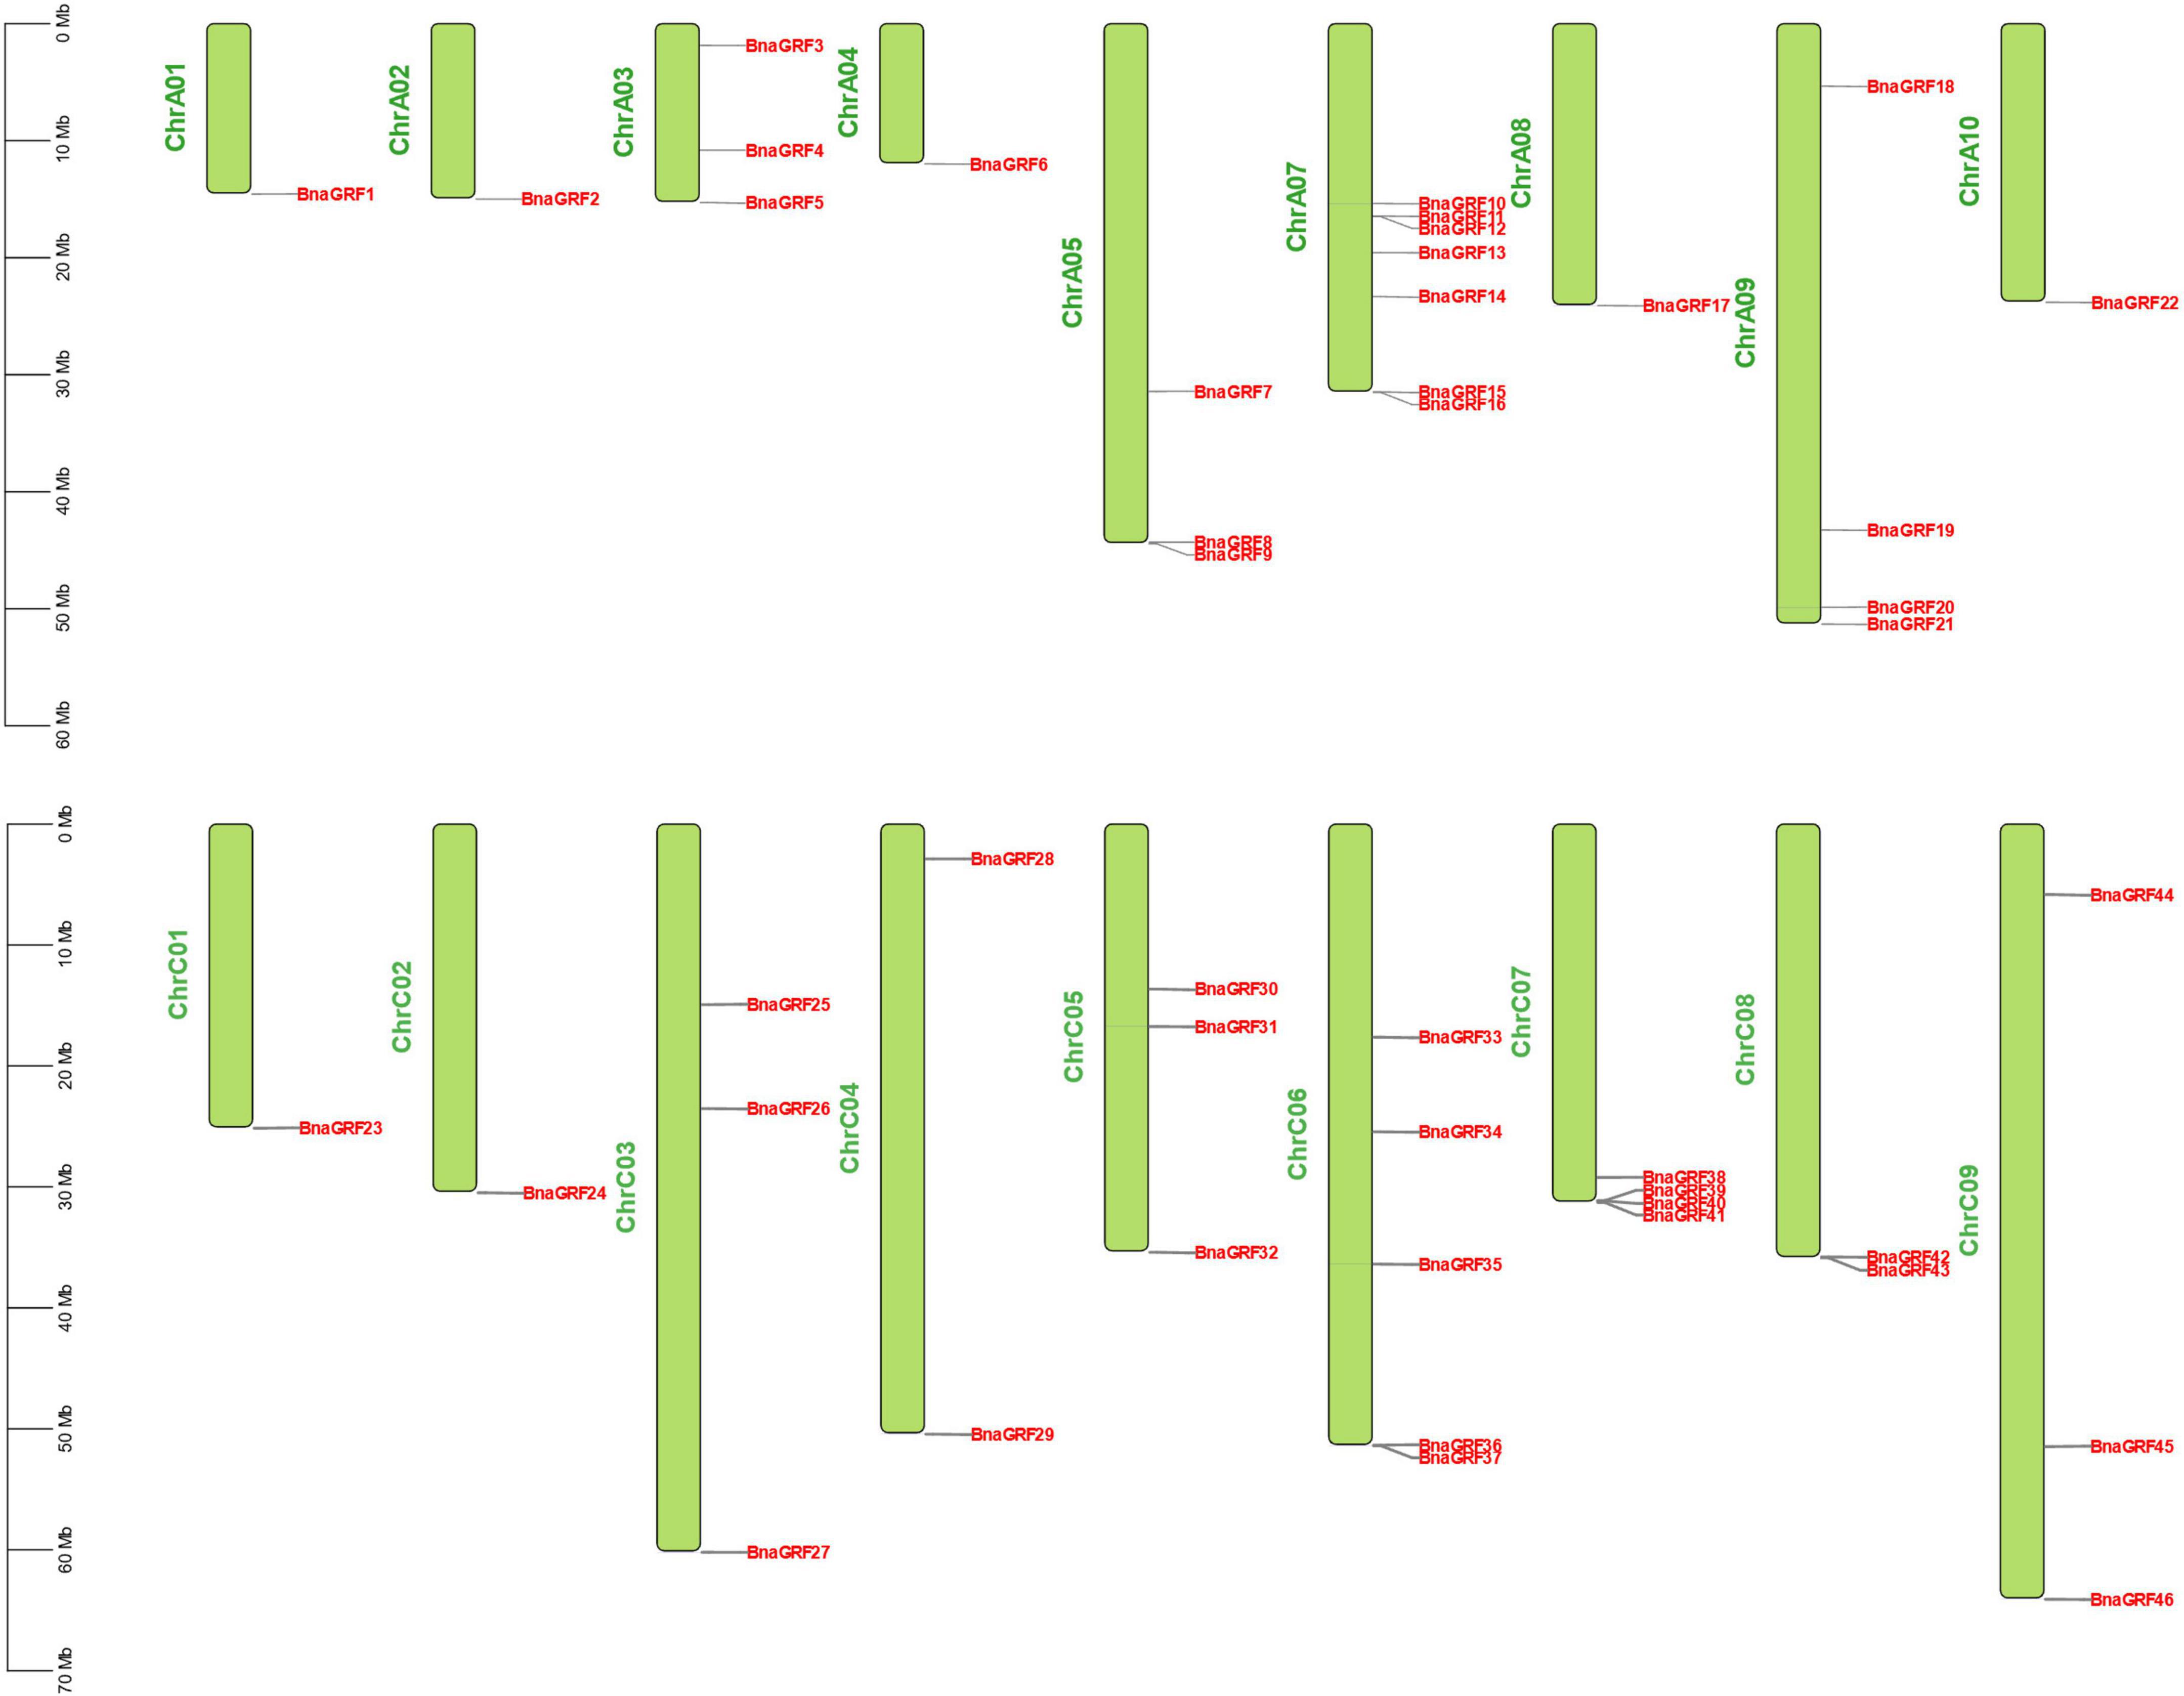
Figure 4. Chromosomal mapping of 46 BnaGRFs. The length of chromosomes is represented in Mb. The chromosome number is presented on the left side of each chromosome. BnaGRFs are marked in red.
Gene duplication reflects the expansion of the gene family. According to BLAST and MCScanX searches, gene duplication events of BnaGRFs were detected in B. napus. Briefly, all 46 BnaGRF genes were derived by different types of duplication events: 41 (89.13%) by whole-genome duplication (WGD) or segmental duplication; 4 by dispersed duplication; and 1 by proximal duplication. Moreover, we identified 101 paralogous gene pairs (Figure 2A and Supplementary Table 2), 24 of which originated in the A subgenome, 18 in the C subgenome, and the remaining 59 arose by duplication events between the A and C subgenomes. To estimate the selection mode of BnaGRFs, the Ka/Ks ratio of paralogous gene pairs was calculated. Generally, Ka/Ks > 1 implies positive selection; Ka/Ks = 1 indicates neutral selection; and Ka/Ks < 1 represents purifying selection. In this study, the Ka/Ks ratio of all paralogous gene pairs (except three gene pairs for which the Ka/Ks ratio could not be calculated, because of high sequence divergence) was less than 1 (Supplementary Table 2), indicating that BnaGRFs are under purifying selection.
Cis-elements in promoter regions play a critical role in determining gene expression patterns. To obtain preliminary clues on how the BnaGRF genes respond to stress stimuli, we identified stress-related cis-elements in the promoters of BnaGRF genes (Figure 5). A total of 18 stress response-related cis-acting elements were detected in 2.0-kb sequence upstream of the ATG of each BnaGRF gene. These cis-acting elements could be divided into three classes: hormone-sensitive regulatory elements involved in biotic or abiotic stress responses, including ABA-responsive element (ABRE), indole-3-acetic acid (IAA)-responsive elements (AuxRRP-core and TGA-element), GA-responsive elements (GARE-motif, P-box, and TATC-box), JA responsive (TGACG-motif and box S), and SA-responsive element (TCA-element); MYB, MYC, and WRKY transcription factor-binding sites; and biotic or abiotic stress-responsive elements, including DRE core, LTR, G-box, ARE, TC-rich repeats, and WUN-motif. MYB-binding elements were detected in all 46 BnaGRFs, with a total number of 284. Other motifs identified in the majority of BnaGRFs included ABRE (41/46, 89.1%), MYC-binding (44/46, 95.7%), G-box (41/46, 89.1%), and ARE (43/46, 93.5%). More than half of BnaGRFs promoters contained methyl jasmonate (MeJA)-responsive elements [TGACG-motif (30/46, 65.2%) and TC-rich repeats (25/46, 54.3%)], WRKY-binding site (W box, 24/46, 52.2%) and low-temperature responsive (LTR) elements (24/46, 52.2%). Moreover, TGA-element (16/46, 34.8%), GARE-motif (13/46, 28.3%), TCA-element (14/46, 30.4%), DRE core (18/46, 39.1%), and WUN-motif (15/46, 32.6%) were identified in many promoters. The total number of elements in each gene varied from 14 (BnaGRF2) to 46 (BnaGRF21), and no significant difference was detected in the number or distribution of elements between non-ε and ε groups. These findings suggest that BnaGRFs play an important role in the biotic and abiotic stress response in B. napus.
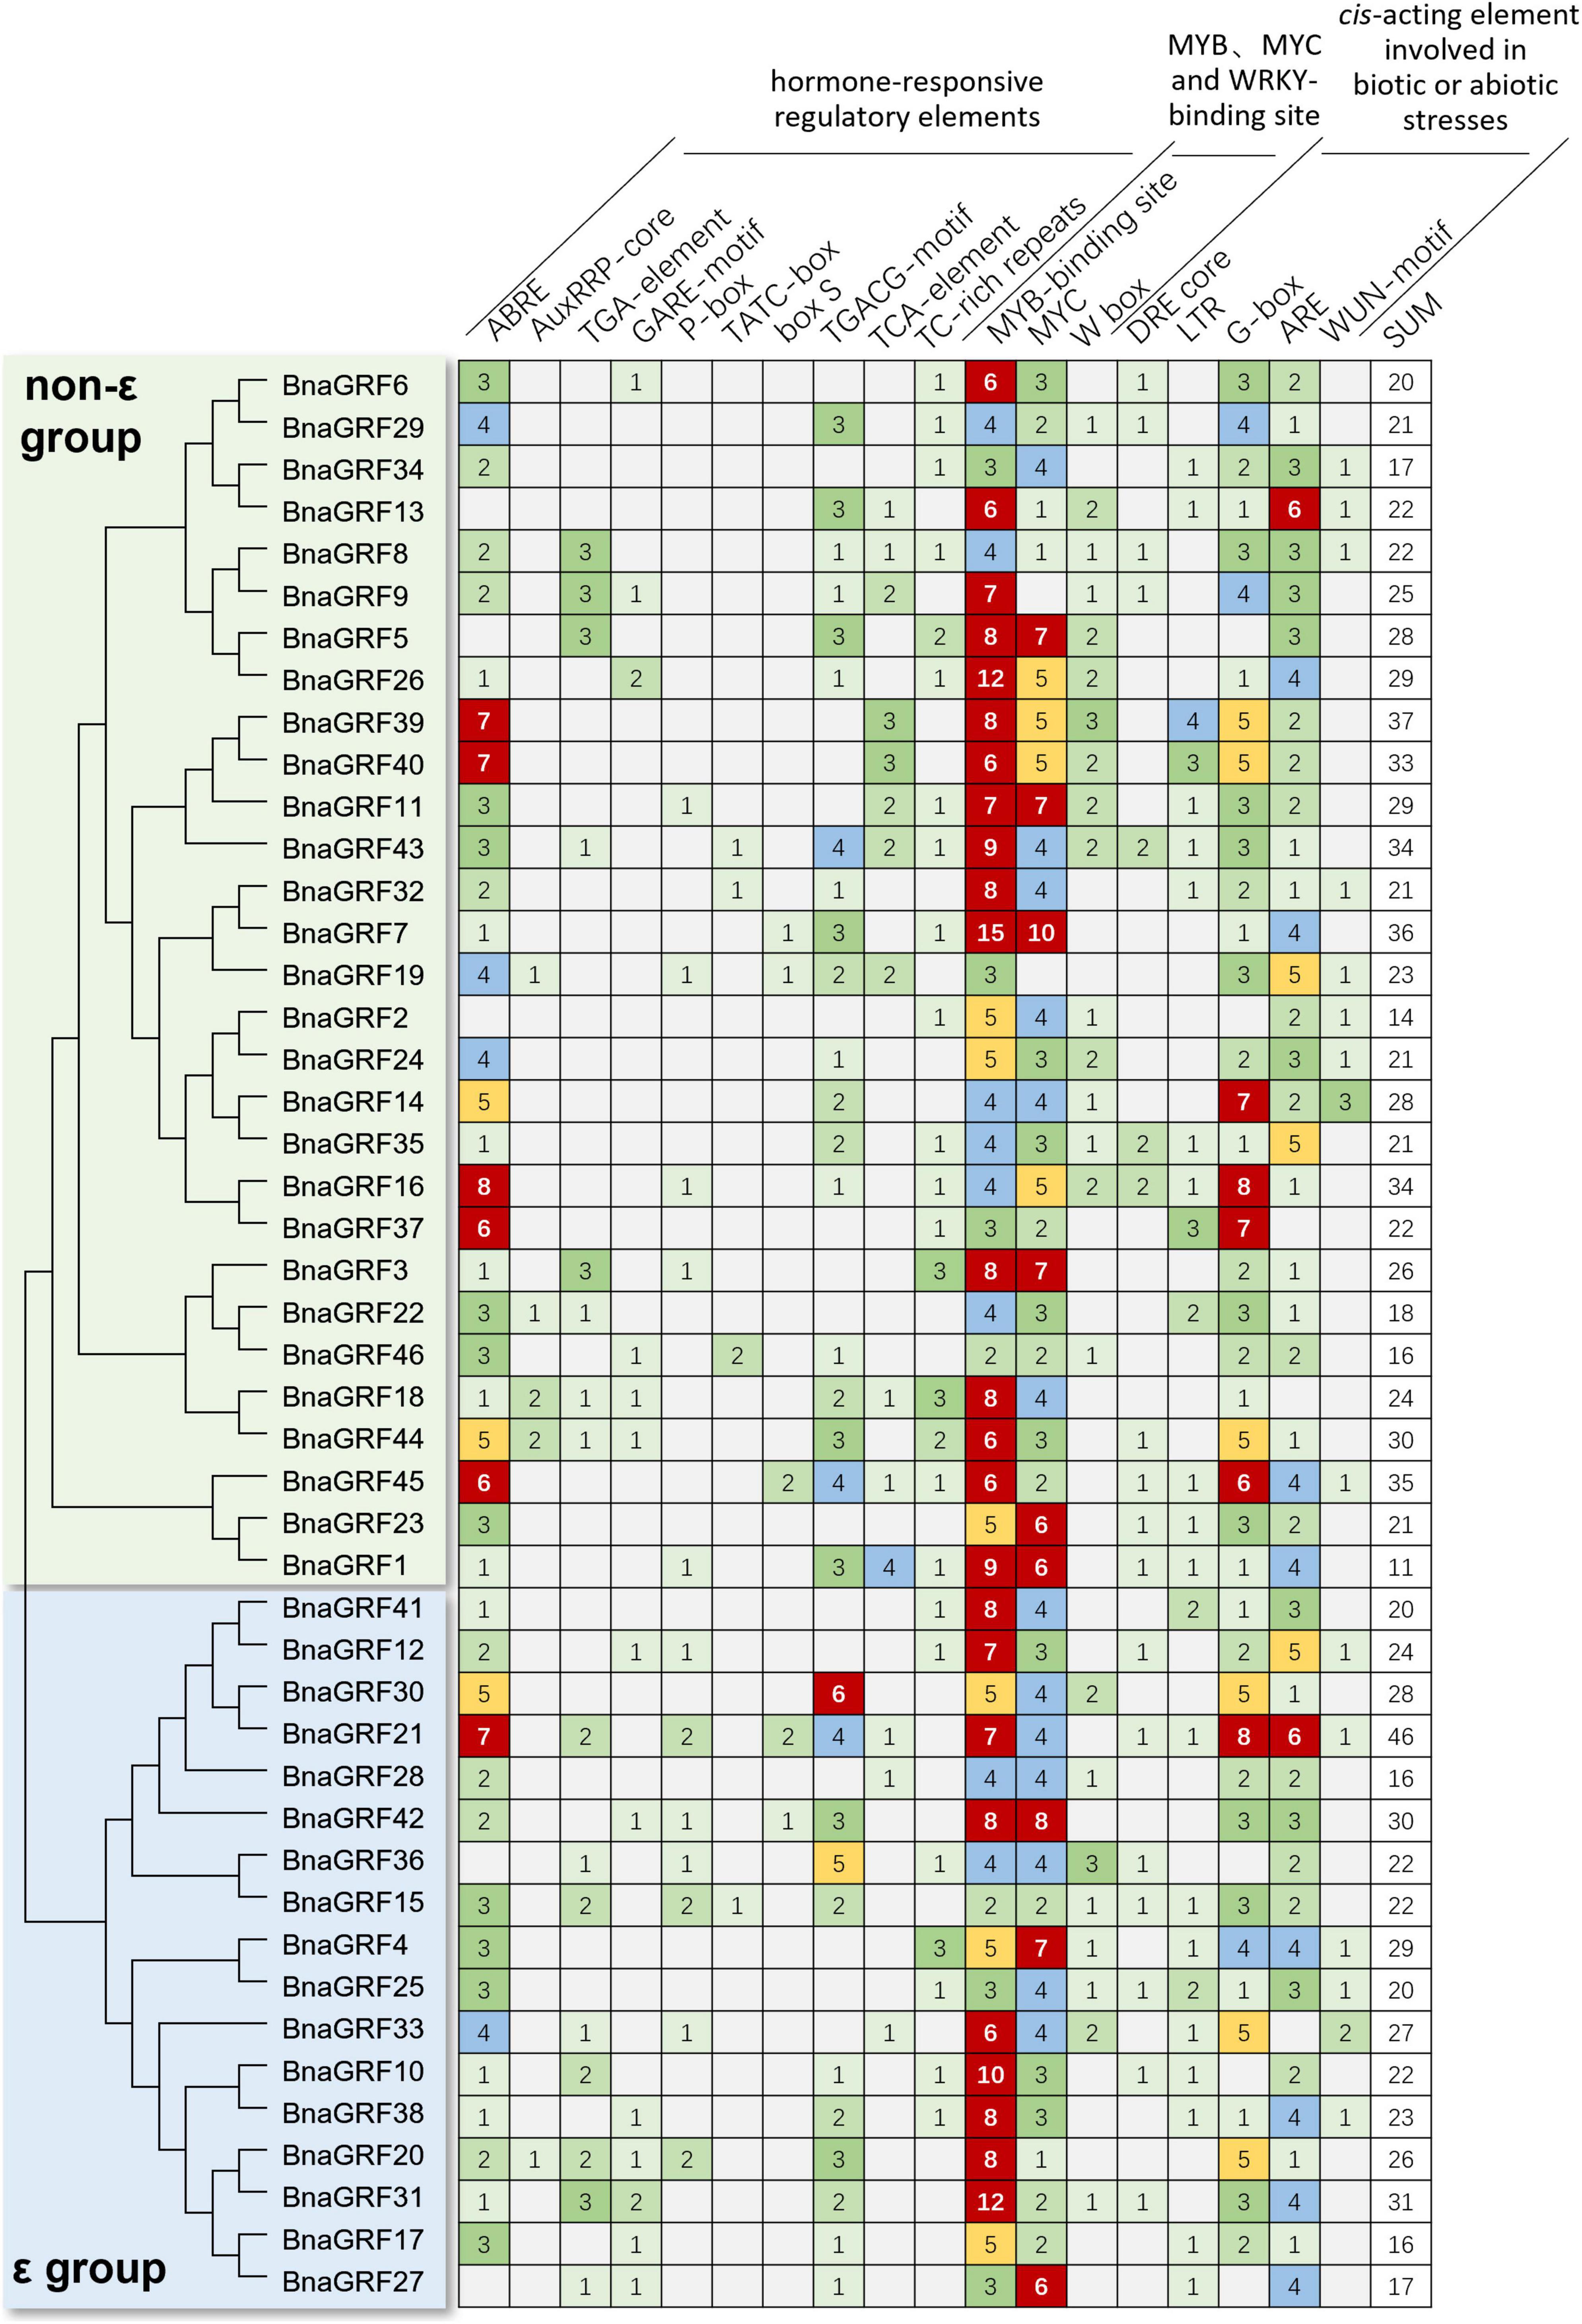
Figure 5. Number of hormone- and stress-responsive cis-elements in the promoters of the BnaGRFs.
To investigate the functions of BnaGRF genes, we analyzed their expression profiles in different tissues or organs based on the data available in the Brassica napus Transcriptome Information Resource (BnTIR) database11 (Liu et al., 2021). Different BnaGRF genes exhibited distinct expression patterns; however, no transcriptome data were available for BnaGRF1 and BnaGRF33 (Figure 6A).
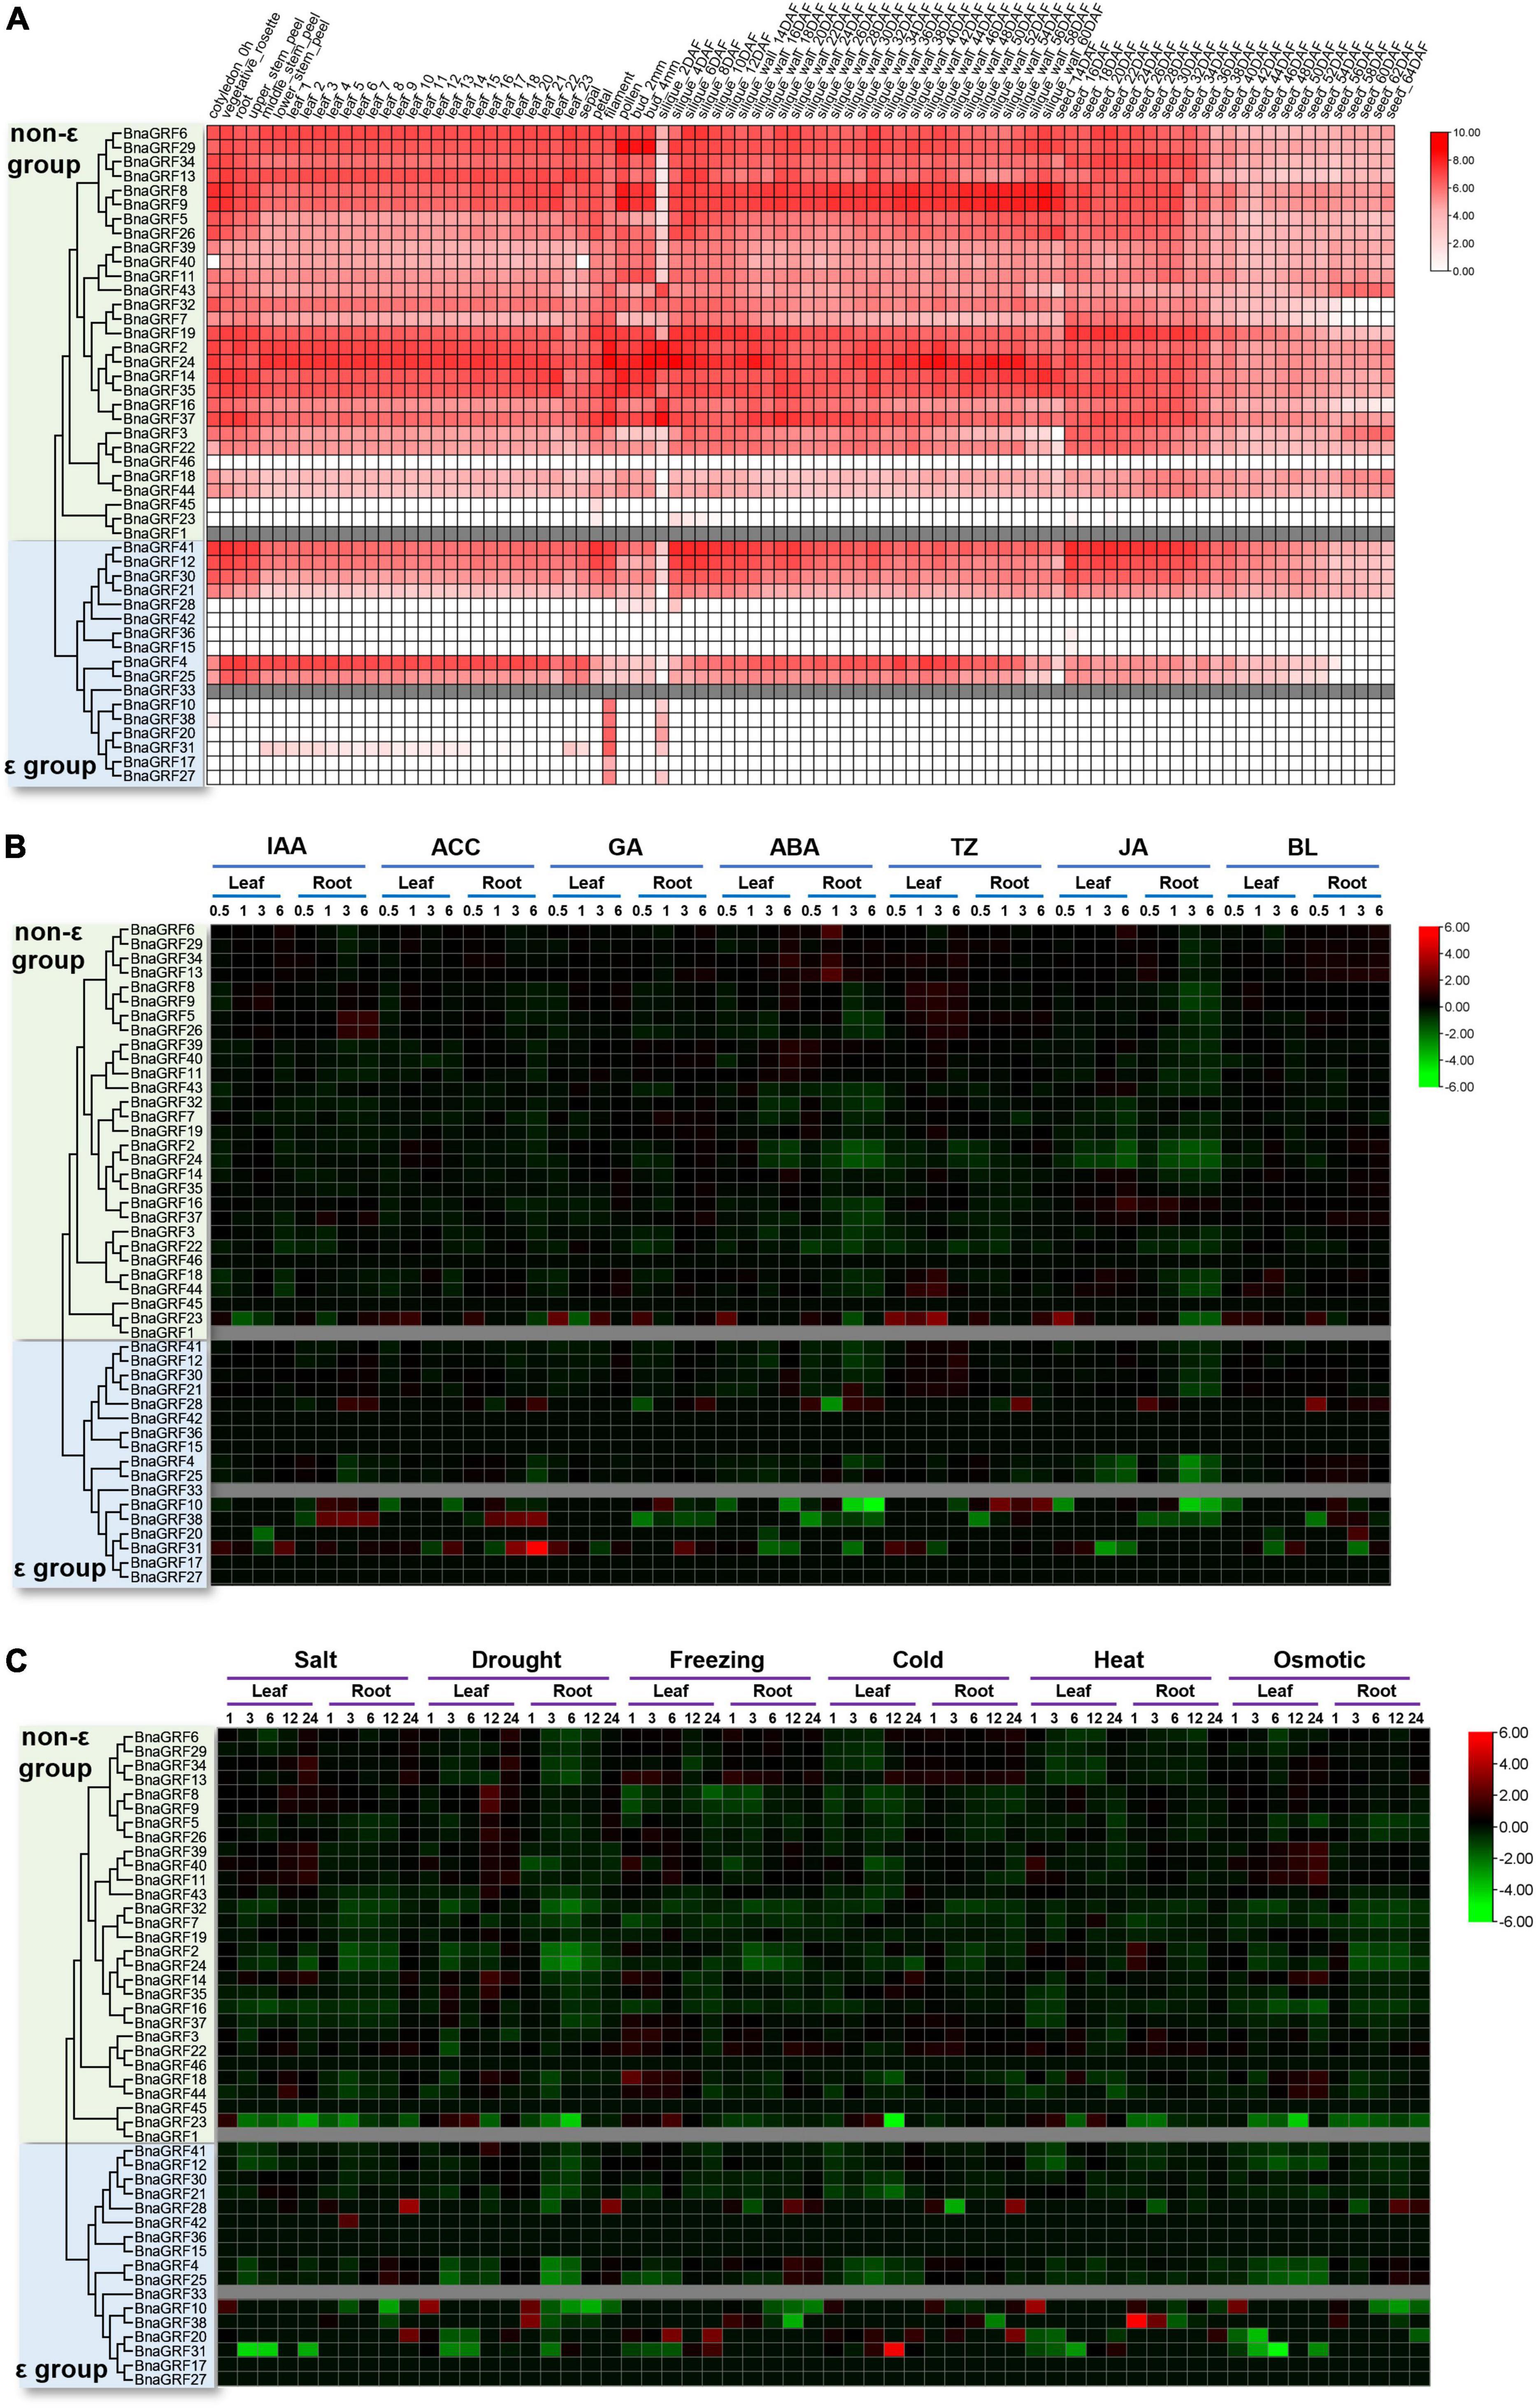
Figure 6. Expression analysis of BnaGRFs in various tissues and under various hormone and abiotic stress treatments. (A) Expression profiling in different tissues and organs. The scale bar represents the Log2 normalized expression. In the expression bar, white color indicates no expression, and gray color indicates the absence of data in the BnTIR database (BnaGRF1 and BnaGRF33). (B) Expression profiles of BnaGRFs after treatment with various hormones, including indole-3-acetic acid (IAA), 1-aminocyclopropane-1-carboxylic acid (ACC), gibberellin (GA), ABA, trans-Zeatin (TZ), jasmonate (JA), and brassinolide (BL). The heatmap was constructed by taking Log2 values of the transcripts per kilobase of exon model per million mapped reads (TPM) generated from RNA-seq data. The bars of BnaGRFs on heatmap represent the expression change folds after treatments. (C) Expression profiles of BnaGRFs under abiotic stresses, including salt (200 mM NaCl), drought, freezing (–4°C), cold (4°C), heat (38°C), and osmotic stress (300 mM mannitol). In panels (B,C), red and green colors indicate up- and downregulated BnaGRFs, respectively, and gray color indicates unavailability of data in the database (BnaGRF1 and BnaGRF33). The heatmap was constructed by taking Log2 values of the transcripts per kilobase of exon model per million mapped reads (TPM) generated from RNA-seq data. The bars of BnaGRFs on heatmap represent the expression change folds after treatments.
Most BnaGRFs were widely expressed in the B. napus plant at different developmental stages. However, some BnaGRFs, including BnaGRF15, BnaGRF23, BnaGRF28, BnaGRF36, BnaGRF42, BnaGRF45, and BnaGRF46, showed no expression in most of the tissues and organs; three of these genes belonged to the non-ε group, while four of them belonged to the ε group. BnaGRF8 and BnaGRF9 were highly expressed in the silique wall at 60 days after flowering (DAF), suggesting that both these genes play specific roles in silique dehiscence in B. napus. Additionally, BnaGRF10, BnaGRF17, BnaGRF20, BnaGRF27, and BnaGRF38, all of which belonged to the ε group, were expressed only in the filament and 2-DAF silique. Interestingly, many BnaGRFs were expressed to significantly lower levels in siliques at 2 DAF than in siliques at other developmental stages. These results suggest that BnaGRFs play important roles in the growth and development of B. napus.
The expression profiles of BnaGRFs were analyzed in different tissues after treatment with various hormones [IAA, 1-aminocyclopropane-1-carboxylic acid (ACC), GA, ABA, trans-Zeatin (TZ), JA, and BL] and abiotic stresses (salt, drought, freezing, cold, heat, and osmotic), based on the data available in BnTIR (Figures 6B,C).
Heatmap analysis showed that the BnaGRF genes were downregulated upon most hormone treatments (Figure 6B), and were upregulated only in a few instances; however, six genes (BnaGRF15, BnaGRF17, BnaGRF27, BnaGRF36, BnaGRF45, and BnaGRF46) were either not expressed or expressed to very low levels in all hormone treatments. Most BnaGRFs were downregulated after ABA and JA treatments; the expression of a few genes either increased or did not change significantly. BnaGRFs showed different expression patterns in roots and leaves. For instance, BnaGRF10 and BnaGRF38 were down- or upregulated significantly under all of the hormone treatments in the root; however, their expression changed only at a few time points. In contrast to leaves, the expression levels of BnaGRFs changed more dramatically in roots. These results indicate BnaGRFs play important roles in the response to various stresses in the root. Members of the non-ε and ε groups showed different expression patterns. Most of the non-ε group members were downregulated upon hormone treatments, except BnaGRF23, which was upregulated by all phytohormones at some point in time. By contrast, the expression levels of ε group members, including BnaGRF10, BnaGRF28, BnaGRF31, and BnaGRF38 changed more dramatically. In the root, the transcript level of BnaGRF10 decreased by 32-fold at 6 h after the ACC treatment, while that of BnaGRF31 decreased by 42-fold at 6 h post-ABA treatment. The ε group members were more frequently upregulated than the non-ε group members. For example, the transcript level of BnaGRF28 was increased in the root at one or more sampling points after all hormone treatments; BnaGRF10, BnaGRF31, and BnaGRF38 were significantly upregulated at some sampling points after treatment with IAA, ACC, GA, TZ, and BL. Additionally, paralogous gene pairs, such as BnaGRF2/BnaGRF24, BnaGRF18/BnaGRF44, and BnaGRF4/BnaGRF25, showed similar expression patterns.
Under abiotic stress conditions, most of the BnaGRFs showed relatively low expression levels, particularly in roots. All BnaGRFs were downregulated in roots under salt and drought stress, except BnaGRF10, BnaGRF20, BnaGRF28, and BnaGRF42, which were upregulated. Members of both non-ε and ε groups showed similar expression patterns under abiotic stresses ass under hormone treatments. Compared with the ε group members, the non-ε group members showed a smooth transition in expression levels from pre-treatment to post-treatment conditions, except BnaGRF23, which was downregulated by 31.00-fold in leaves at 12 h after under the cold stress treatment; BnaGRF38, which was significantly upregulated by 47-fold in roots at 1 h after the heat treatment; and BnaGRF31, which was upregulated by 43-fold and downregulated by 32-fold at 12 h after cold treatment and 6 h after osmotic stress treatment, respectively. These results indicate that BnaGRFs perform biologically relevant functions during plant development and are potentially involved in abiotic stress responses.
Next, to investigate the role of BnaGRFs in the disease resistance response, the expression levels of these genes were determined by RNA-seq analysis of leaves treated with SA, H2O2, and OA or inoculated with S. sclerotiorum. The DEGs were identified after treatments at different time points (Supplementary Figure 1). SA and H2O2 are important signaling molecules, and OA is a main pathogenic factor secreted by S. sclerotiorum. Our results showed that no BnaGRFs were induced or repressed by H2O2 and OA (Figure 7). In the SA treatment, seven BnaGRF genes (BnaGRF8, BnaGRF9, BnaGRF26, BnaGRF32, BnaGRF35, BnaGRF41, and BnaGRF14) were upregulated, and two BnaGRFs (BnaGRF4 and BnaGRF25) were downregulated significantly. All of these genes were induced or depressed at a late time point (6 h post-treatment). Interestingly, all of these nine BnaGRFs showed the same expression patterns after S. sclerotiorum inoculation, except BnaGFR32, which was upregulated by SA but showed no significant expression variation after S. sclerotiorum inoculation. Nineteen BnaGRFs were differentially expressed by S. sclerotiorum inoculation at different time points. Among these 19 genes, 12 BnaGRFs and 5 BnaGRFs were up- and downregulated, respectively, and 2 BnaGRFs (BnaGRF18 and BnaGRF44) were downregulated at 24 h post-inoculation (hpi) but upregulated at 36 hpi.
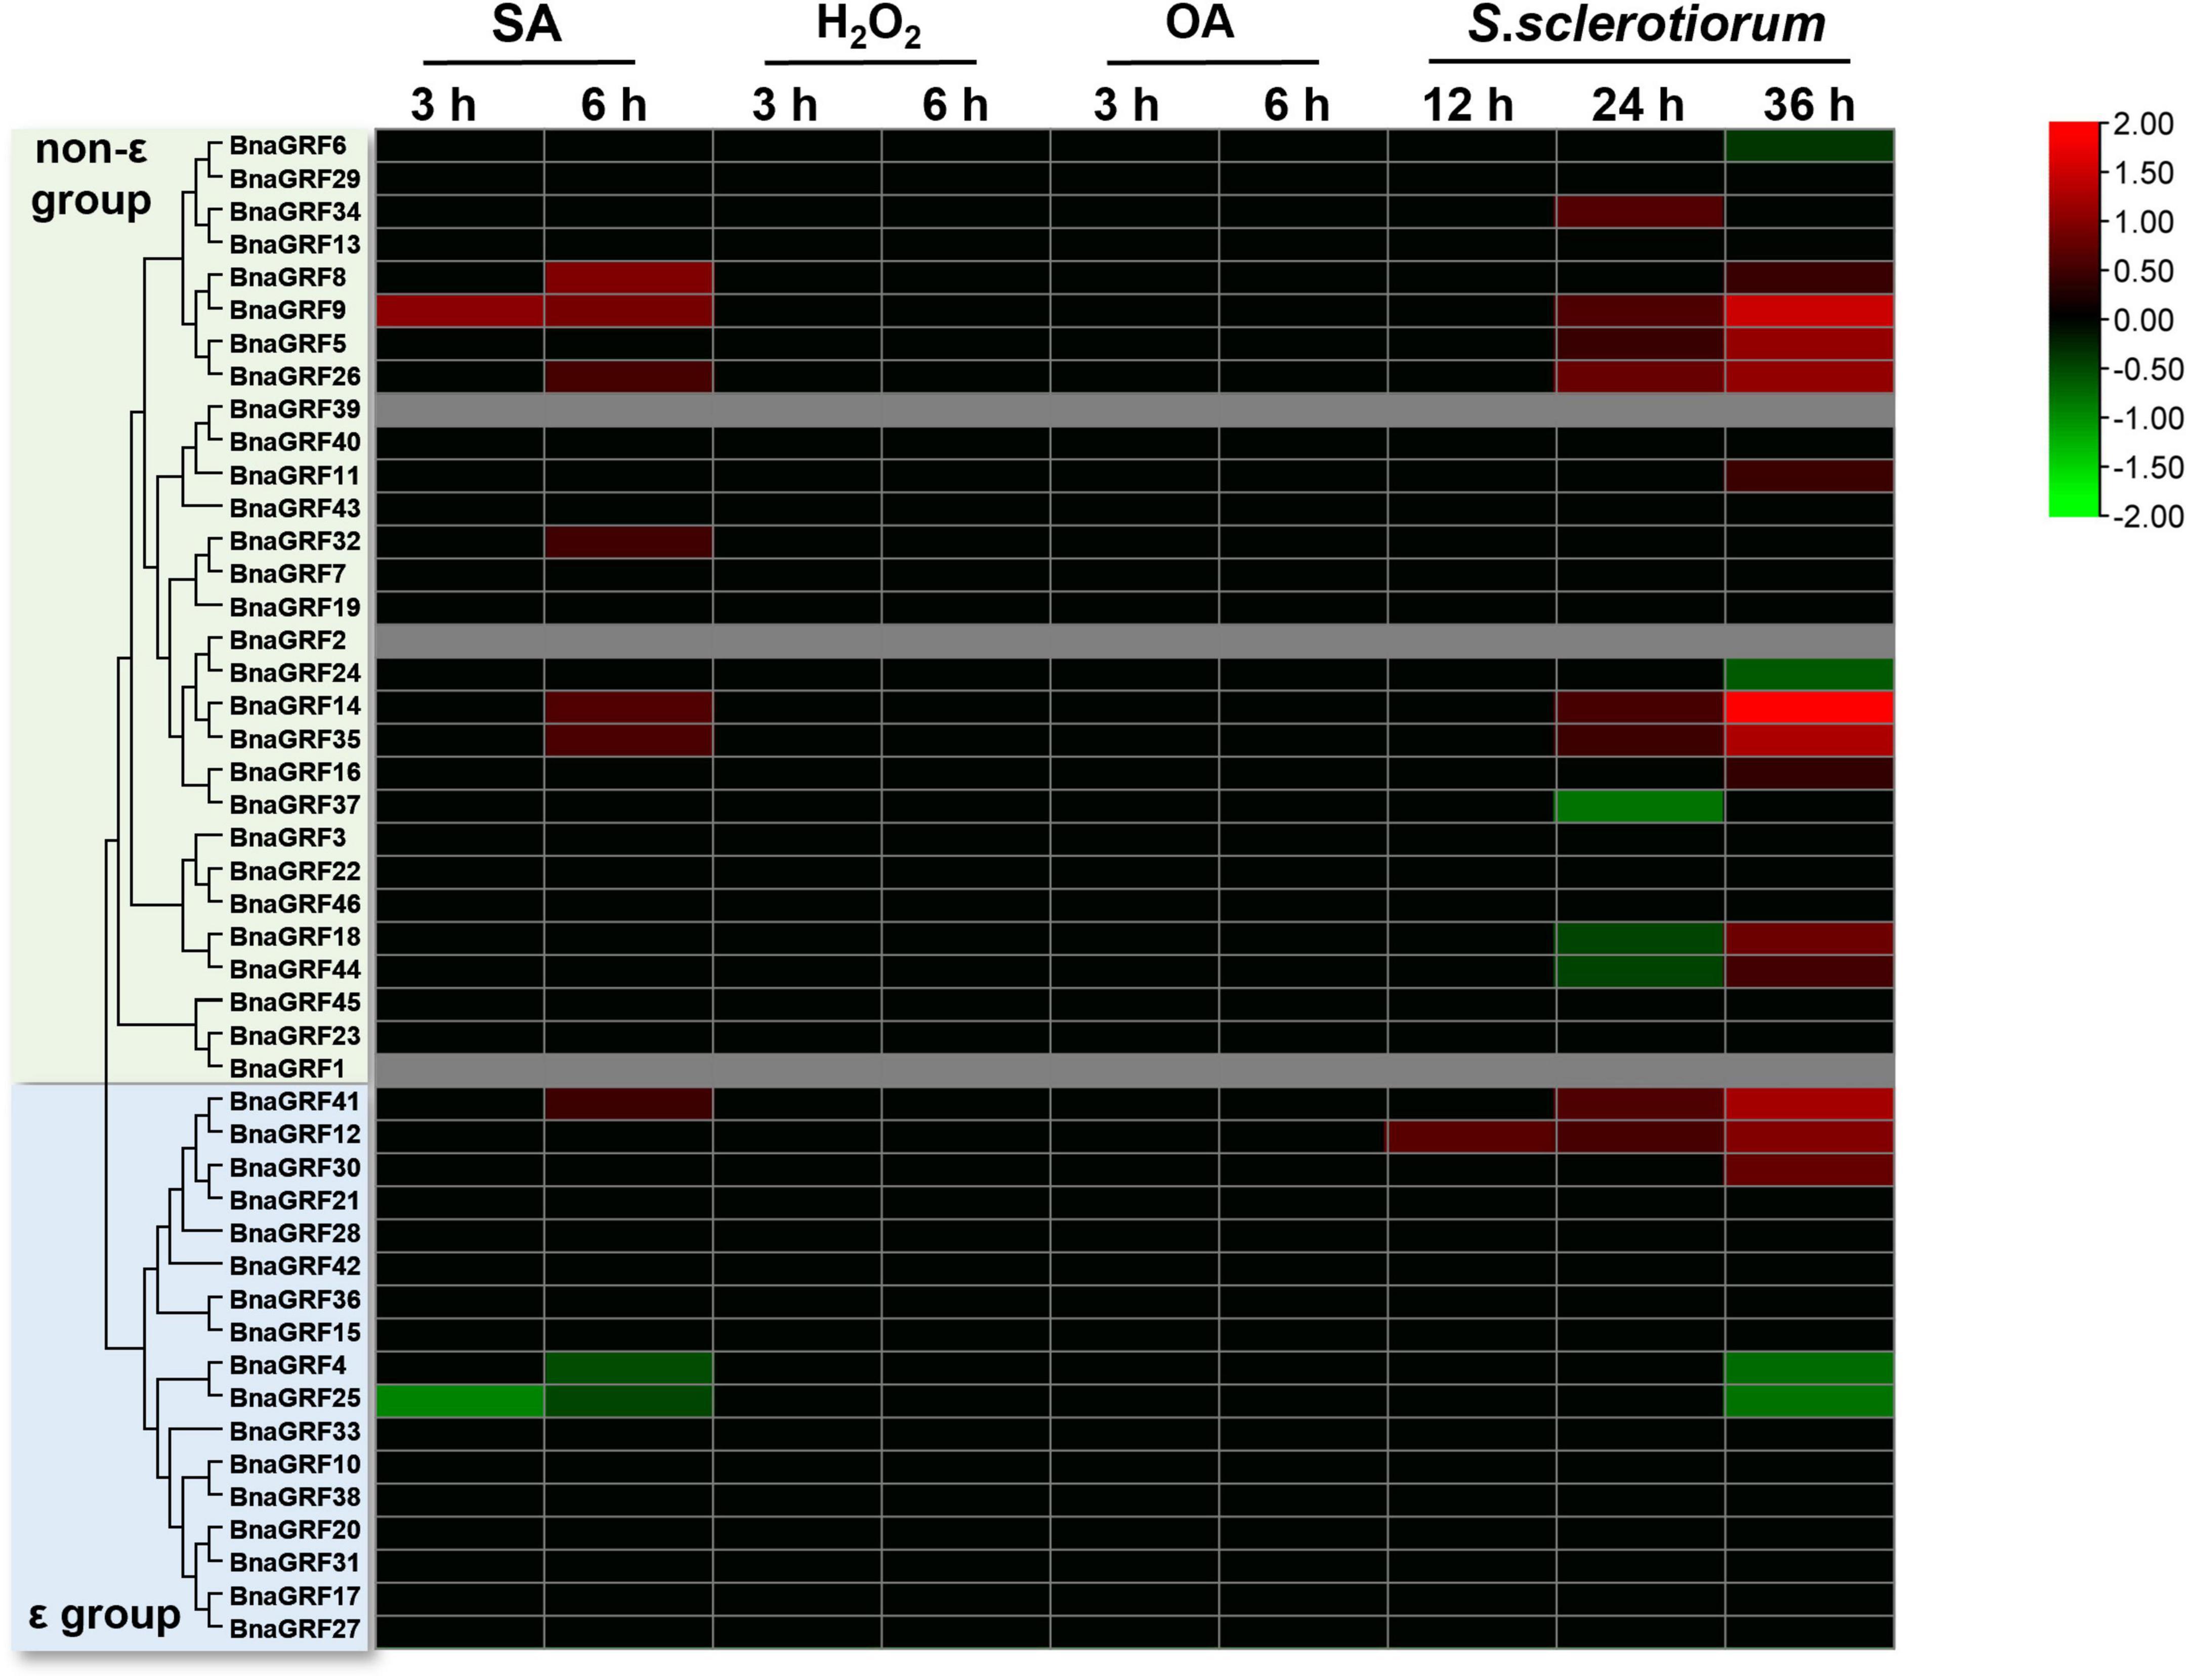
Figure 7. Relative expression levels of BnaGRFs under salicylic acid (SA), hydrogen peroxide (H2O2), and oxalic acid (OA) treatments and Sclerotinia sclerotiorum inoculation. No significant change in expression (p > 0.01) is shown as 0. Red and green colors indicate significantly up- and downregulated genes, respectively, and gray color represents no expression data. The heatmap was constructed by taking Log2 values of the transcript per million fragments mapped (FPKM) generated from RNA-seq data. The bars of BnaGRFs on heatmap represent the expression change folds after treatments.
Overall, the expression profiles of BnaGRFs in response to phytohormones, abiotic stresses, and S. sclerotiorum inoculation suggest that these genes perform diverse or conserved biological functions during plant–environment and plant–microbe interactions.
The 14-3-3 family has been found in all eukaryotes screened to date, and usually consists of multiple proteins and protein isoforms (DeLille et al., 2001). The 14-3-3 proteins exist as homo- and heterodimers in cells (Jones et al., 1995), and function as phosphor-binding regulators in signal transduction pathways by interacting with phosphorylated targets (Camoni et al., 2018). Because 14-3-3s exist as multiple isoforms, these proteins participate in various physiological processes. To the best of our knowledge, the largest 14-3-3 gene family reported to date in plants was identified in both banana and cotton, with each containing 25 14-3-3s (Sun et al., 2011; Li et al., 2016). However, in this research, we identified 46 BnaGRF genes in the B. napus genome; this number is almost twice that in banana and cotton. The lengths of BnaGRF isoforms varied from 182 to 581 aa, and their pI ranged from 4.61 to 5.61, except BnaGRF1 (9.52), BnaGRF15 (6.65), BnaGRF23 (7.01) and BnaGRF45 (9.66) (Table 1). Overall, the data on gene structure, amino acid number, motif type and number, and pI indicated that BnaGRF1, BnaGRF23, and BnaGRF45 are much different from the standard 14-3-3 isoforms, and there are no orthologous genes in Arabidopsis (Figure 1), indicating that BnaGRFs have undergone neofunctionalization in B. napus.
Phylogenetic analysis showed that BnaGRFs could be classified into two groups (ε and non-ε) (Figure 1), consistent with the 14-3-3 family in other plant species (Ferl et al., 2002). The ε and non-ε group members showed considerable differences in intron-exon structure and motif distribution. For instance, BnaGRFs in the ε group contained 5–7 exons, whereas those in the non-ε group contained 2–4 exons, except BnaGRF28 and BnaGRF23, which contained 2 and 14 exons, respectively. The expression patterns of BnaGRF28 and BnaGRF23 under hormone treatments differed from those of other BnaGRFs (Figure 6). Similar results have been reported in other plant species (Cheng et al., 2018; Wang et al., 2019; Shao et al., 2021), which imply evolutionary conservation within the 14-3-3 family.
Tandem duplication, segmental duplication, and WGD events were identified to evaluate the expansion of the BnaGRF gene family. Our results showed that 41 BnaGRFs were generated by WGD or segmental duplication; four BnaGRFs (BnaGRF28, BnaGRF23, BnaGRF28, and BnaGRF23) were a result of dispersed duplication; BnaGRF40, which is separated from BnaGRF39 by only a few genes, originated by proximal duplication; and no BnaGRFs were caused by tandemly duplication (Table 1 and Figure 4). These results indicate that WGD and segmental duplications were the key factors responsible for the expansion of the 14-3-3 gene family, which is consistent with previous studies (Xie et al., 2022).
BnaGRF genes in the A and C subgenomes of B. napus are closely related to 14-3-3 genes in B. rapa and B. oleracea, respectively. The number of 14-3-3 genes in B. napus is exactly equal to the sum of 14-3-3 genes in B. rapa and B. oleracea; however, the 14-3-3 genes in B. napus do not show a one-to-one correspondence with those in B. rapa and B. oleracea. We identified 22 and 24 BnaGRFs in the A and C subgenomes, respectively, of B. napus, and 21 BraGRFs and 25 BolGRFs in B. rapa and B. oleracea genomes, respectively. BnaGRF8 (BnaA05G0489800ZS) is located on chromosome A05 and was identified as an ortholog of Bol01155s020; however, no orthologs of Bol3g099210 and Bol3g005620 were identified in the B. napus genome, even though both BolGRFs are highly homologous to BnaGRF44 (BnaC09G0088500ZS). These results suggest that gene loss events likely occurred in the 14-3-3 gene family in B. napus after hybridization.
Cis-regulatory elements play an important role in the regulation of plant gene expression. The cis-acting element and expression pattern analysis showed that 14-3-3s were involved in hormone and abiotic stress responses in plants (Lyu et al., 2021; Xia et al., 2022; Xie et al., 2022). In this study, we analyzed the stress response-related cis-acting elements in the promoters of BnaGRFs. The 25 cis-regulatory elements were found in the majority of promoters (Figure 5), which implies that the corresponding genes are involved in the stress response.
Expression patterns of BnaGRFs under multiple hormone and abiotic stress treatments were also investigated in this study. Yang Lab developed the BnTIR database, presenting a highly comprehensive temporal-resolution analysis of the transcriptomes of nine different ‘ZS11’ tissues (cotyledon, root, stem peel, leaf, bud, flower, silique, silique wall, and seed) at three distinct developmental stages, and the transcriptomes of roots and leaves under multi-hormone and abiotic stress treatments (Liu et al., 2021). Spatial and temporal expression profiles showed that most of the BnaGRFs were expressed in the vast majority of tissues, except BnaGRF15, BnaGRF23, BnaGRF28, BnaGRF36, BnaGRF42, BnaGRF45, and BnaGRF46, which showed no expression in almost all tissues or organs. These results suggest that BnaGRFs play important roles in the regulation of plant growth and development in B. napus. Interestingly, the expression of BnaGRF10, BnaGRF17, BnaGRF20, BnaGRF27, and BnaGRF38 was only detected in filament and silique sampled at 2 DAF; these genes were clustered into the ε group, which indicates that these genes function in floral organ development.
Phytohormones play a central role in the defense against environmental stress. Expression analysis showed most BnaGRFs responded to hormone and abiotic stress treatments, although the response was stronger to abiotic stresses than to hormones (Figures 6B,C). Compared with other hormones, ABA and JA treatment had a greater influence on the expression level of BnaGRFs. Because ABA and JA are closely related to abiotic and biotic stresses, other results hint at the involvement of BnaGRFs in the response to abiotic and biotic stresses. Almost all BnaGRFs responded to salt, drought, freezing, cold, heat, and osmotic stresses. In most cases, BnaGRFs were downregulated by these abiotic stresses. Expression levels of BnaGRFs differed significantly between the ε and non-ε groups; for instance, a higher percentage of BnaGRFs in the ε group was unexpressed or showed low-level expression in response to all abiotic stresses (5/17), whereas only two BnaGRFs in the non-ε group (BnaGRF45 and BnaGRF46) showed this expression pattern. Compared with the non-ε group BnaGRFs, the ε group members showed a more dramatic increase or decrease in transcript levels. These results suggest that BnaGRFs, especially the ε group members, are extensively involved in the stress response in B. napus, and this involvement most likely occurs through various hormone signaling pathways.
Sclerotinia stem rot, caused by S. sclerotiorum, is the most serious disease affecting the yield of rapeseed, an agriculturally and economically important crop (Boland and Hall, 1994; Liu et al., 2018). JA, SA, and H2O2 signaling pathways are thought to be central components of the mechanisms underlying the active defense response (Hu et al., 2021; Xu et al., 2021). OA is a toxic compound secreted by S. sclerotiorum, which plays an important role in the infection process (Magro et al., 1984; Liang et al., 2015). In the current study, we performed SA, H2O2, and OA treatments and S. sclerotiorum inoculation to evaluate changes in the expression levels of BnaGRFs. None of the BnaGRFs showed a response to H2O2 and OA treatments; however, 9 (19.57%) and 19 (41.30%) BnaGRFs showed differential expression upon the SA treatment and S. sclerotiorum inoculation, respectively (Figure 7). These results indicated that BnaGRF family may not participate in H2O2 and OA metabolic and accumulation processes in B. napus. In addition, changes in the expression levels of BnaGRFs were also detected upon the JA treatment (Figure 6B). The cis-element analysis of these gene promoters revealed that all of the 19 BnaGRFs promoters have MYB-binding sites. In addition, 18 of them show MYC and G-box element and 17 have ABRE and ARE elements. These elements may be involved in the response to S. sclerotiorum. Among the 19 BnaGRFs which response to S. sclerotiorum inoculation, 14 (73.69%) were clustered into the non-ε group, this is almost half of the non-ε group members. This data implied that the members of non-ε group paly more important roles in S. sclerotiorum resistance response. Together, these results suggest that BnaGRFs might participate in the response to S. sclerotiorum via the JA and SA signaling pathways. It has been reported that SA and JA signaling pathways are involved in the plant resistance to S. sclerotiorum in B. napus, whereas the specific regulatory process remains unknown (Wu et al., 2016). A comprehensive study on the function of GRFs and their interacting proteins will help to elucidate the response processes, and these GRFs may be further applied as genetic resources for breeding S. sclerotiorum-resistant plants in B. napus.
Overall, this study presents a comprehensive analysis of the BnaGRF gene family in rapeseed and provides evidence for their possible roles in the response to S. sclerotiorum infection. In total, 46 BnaGRFs were identified in the B. napus genome, and classified into the ε and non-ε groups. Analysis of cis-acting regulatory elements in BnaGRF promoters and evaluation of BnaGRF expression patterns in various tissues and under abiotic stresses revealed that these genes play important roles in plant development and stress responses. RNA-seq data showed that 41.30% of the BnaGRFs are involved in the response to S. sclerotiorum infection.
In summary, these findings provide a detailed characterization of BnaGRFs in B. napus, and could serve as a platform for the functional analysis and genetic improvement of agronomic traits in B. napus.
The datasets presented in this study can be found in online repositories. The names of the repository/repositories and accession number(s) can be found in the article/Supplementary material.
QS and YPW designed the research. QS, YX, PL, YL, and YW performed the experiments. QS, YX, PL, and YL analyzed the data. QS, YX, and YPW wrote and revised the manuscript. All authors read and approved the current version of the manuscript.
This research was funded by the National Natural Science Foundation of China (U20A2028 and 31901504), the Natural Science Foundation of Jiangsu Province (BK20190894 and BE2022340), and the Priority Academic Program Development of Jiangsu Higher Education Institutions, Project of Special Funding for Crop Science Discipline Development (yzuxk202006).
The authors declare that the research was conducted in the absence of any commercial or financial relationships that could be construed as a potential conflict of interest.
All claims expressed in this article are solely those of the authors and do not necessarily represent those of their affiliated organizations, or those of the publisher, the editors and the reviewers. Any product that may be evaluated in this article, or claim that may be made by its manufacturer, is not guaranteed or endorsed by the publisher.
The Supplementary Material for this article can be found online at: https://www.frontiersin.org/articles/10.3389/fpls.2022.986635/full#supplementary-material
Bailey, T. L., Johnson, J., Grant, C. E., and Noble, W. S. (2015). The MEME Suite. Nucleic Acids Res. 43, W39–W49. doi: 10.1093/nar/gkv416
Boland, G. J., and Hall, R. (1994). Index of plant hosts of Sclerotinia sclerotiorum. Can. J. Plant Pathol. 16, 93–108. doi: 10.1080/07060669409500766
Camoni, L., Visconti, S., Aducci, P., and Marra, M. (2018). 14-3-3 proteins in plant hormone signaling: doing several things at once. Front. Plant Sci. 9:297. doi: 10.3389/fpls.2018.00297
Catala, R., Lopez-Cobollo, R., Mar Castellano, M., Angosto, T., Alonso, J. M., Ecker, J. R., et al. (2014). The Arabidopsis 14-3-3 protein RARE COLD INDUCIBLE 1A links low-temperature response and ethylene biosynthesis to regulate freezing tolerance and cold acclimation. Plant Cell 26, 3326–3342. doi: 10.1105/tpc.114.127605
Chalhoub, B., Denoeud, F., Liu, S., Parkin, I. A. P., Tang, H., Wang, X., et al. (2014). Plant genetics. Early allopolyploid evolution in the post-Neolithic Brassica napus oilseed genome. Science 345, 950–953. doi: 10.1126/science.1253435
Chandna, R., Augustine, R., Kanchupati, P., Kumar, R., Kumar, P., Arya, G. C., et al. (2016). Class-specific evolution and transcriptional differentiation of 14-3-3 family members in mesohexaploid Brassica rapa. Front. Plant. Sci. 7:12. doi: 10.3389/fpls.2016.00012
Chang, I. F., Curran, A., Woolsey, R., Quilici, D., Cushman, J. C., Mittler, R., et al. (2009). Proteomic profiling of tandem affinity purified 14-3-3 protein complexes in Arabidopsis thaliana. Proteomics 9, 2967–2985. doi: 10.1002/pmic.200800445
Chang, L., Tong, Z., Peng, C., Wang, D., Kong, H., Yang, Q., et al. (2020). Genome-wide analysis and phosphorylation sites identification of the 14-3-3 gene family and functional characterization of MeGRF3 in cassava. Physiol. Plant 169, 244–257. doi: 10.1111/ppl.13070
Chen, C., Chen, H., Zhang, Y., Thomas, H. R., Frank, M. H., He, Y., et al. (2020). TBtools: An integrative toolkit developed for interactive analyses of big biological data. Mol. Plant 13, 1194–1202. doi: 10.1016/j.molp.2020.06.009
Chen, F., Li, Q., Sun, L., and He, Z. (2006). The rice 14-3-3 gene family and its involvement in responses to biotic and abiotic stress. DNA Res. 13, 53–63. doi: 10.1093/dnares/dsl001
Cheng, C., Wang, Y., Chai, F., Li, S., Xin, H., and Liang, Z. (2018). Genome-wide identification and characterization of the 14-3-3 family in Vitis vinifera L. during berry development and cold- and heat-stress response. BMC Genomics 19:579. doi: 10.1186/s12864-018-4955-8
DeLille, J. M., Sehnke, P. C., and Ferl, R. J. (2001). The Arabidopsis 14-3-3 family of signaling regulators. Plant Physiol. 126, 35–38. doi: 10.1104/pp.126.1.35
Ferl, R. J., Manak, M. S., and Reyes, M. F. (2002). The 14-3-3s. Genome Biol. 3:3010. doi: 10.1186/gb-2002-3-7-reviews3010
Finn, R. D., Clements, J., and Eddy, S. R. (2011). HMMER web server: interactive sequence similarity searching. Nucleic Acids Res. 39, W29–W37. doi: 10.1093/nar/gkr367
Holtman, W. L., Roberts, M. R., Oppedijk, B. J., Testerink, C., Van Zeijl, M. J., and Wang, M. (2000). 14-3-3 proteins interact with a 13-lipoxygenase, but not with a 9-lipoxygenase. FEBS Lett. 474, 48–52. doi: 10.1016/s0014-5793(00)01575-1
Hu, H., Tang, Y., Wu, J., Chen, F., Yang, Y., Pan, X., et al. (2021). Brassica napus mediator subunit16 induces BnMED25- and BnWRKY33-activated defense signaling to confer Sclerotinia sclerotiorum resistance. Front. Plant Sci. 12:663536. doi: 10.3389/fpls.2021.663536
Ito, T., Nakata, M., Fukazawa, J., Ishida, S., and Takahashi, Y. (2014). Scaffold function of Ca2+-dependent protein kinase: tobacco Ca2+-DEPENDENT PROTEIN KINASE1 transfers 14-3-3 to the substrate REPRESSION OF SHOOT GROWTH after phosphorylation. Plant Physiol. 165, 1737–1750. doi: 10.1104/pp.114.236448
Jaspert, N., Throm, C., and Oecking, C. (2011). Arabidopsis 14-3-3 proteins: Fascinating and less fascinating aspects. Front. Plant Sci. 2:96. doi: 10.3389/fpls.2011.00096
Jones, D. H., Ley, S., and Aitken, A. (1995). Isoforms of 14-3-3 protein can form homo- and heterodimers in vivo and in vitro: Implications for function as adapter proteins. FEBS Lett. 368, 55–58. doi: 10.1016/0014-5793(95)00598-4
Kaneko-Suzuki, M., Kurihara-Ishikawa, R., Okushita-Terakawa, C., Kojima, C., Nagano-Fujiwara, M., Ohki, I., et al. (2018). TFL1-Like proteins in rice antagonize rice FT-Like protein in inflorescence development by competition for complex formation with 14-3-3 and FD. Plant Cell Physiol. 59, 458–468. doi: 10.1093/pcp/pcy021
Konagaya, K.-I., Matsushita, Y., Kasahara, M., and Nyunoya, H. (2004). Members of 14-3-3 protein isoforms interacting with the resistance gene product N and the elicitor of Tobacco mosaic virus. J. Gen. Plant Pathol. 70, 221–231. doi: 10.1007/s10327-003-0113-4
Li, M., Ren, L., Xu, B., Yang, X., Xia, Q., He, P., et al. (2016). Genome-wide identification, phylogeny, and expression analyses of the 14-3-3 family reveal their involvement in the development, ripening, and abiotic stress response in banana. Front. Plant Sci. 7:1442. doi: 10.3389/fpls.2016.01442
Liang, X., Liberti, D., Li, M., Kim, Y. T., Hutchens, A., Wilson, R., et al. (2015). Oxaloacetate acetylhydrolase gene mutants of Sclerotinia sclerotiorum do not accumulate oxalic acid, but do produce limited lesions on host plants. Mol. Plant Pathol. 16, 559–571. doi: 10.1111/mpp.12211
Liu, D., Yu, L., Wei, L., Yu, P., Wang, J., Zhao, H., et al. (2021). BnTIR: An online transcriptome platform for exploring RNA-seq libraries for oil crop Brassica napus. Plant Biotechnol. J. 19, 1895–1897. doi: 10.1111/pbi.13665
Liu, F., Li, X. X., Wang, M. R., Wen, J., Yi, B., Shen, J. X., et al. (2018). Interactions of WRKY15 and WRKY33 transcription factors and their roles in the resistance of oilseed rape to Sclerotinia infection. Plant Biotechnol. J. 16, 911–925. doi: 10.1111/pbi.12838
Lyu, S., Chen, G., Pan, D., Chen, J., and She, W. (2021). Molecular analysis of 14-3-3 genes in Citrus sinensis and their responses to different stresses. Int. J. Mol. Sci. 22:568. doi: 10.3390/ijms22020568
Magro, P., Marciano, P., and Di Lenna, P. (1984). Oxalic acid production and its role in pathogenesis of Sclerotinia sclerotiorum. FEMS Microbiol. Lett. 24, 9–12.
Mayfield, J. D., Folta, K. M., Paul, A. L., and Ferl, R. J. (2007). The 14-3-3 Proteins mu and upsilon influence transition to flowering and early phytochrome response. Plant Physiol. 145, 1692–1702. doi: 10.1104/pp.107.108654
Mayfield, J. D., Paul, A. L., and Ferl, R. J. (2012). The 14-3-3 proteins of Arabidopsis regulate root growth and chloroplast development as components of the photosensory system. J. Exp. Bot. 63, 3061–3070. doi: 10.1093/jxb/ers022
Nakamura, T., Yamada, K. D., Tomii, K., and Katoh, K. (2018). Parallelization of MAFFT for large-scale multiple sequence alignments. Bioinformatics 34, 2490–2492. doi: 10.1093/bioinformatics/bty121
Pi, B., Pan, J., Xiao, M., Hu, X., Zhang, L., Chen, M., et al. (2021). Systematic analysis of CCCH zinc finger family in Brassica napus showed that BnRR-TZFs are involved in stress resistance. BMC Plant Biol. 21:555. doi: 10.1186/s12870-021-03340-8
Qin, C., Cheng, L., Shen, J., Zhang, Y., Cao, H., Lu, D., et al. (2016). Genome-wide identification and expression analysis of the 14-3-3 family genes in Medicago truncatula. Front. Plant Sci. 7:320. doi: 10.3389/fpls.2016.00320
Rahman, H., Xu, Y. P., Zhang, X. R., and Cai, X. Z. (2016). Brassica napus genome possesses extraordinary iigh number of CAMTA genes and CAMTA3 contributes to PAMP triggered immunity and resistance to Sclerotinia sclerotiorum. Front. Plant Sci. 7:581. doi: 10.3389/fpls.2016.00581
Robinson, M. D., Mccarthy, D. J., and Smyth, G. K. (2010). edgeR: A Bioconductor package for differential expression analysis of digital gene expression data. Bioinformatics 26, 139–140. doi: 10.1093/bioinformatics/btp616
Rosenquist, M., Alsterfjord, M., Larsson, C., and Sommarin, M. (2001). Data mining the Arabidopsis genome reveals fifteen 14-3-3 genes. expression is demonstrated for two out of five novel genes. Plant Physiol. 127, 142–149. doi: 10.1104/pp.127.1.142
Ryu, H., Cho, H., Kim, K., and Hwang, I. (2010). Phosphorylation dependent nucleocytoplasmic shuttling of BES1 is a key regulatory event in brassinosteroid signaling. Mol. Cells 29, 283–290. doi: 10.1007/s10059-010-0035-x
Schoonheim, P. J., Costa Pereira, D. D., and De Boer, A. H. (2009). Dual role for 14-3-3 proteins and ABF transcription factors in gibberellic acid and abscisic acid signalling in barley (Hordeum vulgare) aleurone cells. Plant Cell Environ. 32, 439–447. doi: 10.1111/j.1365-3040.2009.01932.x
Schoonheim, P. J., Sinnige, M. P., Casaretto, J. A., Veiga, H., Bunney, T. D., Quatrano, R. S., et al. (2007). 14-3-3 adaptor proteins are intermediates in ABA signal transduction during barley seed germination. Plant J. 49, 289–301. doi: 10.1111/j.1365-313X.2006.02955.x
Shao, W., Chen, W., Zhu, X., Zhou, X., Jin, Y., Zhan, C., et al. (2021). Genome-wide identification and characterization of wheat 14-3-3 genes unravels the role of TaGRF6-A in salt stress tolerance by binding MYB transcription factor. Int. J. Mol. Sci. 22, 1904. doi: 10.3390/ijms22041904
Song, J. M., Guan, Z., Hu, J., Guo, C., Yang, Z., Wang, S., et al. (2020). Eight high-quality genomes reveal pan-genome architecture and ecotype differentiation of Brassica napus. Nat. Plants 6, 34–45. doi: 10.1038/s41477-019-0577-7
Sun, G., Xie, F., and Zhang, B. (2011). Transcriptome-wide identification and stress properties of the 14-3-3 gene family in cotton (Gossypium hirsutum L.). Funct. Integr. Genomics 11, 627–636. doi: 10.1007/s10142-011-0242-3
Sun, X., Luo, X., Sun, M., Chen, C., Ding, X., Wang, X., et al. (2014). A Glycine soja 14-3-3 protein GsGF14o participates in stomatal and root hair development and drought tolerance in Arabidopsis thaliana. Plant Cell Physiol. 55, 99–118. doi: 10.1093/pcp/pct161
Takahashi, K., Hayashi, K., and Kinoshita, T. (2012). Auxin activates the plasma membrane H+-ATPase by phosphorylation during hypocotyl elongation in Arabidopsis. Plant Physiol. 159, 632–641. doi: 10.1104/pp.112.196428
Taoka, K., Ohki, I., Tsuji, H., Furuita, K., Hayashi, K., Yanase, T., et al. (2011). 14-3-3 proteins act as intracellular receptors for rice Hd3a florigen. Nature 476, 332–335. doi: 10.1038/nature10272
Tian, F., Wang, T., Xie, Y., Zhang, J., and Hu, J. (2015). Genome-wide identification, classification, and expression analysis of 14-3-3 gene family in Populus. PLoS One 10:e0123225. doi: 10.1371/journal.pone.0123225
Wang, D., Zhang, Y., Zhang, Z., Zhu, J., and Yu, J. (2010). KaKs_Calculator 2.0: A toolkit incorporating Gamma-Series methods and sliding window strategies. Genom Proteom. Bioinform. 8, 77–80. doi: 10.1016/s1672-0229(10)60008-3
Wang, H., Yang, C., Zhang, C., Wang, N., Lu, D., Wang, J., et al. (2011). Dual role of BKI1 and 14-3-3 s in brassinosteroid signaling to link receptor with transcription factors. Dev. Cell 21, 825–834. doi: 10.1016/j.devcel.2011.08.018
Wang, Y., Ling, L., Jiang, Z., Tan, W., Liu, Z., Wu, L., et al. (2019). Genome-wide identification and expression analysis of the 14-3-3 gene family in soybean (Glycine max). PeerJ 7:e7950. doi: 10.7717/peerj.7950
Wu, J., Cai, G. Q., Tu, J. Y., Li, L. X., Liu, S., Luo, X. P., et al. (2013). Identification of QTLs for resistance to sclerotinia stem rot and BnaC.IGMT5.a as a candidate gene of the major resistant QTL SRC6 in Brassica napus. PLoS One 8:e67740. doi: 10.1371/journal.pone.0067740
Wu, J., Zhao, Q., Yang, Q., Liu, H., Li, Q., Yi, X., et al. (2016). Comparative transcriptomic analysis uncovers the complex genetic network for resistance to Sclerotinia sclerotiorum in Brassica napus. Sci. Rep. 6:19007. doi: 10.1038/srep19007
Xia, L., He, X., Huang, X., Yu, H., Lu, T., Xie, X., et al. (2022). Genome-wide identification and expression analysis of the 14-3-3 gene family in mango (Mangifera indica L.). Int. J. Mol. Sci. 23, 1593. doi: 10.3390/ijms23031593
Xie, M., Zuo, R., Bai, Z., Yang, L., Zhao, C., Gao, F., et al. (2022). Genome-wide characterization of Serine/Arginine-rich gene family and its genetic effects on agronomic traits of Brassica napus. Front. Plant. Sci. 13:829668. doi: 10.3389/fpls.2022.829668
Xu, B., Gong, X., Chen, S., Hu, M., Zhang, J., and Peng, Q. (2021). Transcriptome analysis reveals the complex molecular mechanisms of Brassica napus-Sclerotinia sclerotiorum interactions. Front. Plant. Sci. 12:716935. doi: 10.3389/fpls.2021.716935
Yan, J., He, C., Wang, J., Mao, Z., Holaday, S. A., Allen, R. D., et al. (2004). Overexpression of the Arabidopsis 14-3-3 protein GF14 lambda in cotton leads to a “stay-green” phenotype and improves stress tolerance under moderate drought conditions. Plant Cell Physiol. 45, 1007–1014. doi: 10.1093/pcp/pch115
Yang, X., Wang, W., Coleman, M., Orgil, U., Feng, J., Ma, X., et al. (2009). Arabidopsis 14-3-3 lambda is a positive regulator of RPW8-mediated disease resistance. Plant J. 60, 539–550. doi: 10.1111/j.1365-313X.2009.03978.x
Yoon, G. M., and Kieber, J. J. (2013). 14-3-3 regulates 1-aminocyclopropane-1-carboxylate synthase protein turnover in Arabidopsis. Plant Cell 25, 1016–1028. doi: 10.1105/tpc.113.110106
Zhan, G.-M., Tong, J., Wang, H.-Z., and Hua, W. (2010). Molecular analysis and expression patterns of four 14-3-3 genes from Brassica napus L. Agric. Sci. China 9, 942–950. doi: 10.1016/S1671-2927(09)60175-9
Keywords: 14-3-3, GF14, GRF, general regulatory factor, Brassica napus, Sclerotinia sclerotiorum, rapeseed, G-box regulating factors
Citation: Sun Q, Xi Y, Lu P, Lu Y, Wang Y and Wang Y (2022) Genome-wide analysis of the G-box regulating factors protein family reveals its roles in response to Sclerotinia sclerotiorum infection in rapeseed (Brassica napus L.). Front. Plant Sci. 13:986635. doi: 10.3389/fpls.2022.986635
Received: 05 July 2022; Accepted: 27 July 2022;
Published: 12 August 2022.
Edited by:
Huajian Zhang, Anhui Agricultural University, ChinaReviewed by:
Maoteng Li, Huazhong University of Science and Technology, ChinaCopyright © 2022 Sun, Xi, Lu, Lu, Wang and Wang. This is an open-access article distributed under the terms of the Creative Commons Attribution License (CC BY). The use, distribution or reproduction in other forums is permitted, provided the original author(s) and the copyright owner(s) are credited and that the original publication in this journal is cited, in accordance with accepted academic practice. No use, distribution or reproduction is permitted which does not comply with these terms.
*Correspondence: Youping Wang, d2FuZ3lwQHl6dS5lZHUuY24=
Disclaimer: All claims expressed in this article are solely those of the authors and do not necessarily represent those of their affiliated organizations, or those of the publisher, the editors and the reviewers. Any product that may be evaluated in this article or claim that may be made by its manufacturer is not guaranteed or endorsed by the publisher.
Research integrity at Frontiers
Learn more about the work of our research integrity team to safeguard the quality of each article we publish.