 Qiang Yang
 Binqi Li
 Hafiz Muhammad Rizwan
 Kaiwei Sun
 Jiajing Zeng
95% of researchers rate our articles as excellent or good
Learn more about the work of our research integrity team to safeguard the quality of each article we publish.
Find out more
ORIGINAL RESEARCH article
Front. Plant Sci. , 25 August 2022
Sec. Plant Breeding
Volume 13 - 2022 | https://doi.org/10.3389/fpls.2022.972734
This article is part of the Research Topic Recent Developments for Drought-Resilient Crop Breeding View all 7 articles
The NAC gene family is one of the largest plant transcription factors (TFs) families and plays important roles in plant growth, development, metabolism, and biotic and abiotic stresses. However, NAC gene family has not been reported in passion fruit (Passiflora edulis). In this study, a total of 105 NAC genes were identified in the passion fruit genome and were unevenly distributed across all nine-passion fruit chromomere, with a maximum of 48 PeNAC genes on chromosome one. The physicochemical features of all 105 PeNAC genes varied including 120 to 3,052 amino acids, 3 to 8 conserved motifs, and 1 to 3 introns. The PeNAC genes were named (PeNAC001–PeNAC105) according to their chromosomal locations and phylogenetically grouped into 15 clades (NAC-a to NAC-o). Most PeNAC proteins were predicted to be localized in the nucleus. The cis-element analysis indicated the possible roles of PeNAC genes in plant growth, development, light, hormones, and stress responsiveness. Moreover, the PeNAC gene duplications including tandem (11 gene pairs) and segmental (12 gene pairs) were identified and subjected to purifying selection. All PeNAC proteins exhibited similar 3D structures, and a protein–protein interaction network analysis with known Arabidopsis proteins was predicted. Furthermore, 17 putative ped-miRNAs were identified to target 25 PeNAC genes. Potential TFs including ERF, BBR-BPC, Dof, and bZIP were identified in promoter region of all 105 PeNAC genes and visualized in a TF regulatory network. GO and KEGG annotation analysis exposed that PeNAC genes were related to different biological, molecular, and cellular terms. The qRT-PCR expression analysis discovered that most of the PeNAC genes including PeNAC001, PeNAC003, PeNAC008, PeNAC028, PeNAC033, PeNAC058, PeNAC063, and PeNAC077 were significantly upregulated under Fusarium kyushuense and drought stress conditions compared to controls. In conclusion, these findings lay the foundation for further functional studies of PeNAC genes to facilitate the genetic improvement of plants to stress resistance.
Gene expression regulation plays an important role in various biological and physiological functions. Transcription factors (TFs) are fundamental regulatory elements at the transcriptional level and play an important role in protein evolution and crop improvement (Martínez-Ainsworth and Tenaillon, 2016). TFs modulate cis-acting elements of different signaling pathways by combination thereby stimulating, or repressing the expression of target genes (Hernández and Sanan-Mishra, 2017; Pascual et al., 2018). The TF typically contains four functional domains including a DNA binding region, an oligomerization site, a transcription regulation domain, and a nuclear localization (Du et al., 2012). Based on previous research on Arabidopsis thaliana TF families, a total of 2296 TFs were included in the PlantTFDB database and were classified into 58 families (Jin et al., 2014; Munir et al., 2020). As a class of TFs with a variety of biological functions, NAC TFs are unique to plants and belong to one of the largest TF families, and widely exist in eukaryotes (Duval et al., 2002). The NAC TF family is named after three very important proteins with analogous DNA-binding domains including no apical meristem (NAM) from Petunia hybrida, the Arabidopsis transcription activation factors (ATAF1 and ATAF2), and cup-shaped cotyledon 2 (CUC2), that formed a conserved NAC domain (Souer et al., 1996; Aida et al., 1997). NAM domains are associated with plant growth and development (Jensen et al., 2008; Trupkin et al., 2019), while ATAF1/2 and ATCUC are tangled in stress, defense response elements, and embryonic, floral, and apical meristem development, respectively (Lu et al., 2007; Tran et al., 2009; Wang et al., 2009).
Protein structure analysis revealed that the NAC TF family is a novel type and N-terminal encodes a highly conserved DNA-binding domain of about 160 amino acids, which facilitates the binding of target genes to N-terminal cis-elements, as well as different transactivation domains at the C-terminus (Olsen et al., 2005). The NAC domain is further classified into five subdomains including A to E and is related to different functions such as nuclear localization and DNA-binding of homodimers or heterodimers (Khedia et al., 2018). The F to O NAC subdomains are not classified according to conserved motifs and are called NAC-like proteins (Tran et al., 2009). The NAC subdomains such as A, C, and D are conserved at N-terminal and contain nuclear localization signals, while the subdomains including B and E are diverse and might be responsible for different functions (Ooka et al., 2003). The C-terminus exhibits the same highly diverse amino acid sequence, rich in serine, threonine, proline, glutamic acid, amino acid residues, etc., which plays a significant role in transcriptional regulation (Kim et al., 2006).
The NAC TF family members play a significant role in the regulation of plant growth, metabolism and development (Liu et al., 2020), cell wall biosynthesis (Hussey et al., 2011; Zhang et al., 2020), hormone signal transduction (Moschen et al., 2019; Liu et al., 2022), leaf senescence (Kim et al., 2016), fruit ripening (Jing et al., 2018; Zhang et al., 2018), seed development (Han et al., 2014), the stress response of plants to biotic and abiotic stresses (Shao et al., 2015; Raza, 2021), flower morphogenesis (Hendelman et al., 2013), and wood formation (Ohtani et al., 2011). The overexpression of ANAC019, ANAC055, and ANAC072 enhanced drought, cold and salt tolerance in Arabidopsis (Tran et al., 2004). Furthermore, the overexpression of SNAC1 (Saad et al., 2013), ONAC22 (Hong et al., 2016), ONAC045 (Zheng et al., 2009), and OsNAC52 (Gao et al., 2010) enhanced tolerance to abiotic stresses in rice (Oryza sativa L.). Plants activate the defense response genes through disease resistance pathways such as ethylene (ET), jasmonic acid (JA), and salicylic acid (SA) to activate the plant disease resistance defense response (Yang et al., 2019). For example, overexpression of the StNAC gene in potato (Solanum tuberosum) improved the Phytophthora infestans infection and wounding treatment (Collinge and Boller, 2001). Overexpression of HvNAC6 gene barley (Hordeum vulgare) induced resistance toward Blumeria graminis contamination (Jensen et al., 2007). In rice, OsNAC4 responds to the virulent bacterial strain of Acidovorax avenae N1141 (Kaneda et al., 2009) and ATAF1 regulates the defense response in contradiction of various pathogens (Wang et al., 2009).
Furthermore, micro-RNAs (miRNAs) are approximately 21–30 nucleotides in length and are single-stranded non-coding RNAs that play important roles in cellular mechanisms, conferring stress resistance through translational repression or cleavage of transcriptional or post-transcriptional (Kidner and Martienssen, 2005; O’Brien et al., 2018). Asefpour Vakilian (2020) reported that the miRNA plays a significant role under plant stresses. In recent years, with the development of bioinformatics, molecular biology techniques and the crucial role of NAC genes, the gnome wide identification of NAC genes has already been reported in numerous plants including 117 NAC genes in Arabidopsis and 151 in rice (Ooka et al., 2003), 87 genes in maize (Wang G. et al., 2020), 145 genes in sorghum (Sorghum bicolor) (Kadier et al., 2017), 132 genes in peanut (Arachis hypogaea) (Li P. et al., 2021), 113 genes in Medicago sativa (Min et al., 2020), 90 genes in eggplant (Solanum melongena) (Wan et al., 2021), 102 genes in apricot (Prunus sibirica) (Xu et al., 2021), and cacao (Theobroma cacao) (Shen et al., 2019), 167 genes in barley (Murozuka et al., 2018), 64 genes in pitaya (Hylocereus) (Hu et al., 2022), 114 genes in walnut (Juglans mandshurica) (Li X. et al., 2021), 114 genes in longan (Dimocarpus longan) (Munir et al., 2020), 154 genes in tobacco (Nicotiana tabacum) (Li et al., 2018), 91 genes in cucumber (Cucumis sativus) (Liu et al., 2018), 180 genes in apple (Malus domestica) (Su et al., 2013), 147 genes in foxtail millet (Setaria italica) (Puranik et al., 2013), 55 genes in jujuba (Ziziphus jujuba) (Li M. et al., 2021), 163 genes in poplar (Populus Trichocarpa) (Hu et al., 2010), 152 genes in soyabean (Glycine max) (Le et al., 2011), and 104 genes in pepper (Capsicum annuum) (Diao et al., 2018), respectively. However, the NAC gene family has not been studied in passion fruit.
Passion fruit belongs to the Passifloraceae family and is a perennial vine, widely cultivated in subtropical and tropical regions of the world. It has important economic value and is demanded because of its fresh juice as raw material for the food and beverage industry. Passion fruit is rich in nutrients and its roots, stems, and leaves are also used in the pharmaceutical industry (Rizwan et al., 2021). Passion fruit is often affected by adverse environmental factors during growth and development, resulting in reduced yield, quality, and huge economic losses (Rizwan et al., 2021; Yan C. et al., 2021). The genetic improvement of desirable traits in plants is important, especially to increase productivity, quality, and resistance to stresses. Previous studies on NAC genes have shown vital roles in plant growth, development, disease and stresses resistance. The recently published passion fruit genome (Ma et al., 2021) provides a great opportunity to explore the NAC family members in the passion fruit genome.
In the current study, a comprehensive genome-wide identification and analysis of the NAC family members were performed in passion fruit genome. Moreover, the physicochemical characteristics, phylogenetic relationship, gene structure, chromosomal location, conserved motifs, collinearity, and gene duplication of passion fruit NAC genes were analyzed in detail. The subcellular localization, protein–protein interaction, and cis-regulatory element analyses of the passion fruit NAC gene were speculated. In addition, the passion fruit NAC gene expressions in different tissues were analyzed using the existing passion fruit RNA-seq data. Furthermore, the qRT-PCR (real-time quantitative reverse transcription PCR) expressions of selected NAC genes in diverse passion fruit tissues under biotic (Fusarium kyushuense pathogenic fungal stress) and abiotic stress (drought stress) conditions were examined to better understand the functions of passion fruit NAC genes. The current study results laid a foundation for understanding the regulatory mechanism of the NAC genes, which will be useful for further functional studies of NAC genes and to promote the genetic improvement of passion fruit growth, development, and resistance to stresses.
In order to identify the NAC gene family members in the passion fruit genome, the Arabidopsis NAC proteins were downloaded from the TAIR database (the Arabidopsis Information Resource1; accessed on 14 April 2022), P. trichocarpa NAC proteins from PlantTFDB version 5.02 (accessed on 14 April 2022) (Tian et al., 2020), C. sativus NAC proteins from cucurbitgenomics database3 (accessed on 14 April 2022), Z. jujuba NAC from NCBI (National Center for Biotechnology Information4; accessed on 14 April 2022) and T. cacao (Belizian Criollo B97-61/B2) from the ensemble5 (accessed on 14 April 2022). The passion fruit proteins, CDS, genome and gff files were downloaded from the passion fruit genome6 (accessed on 14 April 2022) (Ma et al., 2021). In order to find possible members of the NAC family members in the passion fruit genome, we used two methods, by BLASTp (Basic Local Alignment Search Tool for proteins) and HMMER (Hidden Markov Models) search tool via TBtools software (version 1.09847357) (accessed on 14 April 2022) (Chen et al., 2020), with default mode.
The NAM (PF02365) domain HMM file was downloaded from Pfam8 (accessed on 14 April 2022) and was used for the identification of NAC genes in passion fruit genome via a simple HMM search package in TBtools software (Chen et al., 2020). Additionally, the outcomes of the two methods were merged and the presence of the NAM domain in each NAC gene was confirmed by different online tools including CDD9 (accessed on 14 April 2022), SMART10 (accessed on 14 April 2022), IinterProScan11 (accessed on 14 April 2022).
The physicochemical properties of PeNAC genes including molecular weight (MW), amino acids (aa), ORF length (bp), and isoelectric point (pI) were calculated by ExPASy12 (accessed on 24 April 2022) (Gasteiger et al., 2005). The PeNAC proteins subcellular localization were predicted by plant-mPLoc-213 (accessed on 24 April 2022) (Chou and Shen, 2010). The NAC protein sequences of P. edulis (PeNAC), P. trichocarpa (PNAC), and A. thaliana (AtNAC) were aligned by MEGA software (Molecular Evolutionary Genetics Analyses) version 10.1.814 (accessed on 14 April 2022) (Kumar et al., 2018), and an NJ (neighbor-joining) tree was constructed using 1,000 bootstrap and all other parameters were set to default. Finally, the phylogenetic tree was visualized using the online tool iTOL (Interactive Tree of Life)15 (accessed on 24 April 2022).
The PeNAC gene structures (exon-intron) were drawn by TBtools software (Chen et al., 2020). The PeNAC proteins conserved motifs were predicted by MEME web tool version 5.4.1 (Multiple Expectation Maximization for Motif Elicitation)16 (accessed on 24 April 2022) (Bailey et al., 2015) and the number of motifs was set to 10. The results of the PeNAC phylogenetic tree, exon-intron, gene structure, and conserved motifs were shown by TBtools software.
For the prediction of cis-regulatory elements in the PeNAC genes, the upstream promoter region (2,000 bp) of the PeNAC genes was extracted and predicted by Plant CARE17 (accessed on 24 April 2022). The cis-regulatory element figure was constructed by TBtools software. Furthermore, the numbers of cis-regulatory elements, sequences, and functions were concise and emphasized in phytohormones responsiveness, plant growth and development and stress-responsiveness categories.
Gene duplication including tandem or segmental or whole-genome duplication (WGD) provides better information about gene family development and evolution. Homologous PeNAC genes having only one intervening gene on the same passion fruit chromosome were considered tandem duplicated genes, whereas on the other chromosomes were segmental duplicated genes. The PeNAC gene Ka (non-synonymous)/Ks (synonymous) values, gene duplication, and synteny analysis were performed by TBtools software. The synteny relationships of NAC genes among P. edulis, A. thaliana, T. cacao, C. sativus, and Z. jujuba were performed and visualized using the MCScanX toolkit package of TBtools software. In addition, the multicollinearity analysis of NAC genes among the whole genomes of P. edulis, A. thaliana, T. cacao, C. sativus, and Z. jujuba whole was performed using the TBtools software package Multiple synteny Plot. The nucleotides substitution rate (Ka and Ks) and ratios (Ka/Ks) of duplicated PeNAC genes were calculated by TBtools software. The time of divergence (T, mya: million years ago) of PeNAC genes was measured using the following reference formula: T = Ks/2x (x = 6.38 10.9) (Ma et al., 2021).
The online STRING database18 (accessed on 24 April 2022) was used to predict and generate protein--protein interaction networks between PeNAC proteins based on known Arabidopsis homologs. The STRING parameters were adjusted as follows; network type was set to full STRING network; the meaning of network edges was set to evidence; the minimum required interaction score was set to medium confidence parameter (0.4) and max number of interaction display was not exceed 10 interactors. Furthermore, the 3D (three-dimensionally) models of all 105 PeNAC proteins were predicted by the online Phyre2 tool with a 100% confidence level19 (Kelley et al., 2015).
The prediction of putative miRNA sites in the PeNAC gene was achieved by downloading the published passion fruit mature miRNAs (Paul et al., 2020), and then PeNAC genes CDS sequences were submitted to the online psRNATarget Server1820 (accessed on 24 April 2022) with default parameters. A network interaction among the PeNAC target genes and putative predicted miRNAs was constructed and displayed by Cytoscape version 3.9121 (accessed on 24 April 2022). In addition, PeNAC genes were subjected to GO (Gene Ontology) and KEGG (Kyoto Encyclopedia of Genes and Genomes) annotation analysis by submitting PeNAC protein sequences to eggNOG-MAPPER22 (accessed 24 April 2022) database and the enrichment analysis were performed by TBtools software.
The PeNAC genes TF prediction and regulatory network analysis were performed as described by Rizwan et al. (2022). The online tool Plant Transcriptional Regulatory Map (PTRM)23 (Tian et al., 2020) was used for the prediction of TFs in the upstream (1000-bp) regions of PeNAC genes with p ≤ 1e--5. The predicted TFs were visualized into a network using the Cytoscape software version 3.924 (Kohl et al., 2011).
The expression analysis of PeNAC genes was performed in different tissues of passion fruit under different conditions using the available transcriptional expression data as described by Rizwan et al. (2022). The sample details were as follows: the peel tissue samples of both cultivars including yellow (P. edulis. Flavicarpa cv Huangjin) and purple (P. edulis. Sims cv Tainong) were from the ripening stage; pulp samples were from fruitlet, green, version, and ripening stages of fruit development. Root tissue samples were from cold-tolerant (Pingtan-1, purple passion fruit) in two cultivation areas including limestone (L) and sandy dolomite (D) rocky desertification. Leaf samples were from cold-sensitive [yellow Huangjinguo (HJG)] and cold tolerant (purple Tainong-1) cultivars under chilling stress (CS) and normal temperature (NT) conditions. Since the FPKM (transcript reads per million mapped reads) expression values vary widely between different passion fruit tissues, the FPKM expression values were converted to log2FC (FC-fold change) and heatmaps were generated using TBtools software.
To study the expression profiles of passion fruit NAC genes under biotic and abiotic stress, the material was subjected to abiotic stress (drought stress) and biotic stress (Fusarium kyushuense pathogenic fungus) conditions. For fungal infection sample preparation, fruits of yellow (P. edulis. Flavicarpa cv Huangjin) and purple (P. edulis. Sims cv Tainong) passion fruit cultivars were obtained from a commercial orchard situated in Fujian province (23°48035.200 N and 117°7008.100 E) China. The fruit surface disinfection and inoculation with F. kyushuense were performed following Rizwan et al. (2021) protocol. The peels from the infected areas were collected after 9 and 12 days of inoculation, whereas the non-treated fruits were used as controls. For sample preparation under drought stress conditions, seeds of both cultivars were grown in plastic pots containing peat moss and soil (2:1 ratio) in a greenhouse at 25 ± 2°C, light/dark (16/8-h), and 75–80% RH (relative humidity). After 1 month, the passion fruit seedlings were exposed to dehydration for 10 days and then rewatered. Root, stem, and leaves samples were collected into three biological replicates and frozen into liquid nitrogen, and stored at −80°C for subsequent uses. Control samples were from normally watered plants.
Total RNA was isolated from the collected samples with the help of the Tiangen mini-RNA extraction kit (Tiangen, China) following the instructions of the manufacturer. The quality and concentration of the RNA samples were assessed by Thermo Scientific NanoDrop 2000 UV-Vis Spectrophotometer (Thermo Scientific, United States). One μg of total RNA was used for cDNA (complementary DNA) synthesis using Takara PrimeScript™ RT Kit with gDNA eraser (TAKARA, China), and was diluted to 5× with deionized distilled water. Gene-specific primers were designed using the primer3plus online tool25 (accessed 24 April 2022) (Supplementary Table 1). The LightCycler® 96 (Roche Applied Science, Penzberg, Germany) was used to perform qRT-PCR (quantitative real-time polymerase chain reaction) in a 20 μL reaction mixture, containing 10 μL of TB Green premixed enzyme solution (TAKARA, China), 1.0 μL each of the forward and reverse primers (100 μM), 1 μL cDNA, and 7 μL ddH2O.
The PeNAC genes were selected for qRT-PCR expression analysis based on their cis-acting elements and homologous sequences to NAC members that have been characterized in Arabidopsis and rice in response to biotic and drought stresses. Passion fruit genes encoding Pe60S, PeTIF (transcription initiation factor), and histone were used as reference genes for internal controls (Munhoz et al., 2015). The qRT-PCR reaction was performed under the following conditions including preincubation at 95°C for 30 s, 45 cycles at 95°C for 10 s, and 60°C for 30 s. In each reaction, three biological replicates were used and the relative gene expressions were normalized with the Pe60S gene and calculated using the 2–ΔΔCT method (Schmittgen and Livak, 2008).
One-way analysis of variance (ANOVA) was used to perform the statistical analysis between treated and controlled samples using the student’s t-test and was considered statistically significant if p < 0.05. The figures were constructed by GraphPad Prism version 9.026 (accessed 28 April 2022).
The NAC genes in the passion fruit genome were identified by two methods and their conserved domain (NAM) was further confirmed by CDD, SMART, and IinterProScan tools. After combining the results of the two methods and removing the redundant, repetitive, and unrecognized sequences, 105 PeNAC genes were identified in the passion fruit genome and named (PeNAC1 to PeNAC105) according to their genomic location on the chromosomes (Table 1). All the PeNAC proteins contained the NAM domain. The physicochemical properties of PeNAC genes varied, for example, the encoded proteins range from 120 to 3052 amino acids with an average length of 480 (Table 1). PeNAC065 was the shortest protein-encoding 120 amino acids, while PeNAC019 was the largest protein-encoding 3052 amino acids (Table 1). Correspondingly, the PeNAC ORFs ranged from 363 bp (PeNAC065) to 9159 bp (PeNAC019) (Table 1). The predicted molecular weight of the PeNAC proteins ranges from 13.82 kDa (PeNAC044) to 347.13 kDa (PeNAC019) (Table 1). The predicted isoelectric points (pI) of PeNAC proteins ranged from 4.59 (PeNAC077) to 9.88 (PeNAC044), respectively (Table 1). In addition, the results of protein subcellular localization prediction showed that, except for PeNAC086 located in the chloroplast, 104 of the 105 PeNAC proteins were localized in the nucleus (Table 1).
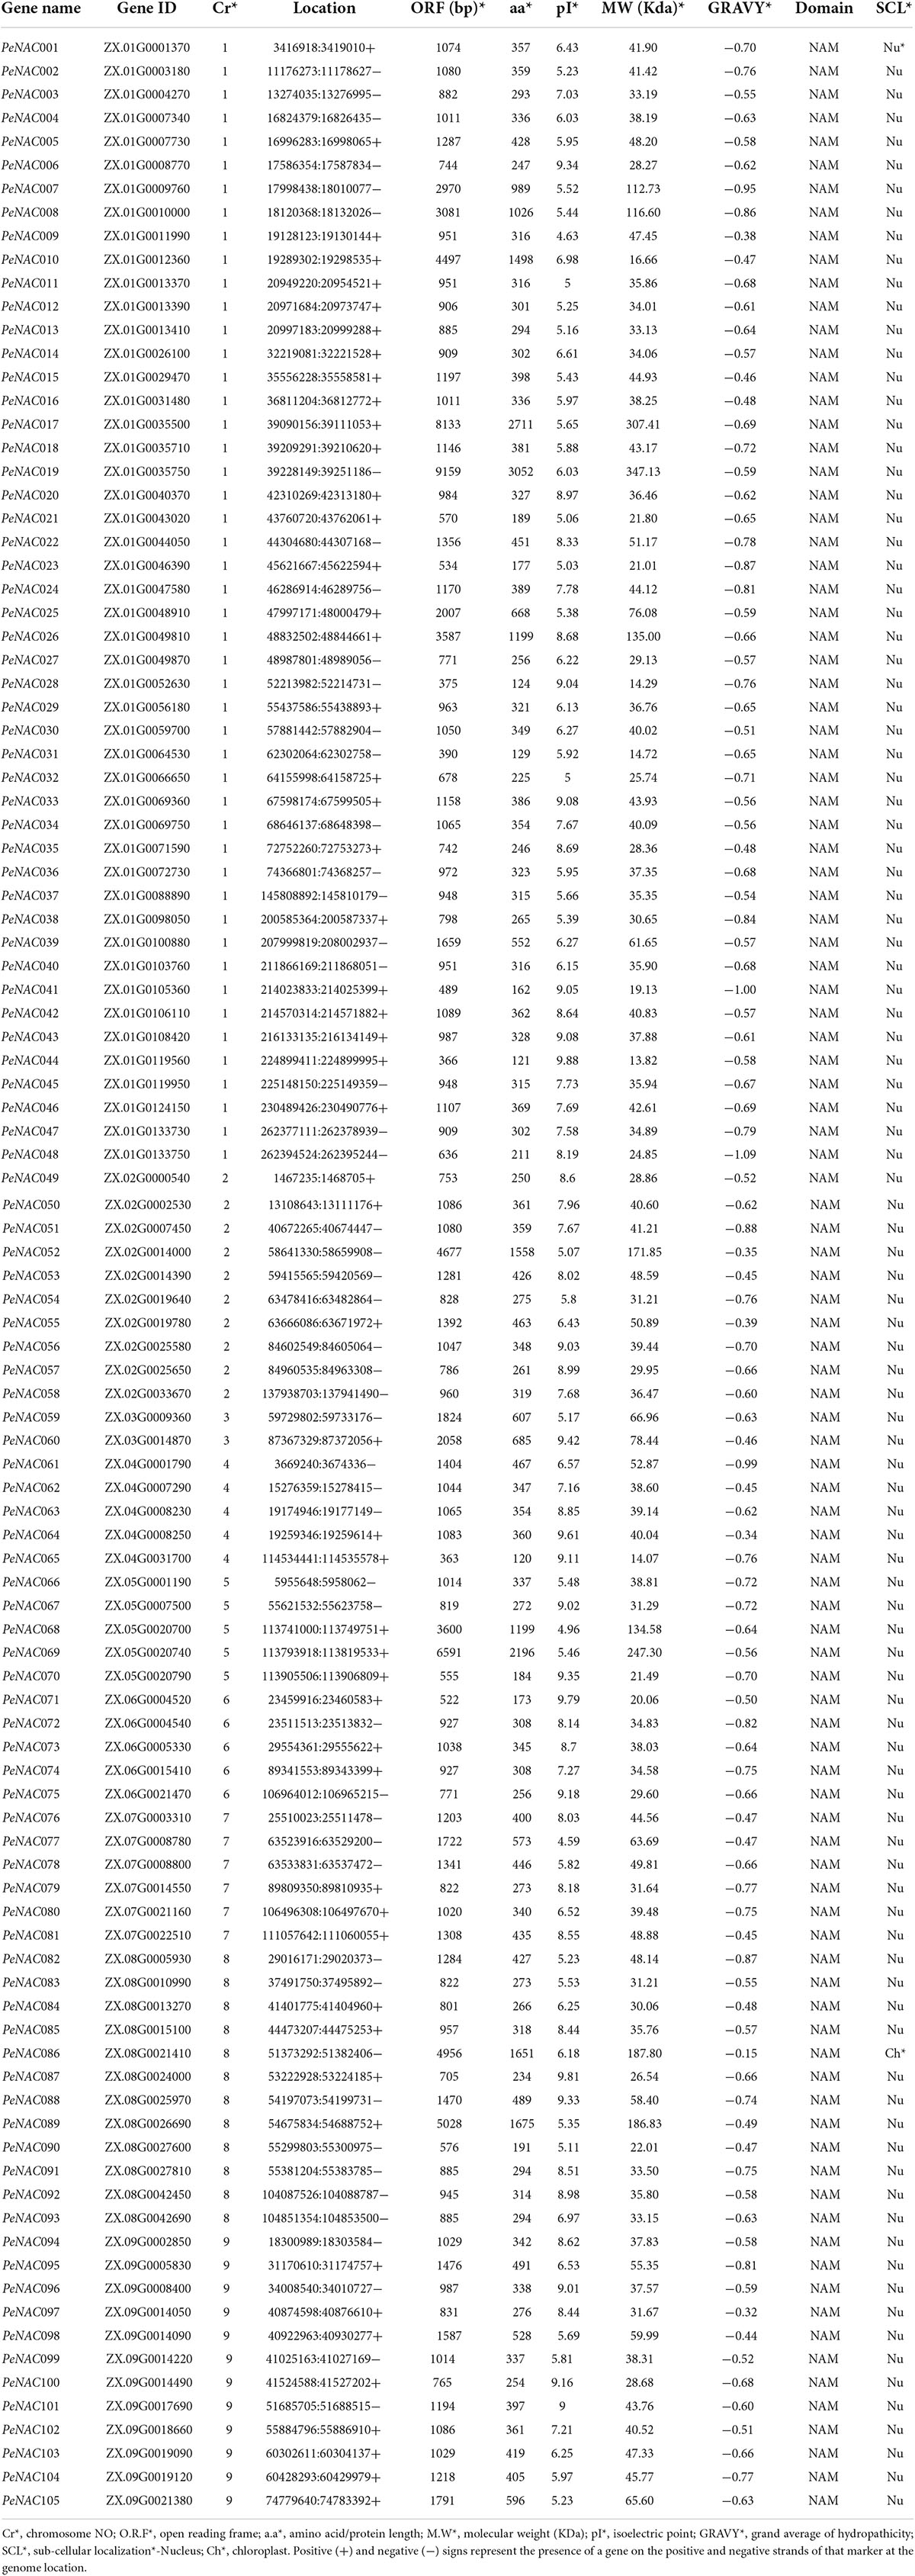
Table 1. Physicochemical properties of PeNAC genes.
To access the evolutionary relationship between the NAC genes, a neighbor-joining (NJ) phylogenetic tree was generated by MEGA software using the NAC protein sequences of passion fruit (PeNAC), Arabidopsis (AtNAC), and P. trichocarpa (PNAC) (the protein sequences of all NACs used in the phylogenetic tree have been provided in Supplementary Table 2). The phylogenetic tree was divided into fifteen groups and named as NAC-a to NAC-o according to the previous publication on P. trichocarpa PNACs (Hu et al., 2010; Figure 1). The results showed that PeNAC genes were as diverse as NAC proteins, and PeNAC genes were found to be unevenly distributed across all groups. All groups contained PeNAC members except the NAC-m group, which only consisted of AtNAC and PNAC members (Figure 1). The NAC-a group had a maximum of 16 PeNAC members, followed by NAC-b with 14 PeNAC members, and NAC-n was the smallest group with only one PeNAC member. Notably, the PeNAC members aligned with AtNAC and PNAC genes in one group, showing their similarity to Populus and Arabidopsis NAC genes and may exhibit the same function, From the phylogenetic tree analysis, the NAC-m group contained only AtNAC and PNAC members but no PeNAC gene, whereas, NAC-n group contained only PeNAC and PNAC members but no AtNAC gene, indicating that some genes have undergone evolutionary changes, and these NAC genes may develop in passion fruit or lost in P. trichocarpa and Arabidopsis during evolution (Figure 1). The NAC genes play a key role in a variety of biological and functional studies, so phylogenetic analysis provides a better understanding of NAC genes. Taken together, genes in one group with co-adaptive associations and relationships might have the same functions and require further function studies.
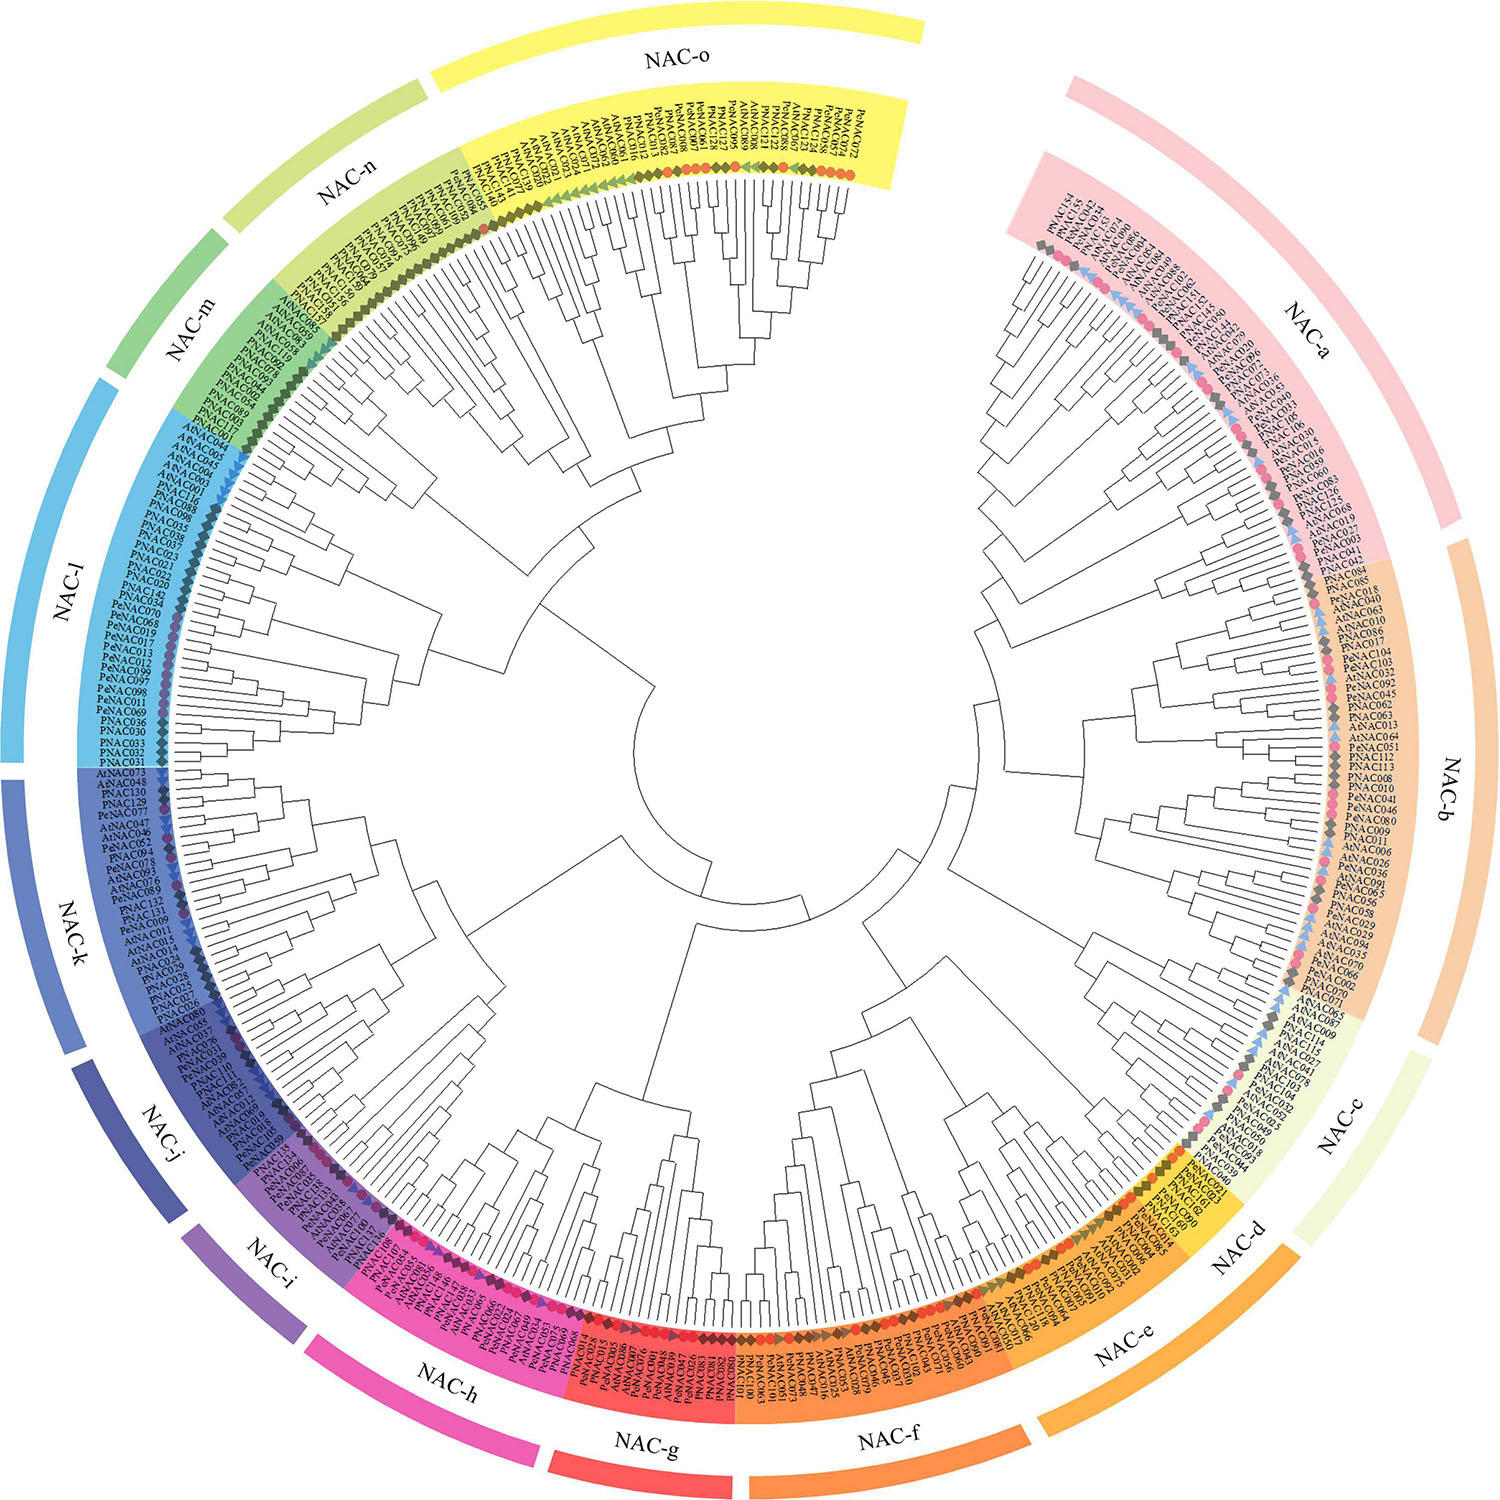
Figure 1. An unrooted neighbor-joining (NJ) phylogenetic tree based on NAC protein sequence alignment between A. thaliana (AtNAC), P. edulis (PeNAC), and P. trichocarpa (PNAC) with 1000 bootstraps. All the NAC members were divided into 15 groups and presented in different colors. The blue triangle represents AtNAC sequences, the red circle represents PeNAC sequences and the gray square represents PNAC sequences.
To investigate the relationship between all 105 PeNAC genes, a phylogenetic tree was constructed by the NJ method and divided into 9 subclades (G1 to G9) (Figure 2). The results showed that G6 was the major group with 20 PeNAC members, and G3 was the smallest group with only 4 PeNAC members (Figure 2A). The PeNAC genes conserved motifs and gene structures (exon-intron) were further investigated. Moreover, 10 conserved motifs were recognized among all 105 PeNAC proteins by MEME online tool (Supplementary Table 3 and Figure 2B). Motif prediction results revealed that the highly conserved PeNAC members may have similar motif information and that the N-terminal motif contains A-E subdomains that confer DNA-binding activity (Figure 2B).
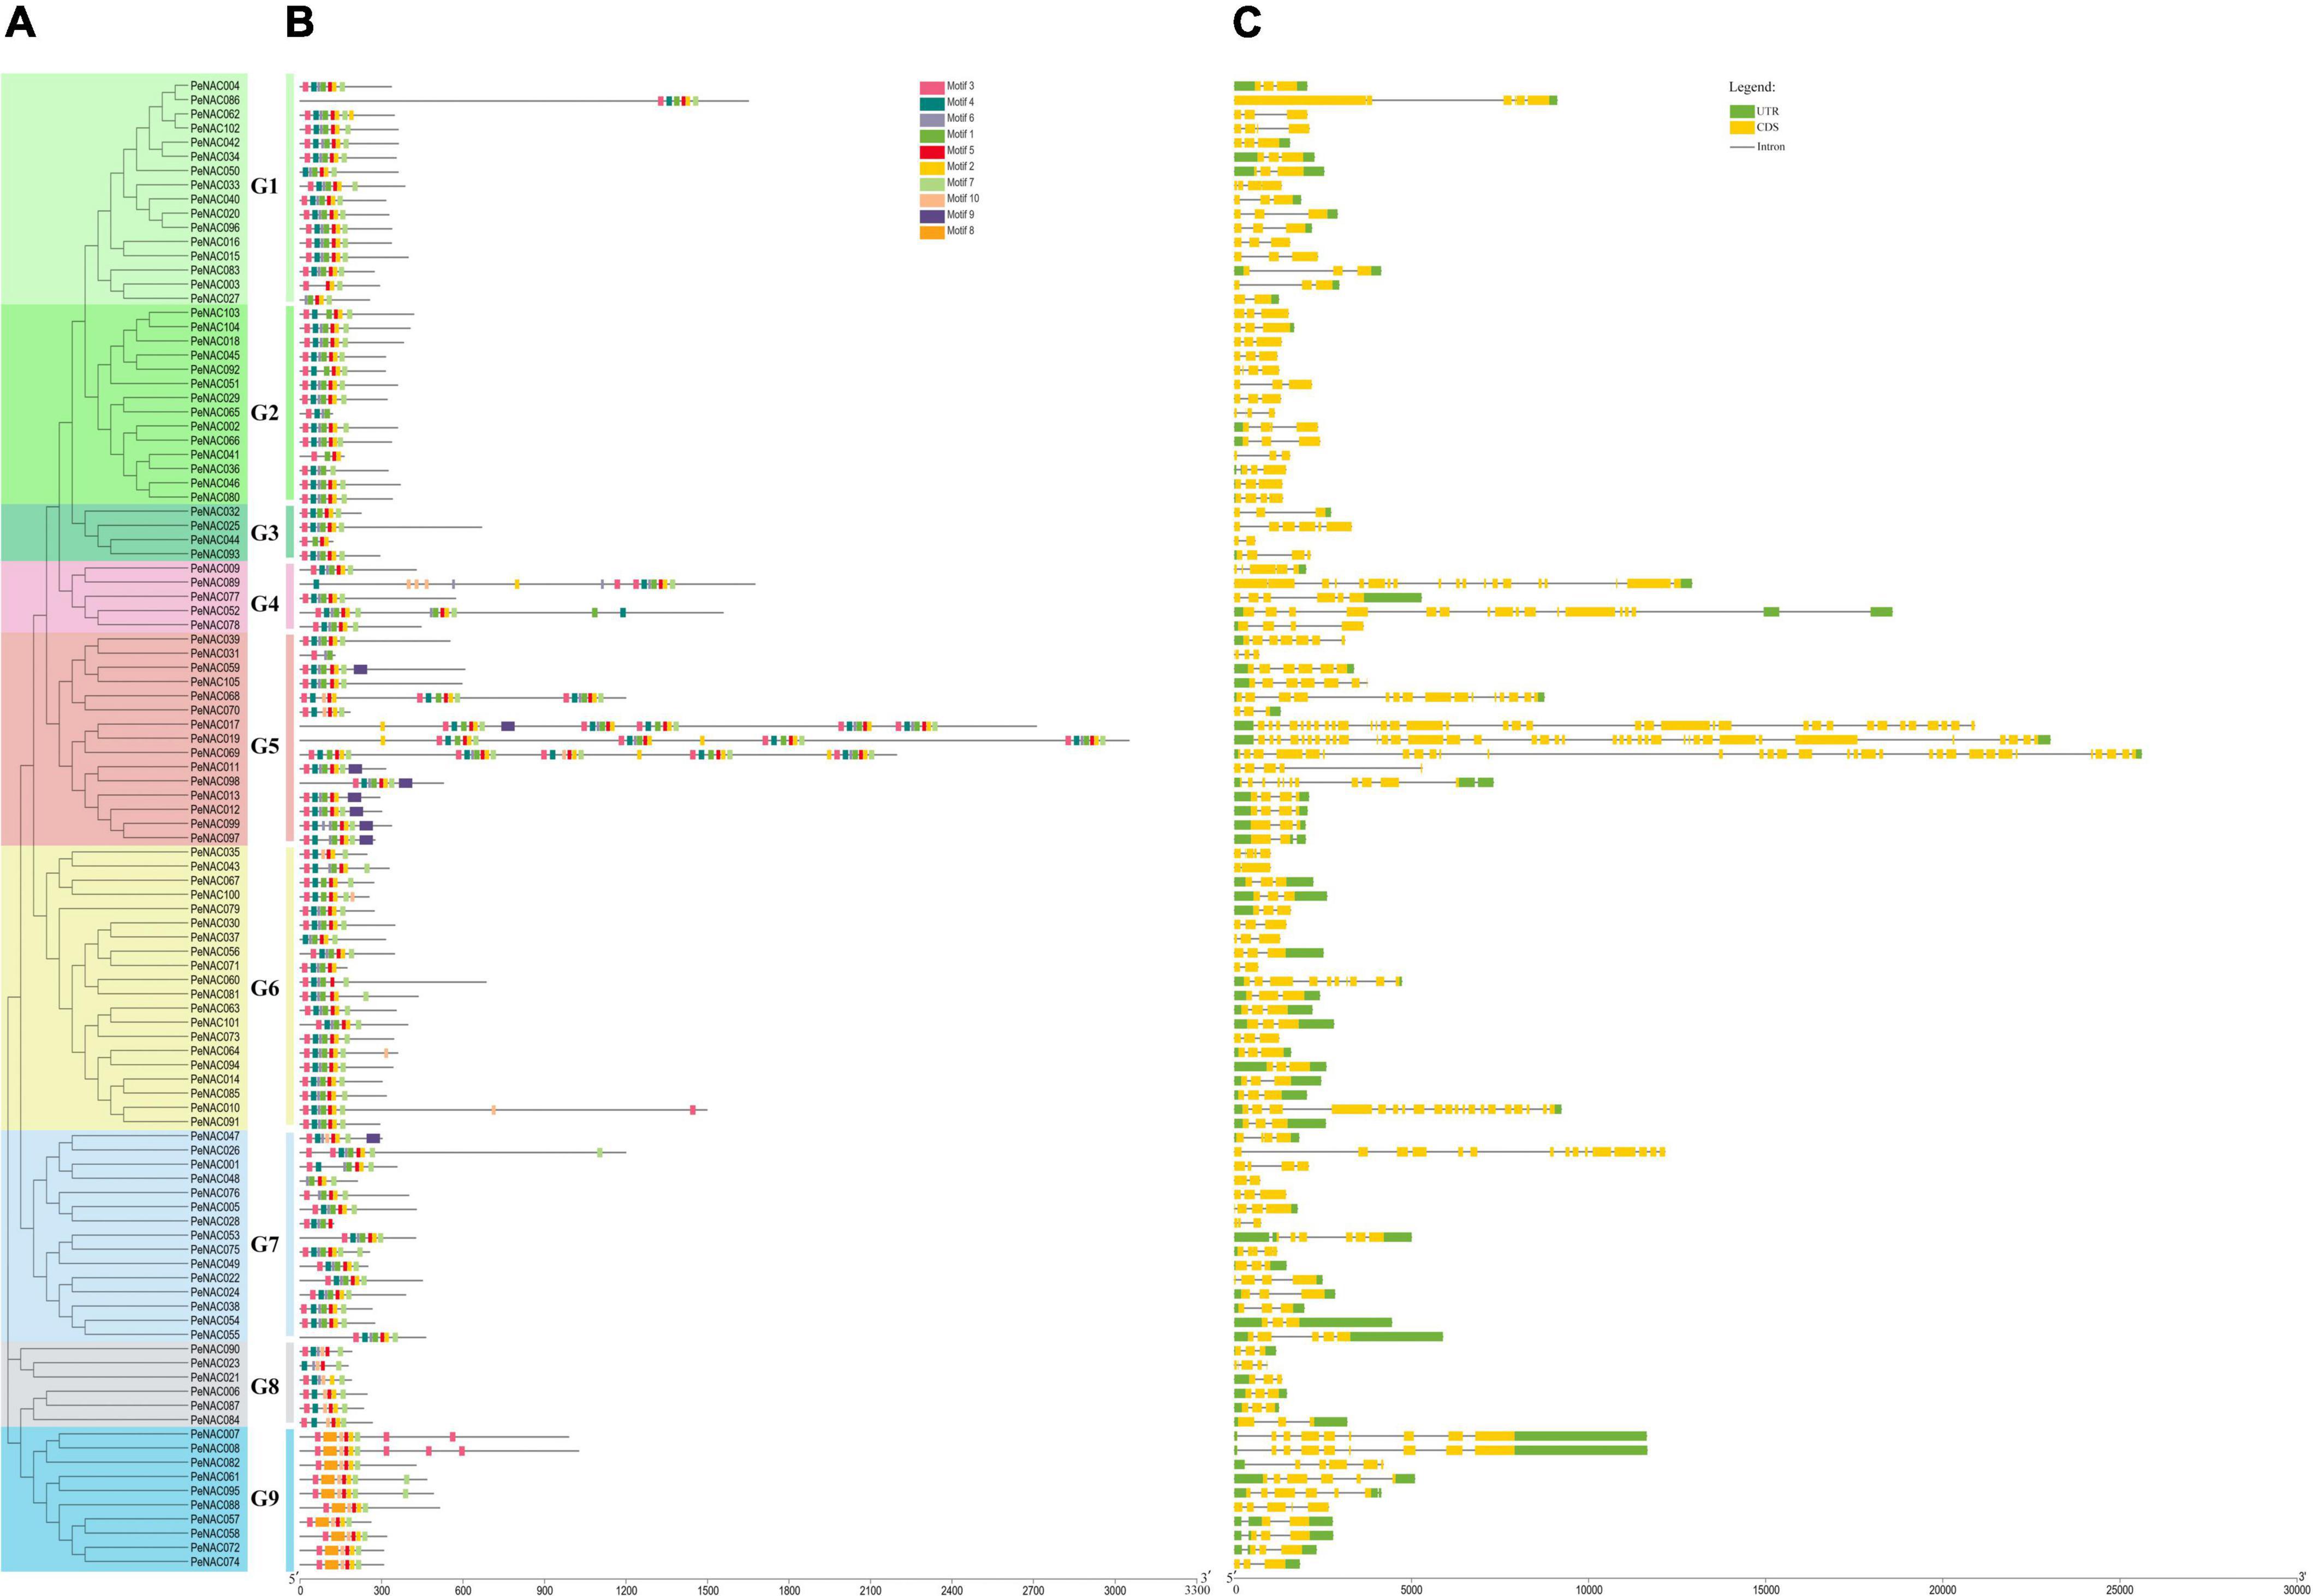
Figure 2. The unrooted phylogenetic tree, conserved motifs, and gene structure of PeNAC genes. (A) The neighbor-joining tree on the left comprised 105 PeNAC proteins, different colors represented different groups. (B) Conserved motifs were represented via boxes and different colors represent different motifs. (C) PeNAC genes structures, yellow color indicates the exons, the green color shows the untranslated 5′ and 3′-regions, and gray color indicates the introns.
The motif results revealed that there were at least 3 to 8 conserved motifs in all the 105 PeNAC proteins, of which the most prominent motifs were Motifs 1, 2, 3, 4, 5, 6, and 7. Among all 105 PeNAC proteins, the proteins including PeNAC011, PeNAC012, PeNAC013, PeNAC059 PeNAC097, PeNAC098, and PeNAC099 contained a maximum of 8 motifs, followed by PeNAC003, PeNAC04, and PeNAC044 proteins contained 4 motifs, whereas the PeNAC031 protein contained at least 3 motifs (Figure 2B). Among the groups, the G1, G2, G3, G4, G6, and G7 groups were most consistent with nearly similar motifs (Motifs 1–7), while the G5, G8, and G9 groups were different from other groups containing Motif 8 (G5), Motif 9 (G9), and Motif 10 (G8 and G9) respectively (Figures 2A,B). The conserved motif results are consistent with the phylogenetic relationship, as members with similar conserved motifs are grouped in the same phylogenetic clade and might have similar functions (Figures 2A,B).
Furthermore, the gene structure results showed that the number of introns found in the PeNAC gene varied from 1 and 38 (Figure 2C). The phylogenetic results (Figure 2A) showed that the genes within the same clade had a similar number of intron-exon. For example, in the G1–G2 (30 genes) and G6 (20 genes) groups, most PeNAC members have 3 exons (Figure 3C). In groups G7-G8, there were 2–8 exons, while in the G5 group, the number of exons varied from 3 to 31. Briefly, the coding regions were diverse, ranging from 2 to 39 in the PeNAC, with an average of 2 introns per gene (Figure 2C). The maximum number of 38, 35, and 31introns were found in PeNAC019, PeNAC017, and PeNAC069 genes. The PeNAC027, PeNAC043, PeNAC044, PeNAC048, and PeNAC071 genes have only one intron (Figure 2C). The results from gene structure analysis provide consistent validation to confirm our phylogenetic classification among PeNAC genes (Figure 2). Taken together, the results of phylogenetic relationship, group classification, conserved motif, and gene structure analyses suggested that the proteins of PeNAC genes were highly conserved and genes within the same group might perform similar functions, but it requires further investigations.
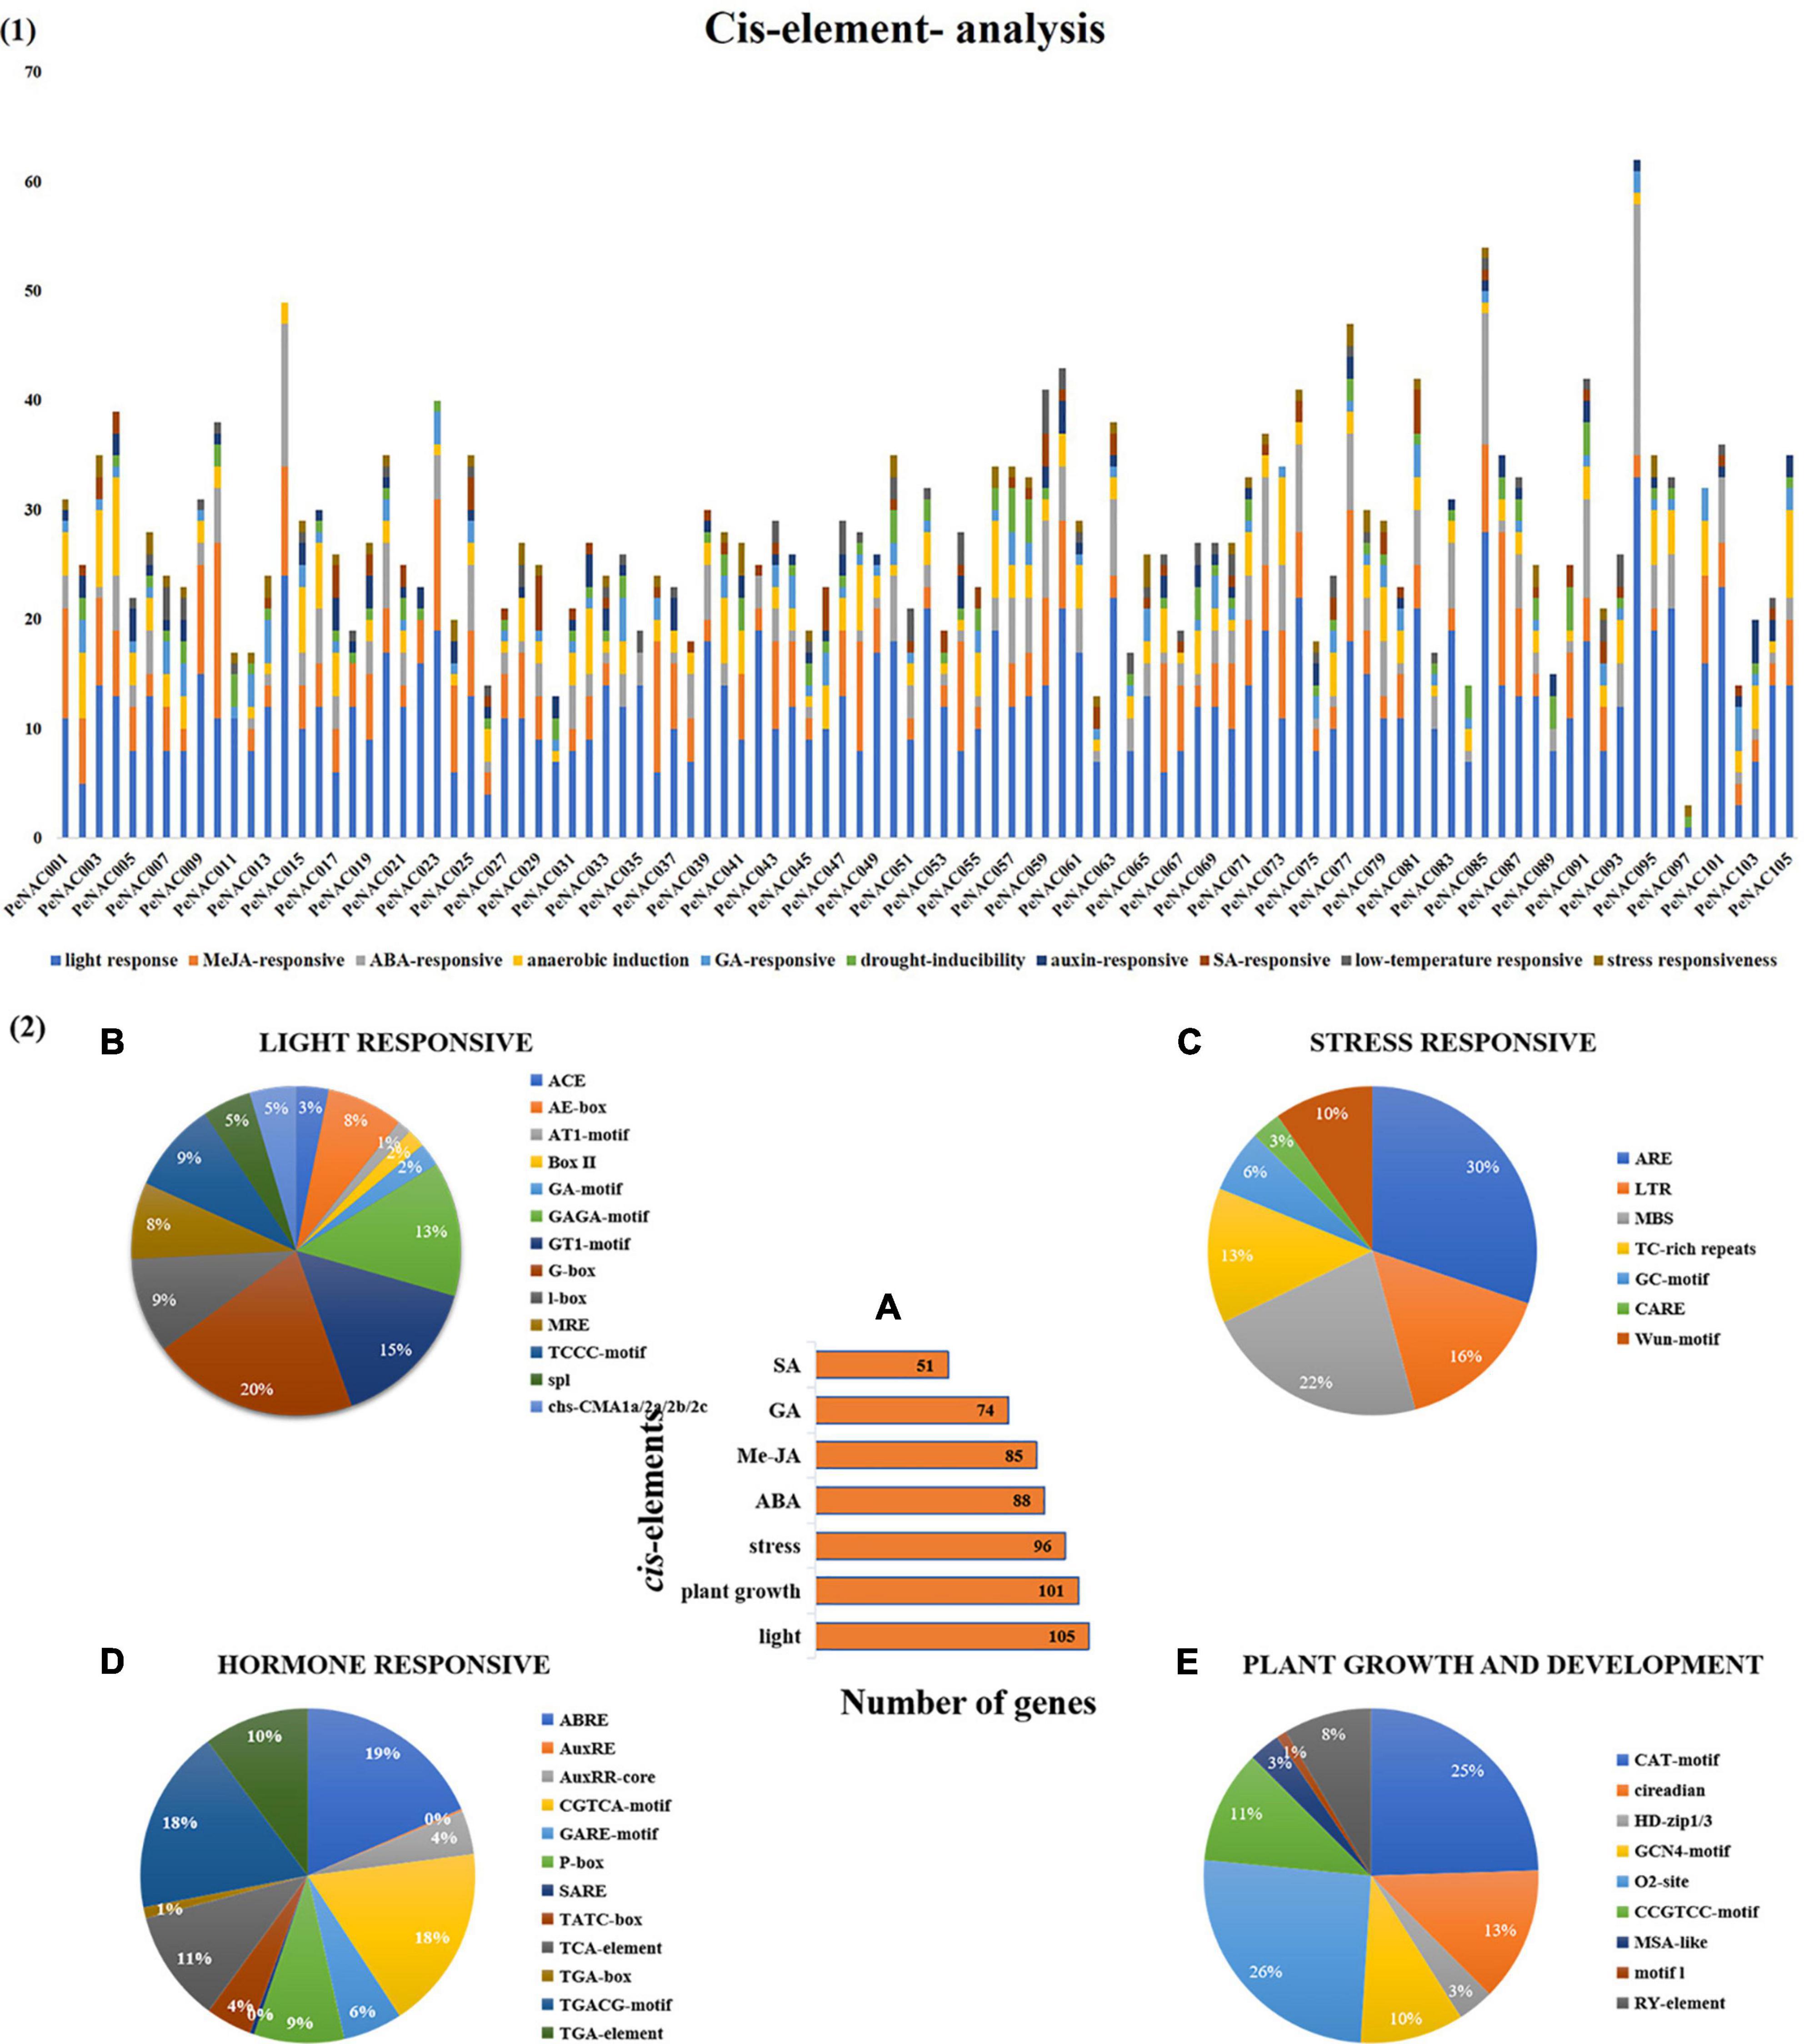
Figure 3. The cis-regulatory element analysis of PeNAC genes (A). (A) The sum number of PeNAC genes involved in four categories of cis-elements and the percentage (%) ratio of the numerous cis-elements from each category is presented in pie charts; (B) light-responsive; (C) stress-responsive; (D) hormone-responsive and (E) plant growth and development. Different colors indicate different cis-elements and their ratios present in PeNAC genes.
The cis-regulatory element analysis of the PeNAC genes was performed to further understand the possible roles of PeNAC genes in response to plant growth and development, phytohormone, and light and stress responsiveness (Figure 3). Furthermore, the cis-regulatory element main categories were divided into 10 sub-categories of cis-elements and presented in Figure 3.1. A total of 2,862 cis-elements belonging to different categories were identified in 105 PeNAC genes. The highest cis-elements 45% (1,297/2,862) were found in light-responsive category followed by MeJA-responsive 15% (436/2862), ABA-responsive 11% (318/2862), anaerobic induction 10% (275/2,862), drought-responsive 4% (107/2,862), GA-responsive 4% (123/2862), low-temperature responsive 3% (72/2,862), SA-responsive 3% (80/2862), auxin-responsive 3% (97/2862), and minimum cis-elements were found in stress-responsive (drought, wound and pathogen, biotic and abiotic stresses, etc.) 2% (57/2,862) category (Figure 3.1).
The light-responsive cis-elements include ACE, AE-box, AT1-motif, Box II, GA-motif, GAGA-motif, GTI-motif, G-box, I-box, MRE, TCCC-motif, spI, and cbs-CMA1a/2a/2b/2c (Figure 3.2B). G-box covered the maximum (20%) and ATI-motif (1%) minimum light-responsive cis-elements (Figure 3.2B). The stress-related cis-element include ARE, LTR, MBS, TC-rich repeats, GC-motif, CARE, and wun-motif. ARE cis-elements covering a maximum of 30% and CARE minimum of 3% stress-responsive category, respectively (Figure 3.2C). Hormone responsive categories include ABRE (abscisic acid-responsive), AuxRE and AuxRR-core (auxin response element), CGTCA-motif, GARE-motif, P-box, TCA-element, and SARE (salicylic acid-responsive elements), TATC-box (gibberellin responsive) (salicylic acid-responsive), TGA-box, TGA element and TGACG-motif (MeJA responsive). The largest hormone-responsive elements included ABRE (19%), TGACG-motif (18%), and the smallest 1% of TGA-box (Figure 3.2D). Plant growth and development-related cis-element include CAT-motif, circadian, HD-zip1/3, GCN4-motif, O2-sit, CCGTCC-motif, MSA-like, motifI and RY-element. This category has a maximum of 26% O2-sit and a minimum 1% motif-1 cis-elements (Figure 3.2E).
In addition, PeNAC genes were classified according to the number of genes involved in each category and it was found that 105 PeNAC genes were involved in light-responsive, 101 genes in metabolic (plant growth and development), and 96 genes in stress-responsive (drought, wound, biotic/abiotic stresses, etc.) cis-elements. PeNAC genes were also associated with different hormone response classes, including 88 genes in ABA, 85 genes in MeJA, 74 genes in GA, and 51 genes in SA response cis-elements (Figure 3.2A). In conclusion, the responses of different PeNAC genes to different cis-regulatory elements indicated that the transcription profiles of PeNAC genes differed in different cis-elements and further functional studies are needed (The details information on cis-elements in PeNAC genes has been provided in Supplementary Table 4).
The chromosomal locations of PeNAC genes were studied based on passion fruit genome DNA sequence annotations. The results discovered that the 105 PeNAC genes were unequally distributed on all nine passion fruit chromosomes (Figure 4A). The maximum number of PeNAC genes were appeared to be on chromosome number one (48 genes) followed by chromosomes numbers eight and nine (12 genes); chromosome number two (10 genes); chromosome number seven (6 genes); and chromosomes four to six (every 5 genes). Chromosome number two contained the least only two PeNAC genes (Figure 4B). Gene duplications including tandem and/or segmental greatly contribute to the diversity and evolutionary history of gene families and play an important role in understanding the adaptive evolution of species. The gene duplication results revealed that, out of 105 PeNAC genes, there were 23 PeNAC orthologous gene pairs (Figure 5A). Among the 23 PeNAC orthologous gene pairs, 11 gene pairs were located on chromosomes number one as tandem duplicated, while 12 gene pairs were located on different chromosomes as segmental duplicated. Only one duplication gene pair was found on chromosomes two, four, five, and six, whereas no gene pair was found on chromosomes three and seven (Figure 5A). These results suggest that segmental and tandem duplication happened during the PeNAC genes evolution.
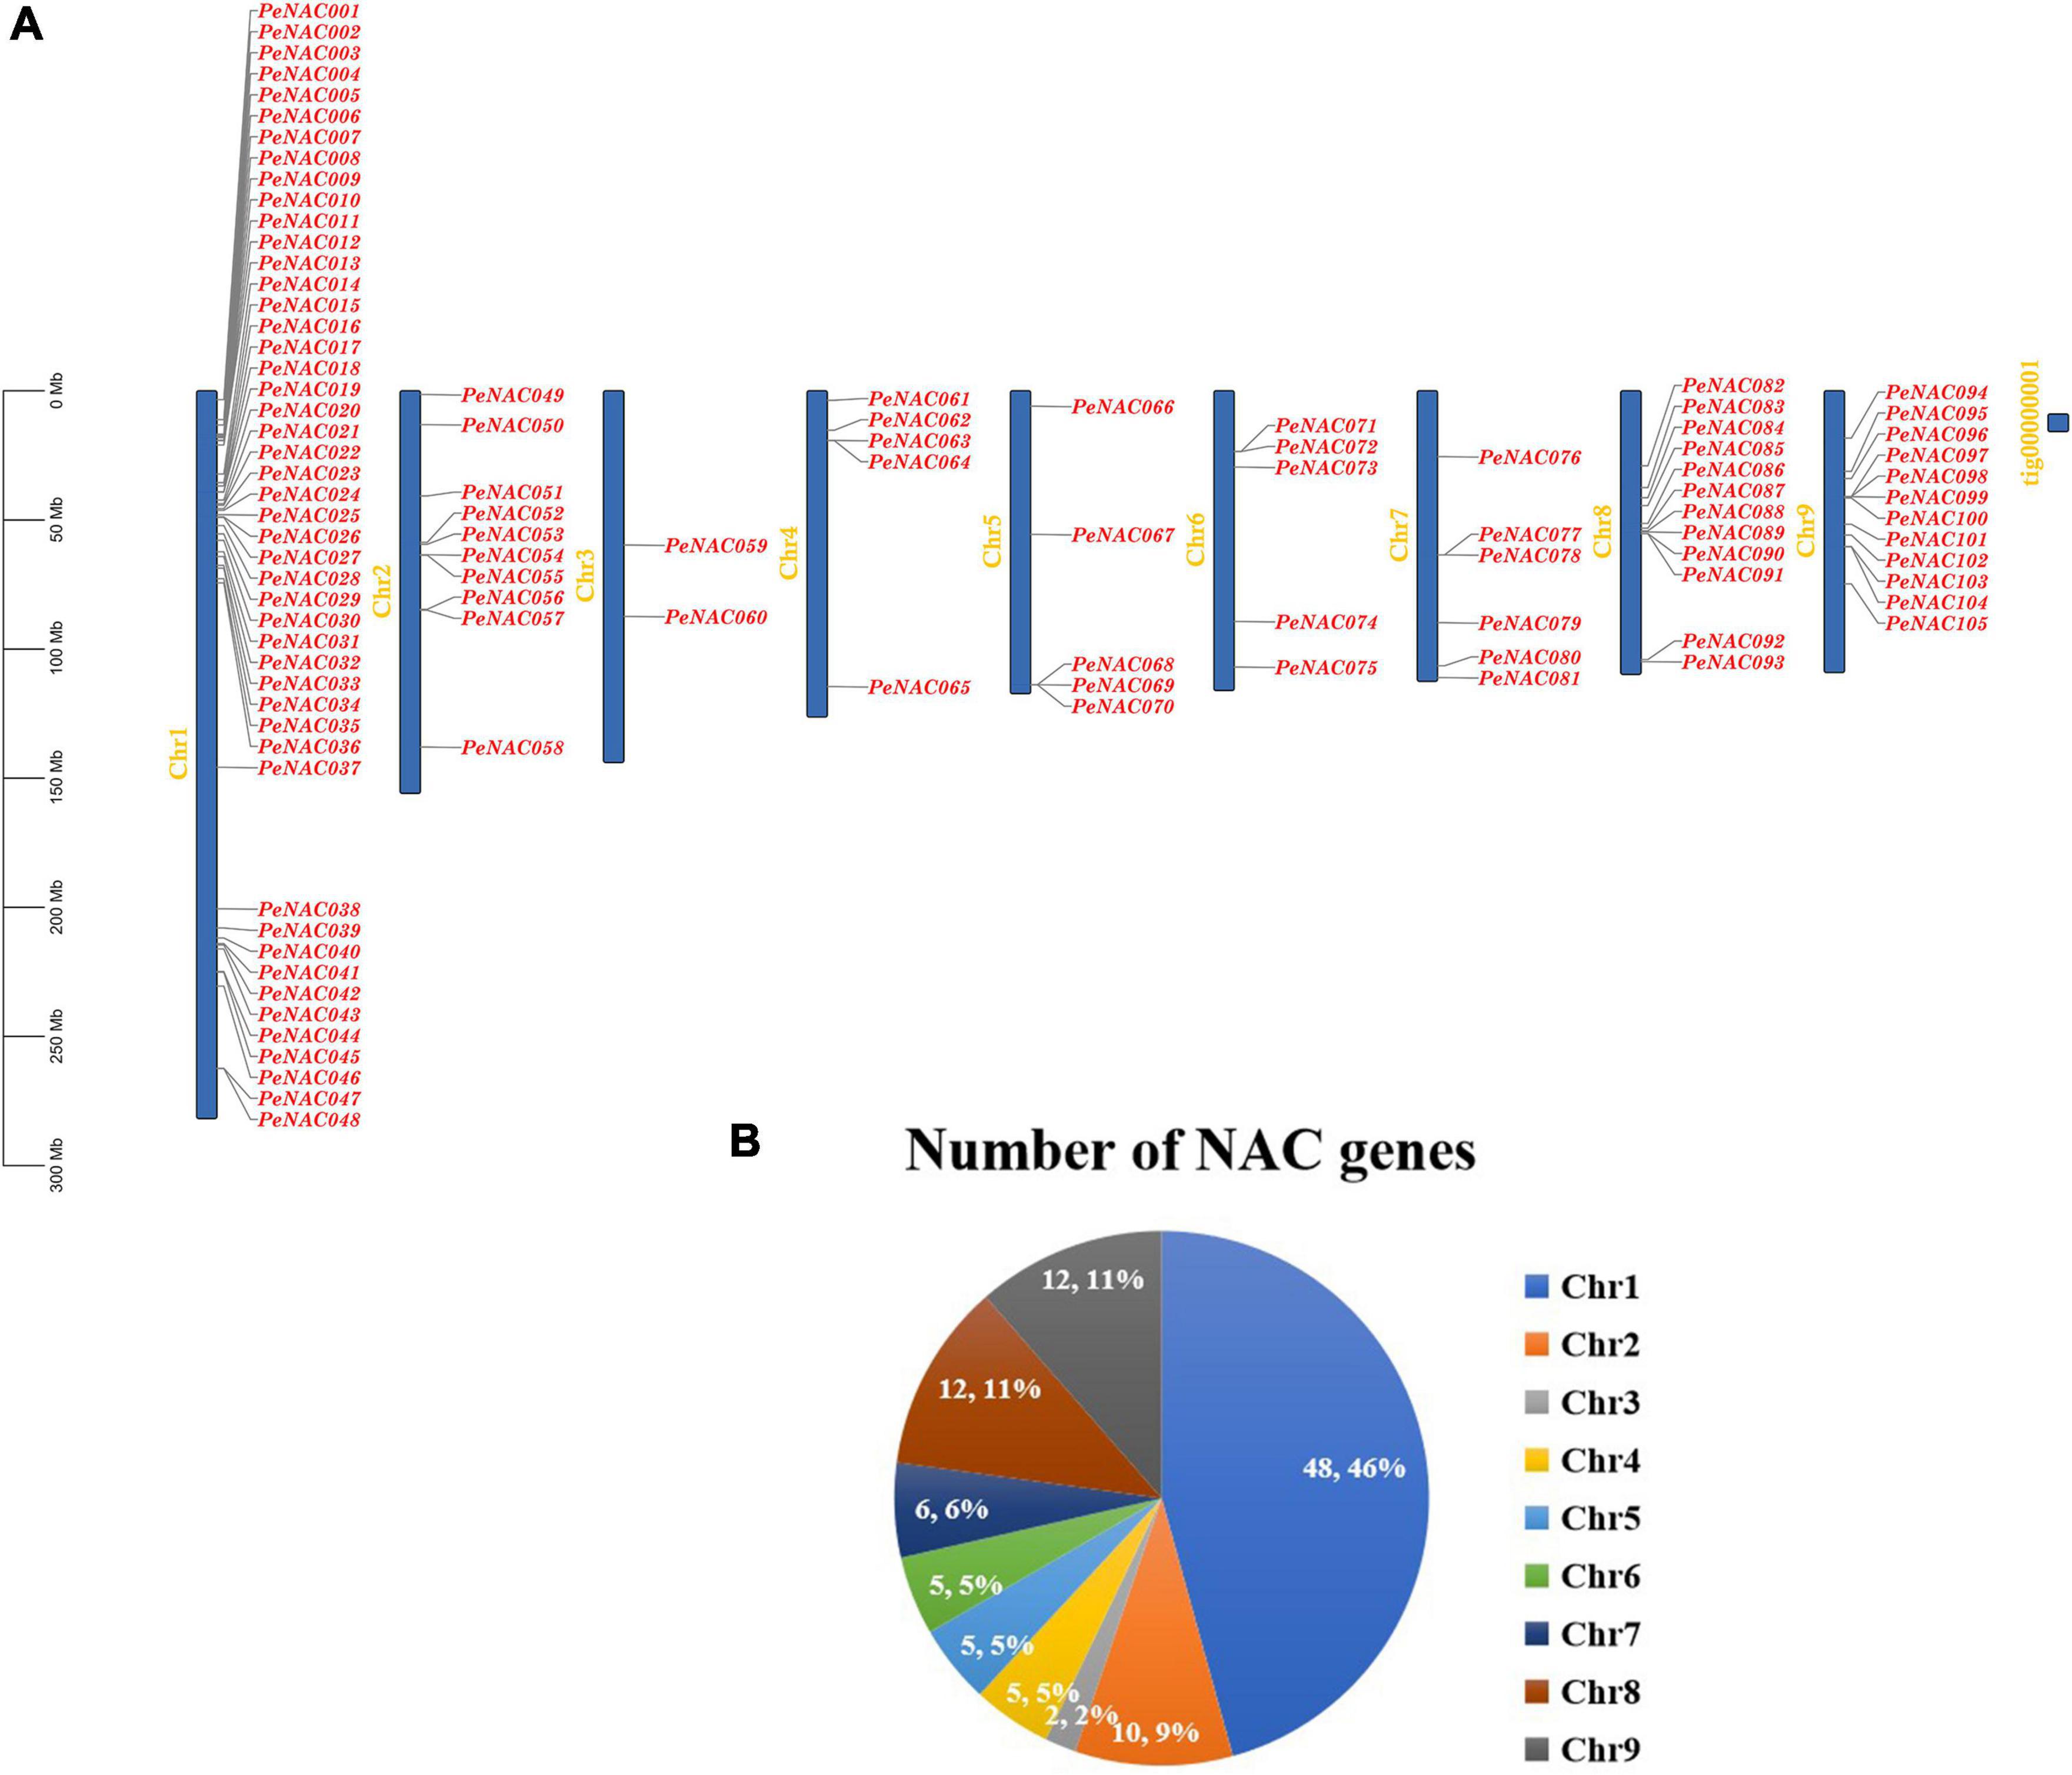
Figure 4. Genomic location of PeNAC genes on passion fruit chromosomes. (A) Chromosomal location of PeNAC genes, the scale represents the 300MB chromosomal distance, and the PeNAC genes are represented in red color. (B) The sum number of PeNAC genes appeared on nine passion fruit chromosomes and the percentage (%) ratio of PeNAC genes from each chromosome is presented in pie charts; different colors indicate a different number of PeNAC genes and their ratio present in the chromosome of passion fruit.
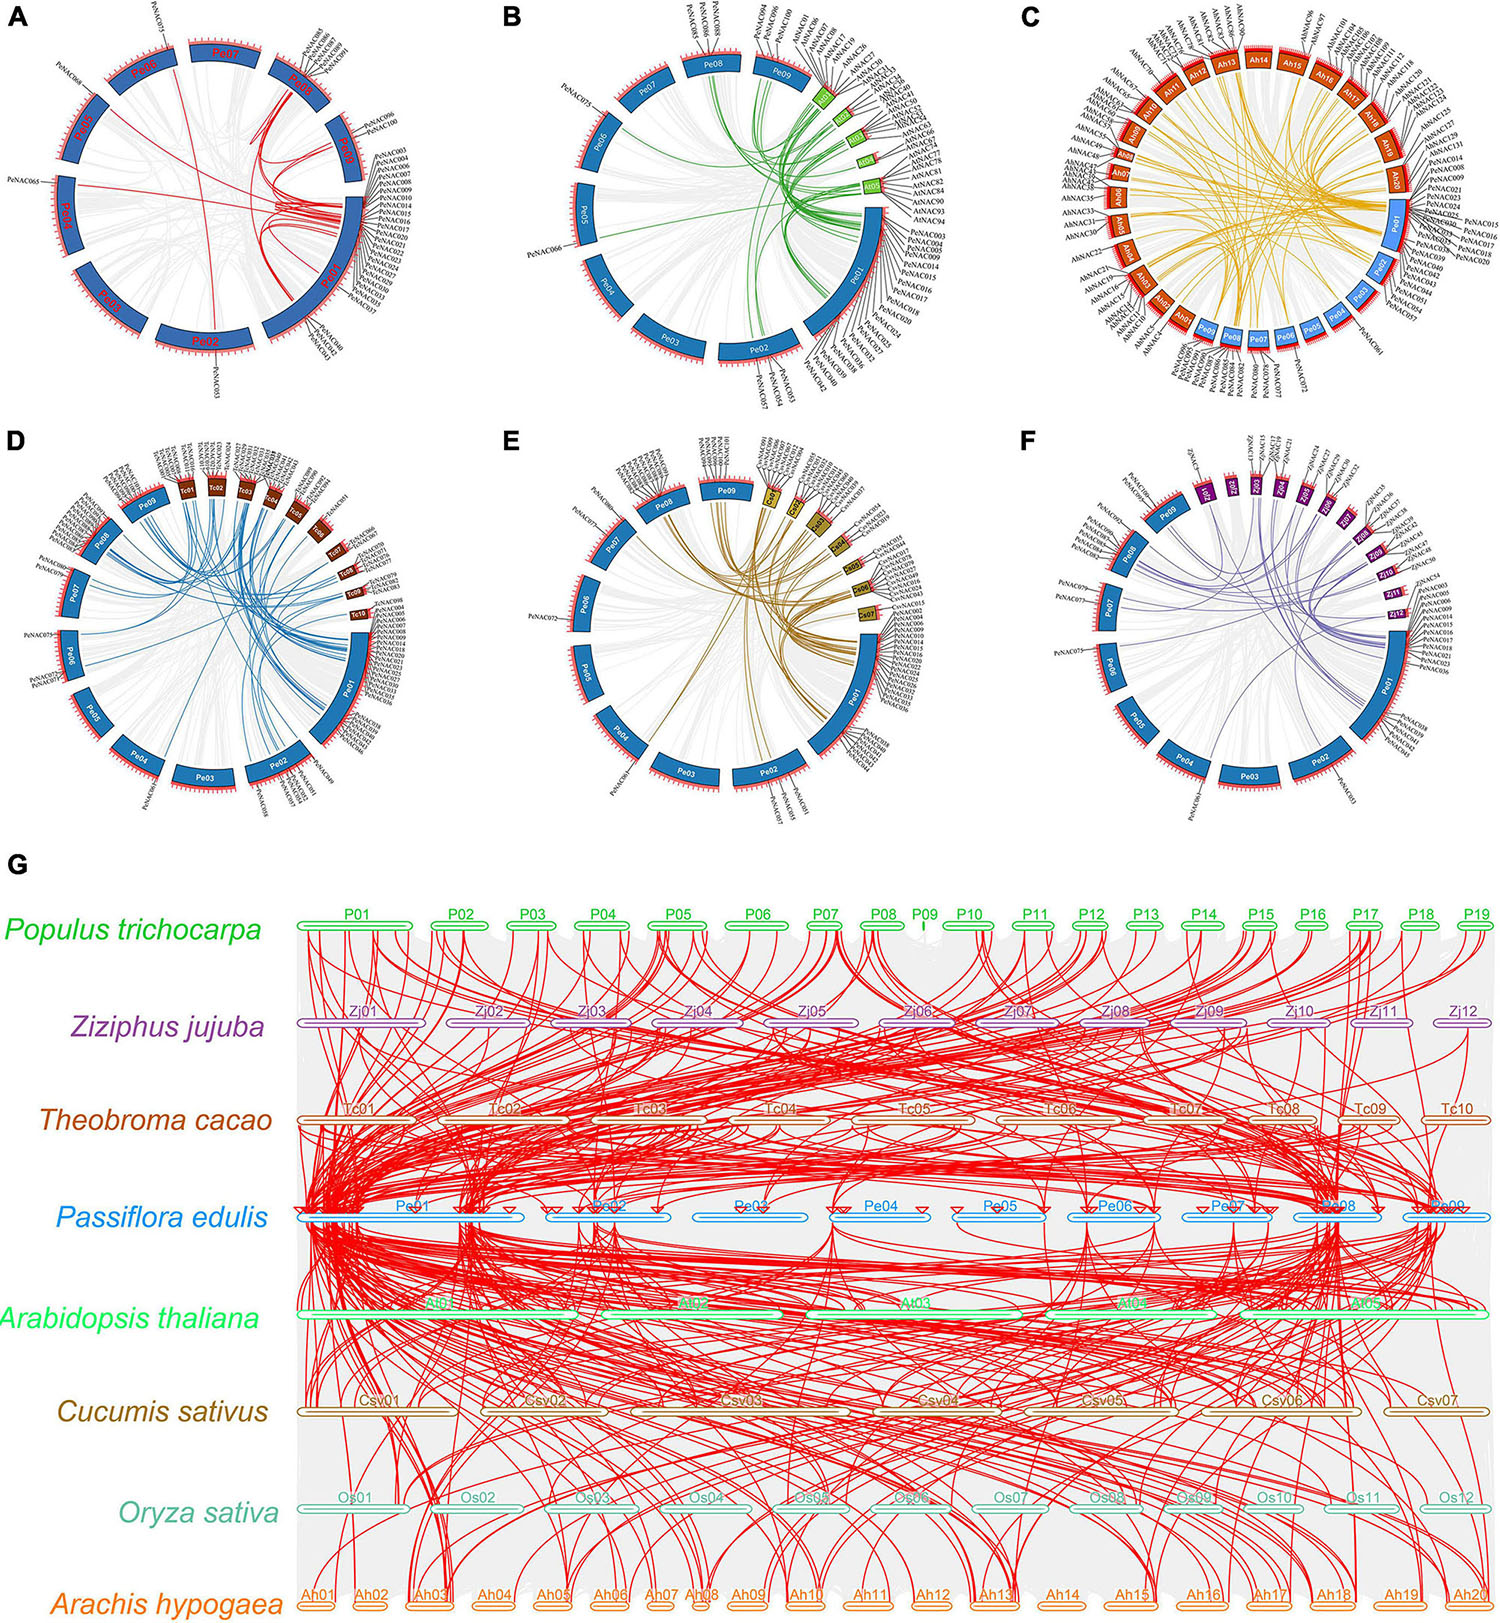
Figure 5. Circos illustrations of the PeNAC genes duplication and multicollinearity analysis of NAC genes between P. edulis, A. thaliana, P. trichocarpa, Z. jujuba, T. cacao, C. sativus, O. sativa, and A. hypogaea. (A) Gene duplication of NAC genes in P. edulis, the background gray lines show all syntenic blocks in the passion fruit genome, and the red lines show the segmental or tandem duplication line regions among-PeNAC genes. The approximate location of PeNAC genes is labeled with a short gray line outside the chromosome with gene names. (B–F) Orthologous of P. edulis NAC genes with A. thaliana (AtNAC), A. hypogaea (AhNAC), T. cacao (TcNAC), C. sativa (CsvNAC), and Z. jujuba (ZjNAC). Chromosomes of P. edulis are presented with Pe01–Pe09, A. thaliana with At01–At05, A. hypogaea with Ah01–Ah20, T. cacao with Tc01–TC10 and Z. jujuba with Zj01–Zj12. The background gray lines show all the syntenic blocks genomes of different species, five colors lines represented the syntenic between P. edulis and other species NAC genes. (G) Multicollinearity analysis of NAC genes between P. edulis, A. thaliana, P. trichocarpa, Z. jujuba, T. cacao, C. sativus, O. sativa, and A. hypogaea species, the gray lines in the background represent the collinear blocks within P. edulis and other species genomes.
Additionally, the Ka/Ks ratios were calculated to access the selection pressure and divergence rates between PeNAC duplicated genes (Supplementary Table 5). Generally, the Ka/Ks > 1 indicates that the gene underwent positive selection, Ka/Ks < 1 indicates negative purification selection and Ka/Ks = 1 as neutral selection. The results of Ka/Ks showed that all the duplicated PeNAC genes have a Ka/Ks < 1 (0.12 to 0.47) representing that all duplicated genes underwent purifying selection (Supplementary Table 5). Moreover, the divergence rate among duplicated PeNAC genes was measured and it was estimated to be between 6.62 to 221.92 million years ago (Supplementary Table 5). The results showed that the divergence rate between duplicated PeNAC genes was estimated to be between 6.62 and 221.92 million years ago (Supplementary Table 5).
Furthermore, a comprehensive collinear analysis was performed among the NAC genes of the following species including P. edulis (PeNAC), A. thaliana (AtNAC), and Z. jujuba (ZjNAC), T. cacao (TcNAC), A. hypogaea (AhNAC), and C. sativa (CsvNAC). Overall, a total of 284 NAC gene pairs were identified in all the above species, of which, the highest number of NAC gene pairs was found between PeNAC-AhNAC (86 gene pairs) followed by PeNAC-CsvNAC (63 gene pairs), PeNAC-TcNAC (61 gene pairs), PeNAC-AtNAC (42 gene pairs), and the lowest (32 gene pairs) among PeNAC-ZjNAC (Figures 5B–F and Supplementary Table 6). Moreover, the results of the collinear analysis revealed that 31 PeNAC genes were paired with 32 AtNAC genes (Figure 5B), 38 PeNAC genes were paired with 61 AhNAC genes (Figure 5C), 50 PeNAC genes were paired with 38 TcNAC genes (Figure 5D), 43 PeNAC genes were paired with 37 CsvNAC genes (Figure 5E), and 31 PeNAC genes were paired with 23 ZjNAC genes (Figure 5F). Among the NAC gene collinearity in all the above species, the NAC genes of P. edulis were highly collinear with A. hypogaea NAC than other species, indicating that they may belong to same ancestor with similar functions, but this requires further studies.
In addition, a multicollinearity analysis was achieved to reveal the robust orthologs of P. edulis NAC genes in the genomes of seven other species including A. thaliana, Z. jujuba, T. cacao, A. hypogaea, P. trichocarpa, O. sativa, and C. sativa (Figure 5G). The collinear gene pairs of the above species were found to be inferred and have undergone lineage-specific expansion during evolution. The results showed that the highest collinearity was found between P. edulis and P. trichocarpa (132 orthologs) followed by P. edulis and A. hypogaea (100 orthologs), P. edulis and T. cacao (78 orthologs), P. edulis and C. sativa (68 orthologs), P. edulis and A. thaliana (66 orthologs), P. edulis and Z. jujuba (41 orthologs), and least collinearity was found between P. edulis and O. sativa (19 orthologs), respectively (Figure 5G and Supplementary Table 7). By comparing the P. edulis chromosomes, the P. edulis chromosome one shared the largest orthologs with all other species. Overall, the maximum collinear orthologs were found between P. edulis and P. trichocarpa indicating that the NAC genes were conserved and may share the same ancestors except for duplication or loss of the NAC genes.
The PeNAC protein interaction network based on Arabidopsis protein orthologs was performed, and PeNAC proteins that were highly similar to Arabidopsis proteins were called STRING proteins. All 105 PeNAC proteins interacted with known Arabidopsis proteins and PeNAC proteins present in different groups may have different functions (Figures 6A,B and Supplementary Table 8). PeNAC036, PeNAC041, PeNAC046, and PeNAC080 were homologous with AtNAC007 and interacts with AtVND1/7 (VASCULAR-RELATED NAC-DOMAIN1/7) protein. PeNAC035, PeNAC043, PeNAC067, and PeNAC100 were homologous with AtNAC083 and have a strong interaction with AtRD26/AtNAC72, ATVND1/7, AtNAC1, and AtCUS2/3 proteins. PeNAC057, PeNAC058, PeNAC072, PeNAC074, and PeNAC088 were homologous with AtNAC073 and interact with AtNST1 (NAC SECONDARY WALL THICKENING PROMOTING FACTOR) and AtXND1 (xylem NAC domain 1) proteins (Figure 6A). PeNAC068, PeNAC069, and PeNAC105 were homologous with AtNAC014, PeNAC025 was homologous with AtNAC028, PeNAC013 was homologous with AtNAC086 and they interact with a common protein that is AtOPR3 (OXOPHYTODIENOATE-REDUCTASE 3) (Figure 6A).
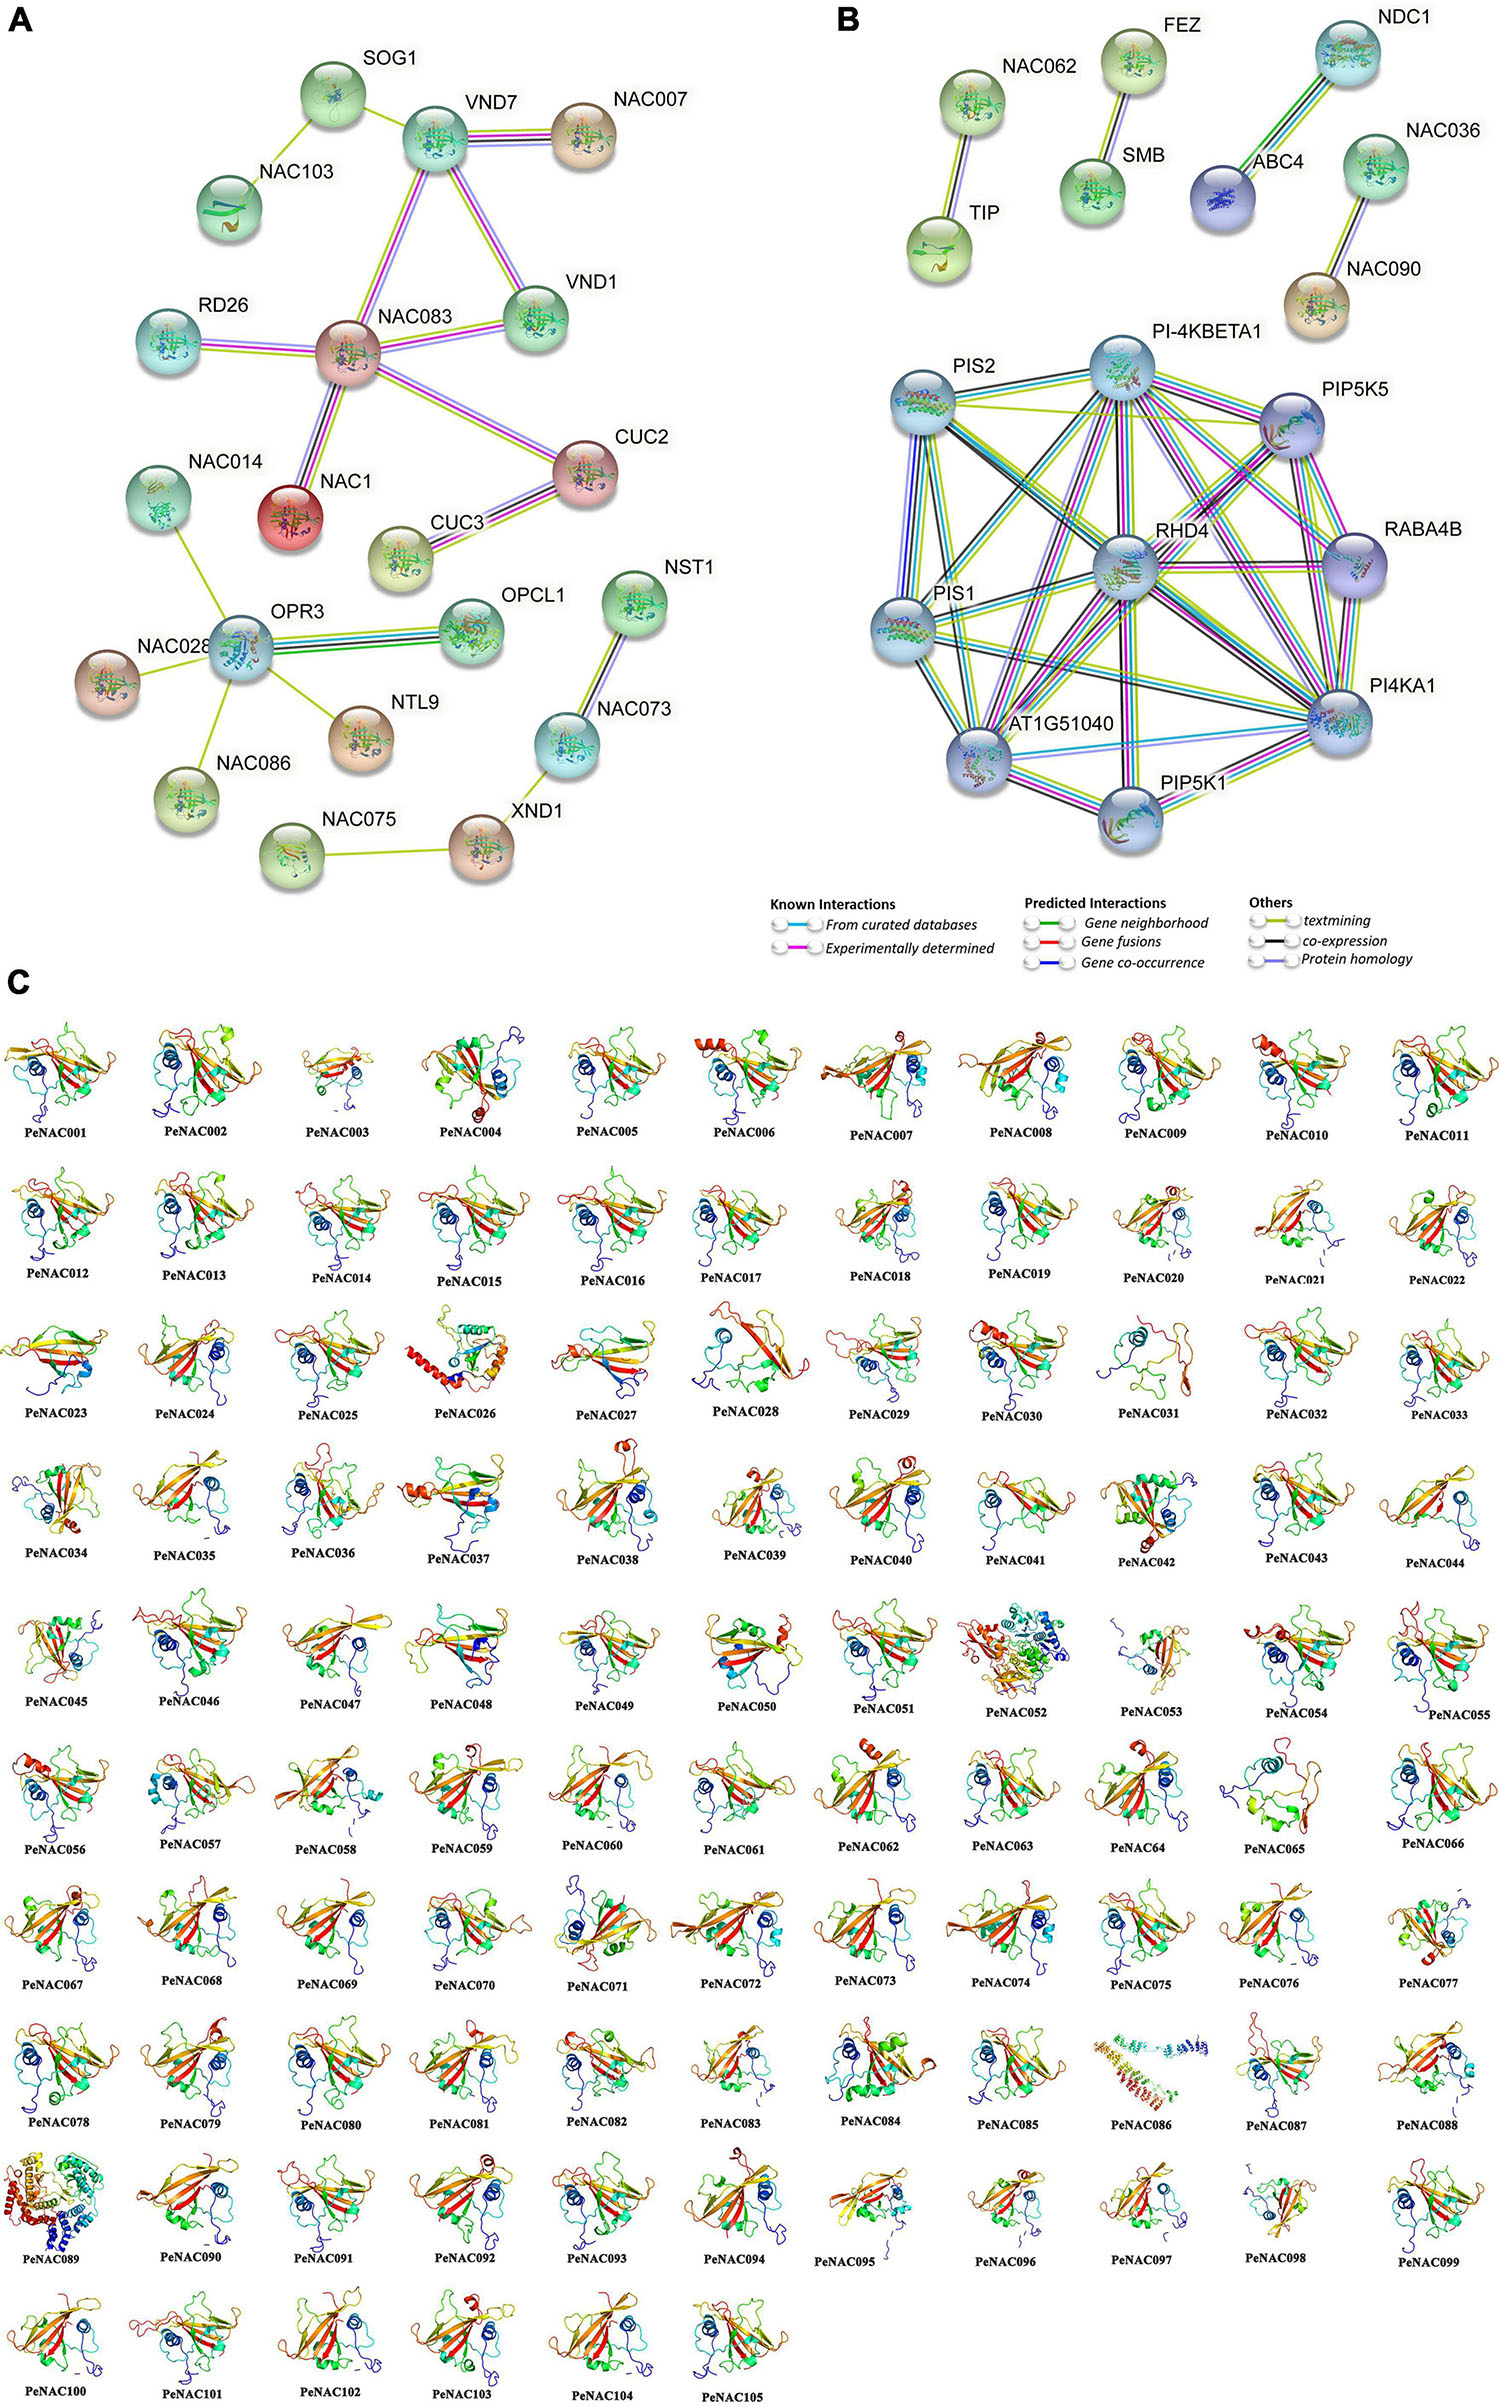
Figure 6. Protein–protein interaction and predicted 3D models of PeNAC proteins. (A) Medium confidence interaction (0.4). (B) High confidence interaction (0.7). (C) 3D models of PeNAC proteins were constructed using the online Phyre2 server with default mode.
PeNAC070 was homologous with AtNAC062 and interact with AtTIP (TCV-INTERACTING PROTEIN) (Figure 6B). PeNAC038, PeNAC054, and PeNAC055 were homologous with AtNAC090 and PeNAC049, PeNAC053, and PeNAC075 were homologous with AtNAC036 and they have a strong interaction between them (Figure 6B). PeNAC089 was homologous with AtPI-4KBETA1 and have a strong interaction with AtPIS1/2, AtPIP5K1/5, AtPI4KA1, and AT1G51040 (Figure 6B and Supplementary Table 8). Furthermore, protein–protein interaction results are inconsistent with phylogenetic relationships because PeNAC proteins align with AtNAC proteins found in the same phylogenetic group, for example, PeNAC062 and PeNAC102 were homologous with AtNAC83 and interact with AtCUC2/3 proteins and present in the same phylogenetic group (G1). Additionally, the 3D structures of all the 105 PeNAC proteins were predicted using an online Phyre2 server with the reference model templates including c4d0mW, c1xi4D, c3ni2A, c3ulxA, c4rciC, and d1ut7a. Overall, up to 49% (52/105) and 47% (49/105) of PeNAC proteins were modeled with the c3ulxA and d1ut7a reference templates. However, only single proteins including PeNAC052, PeNAC086, and PeNAC089 were predicted to be modeled with the c3ni2A, c1xi4D, and c4d0mW reference templates (Figure 6). All 105 PeNAC proteins showed similar 3D structures and they have flexible structures due to the presence of coils (Figure 6). The PeNAC 3D results suggest that NAC proteins may be ancestrally similar to each other from individual genomes, or preliminary adjustments and might be stabilized during long-term domestication leading to changes in protein structures and functions.
To better understand the regulatory mechanisms of miRNAs in PeNAC genes, a total of 17 miRNAs (ped-miRNAs) were identified, that belong to 11 different miRNA families. The network interactions and schematic diagram of miRNA targeting sites in PeNAC genes are presented in Figures 7A,B. As shown in Figure 7A, the 17 identified miRNA targeted 25 PeNAC genes and results showed that ped-miR164b-5p targeted the most 8 PeNAC genes (PeNCA003, PeNCA004, PeNAC027, PeNCA034, PeNCA042, PeNCA062, and PeNCA086) followed by ped-miR166b-3p targeted 4 PeNAC genes (PeNCA072, PeNCA074, PeNCA088, and PeNCA095), whereas ped-miR171b-3p, ped-miR319p, and ped-miR157a-5p targeted at least one PeNAC076, PeNAC039, and PeNAC105 gene respectively. Compared between the targeted genes, PeNAC089 was targeted the most by 4 miRNAs including ped-miR319l, ped-miR319b, ped-miR3199d, and ped-miR3199e. PeNAC009 was targeted by 3 miRNAs including ped-miR399d, ped-miR399e, and ped-miR397a; PeNAC052 was targeted by 3 miRNAs including ped-miR162a, ped-miR172b, and ped-miR828B; similarly, PeNAC073 was also targeted by 3 miRNAs including ped-miR319p, ped-miR319I, and ped-miR319b (Figure 7A and Supplementary Table 9). In conclusion, the ped-miR164b-5p and ped-miR166b-3p were the major miRNAs, while PeNAC089, PeNAC009, PeNAC052, and PeNAC073 were the major targeted genes that may play an important role and require further functional studies (Figure 7 and the detail information about PeNAC target genes and miRNAs have been provided in Supplementary Table 9).
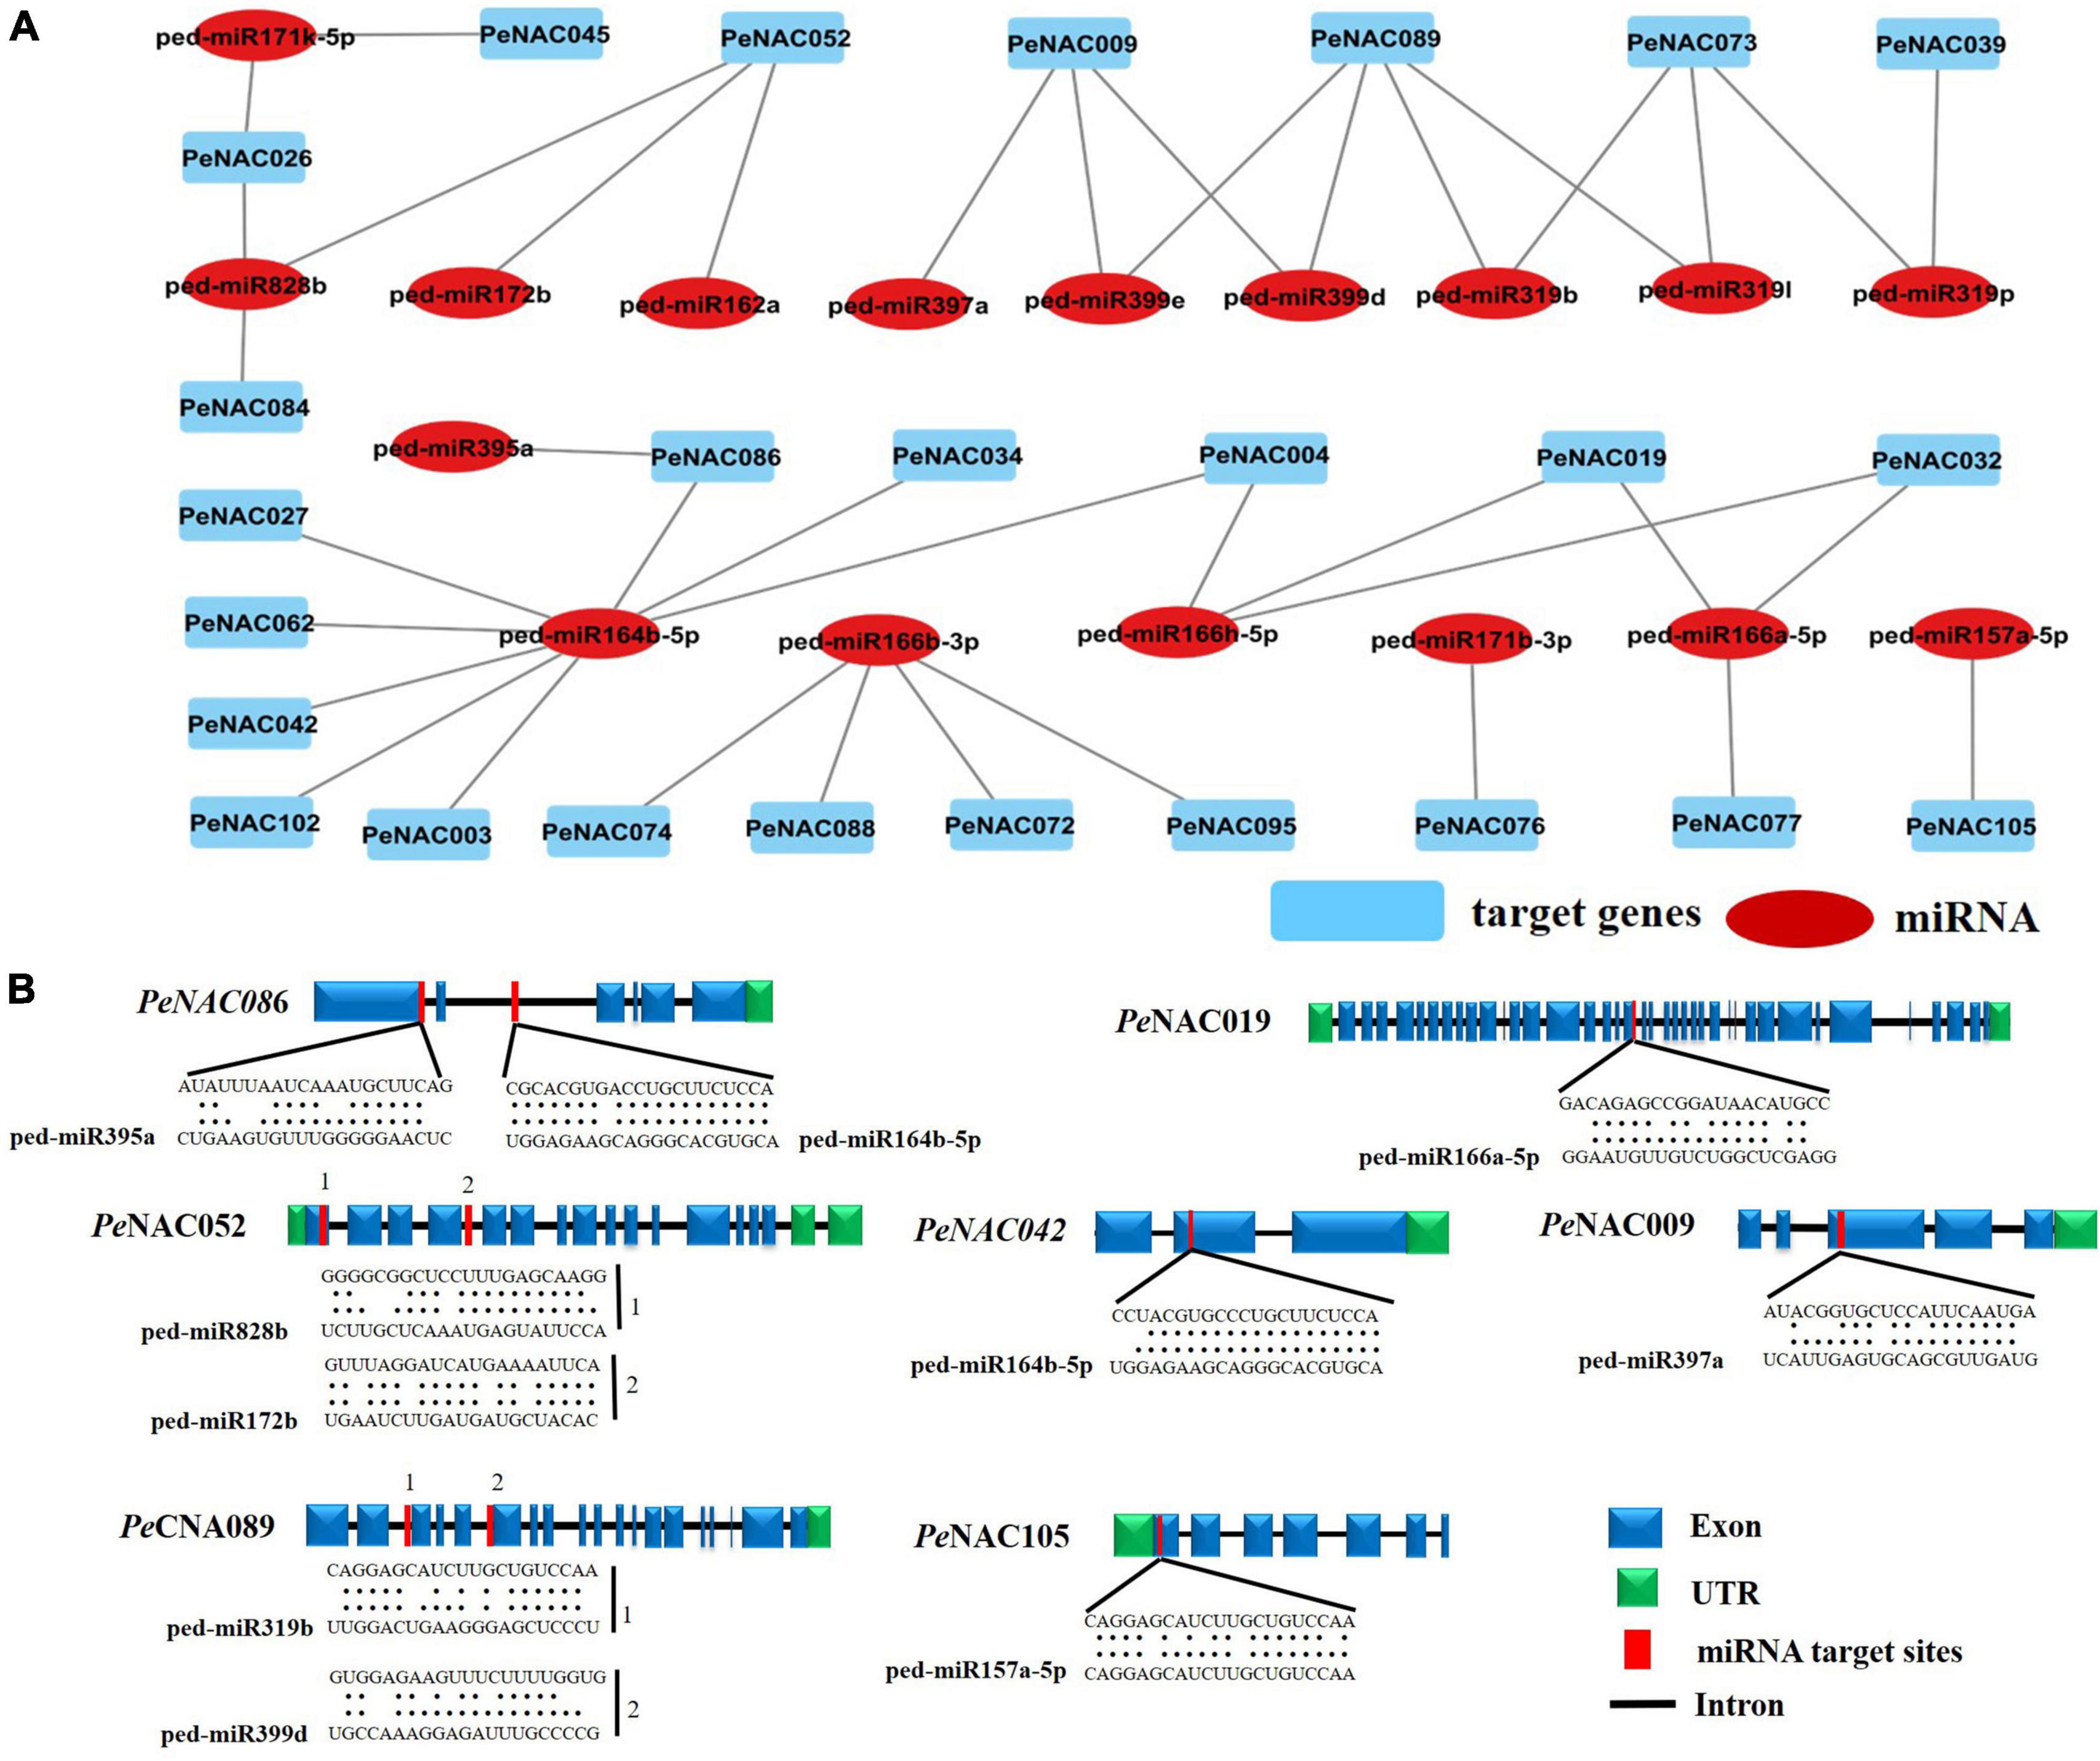
Figure 7. Predicted miRNAs targeting PeNAC genes. (A) Network illustration of predicted miRNA targeted PeNAC genes. Blue rectangle shapes represent the predicted miRNAs and red oval shapes represent targeted PeNAC genes. (B) The schematic diagram indicates the PeNAC genes targeted by miRNAs and the putative miRNAs sites are indicated by red color, upper sequences are from the gene region and lower sequences are from the miRNAs.
The potential TFs were investigated in the upstream regions of all 105 PeNAC genes and a TF regulatory network was constructed using Cytoscape. The results showed that among all 105 PeNAC genes, a total of 7,029 TFs were identified, belonging to 43 different TF families including BBR-BPC, AP2, bHLH, bZIP, Dof, NAC, WRKY, TCP, ERF, GRAS, MYB, C2H2, and B3 (Figure 8 and Supplementary Table 10). The predicted TF families revealed that ERF (1344 members) was highly enriched followed by BBR-BPC (864 members), Dof (814 members), NAC (530 members), MIKC- MADS (458 members), and bZIP (404 members) (Figure 8 and Supplementary Table 10). The least enriched families were also predicted to contain only a few members including VOZ (1 member), LFY (2 members), GRF (3 members), SRS (4 members), WOX (7 members), and EIL (9 members). Among all 105 PeNAC genes, PeNAC089 was the most targeted by 299 TFs followed by PeNAC094 (240 TFs), PeNAC023 (221 TFs), PeNAC014 (219 TFs), and PeNAC074 (167 TFs). Whereas, PeNAC068 was targeted the least by only 4 TFs (Figure 8 and Supplementary Table 10).
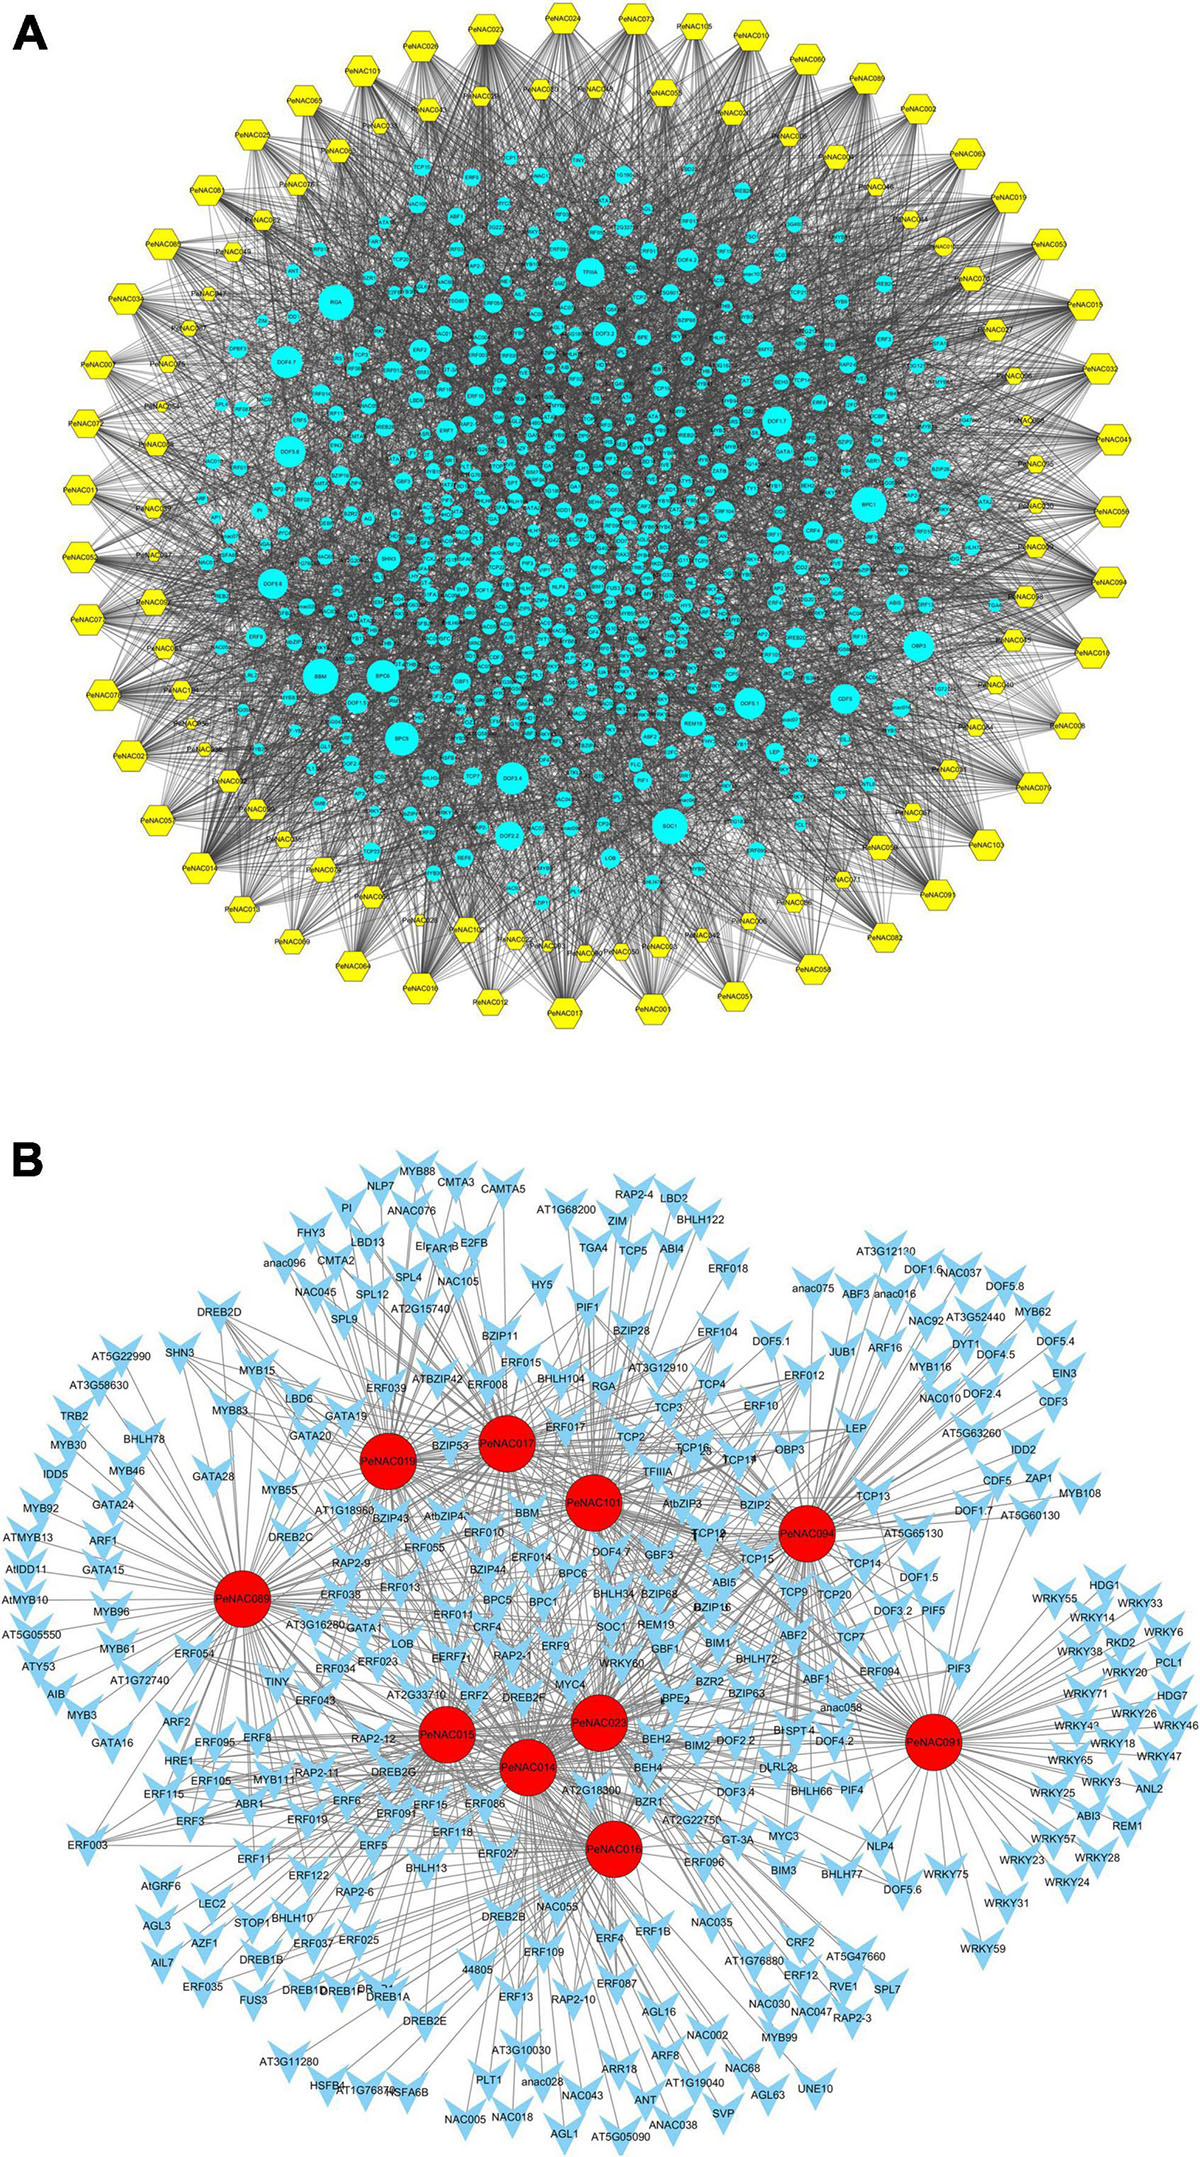
Figure 8. The putative transcription factor regulatory network analysis of PeNAC genes. (A) Turquoise circular nodes represent transcription factors; yellow hexagonal nodes represent PeNAC genes and node size represents the degree of interaction between nodes based on degree value. (B) The top 10 highly enriched and targeted PeNAC genes are shown, darker the color shows highly enriched. Transcriptional factors were predicted by PTRM online program and a regulatory network was constructed using the Cytoscape 3.9 software.
The PeNAC genes were targeted by various types and numbers of TF families, for example, PeNAC089 was enriched in ERF (186), MYB (32), GATA (25), and BBR-BPR (14) family members, PeNAC094 was enriched in Dof (64), bZIP (33), and bHLH (32) family members, PeNAC023 was enriched in ERF (82), BBR-BPC (39), and TCP (28) family members. The TF interaction networks of all 105 PeNAC genes are shown in Figure A. The 10 most enriched PeNAC genes with TFs are shown in Figure B (Supplementary Table 10). TFs related to plant growth, development, and response to biotic and abiotic stress were also found in PeNAC genes including ERF, TCP, bHLH, BBR-BPC, WRKY, bZIP, MYB, and AP2 respectively (Figure 8 and Supplementary Table 10).
The GO and KEGG annotation and enrichment analysis were conducted to further understand PeNAC genes at the molecular level and classified into the biological process (BP), cellular component (CC), and molecular function (MF) (Figure 9 and Supplementary Tables 11, 12). Overall, the highest 628 terms were found in GO-BP class followed by 55 terms in GO-CC and the lowest 38 terms were found in the GO-MF 38-MF class. The high enrichment analysis revealed that there were 11 highly enriched terms in GO-MF class including transcription regulator activity (GO:0140110, 76 genes), DNA-binding transcription factor activity (GO:0003700, 76 genes), sequence-specific DNA binding (GO:0043565, 33 genes), DNA binding (GO:0003677, 33 genes), nucleic acid binding (GO:0003676, 33 genes), heterocyclic compound binding (GO:1901363, 33 genes), organic cyclic compound binding (GO:0097159, 33 genes), transcription cis-regulatory region binding (GO:0000976, 14 genes), transcription regulatory region nucleic acid binding (GO:0001067, 14 genes), sequence-specific double-stranded DNA binding (GO:1990837, 14 genes), and double-stranded DNA binding (GO:0003690, 14 genes) (Figure 9A).
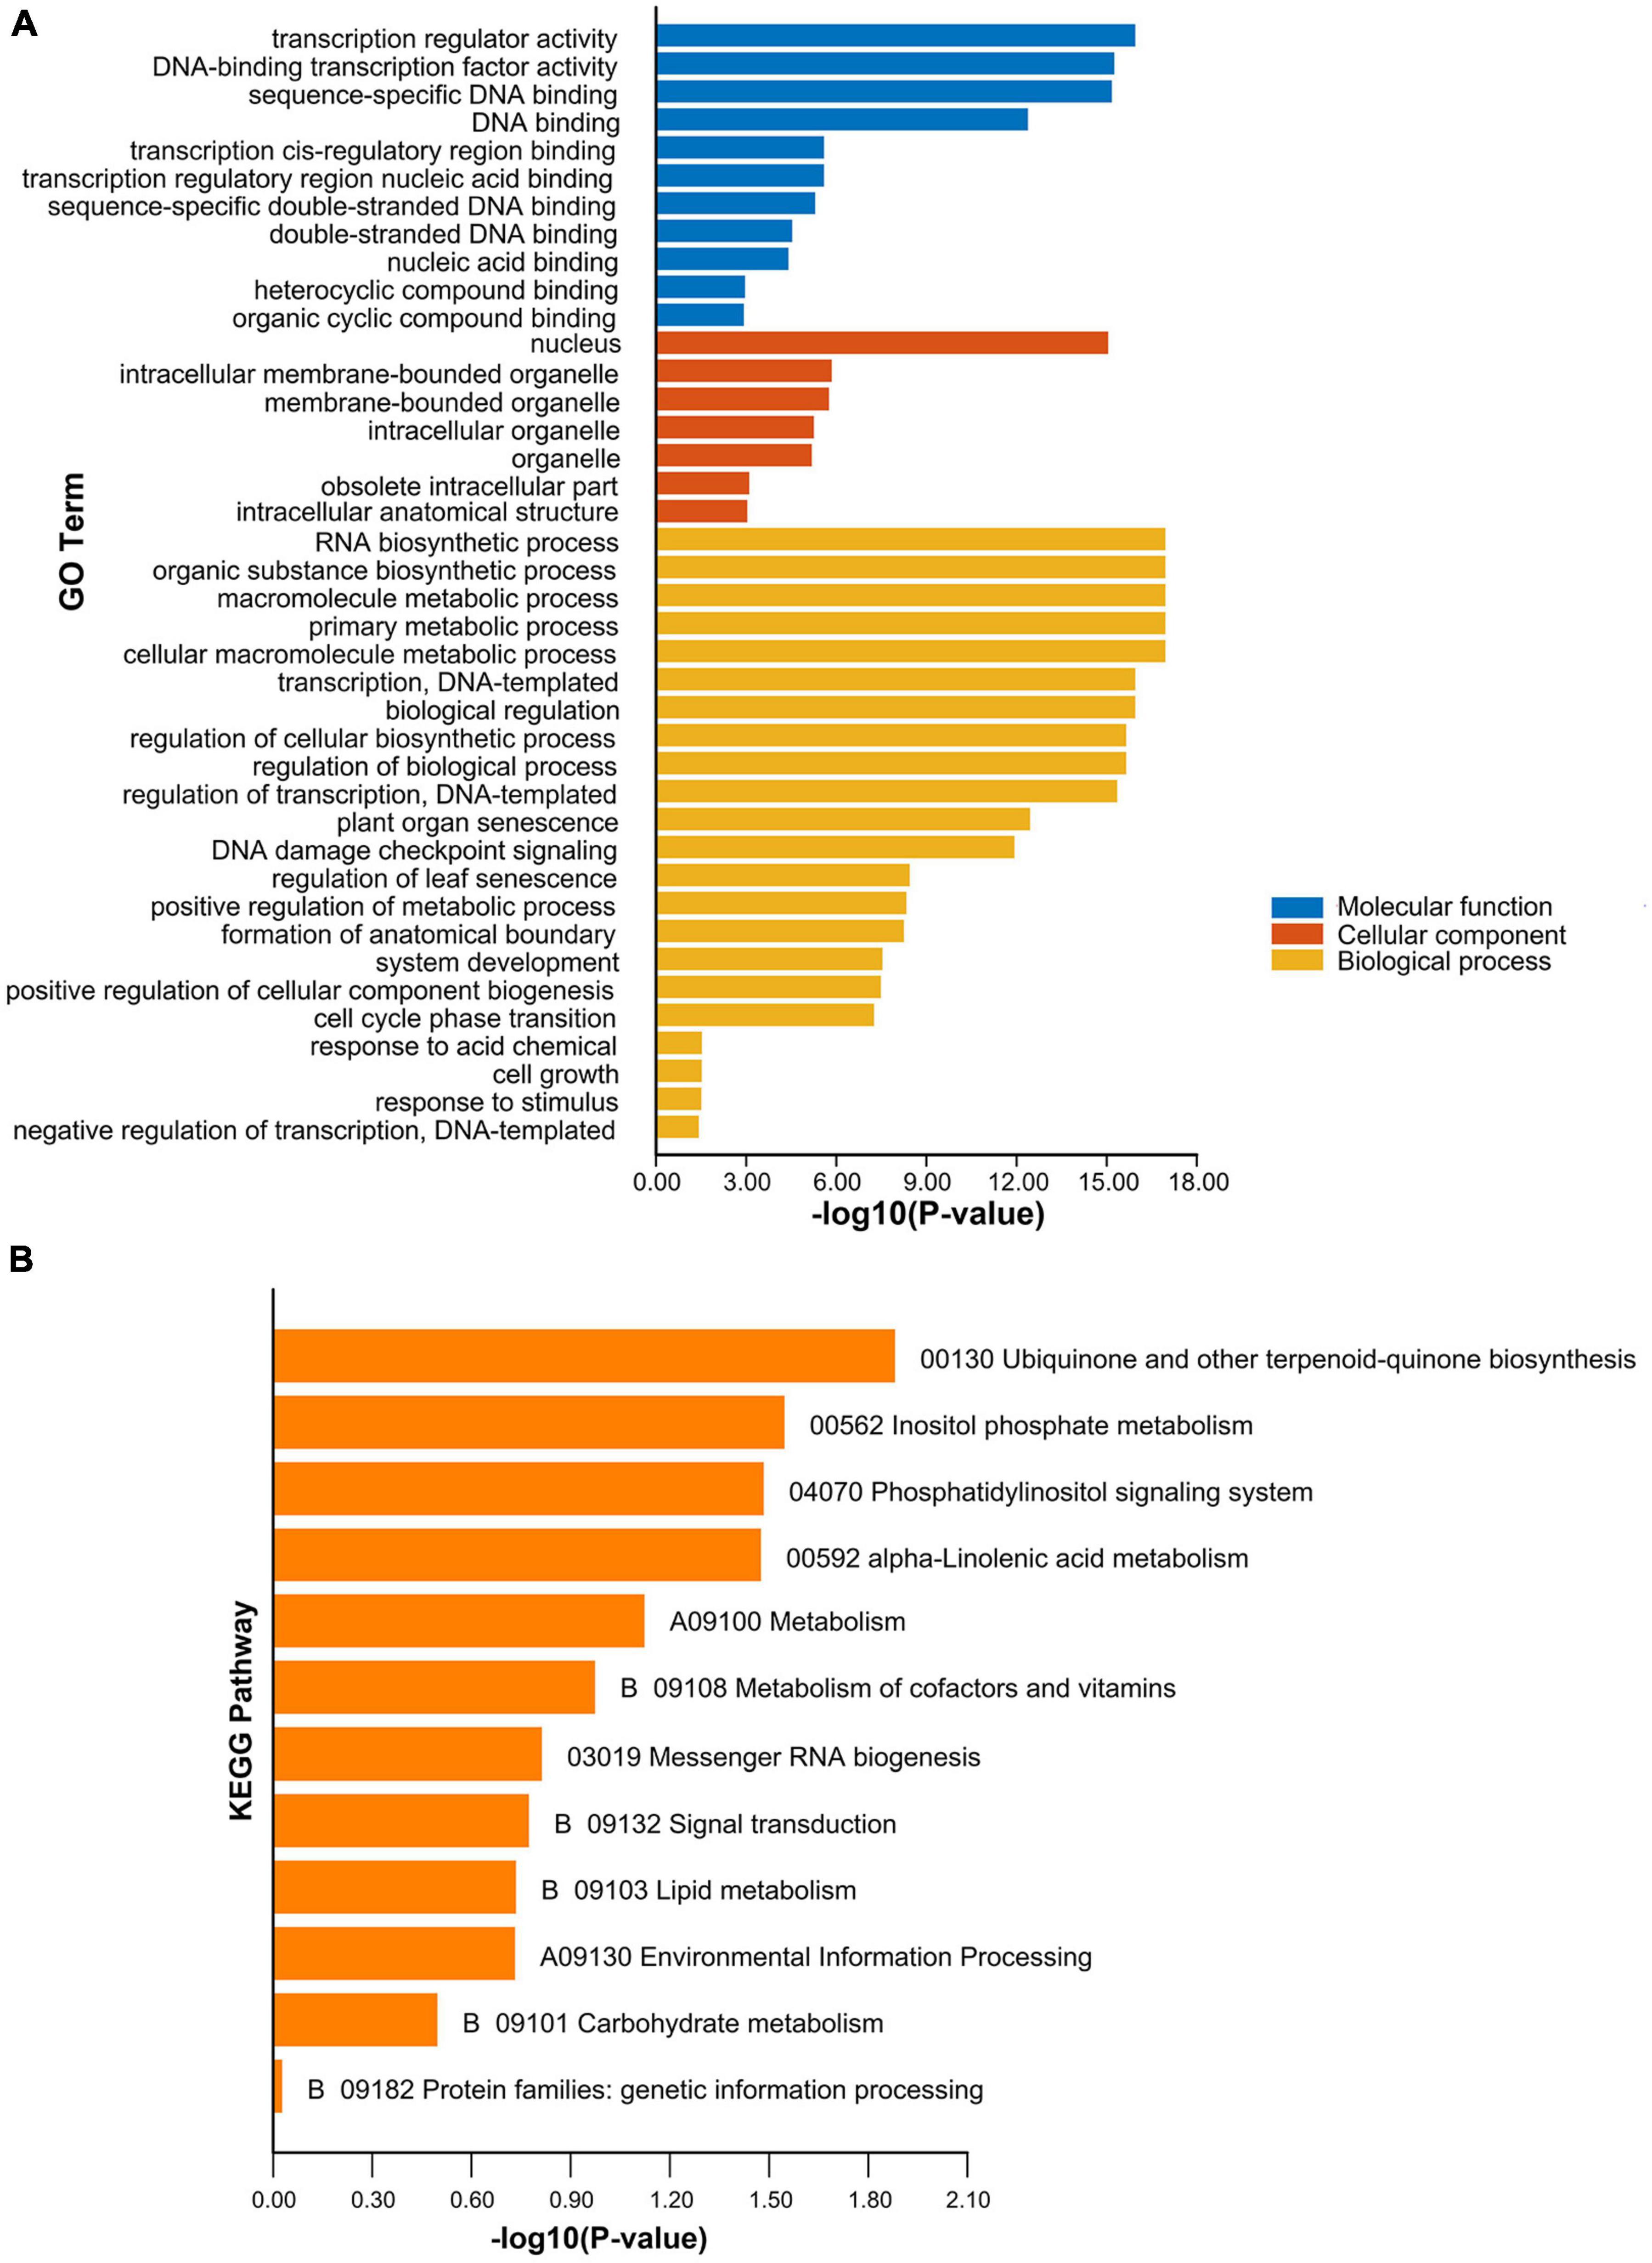
Figure 9. Gene ontology and KEGG enrichment analysis of PeNAC genes. (A) The highly enriched GO terms in PeNAC genes. (B) The highly enriched KEGG pathways in PeNAC genes. Details about GO annotation enrichment and terms of MF, CC, BP, and KEGG pathways can be found in Supplementary Tables 11, 12.
In the GO-CC classification, 7 of the 55 terms were highly enriched including intracellular membrane-bounded organelle (GO:0043231, 39 genes), membrane-bounded organelle (GO:0043227, 39 genes), intracellular organelle (GO:0043229, 39 genes), organelle (GO:0043226, 39 genes), obsolete intracellular part (GO:0044424, 39 genes), intracellular anatomical structure (GO:0005622, 39 genes), and nucleus (GO:0005634, 37 genes). Whereas in GO-BP class, 15 terms were highly enriched including organic substance biosynthetic process (GO:1901576, 78 genes), primary metabolic process (GO:0044238, 78 genes), biological regulation (GO:0065007, 78 genes), regulation of biological process (GO:0050789, 77 genes), RNA biosynthetic process (GO:0032774, 76 genes), macromolecule metabolic process (GO:0043170, 76 genes), cellular macromolecule metabolic process (GO:0044260, 76 genes), transcription, DNA-templated (GO:0006351, 76 genes), regulation of cellular biosynthetic process (GO:0031326, 76 genes), regulation of transcription, DNA-templated (GO:0006355, 76 genes), response to stimulus (GO:0050896, 46 genes), positive regulation of biological process (GO:0048518, 35 genes), system development (GO:0048731, 34 genes), plant organ senescence (GO:0090693, 14 genes), and response to light intensity (GO:0009642, 10 genes) (Figure 9A and Supplementary Table 11). In conclusion, the GO results indicate that the BP category was highly enriched followed by the CC and finally the MF category.
Furthermore, KEGG pathway enrichment analysis of 105 PeNAC genes showed that 12 pathways were predicted to be involved in different functions (Figure 9B and Supplementary Table 12). As shown in Figure 9B, among the predicted KEGG pathways, the highly enriched pathways include ubiquinone and another terpenoid-quinone biosynthesis (00130), inositol phosphate metabolism (00562), phosphatidylinositol signaling system (04070), alpha-Linolenic acid metabolism (00592), metabolism (A09100), and metabolism of cofactors and vitamins (B09108). In conclusion, the GO and KEGG analysis suggest that PeNAC gene may play important functions in different biological, molecular, and cellular processes including different biotic and abiotic stresses, metabolism, and biosynthetic responses related to hormones but require further studies. The details of GO and KEGG annotation results and numerically significantly enriched terms for MF, CC, and BP have been provided in Supplementary Tables 11A,B, 12.
The expression profiles of all 105 PeNAC genes in the pulp tissue of yellow and purple passion fruit at fruitlet, green, veraison, and ripening stages were evaluated based on FPKM values. FPKM values were converted to log2FC and were displayed into heatmap by TBtools software (FPKM and log2FC values have been provided in Supplementary Table 13). The PeNAC genes showed a diverse expression in both cultivars at different fruit developmental stages. The result showed that, overall, 90% (95/105) and 87% (92/105) PeNAC genes were either positively or negatively expressed during fruit development in both cultivars. The following genes were not expressed in both cultivars including PeNAC001, PeNAC013, PeNAC016, PeNAC017, PeNAC035, PeNAC040, PeNAC041, PeNAC044, PeNAC050, and PeNAC098 suggesting that they may not play a role during fruit development. Moreover, PeNAC014, PeNAC063, PeNAC064, PeNAC085, PeNAC094, PeNAC100, and PeNAC101 genes had the highest expression levels (FC ≥ 5) during fruit developmental stages of both cultivars (Figure 10 and Supplementary Table 13).
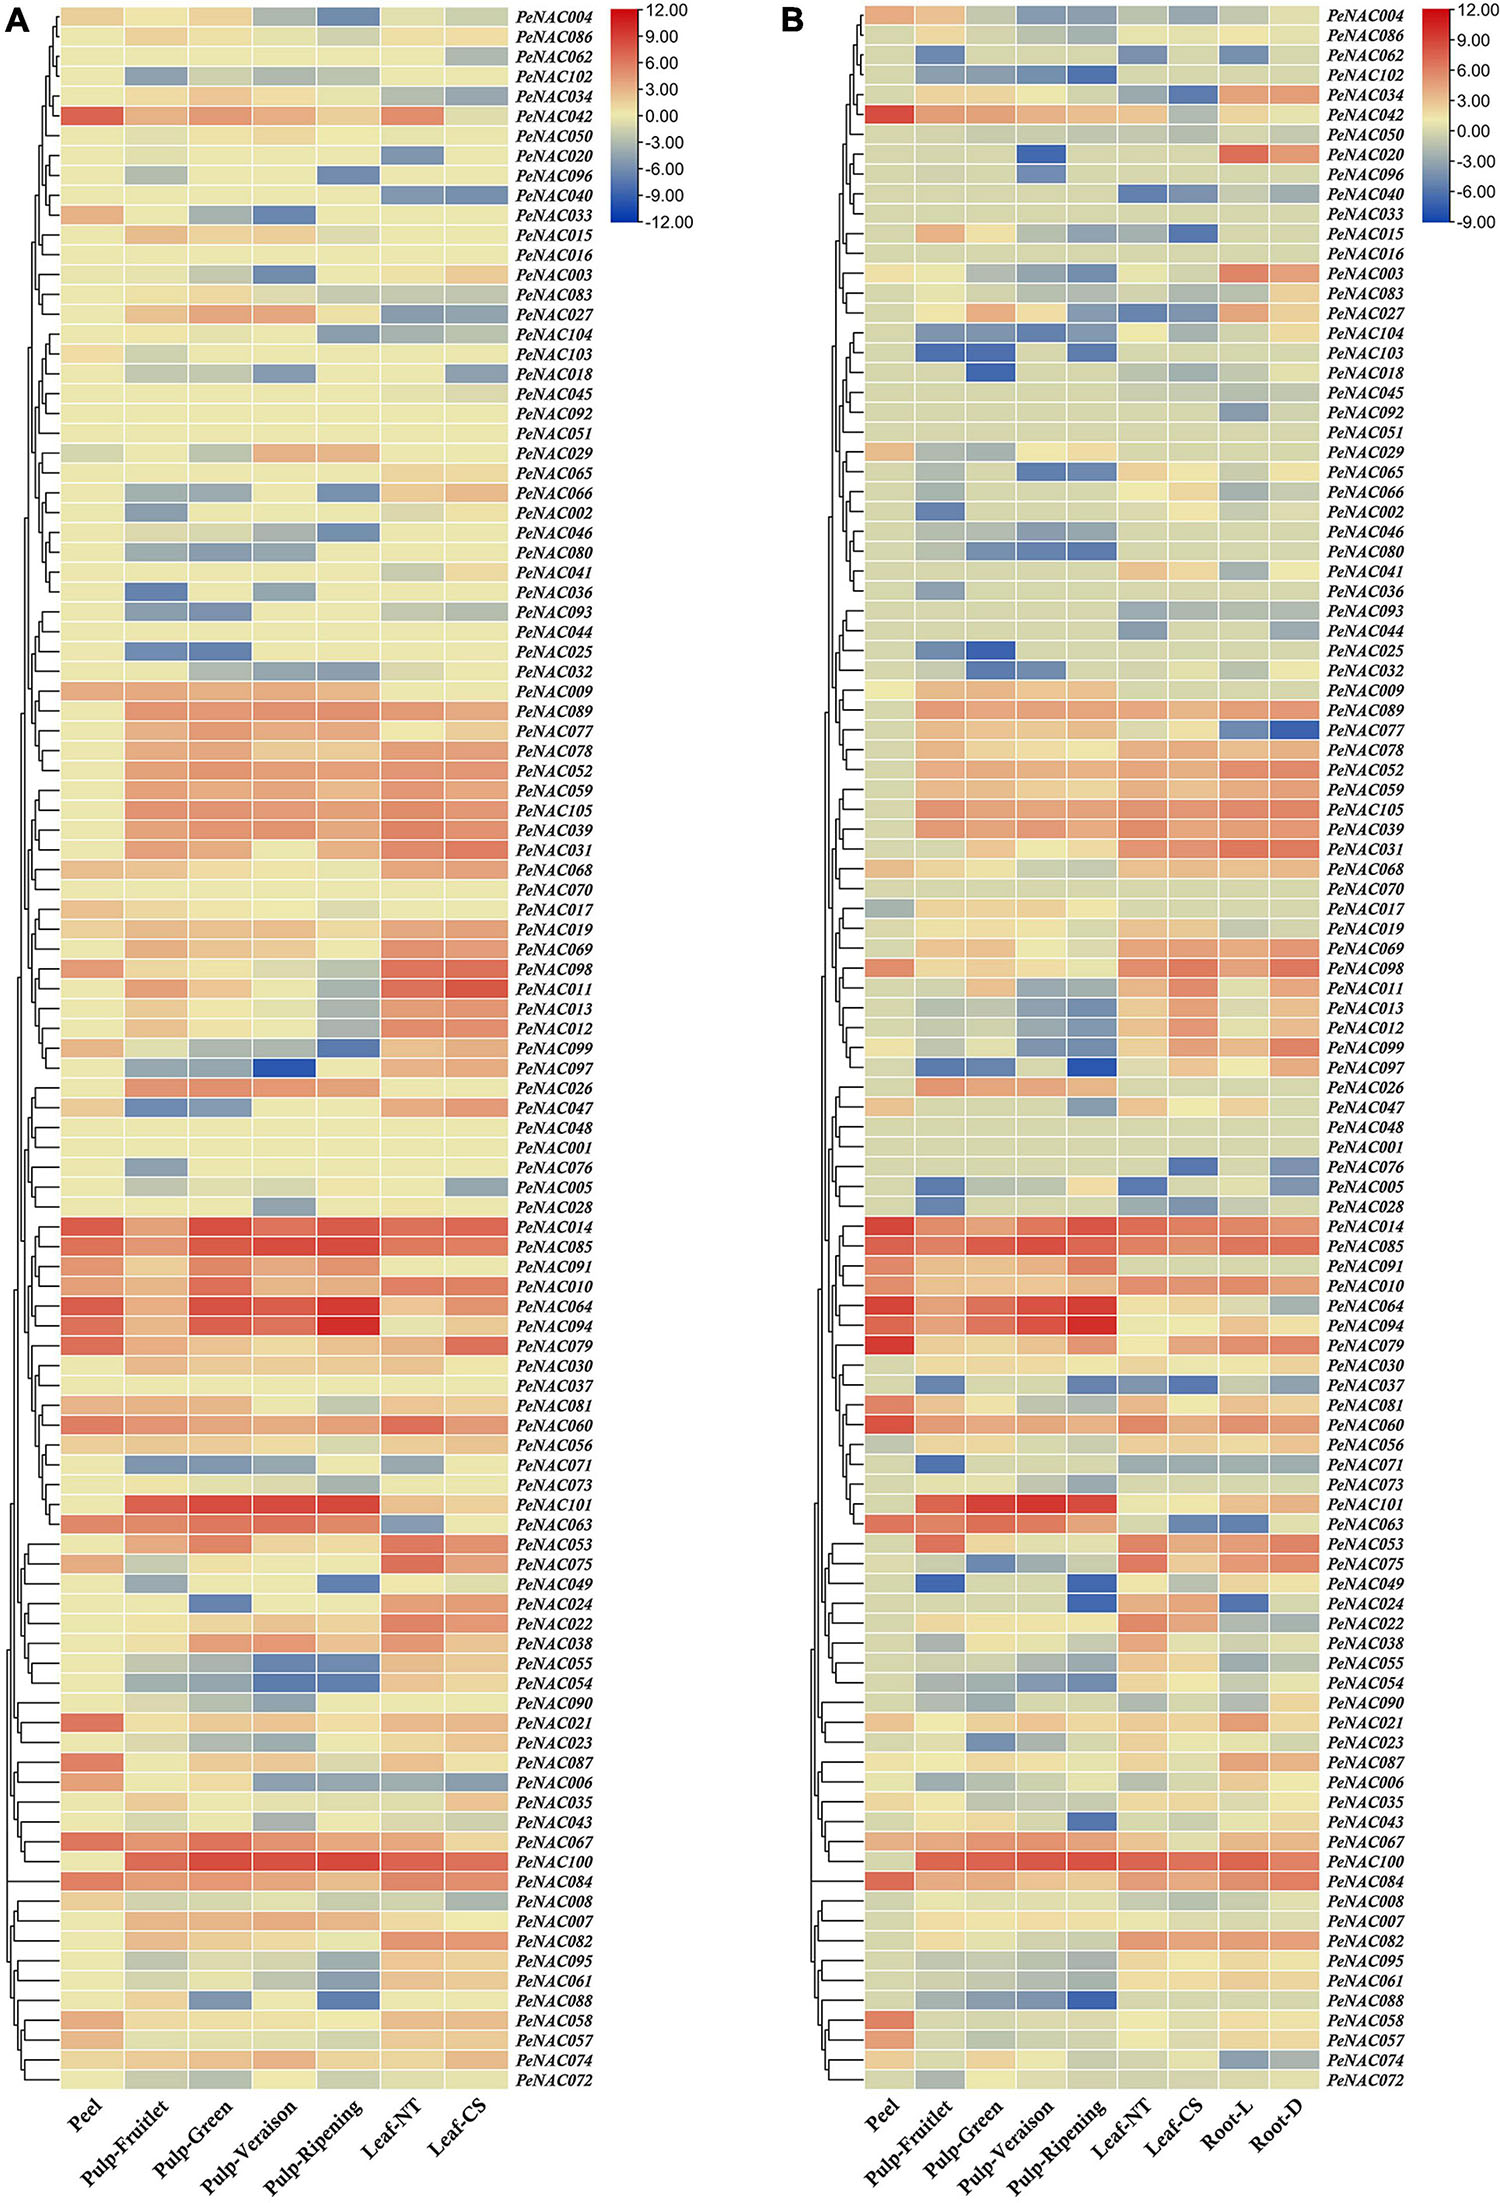
Figure 10. The heatmap showing the expression profiles of PeNAC genes in pulp, root, peel, and leave tissues of yellow and purple passion fruit cultivars under different conditions. (A) PeNAC expressions in the peel, pulp (Fruitlet, Green, Veraison, and Ripening stages) and leaf (NT and CS) of yellow passion fruit. (B) PeNAC genes expressions in the peel, pulp (Fruitlet, Green, Veraison, and Ripening stages), leaf (NT and CS) and root (L and D). The NT and CS indicate the normal temperature (NT) and chilling stress (CS) conditions. L and D represent the samples from limestone (L) and sandy dolomite (D) rocky desertification areas. Fragments per kilobase per million (FPKM) values of PeNAC genes in all tissues were transformed by log2 and a heatmap was constructed by TBtools software (the red color shows the highest and the blue color shows the lowest expression levels in the expression bar).
In the yellow fruit, there were 80% PeNAC (84/105), 82% PeNAC (87/105), 73% PeNAC (77/105), and 68% PeNAC (72/105) genes were expressed in fruitlet, green, veraison and ripening stages. In comparison between different stages, the ripening stage had the highest expression 9.99 FC (PeNAC094) followed by veraison stage 8.41 FC (PeNAC100), green stage 7.28 FC (PeNAC100), and fruitlet stage 8.36 FC (PeNAC104) respectively. There were 35 PeNAC genes (40%) with ≥2 FC expression levels at the green stage, followed by 33 PeNAC genes (39%) at the fruitlet stage, 29 PeNAC genes (37%), and the lowest of 25 PeNAC genes (34%) at ripening stage of yellow fruit (Figure 11A and Supplementary Table 13).
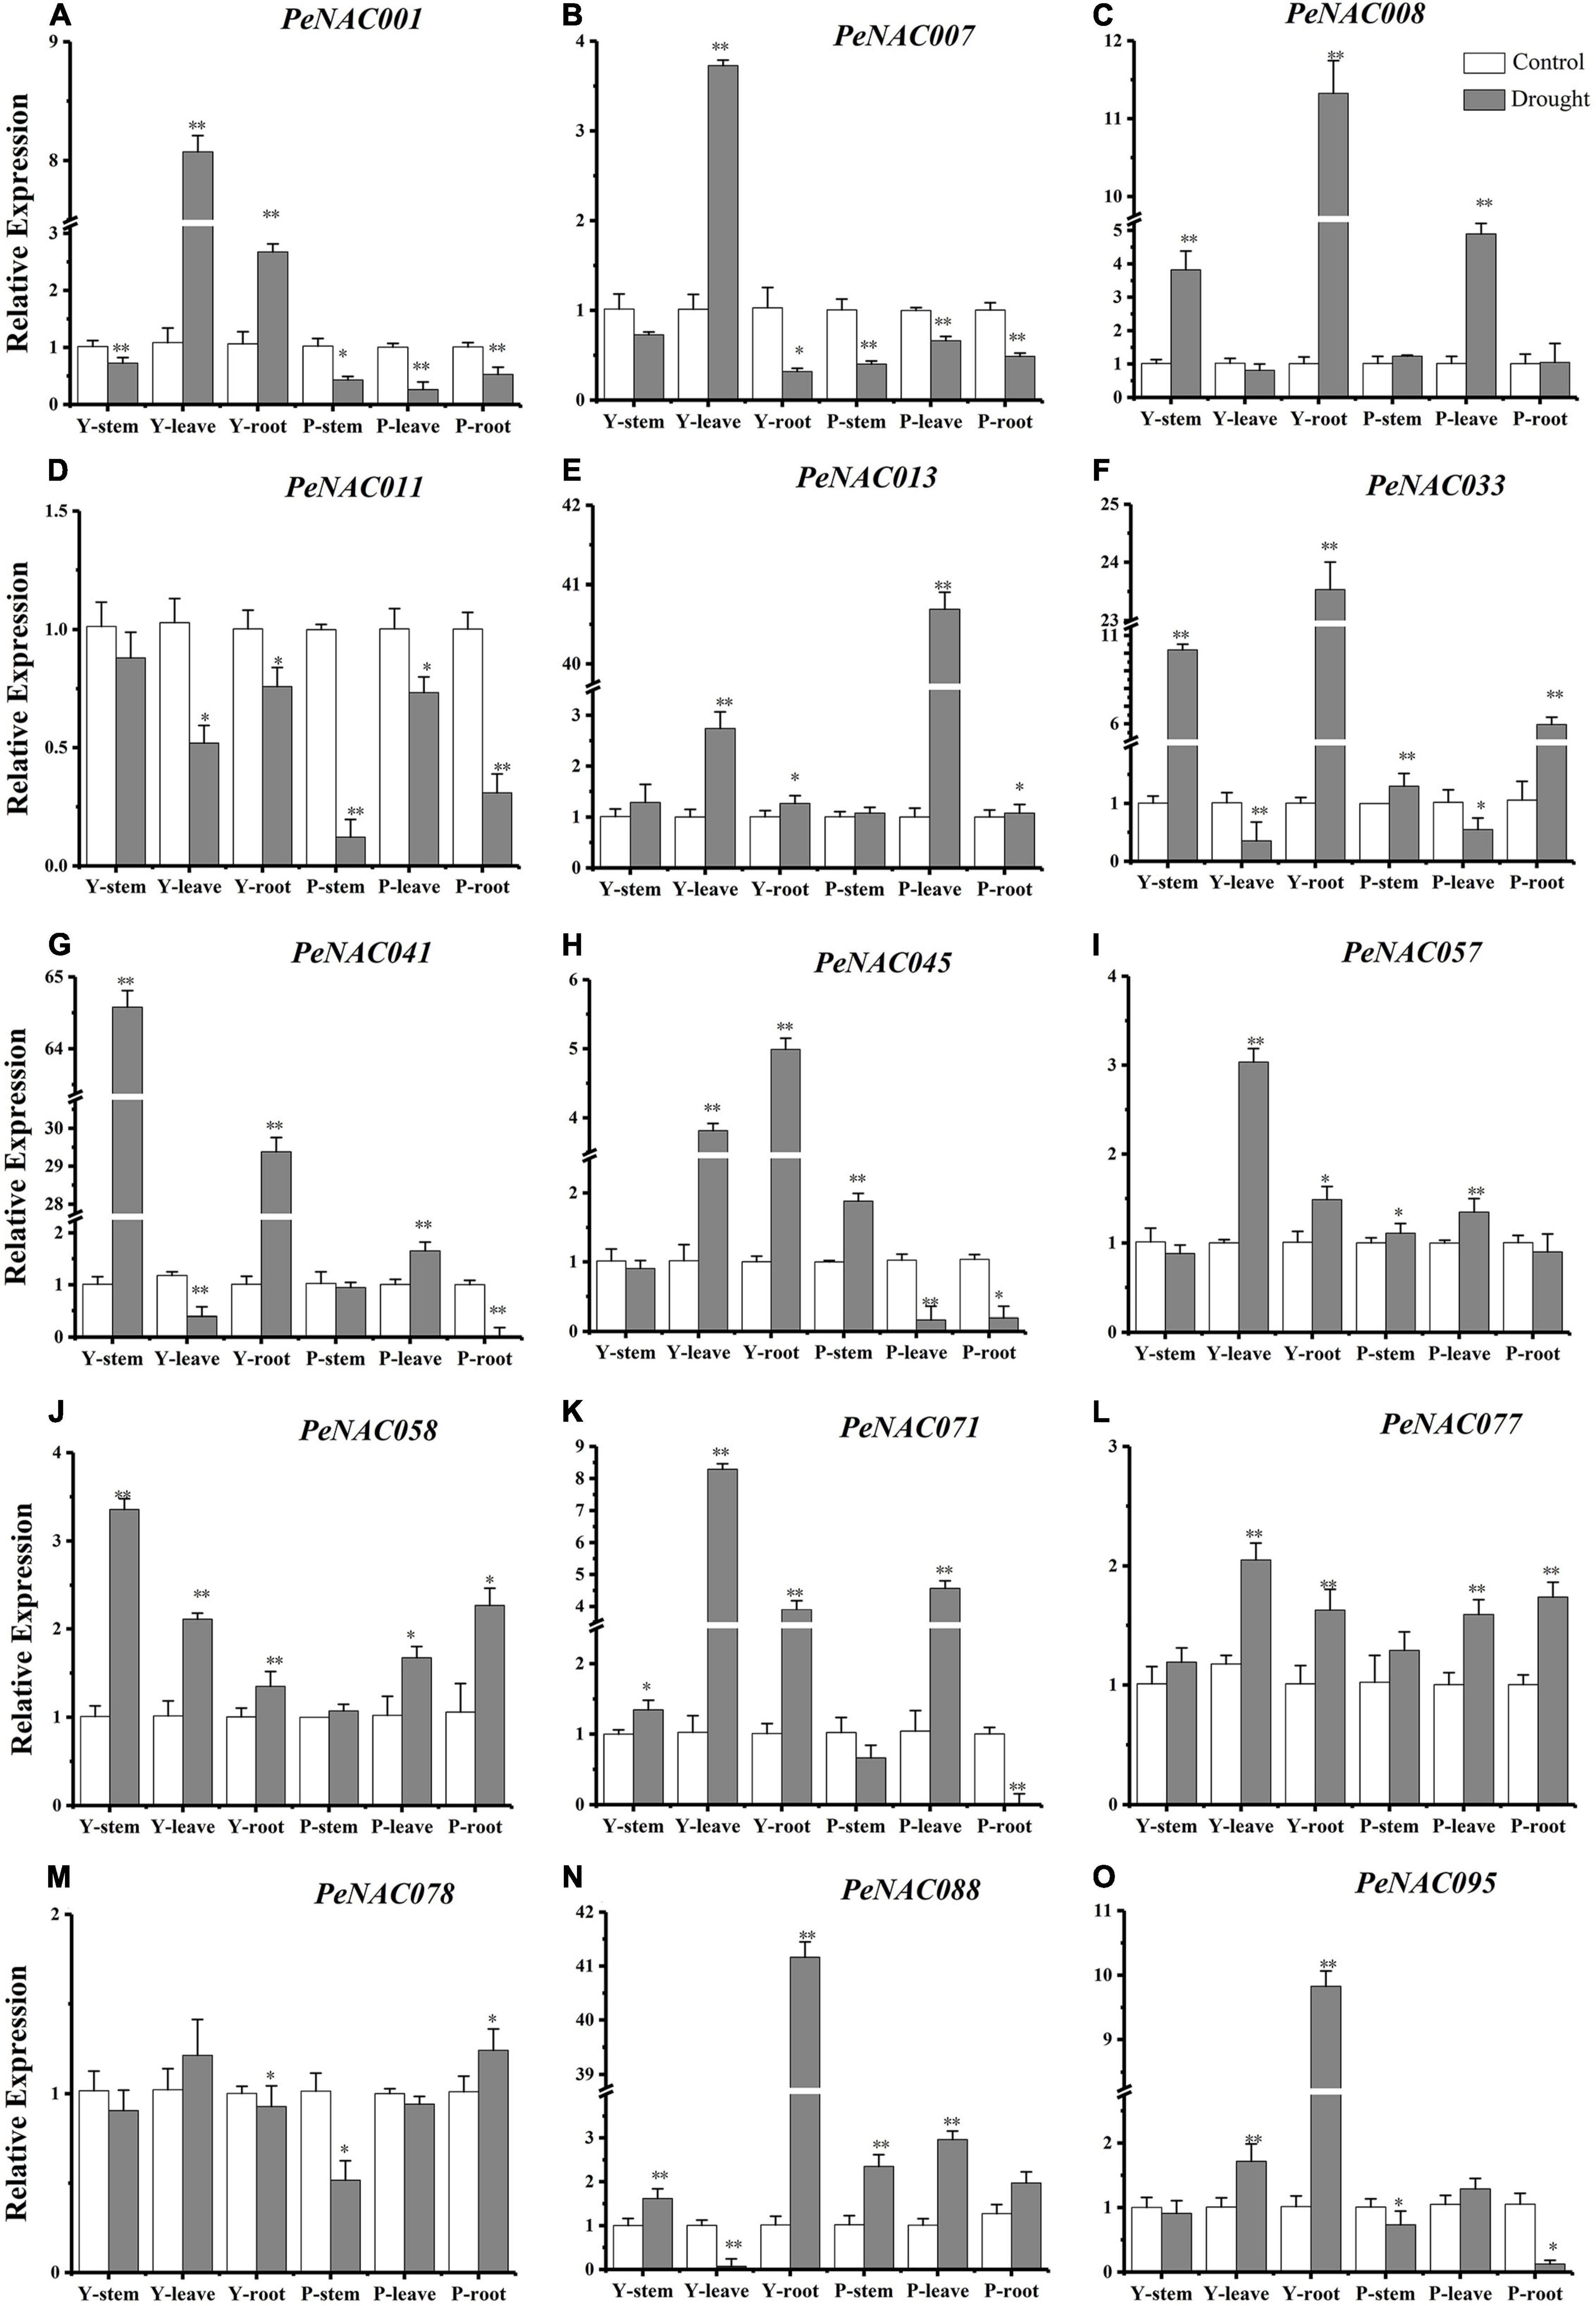
Figure 11. The relative expressions of PeNAC genes in the stem, root, and leave tissues of yellow and purple passion fruits under drought stress and control conditions (A–O). The relative gene expression levels were calculated using the 2–ΔΔCt. Vertical bars represent means ± SD (n = 3). The * and ** show significance at p ≤ 0.05 and p ≤ 0.01. Y represents the yellow passion fruit; P represents the purple passion fruit; and dpi represents the days post-inoculation.
In purple fruit, the expression results showed that 75% PeNAC (79/105), 83% PeNAC (88/105), 73% PeNAC (77/105), and 75% PeNAC (79/105) genes were expressed in fruitlet, green, veraison and ripening stages. In the comparison of different stages, the ripening stage had the highest expression 10.07 FC (PeNAC94) followed by veraison stage 9.61 FC (PeNAC100), fruitlet stage 9.16 FC (PeNAC100), and green stage 7.44 FC (PeNAC100) respectively. A maximum of 35 PeNAC genes (44%) had ≥2 FC expression levels in the fruitlet stage, followed by 33 PeNAC genes (37%) in the green stage, 24 PeNAC genes (31%) in the veraison stage, and a minimum of 22 PeNAC (27%) at the ripening stage of purple fruit (Figure 10B and Supplementary Table 13). In conclusion, overall, the purple PeNAC genes had the highest expressions compared with yellow fruit. The ripening stage had the highest expression compared with other developmental stages. The genes including PeNAC014, PeNAC063, PeNAC064, PeNAC085, PeNAC094, PeNAC100, and PeNAC101 with constant and highest expressions (≥5 FC) in all developmental stages of both cultivars suggested that these genes may play important roles in fruit development, which can be used for further functional studies.
The PeNAC genes expressions in roots of purple, leave and peel tissues of yellow and purple passion fruits were detected based on FPKM expression values. The FPKM expression values were converted to log2FC and visualized into a heatmap (FPKM and log2FC values have been provided in Supplementary Table 14). All 105 PeNAC genes showed as diverse expressions in different tissues of both cultivars. The expression result showed that among 105 PeNAC genes, overall, 85% (90/105) PeNAC genes were expressed in all tested tissues, of which, 80% (84/105) genes were expressed in yellow and purple leaves, 79% (83/105) PeNAC were expressed in yellow and purple root, and only 33% (35/105) PeNAC genes were expressed in the yellow and purple peel. Peel tissue had the highest expression levels (PeNAC079, 9.42 FC) followed by leaves (PeNAC011, 7.84 FC) and root (PeNAC100, 7.38 FC), whereas, the genes including PeNAC001, PeNAC016, PeNAC025, PeNAC026, PeNAC036, PeNAC044, PeNAC046, PeNAC048, PeNAC051, PeNAC070, PeNAC073, PeNAC080, PeNAC088, PeNAC096, and PeNAC102 were not expressed in all tissues suggesting that they may not play role under these conditions (Figures 10A,B and Supplementary Table 14).
In yellow and purple leave tissues under CS and NT conditions, the expression results showed that 77% PeNAC (81/105), 74% PeNAC (78/105), 72% (76/105), and 71% (75/105) genes were expressed in purple leaf-NT, purple leaf-CS, yellow-leaf-NT, and yellow leaf-CS conditions. In comparison between cultivars, the yellow leaf-NT had the highest expression 7.84 FC (PeNAC011) followed by purple leaf-NT 7.41 FC (PeNAC100), yellow leaf-NT 7.20 FC (PeNAC100), and purple leaf-CS 6.80 FC (PeNAC001). A maximum of 42 PeNAC genes (55%) had ≥2 expression levels in yellow leaf-NT followed by 41 PeNAC genes (50%) in purple leaf-NT, 37 PeNAC genes (49%) in yellow leaf-CS, and a minimum of 34 PeNAC genes (43%) in the yellow leaf-NT conditions (Figure 10A and Supplementary Table 14). In purple root tissues under L and D conditions, the results showed that 78% PeNAC (82/105) and 77% PeNAC (81/105) genes were expressed in purple roots under L and D conditions. Purple root under the L condition has the highest expression 7.38 FC (PeNAC100) compared with D condition 6.72 FC (PeNAC085). Purple root under D condition had a maximum of 40 PeNAC genes (49%) with ≥2 FC expression compared with L condition 37 PeNAC genes (45%) (Figure 10B and Supplementary Table 14).
In yellow and purple peel tissue, the expression results showed that 33% PeNAC (35/105) and 31% PeNAC (33/105) genes were expressed in yellow and purple peel respectively. Purple peel had the highest expression 9.42 FC (PeNAC079) compared with yellow peel 7.55 FC (PeNAC014), whereas among the expressed genes, yellow peel had the highest number of PeNAC genes 25 (71%) with ≥2 FC expression levels than purple peel PeNAC genes 23 (69%) (Figures 10A,B and Supplementary Table 14). Taken together, the results showed that the highest number of genes were expressed in leave tissues followed by root and least in peel tissue, while purple peel tissue had the highest expression levels (PeNAC079, 9.42 FC) followed by yellow leaves-CS (PeNAC011, 7.84 FC) and purple root-L (PeNAC100, 7.38 FC) conditions. The genes including PeNAC011, PeNAC014, PeNAC042, PeNAC079, PeNAC085, PeNAC094, and PeNAC100, etc., with ≥6 FC expression levels in all tissues of both cultivars indicate that these genes might have important roles in regulating mechanism and can be used for further functional studies.
It has been reported that NAC genes play a crucial role under drought stress conditions and the expression levels of NAC genes under drought stress conditions. The qRT-PCR expression profiles of selected PeNAC genes in stems, roots, and leave tissues of yellow and purple passion fruit under drought stress conditions were investigated (Figure 11). The results revealed that, overall, in both, all the tested PeNAC genes exhibited increased expression profiles under drought stress conditions compared with controls except the PeNAC0011 gene (Figure 11). Among tissues and cultivars, the significantly highest expressions were found in Y-stem (PeNAC041 > 64-fold, Figure 11G) followed by Y-root (PeNAC088 > 40-fold, Figure 11N), P-leave (PeNAC013 > 40-fold, Figure 11E), and Y-root (PeNAC008 and PeNAC033 > 11-fold, Figures 11C,F), whereas the downregulated/lowest expressions in all tissues of both cultivars were found in PeNAC011 and PeNAC078 genes (Figures 11D,M) respectively. In PeNAC095 (Figure 11O), the expression in yellow root tissue was significantly higher (>9-fold) than in yellow and purple roots, leaves, and stems. In comparison to the tissues of both cultivars, the expressions of PeNAC001 (Figure 11A) and PeNAC007 (Figure 1B) genes were significantly down-regulated in all purple tissues under drought conditions compared to yellow and controls.
The expression levels of the PeNAC077 gene in all tissues were relatively stable, ranging from 1 to 2-fold (Figure 12L). Compared with controls, the expressions of most of the tested PeNAC genes such as PeNAC013 (Figure 12E), PeNAC033 (Figure 12F), PeNAC41 (Figure 12G), PeNAC88 (Figure 12N), and PeNAC095 (Figure 12O) showed an obvious upward trend under drought stress conditions. In conclusion, the expression levels of yellow passion fruit tissues were generally higher than purple tissue under drought stress conditions compared with controls (Figure 12). Genes such as PeNAC008, PeNAC013, PeNAC033, PeNAC041, and PeNAC088 were highly expressed (>10-fold) in passion fruit (Figure 12), suggesting that these genes may play an important role in passion fruit drought stress and provide evidence for further functional studies.
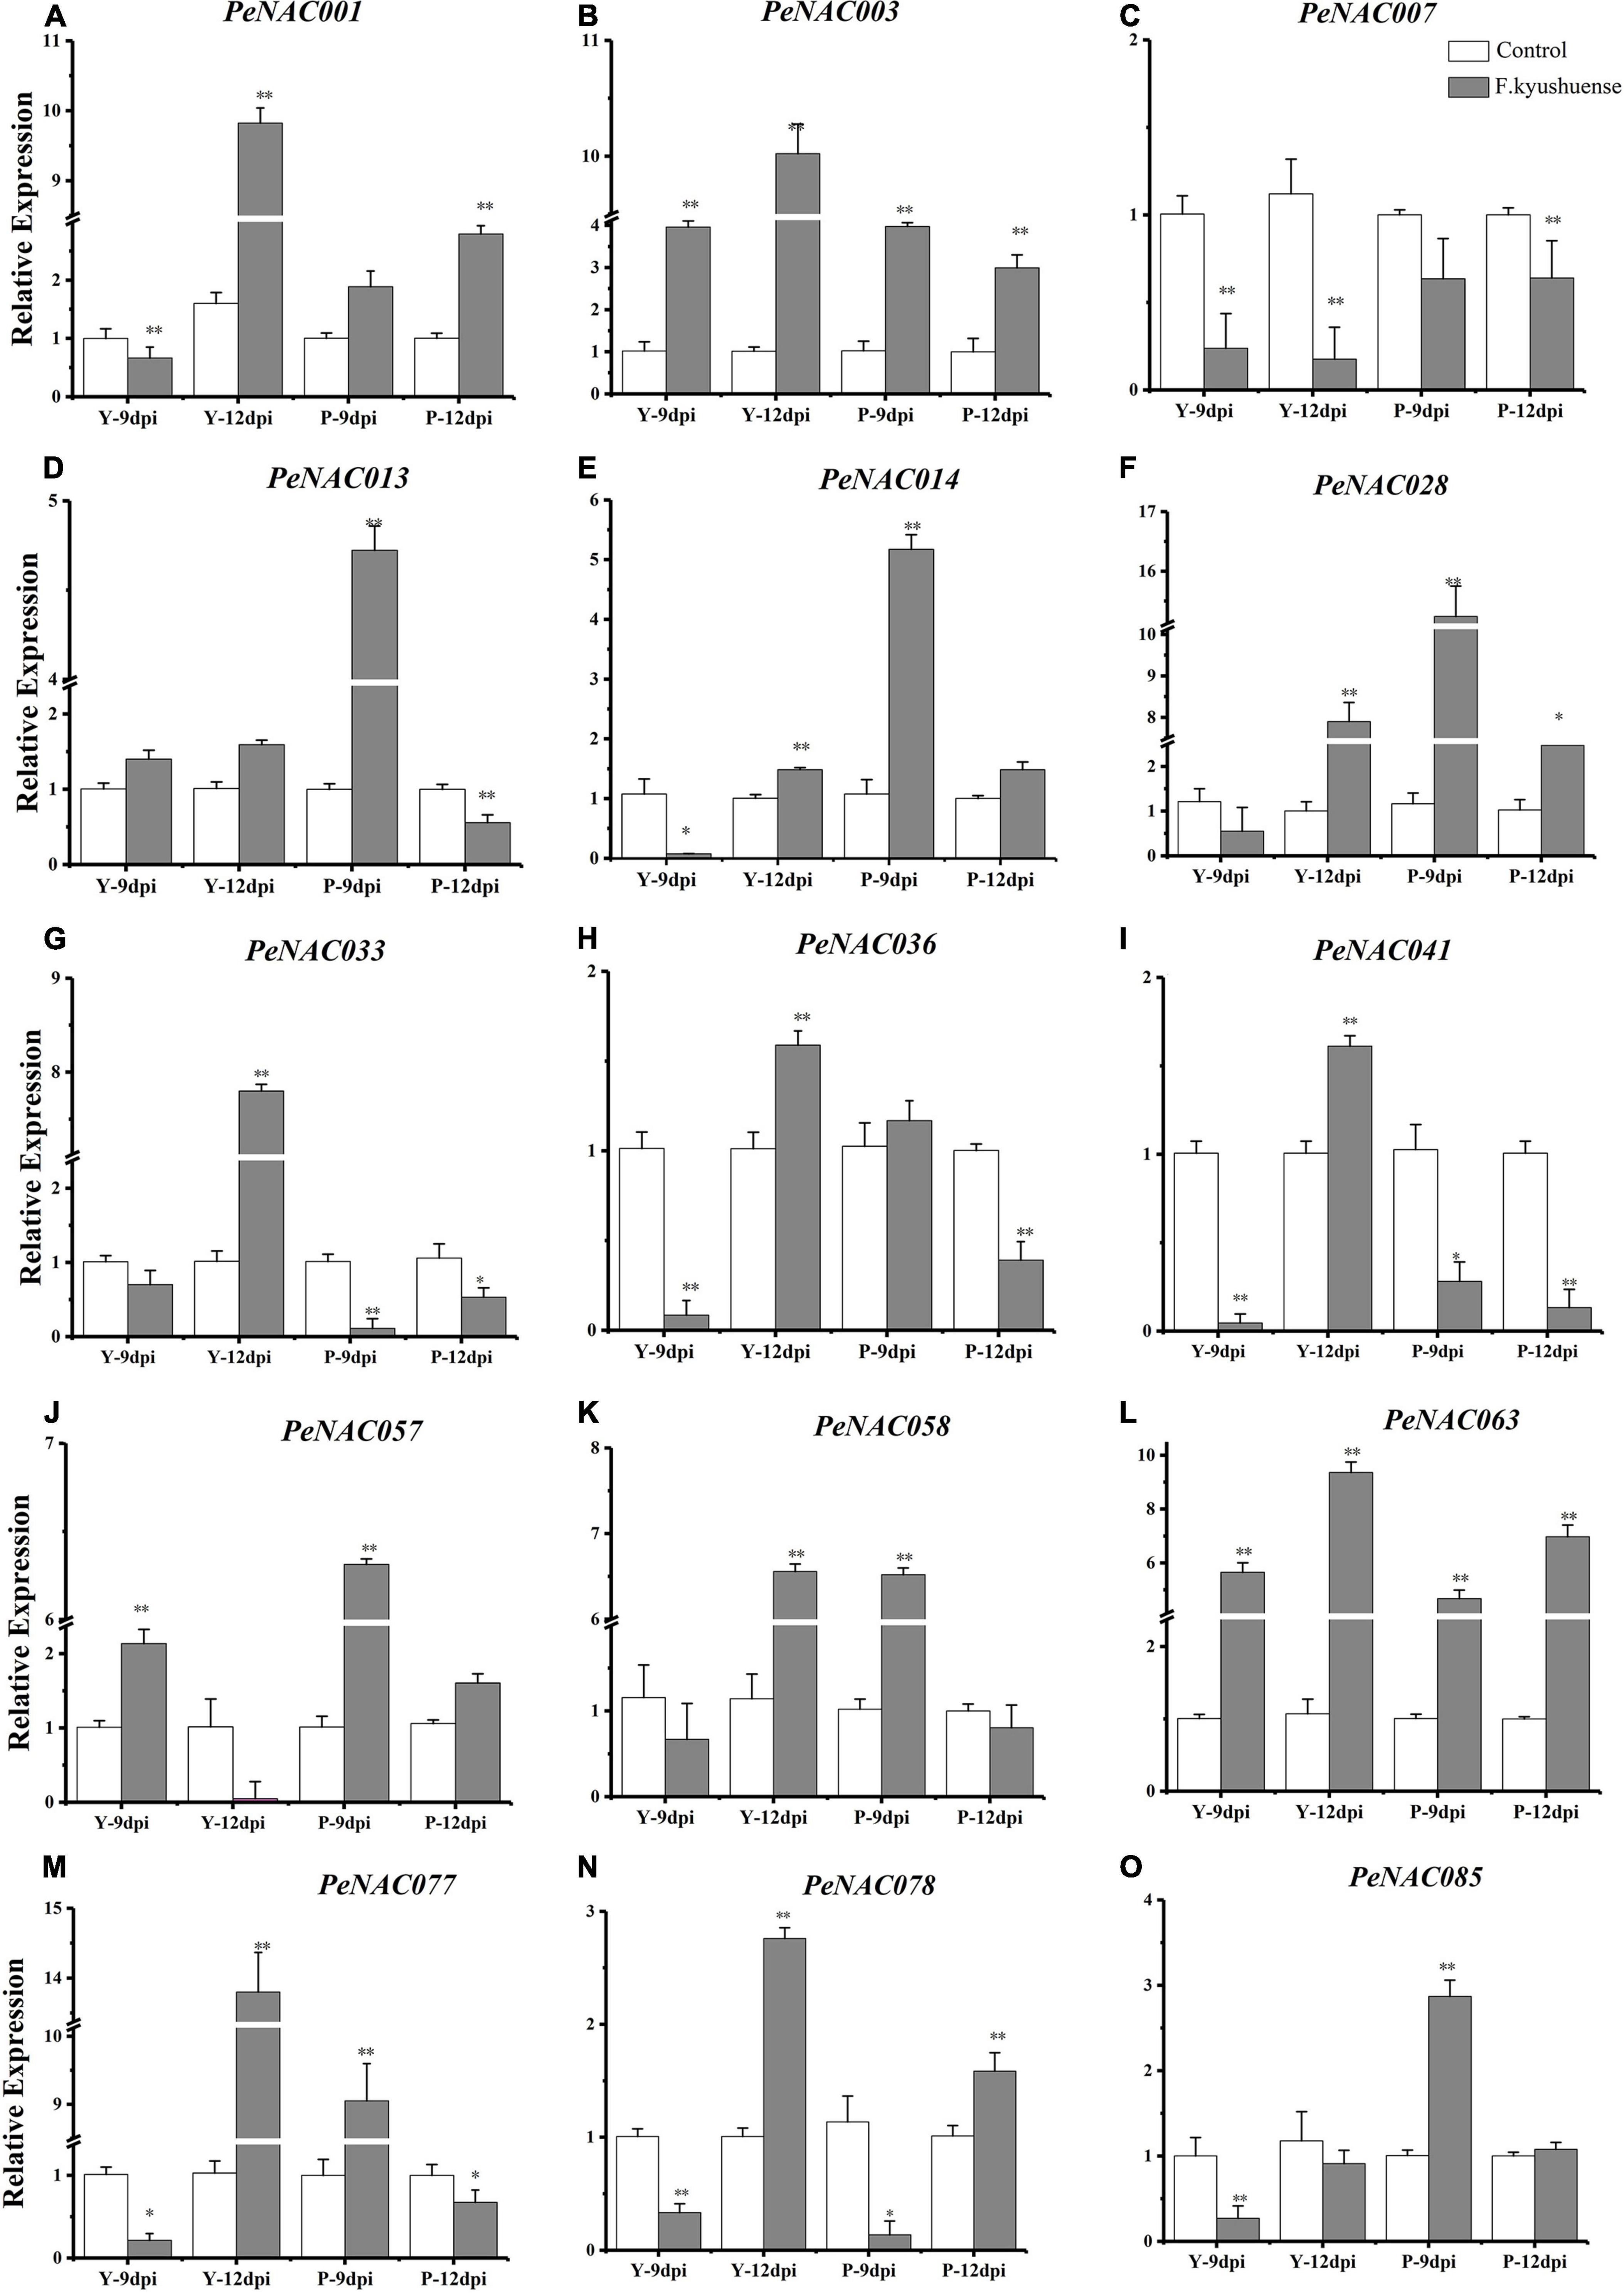
Figure 12. The relative expressions of PeNAC genes in peel tissues of yellow and purple passion fruits under F. kyushuense fungal biotic stress and control conditions (A–O). The relative gene expression levels were calculated using the 2–ΔΔCt. Vertical bars represent means ± SD (n = 3). The* and ** show significance at p ≤ 0.05 and p ≤ 0.0. Y represents the yellow passion fruit; P represents the purple passion fruit; and dpi represents the days post-inoculation.
The possible role of PeNAC genes in yellow and purple passion fruit under biotic stress by a pathogenic fungus (F. kyushuense) at qRT-PCR expression levels was investigated (Figure 11). The results revealed that, overall, in both cultivars, all the tested PeNAC genes exhibited increased expression profiles under fugal biotic stress conditions compared with controls, except for the PeNAC007 gene (Figure 11). The tested PeNAC genes showed different expression levels in both cultivars at 9 dpi and 12 dpi compared to controls. In comparison of both cultivars; in yellow passion fruit, the expression profiles of PeNAC genes at 12 dpi were significantly higher than that at 9 dpi including PeNAC001 (Figure 11A), PeNAC003 (Figure 11B), PeNAC033 (Figure 11G), PeNAC036 (Figure 11H), PeNAC041 (Figure 11I), PeNAC063 (Figure 11L), PeNAC077 (Figure 11M), and PeNAC078 (Figure 11N). However, in purple fruits, the expression levels of PeNAC genes were generally higher at 9 dpi than at 12 dpi including PeNAC013 (Figure 11D), PeNAC014 (Figure 11E), PeNAC028 (Figure 11F), PeNAC057 (Figure 11J), and PeNAC085 (Figure 11O), respectively.
Taken together, these results suggest that PeNAC genes in purple fruits were more active at 9 dpi fungal infection, whereas in yellow fruits were more active after a longer infection time at 12 dpi. There were significant differences in the expression levels of almost all PeNAC genes compared with controls, with a clear upward trend under F. kyushuense infection except PeNAC007 (Figure 11C). The PeNAC007 might not play a role under biotic stress conditions in passion fruit. Genes such as PeNAC001, PeNAC003, PeNAC028, PeNAC033, PeNAC057, PeNAC058, PeNAC063, and PeNAC077 were highly upregulated (log2FC > 5, Figure 11) under F. kyushuense stress conditions in passion fruit, indicating that these genes may play an important role in the resistance of passion fruit to biotic stresses and provide evidence for further exploration of functional studies.
Plant TFs are DNA-binding proteins that play an important role in different plant processes (Baillo et al., 2019). To date, different TF families have been identified and functionally characterized on genome levels in different plant species. NAC is one of the largest TF families that involves in the regulation of plant senescence, metabolism, development, morphogenesis, signal transduction, and stress responses (Singh et al., 2021). Genome-wide NAC gene family has been reported in numerous plant species and members of NAC have been functionally characterized in different plants including Arabidopsis (Tran et al., 2004), rice (Ooka et al., 2003), barley (Murozuka et al., 2018), maize (Wang G. et al., 2020), and peanut (Li P. et al., 2021) respectively. However, there is no comprehensive information regarding the NAC gene family in passion fruit. In this study, a total of 105 NAC genes were identified and characterized in the passion fruit genome (Table 1). All 105 NAC genes were unequally distributed on all nine-passion fruit chromones, while chromosome one contained the maximum number of NAC genes (46%) (Table 1 and Figure 4).
It has been reported that within the same gene family, the distribution of genes on different chromosomes may be due to their involvement in multiple functions (Ahmad et al., 2021). The 105 PeNAC genes identified in the passion fruit genome were almost similar to the number of NAC genes in apricot (102 NAC) (Xu et al., 2021), pepper (104 NAC) (Diao et al., 2018), and cacao (102 NAC) (Shen et al., 2019), while some species have a larger number of NAC genes including rice (151 NAC) (Ooka et al., 2003), poplar (163 NAC) (Hu et al., 2010), apple (180 NAC) (Su et al., 2013), and barley (167 NAC) (Murozuka et al., 2018), whereas some species have a smaller number of NAC genes including maize (87 NAC) (Wang G. et al., 2020), pitaya (64 NAC) (Hu et al., 2022), and eggplant (90 NAC) (Wan et al., 2021).
The diversity in the number and structural features of the same gene family members in different species may be due to differences in genome size and long-term plant evolution (Wang P. et al., 2018). All 105 PeNAC genes contained NAM domains and are consistent with previous reports on Arabidopsis apple and rice (Tran et al., 2004; Gao et al., 2010; Saad et al., 2013; Su et al., 2013), moreover, Trupkin et al. (2019) mentioned that genes containing NAM domains involved in plant growth and development. All the 105 PeNAC genes were predicted to localize to the nucleus (Table 1) and Duan et al. (2017) reported that TFs localized to the nucleus activate the responses including the reactive oxygen species homeostasis, osmolyte production and detoxification under different stresses. A phylogenetic tree was constructed using A. thalian (AtNAC), P. trichocarpa (PNAC), and P. edulis (PeNAC) proteins and divided into 15 groups (NAC-a to NAC-o) based on P. trichocarpa PNACs (Hu et al., 2010). In the G1 and G5 groups, 16 and 15 PeNAC proteins were orthologous to AtNAC019 and AtNAC056, respectively, suggesting that PeNAC proteins may play a role in drought tolerance, fruit ripening, hormone signaling, and secondary wall synthesis in the plant (Rohrmann et al., 2012; Wang J. et al., 2018). In the G2 group, 14 PeNAC proteins were homologous to AtNAC091, and these NAC proteins may be involved in membrane and plant stress associated (Sun et al., 2013). In the NAC-I, NAC-j, and NAC-k groups, 15 and 11 PeNAC proteins were orthologous with AtNAC003, AtNAC008, and AtNAC069, respectively, and these NAC proteins were involved in the DNA damage response, cold, heat, drought tolerance stresses, and development (Liu et al., 2013; Miao et al., 2021).
The conserved motif results revealed that there were at least 3 to 8 conserved motifs (Motif 1–8) in all of 105 PeNAC proteins (Figure 2B), indicating that PeNAC proteins have a remarkably conserved protein structure. These results are consistent with the findings of apricot and pitaya NAC by Xu et al. (2021), Hu et al. (2022), which also reported a distinct number of conserved motifs. Moreover, the majority of the conserved motifs were present in the N-terminus of PeNAC and Xu et al. (2021) mentioned that the N-terminus is an important part of the NAC proteins, as previously shown in potato (Koch et al., 2000). Most of the PeNAC had three exons or two introns (Figure 2C) and genes within the same phylogenetic clade (Figure 2A) have a similar number of exons. These results are consistent with pitaya (Hu et al., 2022), kiwifruit (Jia et al., 2021), and cucumber (Liu et al., 2018) NAC genes suggesting that the genetic makeup of passion fruit NAC genes are similar with the previously reported species.
The PeNAC cis-regulatory element analysis identified distinct plant developmental and stress response elements (Figure 3). The following cis-elements including ACE, G-box, AE-box, ARE, LTR, MBS, ABRE, TGACG-motif, and CAT-motif were found abundantly in PeNAC genes indicating that PeNAC may play an important role in plant development, hormones, and stress responses. Logemann and Hahlbrock (2002) demonstrated the important role of ACE in pathogen defense. Wang C. et al. (2020) reported that ACE promoted the response to ethylene stress and inhibition of ethylene. Liu et al. (2016) mentioned that the G-box participates in light-responsive processes. Maruyama et al. (2012) reported that ABRE cis-acting elements regulate the expression of dehydration- and salt-responsive genes in Arabidopsis and rice. Kaur et al. (2017) reported that genes containing MBS cis-element play an important role under drought stress. Levasseur and Pontarotti (2011) mentioned that gene duplication is the basis for the generation of new genes and functions, and is a major driving force in the evolution of genomes and gene families.
The PeNAC gene duplication analysis was performed and found less than 1 Ka/Ks values, indicating a purifying selection with 6.62 to 221.92 mya duplication process between tandem and segmentally duplicated PeNAC gens. These results are in constant with preceding reports such as Jin et al. (2017) reported that the NAC gene family experienced a divergence rate of 145 mya in dicotyledonous and grass plants, furthermore, Tuskan et al. (2006) reported that a whole-genome duplication occurred in Populus at 60–65 mya. Moreover, 12 PeNAC gene pairs were segmental duplicated and 11 gene pairs were tandem duplicated, which are in consistent with Li X. et al. (2021) and Li P. et al. (2021) reports, who also found the segmental and tandem duplicated genes in genome-wide NAC family analysis. In addition, a comprehensive syntenic analysis of P. edulis NAC with A. thaliana, Z. jujuba, T. cacao, A. hypogaea, and C. sativa NAC identified 284 NAC gene pairs, of which, the maximum 86 NAC gene pairs were between P. edulis and A. hypogaea (38 PeNAC-61 AhNAC).
Moreover, multicollinearity analysis of P. edulis NAC genes found the highest collinearity with P. trichocarpa (132 orthologs) followed by A. hypogaea (100 orthologs). These results are consistent with Ma et al. (2021) that the P. edulis genome maximum likelihood analysis revealed a close relationship between P. edulis and P. trichocarpa orthologous genes, indicating that these orthologous may share the same ancestors and retain corresponding functions. The protein–protein interaction network analysis provides information for specific gene family functions associated with known proteins (Piya et al., 2014). In present study protein–protein interaction analysis revealed that most of the PeNAC proteins have homology and strong interactions with known Arabidopsis proteins including AtNAC083, AtNAC086, AtRD26, AtVND1/7, AtNAC1, AtNAC007, AtCUS2/3, AtNAC073, AtNST1, AtXND1, AtNAC014, and AtNAC028 suggesting that PeNAC may perform similar functions. The highest homology was found between PeNAC035, PeNAC043, PeNAC067, PeNAC100, and AtNAC083 proteins which are consistent with previous reports. For example, it has been reported that AtNAC083 is a crucial transcriptional activator that play a role in response to salt stress response, leaf aging process, and xylem vessel formation (Suyal et al., 2014).
Wen-Fang et al. (2015) proposed that NAC83 might play an important role in response to abiotic stresses in pomelo (Citrus maxima). Yao et al. (2020) reported that NAC86 is involved in stress responses in Populus simonii × P. nigra. Le Hénanff et al. (2013) results provide evidence that VvNAC1 regulates grapevine development and stress responses to pathogens in the grapevine (Vitis vinifera). Protein 3D structure prediction is recognized as a reliable analytical technique to better understand the protein molecular functions (Kelley et al., 2015). In the current study, most of the PeNAC proteins showed similar 3D structures with the reference templates such as c3ulxA, which is considered as a DNA binding protein and annotated as stress-induced NAC1 in rice (Chen et al., 2011) and d1ut7a template annotated as a NAC domain (Ernst et al., 2004). The current findings are consistent with Wang et al. (2021), who also reported similar 3D structures of NAC in Chrysanthemum nankingense. The 3D modeling results discovered that PeNAC proteins possessed similar 3D structures, indicating that PeNAC proteins may belong to similar ancestors or underwent purifying selection to keep stabilization during the long-term evolution after the initial divergence (Zhu et al., 2019).
It is well known that under specific circumstances, miRNAs can directly or indirectly activate and repress gene expression by playing an important role in the regulation of gene expression (O’Brien et al., 2018). In recent years, the identification and functional characterization of miRNAs have been reported in numerous plant species including Arabidopsis (Palatnik et al., 2007; Allen et al., 2010), rice (Jiang et al., 2019), Brassica napus (Wen et al., 2021), passion fruit (Paul et al., 2020), soybean (Glycine max) (Song et al., 2011), and apple (Kaja et al., 2015), which were involved in different metabolism, development, and environmental stresses. In current study, 17 ped-miRNAs belonging to 11 different miRNAs families were identified that targeted 25 PeNAC genes. The ped-miR164 family targeted the most eight PeNAC genes and has been reported to be involved in abiotic stress in P. euphratica (Lu et al., 2017), drought stress in rice (Fang et al., 2014), the resistance of wheat to stripe rust (Feng et al., 2014), and fruit ripening (Wang W. Q. et al., 2020). The ped-miR166 family targeted four PeNAC genes and has been reported to play important role in response to abiotic and biotic stresses in soyabean (Li et al., 2017), shoot apical meristem and floral development in Arabidopsis (Jung and Park, 2007), cold stress in tomato (Valiollahi et al., 2014) and cadmium tolerance and accumulation in rice (Ding et al., 2018).
Moreover, the ped-miR171b-3p, ped-miR319p, and ped-miR157a-5p targeted at least one PeNAC gene. Huang et al. (2019) reported that miR171 and miR319 play a crucial role in citrus adaptation to long-term B toxicity by targeting MYB. He et al. (2018) reported that miR157 plays important role in shoot morphogenesis of Arabidopsis, iron deficiency responses in tomato (Zhu et al., 2022), and fruit development in pineapple (Ananas comosus) (Yew and Kumar, 2011). These findings suggested that the identified ped-miRNAs may play vital roles in combating multiple functions in plant development and stresses by altering the transcriptional level of PeNAC genes, however further functional studies are needed. Plant TFs play an important role in plant growth, development, and response to different stresses (Joshi et al., 2016; Sharif et al., 2021). Different TFs were identified in the promoter regions of PeNAC genes including BBR-BPC, AP2, bHLH, bZIP, Dof, WRKY, ERF, and MYB (Figure 8). The highly enriched TF families were ERF, BBR-BPC, MIKC-MADS, and bZIP respectively. Xie et al. (2019) mentioned that AP2/ERF is involved in hormone and stress responses in Arabidopsis. Wen et al. (2016) stated that Dof plays significant role in plant growth, development, and responses to stresses. Theune et al. (2019) reported that BBR-BPC is involved in flower development, size of the stem cell niche, and seed development. MIKE-MADS determines plant reproductive development (Teo et al., 2019). The bZIP TF is involved in plant developmental and physiological and stress responses (Corrêa et al., 2008).
The bHLH TFs are involved in plant growth and metabolism, photomorphogenesis, light signal transduction, and response to stresses (Sun et al., 2018). Katiyar et al. (2012) reported that MYB TFs play a key role in plant development, secondary metabolism, hormone signal transduction, and stress tolerance (Raza et al., 2022). The present findings are consistent with previous reports suggesting that PeNAC TFs may regulate plant growth, development, and stress responses while requiring further functional studies. The GO is mainly adapted to computational analysis and is used for the functionally annotate genes into distinct terms (Martin et al., 2004). KEGG resources become comprehensive knowledge for functional understanding and practical application of genomic information (Kanehisa et al., 2017). GO and KEGG annotation and enrichment analyses identified highly enriched terms in PeNAC genes (Figure 9) including transcription regulator activity, DNA binding, membrane-bounded organelle, organic substance biosynthetic process, primary metabolic and regulation of the biological process. The highly enriched KEGG pathways were associated with terpenoid-quinone biosynthesis, phosphatidylinositol signaling system and metabolism. These results are in consistent with previous reports on NAC by Gong et al. (2019), Yan H. et al. (2021), Mir et al. (2022).
Gene expression profiling provides important clues to determining the gene functions (Zhang et al., 2018). It has been reported that some NAC genes are specifically expressed in certain tissues and play crucial roles in plant growth and development (Shan et al., 2020). In the current study, diverse expression levels of PeNAC genes were found between passion fruit leaves, peels, pulps, and roots tissues (Figure 10). Among the expressed PeNAC genes, the highest 95 (90%) PeNAC genes were expressed in pulps followed by 84 (80%) PeNAC genes in leaves, 83 (79%) PeNAC genes in roots, and only 35 (33%) PeNAC genes were expressed in peels (Figure 10). Our results are consistent with Li et al. (2020), who also found the highest expressions of NAC genes in banana (Musa acuminata) pulp compared with other tissues. In addition, PeNAC014, PeNAC062, PeNAC082, and PeNAC094 showed high expression levels in passion fruit peel and pulp. Similarly, PeNAC010, PeNAC014, PeNAC039, PeNAC053, PeNAC075, and PeNAC100 had the highest expression levels in passion fruit leaves and roots. Zhang et al. (2018) also found that 13 of 128 NAC genes were differentially expressed at fruit growth and developmental stages in apple. Li X. et al. (2021) reported that out of 114 walnut JmNAC genes, 17 and 14 JmNAC genes were specifically expressed in walnut exocarp and embryo tissues.
It has been reported that NAC family members also play significant roles in plant responses to biotic and abiotic stresses (Tran et al., 2004; Huang et al., 2015; Shao et al., 2015; Hu et al., 2022). The possible role of PeNAC genes in passion fruit under biotic (F. kyushuense) and drought stress conditions were analyzed at qRT-PCR expression levels. Nearly, all the tested PeNAC genes were either positively or negatively regulated under both stress conditions (Figures 11, 12). Genes such as PeNAC001, PeNAC003, PeNAC028, PeNAC033, PeNAC057, PeNAC058, PeNAC063, and PeNAC077 were highly upregulated (>5-fold) at 9 and 12 dpi in yellow and purple passion fruit under F. kyushuense stress (Figure 12). Moreover, under drought stress conditions, among tissues and cultivars, the significantly highest expression levels were found in Y-stem (PeNAC041, >64-fold, Figure 11G) followed by Y-root (PeNAC088, >40-fold, Figure 11N), P-leave (PeNAC013, >40-fold, Figure 11E) and Y-root (PeNAC008 and PeNAC033, >11-fold, Figures 11C,F), whereas PeNAC007 and PeNAC011were not expressed under F. kyushuense stress and drought stress conditions in both cultivars (Figure 11D), respectively.
Similar results were found by Yan H. et al. (2021) in sweet potato (Ipomoea triloba and I. trifida) ItbNAC and ItfNAC genes that showed diver expressions under drought stress conditions. Five genes including ItbNAC110, ItbNAC114, ItfNAC15, ItfNAC28, and ItfNAC62 were highly upregulated (>20-fold) under drought stress. Tran et al. (2004) reported that the ANAC019, ANAC055, and ANAC072 genes expression were upregulated in Arabidopsis and SlNAC4 in tomato under drought stress (Zhu et al., 2014). Overexpression of OsNAC22 and OsNAC52 improved the drought and salt tolerance in rice (Gao et al., 2010; Hong et al., 2016), MdNAC1 in apple (Jia et al., 2019). Wang et al. (2009) reported that ATAF1 NAC TF negative regulated the defense responses against pathogens. TaNAC4 gene is involved in wheat response to biotic and abiotic stresses (Xia et al., 2010).
In this study, a comprehensive analysis identified 105 PeNAC genes in the passion fruit genome. The physicochemical properties, gene structures, evolution, and expression patterns of PeNAC genes were determined. All 105 PeNAC genes were phylogenetically divided into fifteen clades and intron-intron structure, conserved motifs, protein–protein interactions network and 3D structures were highly conserved suggesting their function conservation. Furthermore, syntenic analyses, TFs regulatory network analysis, GO, KEGG annotation, and putative miRNA prediction analysis were also performed. FPKM-based gene expression profiles of PeNAC genes exhibited a diverse expression in passion fruit root, peel, leaves, and pulp tissues. The qRT-PCR expression analysis suggested that most of the PeNAC genes were highly upregulated under Fusarium kyushuense and drought stress conditions compared to controls. These findings provide a foundation for future studies on the functions of PeNAC genes in passion fruit and other plants.
The original contributions presented in this study are included in the article/Supplementary material, further inquiries can be directed to the corresponding author.
FC, QY, and HMR contributed to conceptualization and validation. QY, HMR, JZ, and MS contributed to methodology. QY, BL, and HMR contributed to software. QY, BL, and TG contributed to formal analysis. QY and HMR contributed to data curation, writing, and original draft preparation. FC and HMR contributed to review and editing. FC contributed to supervision and funding acquisition. All authors have read and agreed to the published version of the manuscript.
FC’s research project was funded by the Department of Science and Technology, Fujian Province, China (2020N0004 and 2020S0056), the Engineering Research Center of Fujian Province University (G2-KF2006), and Fujian Agriculture and Forestry University Rural Revitalization Service Team Project (11899170127).
The authors declare that the research was conducted in the absence of any commercial or financial relationships that could be construed as a potential conflict of interest.
All claims expressed in this article are solely those of the authors and do not necessarily represent those of their affiliated organizations, or those of the publisher, the editors and the reviewers. Any product that may be evaluated in this article, or claim that may be made by its manufacturer, is not guaranteed or endorsed by the publisher.
The Supplementary Material for this article can be found online at: https://www.frontiersin.org/articles/10.3389/fpls.2022.972734/full#supplementary-material
Ahmad, H. M., Wang, X., Fiaz, S., Nadeem, M. A., Khan, S. A., Ahmar, S., et al. (2021). Comprehensive genomics and expression analysis of eceriferum (CER) genes in sunflower (Helianthus annuus). Saudi J. Biol. Sci. 28, 6884–6896. doi: 10.1016/j.sjbs.2021.07.077
Aida, M., Ishida, T., Fukaki, H., Fujisawa, H., and Tasaka, M. (1997). Genes involved in organ separation in Arabidopsis: An analysis of the cup-shaped cotyledon mutant. Plant Cell 9, 841–857.
Allen, R. S., Li, J., Alonso-Peral, M. M., White, R. G., Gubler, F., and Millar, A. A. (2010). MicroR159 regulation of most conserved targets in Arabidopsis has negligible phenotypic effects. Silence 1:18. doi: 10.1186/1758-907X-1-18
Asefpour Vakilian, K. (2020). Machine learning improves our knowledge about miRNA functions towards plant abiotic stresses. Sci. Rep. 10:3041. doi: 10.1038/s41598-020-59981-6
Bailey, T. L., Johnson, J., Grant, C. E., and Noble, W. S. (2015). The MEME suite. Nucleic Acids Res. 43, W39–W49.
Baillo, E. H., Kimotho, R. N., Zhang, Z., and Xu, P. (2019). Transcription factors associated with abiotic and biotic stress tolerance and their potential for crops improvement. Genes 10:771.
Chen, C., Chen, H., Zhang, Y., Thomas, H. R., Frank, M. H., He, Y., et al. (2020). TBtools: An integrative toolkit developed for interactive analyses of big biological data. Mol. Plant 13, 1194–1202. doi: 10.1016/j.molp.2020.06.009
Chen, Q., Wang, Q., Xiong, L., and Lou, Z. (2011). A structural view of the conserved domain of rice stress-responsive NAC1. Protein Cell 2, 55–63. doi: 10.1007/s13238-011-1010-9
Chou, K.-C., and Shen, H.-B. (2010). Plant-mPLoc: A top-down strategy to augment the power for predicting plant protein subcellular localization. PLoS One 5:e11335. doi: 10.1371/journal.pone.0011335
Collinge, M., and Boller, T. (2001). Differential induction of two potato genes, Stprx2 and StNAC, in response to infection by Phytophthora infestans and to wounding. Plant Mol. Biol. 46, 521–529. doi: 10.1023/a:1010639225091
Corrêa, L. G. G., Riaño-Pachón, D. M., Schrago, C. G., Vicentini Dos Santos, R., Mueller-Roeber, B., et al. (2008). The role of bZIP transcription factors in green plant evolution: Adaptive features emerging from four founder genes. PLoS One 3:e2944. doi: 10.1371/journal.pone.0002944
Diao, W., Snyder, J. C., Wang, S., Liu, J., Pan, B., Guo, G., et al. (2018). Genome-wide analyses of the NAC transcription factor gene family in pepper (Capsicum Annuum L.): Chromosome location, phylogeny, structure, expression patterns, cis-elements in the promoter, and interaction network. Int. J. Mol. Sci. 19:1028. doi: 10.3390/ijms19041028
Ding, Y., Gong, S., Wang, Y., Wang, F., Bao, H., Sun, J., et al. (2018). MicroRNA166 modulates cadmium tolerance and accumulation in rice. Plant Physiol. 177, 1691–1703. doi: 10.1104/pp.18.00485
Du, H., Yang, S.-S., Liang, Z., Feng, B.-R., Liu, L., Huang, Y.-B., et al. (2012). Genome-wide analysis of the MYB transcription factor superfamily in soybean. BMC Plant Biol. 12:106. doi: 10.1186/1471-2229-12-106
Duan, M., Zhang, R., Zhu, F., Zhang, Z., Gou, L., Wen, J., et al. (2017). A lipid-anchored NAC transcription factor is translocated into the nucleus and activates glyoxalase I expression during drought stress. Plant Cell 29, 1748–1772. doi: 10.1105/tpc.17.00044
Duval, M., Hsieh, T.-F., Kim, S. Y., and Thomas, T. L. (2002). Molecular characterization of AtNAM: A member of theArabidopsis NAC domain superfamily. Plant Mol. Biol. 50, 237–248. doi: 10.1023/a:1016028530943
Ernst, H. A., Nina Olsen, A., Skriver, K., Larsen, S., and Lo Leggio, L. (2004). Structure of the conserved domain of ANAC, a member of the NAC family of transcription factors. EMBO Rep. 5, 297–303. doi: 10.1038/sj.embor.7400093
Fang, Y., Xie, K., and Xiong, L. (2014). Conserved miR164-targeted NAC genes negatively regulate drought resistance in rice. J. Exp. Bot. 65, 2119–2135. doi: 10.1093/jxb/eru072
Feng, H., Duan, X., Zhang, Q., Li, X., Wang, B., Huang, L., et al. (2014). The target gene of tae-miR164, a novel NAC transcription factor from the NAM subfamily, negatively regulates resistance of wheat to stripe rust. Mol. Plant Pathol. 15, 284–296. doi: 10.1111/mpp.12089
Gao, F., Xiong, A., Peng, R., Jin, X., Xu, J., Zhu, B., et al. (2010). OsNAC52, a rice NAC transcription factor, potentially responds to ABA and confers drought tolerance in transgenic plants. lant Cell Tissue Organ Cult. 100, 255–262.
Gasteiger, E., Hoogland, C., Gattiker, A., Wilkins, M. R., Appel, R. D., and Bairoch, A. (2005). “Protein Identification and Analysis Tools on the ExPASy Server,” in The Proteomics Protocols Handbook, ed. J. M. Walker (Totowa, NJ: Humana Press).
Gong, X., Zhao, L., Song, X., Lin, Z., Gu, B., Yan, J., et al. (2019). Genome-wide analyses and expression patterns under abiotic stress of NAC transcription factors in white pear (Pyrus bretschneideri). BMC Plant Biol. 19:161. doi: 10.1186/s12870-019-1760-8
Han, Q., Song, Y., Zhang, J., and Liu, L. (2014). Studies on the role of the SlNAC3 gene in regulating seed development in tomato (Solanum Lycopersicum). J. Hortic. Sci. Biotechnol. 89, 423–429.
He, J., Xu, M., Willmann, M. R., Mccormick, K., Hu, T., Yang, L., et al. (2018). Threshold-dependent repression of SPL gene expression by miR156/miR157 controls vegetative phase change in Arabidopsis Thaliana. PLoS Genet. 14:e1007337. doi: 10.1371/journal.pgen.1007337
Hendelman, A., Stav, R., Zemach, H., and Arazi, T. (2013). The tomato NAC transcription factor SlNAM2 is involved in flower-boundary morphogenesis. J. Exp. Bot. 64, 5497–5507. doi: 10.1093/jxb/ert324
Hernández, Y., and Sanan-Mishra, N. (2017). miRNA mediated regulation of NAC transcription factors in plant development and environment stress response. Plant Gene 11, 190–198.
Hong, Y., Zhang, H., Huang, L., Li, D., and Song, F. (2016). Overexpression of a stress-responsive NAC transcription factor gene ONAC022 improves drought and salt tolerance in rice. Front. Plant Sci. 7:4. doi: 10.3389/fpls.2016.00004
Hu, R., Qi, G., Kong, Y., Kong, D., Gao, Q., and Zhou, G. (2010). Comprehensive analysis of NAC domain transcription factor gene family in Populus Trichocarpa. BMC Plant Biol. 10:145. doi: 10.1186/1471-2229-10-145
Hu, X., Xie, F., Liang, W., Liang, Y., Zhang, Z., Zhao, J., et al. (2022). HuNAC20 and HuNAC25, Two Novel NAC Genes from Pitaya, Confer Cold Tolerance in Transgenic Arabidopsis. Int. J. Mol. Sci. 23:2189. doi: 10.3390/ijms23042189
Huang, J.-H., Lin, X.-J., Zhang, L.-Y., Wang, X.-D., Fan, G.-C., and Chen, L.-S. (2019). MicroRNA sequencing revealed Citrus adaptation to long-term boron toxicity through modulation of root development by miR319 and miR171. Int. J. Mol. Sci. 20:1422. doi: 10.3390/ijms20061422
Huang, Q., Wang, Y., Li, B., Chang, J., Chen, M., Li, K., et al. (2015). TaNAC29, a NAC transcription factor from wheat, enhances salt and drought tolerance in transgenic Arabidopsis. BMC Plant Biol. 15:268. doi: 10.1186/s12870-015-0644-9
Hussey, S. G., Mizrachi, E., Spokevicius, A. V., Bossinger, G., Berger, D. K., and Myburg, A. A. (2011). SND2, a NAC transcription factor gene, regulates genes involved in secondary cell wall development in Arabidopsis fibres and increases fibre cell area in Eucalyptus. BMC Plant Biol. 11:173. doi: 10.1186/1471-2229-11-173
Jensen, M. K., Hagedorn, P. H., De Torres-Zabala, M., Grant, M. R., Rung, J. H., Collinge, D. B., et al. (2008). Transcriptional regulation by an NAC (NAM–ATAF1, 2–CUC2) transcription factor attenuates ABA signalling for efficient basal defence towards Blumeria graminis f. sp. hordei in Arabidopsis. Plant J. 56, 867–880. doi: 10.1111/j.1365-313X.2008.03646.x
Jensen, M. K., Rung, J. H., Gregersen, P. L., Gjetting, T., Fuglsang, A. T., Hansen, M., et al. (2007). The HvNAC6 transcription factor: A positive regulator of penetration resistance in barley and Arabidopsis. Plant Mol. Biol. 65, 137–150. doi: 10.1007/s11103-007-9204-5
Jia, D., Jiang, Q., Van Nocker, S., Gong, X., and Ma, F. (2019). An apple (Malus domestica) NAC transcription factor enhances drought tolerance in transgenic apple plants. Plant Physiol. Biochem. 139, 504–512.
Jia, D., Jiang, Z., Fu, H., Chen, L., Liao, G., He, Y., et al. (2021). Genome-wide identification and comprehensive analysis of NAC family genes involved in fruit development in kiwifruit (Actinidia). BMC Plant Biol. 21:44. doi: 10.1186/s12870-020-02798-2
Jiang, D., Zhou, L., Chen, W., Ye, N., Xia, J., and Zhuang, C. (2019). Overexpression of a microRNA-targeted NAC transcription factor improves drought and salt tolerance in Rice via ABA-mediated pathways. Rice 12:76. doi: 10.1186/s12284-019-0334-6
Jin, J., Zhang, H., Kong, L., Gao, G., and Luo, J. (2014). PlantTFDB 3.0: A portal for the functional and evolutionary study of plant transcription factors. Nucleic Acids Res. 42, D1182–D1187. doi: 10.1093/nar/gkt1016
Jin, X., Ren, J., Nevo, E., Yin, X., Sun, D., and Peng, J. (2017). Divergent evolutionary patterns of NAC transcription factors are associated with diversification and gene duplications in angiosperm. Front. Plant Sci. 8:1156. doi: 10.3389/fpls.2017.01156.
Jing, L., Li, J., Song, Y., Zhang, J., Chen, Q., and Han, Q. (2018). Characterization of a potential ripening regulator, SlNAC3, from Solanum lycopersicum. Open Life Sci. 13, 518–526. doi: 10.1515/biol-2018-0062
Joshi, R., Wani, S. H., Singh, B., Bohra, A., Dar, Z. A., Lone, A. A., et al. (2016). Transcription factors and plants response to drought stress: Current understanding and future directions. Front. Plant Sci. 7:1029. doi: 10.3389/fpls.2016.01029
Jung, J.-H., and Park, C.-M. (2007). MIR166/165 genes exhibit dynamic expression patterns in regulating shoot apical meristem and floral development in Arabidopsis. Planta 225, 1327–1338. doi: 10.1007/s00425-006-0439-1
Kadier, Y., Zu, Y.-Y., Dai, Q.-M., Song, G., Lin, S.-W., Sun, Q.-P., et al. (2017). Genome-wide identification, classification and expression analysis of NAC family of genes in sorghum [Sorghum bicolor (L.) Moench]. Plant Growth Regul. 83, 301–312.
Kaja, E., Szcześniak, M. W., Jensen, P. J., Axtell, M. J., Mcnellis, T., and Makałowska, I. (2015). Identification of apple miRNAs and their potential role in fire blight resistance. Tree Genet. Genomes 11:812.
Kaneda, T., Taga, Y., Takai, R., Iwano, M., Matsui, H., Takayama, S., et al. (2009). The transcription factor OsNAC4 is a key positive regulator of plant hypersensitive cell death. EMBO J, 28, 926–936. doi: 10.1038/emboj.2009.39
Kanehisa, M., Furumichi, M., Tanabe, M., Sato, Y., and Morishima, K. (2017). KEGG: New perspectives on genomes, pathways, diseases and drugs. Nucleic Acids Res. 45, D353–D361.
Katiyar, A., Smita, S., Lenka, S. K., Rajwanshi, R., Chinnusamy, V., and Bansal, K. C. (2012). Genome-wide classification and expression analysis of MYB transcription factor families in rice and Arabidopsis. BMC Genomics 13:544. doi: 10.1186/1471-2164-13-544.
Kaur, A., Pati, P. K., Pati, A. M., and Nagpal, A. K. (2017). In-silico analysis of cis-acting regulatory elements of pathogenesis-related proteins of Arabidopsis Thaliana and Oryza Sativa. PLoS One 12:e0184523. doi: 10.1371/journal.pone.0184523
Kelley, L., Mezulis, S., Yates, C., Wass, M., and Sternberg, M. (2015). The Phyre2 web portal for protein modeling, prediction and analysis. Nat. Protocols 10, 845–858. doi: 10.1038/nprot.2015.053
Khedia, J., Agarwal, P., and Agarwal, P. K. (2018). AlNAC4 transcription factor from halophyte Aeluropus lagopoides mitigates oxidative stress by maintaining ROS homeostasis in transgenic tobacco. Front. Plant Sci. 9:1522. doi: 10.3389/fpls.2018.01522
Kidner, C. A., and Martienssen, R. A. (2005). The developmental role of microRNA in plants. Curr. Opin. Plant Biol. 8, 38–44.
Kim, H. J., Nam, H. G., and Lim, P. O. (2016). Regulatory network of NAC transcription factors in leaf senescence. Curr. Opin. Plant Biol. 33, 48–56.
Kim, Y.-S., Kim, S.-G., Park, J.-E., Park, H.-Y., Lim, M.-H., Chua, N.-H., et al. (2006). A membrane-bound NAC transcription factor regulates cell division in Arabidopsis. The Plant Cell 18, 3132–3144.
Koch, M. A., Haubold, B., and Mitchell-Olds, T. (2000). Comparative evolutionary analysis of chalcone synthase and alcohol dehydrogenase loci in Arabidopsis. Mol. Biol. Evol. 17, 1483–1498. doi: 10.1093/oxfordjournals.molbev.a026248
Kohl, M., Wiese, S., and Warscheid, B. (2011). “Cytoscape: Software for Visualization and Analysis of Biological Networks,” in Data Mining in Proteomics. Methods in Molecular Biology, eds M. Hamacher, M. Eisenacher, and C. Stephan (Totowa, NJ: Humana Press).
Kumar, S., Stecher, G., Li, M., Knyaz, C., and Tamura, K. (2018). MEGA X: Molecular evolutionary genetics analysis across computing platforms. Mol. Biol. Evol. 35, 1547–1549. doi: 10.1093/molbev/msy096
Le, D. T., Nishiyama, R., Watanabe, Y., Mochida, K., Yamaguchi-Shinozaki, K., Shinozaki, K., et al. (2011). Genome-wide survey and expression analysis of the plant-specific NAC transcription factor family in soybean during development and dehydration stress. DNA Res. 18, 263–276. doi: 10.1093/dnares/dsr015
Le Hénanff, G., Profizi, C., Courteaux, B., Rabenoelina, F., Gérard, C., Clément, C., et al. (2013). Grapevine NAC1 transcription factor as a convergent node in developmental processes, abiotic stresses, and necrotrophic/biotrophic pathogen tolerance. J. Exp. Bot. 64, 4877–4893. doi: 10.1093/jxb/ert277
Levasseur, A., and Pontarotti, P. (2011). The role of duplications in the evolution of genomes highlights the need for evolutionary-based approaches in comparative genomics. Biol. Direct 6, 1–12. doi: 10.1186/1745-6150-6-11
Li, B., Fan, R., Yang, Q., Hu, C., Sheng, O., Deng, G., et al. (2020). Genome-wide identification and characterization of the NAC transcription factor family in Musa acuminata and expression analysis during fruit ripening. Int. J. Mol. Sci. 21:634. doi: 10.3390/ijms21020634
Li, M., Hou, L., Liu, S., Zhang, C., Yang, W., Pang, X., et al. (2021). Genome-wide identification and expression analysis of NAC transcription factors in Ziziphus Jujuba Mill. reveal their putative regulatory effects on tissue senescence and abiotic stress responses. Ind. Crops Prod. 173:114093.
Li, P., Peng, Z., Xu, P., Tang, G., Ma, C., Zhu, J., et al. (2021). Genome-wide identification of NAC transcription factors and their functional prediction of abiotic stress response in peanut. Front. Genet. 12:630292. doi: 10.3389/fgene.2021.630292
Li, X., Cai, K., Pei, X., Li, Y., Hu, Y., Meng, F., et al. (2021). Genome-wide identification of NAC transcription factor family in Juglans mandshurica and their expression analysis during the fruit development and ripening. Int. J. Mol. Sci. 22:12414. doi: 10.3390/ijms222212414
Li, W., Li, X., Chao, J., Zhang, Z., Wang, W., and Guo, Y. (2018). NAC family transcription factors in tobacco and their potential role in regulating leaf senescence. Front. Plant Sci. 9:1900. doi: 10.3389/fpls.2018.01900
Li, X., Xie, X., Li, J., Cui, Y., Hou, Y., Zhai, L., et al. (2017). Conservation and diversification of the miR166 family in soybean and potential roles of newly identified miR166s. BMC Plant Biol. 17:32. doi: 10.1186/s12870-017-0983-9
Liu, G.-S., Li, H.-L., Grierson, D., and Fu, D.-Q. (2022). NAC transcription factor family regulation of fruit ripening and quality: A Review. Cells 11:525. doi: 10.3390/cells11030525
Liu, L., Xu, W., Hu, X., Liu, H., and Lin, Y. (2016). W-box and G-box elements play important roles in early senescence of rice flag leaf. Sci. Rep. 6:20881. doi: 10.1038/srep20881
Liu, M., Sun, W., Ma, Z., Yu, G., Li, J., Wang, Y., et al. (2020). Comprehensive multiomics analysis reveals key roles of NACs in plant growth and development and its environmental adaption mechanism by regulating metabolite pathways. Genomics 112, 4897–4911. doi: 10.1016/j.ygeno.2020.08.038
Liu, X., Liu, S., Wu, J., Zhang, B., Li, X., Yan, Y., et al. (2013). Overexpression of Arachis hypogaea NAC3 in tobacco enhances dehydration and drought tolerance by increasing superoxide scavenging. Plant Physiol. Biochem. 70, 354–359. doi: 10.1016/j.plaphy.2013.05.018
Liu, X., Wang, T., Bartholomew, E., Black, K., Dong, M., Zhang, Y., et al. (2018). Comprehensive analysis of NAC transcription factors and their expression during fruit spine development in cucumber (Cucumis sativus L.). Hortic. Res. 5:31. doi: 10.1038/s41438-018-0036-z
Logemann, E., and Hahlbrock, K. (2002). Crosstalk among stress responses in plants: Pathogen defense overrides UV protection through an inversely regulated ACE/ACE type of light-responsive gene promoter unit. Proc. Natl. Acad. Sci. U.S.A 99, 2428–2432. doi: 10.1073/pnas.042692199
Lu, P.-L., Chen, N.-Z., An, R., Su, Z., Qi, B.-S., Ren, F., et al. (2007). A novel drought-inducible gene, ATAF1, encodes a NAC family protein that negatively regulates the expression of stress-responsive genes in Arabidopsis. Plant Mol. Biol. 63, 289–305. doi: 10.1007/s11103-006-9089-8
Lu, X., Dun, H., Lian, C., Zhang, X., Yin, W., and Xia, X. (2017). The role of peu-miR164 and its target PeNAC genes in response to abiotic stress in Populus euphratica. Plant Physiol. Biochem. 115, 418–438. doi: 10.1016/j.plaphy.2017.04.009
Ma, D., Dong, S., Zhang, S., Wei, X., Xie, Q., Ding, Q., et al. (2021). Chromosome-level reference genome assembly provides insights into aroma biosynthesis in passion fruit (Passiflora edulis). Mol. Ecol. Resour. 21, 955–968. doi: 10.1111/1755-0998.13310
Martin, D., Brun, C., Remy, E., Mouren, P., Thieffry, D., and Jacq, B. (2004). GOToolBox: Functional analysis of gene datasets based on Gene Ontology. Genom. Biol. 5:R101. doi: 10.1186/gb-2004-5-12-r101
Martínez-Ainsworth, N. E., and Tenaillon, M. I. (2016). Superheroes and masterminds of plant domestication. Comptes Rendus Biol. 339, 268–273. doi: 10.1016/j.crvi.2016.05.005
Maruyama, K., Todaka, D., Mizoi, J., Yoshida, T., Kidokoro, S., Matsukura, S., et al. (2012). Identification of cis-acting promoter elements in cold-and dehydration-induced transcriptional pathways in Arabidopsis, rice, and soybean. DNA Res. 19, 37–49. doi: 10.1093/dnares/dsr040
Miao, W., Song, J., Huang, Y., Liu, R., Zou, G., Ou, L., et al. (2021). Comparative Transcriptomics for Pepper (Capsicum Annuum L.) under Cold Stress and after Rewarming. Appl. Sci. 11:10204.
Min, X., Jin, X., Zhang, Z., Wei, X., Ndayambaza, B., Wang, Y., et al. (2020). Genome-Wide Identification of NAC Transcription Factor Family and Functional Analysis of the Abiotic Stress-Responsive Genes in Medicago Sativa L. J. Plant Growth Regul. 39, 324–337.
Mir, R. A., Bhat, B. A., Yousuf, H., Islam, S. T., Raza, A., Rizvi, M. A., et al. (2022). Multidimensional Role of Silicon to Activate Resilient Plant Growth and to Mitigate Abiotic Stress. Front. Plant Sci. 13:819658. doi: 10.3389/fpls.2022.819658
Moschen, S., Marino, J., Nicosia, S., Higgins, J., Alseekh, S., Astigueta, F., et al. (2019). Exploring gene networks in two sunflower lines with contrasting leaf senescence phenotype using a system biology approach. BMC Plant Biol. 19:446. doi: 10.1186/s12870-019-2021-6
Munhoz, C., Santos, A., Arenhart, R., Santini, L., Monteiro-Vitorello, C., and Vieira, M. (2015). Analysis of plant gene expression during passion fruit–Xanthomonas Axonopodis interaction implicates lipoxygenase 2 in host defence. Ann. Appl. Biol. 167, 135–155.
Munir, N., Yukun, C., Xiaohui, C., Nawaz, M. A., Iftikhar, J., Rizwan, H. M., et al. (2020). Genome-wide identification and comprehensive analyses of NAC transcription factor gene family and expression patterns during somatic embryogenesis in Dimocarpus longan Lour. Plant Physiol. Biochem. 157, 169–184. doi: 10.1016/j.plaphy.2020.10.009
Murozuka, E., Massange-Sánchez, J. A., Nielsen, K., Gregersen, P. L., and Braumann, I. (2018). Genome wide characterization of barley NAC transcription factors enables the identification of grain-specific transcription factors exclusive for the Poaceae family of monocotyledonous plants. PLoS One 13:e0209769. doi: 10.1371/journal.pone.0209769
O’Brien, J., Hayder, H., Zayed, Y., and Peng, C. (2018). Overview of microRNA biogenesis, mechanisms of actions, and circulation. Front. Endocrinol. 9:402. doi: 10.3389/fendo.2018.00402
Ohtani, M., Nishikubo, N., Xu, B., Yamaguchi, M., Mitsuda, N., Goué, N., et al. (2011). A NAC domain protein family contributing to the regulation of wood formation in poplar. Plant J. 67, 499–512. doi: 10.1111/j.1365-313X.2011.04614.x
Olsen, A. N., Ernst, H. A., Leggio, L. L., and Skriver, K. (2005). NAC transcription factors: Structurally distinct, functionally diverse. Trends Plant Sci. 10, 79–87.
Ooka, H., Satoh, K., Doi, K., Nagata, T., Otomo, Y., Murakami, K., et al. (2003). Comprehensive analysis of NAC family genes in Oryza sativa and Arabidopsis thaliana. DNA Res. 10, 239–247.
Palatnik, J. F., Wollmann, H., Schommer, C., Schwab, R., Boisbouvier, J., Rodriguez, R., et al. (2007). Sequence and expression differences underlie functional specialization of Arabidopsis microRNAs miR159 and miR319. Dev. Cell 13, 115–125.
Pascual, M., Torre, F. D. L., Cañas, R. A., Cánovas, F. M., and Ávila, C. (2018). “NAC Transcription Factors in Woody Plants,” in Progress in Botany, eds F. Cánovas, U. Lüttge, R. Matyssek, and H. Pretzsch (Cham: Springer).
Paul, S., De La Fuente-Jiménez, J. L., Manriquez, C. G., and Sharma, A. (2020). Identification, characterization and expression analysis of passion fruit (Passiflora edulis) microRNAs. 3 Biotech. 10, 1–9. doi: 10.1007/s13205-019-2000-5
Piya, S., Shrestha, S. K., Binder, B., Stewart, C. N. Jr., and Hewezi, T. (2014). Protein-protein interaction and gene co-expression maps of ARFs and Aux/IAAs in Arabidopsis. Front. Plant Sci. 5:744. doi: 10.3389/fpls.2014.00744
Puranik, S., Sahu, P. P., Mandal, S. N., Parida, S. K., and Prasad, M. (2013). Comprehensive genome-wide survey, genomic constitution and expression profiling of the NAC transcription factor family in foxtail millet (Setaria italica L.). PLoS One 8:e64594. doi: 10.1371/journal.pone.0064594
Raza, A. (2021). Eco-physiological and biochemical responses of rapeseed (Brassica napus L.) to abiotic stresses: Consequences and mitigation strategies. J. Plant Growth Regul. 40, 1368–1388.
Raza, A., Tabassum, J., Zahid, Z., Charagh, S., Bashir, S., Barmukh, R., et al. (2022). Advances in “Omics” Approaches for Improving Toxic Metals/Metalloids Tolerance in Plants. Front. Plant Sci. 12:794373. doi: 10.3389/fpls.2021.794373
Rizwan, H., Shaozhong, F., Li, X., Bilal, M. A., Yousef, A., Chenglong, Y., et al. (2022). Genome-Wide Identification and Expression Profiling of KCS Gene Family in Passion Fruit (Passiflora edulis) Under Fusarium kyushuense and Drought Stress Conditions. Front. Plant Sci. 13:872263. doi: 10.3389/fpls.2022.872263
Rizwan, H. M., Zhimin, L., Harsonowati, W., Waheed, A., Qiang, Y., Yousef, A. F., et al. (2021). Identification of fungal pathogens to control postharvest passion fruit (Passiflora edulis) decays and multi-omics comparative pathway analysis reveals purple is more resistant to pathogens than a yellow cultivar. J. Fungi 7:879. doi: 10.3390/jof7100879
Rohrmann, J., Mcquinn, R., Giovannoni, J. J., Fernie, A. R., and Tohge, T. (2012). Tissue specificity and differential expression of transcription factors in tomato provide hints of unique regulatory networks during fruit ripening. Plant Signaling Behav. 7, 1639–1647. doi: 10.4161/psb.22264
Saad, A. S. I., Li, X., Li, H.-P., Huang, T., Gao, C.-S., Guo, M.-W., et al. (2013). A rice stress-responsive NAC gene enhances tolerance of transgenic wheat to drought and salt stresses. Plant Sci. 203, 33–40. doi: 10.1016/j.plantsci.2012.12.016
Schmittgen, T. D., and Livak, K. J. (2008). Analyzing real-time PCR data by the comparative CT method. Nat. Protocols 3, 1101–1108.
Shan, Z., Jiang, Y., Li, H., Guo, J., Dong, M., Zhang, J., et al. (2020). Genome-wide analysis of the NAC transcription factor family in broomcorn millet (Panicum Miliaceum L.) and expression analysis under drought stress. BMC Genom. 21:96. doi: 10.1186/s12864-020-6479-2
Shao, H., Wang, H., and Tang, X. (2015). NAC transcription factors in plant multiple abiotic stress responses: Progress and prospects. Front. Plant Sci. 6:902. doi: 10.3389/fpls.2015.00902
Sharif, R., Raza, A., Chen, P., Li, Y., El-Ballat, E. M., Rauf, A., et al. (2021). HD-ZIP gene family: Potential roles in improving plant growth and regulating stress-responsive mechanisms in plants. Genes 12:1256. doi: 10.3390/genes12081256
Shen, S., Zhang, Q., Shi, Y., Sun, Z., Zhang, Q., Hou, S., et al. (2019). Genome-wide analysis of the NAC domain transcription factor gene family in Theobroma cacao. Genes 11:35. doi: 10.3390/genes11010035
Singh, S., Koyama, H., Bhati, K. K., and Alok, A. (2021). The biotechnological importance of the plant-specific NAC transcription factor family in crop improvement. J. Plant Res. 134, 475–495.
Song, Q.-X., Liu, Y.-F., Hu, X.-Y., Zhang, W.-K., Ma, B., Chen, S.-Y., et al. (2011). Identification of miRNAs and their target genes in developing soybean seeds by deep sequencing. BMC Plant Biol. 11:5. doi: 10.1186/1471-2229-11-5
Souer, E., Van Houwelingen, A., Kloos, D., Mol, J., and Koes, R. (1996). The no apical meristem gene of Petunia is required for pattern formation in embryos and flowers and is expressed at meristem and primordia boundaries. Cell 85, 159–170. doi: 10.1016/s0092-8674(00)81093-4
Su, H., Zhang, S., Yuan, X., Chen, C., Wang, X.-F., and Hao, Y.-J. (2013). Genome-wide analysis and identification of stress-responsive genes of the NAM–ATAF1, 2–CUC2 transcription factor family in apple. Plant Physiol. Biochem. 71, 11–21. doi: 10.1016/j.plaphy.2013.06.022
Sun, L., Yang, Z. T., Song, Z. T., Wang, M. J., Sun, L., Lu, S. J., et al. (2013). The plant-specific transcription factor gene NAC 103 is induced by b ZIP 60 through a new cis-regulatory element to modulate the unfolded protein response in A rabidopsis. Plant J. 76, 274–286. doi: 10.1111/tpj.12287
Sun, X., Wang, Y., and Sui, N. (2018). Transcriptional regulation of bHLH during plant response to stress. Biochem. Biophys. Res. Commun. 503, 397–401.
Suyal, G., Rana, V. S., Mukherjee, S. K., Wajid, S., and Choudhury, N. R. (2014). Arabidopsis thaliana NAC083 protein interacts with Mungbean yellow mosaic India virus (MYMIV) Rep protein. Virus genes 48, 486–493. doi: 10.1007/s11262-013-1028-6
Teo, Z. W. N., Zhou, W., and Shen, L. (2019). Dissecting the function of MADS-box transcription factors in orchid reproductive development. Front. Plant Sci. 10:1474. doi: 10.3389/fpls.2019.01474
Theune, M. L., Bloss, U., Brand, L. H., Ladwig, F., and Wanke, D. (2019). Phylogenetic analyses and GAGA-motif binding studies of BBR/BPC proteins lend to clues in GAGA-motif recognition and a regulatory role in brassinosteroid signaling. Front. Plant Sci. 10:466. doi: 10.3389/fpls.2019.00466
Tian, F., Yang, D.-C., Meng, Y.-Q., Jin, J., and Gao, G. (2020). PlantRegMap: Charting functional regulatory maps in plants. Nucleic Acids Res. 48, D1104–D1113. doi: 10.1093/nar/gkz1020
Tran, L.-S. P., Nakashima, K., Sakuma, Y., Simpson, S. D., Fujita, Y., Maruyama, K., et al. (2004). Isolation and functional analysis of Arabidopsis stress-inducible NAC transcription factors that bind to a drought-responsive cis-element in the early responsive to dehydration stress 1 promoter. Plant Cell 16, 2481–2498. doi: 10.1105/tpc.104.022699
Tran, L.-S. P., Quach, T. N., Guttikonda, S. K., Aldrich, D. L., Kumar, R., Neelakandan, A., et al. (2009). Molecular characterization of stress-inducible GmNAC genes in soybean. Mol. Gen. Genom. 281, 647–664. doi: 10.1007/s00438-009-0436-8
Trupkin, S. A., Astigueta, F. H., Baigorria, A. H., García, M. N., Delfosse, V. C., González, S. A., et al. (2019). Identification and expression analysis of NAC transcription factors potentially involved in leaf and petal senescence in Petunia hybrida. Plant Sci. 287:110195. doi: 10.1016/j.plantsci.2019.110195
Tuskan, G. A., Difazio, S., Jansson, S., Bohlmann, J., Grigoriev, I., Hellsten, U., et al. (2006). The genome of black cottonwood. Populus trichocarpa. Sci. 313, 1596–1604.
Valiollahi, E., Farsi, M., and Kakhki, A. M. (2014). Sly-miR166 and Sly-miR319 are components of the cold stress response in Solanum lycopersicum. Plant Biotechnol. Rep. 8, 349–356.
Wan, F.-X., Gao, J., Wang, G.-L., Niu, Y., Wang, L.-Z., Zhang, X.-G., et al. (2021). Genome-wide identification of NAC transcription factor family and expression analysis of ATAF subfamily members under abiotic stress in eggplant. Sci. Hortic. 289:110424.
Wang, C., Lin, T., Wang, M., and Qi, X. (2020). An AC-Rich Bean Element Serves as an Ethylene-Responsive Element in Arabidopsis. Plants 9:1033. doi: 10.3390/plants9081033
Wang, G., Yuan, Z., Zhang, P., Liu, Z., Wang, T., and Wei, L. (2020). Genome-wide analysis of NAC transcription factor family in maize under drought stress and rewatering. Physiol. Mol. Biol. Plants 26, 705–717. doi: 10.1007/s12298-020-00770-w
Wang, W. Q., Wang, J., Wu, Y. Y., Li, D. W., Allan, A. C., and Yin, X. R. (2020). Genome-wide analysis of coding and non-coding RNA reveals a conserved miR164-NAC regulatory pathway for fruit ripening. N. Phytol. 225, 1618–1634. doi: 10.1111/nph.16233
Wang, H., Li, T., Li, W., Wang, W., and Zhao, H. (2021). Identification and analysis of Chrysanthemum nankingense NAC transcription factors and an expression analysis of OsNAC7 subfamily members. PeerJ. 9:e11505. doi: 10.7717/peerj.11505
Wang, J., Lian, W., Cao, Y., Wang, X., Wang, G., Qi, C., et al. (2018). Overexpression of BoNAC019, a NAC transcription factor from Brassica oleracea, negatively regulates the dehydration response and anthocyanin biosynthesis in Arabidopsis. Sci. Rep. 8:13349. doi: 10.1038/s41598-018-31690-1
Wang, P., Moore, B. M., Panchy, N. L., Meng, F., Lehti-Shiu, M. D., and Shiu, S.-H. (2018). Factors influencing gene family size variation among related species in a plant family. Solanaceae. Genom. Biol. Evol. 10, 2596–2613. doi: 10.1093/gbe/evy193
Wang, X. E., Basnayake, B. V. S., Zhang, H., Li, G., Li, W., Virk, N., et al. (2009). The Arabidopsis ATAF1, a NAC transcription factor, is a negative regulator of defense responses against necrotrophic fungal and bacterial pathogens. Mol. Plant-Microbe Interact. 22, 1227–1238. doi: 10.1094/MPMI-22-10-1227
Wen, C.-L., Cheng, Q., Zhao, L., Mao, A., Yang, J., Yu, S., et al. (2016). Identification and characterisation of Dof transcription factors in the cucumber genome. Sci. Rep. 6:23072. doi: 10.1038/srep23072
Wen, Y., Raza, A., Chu, W., Zou, X., Cheng, H., Hu, Q., et al. (2021). Comprehensive in silico characterization and expression profiling of TCP gene family in rapeseed. Front. Genet. 12:794297. doi: 10.3389/fgene.2021.794297
Wen-Fang, G., De-Chun, L., Li, Y., Xia, Z., Juan-Juan, Z., Shu-Sheng, W., et al. (2015). Cloning and Expression Analysis of New Stress-resistant NAC83 Gene from Citrus. Acta Horticul. Sin. 42:445.
Xia, N., Zhang, G., Liu, X.-Y., Deng, L., Cai, G.-L., Zhang, Y., et al. (2010). Characterization of a novel wheat NAC transcription factor gene involved in defense response against stripe rust pathogen infection and abiotic stresses. Mol. Biol. Rep. 37, 3703–3712. doi: 10.1007/s11033-010-0023-4
Xie, Z., Nolan, T. M., Jiang, H., and Yin, Y. (2019). AP2/ERF transcription factor regulatory networks in hormone and abiotic stress responses in Arabidopsis. Front. Plant Sci. 10:228. doi: 10.3389/fpls.2019.00228
Xu, W., Chen, C., Gou, N., Huang, M., Wuyun, T., Zhu, G., et al. (2021). Genome-wide Identification and Expression Analysis of NAC Transcription Factor Family Genes during Fruit and Kernel Development in Siberian Apricot. J. Am. Soc. Hortic. Sci. 1, 1–22.
Yan, C., Rizwan, H. M., Liang, D., Reichelt, M., Mithöfer, A., Scholz, S. S., et al. (2021). The effect of the root-colonizing Piriformospora indica on passion fruit (Passiflora edulis) development: Initial defense shifts to fitness benefits and higher fruit quality. Food Chem. 359:129671. doi: 10.1016/j.foodchem.2021.129671
Yan, H., Hua, M. G., Da Silva, J. a. T, Qiu, L., Xu, J., Zhou, H., et al. (2021). Genome-wide identification and analysis of NAC transcription factor family in two diploid wild relatives of cultivated sweet potato uncovers potential NAC genes related to drought tolerance. Front. Genet. 12:744220. doi: 10.3389/fgene.021.744220
Yang, J., Duan, G., Li, C., Liu, L., Han, G., Zhang, Y., et al. (2019). The crosstalks between jasmonic acid and other plant hormone signaling highlight the involvement of jasmonic acid as a core component in plant response to biotic and abiotic stresses. Front. Plant Sci. 10:1349. doi: 10.3389/fpls.2019.01349
Yao, W., Li, C., Lin, S., Wang, J., Zhou, B., and Jiang, T. (2020). Transcriptome analysis of salt-responsive and wood-associated NACs in Populus simonii× Populus nigra. BMC Plant Biol. 20:317. doi: 10.1186/s12870-020-02507-z.
Yew, C., and Kumar, S. (2011). MicroRNA regulates gene expression during fruit development in pineapple”. Acta Hortic. 902, 177–184.
Zhang, G., Li, T., and Wang, A. (2018). Expression analysis of NAC genes during the growth and ripening of apples. Hortic. Sci. 45, 1–10. doi: 10.3390/molecules23081908
Zhang, Q., Luo, F., Zhong, Y., He, J., and Li, L. (2020). Modulation of NAC transcription factor NST1 activity by XYLEM NAC DOMAIN1 regulates secondary cell wall formation in Arabidopsis. J. Exp. Bot. 71, 1449–1458. doi: 10.1093/jxb/erz513
Zheng, X., Chen, B., Lu, G., and Han, B. (2009). Overexpression of a NAC transcription factor enhances rice drought and salt tolerance. Biochem. Biophys. Res. Commun. 379, 985–989.
Zhu, H., Wang, J., Jiang, D., Hong, Y., Xu, J., Zheng, S., et al. (2022). The miR157-SPL-CNR module acts upstream of bHLH101 to negatively regulate iron deficiency responses in tomato. J. f Integr. Plant Biol. 64, 1059–1075. doi: 10.1111/jipb.13251
Zhu, M., Chen, G., Zhang, J., Zhang, Y., Xie, Q., Zhao, Z., et al. (2014). The abiotic stress-responsive NAC-type transcription factor SlNAC4 regulates salt and drought tolerance and stress-related genes in tomato (Solanum lycopersicum). Plant Cell Rep. 33, 1851–1863. doi: 10.1007/s00299-014-1662-z
Keywords: passion fruit, synteny analysis, multicollinearity, micro-RNA, gene expressions
Citation: Yang Q, Li B, Rizwan HM, Sun K, Zeng J, Shi M, Guo T and Chen F (2022) Genome-wide identification and comprehensive analyses of NAC transcription factor gene family and expression analysis under Fusarium kyushuense and drought stress conditions in Passiflora edulis. Front. Plant Sci. 13:972734. doi: 10.3389/fpls.2022.972734
Received: 18 June 2022; Accepted: 27 July 2022;
Published: 25 August 2022.
Edited by:
Engin Yol, Akdeniz University, TurkeyReviewed by:
Faisal Hayat, Nanjing Agricultural University, ChinaCopyright © 2022 Yang, Li, Rizwan, Sun, Zeng, Shi, Guo and Chen. This is an open-access article distributed under the terms of the Creative Commons Attribution License (CC BY). The use, distribution or reproduction in other forums is permitted, provided the original author(s) and the copyright owner(s) are credited and that the original publication in this journal is cited, in accordance with accepted academic practice. No use, distribution or reproduction is permitted which does not comply with these terms.
*Correspondence: Faxing Chen, ZnhjaGVuQGZhZnUuZWR1LmNu
†These authors have contributed equally to this work
Disclaimer: All claims expressed in this article are solely those of the authors and do not necessarily represent those of their affiliated organizations, or those of the publisher, the editors and the reviewers. Any product that may be evaluated in this article or claim that may be made by its manufacturer is not guaranteed or endorsed by the publisher.
Research integrity at Frontiers
Learn more about the work of our research integrity team to safeguard the quality of each article we publish.