 Zhiyong Liu1,2
 Siyuan Zhu
 Touming Liu
- 1College of Agriculture, Yangtze University, Jingzhou, China
- 2Institute of Bast Fiber Crops, Chinese Academy of Agricultural Sciences, Changsha, China
- 3College of Horticulture and Plant Protection, Yangzhou University, Yangzhou, China
Ramie (Boehmeria nivea L.) is a perennial plant with vigorously vegetative growth and high nutritive value that is an excellent source of green feed in China. Crude protein and fiber content are the most important traits associated with ramie forage quality; however, their genetic basis remains largely unknown. In this study, we investigated the genetic architecture of these two traits using an F2 population derived from cultivated Zhongsizhu 1 (ZSZ1) and wild Boehmeria nivea var. tenacissima (tenacissima). Linkage mapping identified eight quantitative trait loci (QTLs) in crude fiber and one QTL in crude protein. Of these, five were further validated by association analysis. Then, two major QTLs for crude fiber content, CF7 and CF13, were further identified using bulked segregant analysis (BSA) sequencing, and their exact physical intervals were determined via genotype analysis of F2 progenies with extremely low crude fiber content. In total, 10 genes in the CF7 and CF13 regions showed differential expression in ZSZ1 and tenacissima leaves, including an MYB gene whole_GLEAN_10016511 from the CF13 region. Wide variation was observed in the promoter regions of whole_GLEAN_10016511, likely responsible for its downregulated expression in tenacissima. Interestingly, more fiber cells were observed in Arabidopsis with overexpression of whole_GLEAN_10016511, indicating that the downregulated expression of this gene could have an association with the relatively low fiber content in wild tenacissima. These results provided evidence that whole_GLEAN_10016511 is a logical candidate for CF13. This study provides important insights into the genetic basis underlying ramie crude protein and fiber content, and it presents genetic loci for improving the forage quality of ramie using marker-assisted selection.
Introduction
Ramie is a traditional, natural fiber crop with a cultivation history of over 4,700 years in China (Li, 1970). It is a perennial plant that is usually harvested by cutting mature shoots without destroying the roots, thereby allowing the root system to continuously develop in the soil (Subandi, 2012). Ramie exhibits vigorous, vegetative growth. When it is watered regularly, it can be harvested 6–8 times per year, resulting in 126 tons of fresh biomass per hectare per year (Rehman et al., 2019). In addition, previous studies have shown that young shoots and leaves contain 16.4% crude protein, 25% digestible fiber, 31.8 g/kg calcium, 18.7 g/kg potassium, and ample amounts of lysine, methionine, carotenoids, and riboflavin. Ramie also has high metabolic energy levels (6.4 MJ/kg dry matter; INFIC, 1978), indicating high nutritive value. As the nutritional value of ramie is similar to that of alfalfa (Medicago sativa), ramie is an excellent nutritive source of green feed in China and palatable to all classes of farm animals (Rehman et al., 2019). Previous research on cattle, sheep, pigs, horses, and poultry has highlighted the importance of ramie as a key nutritional source in the form of green foliage (Pérez et al., 2013).
Crude protein and fiber are two of the most important traits associated with ramie forage quality. In the past decade, there has been considerable progress in genetic and genomic research on ramie. In total, thousands of simple sequence repeat markers (SSRs) have been developed based on RNA sequencing transcripts (Liu et al., 2013; Chen et al., 2016). Based on these markers, the first genetic SSR map was developed for ramie (Liu et al., 2014), including 16 SSRs associated with fiber yield traits (Luan et al., 2017). The rapid development of next-generation sequencing technology has recently led to the identification of large-scale single-nucleotide polymorphisms (SNPs) in ramie, resulting in several high-density genetic maps (Liu et al., 2017; Zeng et al., 2019). Consequently, the genetic architecture of many agronomic traits, such as fiber yield, quality, and flowering time, has been systematically characterized using linkage mapping and genome-wide association mapping (Zhu et al., 2016; Liu et al., 2017; Chen et al., 2018, 2019; Zeng et al., 2019, 2022; Huang et al., 2021; Wang et al., 2021), and several candidates across various loci have been documented (Liu et al., 2017; Wang et al., 2021; Zeng et al., 2022). Recently, ramie feeding traits have also been researched, and the genetic basis of six forage yield-related traits was characterized, resulting in 78 significant association signals from 43 genomic regions (Bai et al., 2022). However, in terms of forage quality traits, specifically the crude protein and fiber content, the genetic basis remains largely unknown, limiting our knowledge of the genetic potential of ramie. In a previous study, we developed an F2 population consisting of 111 progenies derived from cultivated Zhongsizhu 1 (ZSZ1) and the wild species B. nivea var. tenacissima (hereafter, tenacissima). Based on this population, a high-density genetic map with 1,085 SNPs was constructed, with a total length of 2,118.8 cM (Wang et al., 2019). In this study, we explored the genetic architecture of crude protein and fiber content based on the F2 population; furthermore, a major quantitative trait locus (QTL) of the crude fiber content, CF13, was analyzed in-depth to ascertain its suitability as a candidate.
Results
Phenotypic variation in the F2 population and parents
Only 6.28% crude fiber and 15.63% crude protein were observed in the dry leaves of the parent tenacissima, whereas 14.14% crude fiber and 19.42% crude protein were observed in ZSZ1, indicating a considerable difference between each trait in the parents. Within the population, the percentage of crude fiber in the dry leaves ranged from 5.23 to 14.48%, with a mean of 10.17%, whereas the percentage of crude protein in the dry leaves ranged from 11.25 to 19.35% (15.30 ± 1.99%); this indicated a wide variation in the two traits associated with forage quality, in this population. Correlation analysis revealed that the phenotypic values of these traits were not correlated in this population (p > 0.05). Furthermore, the crude fiber and protein content followed a skewed normal distribution (Figure 1). These results indicate that the population was suitable for QTL analysis of the two traits.
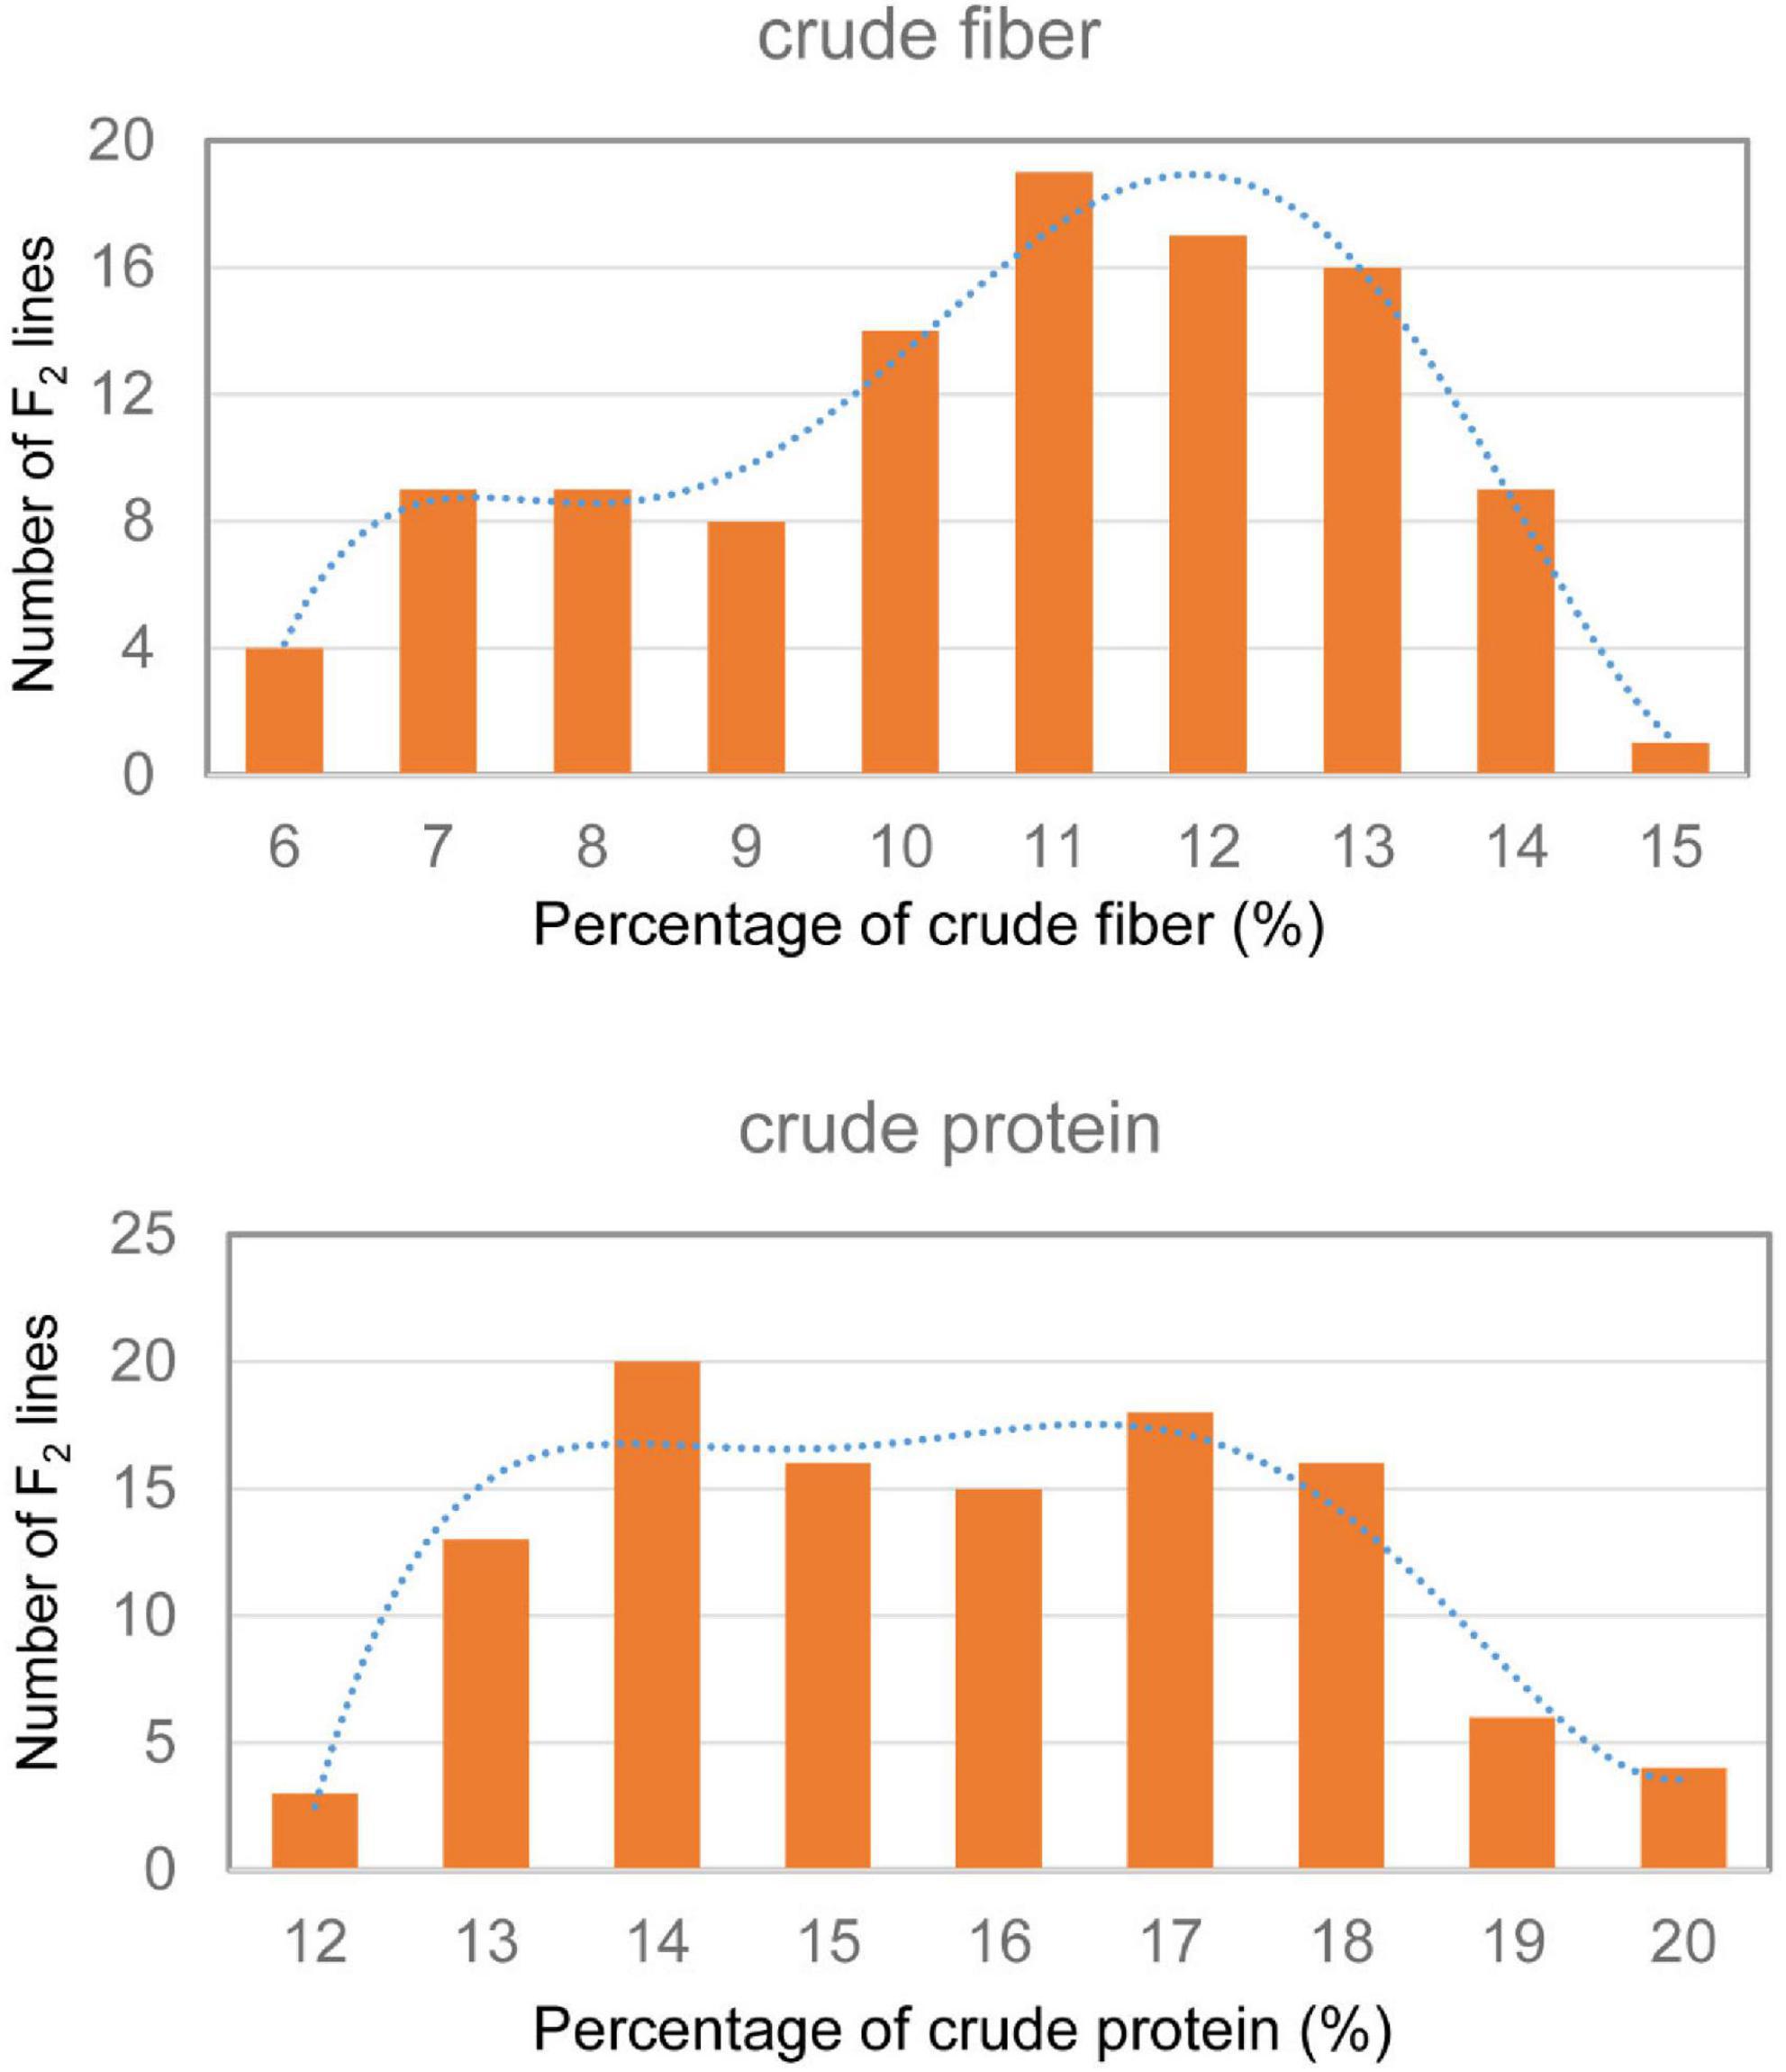
Figure 1. Frequency distribution of crude protein and fiber content in the F2 population derived from cultivated ZSZ1 and wild tenacissima. Blue dashed line indicates the frequency distribution trend. The x-axis indicates the percentage (%) of crude protein and fiber, and the y-axis indicates the number of F2 lines.
Quantitative trait locis of crude fiber and crude protein contents
Linkage and association mapping methods were used for QTL analysis based on the 1,085 SNPs identified in this F2 population. For linkage mapping analysis, the likelihood of odd (LOD) threshold values were estimated using a permutation test program, resulting in 4.05 and 4.36 threshold values used to detect QTLs for crude protein and fiber content, respectively. Consequently, eight QTLs were identified for crude fiber content, accounting for 92.7% of the total phenotypic variation in the population (Table 1 and Figure 2A), and one QTL for crude protein content was detected (Figure 2B). Of these nine QTLs from the linkage mapping method, five could be further validated by the association mapping method (p < 1 × 10⁻⁵), including the crude protein content QTL CP11 that was flanked by Marker_5028 and Marker_5652 on chromosome 11 (Table 1). Notably, a QTL on chromosome 7 (CF7) had a large effect on the trait, with a LOD of 11.57, accounting for 19.75% of the variation within the population. Furthermore, we identified 34 SNPs from the CF7 region that were significantly associated with crude fiber content (p < 1 × 10⁻⁵), especially Marker_6117 (position: 1,497,478 nt of PHNS01007451.1) with a p-value of 6.73 × 10⁻¹⁴ (Supplementary Table 1). Additionally, the QTL from chromosome13 (CF13) had a large effect on crude fiber, and Marker_75 (position: 458,905 nt of PHNS01003683.1) in this QTL region was significantly associated with the crude fiber content of leaves, with a p-value of 5.79 × 10⁻¹¹. These results indicate that CF7 and CF13 are two major loci for crude fiber content.
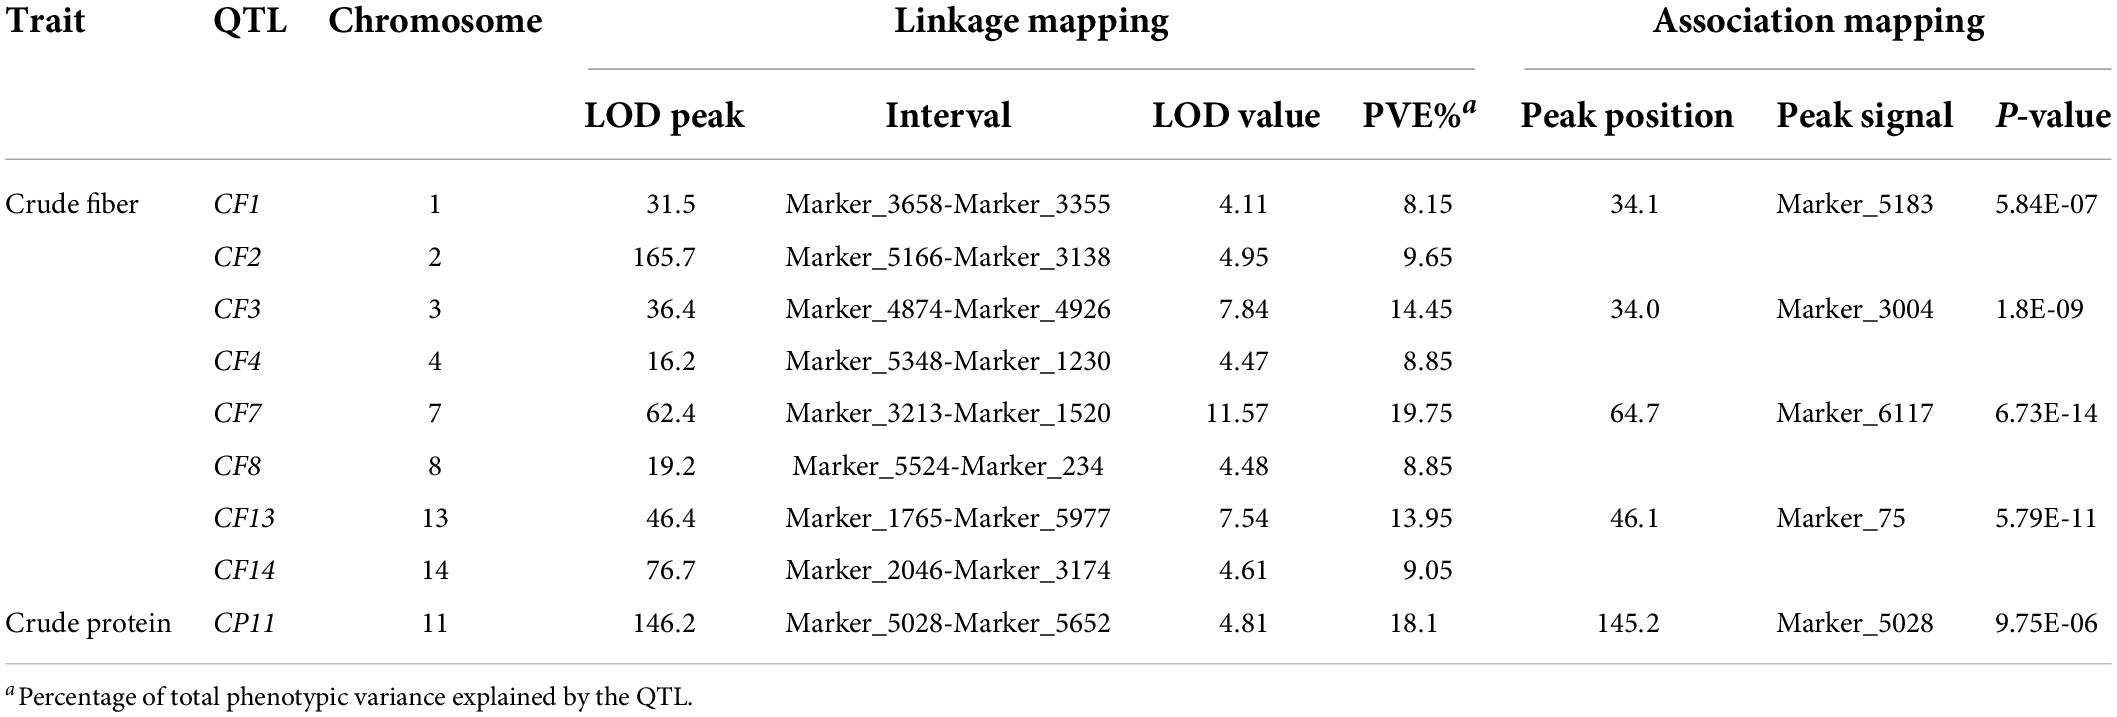
Table 1. QTLs for the crude fiber and crude protein content detected in the F2 population derived from cultivated ZSZ1 and wild tenacissima.
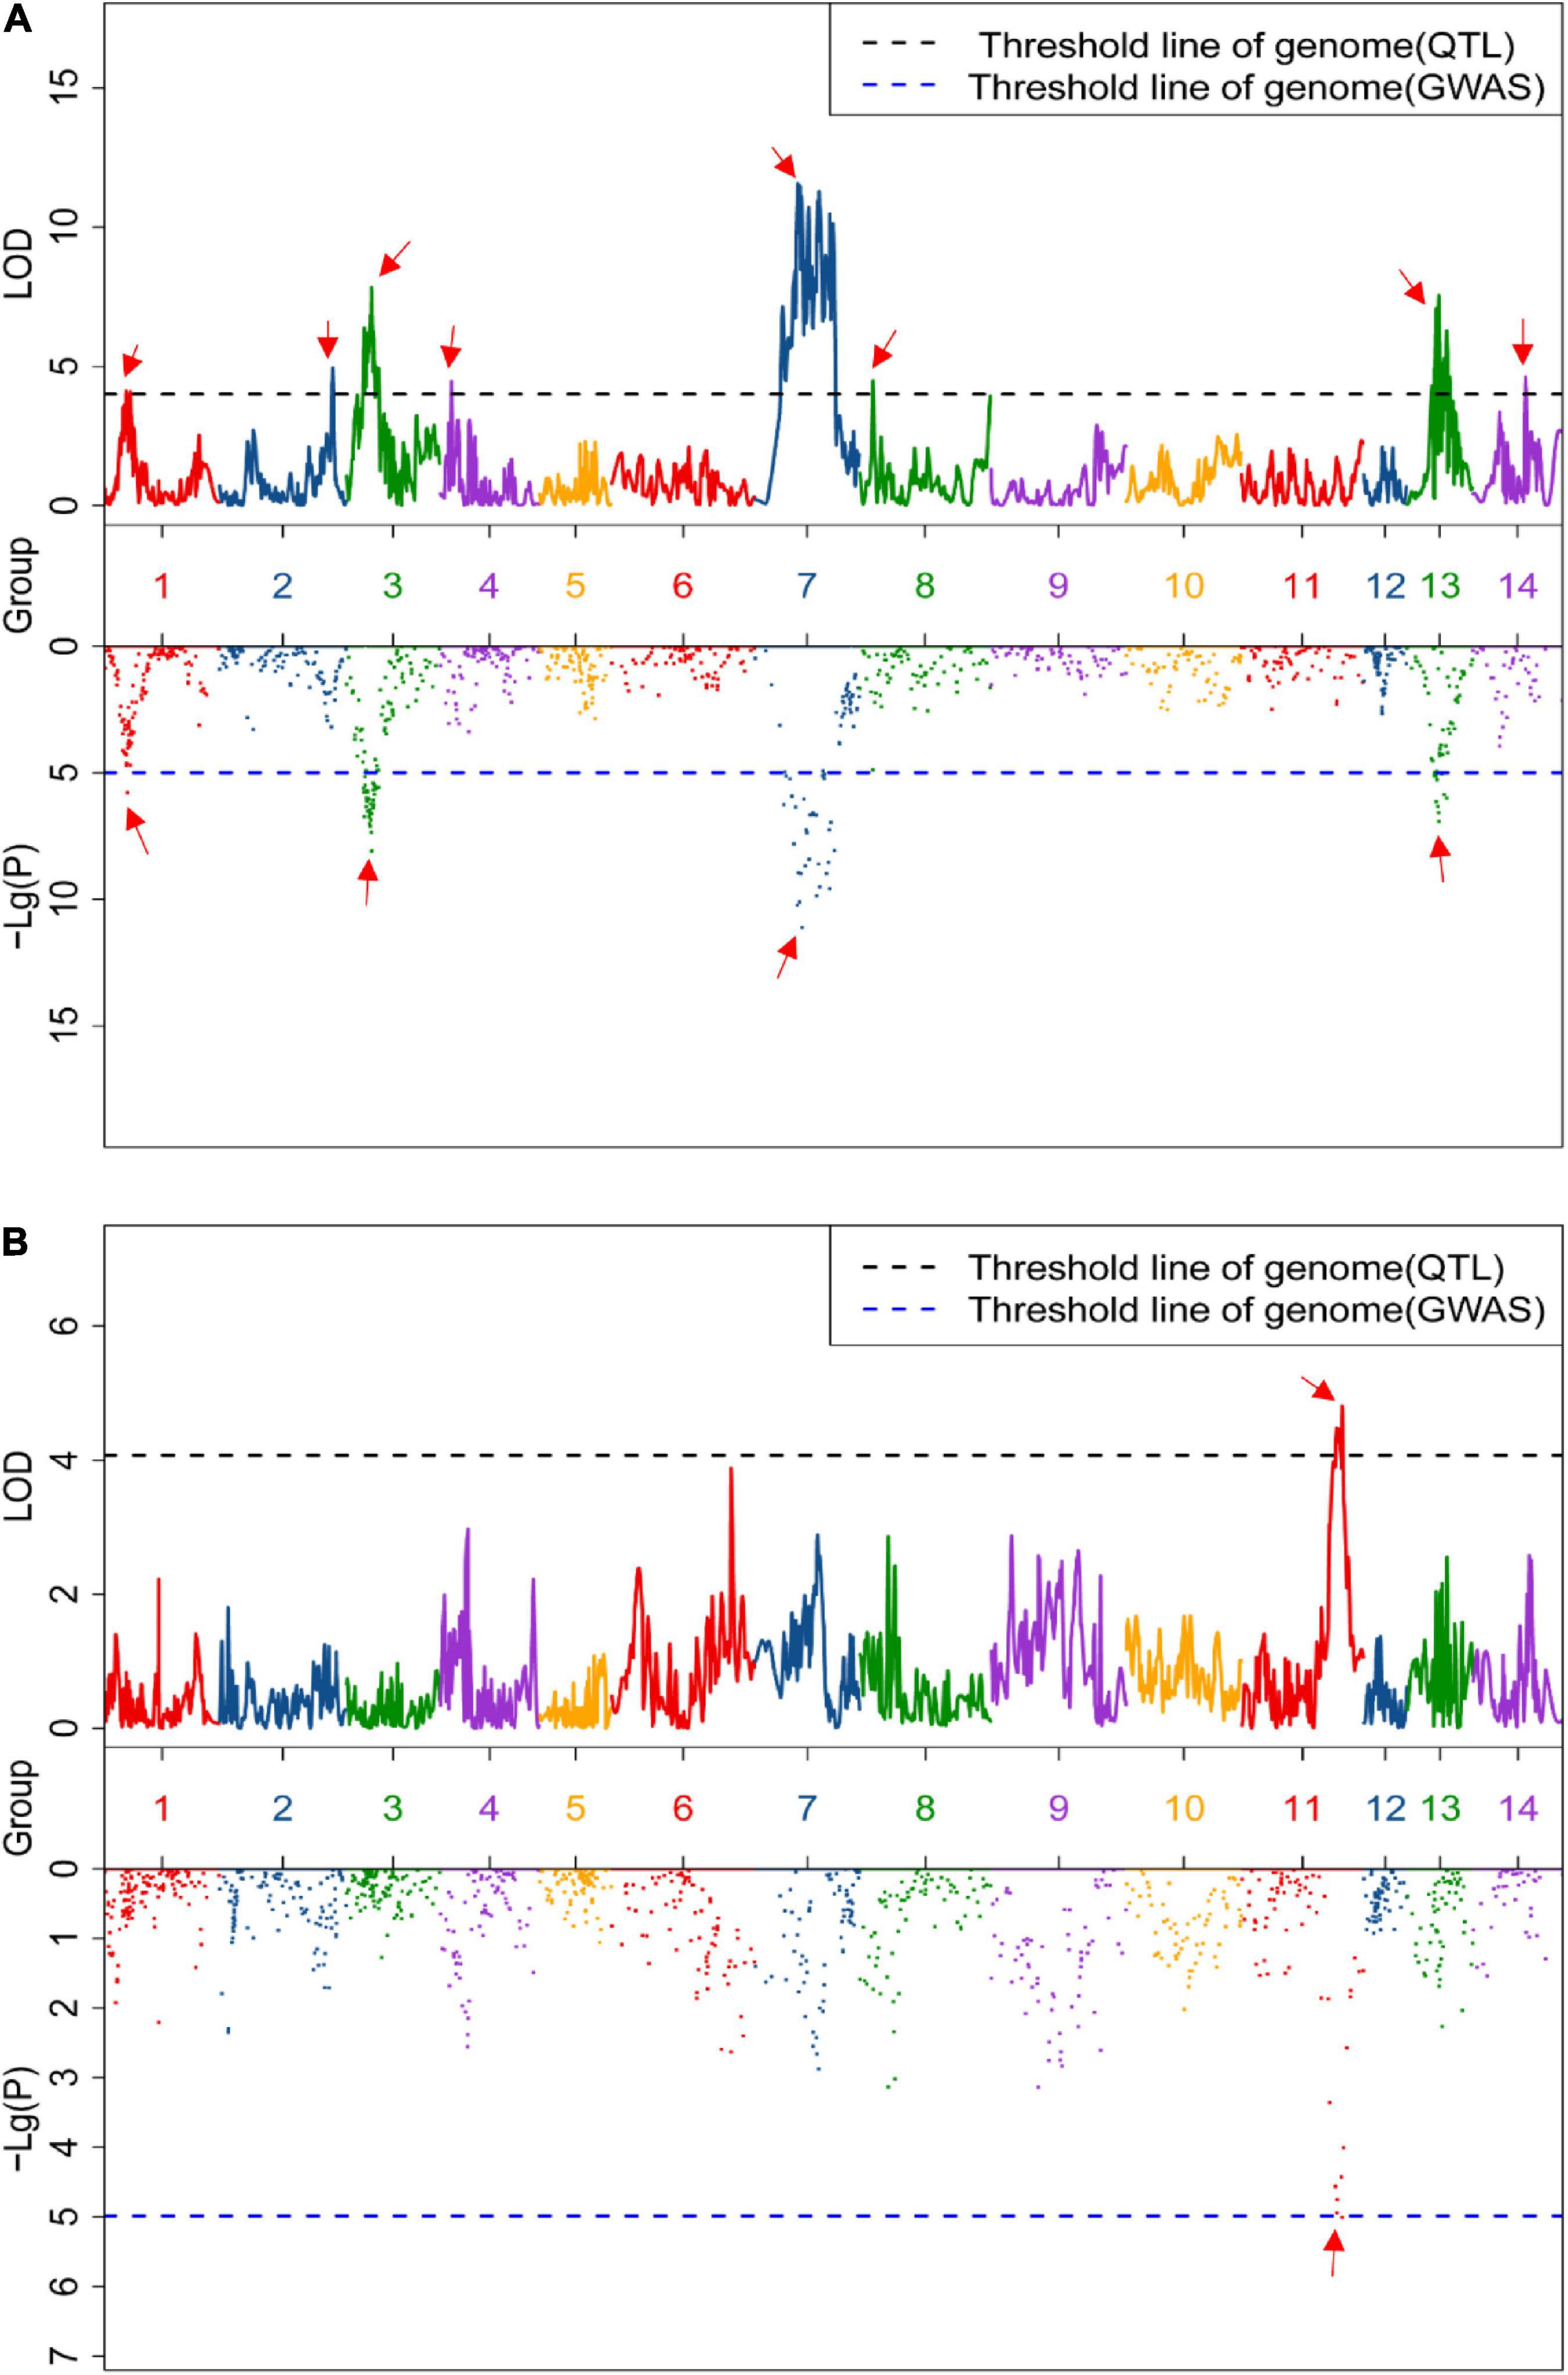
Figure 2. Quantitative trait loci (QTLs) of the content of crude fiber (A) and crude protein (B). Upper and lower box indicates the genome-wide LOD value from linkage mapping and the Manhattan plot from association analysis, respectively. Black and blue dashed lines represent the significance threshold value, and the red arrow indicates the significant peak of the QTLs.
Physical intervals of CF7 and CF13
To identify the exact genomic regions of CF7 and CF13, bulked segregant analysis (BSA) was performed using 30 F2 individuals with extremely high (>14%) and low (<7%) leaf crude fiber content. BSA sequencing for two pools and their parents, ZSZ1 and tenacissima, generated 583.3 million clean reads (Table 2). After mapping to the ramie reference genome, approximately 103.4–131.1 million reads were aligned with the reference, resulting in an average alignment rate of 88.2% with an average depth of 48.3-folds. Consequently, 6,601,156 and 4,577,790 SNPs were identified in the pool of individuals with extremely high and low crude fibers, respectively. The ΔSNP-index algorithm was used to calculate the allele segregation of the SNPs between the two extreme pools, resulting in two candidate regions in accordance with the QTL regions of CF7 and CF13 (Figure 3A). Investigation into the location of SNPs with a ΔSNP-index > 0.8 indicated that these SNPs were in the contigs PHNS01007451.1 (from 28,692 to 1,316,742 nt; peak position: 868,229 nt) and PHNS01003683.1 (from 3,490 to 1,124,784 nt; peak position: 556,306 nt), respectively. Furthermore, in these two intervals determined from BSA, 19 SSR markers were developed and were used to further delimit the QTLs. Finally, CF7 and CF13 were mapped into a physical interval of PHNS01007451.1 (from 466,575 to 1,172,627 nt) and PHNS01003683.1 (from 409,263 to 1,085,754 nt), with a length of 706.2 and 676.5 kb, respectively (Figures 3B,C).

Table 2. Summary of data from BSA sequencing.
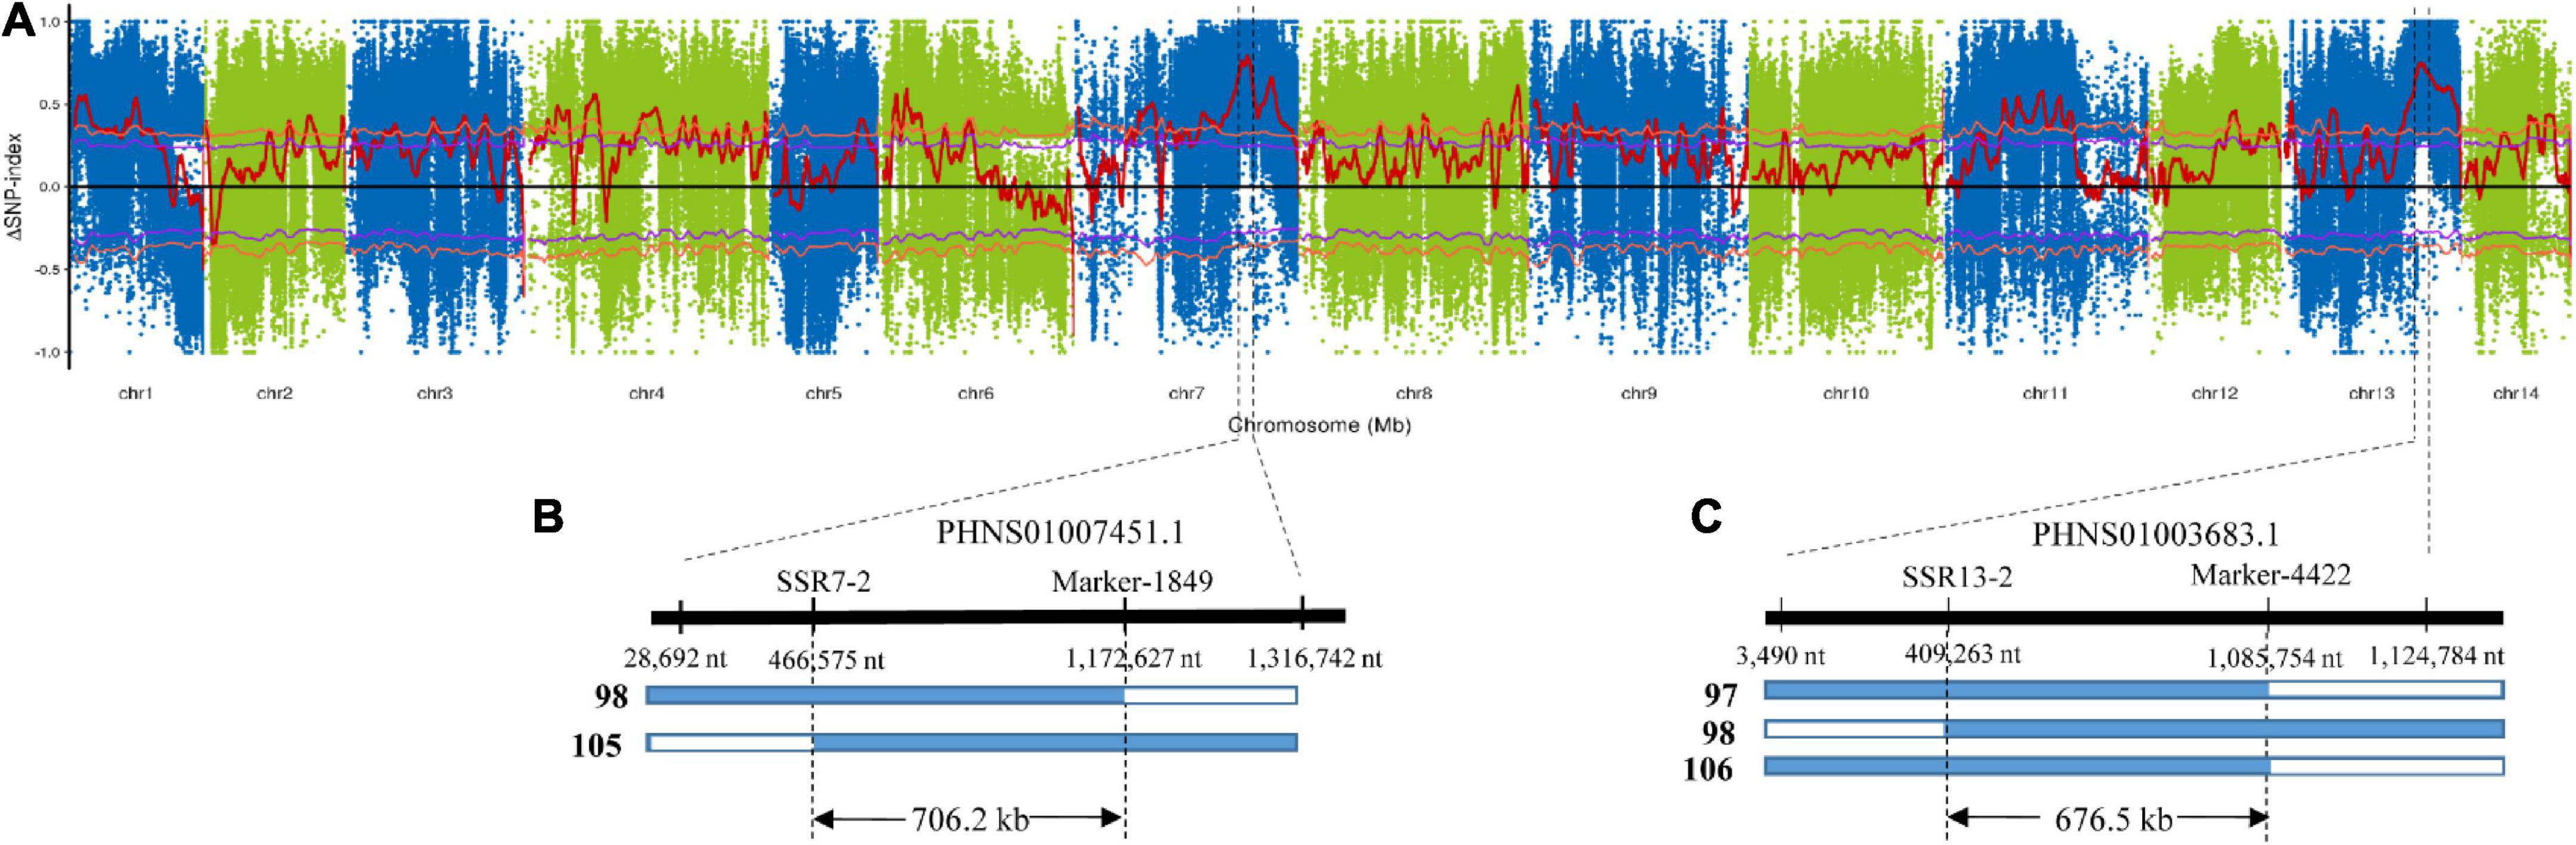
Figure 3. Physical intervals of two major QTLs of crude fiber content, CF7 and CF13. (A) ΔSNP-index was calculated from the difference between the SNP-indexes of the pooled bulks. Red lines indicate the ΔSNP-index. Purple and orange lines represent 95 and 99% confidence levels, respectively. In total, two and three recombinant individuals from 30 F2 progenies with extremely low crude fiber content delimited the CF7 (B) and CF13 (C) into exact physical intervals, respectively. Other F2 individuals with extremely low crude fiber content are not recombinant, and only tenacissima allele was observed in the corresponding QTL regions. Then, two outer numbers under the thick line represent the position of SNPs delimited the region of QTL from BSA, and the intermediated number under the thick line indicates the position of markers used for genotyping the recombinant individuals.
Identification of a fiber growth-related whole_GLEAN_10016511 in the CF13 region
A total of 82 and 79 predicted genes were included in the interval of CF7 and CF13 (Supplementary Tables 2, 3); of these genes, respectively, five from CF7 and five from CF13 showed differential expression between the leaves of two parents, ZSZ1 and tenacissima, including an MYB gene whole_GLEAN_10016511 whose expression level was significantly downregulated in the tenacissima (Figure 4A). MYB transcription factors are crucial for controlling fiber growth by regulating the thickening of the secondary wall (Zhong and Ye, 2015). whole_GLEAN_10016511 is an ortholog of Arabidopsis KAN2 (Supplementary Figure 1). KAN2 plays a crucial role in vascular tissue formation, and its loss-of-function mutants cause ectopic xylem and fiber differentiation in amphivasal vascular tissue (Ilegems et al., 2010). Recently, Genome-wide Association Studies (GWAS) analysis identified a significant signal associated with the fiber content of stem barks in ramie, and whole_GLEAN_10016511 was near this signal (Huang et al., 2021). Therefore, whole_GLEAN_10016511 might be the candidate of CF13 and was further examined. We first performed qRT-PCR analysis for whole_GLEAN_10016511 and further verified its differential expression in the leaves of ZSZ1 and tenacissima (Figure 4B). Then, a sequence comparison for whole_GLEAN_10016511 was conducted and identified five variations that caused amino acid change between the parents, including a deletion in the tenacissima (Figure 4C). Notably, there were numerous variations in the promoter region of the gene, including a 53-bp deletion and a 118-bp insertion in tenacissima comparing with ZSZ1 (Figure 4C). Similarly, recent resequencing of 46 cultivated and 14 wild germplasms revealed wide variations in the promoter region of whole_GLEAN_10016511 (Wang et al., 2021). Using the Indels at the 17-bp upstream of CDS as an example, there were three genotypes in 60 accessions, i.e., deletion and insertion by TATC and TATCATATC, respectively. Interestingly, 13 of 14 wild accessions had a genotype with the deletion at this site, whereas among 35 accessions with the insertion genotype, 34 were cultivated (Figure 4D), indicating the selection for this gene during ramie domestication. Importantly, accessions harboring deletion genotype exhibited a significantly lower content of crude fiber in leaves than those harboring the insertion genotype (Figure 4E). Finally, we explored the function of whole_GLEAN_10016511 by executing an overexpressed analysis in Arabidopsis, resulting in a phenotype with more fiber cells observed in the stem of the transgenic plants (Figure 4F and Supplementary Figure 2). Taken together, our results indicated that whole_GLEAN_10016511 is a fiber growth-related gene, and numerous variations in its promoter region in tenacissima cause low expression levels, likely responsible for the relatively low fiber content of wild tenacissima. Importantly, whole_GLEAN_10016511 was in the CF13 region, and whole_GLEAN_10016511 is a logical candidate for this QTL.
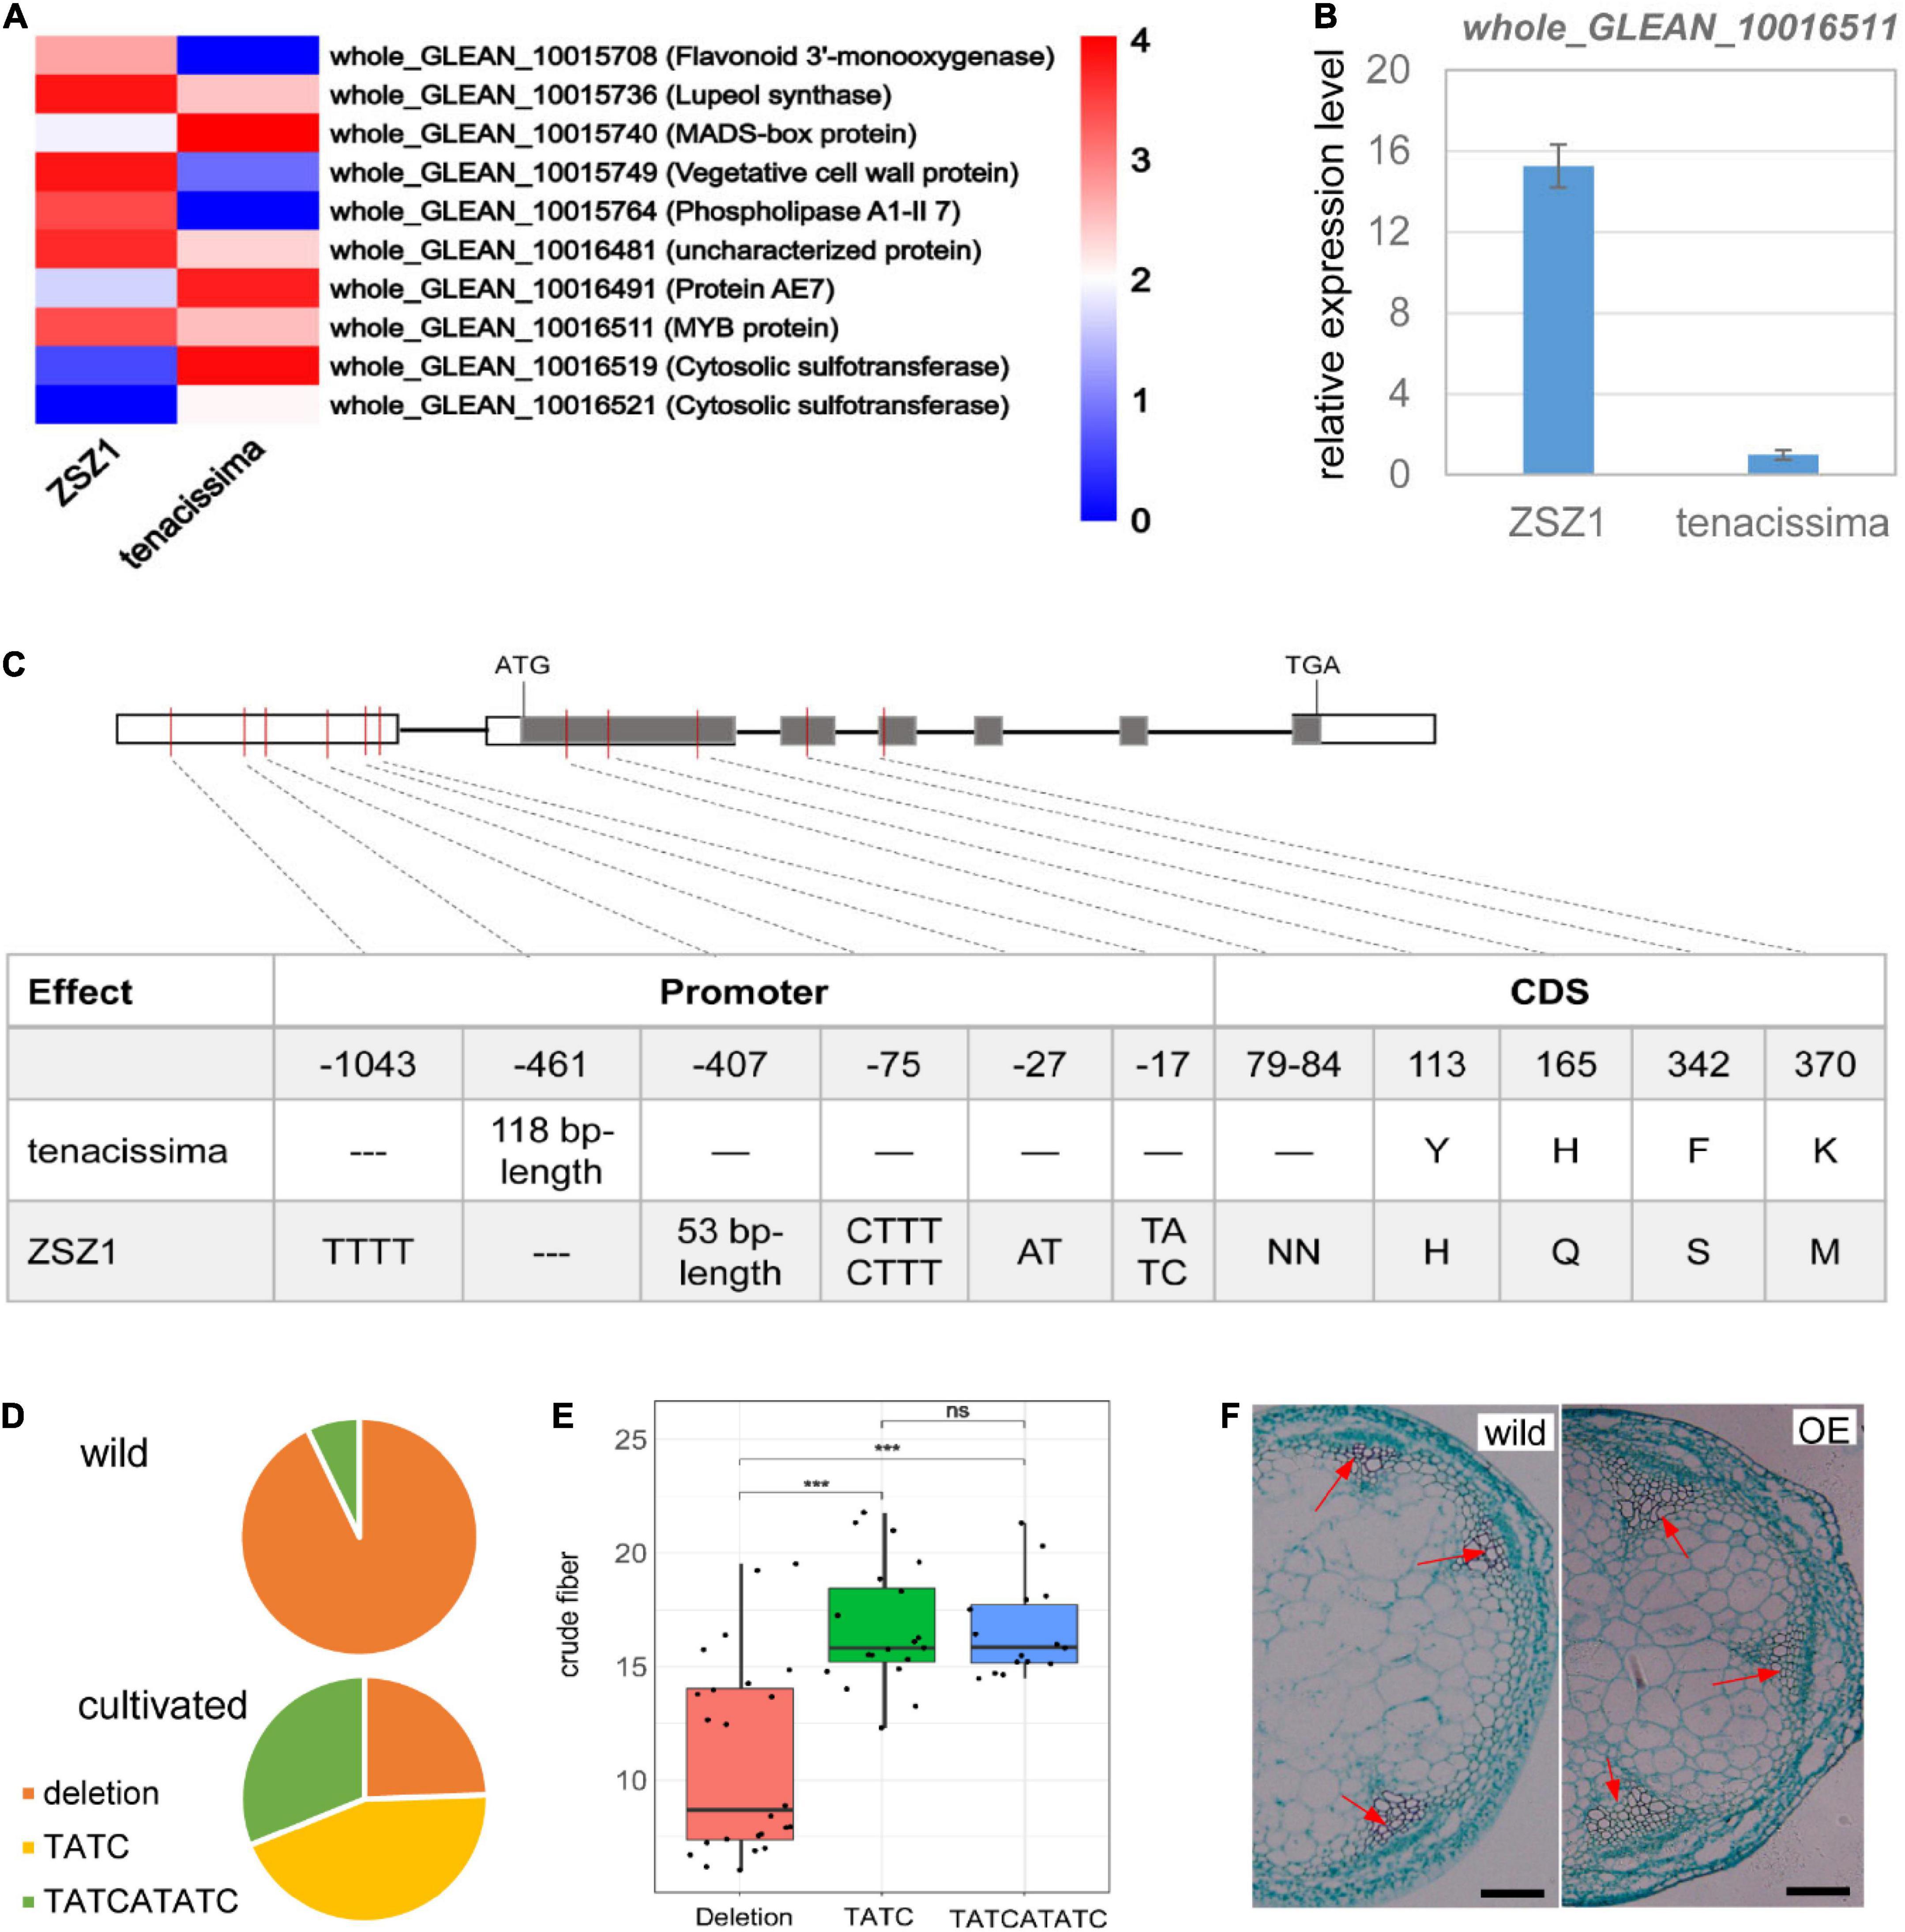
Figure 4. Functional characterization of whole_GLEAN_10016511. (A) Differentially expressed genes between ZSZ1 and tenacissima leaves. whole_GLEAN_10015708, whole_GLEAN_10015736, whole_GLEAN_10015740, whole_GLEAN_10015749, and whole_GLEAN_10015764 are in the CF7 region, whereas all others are from the CF13 region. Gene annotation was indicated in brackets following the gene ID. whole_GLEAN_10016511 expression was downregulated in the tenacissima leaves. (B) Relative expression level of whole_GLEAN_10016511 in the leaves of ZSZ1 and tenacissima. (C) Sequence variations of whole_GLEAN_10016511 in the two parents, ZSZ1 and tenacissima. Gray and white rectangles indicate the coding sequence (CDS) and promoter region, respectively. The thick black lines before the inter-exon region represent the putative intron region. The vertical molding in the gene indicates variation in the corresponding position of the gene. The tables under each figure show the detailed sequence variations in CDS and the corresponding amino acid change for each gene. (D) Allelic variation frequency at the 17-bp upstream of whole_GLEAN_10016511 CDS in wild and cultivated ramie. Orange, yellow, and green parts in each pie graph indicate the allelic frequency of deletion, insertion by TATC, and insertion by TATCATATC in the wild and cultivated groups. (E) Boxplot showed the difference in the crude fiber content of leaves among three groups whose accessions harbor different genotypes at the 17-bp upstream of whole_GLEAN_10016511 CDS. *** Indicates the significant difference at the level of 0.001, and ns indicates no significant difference. (F) Light microscope observation of transected stems of wild and whole_GLEAN_10016511-overexpressing (OE) Arabidopsis. Arrows indicate the fiber cells of xylem regions. Scale bar = 200 μm.
Discussion
Ramie has a close evolutionary relationship with Morus alba, a forage plant that is eaten by silkworms, and their genomes show a high level of collinearity (Wang et al., 2021). Similar to Morus alba, ramie leaves have a high crude protein content. A recent study identified 106 ramie genes that underwent positive selection, and 22 of these were enriched in the GO term “nitrogen compound metabolism,” suggesting that the positive selection of these nitrogen metabolism-related genes could be responsible for crude protein biosynthesis in domesticated ramie (Liu et al., 2018). Currently, the genetic basis of the traits that reflect forage quality remains poorly understood. In this study, we identified nine QTLs using the linkage mapping method. Although linkage maps have been proven to be a powerful tool for identifying genetic loci of agronomic traits in plants using biparental primary populations (Liu et al., 2010, 2011), it is still challenging to determine candidate genes from QTL analysis because of its low precision in genetic mapping. To circumvent this problem, two other methods were used alongside QTL mapping. Association mapping was used to verify the findings of linkage mapping and revealed that five of nine QTLs (four and one, for crude fiber and protein, respectively) were reliable. Additionally, BSA sequencing was used to further improve the precision of the location of the two major QTLs for crude fiber content in ramie leaves, thereby making it feasible to identify the candidates for these two QTLs. Taken together, this study provided the first insights into the genetic basis underlying the traits of crude protein and fiber content in ramie, which will allow forage quality improvement using marker-assisted selection.
As a fiber crop, ramie produces numerous fibers in its bast bark; even in its leaves, there are plentiful crude fibers, which leads to poor palatability as forage. Plant fibers include thickened secondary cell walls composed of cellulose, hemicelluloses (xylan and glucomannan), and lignin, which are deposited in some specialized cells (Zhong and Ye, 2015). Biosynthesis of secondary walls is regulated by a NAC-MYB-based transcriptional network (Nakano et al., 2015), and at least 16 MYB proteins are involved in this network in Arabidopsis (Zhong and Ye, 2015). Several ramie MYB genes have been identified to be involved in fiber growth. evm.model.scaffold7373.133_D1 is a candidate for qBT4a, a QTL of the bark thickness trait related to fiber yield, and it encodes a putative MYB protein. There was a 760-bp insertion that caused premature termination and produced a protein that lacked a part of the MYB domain (Liu et al., 2017). whole_GLEAN_10015497 is another MYB gene associated with fiber growth in ramie, and its overexpression caused a distinct increase in the number of fibers in transgenic plants (He et al., 2021). In this study, a fiber growth-promoted MYB gene, whole_GLEAN_10016511, was mapped on the CF13 region, a QTL for crude fiber content. Wide variations in the promoter region of this MYB gene caused its low expression in tenacissima, a parent with low crude fiber content in leaves. These findings supported the proposal that whole_GLEAN_10016511 is a candidate for CF13. These results provided an essential basis for the cloning of CF13 in the future studies.
Wild tenacissima is the progenitor of cultivated ramie, and many variations have been identified in the genome of tenacissima and cultivated ZSZ1, most of which impact the trait performance. For example, BntGA2ox1 codes for gibberellin 2-beta-dioxygenase, and an 11.7-kb insertion in this gene causes a genic structural change in the genome of cultivars, which is potentially associated with long stems and fibers in cultivated ramie (Wang et al., 2021). This study identified numerous variations in the fiber growth-promoted whole_GLEAN_10016511 between tenacissima and ZSZ1 alleles, especially in its promoter region. Of these variations, an Indels at the 17-bp upstream of CDS had a considerable relationship with the crude fiber content of leaves. Variations in the promoter of whole_GLEAN_10016511 could cause high gene expression levels in ZSZ1 compared to tenacissima and are likely responsible for the high content of crude fiber of cultivated ZSZ1 leaves. Therefore, breeding selection using the tenacissima allele of whole_GLEAN_10016511 could theoretically decrease the crude fiber content, thereby improving ramie palatability.
Materials and methods
Experimental material and field planting
An existing F2 population consisting of 111 progenies derived from cultivated ZSZ1 and wild tenacissima was used for linkage mapping analysis (Supplementary Figure 3; Wang et al., 2019). Cuttings from propagations of each F2 individual and the parents were taken, and five seedlings of each line were grown in the experimental farm at the Institute of Bast Fiber Crops (28.50°N, 112.22°E), Chinese Academy of Agricultural Sciences, Yuanjiang, China, in 2017. In April 2018, young leaves were collected, dried, and used to estimate the crude protein and fiber content.
Phenotype measurements
Crude fiber content was determined using the intermediate filtration method (ISO 6865:2000, 2000). Briefly, 1 g of dried leaves was pre-degreased using petroleum ether, and carbonate content was removed using hydrochloric acid (0.5 mol/L). Subsequently, the treated leaves were boiled in a sulfuric acid solution (0.13 mol/L) for 30 min. After degreasing with petroleum ether, the sample was boiled in a potassium hydroxide solution (0.23 mol/L) for 30 min. After filtering and drying, the samples were weighed (m1). Finally, the samples were subjected to be ashed and weighed again (m2). The difference between m1 and m2 was used to estimate crude fiber, which was further used to calculate the crude fiber content of dried leaves (%).
The Kjeldahl method was used to estimate the crude protein content (CNS GB/T 6432-2018, 2018). Briefly, 0.5 g of dried leaves was boiled in a 12 ml of sulfuric acid solution for 60 min and catalyzed using a mixture of copper sulfate (0.4 g) and sodium sulfate (6 g). Thereafter, the nitrogen compounds in the sample were resolved in a sodium hydroxide solution (0.4 g/ml), and the generated ammonia was collected using a boric acid solution (20 mg/ml). Finally, the ammonia content in the boric acid solution was estimated using titration with hydrochloric acid (0.02 mol/L), which was used to determine the crude protein content.
The correlation between the crude protein and fiber content was estimated using SPSS software, and significance was set at p ≤ 0.05.
Quantitative trait loci analysis
Based on the linkage map of the F2 population (Wang et al., 2019), QTLs for the two traits examined were detected using the QTL ICIMAPPING (v4.2) program (Meng et al., 2015). The experiment-wise LOD threshold significance level was determined by computing 1,000 permutations (p < 0.05) using a permutation test program. To perform associated mapping, all 1,085 SNPs in the linkage map were used for association analysis with trait phenotypes using the EMMAX program (Kang et al., 2010), and a p-value threshold for the suggested locus associations was set to p < 1 × 10⁻⁵.
Bulked segregant analysis sequencing
Another population consisting of 412 F2 individuals from the crossing of ZSZ1 and wild tenacissima was used (Supplementary Figure 3), and the content of crude fiber in leaves of these 412 individuals was determined. In total, thirty individuals with > 14% crude fiber in the leaves were pooled as a sample, whereas 30 individuals with < 7% crude fiber in leaves were used as another pooled sample. Genomic DNAs of these two pooled samples together with two parents were separately extracted from the leaves using a DNA Extraction Kit (TIANGEN Biotech, Beijing, China) according to the manufacturer’s instructions. They were used to construct a sequencing library with the TruSeq Nano Sample Prep Kit (Illumina Inc., San Diego, CA, United States) according to the manufacturer’s specifications. Subsequently, sequencing was performed using the Illumina Hiseq X platform.
After filtering the low-quality reads, the clean reads were aligned to the reference genome of ramie (variety: Zhongzhu NO. 1),1 using Burrows–Wheeler Aligner (BWA) software (v.0.7.8) (Li and Durbin, 2009), with the default parameters. The alignment results were then converted into BAM format and sorted using the SAMtools (v.1.3) (Li et al., 2009). Subsequently, SNPs and Indels for each sample were identified using the Bayesian approach implemented in the package SAMtools. SNPs with a different and homozygous allele in two parents were further filtered using GATK software (McKenna et al., 2010). The SNP-index represents the ratio of reads harboring SNPs among the entire number of reads (Abe et al., 2012), and the ΔSNP-index was the difference of the SNP-index between pooled bulks. To identify the candidate regions associated with crude fiber content, the ΔSNP-index of each locus was calculated by subtracting the SNP-index of the low crude fiber pool from that of the high crude fiber pool according to the previous method (Takagi et al., 2013).
Simple sequence repeat markers analysis
The SSRs were detected in the target regions using the software of AutoSSR (Wang et al., 2009), with the default parameters. In total, 30 individuals with an extremely low crude fiber of leaves (<7%) from 412 F2 progenies were individually extracted genomic DNAs. The SSRs were performed for PCR amplification using the primer pairs in Supplementary Table 4. The SSR assay was conducted as described by Wu and Tanksley (1993).
Expression analysis
RNA sequencing for the leaves of ZSZ1 and tenacissima had been completed by our previous study (Wang et al., 2021). Fragments per kilobase per million read values of genes fell into the QTL regions were collected from these reported transcriptome data and were used to compare their expression level between two varieties. Heatmap of gene expression was visualized using an online tool.2 Total RNAs of young leaves sampled from ZSZ1 and tenacissima were extracted, reverse-transcribed, and used for qRT-PCR analysis. Briefly, qRT-PCR was performed using iTaq™ Universal SYBR Green SuperMix (Bio-Rad, United States) using an optical 96-well plate with an iQ5 multicolor real-time PCR system (Bio-Rad). The 18S ribosomal RNA gene was used as an internal control. The primer sequences are listed in Supplementary Table 4. The relative expression level was determined according to the method proposed by Livak and Schmittgen (2001).
Sequence comparison and overexpression for whole_GLEAN_10016511
Genomic DNAs of ZSZ1 and tenacissima were used to amplify the genic region and its upstream 1.5-kb sequence for whole_GLEAN_10016511 using a standard PCR protocol with gene-specific primers (Supplementary Table 4). After being digested using 5 U of ExoI (NEB) and 0.13 U of shrimp alkaline phosphatase (Fermentas), the PCR products were performed for Sanger sequencing using a 3730xl DNA Analyzer (ABI, United States). The sequence contigs were assembled using SEQUENCER 4.1.2 (Gene Codes Co.), and the assembled sequences were aligned and compared using Clustal Omega (Sievers et al., 2011).
To clone the candidate of whole_GLEAN_10016511, the full-length sequence of this gene was amplified from a cDNA library by a high-fidelity thermostable DNA polymerase and specific primer pair (Supplementary Table 4). Then, the amplified sequence was ligated into the PBI121 vector to initiate its expression by the CaMV 35S promoter. The plasmid construct was introduced into Agrobacterium tumefaciens strain GV3101 using the heat shock method, and the resulting Agrobacterium was introduced into Arabidopsis using the floral dip method (Zhang et al., 2006). Transgenic plants were grown in a greenhouse under the temperature of 22°C and photoperiod of 15-h light/9-h dark cycle. Section of 40-day-old transgenic plants was conducted and stained with Safranin O-Fast Green, which was used to examine the stem cells through transmission light microscopy.
Data availability statement
The original contributions presented in this study are publicly available. This data can be found here: NCBI, PRJNA842875.
Author contributions
ZL and ZZ collected the data and performed the experimental laboratory works. SZ performed the data analysis. YW performed the field experiment. XY supervised the work. YW and TL conceived the work and wrote the manuscript. All authors have read and agreed to the published version of the manuscript.
Funding
This research was financially supported by the National Natural Science Foundation of China (31871678 and 32001512), the Natural Science Foundation of Hunan Province (2021JJ30769 and 2022JJ30649), and the China Agriculture Research System of MOF and MARA (CARS-16).
Conflict of interest
The authors declare that the research was conducted in the absence of any commercial or financial relationships that could be construed as a potential conflict of interest.
Publisher’s note
All claims expressed in this article are solely those of the authors and do not necessarily represent those of their affiliated organizations, or those of the publisher, the editors and the reviewers. Any product that may be evaluated in this article, or claim that may be made by its manufacturer, is not guaranteed or endorsed by the publisher.
Supplementary material
The Supplementary Material for this article can be found online at: https://www.frontiersin.org/articles/10.3389/fpls.2022.969820/full#supplementary-material
Footnotes
References
Abe, A., Kosugi, S., Yoshida, K., Natsume, S., Takagi, H., Kanzaki, H., et al. (2012). Genome sequencing reveals agronomically important loci in rice using MutMap. Nat. Biotechnol. 30, 174–178. doi: 10.1038/nbt.2095
Bai, X., Wang, X., Wang, Y., Wei, Y., Fu, Y., Rao, J., et al. (2022). Genome-wide association study of six forage traits in ramie (Boehmeria nivea L. Gaud). Plants 11:1443. doi: 10.3390/plants11111443
Chen, J., Rao, J., Wang, Y., Zeng, Z., Liu, F., Tang, Y., et al. (2019). Integration of quantitative trait loci mapping and expression profiling analysis to identify genes potentially involved in ramie fiber lignin biosynthesis. Genes 10:842. doi: 10.3390/genes10110842
Chen, J., Yu, R., Liu, L., Wang, B., and Peng, D. (2016). Large-scale developing of simple sequence repeat markers and probing its correlation with ramie (Boehmeria nivea L.) fiber quality. Mol. Genet. Genomics 291, 753–761. doi: 10.1007/s00438-015-1143-2
Chen, K., Luan, M., Xiong, H., Chen, P., Chen, J., Gao, G., et al. (2018). Genome-wide association study discovered favorable single nucleotide polymorphisms and candidate genes associated with ramet number in ramie (Boehmeria nivea L.). BMC Plant Biol. 18:345. doi: 10.1186/s12870-018-1573-1
CNS GB/T 6432-2018 (2018). Determination of crude protein in feeds—Kjeldahl method. Beijing: National Standardization Administration.
He, Q., Zeng, Z., Li, F., Huang, R., Wang, Y., and Liu, T. (2021). Ubiquitylome analysis reveals the involvement of ubiquitination in the bast fiber growth of ramie. Planta 254:1. doi: 10.1007/s00425-021-03652-x
Huang, K., Shi, Y., Pan, G., Zhong, Y., Sun, Z., Niu, J., et al. (2021). Genome-wide association analysis of fiber fineness and yield in ramie (Boehmeria nivea) using SLAF-seq. Euphytica 217:22. doi: 10.1007/s10681-020-02757-w
Ilegems, M., Douet, V., Meylan-Bettex, M., Uyttewaal, M., Brand, L., Bowman, J. L., et al. (2010). Interplay of auxin, KANADI and class III HD-ZIP transcription factors in vascular tissue formation. Development 137, 975–984. doi: 10.1242/dev.047662
ISO 6865:2000 (2000). Animal feeding stuffs—determination of crude fibre content—method with intermediate filtration. Geneva: ISO.
Kang, H. M., Sul, J. H., Service, S. K., Zaitlen, N., Kong, S., Freimer, N., et al. (2010). Variance component model to account for sample structure in genome-wide association studies. Nat. Genet. 42, 348–354. doi: 10.1038/ng.548
Li, H., and Durbin, R. (2009). Fast and accurate short read alignment with Burrows-Wheeler transform. Bioinformatics 25, 1754–1760. doi: 10.1093/bioinformatics/btp324
Li, H., Handsaker, B., Wysoker, A., Fennell, T., Ruan, J., Homer, N., et al. (2009). The sequence alignment/map format and SAMtools. Bioinformatics 25, 2078–2079. doi: 10.1093/bioinformatics/btp352
Li, H. L. (1970). The origin of cultivated plants in Southeast Asia. Econ. Bot. 24, 3–19. doi: 10.1007/BF02860628
Liu, C., Zeng, L., Zhu, S., Wu, L., Wang, Y., Tang, S., et al. (2018). Draft genome analysis provides insights into the fiber yield, crude protein biosynthesis, and vegetative growth of domesticated ramie (Boehmeria nivea L. Gaud). DNA Res. 25, 173–181. doi: 10.1093/dnares/dsx047
Liu, C., Zhu, S., Tang, S., Wang, H., Zheng, X., Chen, X., et al. (2017). QTL analysis of four main stem bark traits using a GBS-SNP-based high-density genetic map in ramie. Sci. Rep. 7:13458. doi: 10.1038/s41598-017-13762-w
Liu, T., Li, L., Zhang, Y., Xu, C., Li, X., and Xing, Y. (2011). Comparison of quantitative trait loci for rice yield, panicle length and spikelet density across three connected populations. J. Genet. 90, 377–382. doi: 10.1007/s12041-011-0083-9
Liu, T., Zhang, Y., Xue, W., Xu, C., Li, X., and Xing, Y. (2010). Comparison of quantitative trait loci for 1,000-grain weight and spikelets per panicle across three connected rice populations. Euphytica 175, 383–394. doi: 10.1007/s10681-010-0186-z
Liu, T., Zhu, S., Fu, L., Tang, Q., Yu, Y., Chen, P., et al. (2013). Development and characterization of 1,827 expressed sequence tag-derived simple sequence repeat markers for ramie (Boehmeria nivea L. Gaud). PLoS One 8:e60346. doi: 10.1371/journal.pone.0060346
Liu, T., Zhu, S., Tang, Q., and Tang, S. (2014). QTL mapping for fiber yield-related traits by constructing the first genetic linkage map in ramie (Boehmeria nivea L. Gaud). Mol. Breed. 34, 883–892. doi: 10.1007/s11032-014-0082-7
Livak, K. J., and Schmittgen, T. D. (2001). Analysis of relative gene expression data using real-time quantitative PCR and the 2- ΔΔCT method. Methods 25, 402–408. doi: 10.1006/meth.2001.1262
Luan, M., Liu, C., Wang, X. Y., Sun, Z., and Chen, J. (2017). SSR markers associated with fiber yield traits in ramie (Boehmeria nivea L. Gaudich). Ind. Crops Prod. 107, 439–445. doi: 10.1016/j.indcrop.2017.05.065
McKenna, A., Hanna, M., Banks, E., Sivachenko, A., Cibulskis, K., Kernytsky, A., et al. (2010). The genome analysis toolkit: A MapReduce framework for analyzing next-generation DNA sequencing data. Genome Res. 20, 1297–1303. doi: 10.1101/gr.107524.110
Meng, L., Li, H., Zhang, L., and Wang, J. (2015). QTL IciMapping: Integrated software for genetic linkage map construction and quantitative trait locus mapping in biparental populations. Crop J. 3, 269–283. doi: 10.1016/j.cj.2015.01.001
Nakano, Y., Yamaguchi, M., Endo, H., Rejab, N. A., and Ohtani, M. (2015). NAC-MYB-based transcriptional regulation of secondary cell wall biosynthesis in land plants. Front. Plant Sci. 6:288. doi: 10.3389/fpls.2015.00288
Pérez, A., Wencomo, H. B., Armengol, N., and Reyes, F. (2013). Boehmeria nivea (L.) Gaud. Pastos Forrajes 36, 404–408.
Rehman, M., Gang, D., Liua, Q., Chen, Y., Wang, B., Peng, D., et al. (2019). Ramie, a multipurpose crop: Potential applications, constraints and improvement strategies. Ind. Crops Prod. 137, 300–307. doi: 10.1016/j.indcrop.2019.05.029
Sievers, F., Wilm, A., Dineen, D., Gibson, T. J., Karplus, K., Li, W., et al. (2011). Fast, scalable generation of high-quality protein multiple sequence alignments using clustal omega. Mol. Syst. Biol. 7:539. doi: 10.1038/msb.2011.75
Subandi, M. (2012). The effect of fertilizers on the growth and the yield of ramie (Boehmeria nivea L. Gaud). Asian J. Agric. Rural Dev. 2, 126–135.
Takagi, H., Abe, A., Yoshida, K., Kosugi, S., Natsume, S., Mitsuoka, C., et al. (2013). QTL-seq: Rapid mapping of quantitative trait loci in rice by whole genome resequencing of DNA from two bulked populations. Plant J. 74, 174–183. doi: 10.1111/tpj.12105
Wang, C., Guo, W., Zhang, T., Li, Y., and Liu, H. (2009). AutoSSR: An improved automatic software for SSR analysis from large-scale EST sequences. Cotton Sci. 2l, 243–247.
Wang, Y., Li, F., He, Q., Bao, Z., Zeng, Z., An, D., et al. (2021). Genomic analyses provide comprehensive insights into the domestication of bast fiber crop ramie (Boehmeria nivea). Plant J. 107, 787–800. doi: 10.1111/tpj.15346
Wang, Y., Zeng, Z., Li, F., Yang, X., Gao, X., Ma, Y., et al. (2019). A genomic resource derived from the integration of genome sequences, expressed transcripts and genetic markers in ramie. BMC Genomics 20:476. doi: 10.1186/s12864-019-5878-8
Wu, K. S., and Tanksley, S. D. (1993). Abundance, polymorphism and genetic mapping of microsatellites in rice. Mol. Gen. Genet. 241, 225–235. doi: 10.1007/BF00280220
Zeng, Z., Wang, Y., Liu, C., Yang, X., Wang, H., Li, F., et al. (2019). Linkage mapping of quantitative trait loci for fiber yield and its related traits in the population derived from cultivated ramie and wild B. nivea var. tenacissima. Sci. Rep. 9:16855. doi: 10.1038/s41598-019-53399-5
Zeng, Z., Zhu, S., Wang, Y., Bai, X., Liu, C., Chen, J., et al. (2022). Resequencing of 301 ramie accessions identifies genetic loci and breeding selection for fiber yield traits. Plant Biotechnol. J. 20, 323–334. doi: 10.1111/pbi.13714
Zhang, X., Henriques, R., Lin, S. S., Niu, Q. W., and Chua, N. H. (2006). Agrobacterium-mediated transformation of Arabidopsis thaliana using the floral dip method. Nat. Protoc. 1, 641–646. doi: 10.1038/nprot.2006.97
Zhong, R., and Ye, Z. H. (2015). Secondary cell walls: Biosynthesis, patterned deposition and transcriptional regulation. Plant Cell Physiol. 56, 195–214. doi: 10.1093/pcp/pcu140
Keywords: ramie, crude protein content, crude fiber content, quantitative trait locus, MYB gene
Citation: Liu Z, Zeng Z, Yang X, Zhu S, Liu T and Wang Y (2022) Genetic insights into the crude protein and fiber content of ramie leaves. Front. Plant Sci. 13:969820. doi: 10.3389/fpls.2022.969820
Received: 15 June 2022; Accepted: 08 August 2022;
Published: 04 October 2022.
Edited by:
Wànkuí Gong, Cotton Research Institute (CAAS), ChinaReviewed by:
Lijun Liu, Huazhong Agricultural University, ChinaXin Wei, Shanghai Normal University, China
Quanwei Lu, Anyang Institute of Technology, China
Copyright © 2022 Liu, Zeng, Yang, Zhu, Liu and Wang. This is an open-access article distributed under the terms of the Creative Commons Attribution License (CC BY). The use, distribution or reproduction in other forums is permitted, provided the original author(s) and the copyright owner(s) are credited and that the original publication in this journal is cited, in accordance with accepted academic practice. No use, distribution or reproduction is permitted which does not comply with these terms.
*Correspondence: Touming Liu, bGl1dG91bWluZ0BjYWFzLmNu; Yanzhou Wang, d3l6aGNmQDE2My5jb20=