- 1Key Laboratory of Agricultural Water Resources, Hebei Key Laboratory of Agricultural Water-Saving, Center for Agricultural Resources Research, Institute of Genetics and Developmental Biology, Chinese Academy of Sciences, Shijiazhuang, China
- 2State Key Laboratory of North China Crop Improvement and Regulation/Key Laboratory of Crop Growth Regulation of Hebei Province, College of Agronomy, Hebei Agricultural University, Baoding, China
Improving water use efficiency (WUE) has been proven to be a prosperous way to produce more grain in drought-prone areas. Transpiration efficiency (TE) has been proposed as a criterion for screening cultivars with high WUE. This study quantifies the relations of TE to relative soil water content (RSWC) gradients using pot experiments and evaluates the capability of the relations of TE-RSWC on assessing the cultivar performance in field yield and WUE. Twelve winter wheat cultivars were grown at 6 RSWC, 12.1, 24.2, 36.3, 48.4, 60.5, and 72.6% of field capacity (FC = 24.8 g/g) for 33 days in tightly sealed pots preventing soil evaporation. The results showed that TE decreased power functionally following the increase in RSWC for all cultivars. The relationship could be described as TE = TE FC × (RSWC) b, named TE–RSWC curve. This curve could be divided into an orderly area where the rank of cultivars was stable when RSWC ≤ 12.1% or RSWC ≥ 72.6% and a disorderly area where the rank was unstable when 12.1% < RSWC < 72.6%. To assess the consistency of pot TE to field yield and WUE, the same 12 varieties were grown under rainfed and two irrigations (75 mm at the jointing and flowering stages, respectively). TE FC was found to be positively related to field yield and WUE independent of irrigation. TE measured near the wilting point was negatively related to field yield and WUE. These results indicated that TE FC could be used as a surrogate for screening high-yield and high-WUE cultivars. The consistency and inconsistency can be attributed to the orderly area and disorderly area of the TE–RSWC curves.
Introduction
Wheat (Triticum aestivum L.) is the major food crop in most countries worldwide. Most wheat crops are planted in arid and semiarid regions or during drought seasons. The scarcity of freshwater resulting from global climate change, population growth and urbanization is making irrigation more difficult than ever (Shiferaw et al., 2013). Thus, wheat production is usually restricted and will continue to be limited more seriously by drought stress (Lobell et al., 2015). However, wheat demand is expected to increase by over 30% due to human population growth (Prasad et al., 2011). Therefore, how to produce more grain per drop has already been intensively studied in drought-prone areas. Improving wheat water use efficiency (WUE, termed grain or biomass production per unit of water use) is considered a possible method (Tfwala et al., 2021). Breeding for varieties with high transpiration efficiency (TE, biomass production per unit of transpiration) may help to achieve high WUE cultivars. However, the ability to screen cultivars with high TE from large populations is limited by slow, low-throughput, and/or expensive screening procedures (Fletcher et al., 2018).
Many properties are known to be suitable as surrogates for high WUE and yield. Stable isotope 13C is discriminated during fixation of carbon and thus plants contain a smaller ratio of 13C to 12C than the atmospheric CO2 [Carbon isotope discrimination (Δ)]. Δ has been observed tightly related to WUE and TE and thus widely accepted as an indicator for WUE (Farquhar and Richards, 1984; Condon et al., 1993; Deery et al., 2016). It has been used to select cultivars with high WUE and as a marker in breeding assisting in phenotypic selection for high WUE (Collard et al., 2005). Canopy temperature reveals the ability of plant to extract soil water and varies among genotypes due to variations in energy balance, stomatal conductance and transpiration (Balota et al., 2008). Lu et al. (2020) evaluated the possibility of using canopy temperature as an indicator to improve the yield and WUE of winter wheat and concluded that the ability to efficiently use soil water and maintain dry matter production at the grain-filling stage are the two important desired characteristics. Other possible traits, such as n-alkanes in leaf wax (the first or second abundant component in leaf wax, Wang et al., 2015; Liu et al., 2019), ash content (significantly correlated to 1/TE and Δ, Masle et al., 1992), chlorophyll content, photosynthetic rate, and TE at the leaf and plant levels (These characters are directly related to carbon fixation and WUE, Misra et al., 2010; Deery et al., 2016), are also related to grain yield and WUE. Among all traits studied, TE at the plant level (g mass/kg transpiration) is considered suitable as an indicator of yield and WUE due to its stability and accessibility in comparison with TE at the leaf level.
At the plant level, TE is the ratio of biomass yield (BY) per unit of transpiration loss (Tr). WUE is the ratio of BY to evapotranspiration (ET). Here, ET is composed of non-productive evaporation from the soil surface (E) and productive Tr through the crop surface. E is an important component of WUE but is excluded when referring to TE. Therefore, TE is more like an intrinsic feature of a certain cultivar than WUE. A three-factor model was introduced to indicate the importance of TE in relation to WUE (Ehdaie, 1995): WUE = UE × TE × HI, where UE is the ratio of water transpired to seasonal ET, HI is the harvest index, and TE is the ratio of biomass to transpiration. Although the function indicated that choosing cultivars with high TE may play an important role in improving the WUE, the question remains of how to measure and compare TE between varieties.
The difficulty in accurate measurement of wheat TE exists in that E and Tr cannot be accurately separated from ET (Tfwala et al., 2021). ET is usually determined by the soil water balance equation (Function 4 in the section “Materials and methods”) using soil cores, neutron probes or soil water probes. Tr is not easy to measure directly and is usually calculated as ET-E, and E is measured using a lysimeter. In the situation of a micro lysimeter, E is usually overestimated with the absence of root water uptake, which causes a higher soil water content (SWC) in the lysimeter than that around the root system (Villalobos and Fereres, 1990). In the situation of a large lysimeter, the soil surface is usually covered by particles and beads to prevent the occurrence of E, and the total water loss is considered Tr. For example, Vadez et al. (2008) used large pots (0.2 m diameter and 1.0 m high for groundnut and chickpea; 0.25 m diameter and 2.0 m long for pigeon pea) to make the situation similar to field conditions. However, only 90% of soil evaporation is prevented with a 2 cm polyethylene bead layer. Fletcher et al. (2018) provided a small pot-in-bucket method to rapidly and accurately screen for high TE wheat cultivars. However, the shortcoming of the pot-in-bucket method is that only one soil moisture can be formed due to the method of water supplementation.
The rank of TE among cultivars usually varied under different soil moistures. This aroused the question of how to compare TE between genotypes. Studying the relationship between TE and SWC may help us to understand the variation in the rank of cultivars. To date, scientists have checked the effect of soil moisture (Siahpoosh and Dehghanian, 2012; Natarajan et al., 2021) on the WUE and/or TE of various kinds of crops. In addition to the negative linear regression of TE against ET reported by Siahpoosh and Dehghanian (2012), the response of TE to gradients of SWC has been less studied. The present study offered a method to study the relations of TE to SWC. The objectives of the present study were (I) to assess the response pattern of TE along SWC gradients and (II) to evaluate whether TE measured at the seedling stage can help to screen wheat cultivars with high yield and WUE in the field.
Materials and methods
Study area
The present study included two experiments, a pot experiment and a field experiment. They were conducted at the Luancheng Agro-Ecosystem Experimental Station of the Chinese Academy of Sciences (114° 40′ E, 37° 50′ N, 50.1 m a.s.l). The experimental station is located on the North China Plain (NCP), which is characterized by a winter wheat–summer maize annual double-cropping system, and water shortages occur during the winter wheat-growing season. The annual precipitation varies be-tween 400 and 600 mm, and approximately 30% falls in the winter wheat-growing season on the NCP.
Pot experiment
A pot experiment was conducted to screen wheat cultivars with high WUE from their TE at the seedling stage. Twelve cultivars were exposed to 6 RSWC levels. Each combination was duplicated 4 times. The experiment was conducted in the following process:
(1) About the pot. The plastic pot used in the present study was a product of an invention patent of the authors, Figure 1 (Liu and Liu, 2006). The pot (d = 110 mm, h = 50 mm) was composed of a basin part and a double layer lid. The two parts made a whole pot when the lid was tightly clung to the basin. The double layer lid included a bottom layer and an upper layer. The bottom layer (d = 110 mm) was the same diameter as the basin. The upper layer was a rotatable cover (d = 35 mm). The two layers were fixed together through an axis at the center of the bottom layer. There is a rotatable knob at the center of the upper lid layer. The upper layer could be turned by turning the knob. Irrigation holes (d = 3 mm), 15 mm away from the axis, were made on both layers of lid. Researchers could provide water through the irrigation hole or keep the pot sealed by rotating the upper layer.
(2) Preparation of seedlings. Approximately 500 seeds of each cultivar were pre-soaked on November 1, 2020, in pure water for 24 h and then placed on a piece of filter paper in a petri dish. The seeds were covered with another piece of filter paper to maintain humidity around the seeds. The seedlings were suitable for the experiment when the buds grew up to 20 ∼ 30 mm long.
(3) Preparation of pots. Ten seedling holes (seedling hole, d = 4 mm, 20 mm from the edge and 35 mm to the center) were made equidistantly from each other using a portable electric drill. The holes were then filled with a rubber tube (6 ∼ 8 mm long, 4 and 3 mm of outer and inner diameter, respectively). The pot was then filled with tap-water-washed and air-dried sand that passed through 60 mesh sieves. The total weight of each pot was recorded as W0. The field capacity (FC), wilting point (WP) and maximal available water (AW) of the sand were 24.7, 1.2, and 23.5%, respectively.
(4) Transplanting. Seedlings 2 ∼ 3 cm long were tucked into rubber tubes in seed-ling holes on November 5, 2020. Simultaneously, 19.2, 33.6, 48.0, 62.4, 76.8, and 91.2 g of tap water were given to each pot (the corresponding sand moisture was 4, 7, 10, 13, 16, and 19%, respectively) (water weight/dry sand weight × 100%). The double layer lid with seedlings was then tightly fixed together with the basin part, and the irrigation hole was covered.
(5) Growing conditions. Plants were cultivated in a growth chamber system (SAFE-LED-3, Zhejiang, China). The available ground surface was approximately 10 m2 (3.6 m long and 2.8 m wide), and the height was 3.5 m in each chamber. Pots with the same cultivar were placed together in a rectangular shape. In each cultivar group, four pots of the same SWC were grouped in line, and then all pots were arranged in a sequence of increasing SWC (4 pots of the same SWC × 6 lines with increasing SWC). Air temperature (18°C/8°C, day/night, 14/10 h), relative air humidity (60%) and light intensity (PAR, 500 μmol photon⋅m–2⋅s–1; total light intensity, 50000 lux) were controlled automatically. The air entered the chamber from the holes on the four walls of the chamber (d = 2 mm, 0.25 mesh). The cold light source was a shadowless design. Therefore, the growing conditions were uniform everywhere in the chamber. There was no need to consider the present experiment a split-plot design. No nutrients were given during the experimental duration.
(6) Water control: Six soil moistures, 12.1, 24.2, 36.3, 48.4, 60.5, and 72.6% of FC (equal to absolute SWC 3% ± 1%, 6% ± 1%, 9% ± 1%, 12% ± 1%, 15% ± 1%, 18% ± 1%, respectively), were applied in the present study. The sand moisture was measured by weighing the pots once a day using a balance (BSA2202S, Sartorius, Germany). Seedling fresh weight was ignored when deciding to give water or not. The sand moisture was controlled target absolute SWC ± 1.0% around the target by giving water to each pot when the moisture was approaching “target absolute SWC - 1.0%” until it reached “target absolute SWC + 1.0%,” using a 20 ml syringe. No water was given to the 12.1% treatment since SWC was approaching the lower limit at the end of the experiment. Two irrigations were applied to the 24.2 and 36.3% treatments, three to the 48.4% treatment and four to the 60.5 and 72.6% treatments.
(7) Harvesting. The pot experiment was harvested 33 days after being transplanted to pots (December 8, 2020, approximately 5 leaves). The pot weight was recorded as W1 using a balance (BSA2202S, Sartorius, Germany). The seedlings were cut off from the pot surface, and then the lid was removed. The remaining shoot was then separated from the root at the tillering node. The root was washed free of sand. The shoots and roots were then oven-dried at 80°C.
(8) Pot TE calculation. Total final weight, including dry shoots (W2) and dry roots (W3), was measured. TE was calculated as
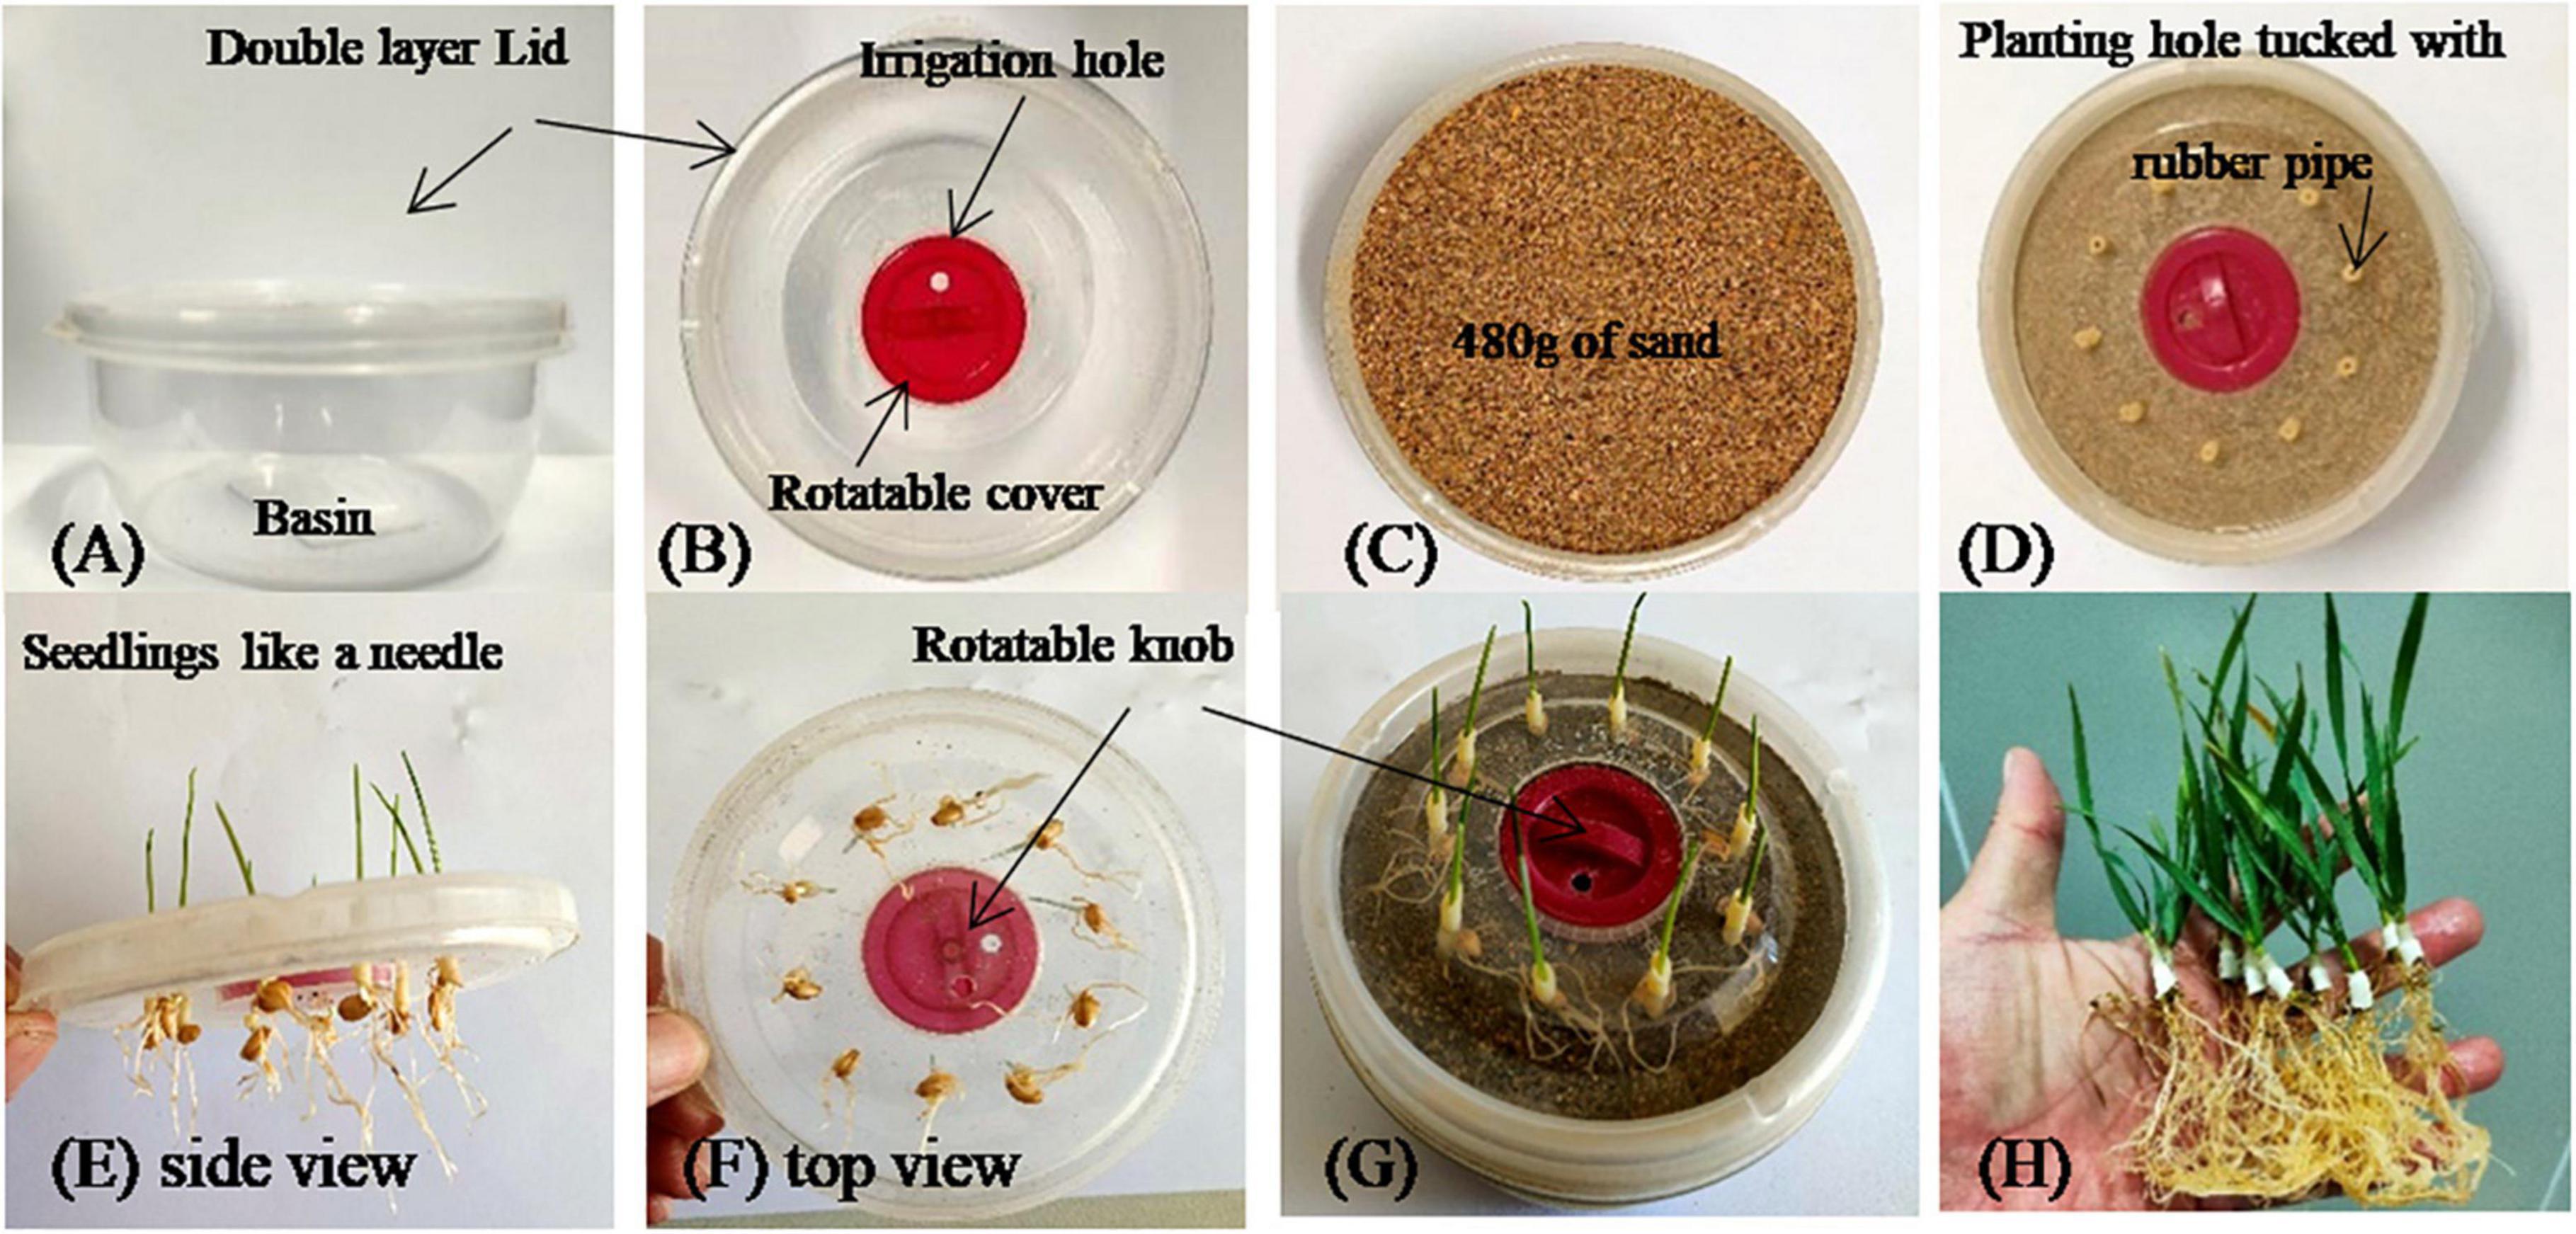
Figure 1. The technological process of the pot experiment evaluating wheat TE response to gradients of soil water contents. The top view and side view of the pot is shown in panels (A,B). The pot is filled with sand (C). The lid was placed on the pot with sand after planting holes were tucked with rubber pipe 6 ∼ 8 mm long (D). Seedlings were tucked into the rubber pipe after growing into a needle shape in a petri dish (E,F). The pot was covered with lid with seedlings after being watered 1 higher above the target soil moisture (G). The pot was broken using hacksaw for taking photograph (H). If a whole plant is not needed, the seedlings could be cut off outside the pot using scissors first, and continue to be cut into aboveground and belowground parts from the node between root and shoot, after removing the lid.
where shoot mass is dry shoot weight; root mass is root dry weight; and Tr is transpiration, which is calculated as the total irrigation amount minus the water left in the pot (W1 − W0 − W2 − W3 + irrigation). TE total was also divided into TE shoot and TE root. They were calculated as the ratio of dry mass produced by each part to the total water loss.
Field experiment
Experimental design
To assess the consistency of seedling TE to field-measured WUE of a whole growing season, the 12 winter wheat cultivars were also grown in a field at the Luancheng Experimental Station. The field experiment was completely a randomized de-sign. Cultivars and irrigation were randomly assigned to each plot. The experiment was repeated 3 times, and 72 plots were set up (1.4 m × 10 m of area, 8 rows with 17.5 cm of row space). The protection line was 1.0 m between plots planted with the wheat Cultivar Shimai 19. Half of the 72 plots were given no water, and another half were given two irrigations (75 mm at the jointing stage and 75 mm at the flowering stage). The field experiment was sowed using a plot planter (ZZXB-8A, Haoqing Machinery Factory, Hebei, China).
The field had a loamy soil with 1.2% organic matter and with 15 mg kg–1, 150 mg kg–1, and 80 mg kg–1 available phosphorus, potassium, and nitrogen, respectively. Before rotary tillage, 220 kg P2O5 ha–1, 210 kg N ha–1, and 45 kg K2O ha–1 were given as base fertilizers, and there was no top dressing during the whole growing period. Wheat was sown on October 15, 2019. The soil water content at sowing time was 73.6% ± 3.5% of the field capacity in the 0 cm ∼ 20 cm soil layer. The meteorological conditions of the wheat-growing season are shown in Figure 2.
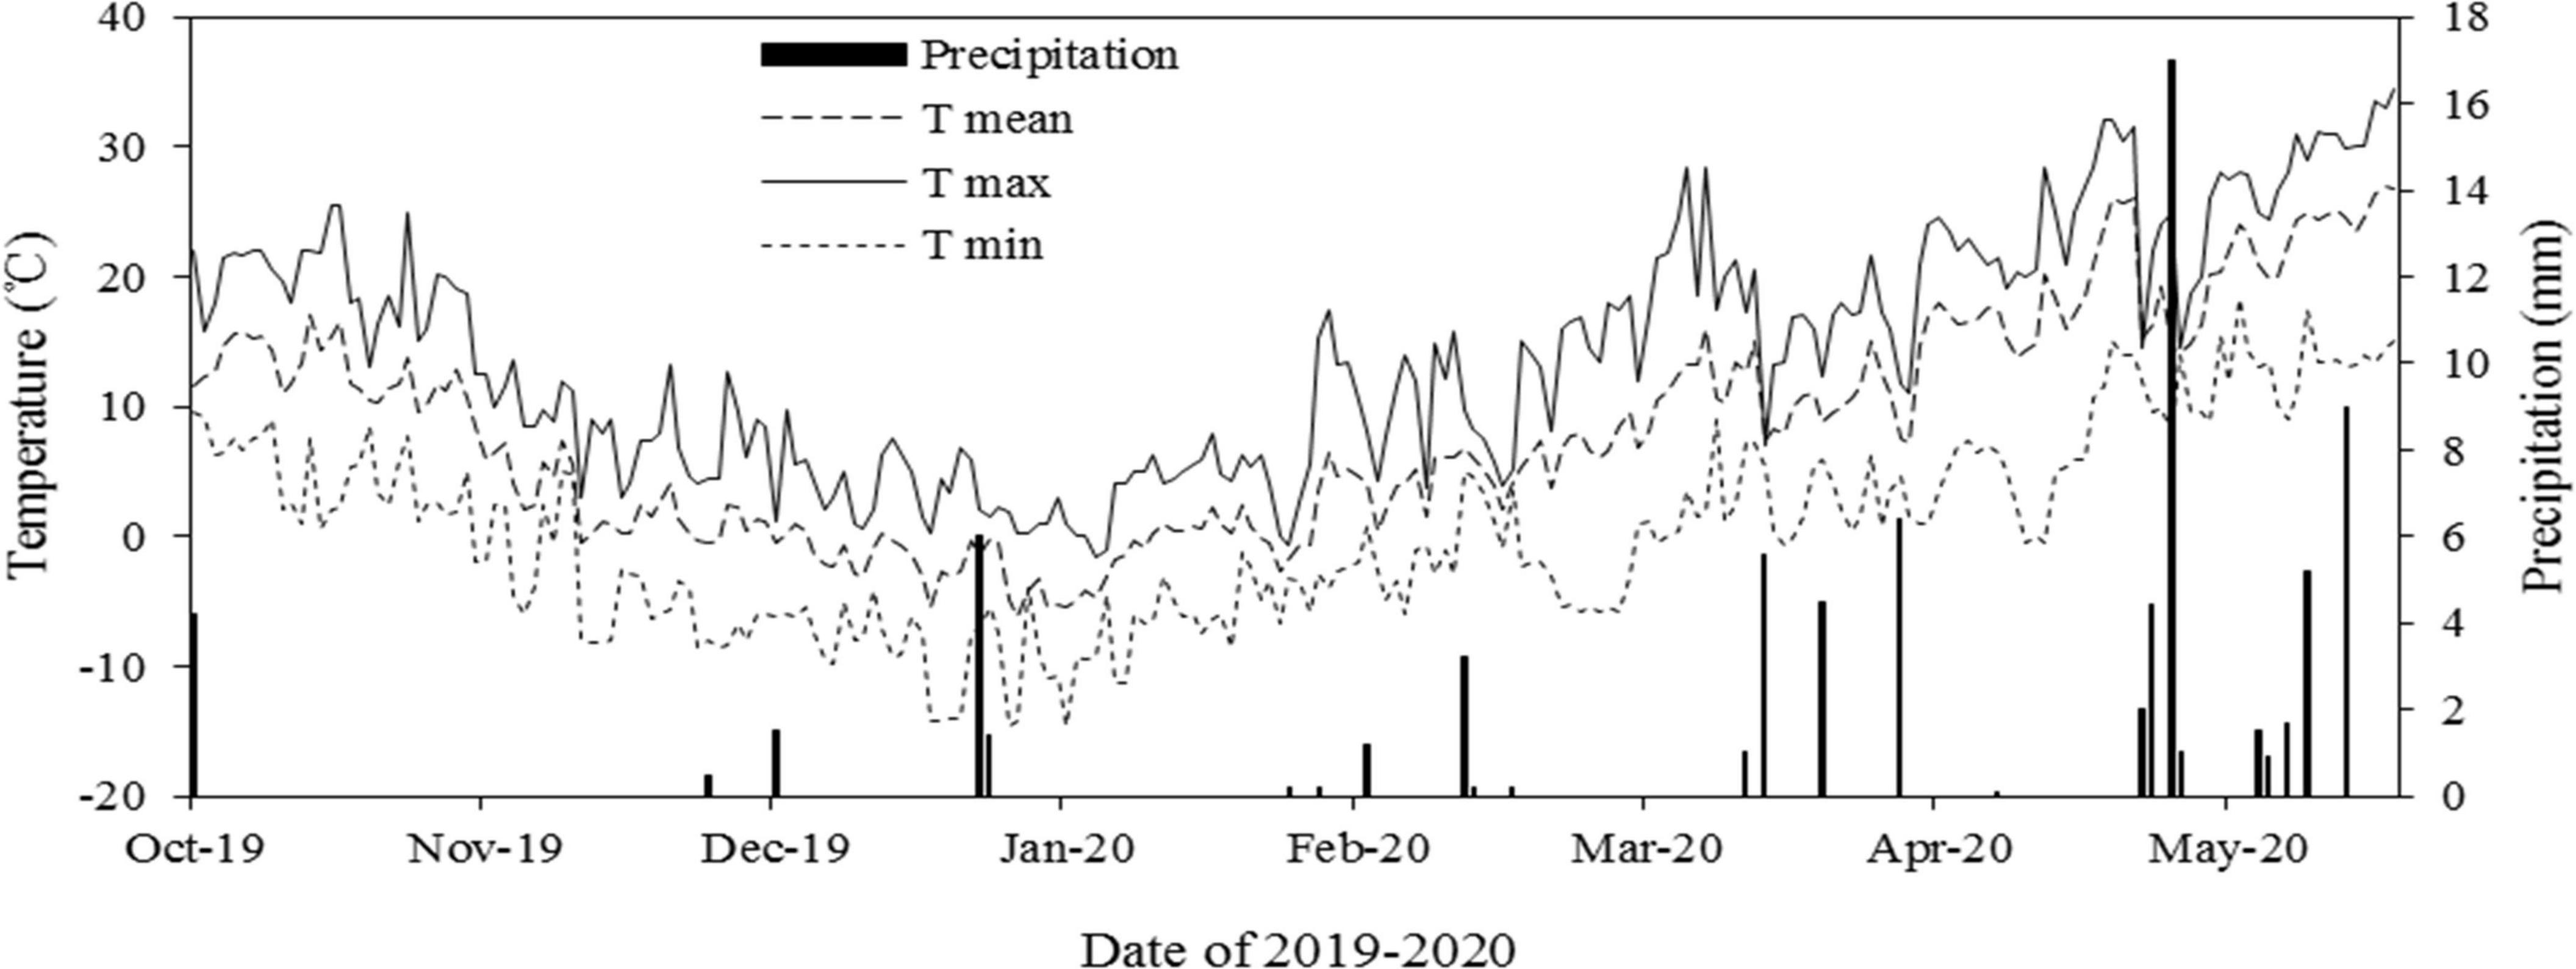
Figure 2. Meteorological conditions during the field experiment from October 16, 2019 to June 10, 2020.
Calculation of water use efficiency
An area of 4 rows × 2 m (1.40 m2) in nearly the middle of each plot was harvested manually at physiological maturity on the 5th (drought treatment) and 10th (irrigated treatment) of June 2021. Grain was obtained using a threshing machine (QKT-320A, Weihui Xinnongke Machinery Factory, Henan, China) and air-dried to constant weight. The SWC at sowing and harvesting time was measured every 10 cm from ground sur-face down to 200 cm by soil cores and oven (DHG-9620A, Shaying Scientific Instrument Co., Ltd., Shanghai, China) dried to a constant weight at 60°C.
ET was calculated according to the water balance equation (Allen et al., 1998):
where, SWD is soil water depletion from 0 to 200 cm profile (initial soil water content minus final soil water content), P is precipitation, I is irrigation, D is drainage from the root zone, CR is capillary rise to the root zone, and R is runoff. Equation (4) was simplified by zeroing 3 terms: (1) D = 0 since irrigation and precipitation were not high enough to leak below 200 cm. (2) CR = 0 due to the deep groundwater table (ap-proximately 40 m below the surface). (3) R = 0 as a result of the deep soil profile and large water-holding capacity of the field (Zhang et al., 2008, 2009). As a result, the water balance equa-tion transformed to
WUE was calculated as GY and BY divided by evapotranspiration (ET),
Data analysis
Statistical analysis was performed in SPSS 17.0 (Statistical Product and Service Solutions, IBM). The regression of TE to RSWC was analyzed as
where, TE FC and b are constant items. TE FC is the minimal potential TE of a certain cultivar since wheat is seldom planted under conditions of soil moisture higher than FC. The TE–RSWC curve was drawn in Microsoft Office Excel 2013 (Microsoft Co., Ltd.). The Pearson correlation and linear regression of TE (at different RSWC levels) to field yield and WUE of TE FC to b were also analyzed. Two-way ANOVA was applied to test (I) the effect of soil moisture levels, cultivars and their interaction on pot TE and (II) the effect of irrigation, cultivars and their interaction on field yield and WUE.
Results
Growth, transpiration and transpiration efficiency
Wheat seedlings grew well and showed a significant difference in final biomass at 33 days after exposure to 6 soil moisture levels (Figure 3). Both cultivars and RSWC showed significant effects on the growth of wheat seedlings (Table 1). The combination of cultivars and RSWC showed a significant interactive effect on shoot dry mass and no effect on root and total dry mass (Table 1). The shoot, root and total biomass per pot (Figure 3) showed an increasing trend with increasing RSWC. The increase was in a linear relationship with the increase in RSWC from 12.1 to 60.5%. Eight cultivars stopped increasing when the SWC reached 60.5%. However, the masses of Heng136, Kenong8162, Lunxuan987 and Xinong511 continued to increase after 60.5% SWC.
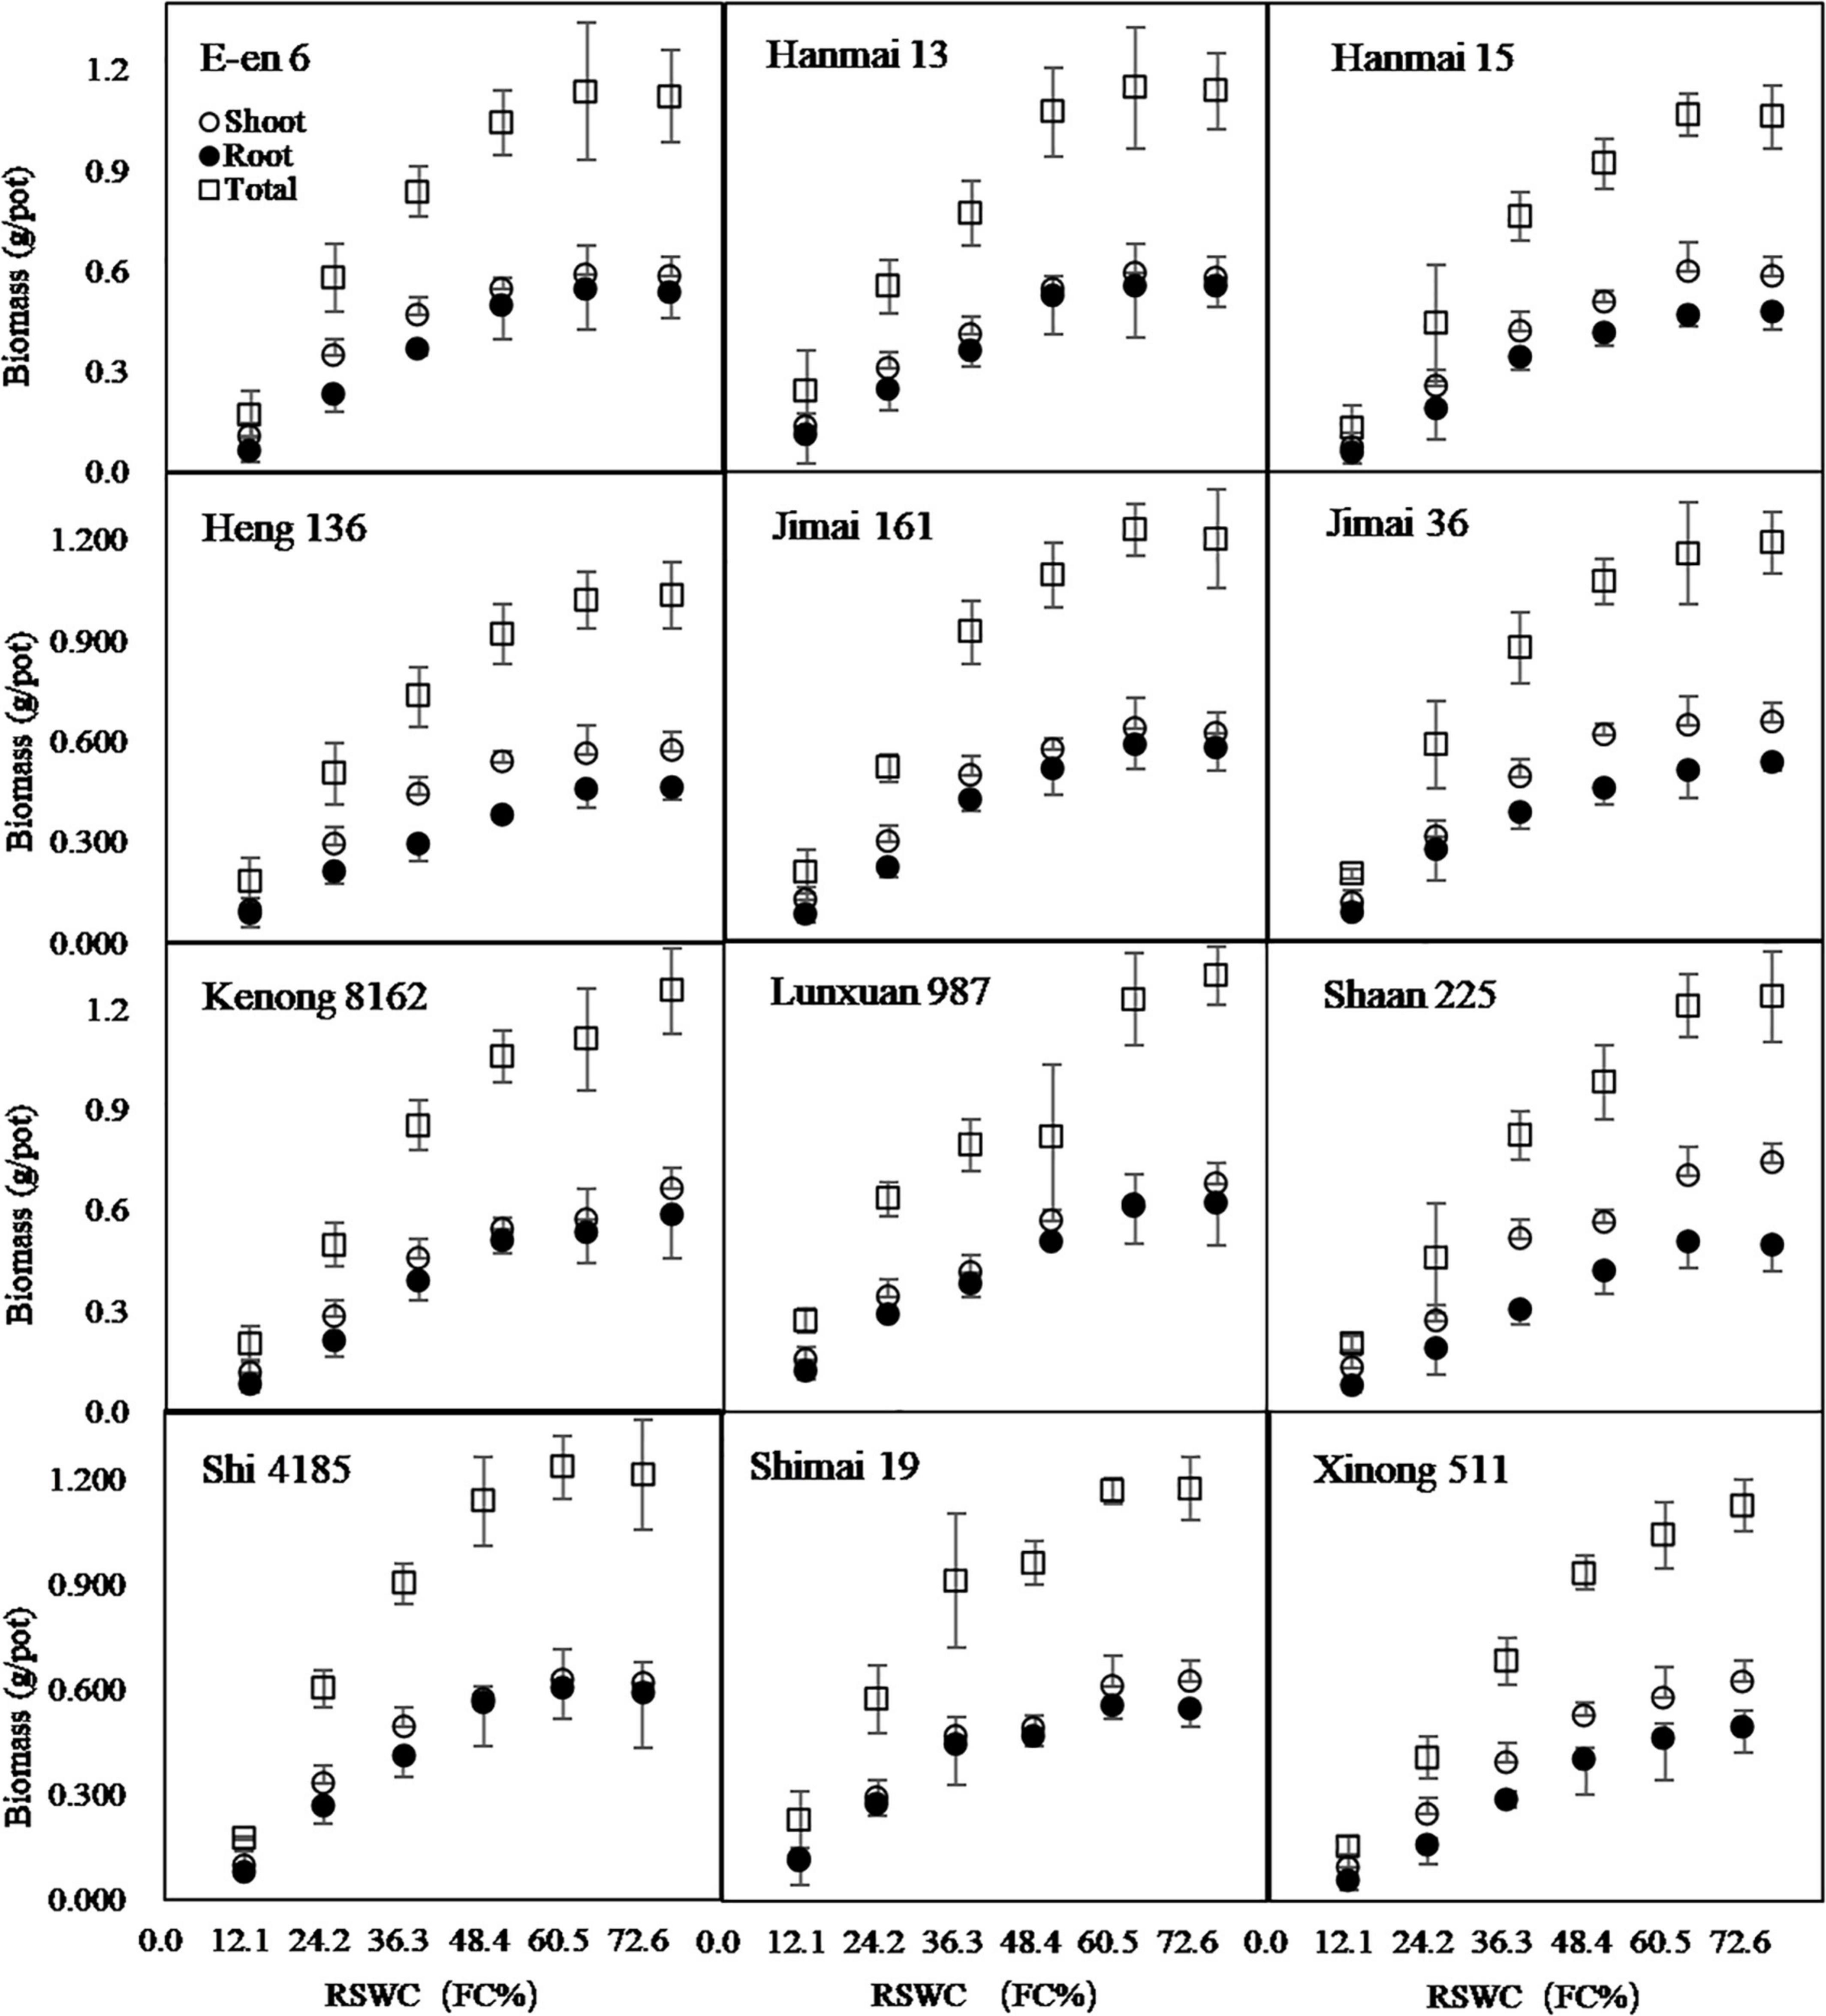
Figure 3. Growth of shoot, root and total biomass after 33 days cultivation under 6 soil water contents. RSWC, soil water content. FC, field capacity. Data are shown as Mean ± SD, n = 4.
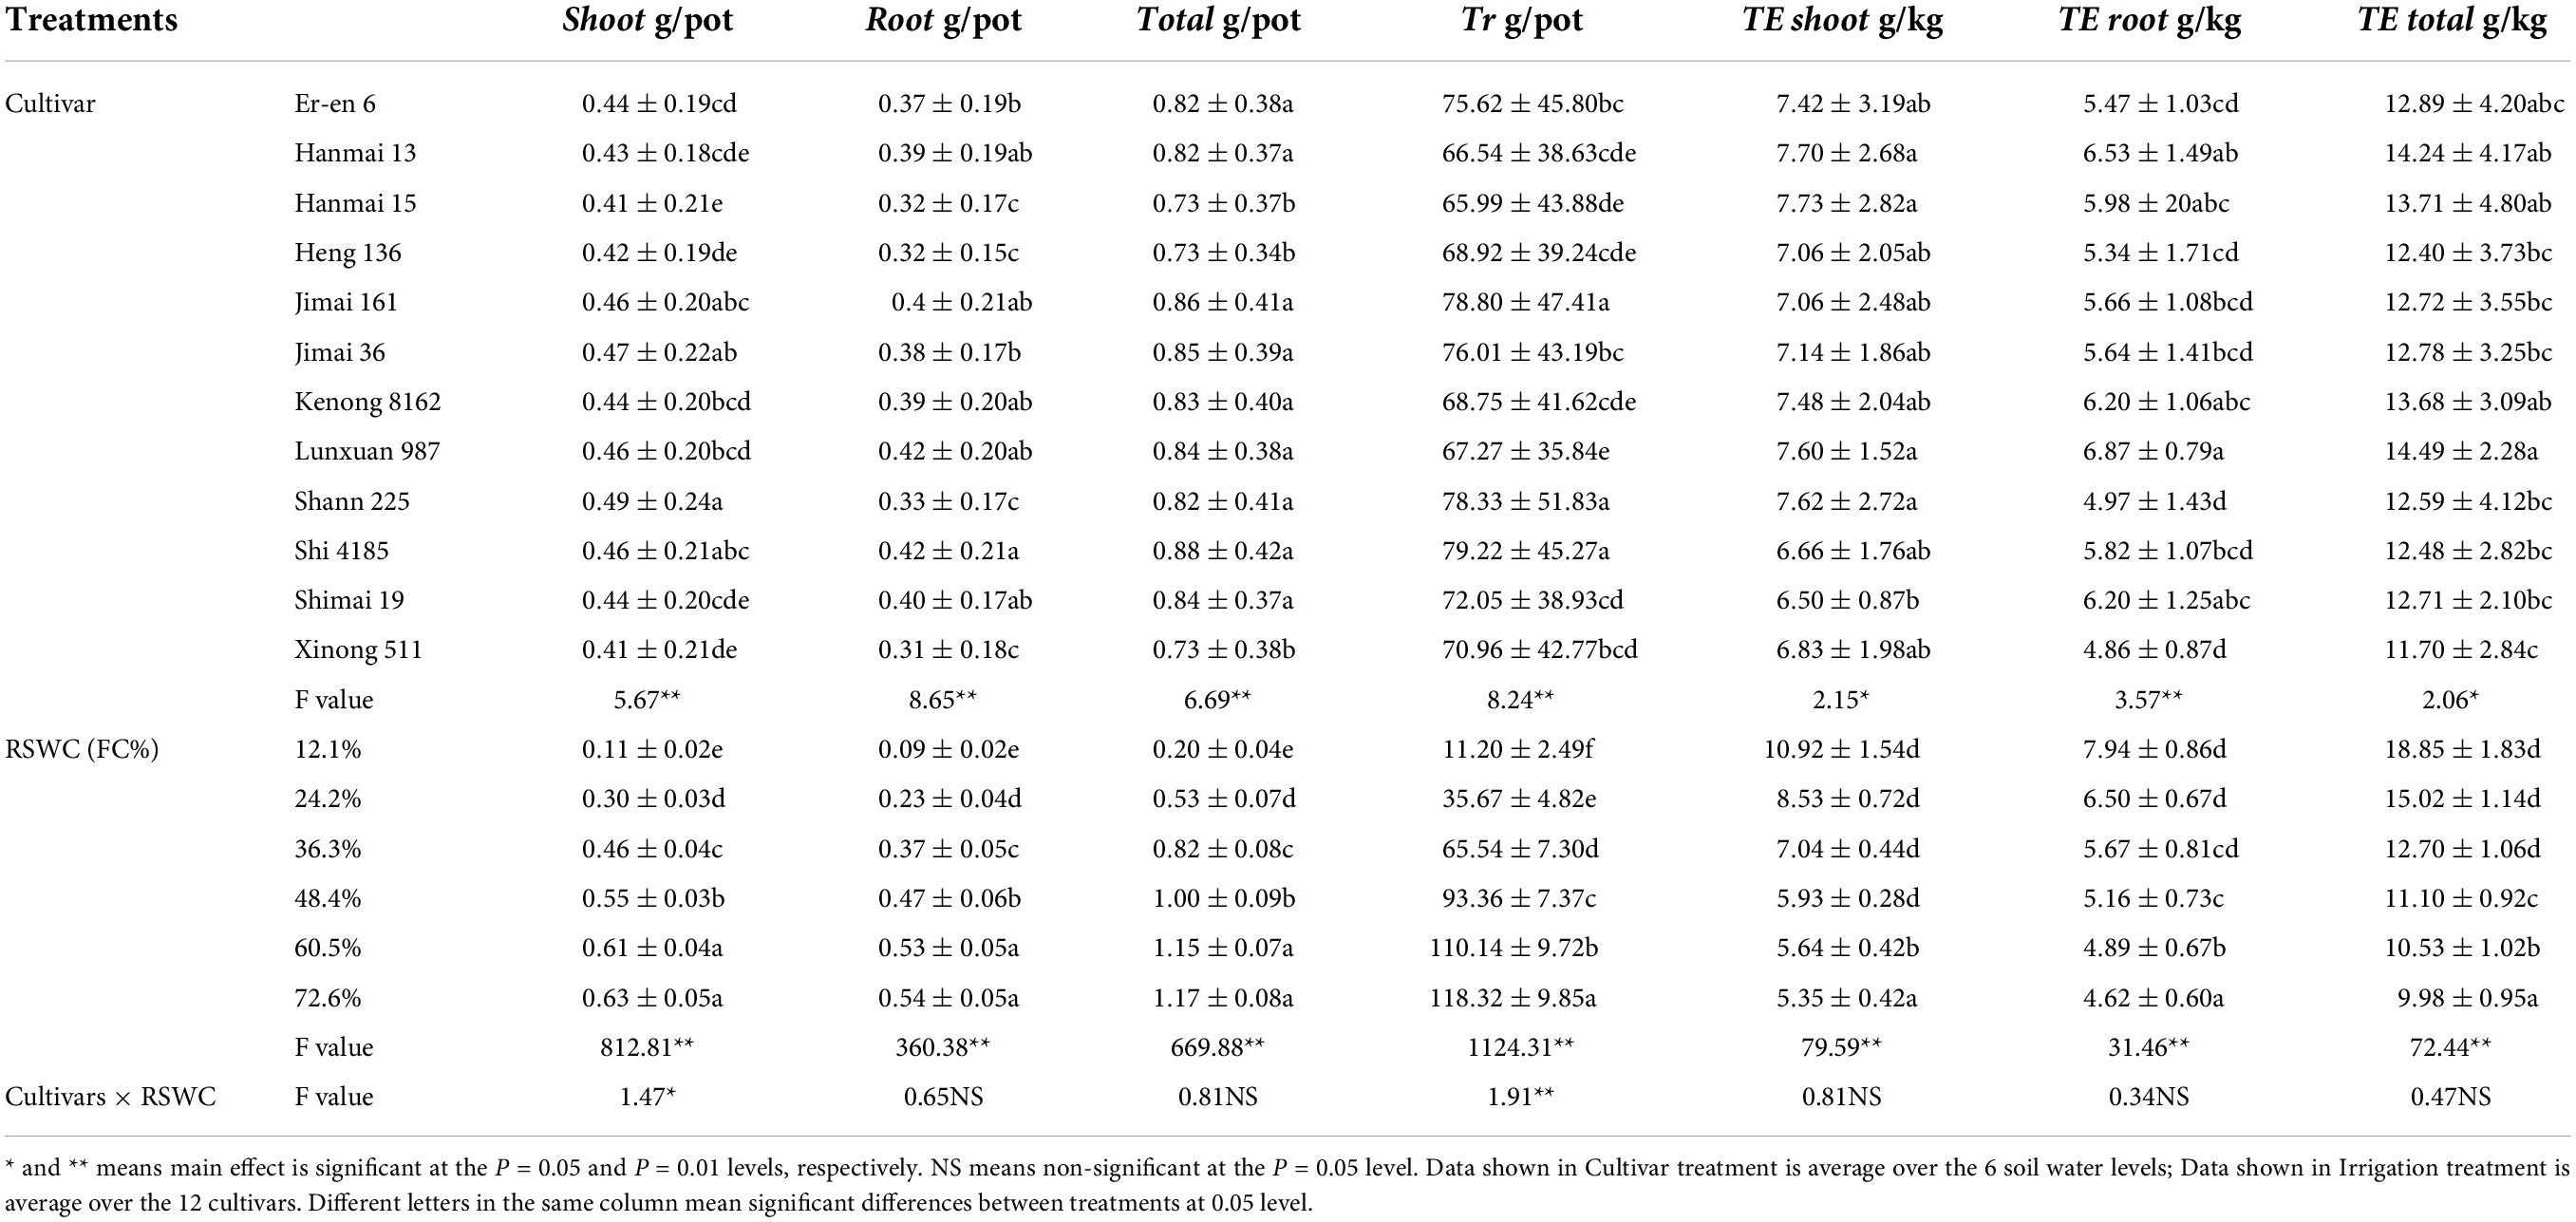
Table 1. Main effects of cultivar and SWC on seedling growth (Shoot, shoot mass; Root, root mass; Total, total biomass), Transpiration (Tr), and transpiration efficiency (TEshoot, TE root, TE total, the ratio of Shoot, Root and Total to Tr).
Cultivars, RSWC and their combination showed a significant effect on Tr (Table 1). The Tr per pot showed a trend of increasing with increasing RSWC (Figure 4). The in-creasing trend stopped at a RSWC of 48.4% in the Hanmai13 and Jimai36 cultivars and at a SWC of 60.5% in the Hanmai15, Heng136 and Jimai161 cultivars. The other 7 cultivars still showed an uptrend even when the RSWC reached 72.6%. These results indicated that these cultivars might not have water saving potential compared to the other 5 cultivars.
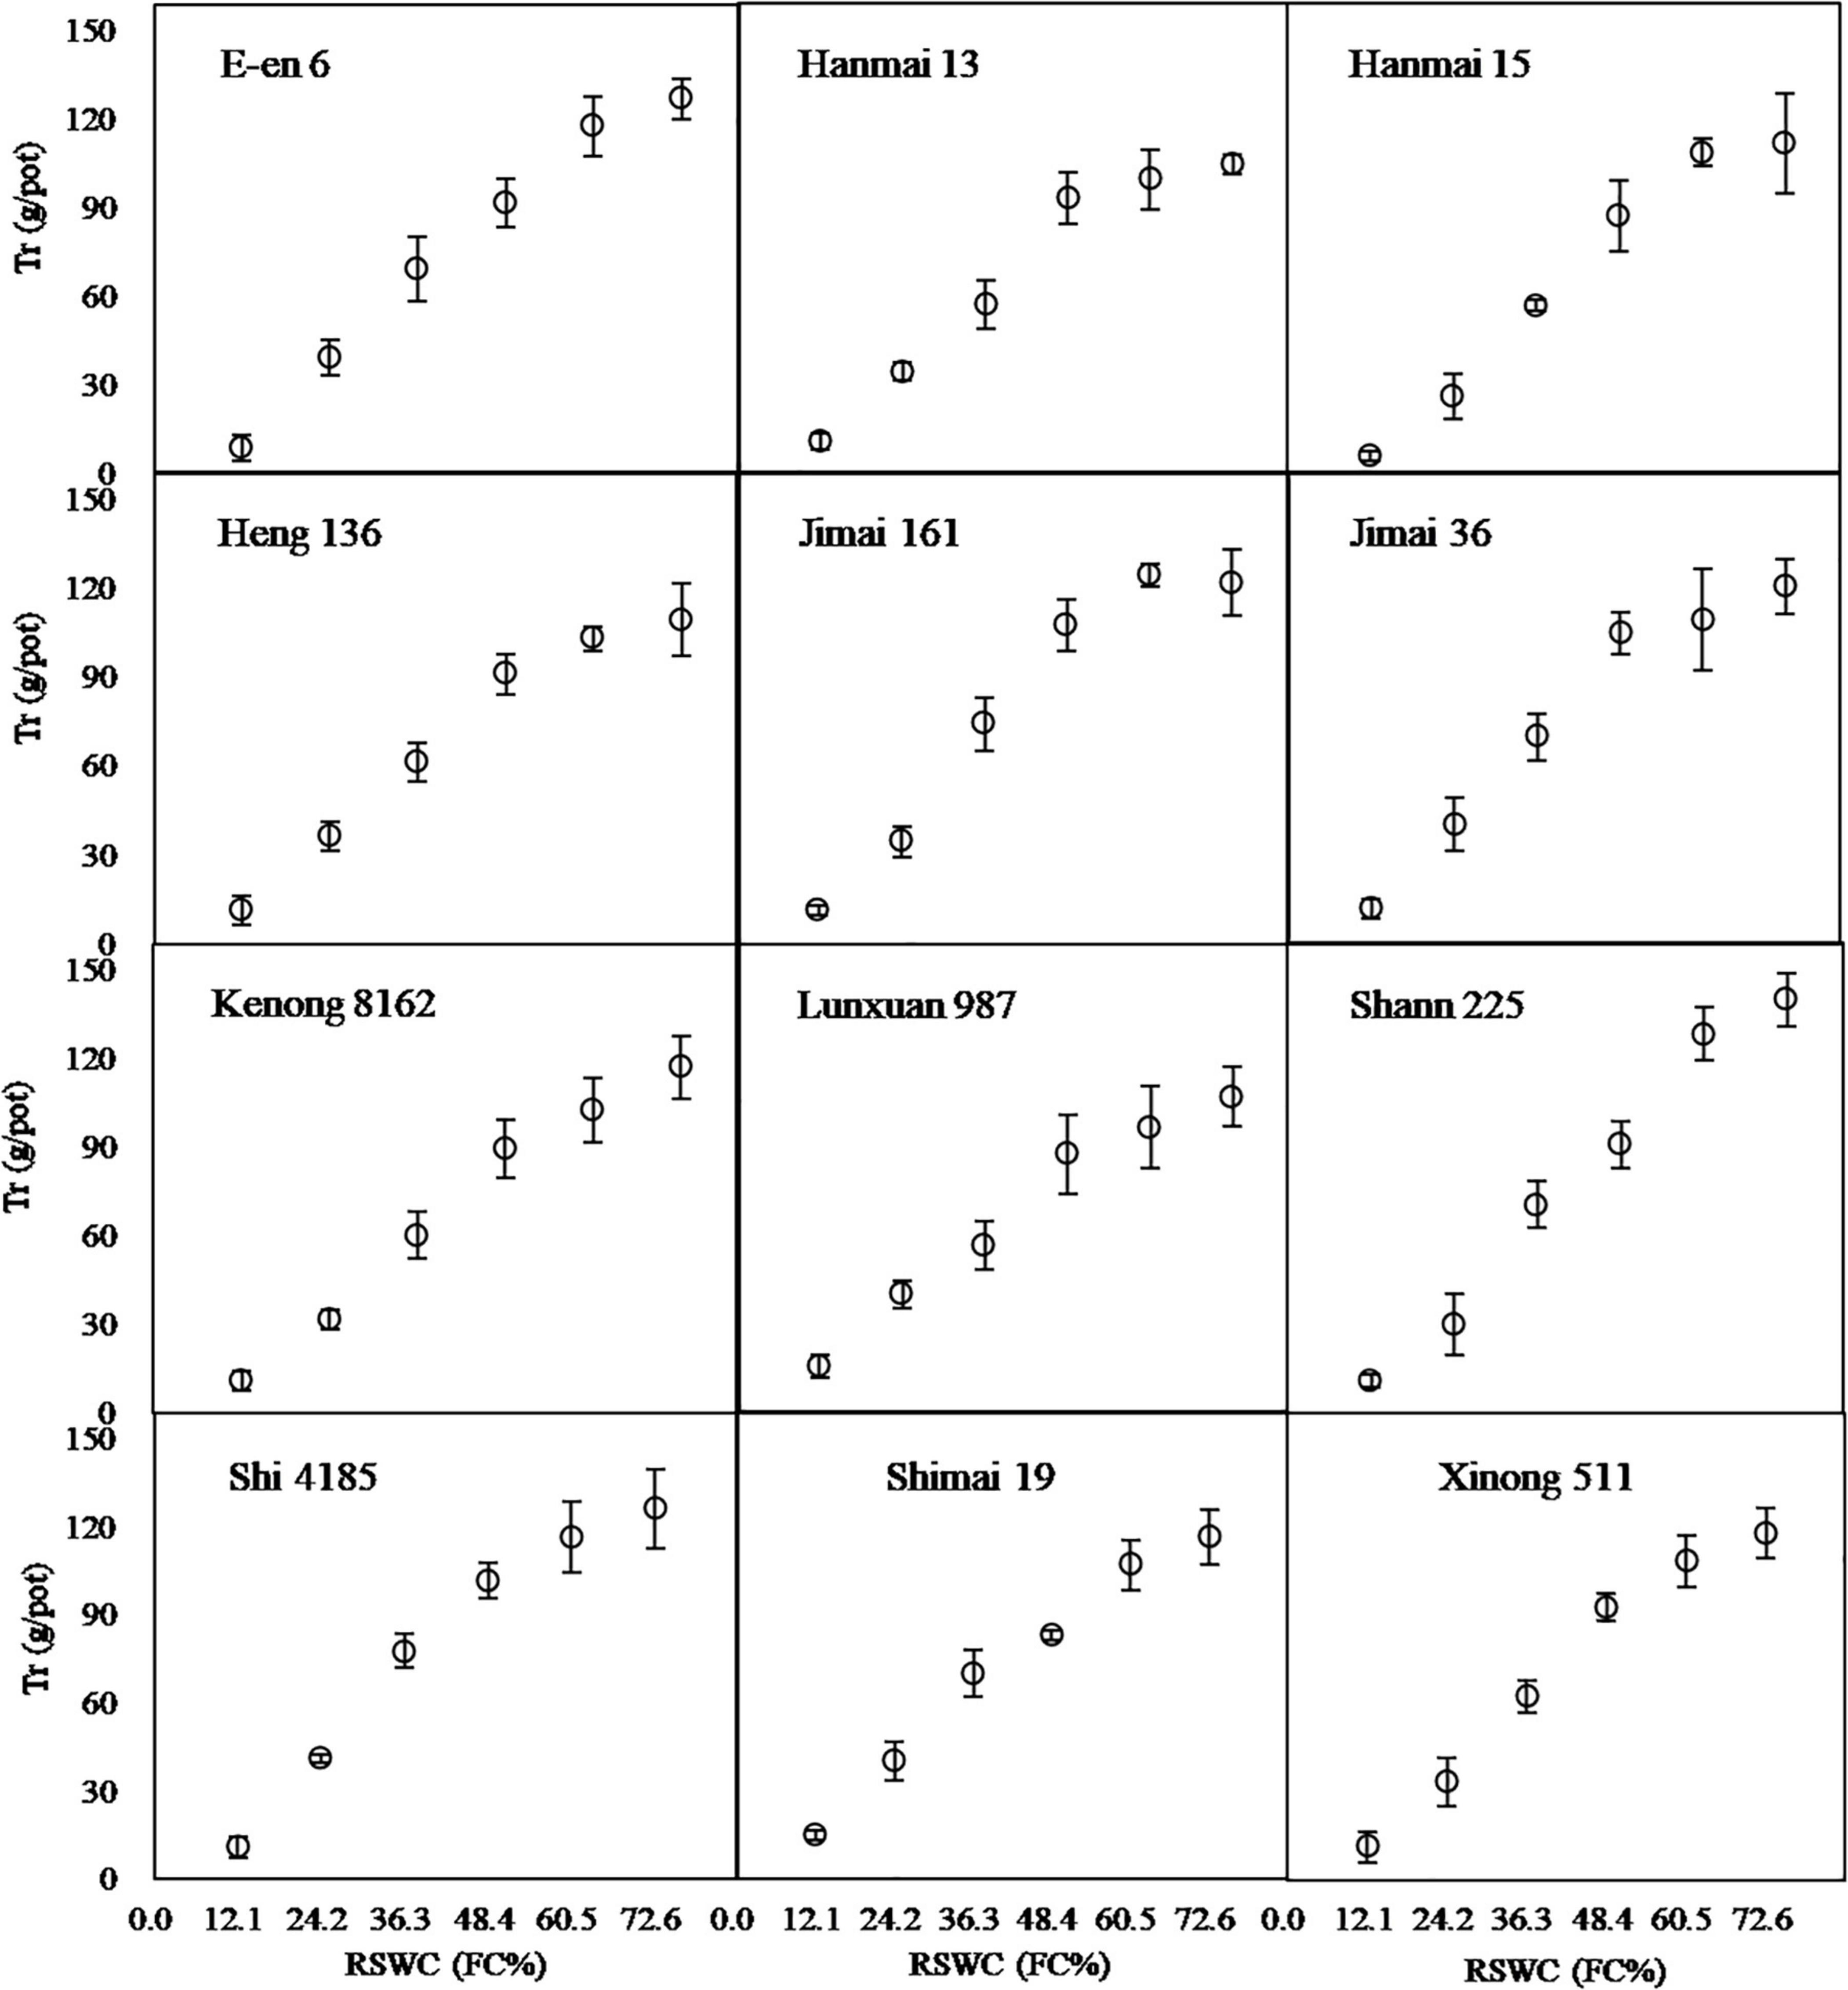
Figure 4. Transpiration per pot after 33 days cultivation under 6 soil water contents. RSWC, soil water content. FC, field capacity. Data are shown as Mean ± SD, n = 4.
Both cultivars and SWC showed a significant effect on TE, with the exception of their interaction (Table 1). The TE shoot, TEroot and TE total of the 12 cultivars de-creased with increasing RSWC in a power functional manner. The relationship was well described by Function 8 (Figures 5, 6). Here, we named this curvilinear relationship the TE–RSWC curve. According to the characteristics of the power function, TE FC could be understood as the TE of a certain cultivar measured at SWC at FC. The 12 cultivars showed very different responses of TE to the soil moisture gradient in magnitude. However, the response was similar in shape (Figures 5, 6). TE FC was between 7.5 and ∼11.4, 3.8 and ∼5.7, and 3.2 and ∼5.8, and b was between −0.5 and ∼−0.2, −0.6 and ∼−0.2, and −0.5 and ∼−0.2 for the TE total-RSWC curve, TE shoot-RSWC curve and TE root-RSWC curve, respectively.
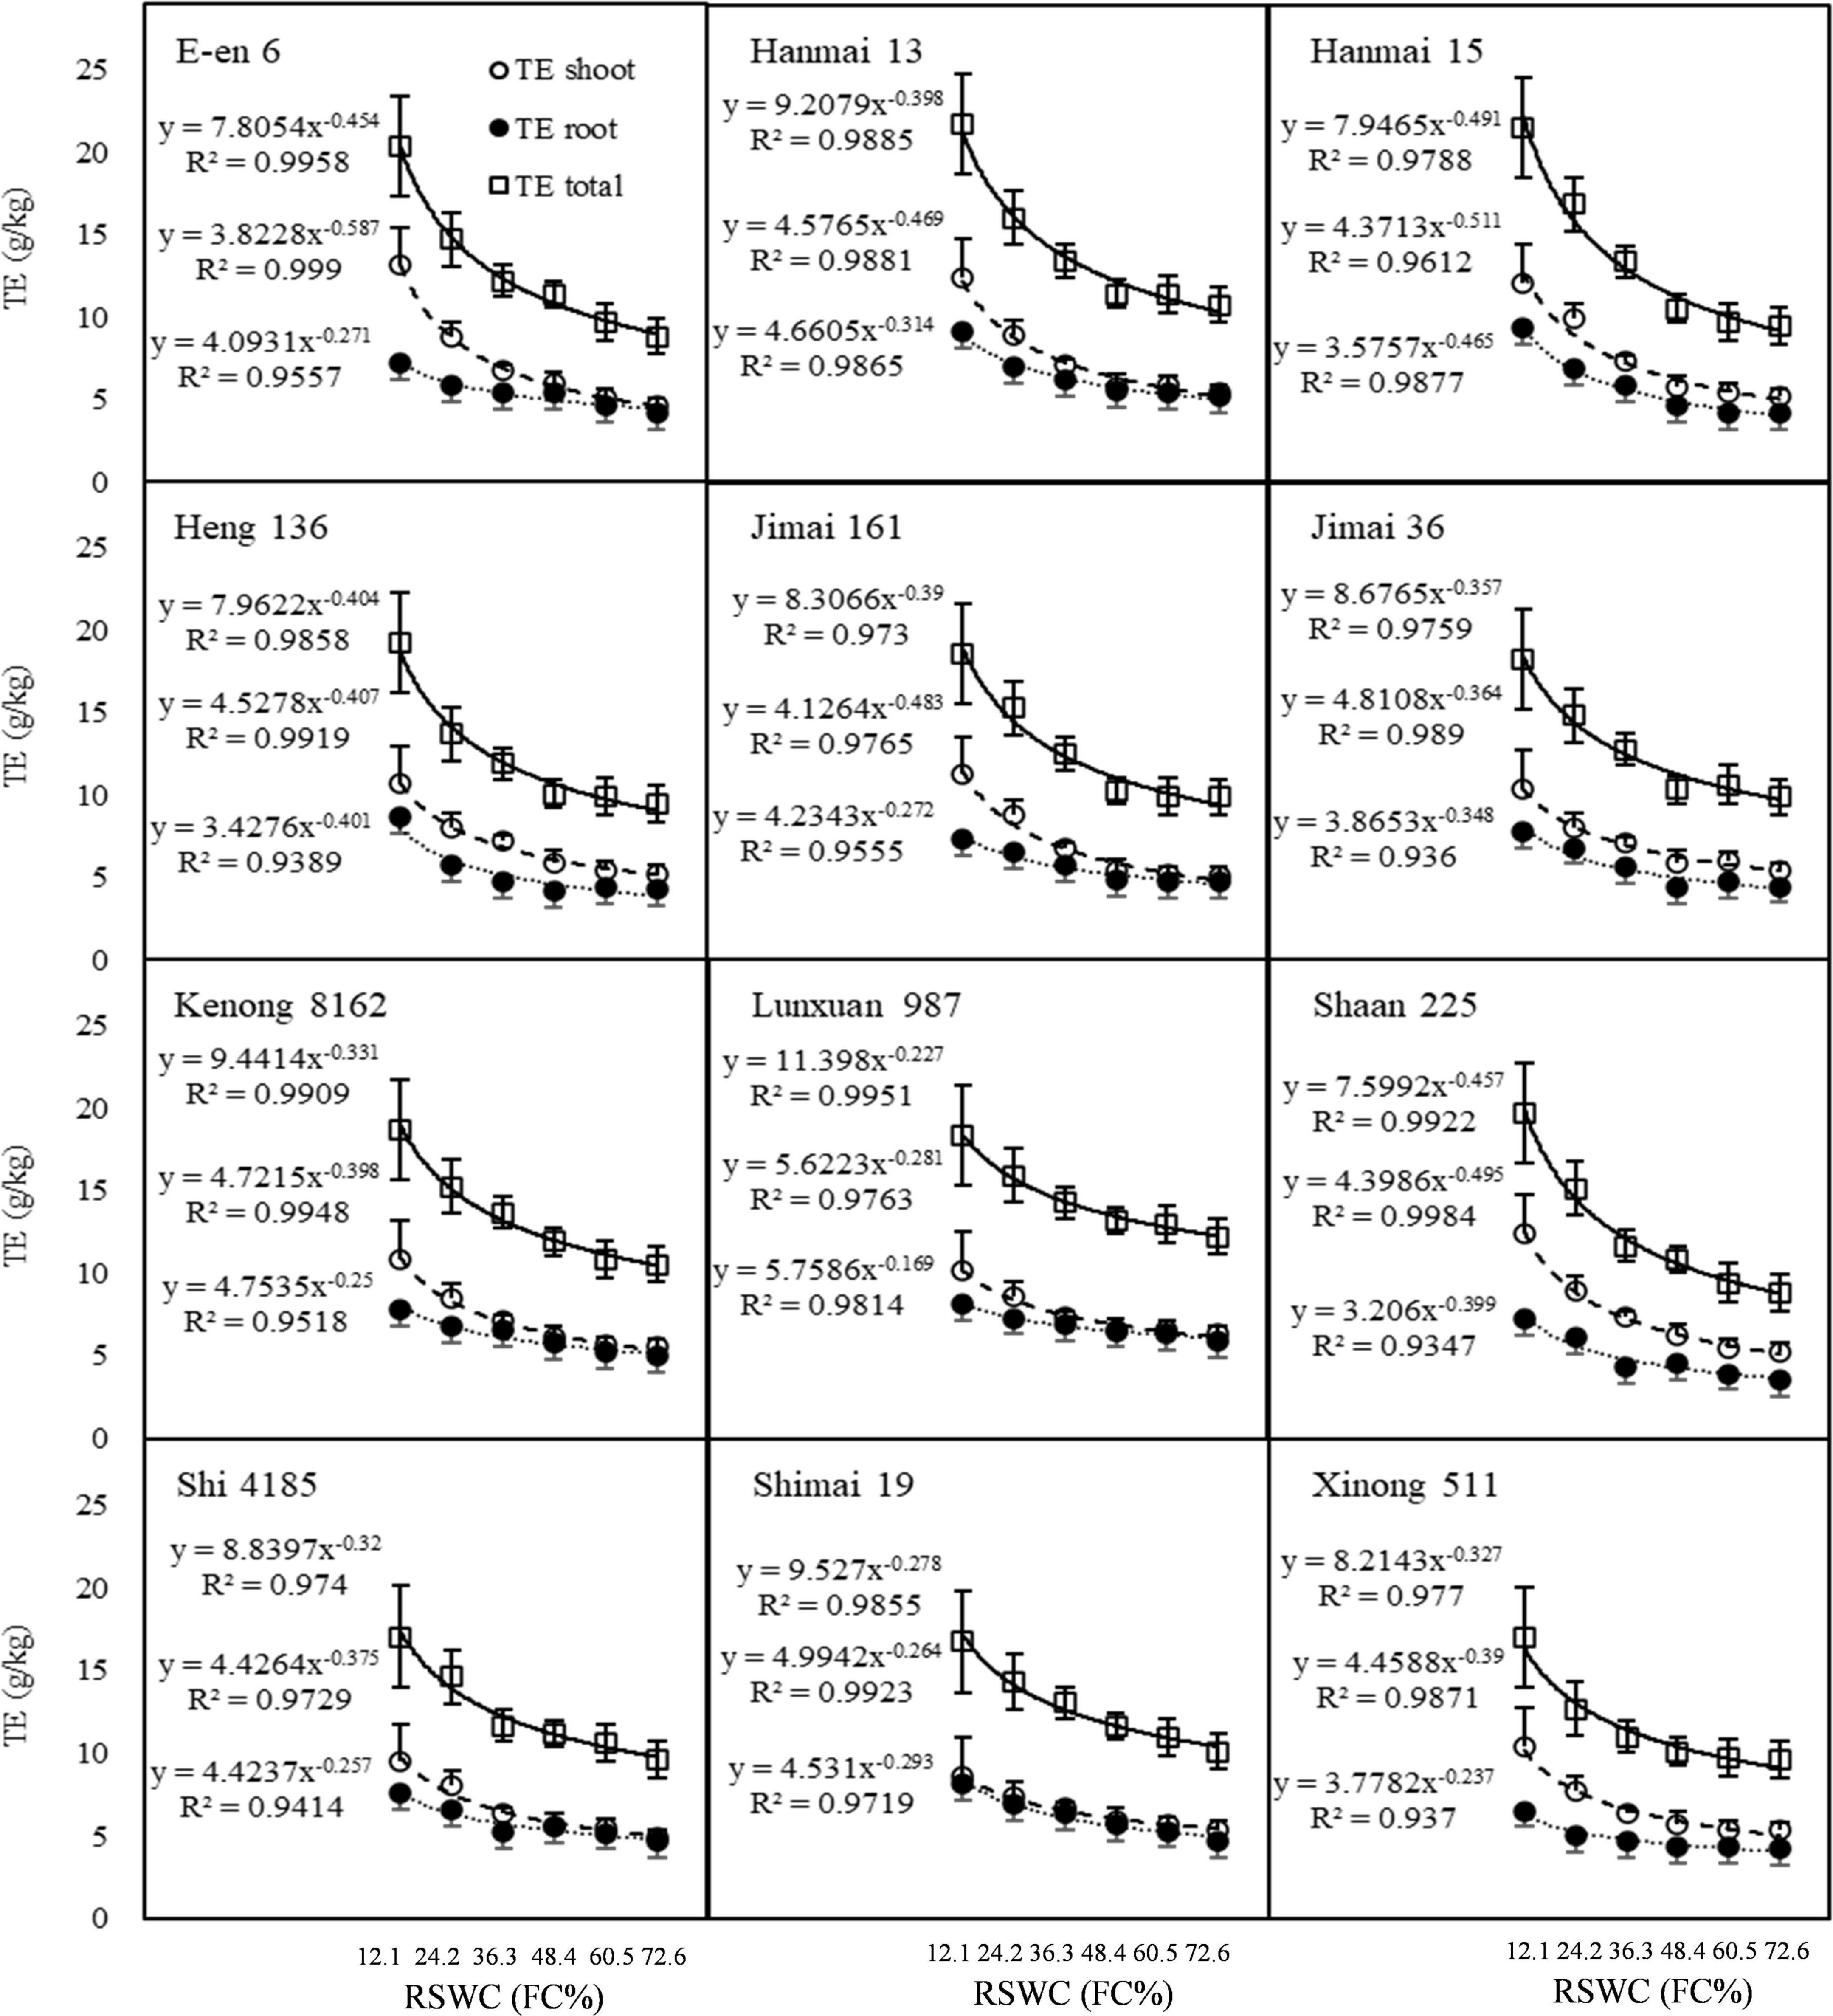
Figure 5. Transpiration efficiency changes following the gradients of soil water content. TE shoot, TE root, TE total, the ratio of shoot mass, root mass and total biomass to transpiration loss. RSWC, soil water content. FC, field capacity. Data are shown as Mean ± SD, n = 4.
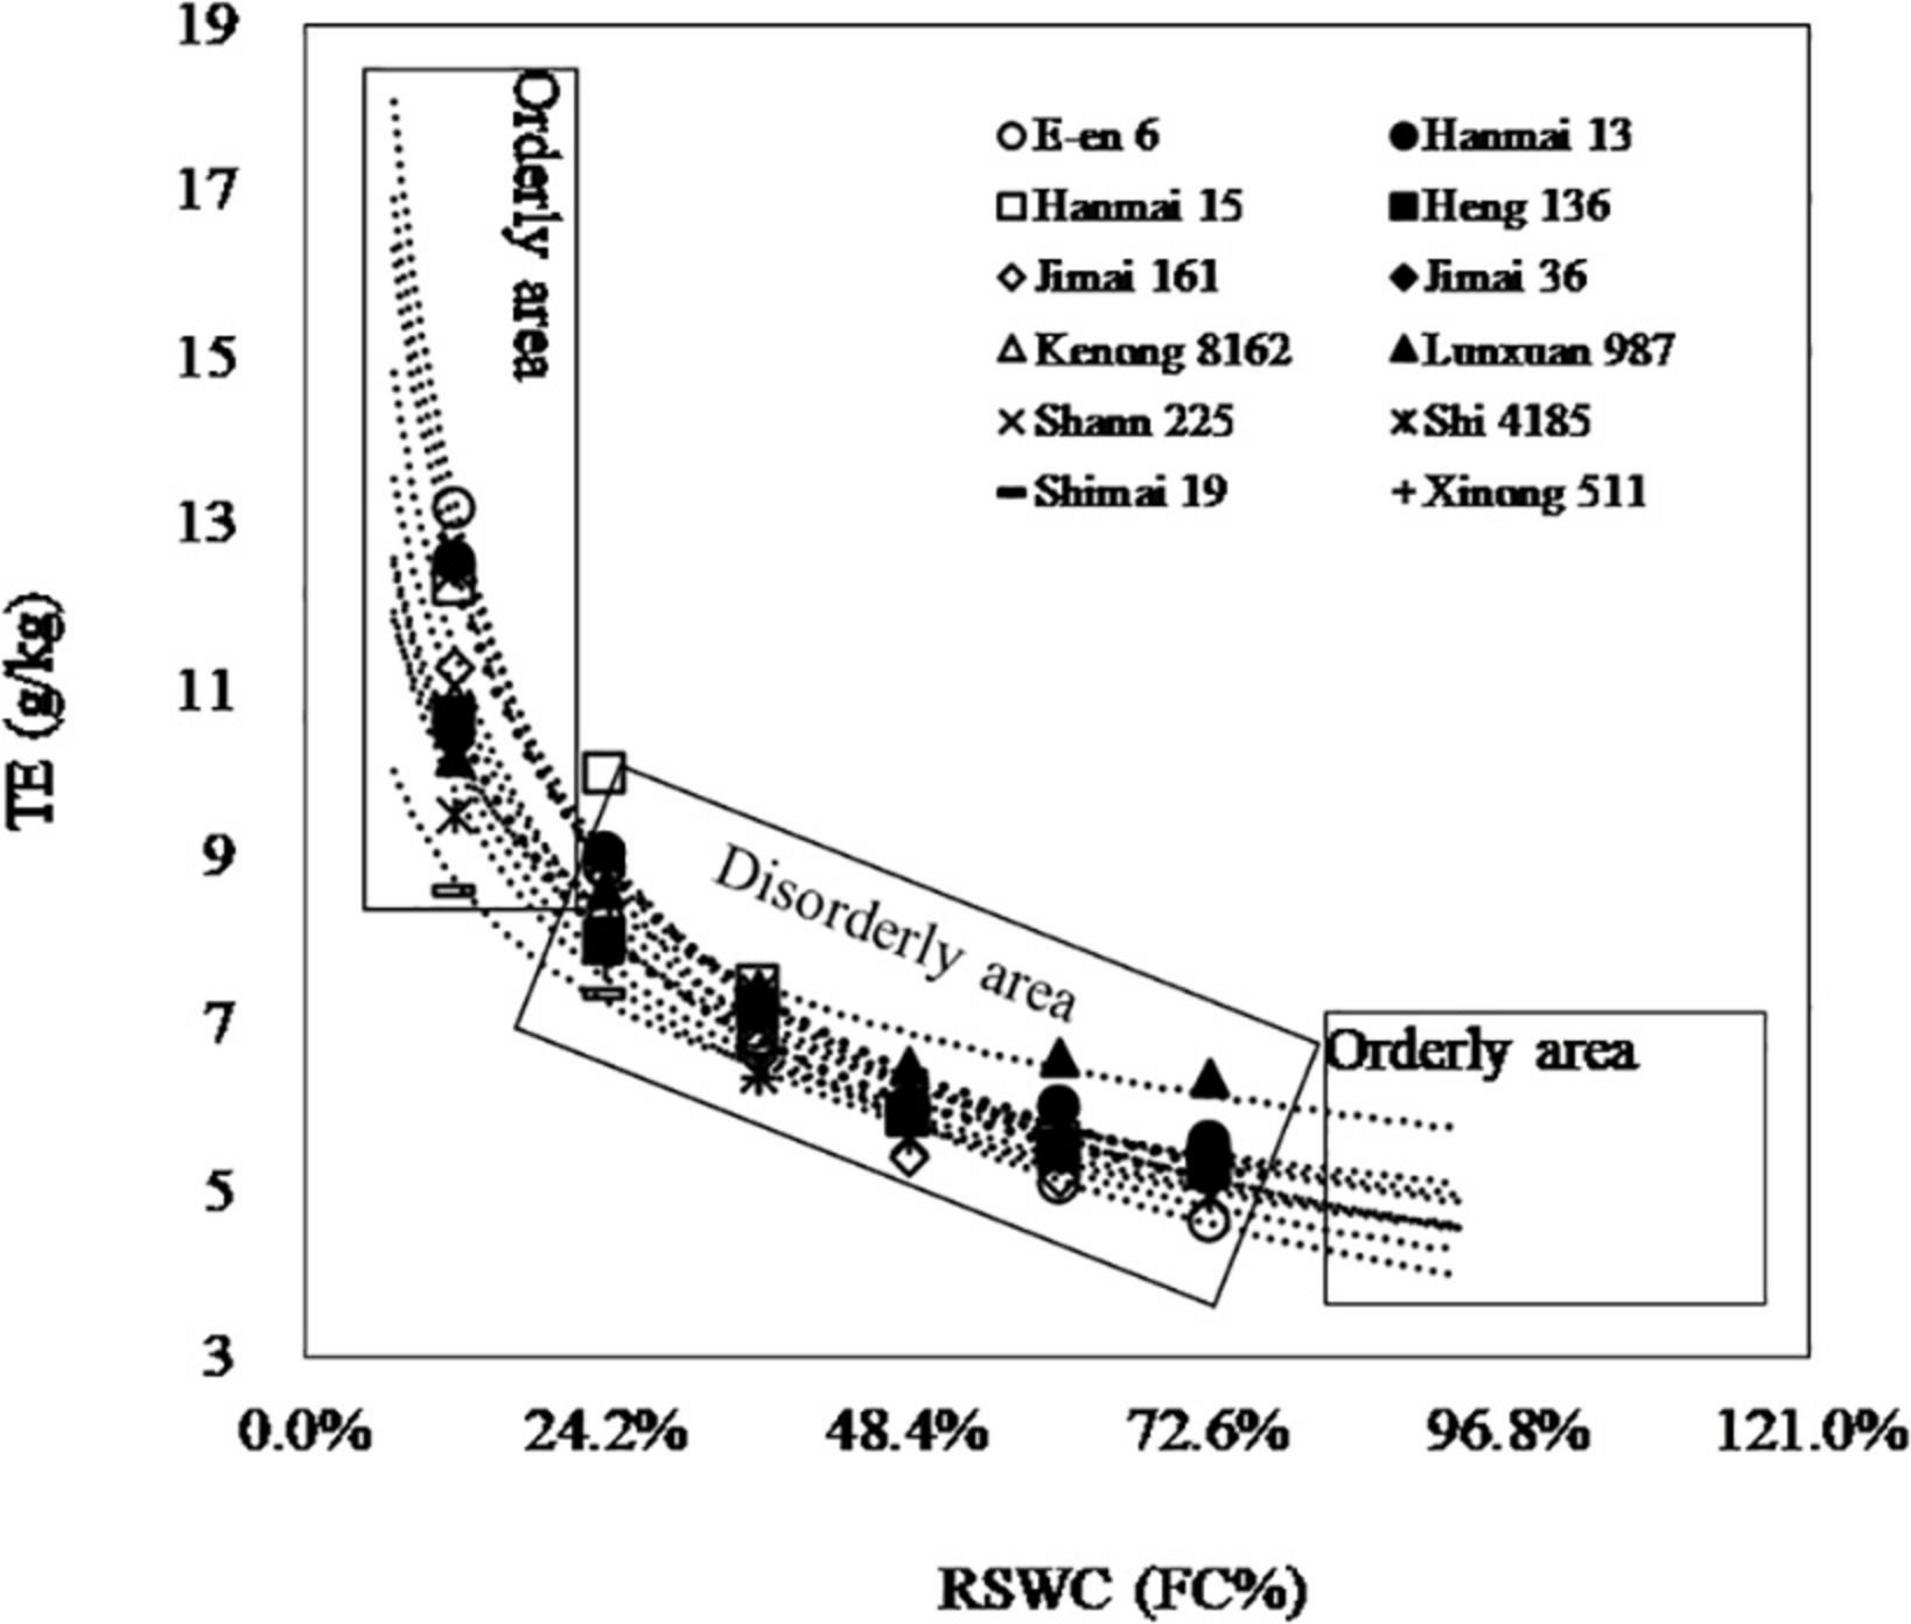
Figure 6. The rank of TE shoot among cultivars at different RSWC levels. The curves can be divided into orderly area where the rank of cultivars is stable when RSWC ≤ 12.1% or RSWC ≥ 72.6% and disorderly area where the rank is instable when 3% < RSWC < 18%, when comparing among number of cultivars. TE shoot, the ratio of shoot mass to transpiration loss. RSWC, soil water content. FC, field capacity. Data are shown as mean, n = 4.
The TE–RSWC curve was characterized by 4 points. Take TE shoot, which was most related to grain yield and most cared for by researchers, for example. First, TE varied depending on RSWC. Second, TE measured at any two adjacent SWCs had a positive correlation with each other (Table 2). Third, TE–RSWC curves could be divided into orderly areas, where TE became stable when RSWC went to extremely scarce (RSWC ≤ 12.1%) or plenty (RSWC ≥ 72.6%) levels, and disorderly areas, where TE was unstable when 12.1% < RSWC < 72.6% (Figure 6). Fourth, TE measured at 12.1% FC was negatively related to TE FC, and TE measured at 60.5 and 72.6% FC was positively related to TE FC. These 4 features of the TE–RSWC curve implied that comparison of TE among cultivars must and only be done under a given or similar RSWC.
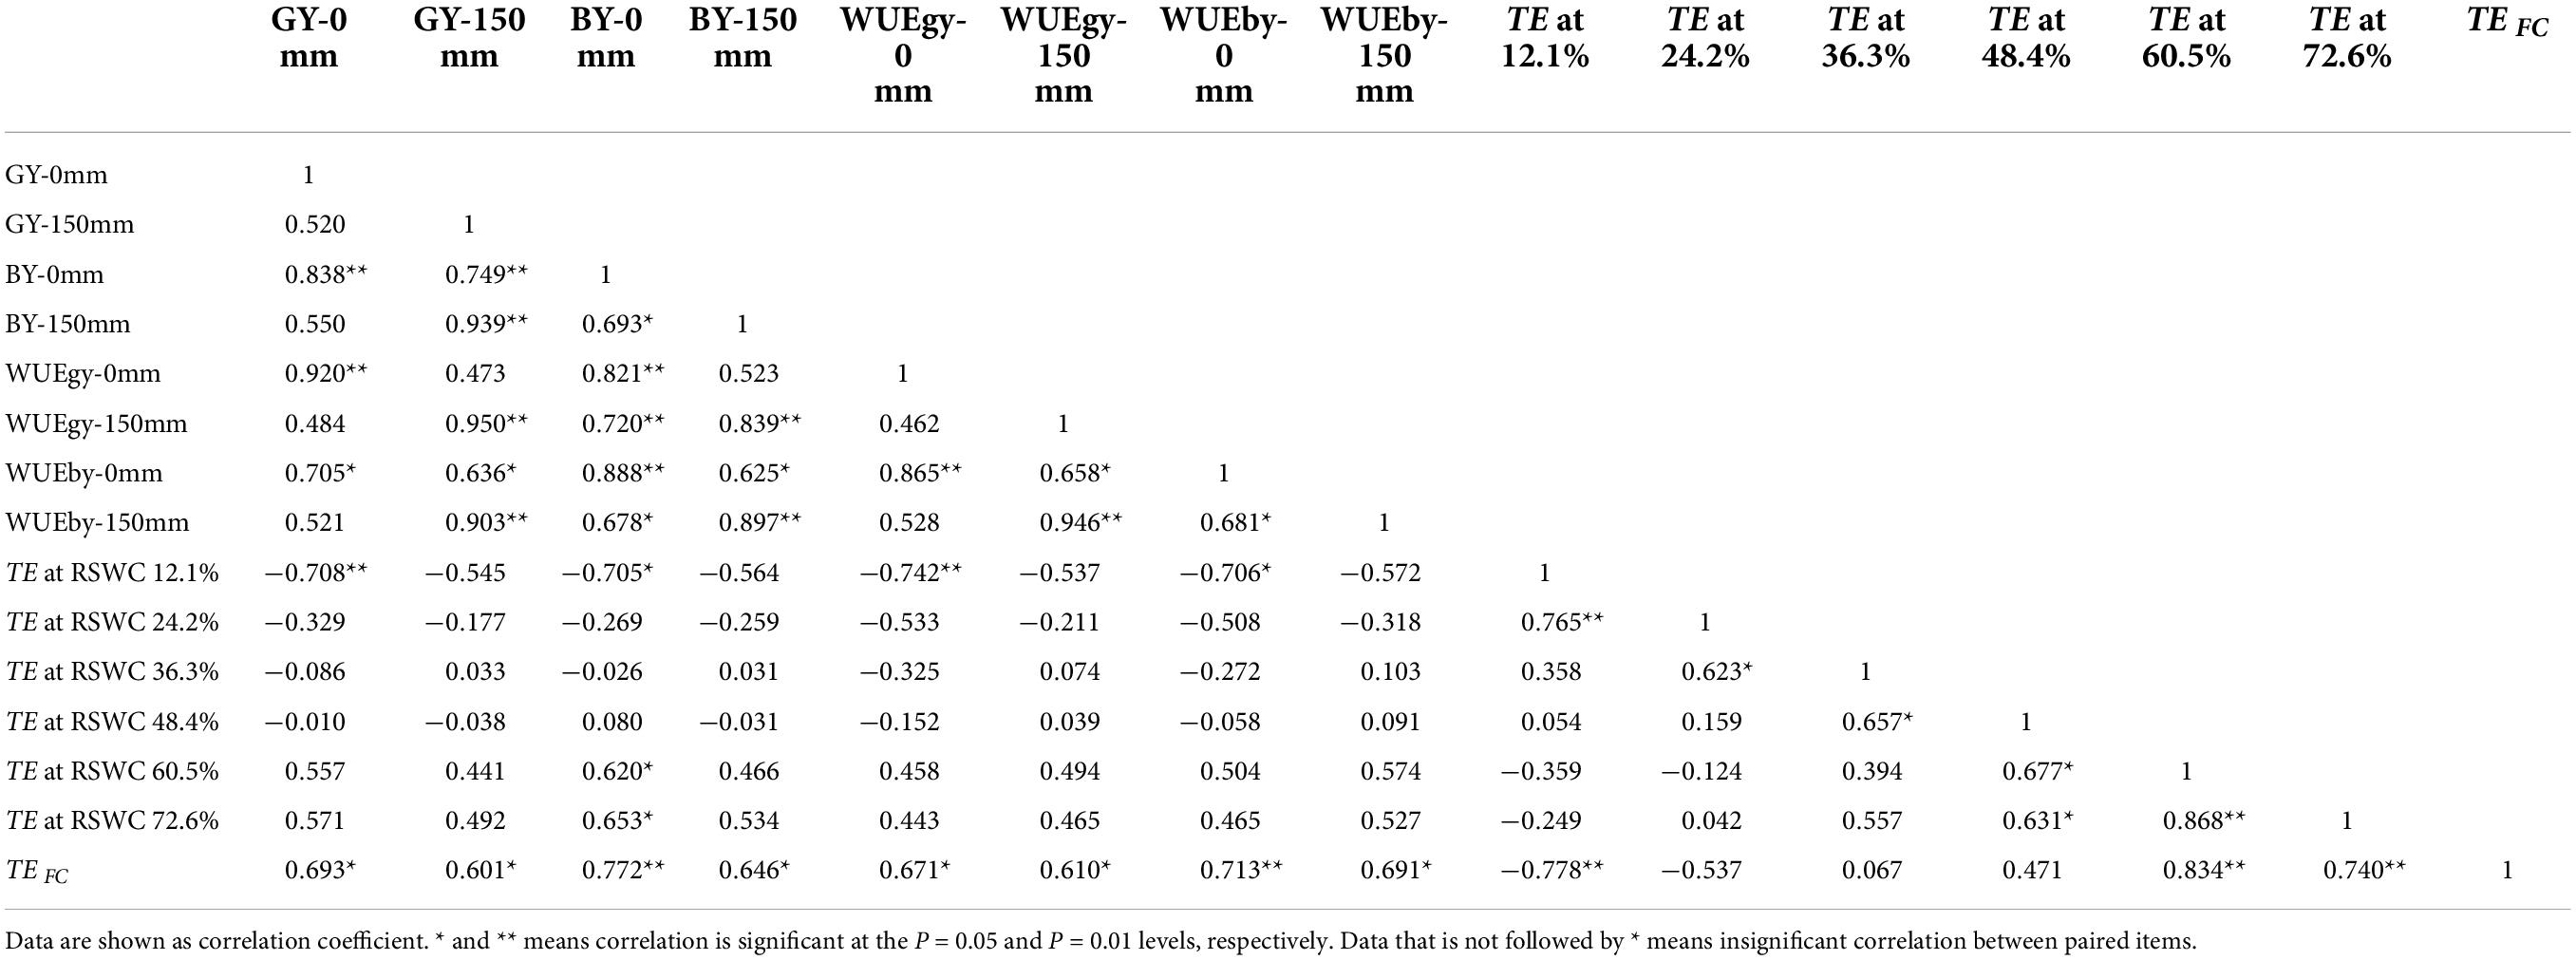
Table 2. Correlation analysis between field measured yield (GY, grain yield; BY, biomass yield), water use efficiency (WUE gy, WUE at grain yield level; WUE by, WUE at biomass yield level), pot measured transpiration efficiency (TE) at different SWC levels (TE at x%, TE shoot measured at x% of SWC.) and TE FC (TE measured at field capacity, the parameter of the power function TE = TE FC × (RSWC)b.
The comparison of TE between cultivars could be categorized into two types. I) To compare between any two cultivars, the one with higher TE FC would show lower TE at lower RSWC and higher TE at higher RSWC. In other words, cultivars with lower TE FC would show higher TE at lower RSWC and lower TE at higher RSWC. In this situation, the intersection points between the TE–RSWC curve of any two cultivars would help to compare TE between cultivars (Figure 6). For example, to compare TE between Cultivar 1 and Cultivar 2, it is assumed that TE1 = TE FC1 × RSWC b1, TE2 = TE FC2 × RSWC b2. The RSWC at the intersection point was calculated as RSWC ip = (TE FC2/TE FC1) ^ [1/(b1 – b2)]. If a cultivar shows higher TE when RSWC is lower than the intersection point, it must show lower TE when RSWC is higher than the intersection point. II) To compare among large amounts of cultivars, the RSWC was recommended to be lower than 12.1% (near wilting point) or higher than 60.5% because the rank of cultivars became stable under these two conditions (Figure 6). The comparison results from the orderly area with a low RSWC would be opposite to the comparison results from the orderly area with a high RSWC.
The TE–RSWC curve could be used to compare the sensitivity of TE to RSWC between cultivars. The existence of intersection point indicated that the sensitivity of TE to RSWC was different among cultivars. Simply, TE FC could be used directly to assess the sensitivity. Cultivars with higher TE FC might be less sensitive to RSWC because higher TE FC meant lower TE at lower RSWC and higher TE at higher RSWC. For example, the sensitivity of Cultivar Hanmai13, whose TE FC was less than that of Cultivar Lunxuan987, was more sensitive than that of the latter (Figure 7). From this viewpoint, the sensitivity of TE to RSWC was negatively related to TE FC. Accurately, the first-order derivative of the TE–RSWC curve function could be considered the sensitivity. However, the first-order derivative of a power function is still a power function. Thus, the sensitivity analysis became the same question as stated in the last paragraph, where the intersection point was introduced.
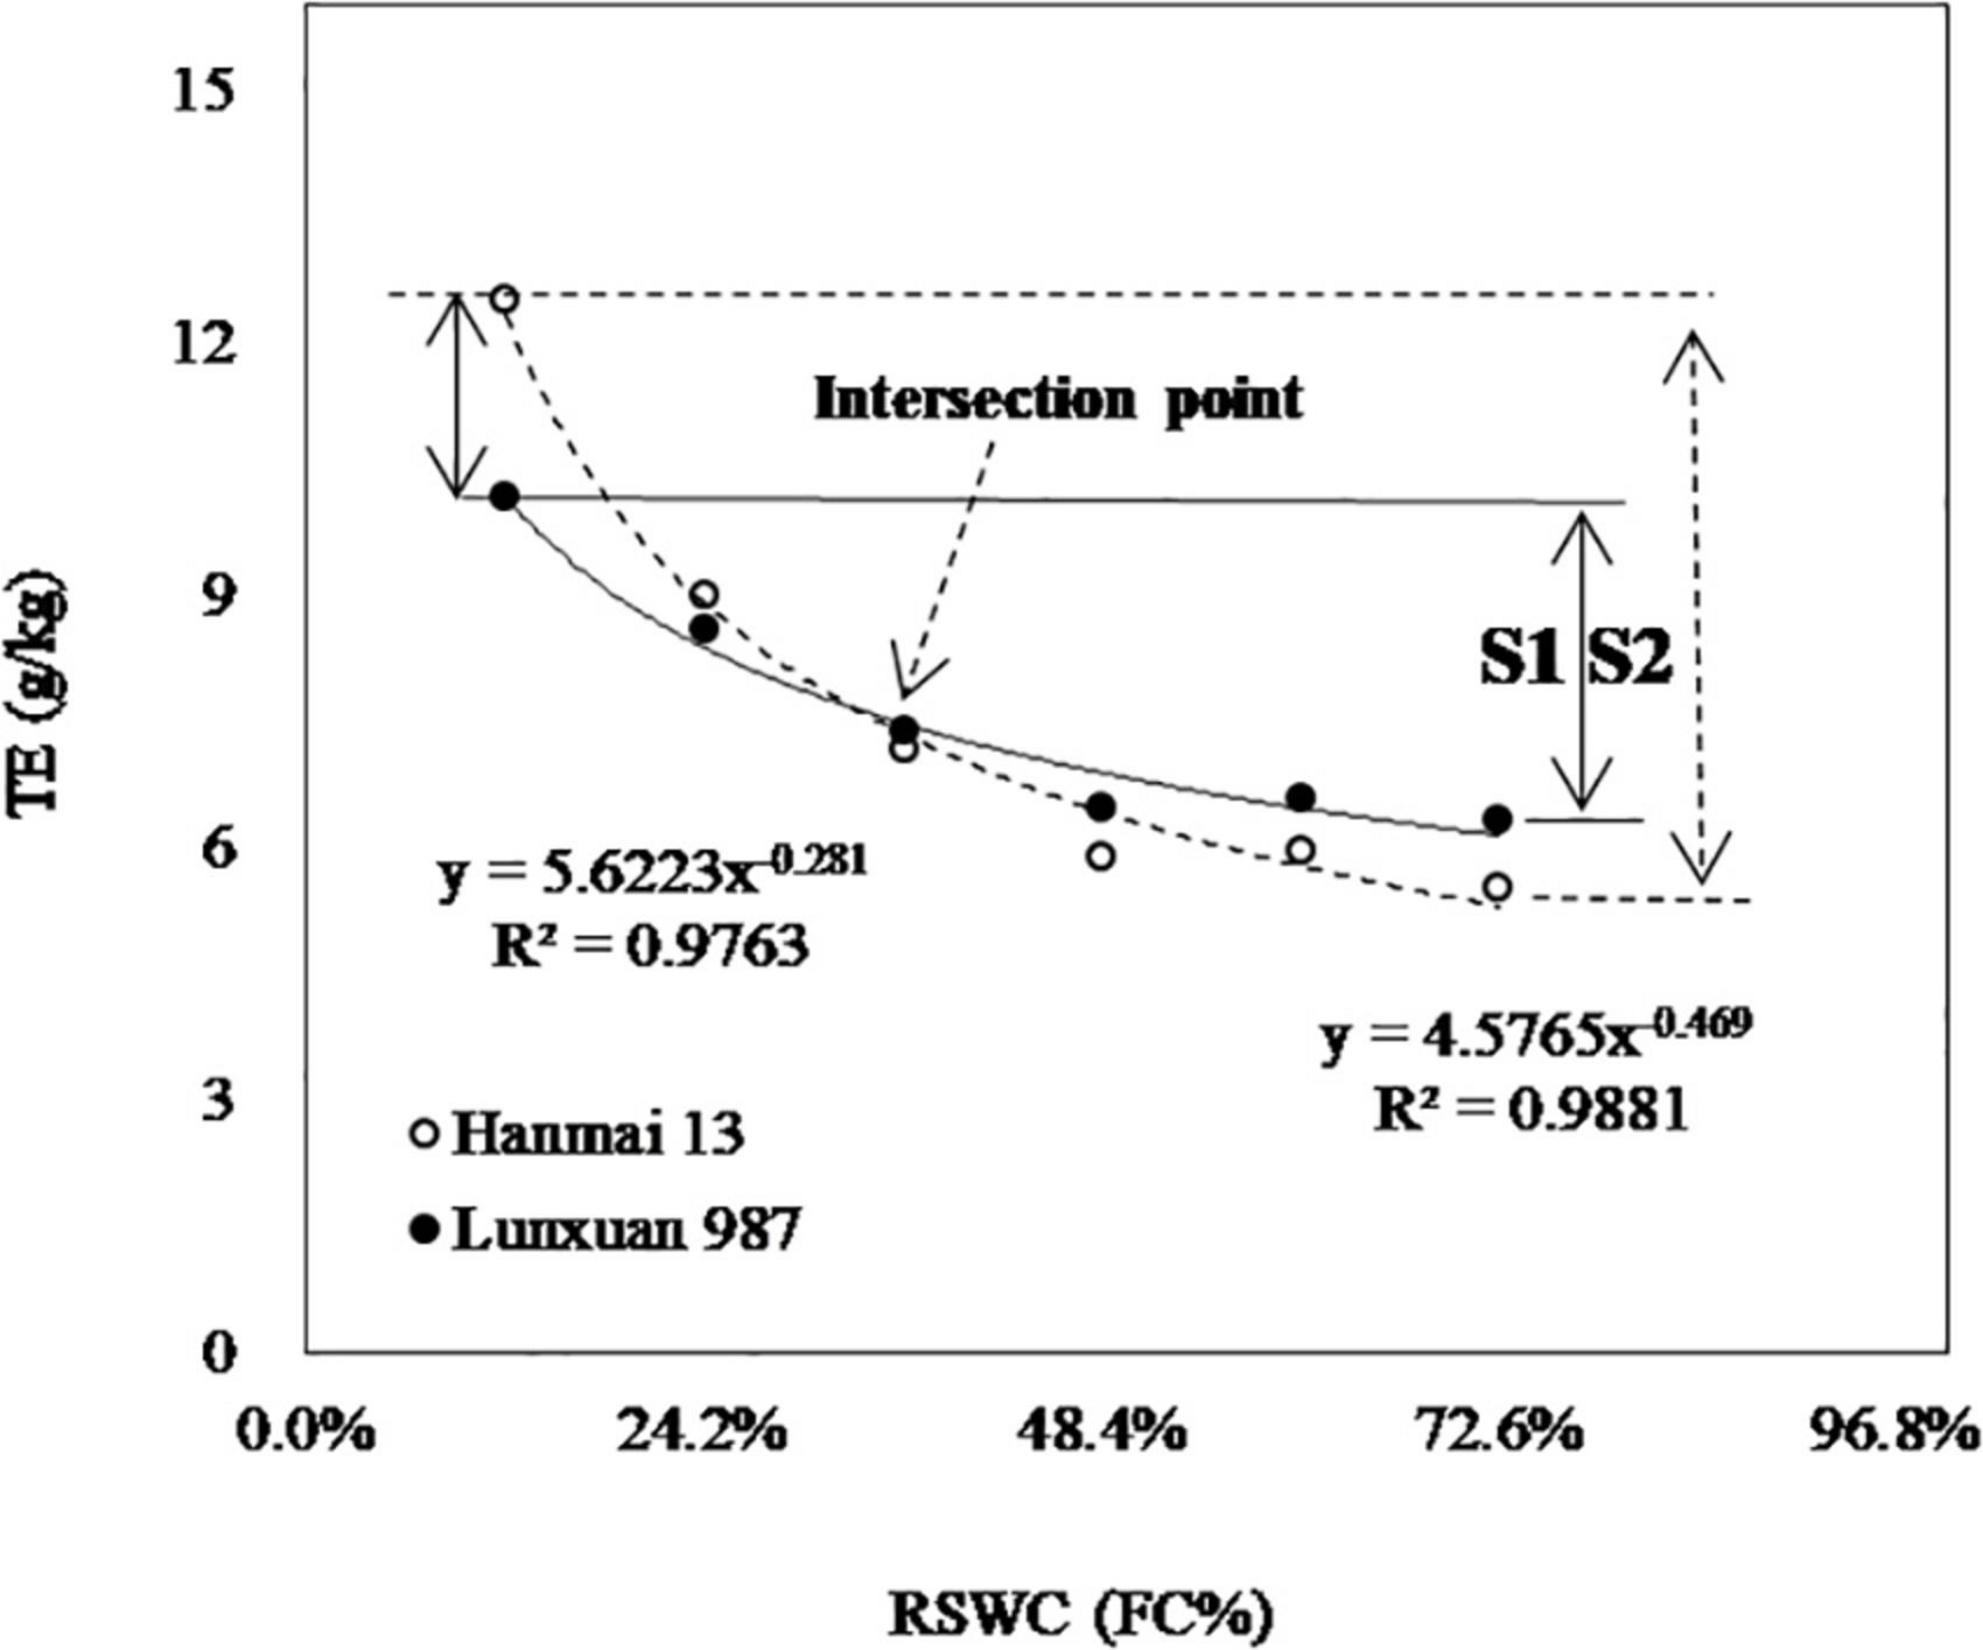
Figure 7. Sensitivity analysis and comparison of transpiration efficiency (TE) between any two cultivars, taking cultivars Hanmai 13 and Lunxuan 987 for example. The rank of sensitivity is inverse to the rank of TE FC. Sensitivity of Hanmai 13 (S2) is higher than that of Lunxuan 987 (S1). When comparing between two cultivars, TE of Hanmai 13 is higher than that of Lunxuan 987 to the left of the intersection point. The rank is reversed to the right of the intersection point. RSWC, soil water content. FC, field capacity. Data are means of 4 replicates at the same RSWC.
Field yield and water use efficiency
GY and BY were both significantly affected by cultivar and irrigation. The interaction between cultivar and irrigation only showed remarkable effects on GY but not on BY (Table 3). Two irrigations (150 mm) resulted in 1853.14 kg/ha (p < 0.05) and 3035.10 kg/ha (p < 0.05) increases in GY and BY averaged over the 12 cultivars, respectively. Among all cultivars, Cultivar E-en6 showed minimal GY and BY under both irrigation conditions. This implied that E-en6 has no potential both in drought resistance and in high yield. That Shimai19 showed the highest GY under rain feeding indicated its ability to resist drought stress. Lunxuan 987, ranking 3rd under rainfed conditions and 1st under two irrigation treatments, either in GY or BY, was the most likely high-yielding cultivar under either drought or well-watered conditions.
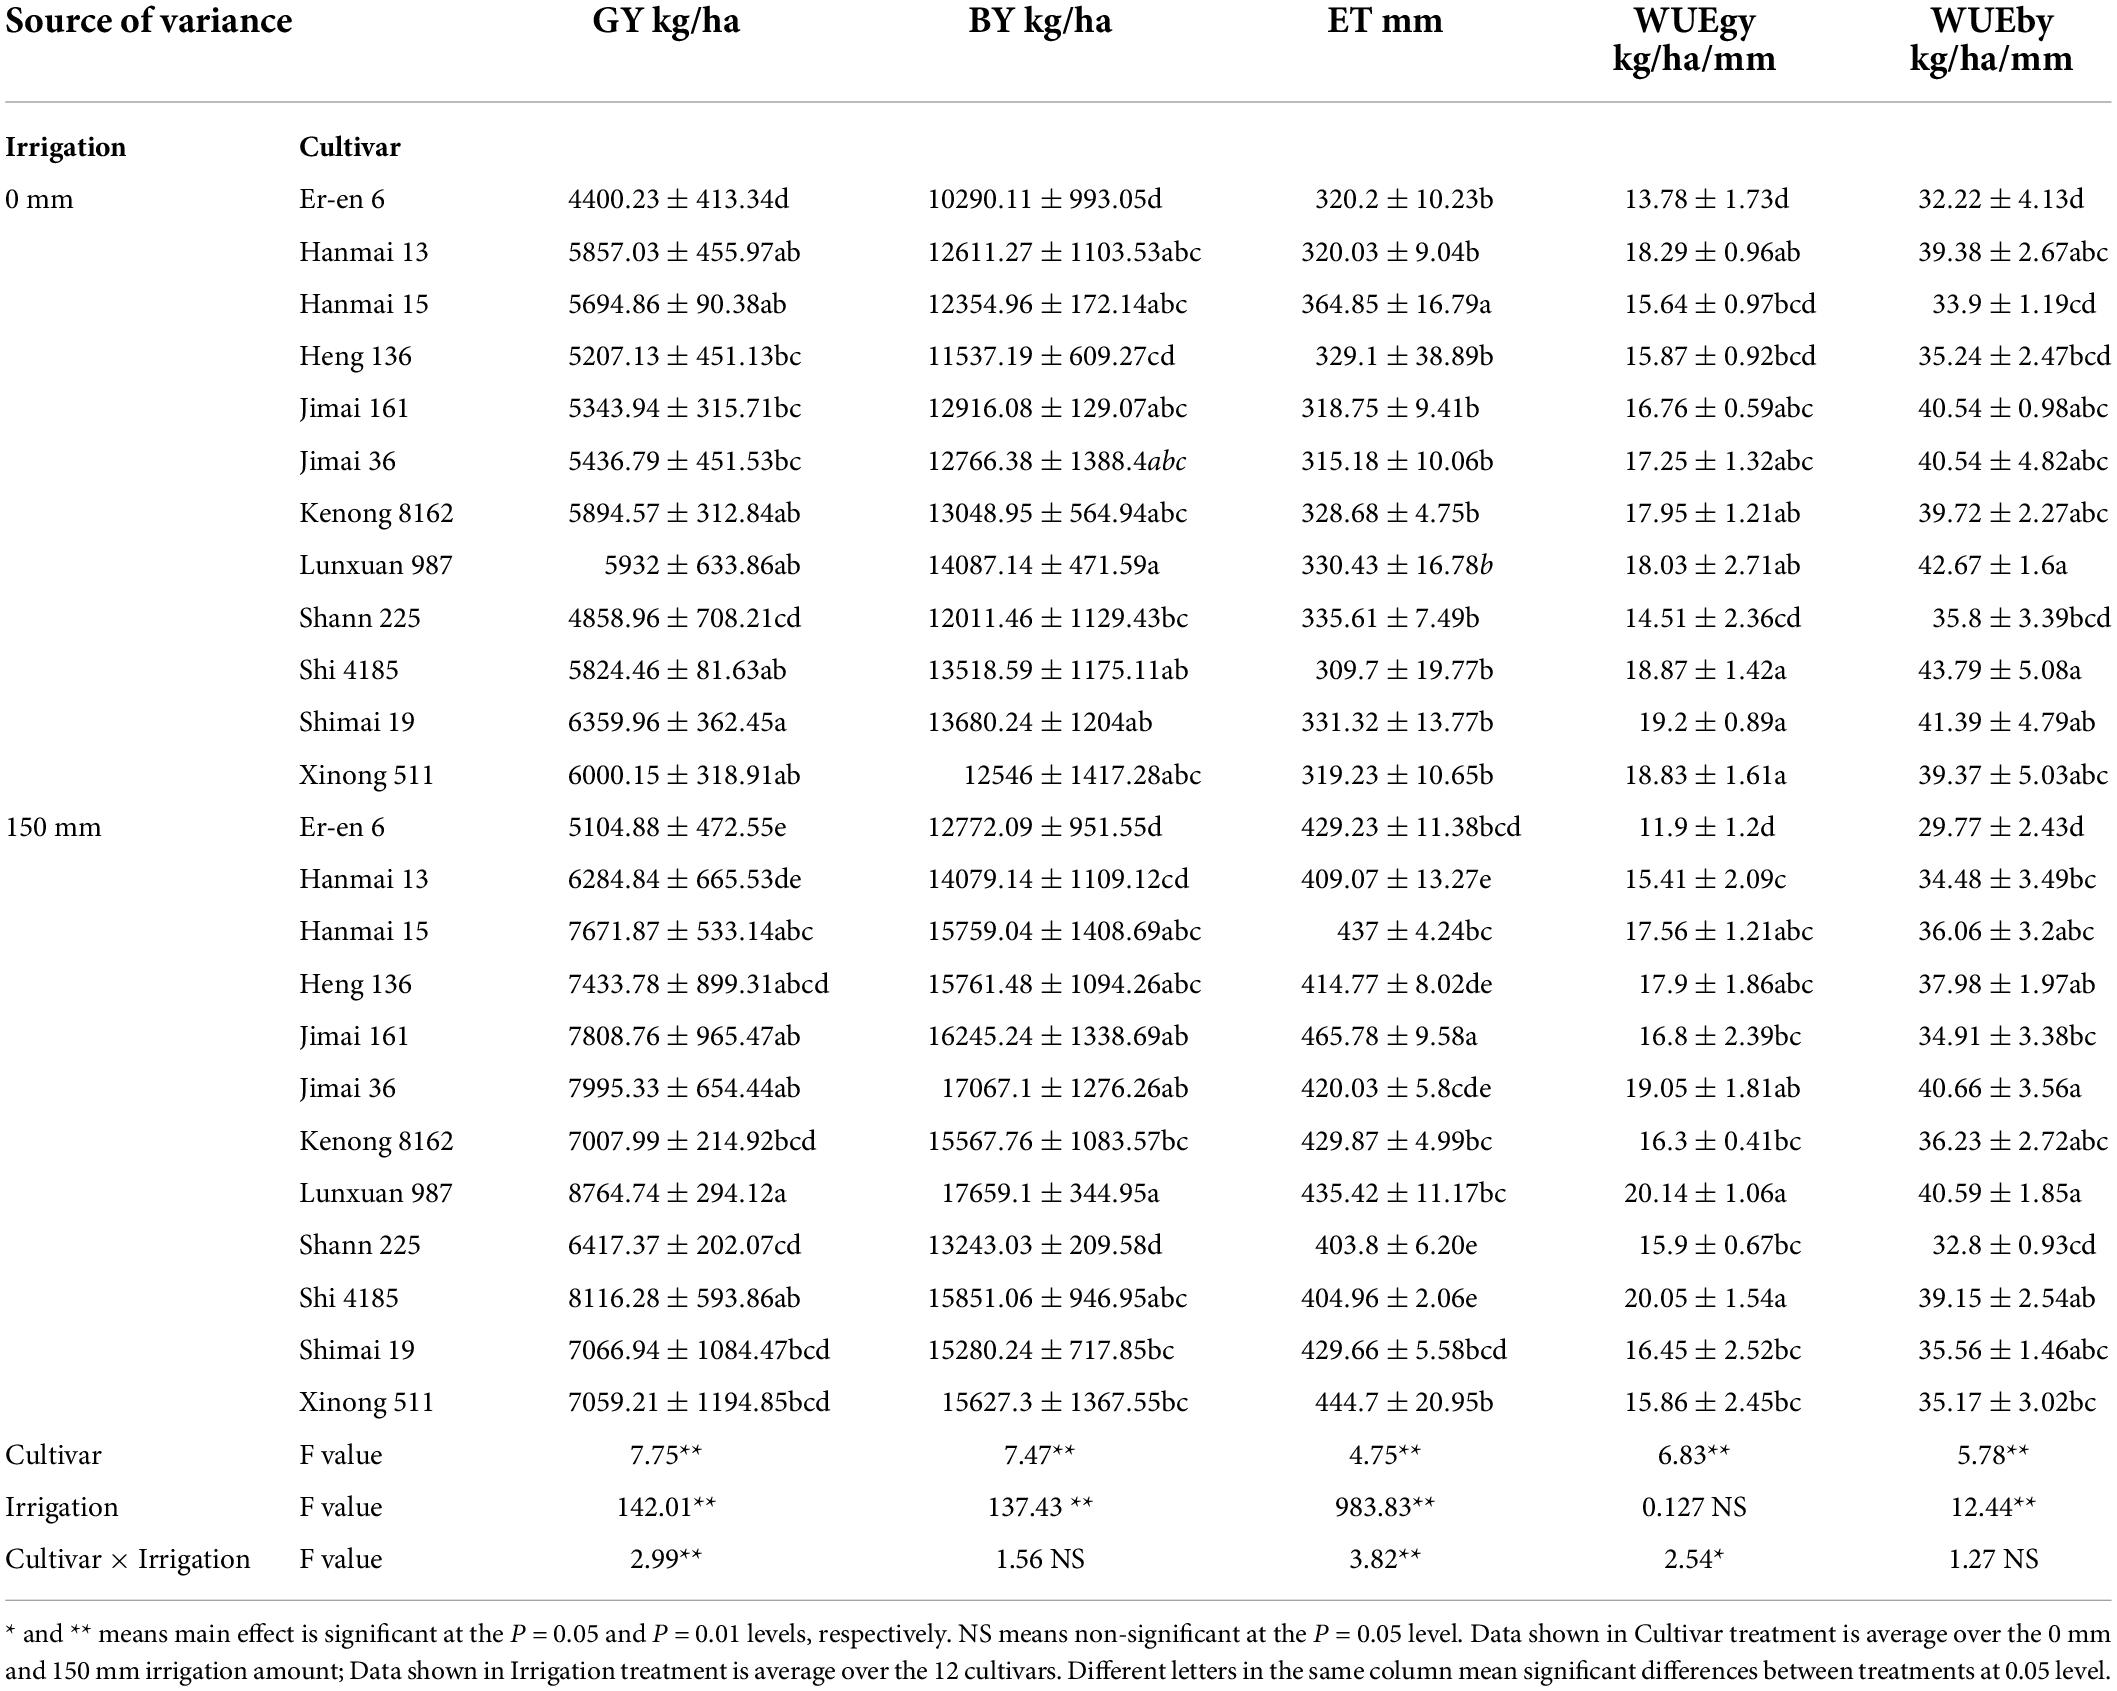
Table 3. Effects of cultivar and irrigation on field observed grain yield (GY), Biomass yield (BY), evapotranspiration (ET), and water use efficiency at grain yield level (WUE gy) and biomass yield level (WUE by).
Cultivars showed significant effects on both WUE gy and WUE by. Irrigation only showed a significant effect on WUE by. The combination only showed significant effects on WUE gy but not on WUE by. Two irrigation treatments decreased WUE by 2.02 kg/ha/mm (p < 0.05, averaged over 12 cultivars) compared to the rainfed treatment. The decrease might be attributed to the fact that 150 mm irrigation only resulted in a 99.90 mm increase in ET compared to rainfed treatment. This indicated that approximately 50.10 mm of irrigation was not used by wheat (Table 3). Among all cultivars, Cultivar E-en6 showed minimal WUE gy and WUE by under both irrigation conditions. Shimai19, Shi4185 and Xinong 511 showed the best WUE in the rainfed treatment, and Lunxuan987 and Shi4185 showed the best WUE in 150 mm irrigation.
Relationship of seedling transpiration efficiency to whole seasonal growth and water use efficiency
The relationship of seedling TE to field-observed yield and WUE was dependent on the SWC level at which TE was observed (Figure 8 and Table 2). Linear correlation and regression analytical results indicated that TE measured at the lowest and highest RSWC was negatively and positively related to field yield and WUE, respectively, whether significant or not. The correlation decreased either with decreasing RSWC from 72.6% or with increasing RSWC from 12.1% to moderate RSWC. The minimal correlation coefficient appeared in TE measured at RSWC = 36.3% or RSWC = 48.4%. TE at RSWC = 12.1% was negatively correlated with GY, BY, WUE gy and WUE by under the rainfed treatment and not significantly correlated under 150 mm irrigation. There was almost no significant correlation of seedling TE to yield and WUE at other RSWC levels, except for the association of TE at SWC = 60.5% and at RSWC = 72.6% to BY under rainfed conditions. However, TE FC, which could be taken as TE measured at SWC of FC, was positively correlated with field yield and WUE either at grain yield or at biomass yield level, regardless of whether the wheat cultivar was irrigated.
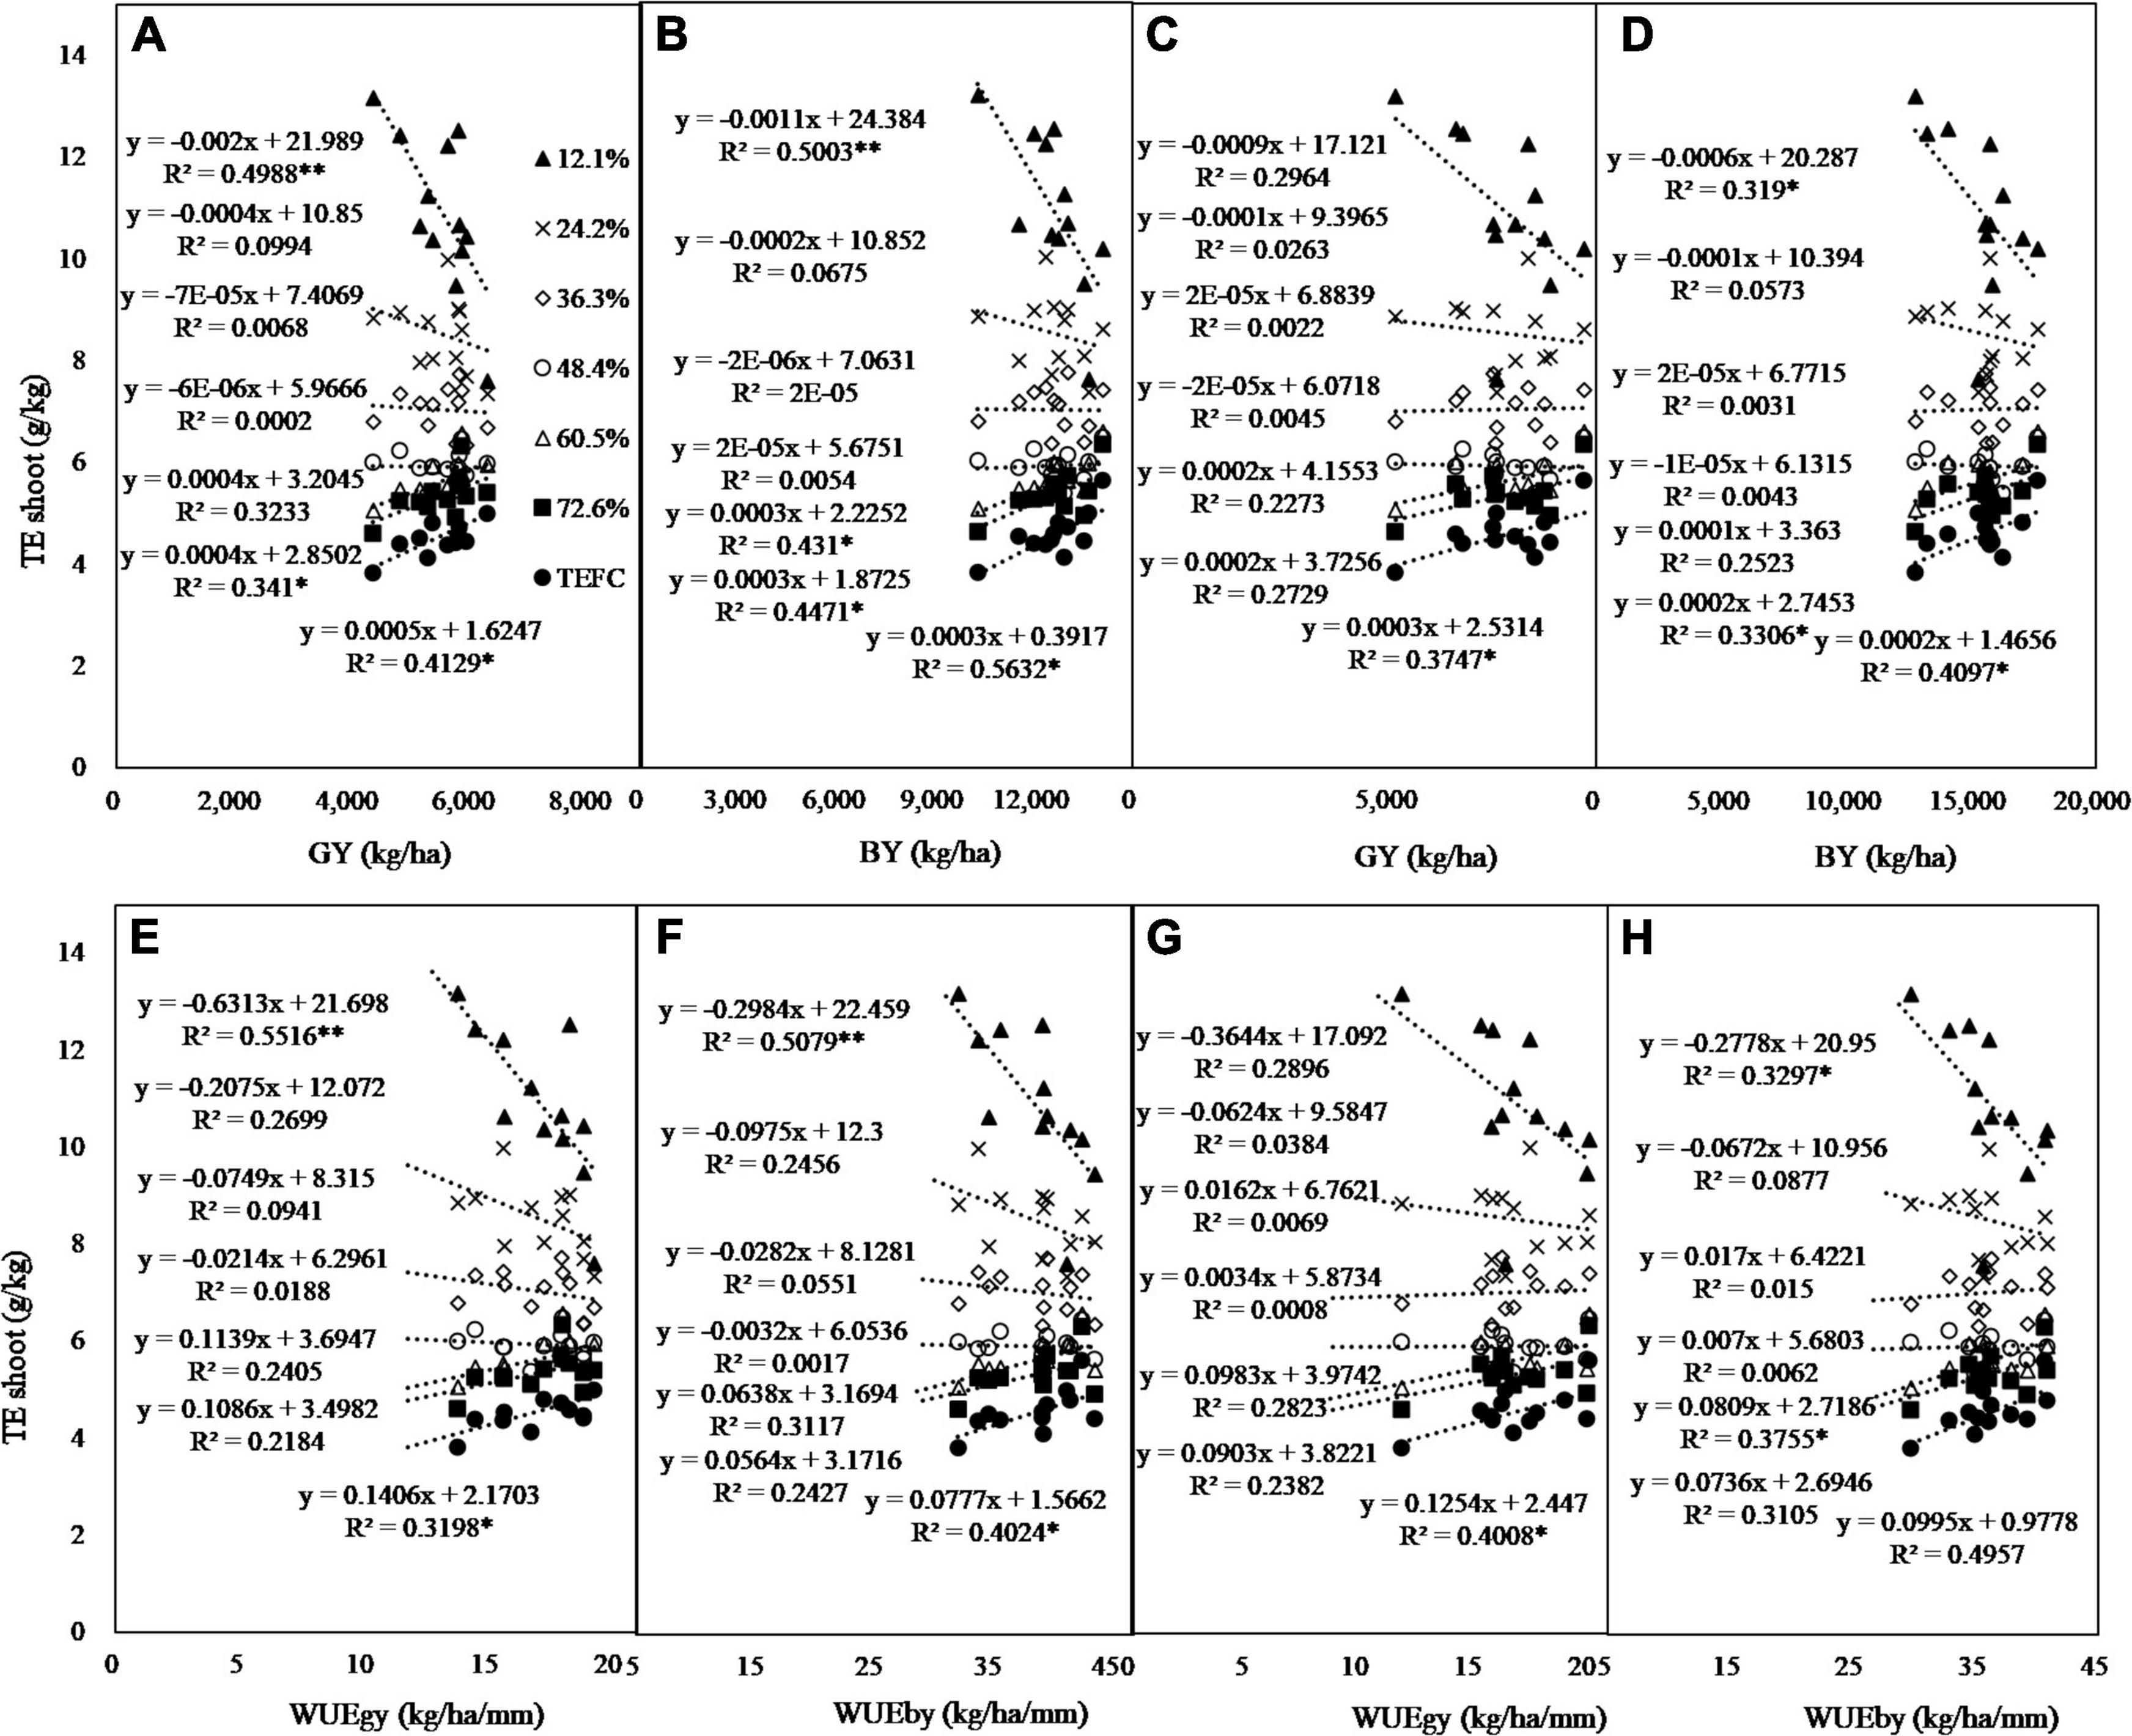
Figure 8. The regression of pot TE shoot to yield (GY, grain yield; BY, biomass yield) and water use efficiency (WUE gy, WUE at grain yield level; WUE by, WUE at biomass level) under rain-fed (A,B,E,F) and twice irrigation (150 mm, C,D,G,H). TE FC, TE measured at field capacity, *, ** means significant at the P = 0.05 and P = 0.01 levels, respectively.
Discussion
Response of transpiration efficiency to relative soil water content
The present study aimed to describe the response of TE to RSWC using a tightly sealed pot experiment. The results showed that TE decreased power functionally following the increase in RSWC gradients. The relationship can be described as TE = TE FC × (RSWC) b. In recent years, a large number of studies have focused on the variation in TE under various soil moisture conditions (Zhang et al., 1998; Jamalluddin et al., 2019). TE was usually found to decrease due to irrigation, precipitation and higher SWC (Zhang et al., 1998; Brueck et al., 2010; Sinclair, 2012). For instance, wheat TE at the dry matter level was found to be significantly higher under rainfed conditions than under irrigation in a 5-year experiment in northern Syria, an area with a typical Mediterranean climate (Zhang et al., 1998). Siahpoosh and Dehghanian (2012) reported the negative linear regression of TE against ET. The present results did not support their findings completely, especially in the shape of the regression line. Although many studies have focused on the response of TE to soil moisture, this is the first report on the power functional TE–RSWC curve to date within the bounds of our knowledge.
Soil water status is the most important factor that determines productivity and water consumption (Carter and Sheaffer, 1983; Flénet et al., 1996). Maintaining soil moisture at a higher level will help to harvest more yield. In arid and semiarid regions, various irrigation techniques (Zhou et al., 2021), water saving strategies (Wang et al., 2002), drought tolerant varieties (Kulathunga et al., 2021), bare soil mulching with straw or plastic film (Qin et al., 2022) and no-tillage (Guo et al., 2020; Peixoto et al., 2020) have been adopted and have been shown to be effective in improving crop yields. The common feature of all these yield-enhancing agronomic methods is the increase/maintenance in SWC. It must be mentioned that higher SWC also means higher evaporative loss in field crops and thus lower TE and WUE. This implies that the increased yield mainly results from the increased Tr (water uptake by plants, water use) but not the enhanced TE. This is not to say that breeding varieties with high TE are of no use. Varieties with high TE may have the potential to leave more water in the soil to maintain SWC at a higher level for later use (Christy et al., 2018). Thus, the best solutions for best wheat production exist in 3 choices, giving water as much as we can but not excessively, trying best to maintain the water in the soil available to the root system, and avoiding water loss through non-productive E as much as we can. This would help us to yield as much as possible in regions with either plenty of water or water shortages.
Usage of the transpiration efficiency–relative soil water content curve
The TE–RSWC curve offers a promising method to screen cultivars/species for high yield and high WUE purposes. The second objective of the present study is to evaluate whether TE measured at the seedling stage can help to screen wheat cultivars with high yield and high WUE in the field. Although the TE of the present study was obtained from an experiment conducted at the seedling stage, the results indicated that TE FC, which was positively related to field yield and WUE, could be used as a surrogate for high yield and WUE (Figure 8). Additionally, the TE measured at RSWC ≤ 12.1% is also acceptable as an indicator of yield and WUE in rainfed conditions. However, TE measured at other RSWC values, i.e., 24.2, 36.3, 48.4, 60.5, and 72.6%, could not be used to represent field yield and WUE. This could be attributed to the instability of ranks among cultivars (Figure 6). A few other studies have confirmed that TE at the seedling stage can be used to represent seasonal TE. For example, Thapa et al. reported that the TE of sorghum was the same among six leaf, flag leaf, grain-filling and maturity stages (Thapa et al., 2017). The results of a four-water-level experiment in Iran showed that an increase in TE could improve the WUE in wheat genotypes (Siahpoosh and Dehghanian, 2012). The present study suggested that a cultivar with a higher TE FC may produce more GY and show higher WUE than a cultivar with a lower TE FC. This will greatly simplify the screening work for varieties with high WUE.
The TE–RSWC curve offers a promising method to compare TE between cultivars or species not only applicable to wheat but also to other densely planted crops, such as millet and oats. However, conducting an experiment with many SWC levels would impede the application of this pot method. But the characteristics of the power function and the relationship between parameter b and TE FC may help to simplify the experimental procedure. According to the feature of the power function TE = TE FC × (RSWC) b, when RSWC = 1, TE = TE FC. That is, TE FC can be observed under soil moisture at field capacity or even saturated soil or water culture conditions. The situation is in accordance with Fletcher et al. (2018), who measured the TE of wheat cultivated with sufficient water. Additionally, parameter b is significantly related to TE FC (Figure 9), b = 0.1806 × TE FC - 1.2444 (R2 = 0.7375, n = 12, p ≤ 0.01). These two important features together make the work much easier than ever. Moreover, there is another advantage of high soil moisture conditions that should be addressed. Researchers can use open pots since the soil water content is no longer a limiting factor on the soil surface evaporation rate. Tr can be calculated as the ET of the planted pot minus the ET of the bare pot. This greatly simplifies the measuring process further.
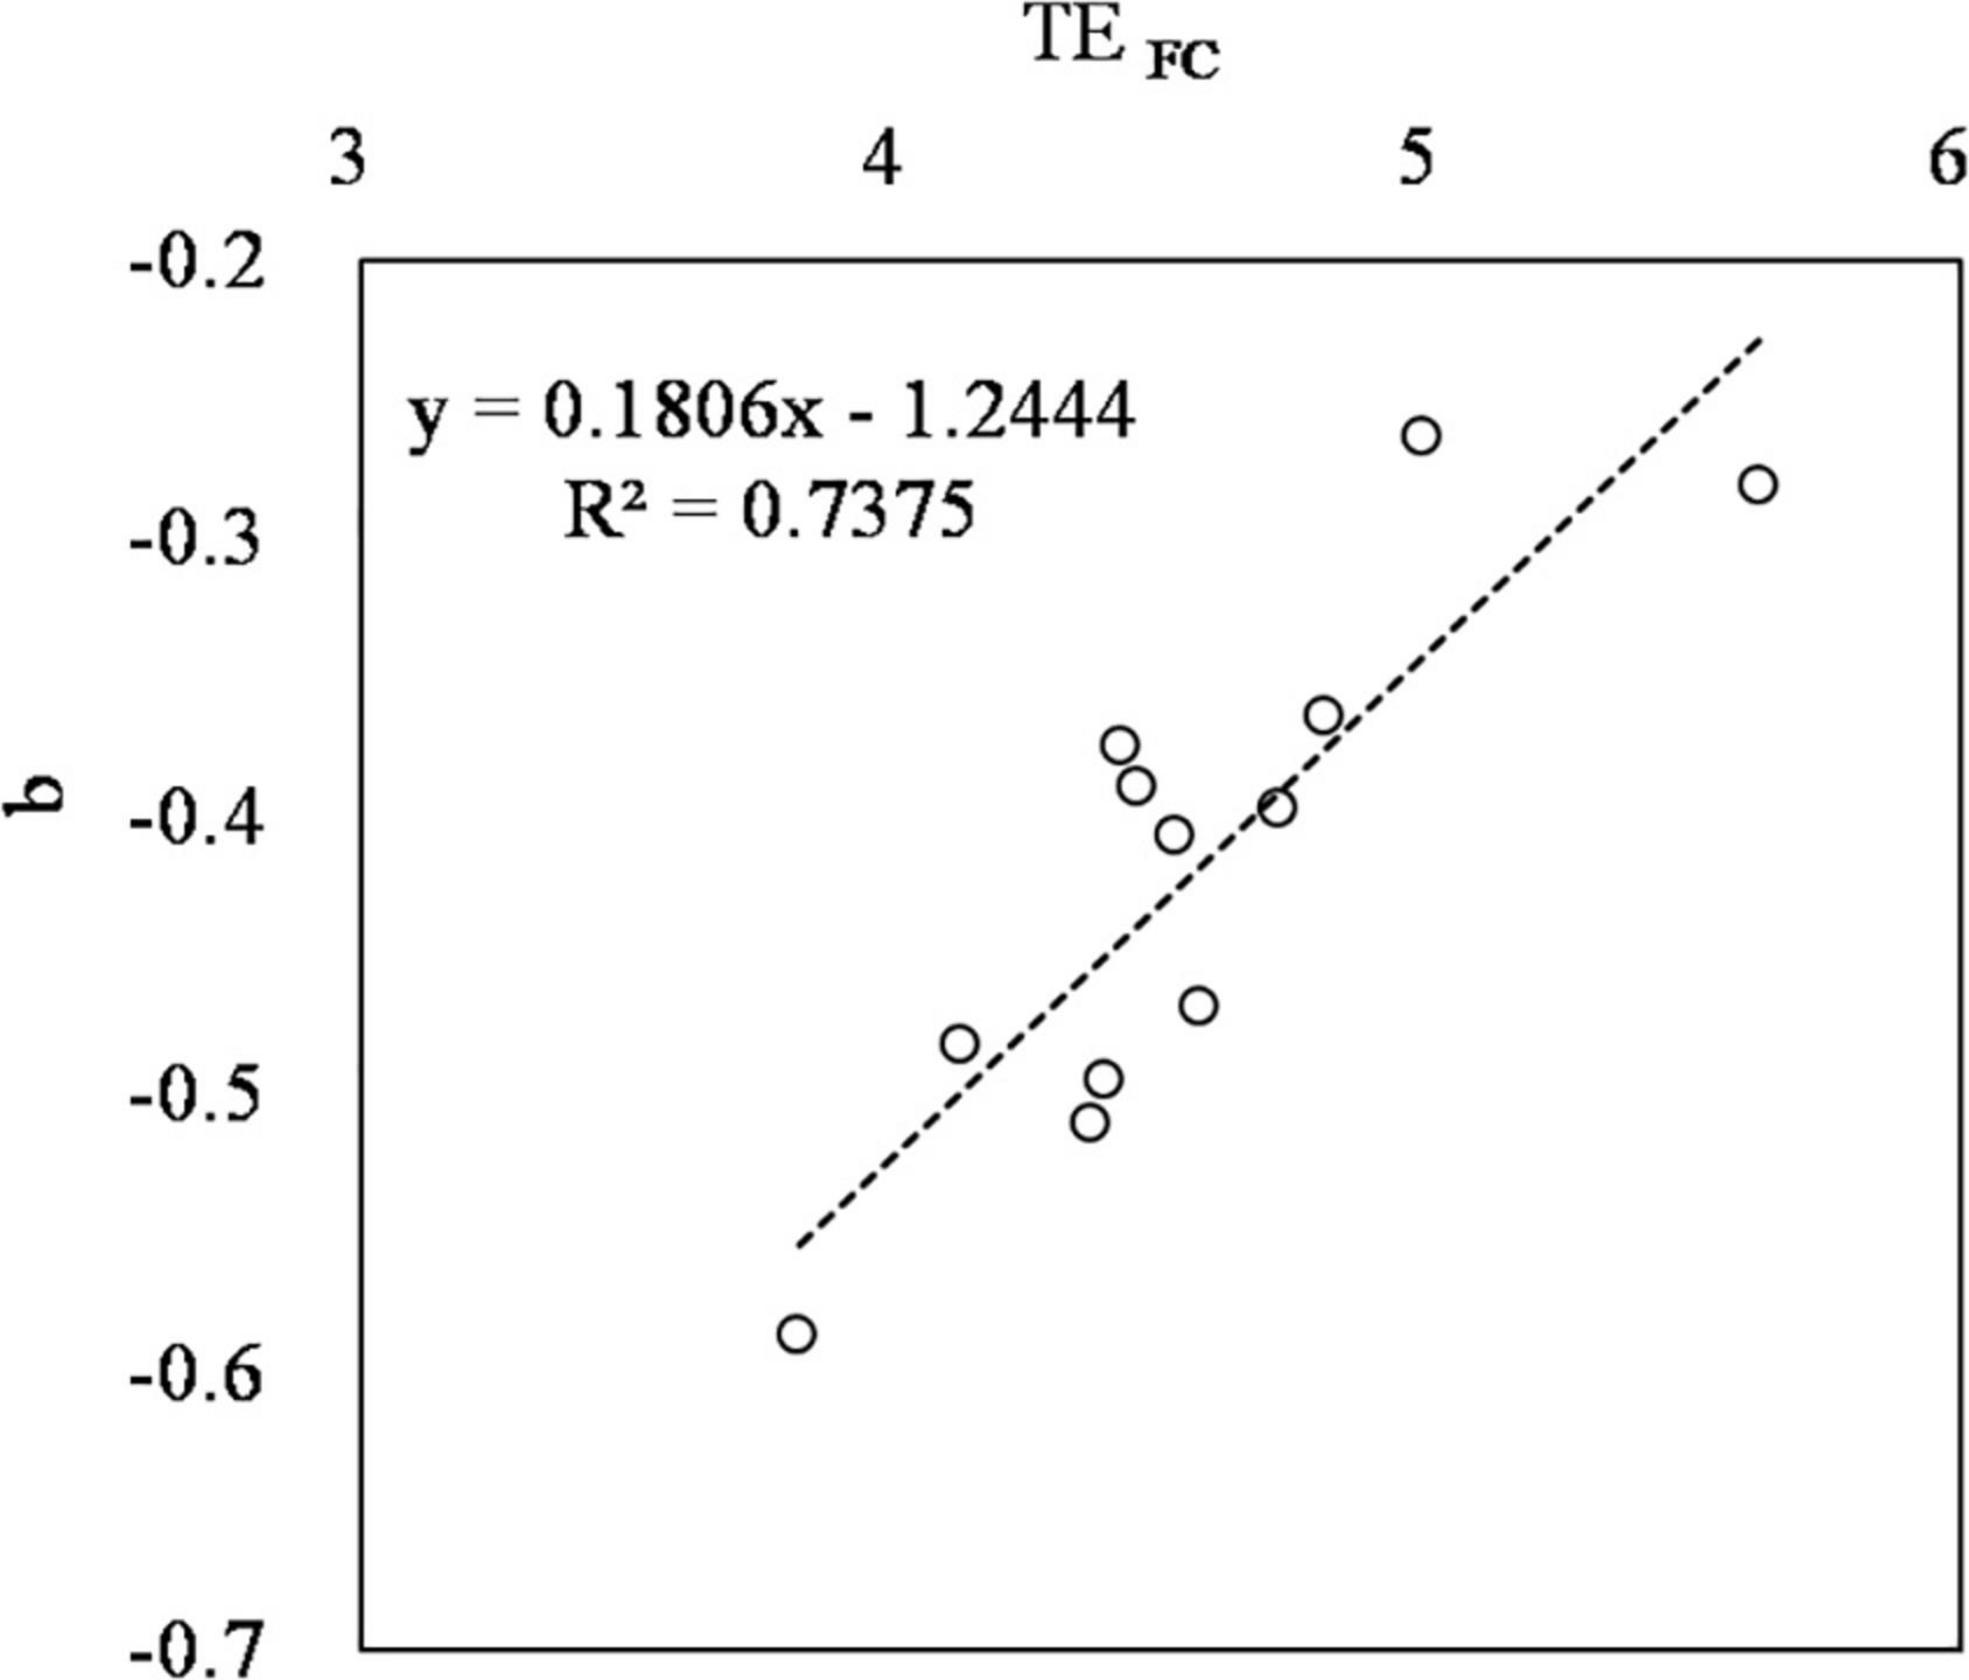
Figure 9. The relationship between parameter TE FC and b of the power function TE = TE FC × (RSWC)b in TE shoot (transpiration efficiency of shoot, the ratio of shoot mass to transpiration loss).
There are also other possible uses of the TE–RSWC curve that should be addressed. The following usages were examined under the premise that the TE–RSWC curve was known. I) It could be used to estimate TE at any given RSWC (Function 7). This implied that we would be clear about the TE at any growing moment by real-time checking of the soil water status. II) It could be used to estimate Tr. Scientists from all over the world have tried methods to partition water used (ET) into transpiration (Tr) and soil evaporation (E) (Ritchie, 1972; Zhang et al., 1998). According to the present results and the definition of TE, Tr can be estimated as Tr = shoot mass/TE shoot, where shoot mass can be obtained by harvesting the aboveground part of the plant studied. TE shoot could be obtained with the TE–RSWC curve and RSWC. However, efforts are still needed to estimate long-term or seasonal Tr, such as the variability in the TE–RSWC curve among different growing stages.
Uncertainties of the transpiration efficiency–relative soil water content curve
The present study provided an accurate measuring method of TE by restricting E to an extremely low level. The same pots without seedlings were tucked in with toothpicks made of bamboo with a diameter similar to that of wheat seedlings to test the proofness. The water loss rate was 0.03 ± 0.01 g⋅day–1⋅pot–1. The ratio of leakage to total Tr was approximately 10.81 ± 0.88%, 3.36 ± 0.34%, 1.83 ± 0.12%, 1.29 ± 0.06%, 1.09 ± 0.02%, and 1.01 ± 0.01% with increasing RSWC from 12.1 to 72.6%. Attention should be given to the fact that leakage will take a larger portion of the total Tr in the low moisture treatment. However, the error is easily eliminated because the leakage was the same independent of soil moisture. Researchers adopting this method are suggested to set out their study with a relative soil moisture no less than 24.2%.
Further studies should be conducted to certify the impacts of other factors that may affect the TE–RSWC curve. As is already known, variation in soil types (Ritchie, 1972; Tfwala et al., 2021), agronomic strategies such as fertilization (Hernandez et al., 2021) and organic amendments (Wang et al., 2021), growth regulators (Li et al., 2017, 2020), and environmental factors such as temperature (Vadez and Ratnakumar, 2016), atmospheric CO2 concentration (Tausz-Posch et al., 2012; Christy et al., 2018) and VPD [atmospheric vapor pressure deficit, (Vadez et al., 2014)] might change the TE of a given cultivar. Previous studies have also reported alterations in the ranking of TE among varieties resulting from some of these factors (Zhao et al., 2008; Fletcher et al., 2018). Setting out to study the effects of such factors on the TE–RSWC curve and the underlying mechanisms will help us to understand changes in TE due to exposure to various surroundings.
Conclusion
Transpiration efficiency decreases power functionally following the increase in RSWC. The relationship can be described as TE = TE FC × (SWC)b. The parameter TE FC is the TE of a certain cultivar at RSWC = 1 (SWC = FC). The parameter b was intimately related to TE FC in a linear manner, i.e., b = 0.1806 × TE FC - 1.2444 (R2 = 0.7375, n = 12, p ≤ 0.01). The TE–RSWC curve can be used to compare TE between cultivars, to estimate transpiration loss of soil water, and to screen for high yield and high WUE varieties. Cultivars with higher TE FC are expected to produce more GY with higher WUE under field conditions. The TE–RSWC curve can be briefly measured by planting crops under soil moisture at FC or with more than saturated soil moisture or even in water culture to obtain TE FC and then obtain parameter b according to the regression between b and TE FC. This curve may help greatly in screening for crop cultivars with high yield and high WUE.
Data availability statement
The raw data supporting the conclusions of this article will be made available by the authors, without undue reservation.
Author contributions
YQ and XZ designed the experiments and revised the manuscript. ML contributed to the formal analysis. DL and WQ contributed to the investigation and writing – original draft preparation. DL, YL, HY, and WL contributed to the resources. BD contributed to the data curation and project administration. YQ contributed to the writing – review and editing. XZ contributed to the supervision and funding acquisition. All authors read and approved the final manuscript.
Funding
The study was funded by the International Cooperation Project of MOST (2017YFE0130500), the National Key Research and Development Program of China (2021YFD190100301), the Strategic Priority Research Program of Chinese Academy of Sciences (XDA 26040102 and XDA28120105), the Hebei Key Research and Development Program (20326415D and 19226436D), and the State Key Laboratory of North China Crop Improvement and Regulation.
Acknowledgments
We are grateful to staff for the field data collection.
Conflict of interest
The authors declare that the research was conducted in the absence of any commercial or financial relationships that could be construed as a potential conflict of interest.
Publisher’s note
All claims expressed in this article are solely those of the authors and do not necessarily represent those of their affiliated organizations, or those of the publisher, the editors and the reviewers. Any product that may be evaluated in this article, or claim that may be made by its manufacturer, is not guaranteed or endorsed by the publisher.
References
Allen, R. G., Pereira, L. S., Raes, D., and Smith, M. (1998). Crop Evapotranspiration – Guidelines for Computing Crop Water Requirements – FAO Irrigation and Drainage Paper. Rome: FAO, 56.
Balota, M., Payne, W. A., Evett, S. R., and Peters, T. R. (2008). Morphological and physiological traits associated with canopy temperature depression in three closely related wheat lines. Crop Sci. 48, 1897–1910. doi: 10.2135/cropsci2007.06.0317
Brueck, H., Erdle, K., Gao, Y., Giese, M., Zhao, Y., Peth, S., et al. (2010). Effects of N and water supply on water use-efficiency of a semiarid grassland in Inner Mongolia. Plant Soil 328, 495–505.
Carter, P. R., and Sheaffer, C. C. (1983). Alfalfa Response to soil water deficits. I. Growth, forage quality, yield, water use, and water-use efficiency1. Crop Sci. 23, 669–675. doi: 10.2135/cropsci1983.0011183X00230004
Christy, B., Tausz-Posch, S., Tausz, M., Richards, R., Rebetzke, G., Condon, A., et al. (2018). Benefits of increasing transpiration efficiency in wheat under elevated CO2 for rainfed regions. Glob. Change Biol. 24, 1965–1977. doi: 10.1111/gcb.14052
Collard, B. C. Y., Jahufer, M. Z. Z., Brouwer, J. B., and Pang, E. C. K. (2005). An introduction to markers, quantitative trait loci (QTL) mapping and marker-assisted selection for crop improvement: The basic concepts. Euphytica 142, 169–196. doi: 10.1007/s10681-005-1681-5
Condon, A. G., Richards, R. A., and Farquhar, G. D. (1993). Relationships between carbon-isotope discrimination, water-use efficiency and transpiration efficiency for Dryland Wheat. Aust. J. Agr. Res. 44, 1693–1711. doi: 10.1071/Ar9931693
Deery, D. M., Rebetzke, G., Jimenez-Berni, J., James, R., Condon, A., Bovill, W., et al. (2016). Methodology for high-throughput field phenotyping of CT using airborne thermography. Front. Plant Sci. 7:1808. doi: 10.3389/fpls.2016.01808
Ehdaie, B. (1995). Variation in water use efficiency and its components in wheat: II. Pot and field experiments. Crop Sci. 35, 1617–1626. doi: 10.2135/cropsci1995.0011183X003500060017x
Farquhar, G. D., and Richards, R. A. (1984). Isotopic composition of plant carbon correlates with water-use efficiency of wheat genotypes. Aust. J. Plant Physiol. 11, 539–552. doi: 10.1071/Pp9840539
Flénet, F., Bouniols, A., and Saraiva, C. (1996). Sunflower response to a range of soil water contents. Eur. J. Agron. 5, 161–167. doi: 10.1016/s1161-0301(96)02006-0
Fletcher, A., Christopher, J., Hunter, M., Rebetzke, G., and Chenu, K. (2018). A low-cost method to rapidly and accurately screen for transpiration efficiency in wheat. Plant Methods 14, 77–90. doi: 10.1186/s13007-018-0339-y
Guo, Y., Yin, W., Fan, Z. L., Hu, F. L., Fan, H., Zhao, C., et al. (2020). No-tillage with reduced water and nitrogen supply improves water use efficiency of wheat in arid regions. Agron. J. 112, 578–591. doi: 10.1002/agj2.20031
Hernandez, M. D., Alfonso, C., Echarte, M. M., Cerrudo, A., and Echarte, L. (2021). Maize transpiration efficiency increases with N supply or higher plant densities. Agric. Water Manag. 250:106816. doi: 10.1016/j.agwat.2021.106816
Jamalluddin, N., Massawe, F. J., and Symonds, M. R. (2019). Transpiration efficiency of Amaranth (Amaranthus sp.) in response to drought stress. J Hortic. Sci. Biotechnol. 94, 448–459. doi: 10.1080/14620316.2018.1537725
Kulathunga, M. R. D. L., van Oosterom, E., Hammer, G. L., and Deifel, K. S. (2021). Transpiration efficiency of sorghum [Sorghum bicolor (L.) Moench] in relation to plant type and genotype. J. Natl. Sci. Found. Sri. 49, 183–193. doi: 10.4038/jnsfsr.v49i2.9968
Li, D., Zhang, D., Wang, H., Li, Y., and Li, R. (2017). Physiological response of plants to polyethylene glycol (PEG-6000) by exogenous melatonin application in wheat. Zemdirbyste 104, 219–228. doi: 10.13080/z-a.2017.104.028
Li, S., Li, X., Wei, Z., and Liu, F. (2020). ABA-mediated modulation of elevated CO2 on stomatal response to drought. Curr. Opin. Plant Biol. 56, 174–180. doi: 10.1016/j.pbi.2019.12.002
Liu, M. Y., and Liu, H. L. (2006). The invention of a method for accurately measuring the transpiration efficiency of plants and a device thereof. Patent No. ZL 2006:0012505.5.
Liu, X. W., Feakins, S. J., Dong, X. J., Xue, Q. W., Han, J., Marek, T., et al. (2019). Evaluating leaf wax and bulk leaf carbon isotope surrogates for water use efficiency and grain yield in winter wheat. Crop Sci. 59, 718–732. doi: 10.2135/cropsci2018.07.0452
Lobell, D. B., Hammer, G., Chenu, K., Zheng, B., McLean, G., and Chapman, S. (2015). The shifting influence of drought and heat stress for crops in Northeast Australia. Glob. Change Biol. 21, 4115–4127. doi: 10.1111/gcb.13022
Lu, Y., Yan, Z. Z., Li, L., Gao, C. S., and Shao, L. W. (2020). Selecting traits to improve the yield and water use efficiency of winter wheat under limited water supply. Agric. Water Manage. 242:106410. doi: 10.1016/j.agwat.2020.106410
Masle, J., Farquhar, G. D., and Wong, S. C. (1992). Transpiration ratio and plant mineral content are related among genotypes of a range of species. Aust. J Plant Physiol. 19, 709–721. doi: 10.1071/pp9920709
Misra, S. C., Shinde, S., Geerts, S., Rao, V. S., and Monneveux, P. (2010). Can carbon isotope discrimination and ash content predict grain yield and water use efficiency in wheat? Agric. Water Manage. 97, 57–65. doi: 10.1016/j.agwat.2009.08.014
Natarajan, S., Basnayake, J., Lakshmanan, P., and Fukai, S. (2021). Genotypic variation in intrinsic transpiration efficiency correlates with sugarcane yield under rainfed and irrigated field conditions. Physiol. Plant 172, 976–989. doi: 10.1111/ppl.13221
Peixoto, D. S., Silva, L. C. M. D., Melo, L. B. B., Azevedo, R. P., Araújo, B. C. L., de Carvalho, T. S., et al. (2020). Occasional tillage in no-tillage systems: A global meta-analysis. Sci. Total Environ. 745:140887. doi: 10.1016/j.scitotenv.2020.140887
Prasad, P. V. V., Pisipati, S. R., Momčilović, I., and Ristic, Z. (2011). Independent and combined effects of high temperature and drought stress during grain filling on plant yield and chloroplast EF-Tu expression in spring wheat. J. Agron. Crop Sci. 197, 430–441. doi: 10.1016/j.scitotenv.2020.140887
Qin, Y. Q., Chai, Y. W., Li, R., Li, Y. W., Ma, J. T., Cheng, L., et al. (2022). Evaluation of straw and plastic film mulching on wheat production: A meta-analysis in Loess Plateau of China. Field. Crop Res. 275:108333. doi: 10.1016/j.fcr.2021.108333
Ritchie, J. T. (1972). Model for predicting evaporation from a row crop with incomplete cover. Water Resour. Res. 8, 1204–1213. doi: 10.1029/WR008i005p01204
Shiferaw, B., Smale, M., Braun, H. J., Duveiller, E., Reynolds, M., and Muricho, G. (2013). Crops that feed the world 10. Past successes and future challenges to the role played by wheat in global food security. Food Sec. 5, 291–317. doi: 10.1007/s12571-013-0263-y
Siahpoosh, M. R., and Dehghanian, E. (2012). Water use efficiency, transpiration efficiency, and uptake efficiency of wheat during drought. Agron. J. 104, 1238–1243. doi: 10.2134/agronj2011.0320
Sinclair, T. R. (2012). Is transpiration efficiency a viable plant trait in breeding for crop improvement? Funct. Plant Biol. 39, 359–365. doi: 10.1071/FP11198
Tausz-Posch, S., Seneweera, S., Norton, R. M., Fitzgerald, G. J., and Tausz, M. (2012). Can a wheat cultivar with high transpiration efficiency maintain its yield advantage over a near-isogenic cultivar under elevated CO2? Field Crop Res. 133, 160–166. doi: 10.1016/j.fcr.2012.04.007
Tfwala, C. M., Ukoh Haka, I. B., van Rensburg, C. C., and Du Preez, C. C. (2021). Influence of soils and different phases of reproductive growth stage on transpiration efficiency of irrigated Canola. Irrig. Drain. 69, 891–902. doi: 10.1002/ird.2469
Thapa, S., Stewart, B. A., and Xue, Q. W. (2017). Grain sorghum transpiration efficiency at different growth stages. Plant Soil Environ. 63, 70–75. doi: 10.1002/ird.2469
Vadez, V., and Ratnakumar, P. (2016). High transpiration efficiency increases pod yield under intermittent drought in dry and hot atmospheric conditions but less so under wetter and cooler conditions in groundnut (Arachis hypogaea (L.)). Field Crop Res. 193, 16–23. doi: 10.1016/j.fcr.2016.03.001
Vadez, V., Kholova, J., Medina, S., Kakkera, A., and Anderberg, H. (2014). Transpiration efficiency: New insights into an old story. J. Exp. Bot. 65, 6141–6153. doi: 10.1093/jxb/eru040
Vadez, V., Rao, S., Kholova, J., Krishnamurthy, L., Kashiwagi, J., Ratnakumar, P., et al. (2008). Root research for drought tolerance in legume: Quo vadis? J. Food Legum. 21, 77–85.
Villalobos, F. J., and Fereres, E. (1990). Evaporation Measurements beneath corn, cotton, and sunflower canopies. Agron. J. 82, 1153–1159. doi: 10.2134/agronj1990.00021962008200060026x
Wang, H. X., Liu, C. M., and Zhang, L. (2002). Water-saving agriculture in China: An overview. Adv. Agron. 75, 135–171. doi: 10.1016/S0065-2113(02)75004-9
Wang, X. J., Sale, P., Franks, A., Jin, J., Krohn, C., Armstrong, R., et al. (2021). An insight into the effect of organic amendments on the transpiration efficiency of wheat plant in a sodic duplex soil. Front. Plant Sci. 12:722000. doi: 10.3389/fpls.2021.722000
Wang, Y., Wang, J. H., Chai, G. Q., Li, C. L., Hu, Y. G., Chen, X. H., et al. (2015). Developmental changes in composition and morphology of cuticular waxes on leaves and spikes of glossy and glaucous wheat (Triticum aestivum L.). PLoS One 10:e0141239. doi: 10.1371/journal.pone.0141239
Zhang, H. P., Oweis, T. Y., Garabet, S., and Pala, M. (1998). Water-use efficiency and transpiration efficiency of wheat under rain-fed conditions and supplemental irrigation in a Mediterranean-type environment. Plant Soil 201, 295–305. doi: 10.1023/A:1004328004860
Zhang, X. Y., Chen, S. Y., Sun, H. Y., Pei, D., and Wang, Y. M. (2008). Dry matter, harvest index, grain yield and water use efficiency as affected by water supply in winter wheat. Irrig. Sci. 27, 1–10. doi: 10.1007/s00271-008-0131-2
Zhang, X. Y., Chen, S. Y., Sun, H. Y., Wang, Y. M., and Shao, L. W. (2009). Root size, distribution and soil water depletion as affected by cultivars and environmental factors. Field. Crop Res. 114, 75–83. doi: 10.1016/j.fcr.2009.07.006
Zhao, H., Zhang, Z. B., Shao, H. B., Xu, P., and Foulkes, M. J. (2008). Genetic correlation and path analysis of transpiration efficiency for wheat flag leaves. Environ. exp. bot. 64, 1128–1134.
Keywords: TE–RSWC curve, power function, transpiration efficiency, yield, water use efficiency
Citation: Qiao Y, Li D, Qiao W, Li Y, Yang H, Liu W, Liu M, Zhang X and Dong B (2022) Development and application of a relative soil water content – transpiration efficiency curve for screening high water use efficiency wheat cultivars. Front. Plant Sci. 13:967210. doi: 10.3389/fpls.2022.967210
Received: 12 June 2022; Accepted: 31 July 2022;
Published: 26 August 2022.
Edited by:
Luigi Lucini, Catholic University of the Sacred Heart, ItalyReviewed by:
Xiangnan Li, Northeast Institute of Geography and Agroecology (CAS), ChinaHonghai Luo, Shihezi University, China
Copyright © 2022 Qiao, Li, Qiao, Li, Yang, Liu, Liu, Zhang and Dong. This is an open-access article distributed under the terms of the Creative Commons Attribution License (CC BY). The use, distribution or reproduction in other forums is permitted, provided the original author(s) and the copyright owner(s) are credited and that the original publication in this journal is cited, in accordance with accepted academic practice. No use, distribution or reproduction is permitted which does not comply with these terms.
*Correspondence: Baodi Dong, ZG9uZ2Jhb2RpQDEyNi5jb20=
†These authors have contributed equally to this work
 Yunzhou Qiao
 Dongxiao Li
 Wenjun Qiao1
 Xiying Zhang
 Baodi Dong