 Xinwei Hou†
 Senan Cheng†Shukai WangTing YuYancui WangPingping XuXitong XuQi ZhouXuetong HouGuobin Zhang*
 Cuixia Chen*
- State Key Laboratory of Crop Biology, College of Agronomy, Shandong Agricultural University, Tai'an, China
Stalk strength is one of the most important traits in maize, which affects stalk lodging resistance and, consequently, maize harvestable yield. Rind penetrometer resistance (RPR) as an effective and reliable measurement for evaluating maize stalk strength is positively correlated with stalk lodging resistance. In this study, one F2 and three F2:3 populations derived from the cross of inbred lines 3705I (the low RPR line) and LH277 (the high RPR line) were constructed for mapping quantitative trait loci (QTL), conferring RPR in maize. Fourteen RPR QTLs were identified in four environments and explained the phenotypic variation of RPR from 4.14 to 15.89%. By using a sequential fine-mapping strategy based on the progeny test, two major QTLs, qRPR1-3 and qRPR3-1, were narrowed down to 4-Mb and 550-kb genomic interval, respectively. The quantitative real-time PCR (qRT-PCR) assay was adopted to identify 12 candidate genes responsible for QTL qRPR3-1. These findings should facilitate the identification of the polymorphism loci underlying QTL qRPR3-1 and molecular breeding for RPR in maize.
Introduction
Maize has become one of the most important food crops because it can be used as staple grain, fodder, and industrial raw material (Hu et al., 2012). Notably, stalk lodging reduced annual maize yields by 5–20% (Flint-Garcia et al., 2003b). Besides restricting maize yield and quality, stalk lodging is not conductive to mechanical harvest, and increases labor cost consequently (Zhang et al., 2020). Therefore, improving stalk-lodging resistance has been a key objective for maize breeding programs.
Stalk lodging is closely related to maize stalk strength, which was controlled by the morphology and cell wall structure components of stalk (Zuber et al., 1980; Robertson et al., 2017). So far, there have been several testing methods for evaluating stalk strength, including mechanical methods, chemical methods, and morphological measurement. Among them, the mechanical methods can evaluate the stalk strength of maize with large population in a short period, which is minimally required for the phenotypic measurement for fine mapping. Stalk crushing strength (SCS) (Zuber and Grogan, 1961), stalk bending strength (SBS) (Sekhon et al., 2020), and rind penetrometer resistance (RPR) (Dudley, 1994; Liu et al., 2020) are three typical mechanical methods in the field and positively correlated with stalk lodging resistance. Among them, RPR overcomes the drawbacks of SCS and SBS, including increasing labor cost and destructing maize stalk (Robertson et al., 2017), and has been widely applied to crop genetic breeding (Albrecht and Dudley, 1987; Abedon et al., 1999; Hu et al., 2000; Feng et al., 2009).
According to several genetic studies, RPR is regulated by a large number of QTL. Thirty-five individual QTLs and 11 pairs of epistatic interactions for RPR were detected from the four F2:3 maize populations. The major QTL accounted for > 15% of the total phenotypic variation of RPR (Flint-Garcia et al., 2003a). By constructing a recombinant inbred line (RIL) population crossed with the inbred lines Ce03005 and B73, nine additive-effect QTLs and one pair of epistatic interaction were identified and each QTL could explain the phenotypic variation of RPR from 1.15% (bin, 6.01) to 12.43% (bin, 3.06) (Hu et al., 2012). Across nested association mapping (NAM) and intermated B73 × Mo17 (IBM) families with more polymorphic loci and bigger mapping population, 18 QTLs and 141 significant GWAS associations for RPR were identified (Peiffer et al., 2013). Approximately, 3,072 SNPs in the GoldenGate maize SNP assay that could increase QTL resolution to make that seven QTLs for RPR were identified in the two RIL populations, the parents of which were H127R and Chang7-2 lines, and B73 and By804 lines, respectively. These QTLs could account for the RPR phenotypic variation from 4.4 to 18.9% (Li et al., 2014). Recently, stiff1, which encodes an F-box domain protein, has been identified for regulating stalk strength in maize. There is a 27.2 kb transposable element insertion in the promoter of stiff1, leading to increase in the content of cellulose and lignin in maize stalk and, consequently, higher stalk strength (Zhang et al., 2020). The identification of stiff1 paves a new way for the breeding program of maize stalk strength. However, the QTLs of stalk strength are still harder to be identified because of the complication of maize genome.
In this study, two inbred lines with great difference in RPR were chosen to construct F2 and F2:3 families for discovering more loci, conferring higher RPR to maize. By using a sequential fine-mapping strategy based on the progeny test (Ma et al., 2017), the physical region of two major QTLs, qPRP1-3 and qPRP3-1, was narrowed down to 4 MB and 550 kb. A qRT-PCR assay was adopted to identify the candidate gene responsible for qPRP3-1. These results provide a basis for facilitating molecular breeding of stalk strength and identifying causal gene underlying qPRP3-1.
Materials and Methods
Field Experiments and RPR Measurement
The F2 and F2:3 genetic population consisting of 214 individuals/families was constructed by single-seed descent from the cross between 3705I and LH277. In the summer of 2015, F2 population was planted at the experimental station of Shandong Agricultural University, Tai'an, China (36.18°N, 117.13°E). In the winter of 2015, F2:3 population obtained from self-pollinated F2 population was planted at the experimental station of Sanya, Hainan, China (18.15°N, 109.30°E). In the summer and winter of 2016, another two replications of F2:3 populations were planted at Tai'an and Sanya, respectively. Each line was grown in a single 2.8-m row; rows were 0.6 m apart, and planting density was 83,000 plants/ha. At the tasseling stage at the average level of each population, the RPR of five randomly selected plants in each row was measured against the three flat sides of the third internodes below the primary ear by using electronic penetrometer (ZTS-50N, IMADA Company, Japan; Supplementary Figure 1).
Phenotypic Data Analysis
Four sets of phenotypic data were obtained for the F2 and F2:3 populations, corresponding to the four field trials in the 2015-T, 2015-H, 2016-T, and 2016-H plantings. “KURT” and “SKEW” functions in Microsoft Office Excel were used to calculate the skewness and kurtosis (Liu K. et al., 2018). The differences of parental phenotypes were detected by the Student's T-test. The StatgenGxE package of R was used to test the significance of the genotypic and environment effects. The model of variance analysis is as follows: trait = trial + genotype + genotype: trial, in which trait is the phenotypic value, trial the environmental effect, genotype the genetic effect, genotype: trial the interaction effect between genotype and trial. Broad-sense heritability (H2) was calculated using the lme4 package of R based on the following formula:
where is a variance component of genotype, is a variance component of genotype × environment interaction, is a variance component of random error, e is number of environments, and r is number of replicates per environment (Liu X. et al., 2018).
Lignin Staining and SEM
Phloroglucinol-HCl staining was carried out as described previously (Tang et al., 2014). The third internode below the primary ear at the tasseling stage was sectioned with a double-edged razor blade and stained with 1% phloroglucinol (w/v) in 12% HCl for 5 min and immediately observed with a microscope under white light. The cross section of 3705I and LH277 stems was observed by using scanning electron microscopy (Sindhu et al., 2007). Approximately, 0.5-cm3 tissues containing rind of third internodes below the primary ear were cut free-hand by the razor blade and fixed with 3.5% glutaraldehyde at 4°C for at least 24 h. Samples were rinsed four times (20 min each) in 0.1-M sodium phosphate (pH 7.2) and then post-fixed in 1% osmium tetroxide for 1 h. After several washes with 0.2-M sodium phosphate (pH 7.2), the samples were dehydrated in a graded ethanol series (30, 50, 70, 80, 90, and 100%) and the critical point dried. Finally, the samples were mounted on an SEM aluminum stub with double-sided tape and sputter-coated with gold. Images were captured by using a JSM-6610LV scanning electron microscope at 5–10 kV.
DNA Extraction and SSR Analyses
Genomic DNA was extracted from fresh leaves of F2 and F2:3 families following the standard CTAB method (Murray and Thompson, 1980). Based on the maize genome database (http://www.maizegdb.org), 864 simple sequence repeat (SSR) markers that were distributed throughout the maize genome (Chromosome 1 to Chromosome 10) were selected to screen for polymorphisms between the two parents. These primers were synthesized at Sangon (Shanghai, China). Agarose gel (4%) electrophoresis with 0.5 mg/L EB and Ultraviolet gel imager were used to detect the polymorphism of the PCR products. PCR-based polymorphic SSR markers were used for detecting the genotype of F2 and F2:3 populations.
Linkage Analysis and QTL Mapping
Based on the genotypic data of F2 and F2:3, the software JoinMap 4.0 (Ooijen and Van, 2006) was used to construct a linkage map and calculate map distances in centiMorgen (cM) by using the Kosambi mapping function. QTL analysis was conducted with QTL IciMapping 4.0 (Li et al., 2008) based on the inclusive composite interval mapping method (ICIM), with a walk speed of 1 cM. For each of the datasets (2015-T, 2015-H, 2016-T, 2016-H), a putative QTL with a significant threshold was estimated by permutation tests with 1,000 times at p < 0.05, with a logarithm of odds (LOD) score > 2.5.
Fine Mapping of QTL
For fine mapping qRPR1-3 and qRPR3-1, two major QTLs on Chromosomes 1 and 3, respectively, we developed different types of markers Insertions/Deletions (InDels), Cleaved Amplified Polymorphic Sequence (CAPS) based on various sequence variations, which included InDels and Single Nucleotide Polymorphisms (SNPs) between 3705I and LH277 parents (Supplementary Tables 3, 5). Based on the initial QTL analysis, a progeny-based sequential fine-mapping strategy was adopted to dissect the QTL region (Ma et al., 2017). The progeny from BC4F1, BC6F1, and BC8F1, which were created by backcrossing to the low RPR parent 3705I, was screened for fine mapping qRPR1-3 and qRPR3-1. In each recombinant-derived progeny population (BC5F1, BC7F1, and BC9F1 populations), homozygotes harboring the 3705I allele and heterozygotes harboring the LH277 allele were identified by using markers (Supplementary Tables 3, 5) within the region of qRPR1-3 and qRPR3-1, the phenotypic difference of which was detected. Student's T-test (p < 0.05) was adopted to estimate the significance of RPR difference. The BC6F1 and BC8F1 populations were planted in Hainan. Because of the bad weather, the BC6F1 and BC8F1 populations were used exclusively for screening more recombinants.
RNA Extraction and qRT-PCR
Stem rind tissues in V6, V8, V10, V12, and VT stages were collected from the third internodes below the primary ear of NIL-3705I and NIL-LH277. Total RNA was extracted from rind tissues by using a Trizol reagent (Thermo Fisher Scientific, USA). Evo M-MLVPlus 1st Strand cDNA Synthesis Kit (Accurate Biotechnology, Hunan, China) was used to synthesize cDNA from the total RNA. qRT-PCR with gene-specific primers was performed on an Applied Biosystems PCR instrument VIIA7 by using the UltraSYBR Mixture (Cwbio, China) according to the manufacturers' protocols (Supplementary Table 5). The expression levels of candidate genes were normalized to those of the CULLIN2 control (Manoli et al., 2012).
Results
Selection of Maize Inbred Lines With Contrasting Stalk-Lodging Resistance
A small set of maize inbred lines was initially selected according to their performance of lodging resistance in the field. To further evaluate the capability of their stalk-lodging resistance quantitatively, rind penetrometer resistance (RPR) of them was measured at the tasseling stage in four growing seasons (Table 1). Among them, the line LH277 showed consistently high RPR, whereas the RPR of 3705I was consistently and significantly low (p < 0.001), suggestive of their opposite stalk-lodging resistance (Figure 1). Then, we stained the lignin of the third internodes below the primary ears of both lines and observed that the staining color was deeper in LH277 (Figure 2B) than in 3705I (Figure 2A) in the epidermis and around the vascular bundle, indicative of more lignin deposition in cell walls of LH277 (Figures 2A,B). To gain a detailed view of cell walls in stalk tissues of both lines, scanning electron microscopy (SEM) was used to observe the cross sections of their third internodes. The cell walls of epidermis and hypodermis in 3705I (Figure 2C) were much thinner than those in LH277 (Figure 2D), which indicated that there were more developed secondary cell walls in LH277. Similarly, the cell walls in the vascular bundles of LH277 (Figure 2D) were thicker than those of 3705I (Figure 2C). These results together suggested that the difference of cell wall thickness and the degree of lignin deposition between 3705I and LH277 may be mainly responsible for the difference of their RPR. Both of them were thus selected as parental lines for genetic population construction and QTL mapping of RPR.
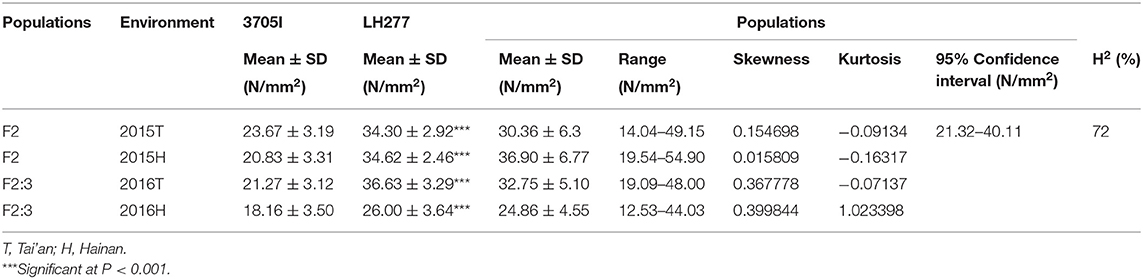
Table 1. Phenotypic performance and broad-sense heritability for RPR in F2 and F2:3 populations.
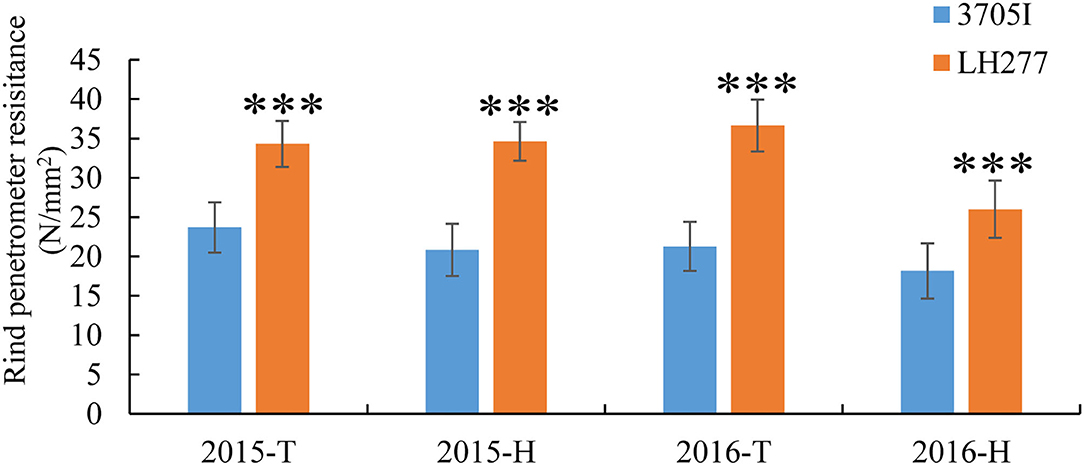
Figure 1. Rind penetrometer resistance of 3705I and LH277 in 2015 and 2016. ***Significant at p < 0.001, T, Tai'an; H, Hainan.
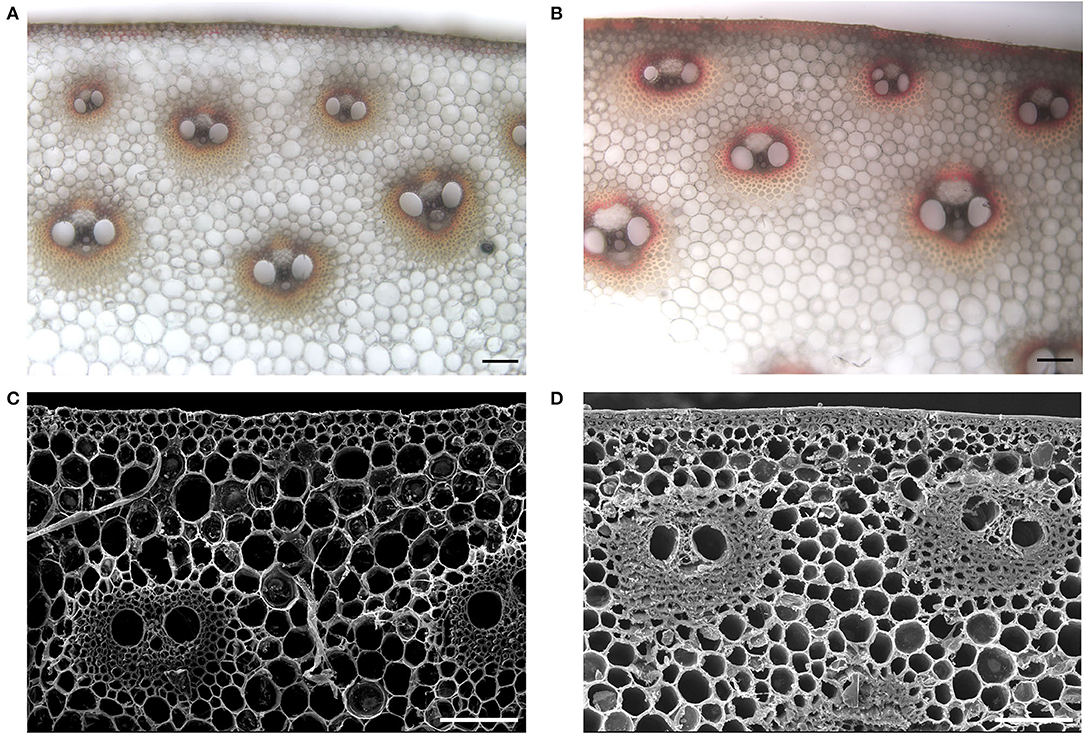
Figure 2. Morphological characteristic of cross-sections of the third internodes below the primary ear in 3705I and LH277. (A,B) Are phloroglucinol staining of lignin of 3705I stems and LH277 stems, respectively. A scale bar of (A,B), 100 μm. (C,D) Are SEM images of cross-sections of 3705I stems and LH277 stems, respectively. A scale bar of (C,D), 100 μm.
Phenotypic Analysis
Four field trials were conducted in four growing seasons. The mean RPR values of F2 families (30.36 ± 6.37 N/mm2) in 2015-T and F2:3 families (32.75 ± 5.10 N/mm2, 24.86 ± 4.55 N/mm2) in 2016-T and 2016-H were lower than the mean RPR value of both parental lines. And the mean RPR value of F2:3 families (36.90 ± 6.77 N/mm2) in 2015-H was higher than the mean RPR value of parental lines (Table 1). Wide phenotypic variation of RPR was detected, and the frequency distribution of RPR in F2 and F2:3 families exhibited a continuous variation, ranging from 12.53 to 54.90 N/mm2, with average values of 30.36, 36.90, 32.75, and 24.86 N/mm2, respectively (Figure 3). The skewness and kurtosis for RPR of F2 and F2:3 families indicated a normal distribution of RPR, suggesting that RPR is a typical quantitative trait controlled by polygenic loci. The variance was mainly derived from the different genotypes among F2 and F2:3 populations. At the same time, part of the variance derived from the interaction between genotypes and environment (Supplementary Table 1). The broad-sense heritability (H2) of RPR was estimated to be 72% (Table 1) across the four field trials, which means that genetics largely account for the lodging resistance of maize.
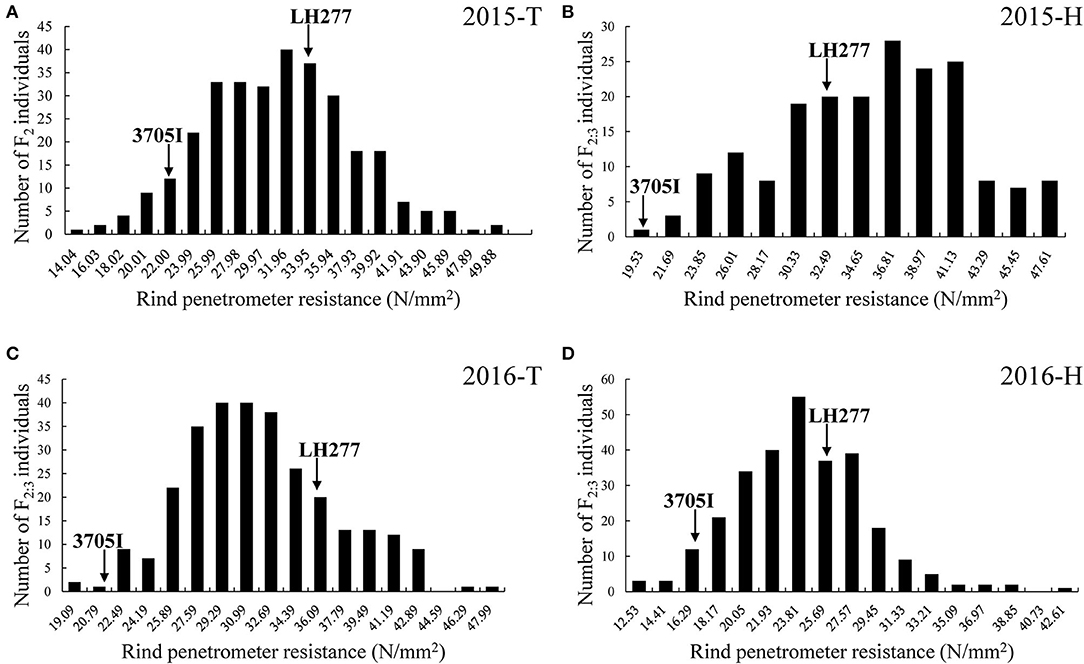
Figure 3. Frequency distribution of rind penetrometer resistance in the F2 and F2:3 populations, respectively. (A) RPR of F2 in 2015-T. (B) RPR of F2 in 2015-H. (C) RPR of F2:3 in 2016-T. (D) RPR of F2:3 in 2016-H. The x-axis indicates the rind penetrometer resistance, and the y-axis indicates the number of individuals in each group. In each trial, the two arrows represent the rind penetrometer resistance of both parental lines. T, Tai'an; H, Hainan.
QTL Analysis
All of 864 high-quality simple sequence repeat (SSR) markers across the maize whole genome were screened, of which 279 SSR markers (32.3% of the total) showed clear polymorphism between 3705I and LH277. After quality control, 267 SSR markers were used to genotype the 214 F2 individuals, and a linkage map was subsequently constructed (Supplementary Table 2). Ten linkage groups formed the linkage map, the total genetic length of which spanned 1,312.00 cM, with an average interval of 5.11 cM between adjacent markers.
In total, 14 QTLs for RPR were detected based on the F2 and F2:3 families across four growing seasons and distributed in eight chromosomes, except Chromosomes 2 and 6 (Table 2; Supplementary Figure 2). The additive and dominance effects were detected at all of the mapped RPR QTLs, with additive effects ranging from 0.05 to 2.67 and dominance effects ranging from 0.01 to 2.28. Each QTL could explain the phenotypic variation of RPR from 4.14% (qRPR4) to 15.89% (qRPR1-3). Of the RPR-increasing alleles at the 14 QTL loci, seven were derived from the high-RPR line LH277, and the other seven were derived from low-RPR line 3705I.

Table 2. QTL for rind penetrometer resistance in F2 and F2:3 populations.
Twelve RPR-associated QTLs were detected in only one field trial, and each of them only accounted for <10% phenotypic variation, indicating that these QTLs with small effect were highly sensitive to environment (Table 2). Two large-effect QTLs, qRPR1-3 and qRPR3-1, were detected across two field trials. qRPR1-3, flanked by the umc1306 and mmc0041 markers on Chromosome 1, accounted for 14.05% (LOD = 7.30) and 15.89% (LOD = 6.88) of the total phenotypic variation of RPR in 2016-T and 2016-H, respectively (Table 2; Supplementary Figure 2). qRPR3-1, flanked by the bnlg1447 and Phi036 on Chromosome 3, accounted for 12.25% (LOD = 5.99) and 10.27% (LOD = 6.29) of the RPR variation in 2015-T and 2016-T. Both of them were thus chosen for fine mapping.
Fine Mapping of qRPR1-3
According to the initial QTL analysis, the confidence region covering the QTL qRPR1-3 was corresponding with a physical distance of 26.8 Mb in the B73 reference genome (B73_RefGen_v4). For fine mapping of QTL qRPR1-3, 8 molecular markers were developed based on the B73 reference sequence, including one Cleaved Amplified Polymorphic Sequence (CAPS), and 7 Insertion/Deletion (InDel) markers (Supplementary Table 3). Two markers (mmc0041 and umc1306) flanking the qRPR1-3 region and three markers (IDP8287, Caps-4, and bnlg1331) within it were used to screen the BC4F1 population, and seven recombinants were identified with crossover breakpoints in the qRPR1-3 region. All the BC5F1 progeny of them (652 individuals) was used for RPR measurement. Progeny from Types I to IV exhibited a significant difference of RPR (p < 0.001) between homozygotes harboring the 3705I allele (16.77–18.20 N/mm2) and heterozygotes harboring the LH277 allele (18.63–19.58 N/mm2; Figure 4A), indicating the presence of qRPR1-3 in the LH277 donor region. On the basis of this result, we could narrow the interval of qRPR1-3 down to a 19 Mb window, which is flanked by markers mmc0041 and Caps-4 (Figure 4A).
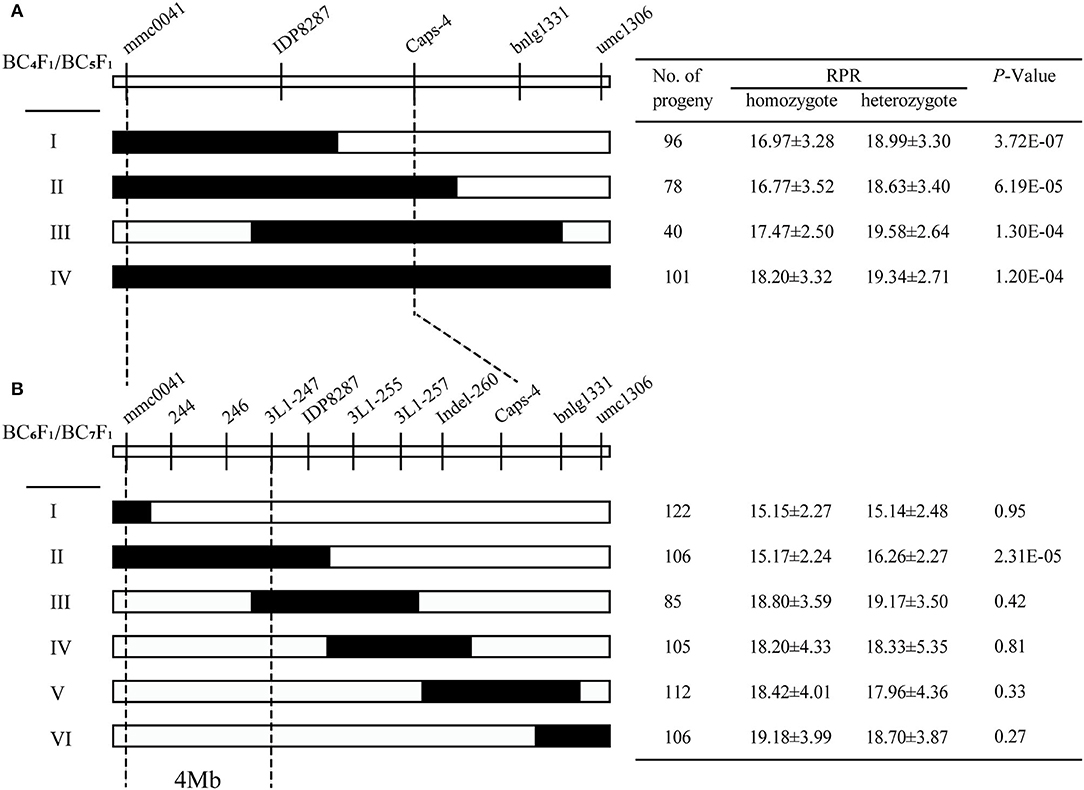
Figure 4. Fine mapping of qRPR1-3. Seven BC4F1 (A) and 19 BC6F1 (B) recombinants of qRPR1-3 was classified into four and six types, respectively. In each recombinant type, the chromosomal composition of qRPR1-3 is depicted as black or white, corresponding to heterozygous 3705I/LH277 and homozygous 3705I/3705I, respectively. The black-dotted lines indicate the narrowed regions of qRPR1-3. A significant difference (p < 0.05) between heterozygote 3705I/LH277 and homozygote 3705I/3705I indicated the presence of qRPR1-3 in the donor region. The location of qRPR1-3 was refined from a 26.8 Mb region to a 4 Mb region flanked by the markers mmc0041 and 3L1-247.
In the next fine mapping of qRPR1-3, 11 markers (Supplementary Table 3) were used to screen the BC6F1 population and identify 19 recombinants in the qRPR1-3 region. These 19 recombinants were classified into six types (I–VI; Figure 4B), and all BC7F1 progeny of them (1,990 individuals) was used for RPR measurement. Progeny from Type II, which carried a recombination event between mmc0041 and 3L1-255, showed significant difference (p < 0.001) of RPR between homozygotes (15.17 ± 2.24 N/mm2) and heterozygotes (16.26 ± 2.27 N/mm2; Figure 4B), indicating the presence of qRPR1-3 in the LH277 donor region. Whereas, there was no significant difference (P > 0.05) of RPR between homozygotes (15.15–19.18 N/mm2) and heterozygotes (15.14–19.17 N/mm2), which were derived from the progeny of Types I, III, IV, V, and VI, indicating the absence of qRPR1-3 in the LH277 donor region. Therefore, QTL qRPR1-3 could be narrowed down to a 4Mb window between markers mmc0041 and 3L1-247 (Figure 4B).
Fine Mapping of qRPR3-1
For further resolving the position of qRPR3-1, 11 molecular markers that showed polymorphisms between two parents were developed in the 4.5 Mb QTL interval (Supplementary Table 5). Eight recombinants were screened from the BC4F1 population and classified into four types (I–IV; Figure 5A) by using markers Snp3 and Phi036 flanking and three markers (Indel-4, Indel-2, and Indel-3; Supplementary Table 5) within the interval of the qRPR3-1 region. BC5F1 progeny (908 individuals) of recombinants was used for RPR measurement. Progeny from Types II and IV exhibited significant difference (p < 0.001) between homozygotes harboring the 3705I allele (20.11 ± 3.63 and 18.47 ± 3.27 N/mm2) and heterozygotes harboring the LH277 allele (21.47 ± 3.45 and 20.22 ± 3.59 N/mm2), indicating the presence of qRPR3-1 in the LH277 donor region. Progeny from Types I and IV showed no significant difference (p > 0.05) of RPR between homozygotes (16.22 ± 3.67 and 17.32 ± 3.51 N/mm2) and heterozygotes (15.65 ± 3.48 and 17.88 ± 3.21 N/mm2), indicating the absence of qRPR1-3 in the LH277 donor region (Figure 5A). Based on this result, qRPR3-1 could be narrowed down to an interval of 1.8 Mb flanked by markers Snp3 and Indel-4.
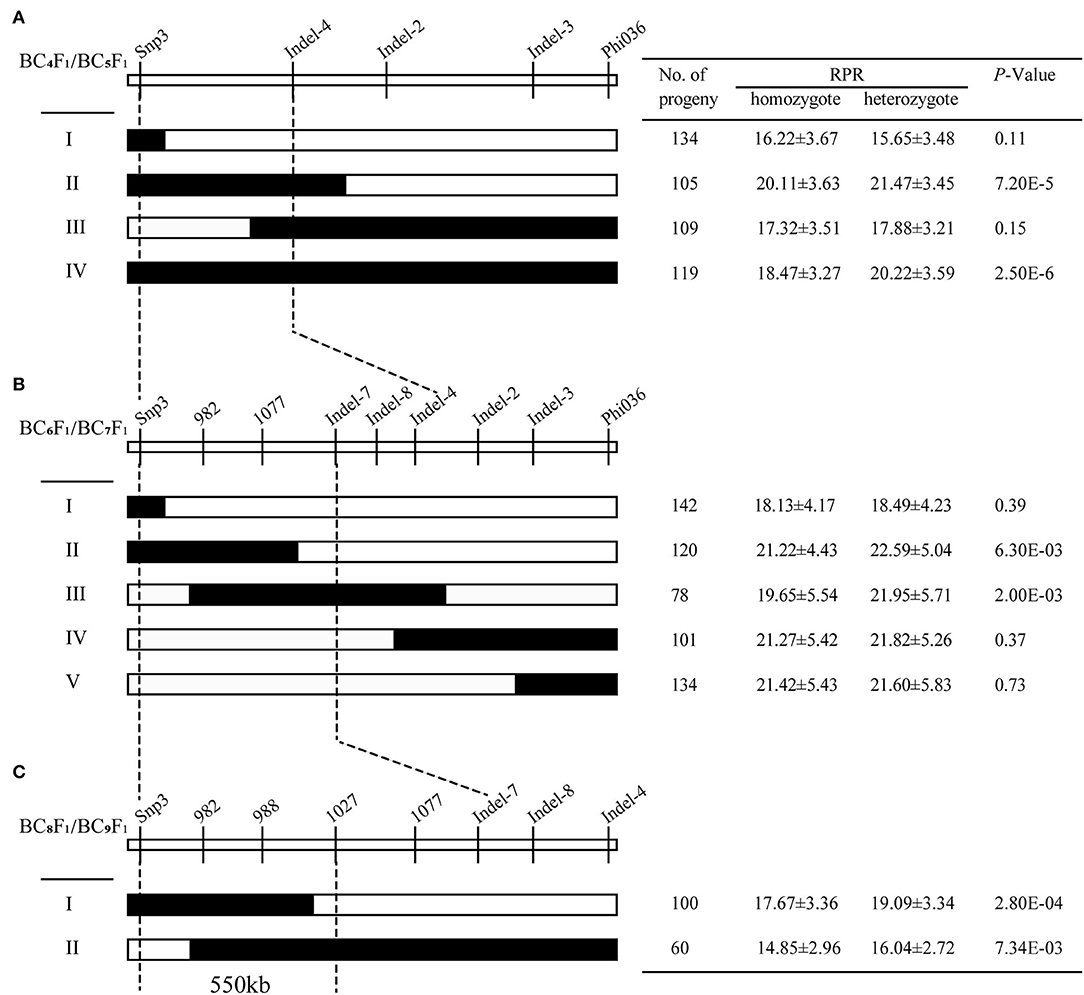
Figure 5. Fine mapping of qRPR3-1. Eight BC4F1 (A), 14BC6F1 (B), and six BC8F1 (C) recombinants of qRPR3-1 were classified into four, five, and two types, respectively. In each recombinant type, the chromosomal composition of qRPR3-1 is depicted as black or white, corresponding to heterozygous 3705I/LH277 and homozygous 3705I/3705I, respectively. The black-dotted lines indicate the narrowed regions of qRPR3-1. A significant difference (p < 0.05) between heterozygote 3705I/LH277 and homozygote 3705I/3705I indicated the presence of qRPR3-1 in the donor region. The location of qRPR3-1 was refined from a 4.5 Mb region to a 550 kb region flanked by the markers Snp3 and 1027.
In the next step of fine mapping, nine markers (Supplementary Table 5) were used to screen the BC6F1 population. Fourteen recombinants were identified in the qRPR3-1 region and classified into five types (I–V; Figure 5B). BC7F1 progeny (1,566 individuals) of recombinants was used for RPR measurement. The RPR values of progeny derived from heterozygotes (21.95–22.59 N/mm2) were significantly higher (p < 0.01) than the RPR values of homozygotes (19.65–21.22 N/mm2), which were derived from progeny of Types II and III, indicating the presence of qRPR3-1 in the LH277 donor region. Whereas, the homozygote (18.13–21.42 N/mm2) and heterozygote (18.49–21.82 N/mm2) of progeny from Types I, IV, and V showed similar RPR values (p > 0.05), indicating the absence of qRPR3-1 in the LH277 donor region (Figure 5B). According to the above results, the target region of QTL qRPR3-1 could be narrowed down to a 1 Mb window between markers Snp3 and Indel-7.
To fine map qRPR3-1 further, six recombinants were identified from the BC8F1 population and were classified into two types (I–II; Figure 5C) by using eight markers within the interval of the qRPR3-1 region. BC9F1 progeny (481 individuals) of the recombinants was used for RPR measurement. Progeny from Types I and II exhibited a significant difference of RPR (p < 0.01) between homozygotes (14.85–17.67 N/mm2) and heterozygotes (16.04–19.09 N/mm2) (Figure 5C), indicating the presence of qRPR3-1 in the LH277 donor region. Therefore, QTL qRPR3-1 could be narrowed down to a 550 kb window between markers Snp3 and 1027 (Figure 5C).
Candidate Genes in the Target QTL Region of qRPR3-1
Based on the gene annotation of B73 reference sequence Version 4, there are 76 genes located in the 4 Mb target region of QTL qRPR1-3 (Supplementary Table 4) and 12 genes located in the 550 kb target region of QTL qRPR3-1 (Table 3). The candidate genes within qRPR3-1 were further investigated because of their relatively small number. Given that the RPR was closely related with stalk development involving cell wall synthesis, the RPR of the third internodes of both parental lines in five vegetative stages was measured (Figure 6). In V6 and V8 stages, 3705I and LH277 showed similar RPR values. In V10, V12, and VT stages, however, the RPR values of LH277 were significantly higher than that of 3705I (p < 0.01, p < 0.001, and p < 0.001). These results suggested the RPR difference between 3705I and LH277 occurred in the late vegetative stages and increased along with the growth of plants, which was most likely associated with secondary cell wall growth, including lignin deposition.
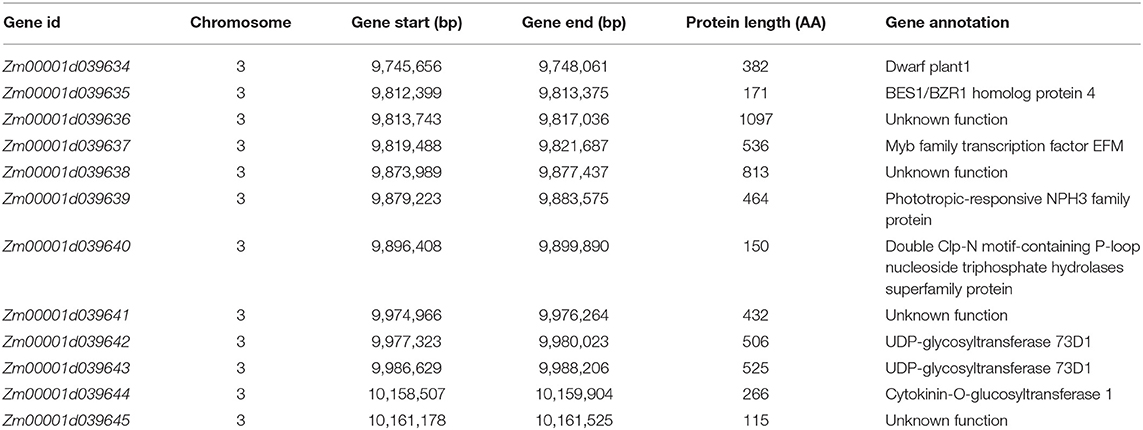
Table 3. Candidate genes in the 550 kb physical region of qRPR3-1.
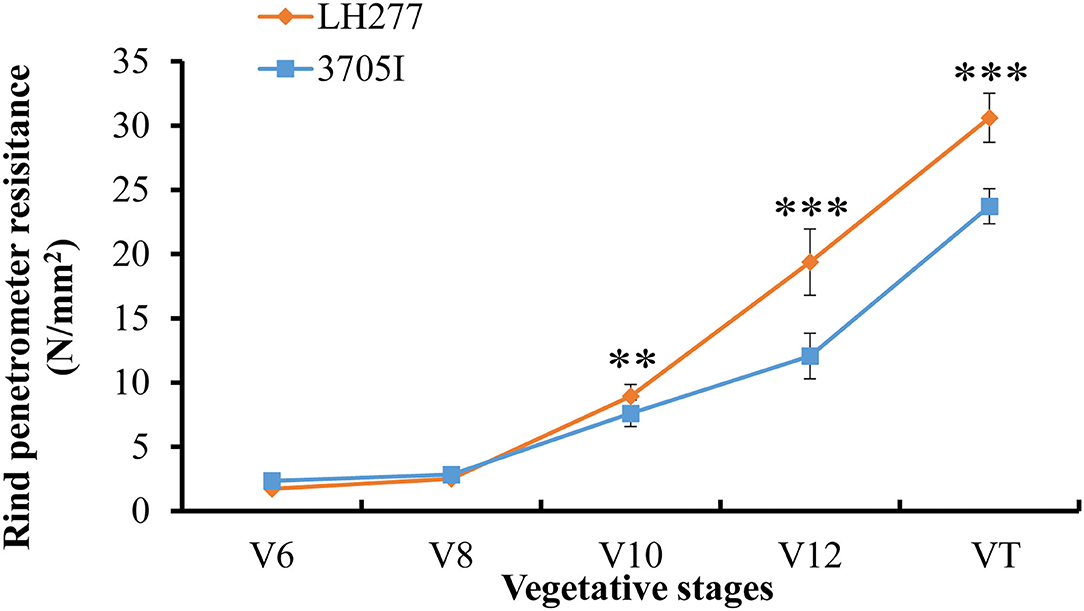
Figure 6. Rind penetrometer resistance of 3705I and LH277 in V6, V8, V10, V12, and VT stages. V6, V8, V10, and V12 represent the last leaf stages, which were defined according to the uppermost leaf whose collar is visible, and VT (tasseling) was the last vegetative stage. **Significant at p < 0.01, ***Significant at p < 0.001.
The expression of 12 candidate genes was then analyzed in five vegetative stages of NIL lines (Figure 7). Zm00001d039638 and Zm00001d039640 were barely expressed in V10, V12, and VT stages, inconsistent with the RPR difference. Compared to the moderately expressed reference gene CULLIN2 (https://qteller.maizegdb.org/bar_chart_B73v4.php?name=Zm00001d024855), the expression level of genes, including Zm00001d039635, Zm00001d039636, Zm00001d039639, Zm00001d039642, Zm00001d039643, and Zm00001d039645, was extremely low, which makes these genes unlikely to be the causal genes for RPR difference. Therefore, one of Zm00001d039634, Zm00001d039637, Zm00001d039641, and Zm00001d039644 might be responsible for the phenotypic difference, and all four of them need to be further investigated.
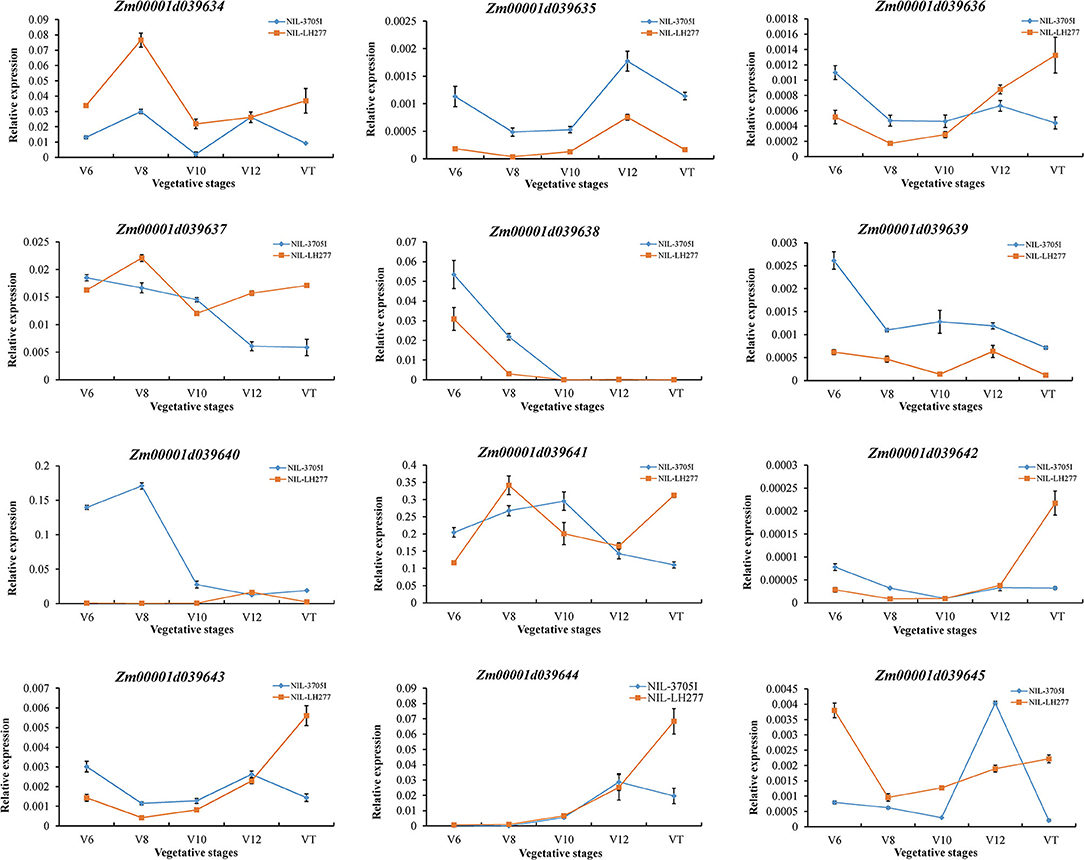
Figure 7. Relative expression levels of candidate genes in V6, V8, V10, V12, and VT stages. The expression levels of candidate genes were normalized to that of CULLIN2.
Discussion
Accurate phenotypic measurement is crucial for QTL analysis (Cobb et al., 2013). The RPR of an internode at higher position below the primary ear of maize stalks is usually lower than those at lower positions (Gou et al., 2010). And RPR has been found to be negatively correlated with maize lodging (Twumasi-Afriyie and Hunter, 1982; Chesang-Chumo, 1993; Liu et al., 2020). In our study, the method of detecting RPR of third internodes below the primary ear was adopted to assess the maize lodging resistance in the tasseling stage (Supplementary Figure 1). The RPR of third internodes below the primary ear was significantly different between the inbred lines 3705I and LH277 (Figure 1). Although RPR as a complicated quantitative trait is controlled by genetics and environment heredity, genetic factors account for the phenotypic variation largely, and the broad-sense heritability of F2 and F2:3 populations of RPR was 72% (Table 1). The RPR performance of F2 and F2:3 populations (Figure 3) and the high broad-sense heritability of RPR verified that our adopted method was feasible for RPR QTL mapping. Compared to previous studies (Flint-Garcia et al., 2003a; Hu et al., 2012; Li et al., 2014), the reduced broad-sense heritability may be attributed to the difference of populations and growing environments.
By analyzing genotypes and phenotypes of F2 and F2:3 genetic populations across four field trials, 14 RPR QTLs were detected (Table 2; Supplementary Figure 2). Among them, the QTL qRPR3-1 was also detected using NAM and IBM families, with which qRPR1-1 was also detected at the same time (Peiffer et al., 2013). qRPR10 was also detected by employing another population and accounted for 2.84% of the RPR variation (Hu et al., 2012). In addition to these three QTLs, other QTLs were detected for the first time in this study, including the largest-effect QTL qRPR1-3. The low repeatability of QTLs across different populations may be attributed to the complex genetic basis of maize RPR and their interaction with varied environments (Hu et al., 2012; Peiffer et al., 2013).
RPR as an indicator of maize stalk strength is highly correlated with the content of cell wall components, among which increased lignin, cellulose, and hemicellulose content can enhance maize stalk strength (Martin et al., 2004). In the internodes of the RIL population crossed with the inbred lines Ce03005 and B73, RPR was positively correlated with the content of some cell wall components, such as crude fiber, acid detergent lignin, acid detergent fiber, and cellulose in maize internodes (Hu et al., 2012). The suppression of stiff1, a gene located on Chromosome 6 underlying the major QTL for BS and RPR, led to the increase of cellulose and lignin content in maize stalk and, consequently, higher stalk strength (Zhang et al., 2020). The lignin content of third internodes in LH277 was higher than that in 3705I validated by lignin staining, while the cell walls of epidermis and vascular bundles in 3705I were much thinner than those in LH277 (Figure 2). Taken together, these results hinted that the RPR-associated QTLs were much likely to be related to cell wall components of maize stalk, and it was very likely that the causal genes are involved in the cell wall development or lignocellulose deposition.
By using a sequential fine-mapping strategy based on the progeny test, two major QTLs, qRPR1-3 and qRPR3-1, were, respectively, narrowed down to 4 Mb and 550 kb physical intervals (Figures 4, 5), within which there are 76 and 12 genes (Supplementary Table 4; Table 3). There are too many candidate genes located within the target region of QTL qRPR1-3 for screening, and we expect to do the corresponding work of candidate gene screening after further narrowing the interval of QTL qRPR1-3. The candidate genes within qRPR3-1 were further investigated by using the qRT-PCR assay because of their relatively small number (Figure 7). By analyzing the expression pattern and the level of 12 candidate genes, Zm00001d039634, Zm00001d039637, Zm00001d039641, and Zm00001d039644 are considered to be the most likely causal genes for RPR difference. The function of Zm00001d039641 is unknown. Zm00001d039634 encodes a gibberellin 3-oxidase to catalyze the final step of bioactive gibberellin synthesis, whereas gibberellin has been shown to regulate the development of stalks (Okuno et al., 2014; Peng et al., 2014). Zm00001d039637 encodes a MYB transcription factor, and it has been reported that a subset of MYB transcription factors, such as AtMYB46 and AtMYB83, orchestrates the biosynthesis of the plant secondary wall (McCarthy et al., 2009; Zhao and Dixon, 2011; Guo et al., 2017). Zm00001d039644 encodes cytokinin-o-glucosyltransferase, rendering cytokinin inactivation temporarily, and cytokinin has been proved to be involved in regulation of flowering time (D'Aloia et al., 2011) and development of stalks (Nguyen et al., 2016). Thus, any of these three genes could not be excluded without further evidence. Moreover, all 12 candidate genes were retrieved from the B73 reference sequence Version 4. There may be extra and different candidate genes within the qRPR3-1 interval of 3705I or the LH277 genome, given that more and more pangenes are identified (Hufford et al., 2021). Further fine mapping, genome segment sequencing, together with mutant analysis, are thus required for the identification and confirmation of the target gene. The functional characterization of the target gene would then unveil the role of the causal gene in regulating maize RPR.
In the maize breeding, stalk strength plays an important role in maintaining grain yield. In many maize synthetic populations, stalk strength has been successfully enhanced based on phenotypic selection for RPR (Masole, 1993; Zhang et al., 2020; Kumar et al., 2021). Marker-assisted selection (MAS) as an alternative way could improve the target agronomic traits in maize varieties, making breeding more efficient and rapid (Zhao et al., 2012; Liu et al., 2015; Kage et al., 2016). In this study, the major QTL qRPR3-1 was narrowed down to the 550 kb window, containing 12 genes, and the use of four markers (Snp3, 982, 988, and 1027) allowed us to precisely introgress the qRPR3-1 locus into a target maize inbred line for enhancing stalk strength. The small qRPR3-1 location interval reduces the probability of a linkage drag of deleterious alleles. However, the genetic effects of some QTLs are more or less influenced by a genetic background, in particular mapping population (Liao et al., 2001; Li et al., 2017). Thus, the application of qRPR3-1 on RPR selection should be further tested in more varieties.
Data Availability Statement
The original contributions presented in the study are included in the article/Supplementary Material, further inquiries can be directed to the corresponding authors.
Author Contributions
CC designed and supervised this project. XiH and SC conducted the experiments. XiH, SC, SW, TY, YW, PX, XX, QZ, and XuH performed the phenotypic data collection and field experiments. XiH, SC, and XuH carried out the genotypic data generation. XiH, SC, and TY contributed to the data analysis. XiH wrote the manuscript. GZ revised the manuscript. All authors contributed to the article and approved the submitted version.
Funding
This research was supported by the Key Project of Shandong Natural Science Foundation, China to CC (ZR2020KC041), the Young Scientists Fund of the National Natural Science Foundation of China to GZ (31901556), and the National Key Research and Development Program of China to CC (2017YFD0101200 and 2016YFD0101003).
Conflict of Interest
The authors declare that the research was conducted in the absence of any commercial or financial relationships that could be construed as a potential conflict of interest.
Publisher's Note
All claims expressed in this article are solely those of the authors and do not necessarily represent those of their affiliated organizations, or those of the publisher, the editors and the reviewers. Any product that may be evaluated in this article, or claim that may be made by its manufacturer, is not guaranteed or endorsed by the publisher.
Supplementary Material
The Supplementary Material for this article can be found online at: https://www.frontiersin.org/articles/10.3389/fpls.2022.944539/full#supplementary-material
References
Abedon, B. G., Darrah, L. L., and Tracy, W. F. (1999). Developmental changes associated with divergent selection for rind penetrometer resistance in the MoSCSSS maize synthetic. Crop Sci. 39, cropsci1999.0011183X003900010017x. doi: 10.2135/cropsci1999.0011183X003900010017x
Albrecht, B., and Dudley, J. W. (1987). Divergent selection for stalk quality and grain yield in an adapted? exotic maize population cross. Crop Sci. 27, cropsci1987.0011183X002700030012x. doi: 10.2135/cropsci1987.0011183X002700030012x
Chesang-Chumo, J. J (1993). Direct and correlated responses to divergent selection for rind penetrometer resistance in MoSCSS maize synthetic (Ph.D). University of Missouri, Columbia.
Cobb, J. N., Declerck, G., Greenberg, A., Clark, R., and McCouch, S. (2013). Next-generation phenotyping: requirements and strategies for enhancing our understanding of genotype-phenotype relationships and its relevance to crop improvement. Theor. Appl. Genet. 126, 867–887. doi: 10.1007/s00122-013-2066-0
D'Aloia, M., Bonhomme, D., Bouché, F., Tamseddak, K., Ormenese, S., Torti, S., et al. (2011). Cytokinin promotes flowering of Arabidopsis via transcriptional activation of the FT paralogue TSF. Plant J. 65, 972–979. doi: 10.1111/j.1365-313X.2011.04482.x
Dudley, J. W (1994). Selection for rind puncture resistance in two maize populations. Crop Sci. 34, cropsci1994.0011183X003400060007x. doi: 10.2135/cropsci1994.0011183X003400060007x
Feng, G., Liu, Z., Li, Y., Xing, J., and Huang, C. (2009). Genetics of lodging in tolerance to maize stem puncture. Acta Agronomica Sinica 35, 2133–2138. doi: 10.3724/SP.J.1006.2009.02133
Flint-Garcia, S. A., Darrah, L. L., McMullen, M. D., and Hibbard, B. E. (2003b). Phenotypic versus marker-assisted selection for stalk strength and second-generation European corn borer resistance in maize. Theor. Appl. Genet. 107, 1331–1336. doi: 10.1007/s00122-003-1387-9
Flint-Garcia, S. A., Jampatong, C., Darrah, L. L., and McMullen, M. D. (2003a). Quantitative trait locus analysis of stalk strength in four maize populations. Crop Sci. 43, 13–22. doi: 10.2135/cropsci2003.0013
Gou, L., Huang, J., Sun, R., Ding, Z., Dong, Z., and Zhao, M. (2010). Variation characteristic of stalk penetration strength of maize with different density-tolerance varieties. Trans. Chin. Soc. Agric. Eng. 26, 156–162. doi: 10.3969/j.issn.1002-6819.2010.11.028
Guo, H., Wang, Y., Wang, L., Hu, P., Wang, Y., Jia, Y., et al. (2017). Expression of the MYB transcription factor gene BplMYB46 affects abiotic stress tolerance and secondary cell wall deposition in Betula platyphylla. Plant Biotechnol. J. 15, 107–121. doi: 10.1111/pbi.12595
Hu, H., Meng, Y., Wang, H., Liu, H., and Chen, S. (2012). Identifying quantitative trait loci and determining closely related stalk traits for rind penetrometer resistance in a high-oil maize population. Theor. Appl. Genet. 124, 1439–1447. doi: 10.1007/s00122-012-1799-5
Hu, J., Bao, Y., and Luo, F. (2000). Research on technology for measuring crop rind penetrometer resistance. J. Henan Agric. Univ. 34, 77–80. doi: 10.16445/j.cnki.1000-2340.2000.01.022
Hufford, M. B., Seetharam, A. S., Woodhouse, M. R., Chougule, K. M., Ou, S., Liu, J., et al. (2021). De novo assembly, annotation, and comparative analysis of 26 diverse maize genomes. Science 373, 655–662. doi: 10.1126/science.abg5289
Kage, U., Kumar, A., Dhokane, D., Karre, S., and Kushalappa, A. C. (2016). Functional molecular markers for crop improvement. Crit. Rev. Biotechnol. 36, 917–930. doi: 10.3109/07388551.2015.1062743
Kumar, R., Gyawali, A., Morrison, G. D., Saski, C. A., Robertson, D. J., Cook, D. D., et al. (2021). Genetic architecture of maize rind strength revealed by the analysis of divergently selected populations. Plant Cell Physiol. 62, 1199–1214. doi: 10.1093/pcp/pcab059
Li, H., Ribaut, J. M., Li, Z., and Wang, J. (2008). Inclusive composite interval mapping (ICIM) for digenic epistasis of quantitative traits in biparental populations. Theor. Appl. Genet. 116, 243–260. doi: 10.1007/s00122-007-0663-5
Li, K., Yan, J., Li, J., and Yang, X. (2014). Genetic architecture of rind penetrometer resistance in two maize recombinant inbred line populations. BMC Plant Biol. 14, 152. doi: 10.1186/1471-2229-14-152
Li, Y., Tong, L., Deng, L., Liu, Q., Xing, Y., Wang, C., et al. (2017). Evaluation of ZmCCT haplotypes for genetic improvement of maize hybrids. Theor. Appl. Genet. 130, 2587–2600. doi: 10.1007/s00122-017-2978-1
Liao, C. Y., Wu, P., Hu, B., and Yi, K. K. (2001). Effects of genetic background and environment on QTLs and epistasis for rice (Oryza sativa L.) panicle number. Theor. Appl. Genet. 103, 104–111. doi: 10.1007/s001220000528
Liu, K., Xu, H., Liu, G., Guan, P., Zhou, X., Peng, H., et al. (2018). QTL mapping of flag leaf-related traits in wheat (Triticum aestivum L.). TAG. Theoretical and applied genetics. Theor. Angewandte Genetik 131, 839–849. doi: 10.1007/s00122-017-3040-z
Liu, L., Du, Y., Shen, X., Li, M., Sun, W., Huang, J., et al. (2015). KRN4 controls quantitative variation in maize kernel row number. PLoS Genet 11, e1005670. doi: 10.1371/journal.pgen.1005670
Liu, X., Hao, L., Kou, S., Su, E., Zhou, Y., Wang, R., et al. (2018). High-density quantitative trait locus mapping revealed genetic architecture of leaf angle and tassel size in maize. Mol. Breed. 39, 7. doi: 10.1007/s11032-018-0914-y
Liu, X., Hu, X., Li, K., Liu, Z., Wu, Y., Wang, H., et al. (2020). Genetic mapping and genomic selection for maize stalk strength. BMC Plant Biol. 20, 196. doi: 10.1186/s12870-020-2270-4
Ma, C., Ma, X., Yao, L., Liu, Y., Du, F., Yang, X., et al. (2017). qRfg3, a novel quantitative resistance locus against Gibberella stalk rot in maize. Theor. Appl. Genet. 130, 1723–1734. doi: 10.1007/s00122-017-2921-5
Manoli, A., Sturaro, A., Trevisan, S., Quaggiotti, S., and Nonis, A. (2012). Evaluation of candidate reference genes for qPCR in maize. J. Plant Physiol. 169, 807–815. doi: 10.1016/j.jplph.2012.01.019
Martin, S. A., Darrah, L. L., and Hibbard, B. E. (2004). Divergent selection for rind penetrometer resistance and its effects on european corn borer damage and stalk traits in corn. Crop Sci. 44, 711–717. doi: 10.2135/cropsci2004.7110
Masole, H (1993). Evaluation of High and Low Divergent Rind Penetrometer Resistance Selection at Three Plant Densities in Maize. Columbia: University of Missouri.
McCarthy, R. L., Zhong, R., and Ye, Z. H. (2009). MYB83 is a direct target of SND1 and acts redundantly with MYB46 in the regulation of secondary cell wall biosynthesis in Arabidopsis. Plant Cell Physiol. 50, 1950–1964. doi: 10.1093/pcp/pcp139
Murray, M. G., and Thompson, W. F. (1980). Rapid isolation of high molecular weight plant DNA. Nucleic Acids Res. 8, 4321–4325. doi: 10.1093/nar/8.19.4321
Nguyen, T. N., Son, S., Jordan, M. C., Levin, D. B., and Ayele, B. T. (2016). Lignin biosynthesis in wheat (Triticum aestivum L.): its response to waterlogging and association with hormonal levels. BMC Plant Biol. 16, 28. doi: 10.1186/s12870-016-0717-4
Okuno, A., Hirano, K., Asano, K., Takase, W., Masuda, R., Morinaka, Y., et al. (2014). New approach to increasing rice lodging resistance and biomass yield through the use of high gibberellin producing varieties. PLoS ONE 9, e86870. doi: 10.1371/journal.pone.0086870
Ooijen, J., and Van, J. W. (2006). JoinMap 4, Software for the Calculation of Genetic Linkage Maps in Experimental Populations. Wageningen: Wageningen University.
Peiffer, J. A., Flint-Garcia, S. A., De Leon, N., McMullen, M. D., Kaeppler, S. M., and Buckler, E. S. (2013). The genetic architecture of maize stalk strength. PLoS ONE 8, e67066. doi: 10.1371/journal.pone.0067066
Peng, D., Chen, X., Yin, Y., Lu, K., Yang, W., Tang, Y., et al. (2014). Lodging resistance of winter wheat (Triticum aestivum L.): lignin accumulation and its related enzymes activities due to the application of paclobutrazol or gibberellin acid. Field Crops Res. 157, 1–7. doi: 10.1016/j.fcr.2013.11.015
Robertson, D. J., Julias, M., Lee, S. Y., and Cook, D. D. (2017). Maize stalk lodging: morphological determinants of stalk strength. Crop Sci. 57, 926–934. doi: 10.2135/cropsci2016.07.0569
Sekhon, R. S., Joyner, C. N., Ackerman, A. J., McMahan, C. S., Cook, D. D., and Robertson, D. J. (2020). Stalk bending strength is strongly associated with maize stalk lodging incidence across multiple environments. Field Crops Res. 249, 107737. doi: 10.1016/j.fcr.2020.107737
Sindhu, A., Langewisch, T., Olek, A., Multani, D. S., McCann, M. C., Vermerris, W., et al. (2007). Maize Brittle stalk2 encodes a COBRA-like protein expressed in early organ development but required for tissue flexibility at maturity. Plant Physiol. 145, 1444–1459. doi: 10.1104/pp.107.102582
Tang, H. M., Liu, S., Hill-Skinner, S., Wu, W., Reed, D., Yeh, C.-T., et al. (2014). The maize brown midrib2 (bm2) gene encodes a methylenetetrahydrofolate reductase that contributes to lignin accumulation. Plant J. 77, 380–392. doi: 10.1111/tpj.12394
Twumasi-Afriyie, S., and Hunter, R. B. (1982). Evaluation of quantitative methods for determining stalk quality in short-season corn genotypes. Can. J. Plant Sci. 62, 55–60. doi: 10.4141/cjps82-008
Zhang, Z., Zhang, X., Lin, Z., Wang, J., Liu, H., Zhou, L., et al. (2020). A Large Transposon Insertion in the stiff1 Promoter Increases Stalk Strength in Maize. Plant Cell 32, 152–165. doi: 10.1105/tpc.19.00486
Zhao, Q., and Dixon, R. A. (2011). Transcriptional networks for lignin biosynthesis: more complex than we thought? Trends Plant Sci. 16, 227–233. doi: 10.1016/j.tplants.2010.12.005
Zhao, X., Tan, G., Xing, Y., Wei, L., Chao, Q., Zuo, W., et al. (2012). Marker-assisted introgression of qHSR1 to improve maize resistance to head smut. Mol. Breed. 30, 1077–1088. doi: 10.1007/s11032-011-9694-3
Zuber, M. S., Colbert, T. R., and Darrah, L. L. (1980). Effect of recurrent selection for crushing strength on several stalk components in maize. Crop Sci. 20, cropsci1980.0011183X002000060009x. doi: 10.2135/cropsci1980.0011183X002000060009x
Keywords: maize, lodging resistance, QTL, RPR, fine mapping
Citation: Hou X, Cheng S, Wang S, Yu T, Wang Y, Xu P, Xu X, Zhou Q, Hou X, Zhang G and Chen C (2022) Characterization and Fine Mapping of qRPR1-3 and qRPR3-1, Two Major QTLs for Rind Penetrometer Resistance in Maize. Front. Plant Sci. 13:944539. doi: 10.3389/fpls.2022.944539
Received: 15 May 2022; Accepted: 21 June 2022;
Published: 19 July 2022.
Edited by:
Mallikarjuna Swamy, International Rice Research Institute (IRRI), PhilippinesReviewed by:
Yingpeng Han, Northeast Agricultural University, ChinaWeiya Xue, The Pennsylvania State University (PSU), United States
Copyright © 2022 Hou, Cheng, Wang, Yu, Wang, Xu, Xu, Zhou, Hou, Zhang and Chen. This is an open-access article distributed under the terms of the Creative Commons Attribution License (CC BY). The use, distribution or reproduction in other forums is permitted, provided the original author(s) and the copyright owner(s) are credited and that the original publication in this journal is cited, in accordance with accepted academic practice. No use, distribution or reproduction is permitted which does not comply with these terms.
*Correspondence: Guobin Zhang, Z2J6aGFuZ0BzZGF1LmVkdS5jbg==; Cuixia Chen, Y3hjaGVuQHNkYXUuZWR1LmNu
†These authors have contributed equally to this work and share first authorship