
94% of researchers rate our articles as excellent or good
Learn more about the work of our research integrity team to safeguard the quality of each article we publish.
Find out more
ORIGINAL RESEARCH article
Front. Plant Sci., 30 August 2022
Sec. Plant Breeding
Volume 13 - 2022 | https://doi.org/10.3389/fpls.2022.943959
This article is part of the Research TopicBreeding Innovations in Underutilized Temperate Fruit Trees, Volume IIView all 5 articles
 Prakash Goudappa Patil1*
 Shivani Jamma1
 Manjunatha N1
 Abhishek Bohra2
 Somnath Pokhare1
 Karuppannan Dhinesh Babu1
 Ashutosh A. Murkute3
 Rajiv A. Marathe1*
Despite the availability of whole genome assemblies, the identification and utilization of gene-based marker systems has been limited in pomegranate. In the present study, we performed a genome-wide survey of intron length (IL) markers in the 36,524 annotated genes of the Tunisia genome. We identified and designed a total of 8,812 potential intron polymorphism (PIP) markers specific to 3,445 (13.40%) gene models that span 8 Tunisia chromosomes. The ePCR validation of all these PIP markers on the Tunisia genome revealed single-locus amplification for 1,233 (14%) markers corresponding to 958 (27.80%) genes. The markers yielding single amplicons were then mapped onto Tunisia chromosomes to develop a saturated linkage map. The functional categorization of 958 genes revealed them to be a part of the nucleus and the cytoplasm having protein binding and catalytic activity, and these genes are mainly involved in the metabolic process, including photosynthesis. Further, through ePCR, 1,233 PIP markers were assayed on multiple genomes, which resulted in the identification of 886 polymorphic markers with an average PIC value of 0.62. In silico comparative mapping based on physically mapped PIP markers indicates a higher synteny of Tunisia with the Dabenzi and Taishanhong genomes (>98%) in comparison with the AG2017 genome (95%). We then performed experimental validation of a subset of 100 PIP primers on eight pomegranate genotypes and identified 76 polymorphic markers, with 15 having PIC values ≥0.50. We demonstrated the potential utility of the developed markers by analyzing the genetic diversity of 31 pomegranate genotypes using 24 PIP markers. This study reports for the first time large-scale development of gene-based and chromosome-specific PIP markers, which would serve as a rich marker resource for genetic variation studies, functional gene discovery, and genomics-assisted breeding of pomegranate.
Pomegranate (Punica granatum L.) is one of the oldest edible fruit crops in the world and is thought to have originated in Iran. It is mainly grown in drier parts of Southeast Asia, Iran, China, Japan, the West Indies, the United States (California), Tropical America, and India (Holland and Bar-Ya'akov, 2014). With respect to taxonomic classifications, pomegranate was placed under the family Lythraceae that includes the genus Punica with three species: Punica protopunica, Punica nana and Punica granatum L. (2n = 16), of which P. granatum is cultivated for fruit production (Moriguchi et al., 1987; Graham and Graham, 2014; Berger et al., 2016). Due to its multifaceted health benefits to humankind, pomegranate cultivation has gained wider popularity across the Mediterranean and Middle Eastern countries (Melgarejo et al., 2009; Teixeira da Silva et al., 2013). India, on the other hand, leads the world in pomegranate cultivation, with a total area of 2.83 lakh hectares and a production of 31.83 lakh million tonnes (http://agricoop.gov.in2019-20). The progress of pomegranate research and breeding has remained slow because of the paucity of genomic information in this crop (Saminathan et al., 2016). Recently, the international efforts on genome sequencing of pomegranate have leveraged the genomic repertoire of pomegranate. The availability of genome sequence paves the way for large-scale development of functional DNA markers, i.e., EST-SSRs, EST-SNPs (Ono et al., 2011; Ophir et al., 2014), and miRNA-SSRs (Patil et al., 2020b) in pomegranate.
The availability of genic SSR and SNP markers mined from whole genome assemblies has facilitated high-throughput genetic analysis in various crops. The limitations that hamper the widespread use of these gene-based DNA markers include lower polymorphic potential, as well as the need for specialized and high-cost platforms for marker genotyping. So far, SSR markers have shown to be highly effective in pomegranate genetic analyses, including genetic diversity, population structure, and marker trait association studies (Curro et al., 2010; Pirseyedi et al., 2010; Singh et al., 2015). SSR markers in these studies showed a relatively low degree of DNA polymorphism; as a result, highly polymorphic chromosome-specific markers have recently been developed in pomegranate (Patil et al., 2021).
There are very few reports available on the mapping of gene(s)/QTL for fruit quality traits in pomegranate using SSR and SNP markers. Basaki et al. (2011) identified 14 SSRs significantly associated with 14 traits, explaining 2 to 29% phenotypic variance (PVs) for flower and fruit quality traits in pomegranate. Singh et al. (2015) also reported 4 SSRs significantly associated with fruit weight, titratable acidity, and bacterial blight severity in pomegranate. Harel-Beja et al. (2015), through QTL analysis, identified 25 QTLs for fruit quality traits using SNP markers. Recently, using SNP markers, Trainin et al. (2021) fine mapped the candidate gene, i.e., anthocyanidin reductase (ANR), with point mutation being responsible for the black peel color in pomegranate.
Therefore, the development of new gene-based DNA marker systems in pomegranate could greatly support future genomics research and genetic improvement (Patil et al., 2020a,c). Enhanced breeding efficiency through the deployment of DNA markers would accelerate the progress of the cultivar development in pomegranate. Given this, efficient gene-based marker systems with abundant distribution in the genome and the ability to demonstrate polymorphism on simple genotyping platforms are urgently required (Badoni et al., 2016).
Introns, abundant in most eukaryotic genomes, are found in several gene sequence components. Low purifying selection pressure during evolution has caused these introns to remain less conserved and variable than coding regions. These regions can serve as highly polymorphic genetic markers (Badoni et al., 2016). Despite being based on genic regions, these markers have been reported to show greater plant intra-species variations than other types of markers (Muthamilarasan et al., 2014).
The popularity of intron length polymorphism (ILP) is growing because it not only offers similar benefits to SSR but also shows certain unique qualities, including direct representation of variation within specific genes and subspecies (Wang et al., 2006). Similar to SSRs, when primers were designed in flanking exons to amplify introns by PCR, cross-species amplification became possible (Yang et al., 2007).
Huang et al. (2010) developed ILP markers following a comparative genomics approach to determine the positions of introns in the genome. Yang et al. (2007) developed a database of potential intron polymorphism (PIP) markers based on intron position predictions across species. PIP markers have been developed in various plant species (Wang et al., 2010; Chen et al., 2011; Liu et al., 2012), but not in pomegranate yet. The PIP markers could be used in combination with SSR markers to determine genetic diversity given the tremendous advantages they offer in terms of subspecies specificity, neutrality (no phenotypic effect), and the ability to perform assay variation within genes (Huang et al., 2013).
The growing information on structurally and functionally annotated genes made available from whole genome sequencing of many crops is a great resource for the development of ILP markers on a genome-wide scale. Still, there are limited reports on the development of ILP markers in fruit trees in comparison to other DNA marker systems. Earlier, Xia et al. (2017) developed genome-wide markers (SSR, ILP, and PIP) from 16 sequenced tree species. In pomegranate, no research on ILP markers has been reported so far despite the availability of whole genome sequences of four genotypes. Realizing the importance of ILPs in pomegranate research, we carried out the current research with the following objectives: (i) large-scale development of ILP markers based on annotated genes in the Tunisia genome, (ii) to develop a physical map and comparative mapping using four sequenced pomegranate genomes, and (iii) to demonstrate ILP marker application in genetic studies.
To develop intron-specific PIP markers in pomegranate, we retrieved 36,524 annotated gene models (Accession No: XM_031515503.1 to XM_31552026.1, https://www.ncbi.nlm.nih.gov/nuccore?linkname=bioproject_nuccore_transcript&from_uid=580467) for the Tunisia genome (Luo et al., 2020) from the NCBI (https://www.ncbi.nlm.nih.gov/). Complexity reduction was performed to identify 25,710 unique sequences through the CD-HIT-EST tool with default parameters (Li and Godzik, 2006). Using these sequences as a query, we searched against Arabidopsis CDS sequences with introns as a reference to anticipate intron positions in its mRNA sequences using the PIP database (http://ibi.zju.edu.cn/pgl/pip/, Yang et al., 2007) and designed a pair of primers on both sides of each intron position (Figure 1). PIP identifies exon–intron boundaries and predicts suitable primers flanking intronic regions. The identified intron flanking primers were designated as Pg_PIP (Punica granatum potential intron polymorphism).
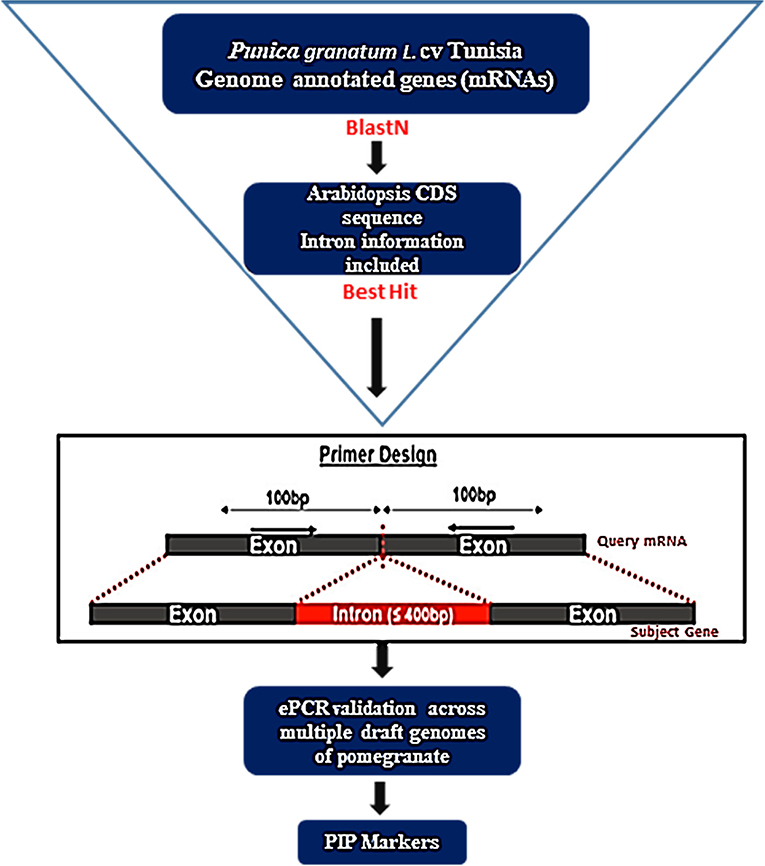
Figure 1. A flowchart depicting the development of PIP marker in pomegranate using the PIP database (Image source: http://ibi.zju.edu.cn/pgl/pip/methodology.html).
The high-quality “Tunisia” pomegranate genome assembly with eight pseudo-chromosome molecules (Luo et al., 2020) and three other draft genome sequences cv. Dabenzi (Qin et al., 2017), Taishanhong (Yuan et al., 2018), and AG2017 (Akparov et al., 2017), were retrieved from the NCBI database. In silico simulated PCR was performed by an ePCR algorithm (Schuler, 1997) for all designed PIP markers against eight Tunisia chromosomes using default parameters of GMATA software (Genome-wide Microsatellite Analyzing Tool, Wang and Wang, 2016). As a result, the output file (.emap) was generated with detailed information on the amplification patterns of the markers with approximate amplicon sizes and target positions on Tunisia chromosomes. Then, the PIP markers amplifying a single locus on Tunisia were mapped across the other three pomegranate genomes in order to obtain approximate amplicon sizes to calculate various marker parameters using GenAlEx v. 6.5 (Peakall and Smouse, 2012) software.
The ePCR provided a preliminary idea about the amplification of all PIP loci with the start and end positions within genes on each Tunisia chromosome. Using the ShinyCircos software (Yu et al., 2017), a circular graph is drawn to illustrate the chromosome-wise localization of each gene and its PIP markers. Apart from that, the saturated PIP marker-based physical map of each chromosome was constructed using MapChart v 2.2 software (Voorrips, 2002), based on the physical positions of all the PIP loci with single amplicons in Tunisia. The functional annotations details of each gene harboring PIP markers were retrieved from the Tunisia genome annotation file (NCBI).
To evaluate the amplification specificity and polymorphism nature of newly designed PIP markers. The single-locus PIP primers identified on the ‘Tunisia' chromosomes were validated against the three draft genome sequences of pomegranate cv. Dabenzi, Taishanhong and AG2017. Using the GMATA software, we identified the approximate product sizes obtained for PIP markers across the four pomegranate genomes. We then used GenAlEx v. 6.5 software to compute various marker parameters: number of alleles (Na), effective alleles (Ne), major allelic frequency (MF), observed (Ho) and expected (He) heterozygosity, Shannon's information index (I), and the polymorphism information content (PIC). The Arabidopsis homolog genes of pomegranate having single PIP marker amplicons were further annotated based on bulk download at GO-TAIR (https://www.arabidopsis.org/tools/bulk/go/index.jsp) to obtain the Gene Ontology Annotation Plot showing three classes: biological process (BP), molecular function (MF), and cellular component (CC).
Using the modified CTAB method, as described by Ravishankar et al. (2000), genomic DNA was extracted from the leaf samples of 31 pomegranate genotypes as listed in Table 1. For the wet lab assay, initially, one hundred PIP markers were synthesized, which were evenly distributed across eight chromosomes of the Tunisia genome. PCR screening was done on a subset of eight pomegranate genotypes, including “Ganesh”, “Arakta”, “P-16”, “Gulesha Red”, “Tabesta”, IC318790, IC1205, and IC318723, using the Prime-96TM Thermal Cycler (HiMedia, India). Based on the results of clear amplifications, subsequently, 24 informative PIP markers were selected for screening of 31 pomegranate genotypes for the genetic diversity study. All the PCR experiments were carried out in 10 μl reaction volume, which included 10 ng of template DNA, 10× PCR buffer, 1 mM dNTP mix, and 10 pmols each of forward and reverse primers, as well as 0.1 U of Taq DNA polymerase (Himedia, India). PCR with a touchdown program was followed (Patil et al., 2021), and finally, all the amplicons were resolved and photographed on 3% metaphor gels using a gel documentation system (Vilber Lourmat, France).
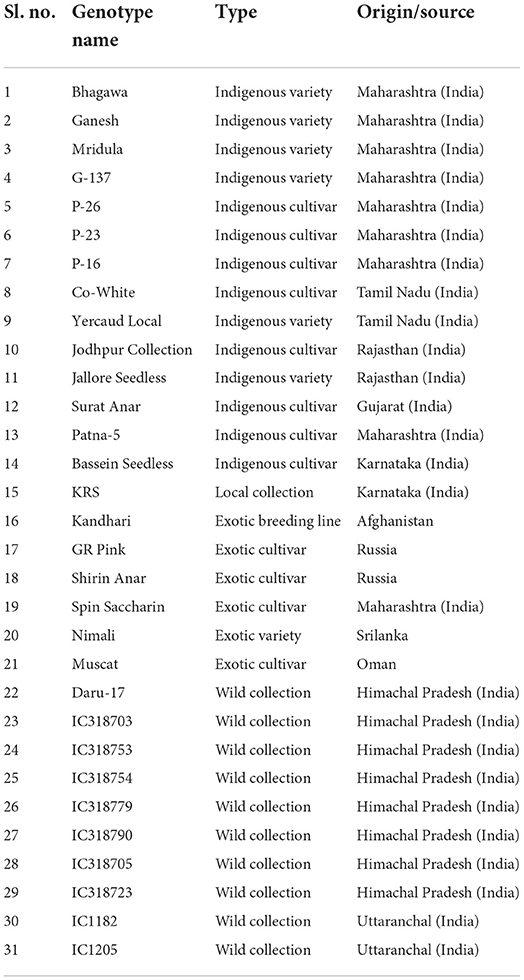
Table 1. The details of 31 different genotypes of pomegranate used in this study.
The allele sizes (bp) of 24 PIP primers were scored on 31 genotypes. The marker genotyping data were used to compute various marker parameters using GenAlEx v. 6.5 software. DARwin v. 6.0.13 (Perrier and Jacquemoud-Collet, 2006) software was used to create an NJ tree based on pairwise genetic distances determined by using Jaccard's dissimilarity coefficients with 10,000 bootstrap iterations. The same software was also used for Principal coordinate analysis (PCoA).
A set of 36,524 annotated gene sequences of the Tunisia genome produced 25,710 nonredundant sequences, which were used to design the intron polymorphism based PIP markers by using Arabidopsis as a reference genome in the PIP database. As a result, 8,812 PIP markers were designed out of 25,710 unique gene sequences with an average marker density of 30.76 markers/Mb of the genome. These markers targeted 3,445 (13.40%) gene models that span 8 chromosomes of the Tunisia genome (Supplementary Table 1). The marker density ranged from 22.84 per Mb (Chm_ 1) to 36.60 per Mb (Chm_4 & 6) with an average of 30.76 per Mb. The highest average marker density (36.60/Mb) was recorded for chromosomes 4 and 6, followed by 35.54/Mb and 34.55/Mb for chromosomes 7 and 8, and the lowest (22.84/Mb) was found in chromosome 1 (Table 2). Further, ePCR mapping of 8,812 PIP markers on Tunisia chromosomes revealed that 7,425 (84.26%) markers were successfully validated. Distribution and frequency analysis of physically mapped PIP markers revealed that markers mapped on chromosome 4 (1,317 markers, 89.7%) were more frequent than those mapped on chromosome 2 (707, 67.05%). Out of 7,425, 1,233 (16.60%) markers produced single-locus amplification in Tunisia chromosomes corresponding to 958 (27.80%) genes. Further, the overall distribution of PIP markers on 8 Tunisia chromosomes, their positions, intron numbers, and lengths within 3,445 to 958 chosen genes were reduced from the inside to the outer rings of the Circos graph (Figure 2, Supplementary Table 2).

Table 2. ePCR based validation of Pg_PIP markers for genotyping applications.
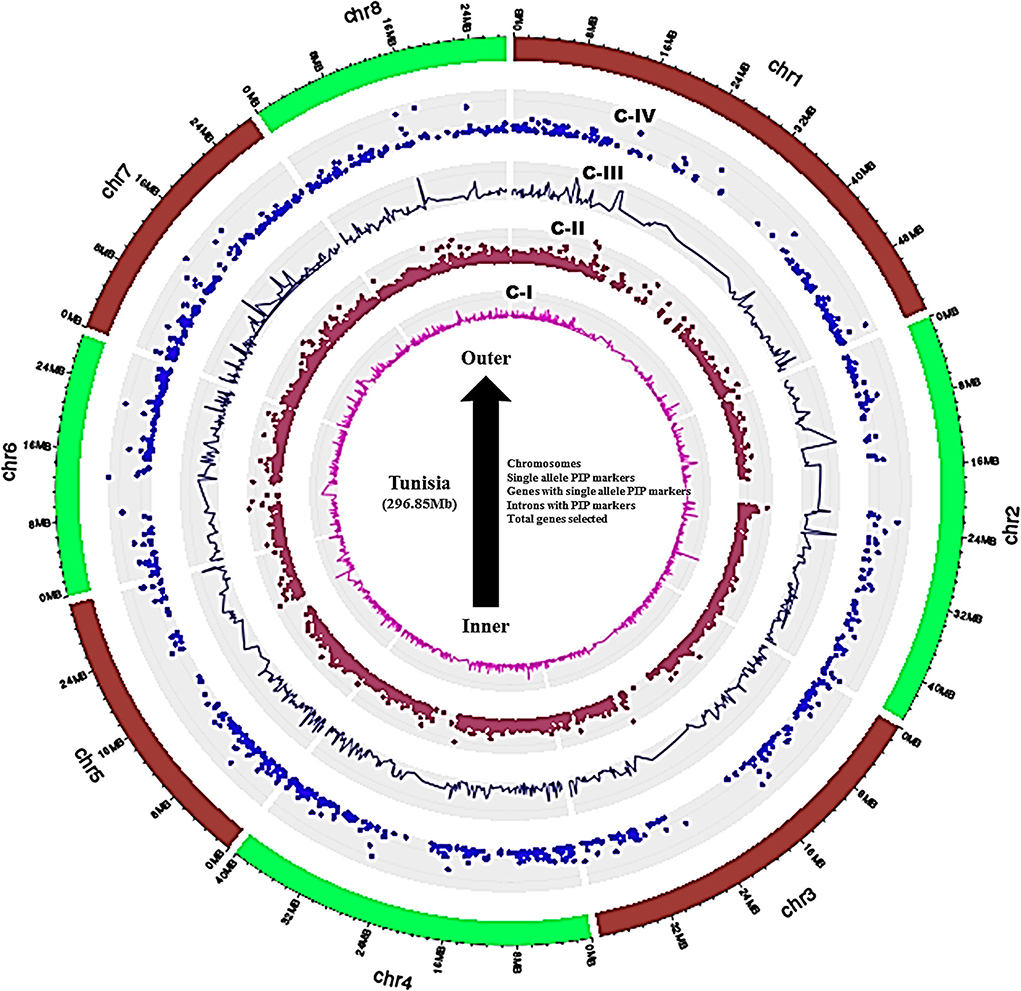
Figure 2. Circos graph depicting the physical positions of genes, intron numbers, and lengths targeted.
On each chromosome, the physical start positions of 1,233 Pg_PIP markers were used to create a high-density physical map (Figure 3, Supplementary Table 3). The map revealed that Chm_4 had the highest number of markers (234), followed by Chm_1 (170), Chm_7 (163), and Chm_3 (157). Whereas Chm_8 had the lowest number of markers (110), followed by Chm_2 (120), Chm_5 (137), and Chm_6 (142).
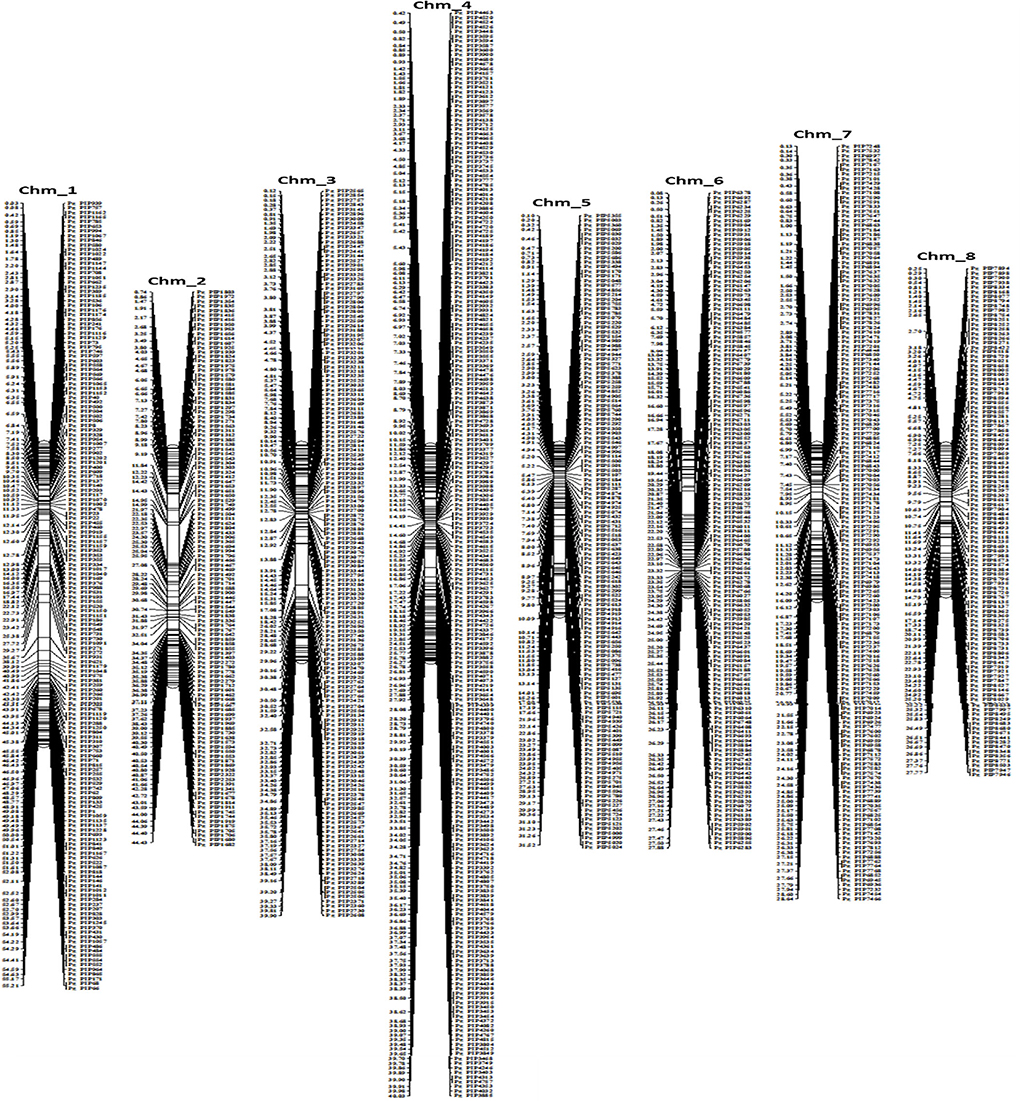
Figure 3. Physical linkage map based on 1233 PIP markers of the Tunisia genome.
Amplification efficiency and specificity of the developed ILP markers were determined by e-mapping 8,812 PIP markers on the “Tunisia” genome. A total of 7,425 (84.26%) primers were mapped and proportionately all the primers got validated across 8 chromosomes of “Tunisia” yielding one to more than 3 alleles. A total of 1,233 (14%) primers produced a single amplicon of the expected size, while 3,190 (36.2%) primers produced two alleles, and 2,972 (33.73%) primers produced three alleles. More than 3 alleles were recorded for 30 (0.34%) primers. Subsequently, validation of 8,812 PIP markers was also performed on three genome assemblies (“Dabenzi,” “Taishanhong,” “AG2017,”). Interestingly, we found, as compared to the Tunisia genome, maximum PIP markers were validated on Dabenzi (7,735, 87.78%) and Tiashanhong (7,727, 87.69%), followed by AG2017 (7,491, 85%). Similarly, a total of 1,283 (“Taishanhong”), 1,264 (“Dabenzi”), and 1,234 (“AG2017”) PIP markers offered single-locus amplifications.
We selected a set of 1,233 chromosome-specific PIP markers that had a single amplicon on the Tunisian genome and validated them in three additional pomegranate genomes (Table 2, Supplementary Table 4). The 886 (71.86%) resultant polymorphic PIP markers generated a total of 429 alleles across the four genomes. The average “Na” per locus was 2.79, ranging from 2 to 5. MF per locus varied from 0.25 to 0.87, with 0.55 being the average. The markers showed PIC values in the range of 0.25 to 1.00, with an average of 0.62. Interestingly, 1,118 PIP markers had PIC values ≥0.50. The average “I” index for the four genomes studied was 1.01.
We made chromosome-wise comparisons based on marker parameters (Table 3, Supplementary Table 5). Chm_4 had the most polymorphic markers (160) and the highest average value of Na (637). However, Chm_8 had the least values for both polymorphic loci (71) and Na (300). Whereas, with respect to all other parameters, i.e., Ne, I, Ho, He, and PIC, all the chromosomes except Chm_5 showed higher average values. The markers belonging to Chm_2 and Chm_3 had higher average PIC values of 0.67 and 0.66, respectively.
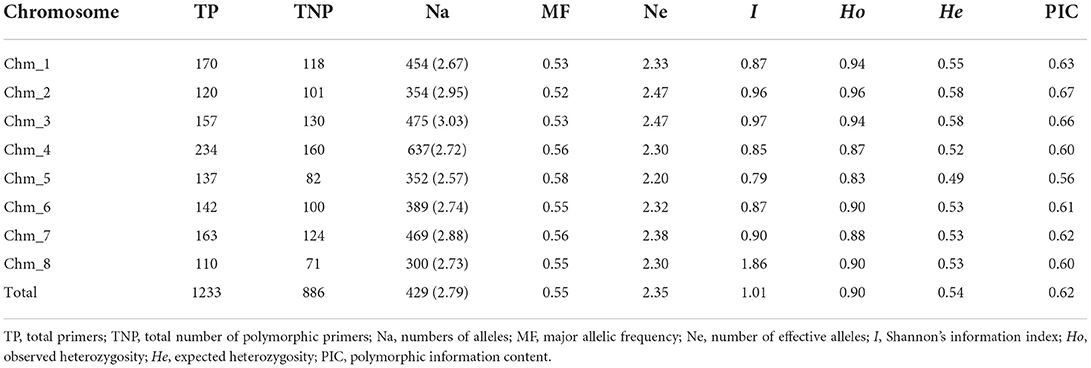
Table 3. ePCR-based marker statistics for 1233 chromosome-specific PIP primers assayed on four pomegranate genomes.
For wet-lab validation, we synthesized a set of 100 PIP markers randomly distributed across chromosomes of Tunisia and screened on eight pomegranate genotypes (Supplementary Table 6). As a result, 99 (99%) PIP primers could produce gene-specific amplicons in test genotypes. Of these, 76 (76%) PIP markers revealed polymorphisms across eight pomegranate genotypes, 12 were monomorphic, and 11 markers showed amplifications in one to three genotypes but one marker did not show amplification. The representative gel profiles of pomegranate genotypes using selected PIP markers are shown in Figure 4. Using PIP markers, we detected 177 alleles among eight pomegranate genotypes, and PIC values varied from 0 to 0.53 with a mean value of 0.30 (Supplementary Table 7). It is worth noting that 15 PIP markers had PIC values ≥0.50.

Figure 4. Allelic differences for PIP markers when validated on eight pomegranate genotypes (A), 31 genotypes using PIP markers Pg_PIP1836, 3403, and 6084 on 3% metaphor gels (B) (Lane L-100 bp DNA ladder, lanes 1–8, eight genotypes as mentioned in the Section Materials and methods, lanes 1–31, genotypes as mentioned in Table 1, lane-, genotypes not considered for analysis).
The physical locations of the 1,233 PIP markers mapped on the Tunisia genome were compared to their locations on three other draft genome assemblies (Figure 5). For markers spanning eight chromosomes, the results suggested the strongest syntenic relationship of Tunisia with Taishanhong (98.86%, 1,219) and Dabenzi (98.38%, 1,213), followed by AG2017 (94.97%, 1,171) (Table 4).
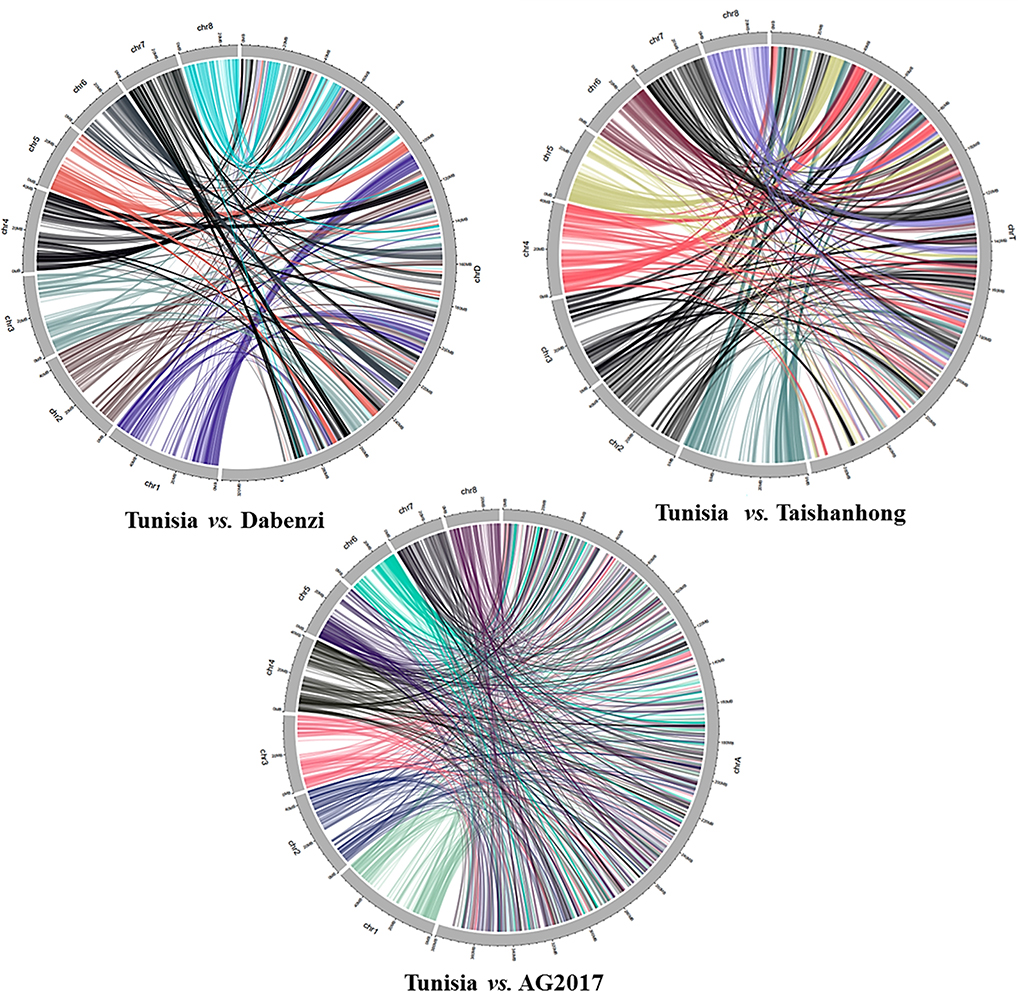
Figure 5. Syntenic relationships between Tunisia in comparison to Dabenzi, Taishanhong and AG2017 genomes based on 1233 PIP markers.

Table 4. A summary of 1233 PIP marker-based comparative mapping of Tunisia chromosomes with Dabenzi, Taishanhong, and AG 2017 assemblies, revealing syntenic relationships.
Based on the available functional annotations of 3,445 gene models of Tunisia, 94% of the PIP markers had defined functions and 6% had uncharacterized proteins. All the annotated genes were grouped into nine major categories (Figure 6, Supplementary Table 8). The category with predicted/uncharacterized/hypothetical protein activities was the most dominant (45%) accompanied by enzymes (24%). The transcription factors (10%) ranked third, followed by kinases (8%), biotic and abiotic stress tolerance (3%), lipid metabolism (3%), DNA synthesis and repair (2%), and sugar, starch, and cellulose metabolisms (2%) (Figure 6).
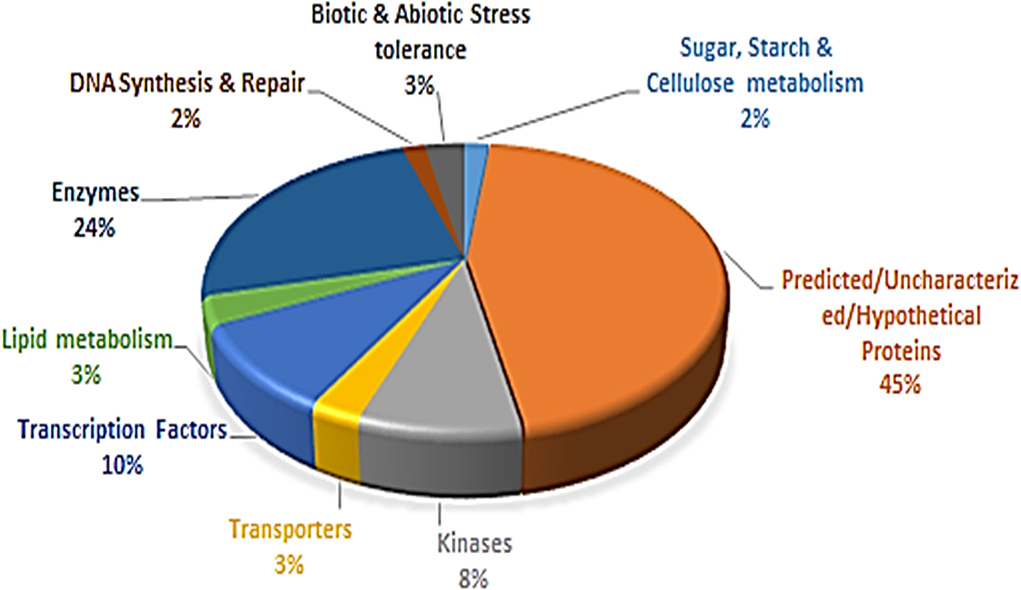
Figure 6. Proportionate distribution and classification of 3,445 annotated genes having 8,812 PIP markers.
We performed gene ontology for 958 Arabidopsis homolog genes of pomegranate having single PIP marker amplicons to obtain GO Annotation Plot (Supplementary Table 9). All the genes were categorized into three classes: BP (47 GO terms), MF (26 GO terms), and CC (24 GO terms) (Figure 7). According to GO analysis, the majority of the genes under biological process were categorized into cellular processes (81.86%) and metabolic processes (63.38%). In CC, many genes are found in the nucleus (39%), the cytoplasm (39%), and the chloroplast (31.67%). However, in MF, many genes have a role in protein binding (38.06%), catalytic activity (38.06%), and other binding (25.71%).

Figure 7. Gene ontology-based functional categorization of 958 genes with unique PIP marker amplifications in Tunisia genome that are part of (i) cellular component, (ii) molecular function, and (iii) biological process.
Based on the amplification and polymorphism profiles, a subset of 24 PIP markers distributed on 8 chromosomes of the Tunisia genome was selected for genotyping 31 pomegranate genotypes (Table 5). A total of 49 alleles were obtained across the genotypes, with an average value of 2.04 alleles. The ranges of expected heterozygosity and PIC were found as 0.28–0.49 and 0.28–0.50, respectively. Among the 31 pomegranate genotypes, the average “I” index was 0.59.
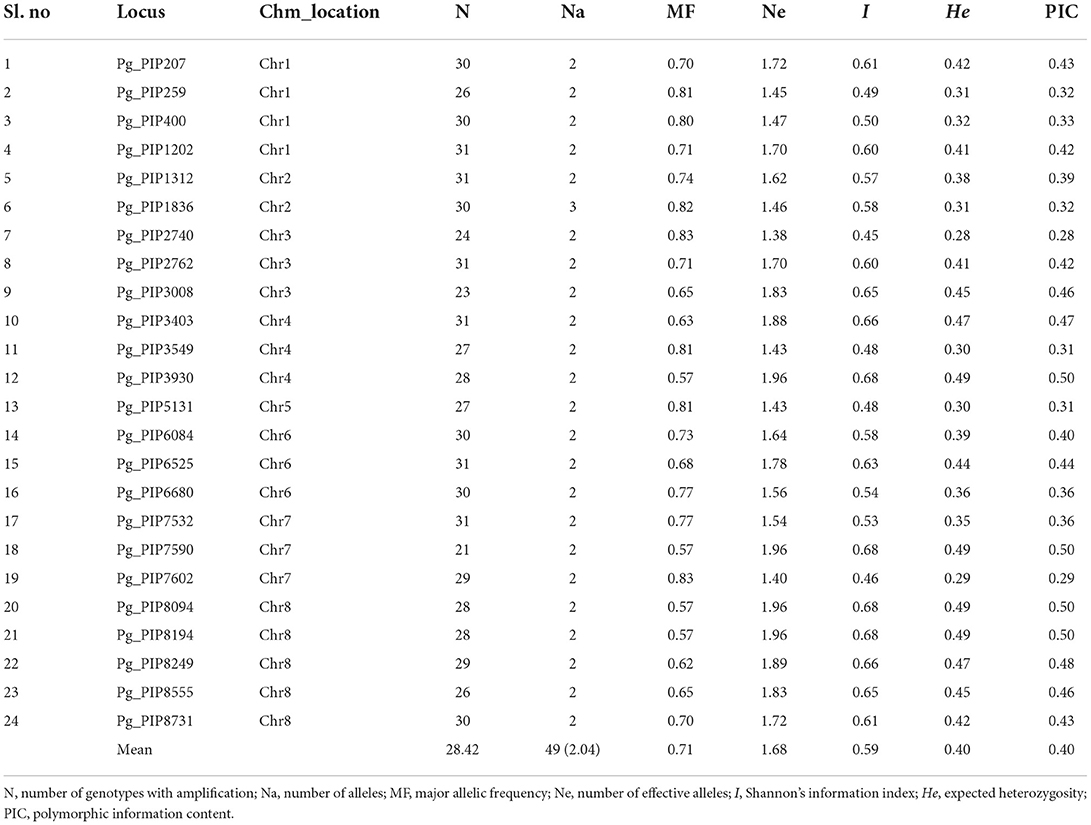
Table 5. Diversity parameters for 24 PIP markers screened on 31 pomegranate genotypes.
Nineteen and 12 genotypes formed two separate clusters in the NJ tree based on 31 pomegranate genotypes (Figure 8A). Cluster 1 primarily had 10 wild genotypes, with an out-grouping of 9 cultivars. In addition, the PCA plot also separated 31 genotypes into two major groups (Figure 8B). The principal coordinates (PCos) 1 and 2 explained 19.9% and 10.98% of the total variance, respectively, accounting for 30.88% of the overall variation. Interestingly, PCo 1 distinguished two clusters into the wild and cultivar groups.

Figure 8. The Neighbor-joining tree (A) and the PCA plot (B) showing genetic relationships among 31 pomegranate genotypes based on 24 PIP markers.
In this study, we developed genome-wide PIP markers based on the information on individual introns obtained from the annotated gene models of the pomegranate genome (cv. Tunisia) using the PIP database. We designed 8,812 novel PIP markers targeting 3,445 gene models that spanned 8 chromosomes of the Tunisia genome. We found that the overall PIP marker density increased with shorter chromosome lengths. Wang et al. (2006) reported a considerable change in ILP density across the rice genome and among chromosomes. In pomegranate, we observed earlier a positive correlation between chromosomal length and SSR abundance, with higher marker density on the shorter chromosome length (Patil et al., 2021). Xia et al. (2017), while working on different marker systems (SSR, ILP, and PIP) in 16 tree species, discovered that genome size has a high correlation with the number of marker loci compared to marker density.
As illustrated by the Circos graph, 8,812 PIP primers (targeted 3,445 genes) were scattered evenly across all of the 8 Tunisia chromosomes. In chickpea, 7,454 intron-spanning markers (ISMs) were developed from introns of 3,283 genes representing the entire eight chromosomes (Srivastava et al., 2016). Badoni et al. (2016) also developed 16,510 ILP markers, which were physically mapped on 12 chromosomes, and found them to be well-distributed throughout the rice genome. The development of multiple PIP markers from individual genes allows researchers to choose the best primer combination for reliable amplification.
The information on ILP markers was utilized to construct a high-density PIP marker-based physical map. Through in silico PCR, we identified 1,233 genome-wide Pg_PIP markers producing single amplicons in the Tunisia genome and physically mapped them to construct a PIP marker-based saturated physical map with an average marker density of 4.31 markers/Mb. Similarly, Muthamilarasan et al. (2014) reported the development of 5,123 ILP markers, 4,049 of which were physically mapped onto 9 chromosomes of foxtail millet with a marker density of 9.8 markers/Mb. The ePCR technique was found to be highly useful in the validation and identification of informative markers that are derived through in silico methods in many crops (Cui et al., 2017; Wang et al., 2018; Uncu and Uncu, 2020). Several studies demonstrated the use of a marker-based physical map to fine-map QTL regions (Zhao et al., 2017). In our previous research, we constructed a high-density physical map based on SSR loci, which could act as a reference for assessing genotyping data for different types of populations in pomegranate.
Although we designed primers based on the Tunisia gene models, we were able to validate 7,425 primers (84.26%) and failed to acquire e-PCR products for 1,387 (15.74%) primers in the Tunisia genome. This could be due to constraint conditions set while designing ILP primers and e-PCR validation that resulted in mismatches between primers with the genomic sequence as also observed in rice (Wang et al., 2006).
The most crucial characteristic of any molecular marker system is its ability to uncover a high level of DNA polymorphism. Therefore, we used in silico simulated PCR to determine the PIP marker polymorphism across four pomegranate genome sequences. As a result, 1,233 (Tunisia) to 1,283 (Taishanhong) markers showed single ePCR product with the expected size across the multiple genomes. With a mean PIC value of 0.62, 886 (71.86%) markers were found to be polymorphic, which implied their highly informative nature and would serve as a valuable genomic tool for downstream trait mapping in pomegranate. Similarly, Patil et al. (2021) identified the 265 most informative SSR markers with an average PIC value of 0.46 through ePCR validation of in silico-designed markers across multiple pomegranate genomes. Recently, Patil et al. (2022) reported the identification of 77 polymorphic miRNA-SSRs for seed hardness breeding through multiple genome-ePCR confirmations in pomegranate.
We showed the utility of the PIP marker-based physical map to facilitate comparative genome mapping in pomegranate. A total of 1,233 physically mapped markers were compared with the three different pomegranate draft genomes. We noticed 98.38% (1,213) to 98.86% (1,219) markers mapped to Dabenzi and Taishanhong genome assemblies, respectively, with lower than 94.97% in AG2017 (1,171) genome. This revealed a considerable proportion of sequence-based orthology and syntenic relationship due to the cross-transferability nature of ILP markers within genera or cross-genera as that of SSR markers. These results also substantiated conserved orthologous genes that are evenly distributed across pomegranate genomes. Muthamilarasan et al. (2014) reported ~85% transferability for foxtail millet ILP markers within eight millets and five non-millet species.
The interspecies conservation of PIP markers renders these marker systems highly suitable for generating cross-species genetic markers (Huang et al., 2013). Our comparative mapping revealed the highest conserved syntenic blocks of Tunisia with Dabenzi and Taishanhong assemblies, whereas the least synteny was observed with AG2017. Xia et al. (2017) assessed SSR and ILM markers for duplication analysis in trees, and the syntenic graphs elucidated that SSRs corresponded to substantially higher duplication occurrences than gene-based ILS markers, implying the suitability of SSRs for duplication study in tree species.
The genome-wide ILP markers developed from a variety of cloned or functionally annotated candidate genes could facilitate gene-trait association studies and genomics-assisted breeding in different crop species (Badoni et al., 2016). Therefore, based on annotation details, 3,445 Tunisia gene models with PIP markers were grouped into nine categories. The largest category (45%) contained gene sequences with predicted/uncharacterized/hypothetical protein functions. Similarly, the largest category (47.4%) belonged to hypothetical/uncharacterized/putative functions when analyzed for 5,123 ILP markers in foxtail millet (Muthamilarasan et al., 2014). We found that the second largest category comprised enzymes (24%); pomegranate being a medicinal plant, there is every chance that investigating 45% of their functions (predicted/uncharacterized/hypothetical protein) could help to identify important unique enzymes that are part of potential biochemical pathways or structural proteins, which could help to improve fruit quality traits in future.
The gene ontology was analyzed for 958 Arabidopsis homolog genes having single PIP marker amplifications in pomegranate. All the genes were categorized into one of three GO categories: BP (47), MF (26), and CC (24). In biological processes, 81.86% of genes engaged in cellular processes, whereas 63.38% of genes engaged in metabolic processes. The majority of genes were engaged in protein binding, catalytic activity, and other binding activities in molecular functions. The bulk of genes was found in the nucleus, the cytoplasm, and the chloroplast. The relevance of these gene-derived PIP markers for pomegranate trait mapping was clearly demonstrated by GO analysis. Saminathan et al. (2016) performed large-scale sequencing and identification of ncRNAs during fruit development stages in pomegranate. Through GO for miRNA target genes, they found the majority of genes to possess binding and catalytic activity, having a role in cellular and metabolic processes, and are part of the cell, intracellular, and organelle parts. Similarly, Patil et al. (2020b) also performed the GO analysis for miRNA target genes to elucidate the importance of gene-derived miRNA-SSRs markers for trait mapping in pomegranate. In a recent study, we performed GO for 727 gene targets of miRNAs that are part of seed development (Patil et al., 2022) and observed biological processes to be the most abundant category. Binding and catalytic activity had the highest representation in the molecular functions category.
We performed wet lab validation experiments for 100 PIP markers, of which 76 markers were polymorphic on eight genotypes. The marker polymorphism data of ILP markers as assessed on metaphor gels enabled us to obtain an average PIC value of 0.30. Similar values of average PIC were earlier recorded for ILP markers in foxtail millet (0.20), cowpea (0.34), maize (0.48), and rice (0.45) (Wang et al., 2006; Gupta et al., 2012; Liu et al., 2012; Muthamilarasan et al., 2014). Following the criterion laid by Botstein et al. (1980), in our study, 15 PIP markers had PIC values ≥0.50, indicating the informative nature of these markers for genetic diversity and genetic mapping analyses in pomegranate. Similarly, Zhang et al. (2017) identified 25 ILP markers with PIC values >0.5 in Medicago sativa for genetic studies. In the rubber tree, Bhusudsawang and Ukoskit (2019) also found 20 ILP markers with PIC values >0.5. We observed lesser alleles with lower PIC values for PIP markers and many of the earlier reports in different crops clearly indicated ILP markers with higher alleles and PIC values when separated on acrylamide gels. This suggested limited resolution for PIP markers as that of SSRs when assayed on agarose and metaphor gels as compared to the high-end automated gel systems (Patil et al., 2020a). Therefore, the PIP markers generated here might show a higher degree of polymorphism on polyacrylamide or capillary systems.
The ability of selected PIP markers to detect polymorphism and molecular diversity among 31 pomegranate genotypes was evaluated by large-scale validation and genotyping. Recently, the potential of these novel markers to precisely assay large-scale genotyping, allelic diversity, and expression profiling in a diverse array of accessions was demonstrated in rice (Badoni et al., 2016).
There were 49 alleles with PIC values ranging from 0.28 to 0.50 and a mean value of 0.40 among the 24 PIP markers representing 8 chromosomes. PIP markers were found to be the best complement for SSR-based profiling in many other crops (Huang et al., 2013) and are codominant in nature with high cross-genera transferability. The new findings support our previous findings, in which we found 30 alleles for 13 HvSSRs originating from the “Dabenzi” genome with PIC values ranging from 0.12 to 0.63 across 46 genotypes (Patil et al., 2020a). Low PIC values for PIP markers were found in our investigation, which could be related to the low resolution of the agarose or metaphor gels employed for gel separation and scoring or to the smaller number of polymorphic alleles found in the cultivars investigated here, as in the SSR-based study (Patil et al., 2020a).
The mean Shannon's information index obtained for 24 PIP markers was 0.59. Our findings indicated that, among the 31 genotypes studied, there was a moderate level of genetic diversity. Patil et al. (2021) also found moderate genetic variability among 30 pomegranate genotypes using 16 chromosome-specific HvSSR markers. Similarly, the utility of gene-derived miRNA-based SSR markers for genetic diversity study was demonstrated in pomegranate in an earlier study (Patil et al., 2020b, 2022).
The NJ tree based on 24 PIP markers divided 31 genotypes into two separated groups constituting wild and cultivated types. These findings strongly corroborate the clustering patterns recorded previously in pomegranates using SSRs and miRNA-SSRs (Patil et al., 2020a,b, 2022). It was interesting to note that cluster 2 was found to be more diverse by including a few introduced exotic pomegranate accessions like Nimali (Srilanka), Kandhari (Afghanistan), GR Pink (Russia), and Shirin Anar (Russia). Similarly, Patil et al. (2021) observed the inclusion of exotic lines, which accounted for higher genetic diversity levels as observed for cultivars groups based on SSR markers. The PCA plot also grouped 31 genotypes into two major clusters as that of the NJ tree. The PCos 1 accounted for a higher proportion of the variance of 19.9%, separating wild type from cultivars in pomegranate as reported in previous studies (Patil et al., 2020a, 2022). Overall, the NJ tree and the factorial analysis showed strong agreements based on the PIP markers.
The present study reports the development of novel gene-based PIP markers evenly distributed on eight Tunisia chromosomes. In silico survey of PIP markers in the 36,524 annotated gene models of the Tunisia genome resulted in the designing of 8,812 PIP markers specific to 3,445 gene models that spanned 8 chromosomes. Further, we first assessed the in silico amplification of all the PIP markers, identified 1,233 markers that amplified a single locus, and corresponded to 958 important genes of Tunisia. In this study, we provided a set of 886 polymorphic PIP markers after ePCR validation on four pomegranate genome assemblies. Furthermore, amplification of 100 PIP markers was confirmed through wet-lab experiments, with 76% of them being polymorphic. Comparative mapping of 1,233 PIP markers across four pomegranate genomes revealed a significant proportion of orthology and syntenic relationships of Tunisia with Dabenzi and Taishanhong assemblies, followed by AG2017. The immediate use of the developed PIP markers was exemplified by a genetic diversity study of 31 pomegranate genotypes. The study provides an important functional marker resource for future trait discovery and improvement and for genomics-assisted breeding of pomegranate.
The datasets presented in this study can be found in online repositories. The names of the repository/repositories and accession number(s) can be found in the article/Supplementary material.
PP and RM were designed the research experiments. PP and SJ were performed in silico analyses and were carried out wet-lab experiments. MN and SP assisted in the collection of test materials. PP, AB, and AM wrote the original manuscript with the help of RM. All authors approved the final version to submit.
This research was funded by the Indian Council of Agricultural Research (ICAR), New Delhi, India, through the ICAR-National Research Centre on Pomegranate, Solapur (MS), as part of an Institute Project.
The authors declare that the research was conducted in the absence of any commercial or financial relationships that could be construed as a potential conflict of interest.
All claims expressed in this article are solely those of the authors and do not necessarily represent those of their affiliated organizations, or those of the publisher, the editors and the reviewers. Any product that may be evaluated in this article, or claim that may be made by its manufacturer, is not guaranteed or endorsed by the publisher.
The Supplementary Material for this article can be found online at: https://www.frontiersin.org/articles/10.3389/fpls.2022.943959/full#supplementary-material
Supplementary Table 1. Details for 8812 PIP primers designed from 3,445 genes of Tunisia genome.
Supplementary Table 2. Details of locations of genes and PIP markers on Tunisia chromosomes.
Supplementary Table 3. Physical position of PIP markers on 8 chromosomes of Tunisia.
Supplementary Table 4. Details of 1233 PIP primers designed from 958 genes of Tunisia genome.
Supplementary Table 5. Marker parameters for 1233 PIP primers assayed across four pomegranate genomes using ePCR.
Supplementary Table 6. Details of 100 PIP primers used for wet-lab validation among six pomegranate genotypes.
Supplementary Table 7. Marker statistics obtained based on 100 PIP primers screened on 8 pomegranate genotypes.
Supplementary Table 8. Functional categorization of 3,445 annotated Tunisia genes with 1,233 PIP markers.
Supplementary Table 9. Details of 956 Arabidopsis homolog genes of pomegranate having single PIP marker amplicons used for GO annotation.
Akparov, Z., Amiraslanov, A., Hajiyeva, S., Abbasov, M., Kaur, K., Hamwieh, A., et al. (2017). De-novo Sequencing of Pomegranate (Punica granatum L.) Genome. Heidelberg: EMBL.
Badoni, S., Das, S., Sayal, Y. K., Gopalakrishnan, S., Singh, A. K., Rao, A. R., et al. (2016). Genome-wide generation and use of informative intron-spanning and intron-length polymorphism markers for high-throughput genetic analysis in rice. Sci. Rep. 6, 1–15. doi: 10.1038/srep23765
Basaki, T., Choukan, R., Mojtaba, S., and Nekouei, K. (2011). Association analysis for morphological traits in pomegranate (Punica geranatum L.) using microsatellite markers. Middle-East J. Scie. Res. 9, 410–417.
Berger, B. A., Kriebel, R., Spalink, D., and Sytsma, K. J. (2016). Divergence times, historical biogeography, and shifts in speciation rates of Myrtales. Mol. Phylogene. Evol. 95, 116–136. doi: 10.1016/j.ympev.2015.10.001
Bhusudsawang, G., and Ukoskit, K. (2019). Intron length polymorphism in candidate genes for secondary growth and its application in diversity assessment of amazonian accessions of Hevea brasiliensis. Sci. Technol. Asia 24, 66–75.
Botstein, D., White, R. L., Skolnick, M., and Davis, R. W. (1980). Construction of genetic linkage map in man using restriction fragment length polymorphisms. Am. J. Hum. Genet. 32, 314–331.
Chen, X., Zhang, G., and Wu, W. (2011). Investigation and utilization of intron length polymorphisms in conifers. New For. 41, 379–388. doi: 10.1007/s11056-010-9229-5
Cui, J., Cheng, J., Nong, D., Peng, J., Hu, Y., He, W., et al. (2017). Genome-wide analysis of simple sequence repeats in bitter gourd (Momordica charantia). Front. Plant Sci. 8, 1103. doi: 10.3389/fpls.2017.01103
Curro, S., Caruso, M., Distefano, G., Gentile, A., and La Malfa, S. (2010). New microsatellite loci for pomegranate, Punica granatum (Lythraceae). Am. J. Bot. 97, e58–e60. doi: 10.3732/ajb.1000143
Graham, S. A., and Graham, A. (2014). Ovary, fruit, and seed morphology of the Lythraceae. Int. J. Plant Sci. 175, 202–240. doi: 10.1086/674316
Gupta, S. K., Bansal, R., and Gopalakrishna, T. (2012). Development of intron length polymorphism markers in cowpea [Vigna unguiculata (L.) Walp.] and their transferability to other Vigna species. Mol. Breed. 30, 1363–1370. doi: 10.1007/s11032-012-9722-y
Harel-Beja, R., Sherman, A., Rubinstein, M., Eshed, R., Bar-Ya'akov, I., Trainin, T., et al. (2015). A novel genetic map of pomegranate based on transcript markers enriched with QTLs for fruit quality traits. Tree Genet. Genomes 11, 109. doi: 10.1007/s11295-015-0936-0
Holland, D., and Bar-Ya'akov, I. (2014). “Pomegranate: aspects concerning dynamics of health beneficial phytochemicals and therapeutic properties with respect to the tree cultivar and the environment,” in Medicinal and Aromatic Plants of the Middle-East, eds Z. Yaniv and N. Dudai (Netherlands: Springer), 225–239 doi: 10.1007/978-94-017-9276-9_12
Huang, L., Cao, H., Yang, L., Yu, Y., and Wang, Y. (2013). Large-scale development of PIP and SSR markers and their complementary applied in Nicotiana. Russ. J. Genet. 49, 827–838. doi: 10.1134/S1022795413070077
Huang, M., Xie, F. M., Chen, L. Y., Zhao, X. Q., Jojee, L., and Madonna, D. (2010). Comparative analysis of genetic diversity and structure in rice using ILP and SSR markers. Rice Sci. 17, 257–268. doi: 10.1016/S1672-6308(09)60025-1
Li, W., and Godzik, A. (2006). Cd-hit: a fast program for clustering and comparing large sets of protein or nucleotide sequences. Bioinformatics 22, 1658–1659. doi: 10.1093/bioinformatics/btl158
Liu, H., Lin, Y., Chen, G., Shen, Y., Liu, J., and Zhang, S. (2012). Genome-scale identification of resistance gene analogs and the development of their intron length polymorphism markers in maize. Mol. Breed. 29, 437–447. doi: 10.1007/s11032-011-9560-3
Luo, X., Li, H., Wu, Z., Yao, W., Zhao, P., Cao, D., et al. (2020). The pomegranate (Punica granatum L.) draft genome dissects genetic divergence between softand hard-seeded cultivars. Plant Biotechnol. J. 18, 955–968. doi: 10.1111/pbi.13260
Melgarejo, P., Martínez, J., Hernández, F., Martínez, R., Legua, P., Oncina, R., et al. (2009). Cultivar identification using 18S−28S rDNA intergenic spacer-RFLP in pomegranate (Punica granatum L.). Sci. Hortic. 120, 500–503. doi: 10.1016/j.scienta.2008.12.013
Moriguchi, T., Omura, M., Natsuta, N., and Kozaki, I. (1987). In vitro adventitious shoot formation from anthers of pomegranate. Hort. Sci. 22, 947–948.
Muthamilarasan, M., Venkata Suresh, B., Pandey, G., Kumari, K., Parida, S. K., and Prasad, M. (2014). Development of 5123 intronlength polymorphic markers for large-scale genotyping applications in foxtail millet. DNA Res. 21, 41–52. doi: 10.1093/dnares/dst039
Ono, N. N., Britton, M. T., Fass, J. N., Nicolet, C. M., Lin, D., and Tian, L. (2011). Exploring the transcriptome landscape of pomegranate fruit peel for natural product biosynthetic gene and SSR marker discovery. J. Integr. Plant Biol. 53, 800–813. doi: 10.1111/j.1744-7909.2011.01073.x
Ophir, R., Sherman, A., Rubinstein, M., Eshed, R., Sharabi Schwager, M., HarelBeja, R., et al. (2014). Single-nucleotide polymorphism markers from de-novo assembly of the pomegranate transcriptome reveal germplasm genetic diversity. PLoS ONE 9, e88998. doi: 10.1371/journal.pone.0088998
Patil, P. G., Jamma, S. M., Singh, N. V., Bohra, A., Parashuram, S., Injal, A. S., et al. (2020a). Assessment of genetic diversity and population structure in pomegranate (Punica granatum L.) using new hypervariable SSR markers. Physiol. Mol. Biol. Plants 26, 1249–1261. doi: 10.1007/s12298-020-00825-y
Patil, P. G., Singh, N. V., Bohra, A., Jamma, S., Karuppannan, D. B., Sharma, J., et al. (2022). Novel miRNA-SSRs for improving seed hardness trait of pomegranate (Punica granatum L.). Front. Genet. 13, 866504. doi: 10.3389/fgene.2022.866504
Patil, P. G., Singh, N. V., Bohra, A., Raghavendra, K. P., Mane, R., Mundewadikar, D. M., et al. (2021). Comprehensive characterization and validation of chromosome-specific highly polymorphic SSR markers from Pomegranate (Punica granatum L.) cv. Tunisia Genome. Front. Plant Sci. 12, 337. doi: 10.3389/fpls.2021.645055
Patil, P. G., Singh, N. V., Parashuram, S., Bohra, A., Mundewadikar, D. M., Sangnure, V. R., et al. (2020b). Genome wide identification, characterization and validation of novel miRNA-based SSR markers in pomegranate (Punica granatum L.). Physiol. Mol. Biol. Plants 26, 683–696. doi: 10.1007/s12298-020-00790-6
Patil, P. G., Singh, N. V., Parashuram, S., Bohra, A., Sowjanya, R., Gaikwad, N., et al. (2020c). Genome-wide characterization and development of simple sequence repeat markers for genetic studies in pomegranate (Punica granatum L.). Trees Struct. Func. 34, 987–998. doi: 10.1007/s00468-020-01975-y
Peakall, R., and Smouse, P. E. (2012). GenAlEx 6.5: genetic analysis in excel. Population Genetic Software for Teaching and Research-Aan Update. Bioinformatics 28, 2537–2539. doi: 10.1093/bioinformatics/bts460
Pirseyedi, S. M., Valizadehghan, S., Mardi, M., Ghaffari, M. R., Mahmoodi, P., Zahravi, M., et al. (2010). Isolation and characterization of novel microsatellite markers in pomegranate (Punica granatum L.). Int. J. Mol. Sci. 11, 2010–2016. doi: 10.3390/ijms11052010
Qin, G., Xu, C., Ming, R., Tang, H., Guyot, R., Kramer, E. M., et al. (2017). The pomegranate (Punica granatum L.) genome and the genomics of punicalagin biosynthesis. Plant J. 91, 1108–1128. doi: 10.1111/tpj.13625
Ravishankar, K. V., Anand, L., and Dinesh, M. R. (2000). Assessment of genetic relatedness among mango cultivars of India using RAPD markers. J. Hort. Sci. Biotechnol. 75, 198–201. doi: 10.1080/14620316.2000.11511223
Saminathan, T., Bodunrin, A., Singh, N. V., Devarajan, R., Nimmakayala, P., Jeff, M., et al. (2016). Genome-wide identification of microRNAs in pomegranate (Punica granatum L.) by high-throughput sequencing. BMC Plant Biol. 16, 122. doi: 10.1186/s12870-016-0807-3
Schuler, G. D. (1997). Sequence mapping by electronic PCR. Genome Res. 7, 541–550. doi: 10.1101/gr.7.5.541
Singh, N. V., Abburi, V., Ramajayam, D., Kumar, R., Chandra, R., Sharma, K., et al. (2015). Genetic diversity and association mapping of bacterial blight and other horticulturally important traits with microsatellite markers in pomegranate from India. Mol. Genet. Genomics 290, 1393–1402. doi: 10.1007/s00438-015-1003-0
Srivastava, R., Bajaj, D., Sayal, Y. K., Meher, P. K., Upadhyaya, H. D., Kumar, R., et al. (2016). Genome-wide development and deployment of informative intron-spanning and intron-length polymorphism markers for genomics-assisted breeding applications in chickpea. Plant Sci. 252, 374–387. doi: 10.1016/j.plantsci.2016.08.013
Teixeira da Silva, J., Rana, T. S., Narzaryd, D., Vermae, N., Meshramf, D. T., and Ranade, S. A. (2013). Pomegranate biology and biotechnology: a review. Sci. Hort. 160, 85–107. doi: 10.1016/j.scienta.2013.05.017
Trainin, T., Harel-Beja, R., Bar-Ya'akov, I., Ben-Simhon, Z., Yahalomi, R., Borochov-Neori, H., et al. (2021). Fine mapping of the “black” peel color in Pomegranate (Punica granatum L.) strongly suggests that a mutation in the Anthocyanidin Reductase (ANR) gene is responsible for the trait. Front. Plant Sci. doi: 10.3389/fpls.2021.642019
Uncu, A. O., and Uncu, A. T. (2020). High-throughput simple sequence repeat (SSR) mining saturates the carrot (Daucus carota L.) genome with chromosome-anchored markers. Biotechnol. Biotech. Equipment 34, 1–9. doi: 10.1080/13102818.2019.1701551
Voorrips, R. E. (2002). MapChart: software for the graphical presentation of linkage maps and QTLs. J. Heredit. 93, 77–78. doi: 10.1093/jhered/93.1.77
Wang, X., and Wang, L. (2016). GMATA: an integrated software package for genome-scale SSR mining, marker development and viewing. Front. Plant Sci. 7:1350. doi: 10.3389/fpls.2016.01350
Wang, X., Yang, S., Chen, Y., Zhang, S., Zhao, Q., Li, M., et al. (2018). Comparative genome-wide characterization leading to simple sequence repeat marker development for nicotiana. BMC Genomics 19, 4874–78. doi: 10.1186/s12864-018-4878-4
Wang, X. S., Zhao, X. Q., Zhu, J., and Wu, W. R. (2006). Genome-wide investigation of intron length polymorphisms and their potential as molecular markers in rice (Oryza sativa L.). DNA Res. 12, 417–427. doi: 10.1093/dnares/dsi019
Wang, Y., Chen, J., Francis, D. M., Shen, H., Wu, T., and Yang, W. (2010). Discovery of intron polymorphisms in cultivated tomato using both tomato and Arabidopsis genomic information. Theor. Appl. Genet. 121, 1199–1207. doi: 10.1007/s00122-010-1381-y
Xia, X., Luan, L. L., Qin, G., Yu, L. F., Wang, Z. W., Dong, W. C., et al. (2017). Genome-wide analysis of SSR and ILP markers in trees: diversity profiling, alternate distribution, and applications in duplication. Sci. Rep. 7, 17902. doi: 10.1038/s41598-017-17203-6
Yang, L., Jin, G., Zhao, X., Zheng, Y., Xu, Z., and Wu, W. (2007). PIP: a database of potential intron polymorphism markers. Bioinformatics 23, 2174–2177. doi: 10.1093/bioinformatics/btm296
Yu, Y., Ouyang, Y., and Yao, W. (2017). ShinyCircos: an R/Shiny application for interactive creation of Circos plot. Bioinformatics 34, 1229–1231. doi: 10.1093/bioinformatics/btx763
Yuan, Z., Fang, Y., Zhang, T., Fei, Z., Han, F., Liu, C., et al. (2018). The pomegranate (Punica granatum L.) genome provides insights into fruit quality and ovule developmental biology. Plant Biotechnol. J. 16, 1363–1374. doi: 10.1111/pbi.12875
Zhang, Z., Min, X., Wang, Z., Wang, Y., Liu, Z., and Liu, W. (2017). Genome-wide development and utilization of novel intron-length polymorphic (ILP) markers in Medicago sativa. Mol. Breed. 37, 1–8. doi: 10.1007/s11032-017-0659-z
Zhao, C., Qiu, J., Agarwal, G., Wang, J., Ren, X., Xia, H., et al. (2017). Genome-wide discovery of microsatellite markers from diploid progenitor species, Arachis duranensis and A. ipaensis, and their application in cultivated peanut (A. hypogaea). Front. Plant Sci. 8, 1209. doi: 10.3389/fpls.2017.01209
Keywords: chromosome, genome, potential intron polymorphism markers, pomegranate, diversity
Citation: Patil PG, Jamma S, N M, Bohra A, Pokhare S, Dhinesh Babu K, Murkute AA and Marathe RA (2022) Chromosome-specific potential intron polymorphism markers for large-scale genotyping applications in pomegranate. Front. Plant Sci. 13:943959. doi: 10.3389/fpls.2022.943959
Received: 14 May 2022; Accepted: 23 June 2022;
Published: 30 August 2022.
Edited by:
Agata Gadaleta, University of Bari Aldo Moro, ItalyReviewed by:
Samar Gamal Thabet, Fayoum University, EgyptCopyright © 2022 Patil, Jamma, N, Bohra, Pokhare, Dhinesh Babu, Murkute and Marathe. This is an open-access article distributed under the terms of the Creative Commons Attribution License (CC BY). The use, distribution or reproduction in other forums is permitted, provided the original author(s) and the copyright owner(s) are credited and that the original publication in this journal is cited, in accordance with accepted academic practice. No use, distribution or reproduction is permitted which does not comply with these terms.
*Correspondence: Prakash Goudappa Patil, cGF0aWxidEBnbWFpbC5jb20=; Rajiv A. Marathe, cmFtYXJhdGhlMjhAZ21haWwuY29t
Disclaimer: All claims expressed in this article are solely those of the authors and do not necessarily represent those of their affiliated organizations, or those of the publisher, the editors and the reviewers. Any product that may be evaluated in this article or claim that may be made by its manufacturer is not guaranteed or endorsed by the publisher.
Research integrity at Frontiers
Learn more about the work of our research integrity team to safeguard the quality of each article we publish.