
94% of researchers rate our articles as excellent or good
Learn more about the work of our research integrity team to safeguard the quality of each article we publish.
Find out more
ORIGINAL RESEARCH article
Front. Plant Sci., 14 July 2022
Sec. Technical Advances in Plant Science
Volume 13 - 2022 | https://doi.org/10.3389/fpls.2022.942110
This article is part of the Research TopicAdvances in Computer Vision and Artificial Intelligence Techniques for Multi-View, Multimodal Plant Phenotyping Analysis Using Time-Series ImageryView all 6 articles
Drought-rehydration irrigation has an enhancing impact on rice yield, but the current research on its yield-increasing effect is mainly experimental and empirical, lacking mechanism theoretical support. Image-based machine vision is rapidly developing and can estimate crop physical and chemical properties. A novel image processing method has been purposefully carried out to detect the real-time response shape of rice drought-rehydration. By application of this method, two new types of morphological descriptors were proposed to characterize and quantify the vertical phenotypic heterogeneity of rice, in which the relative height of the plant centroid (RHC) locates the growth focus, while the leaf angle distribution model describes the vertical characteristics of the leaf phenotypic traits. We verified the response of the vertical traits to different water treatments through designed experiments. The results showed that the RHC and leaf angle distribution parameters followed divergent trends under water stress, reflecting the drought characteristics of rice at different growth stages. The newly developed indicators were sensitive to drought response at specific growth stages and also efficient for evaluating rice growth, including determination of radiation interception capacity and assessment of nutrient accumulation. Furthermore, through the measurement and analysis of vertical structural traits, we found that a short-term water deficit and reasonable rehydration during the rice heading period could help to extend the spike-growing time and improve photosynthetic efficiency, thus benefiting yield formation.
As one of the most important grain food in China, rice contributes 31% of the total output of food crops by utilizing 26% of the cultivated acreage, thus rice plays a critical role in ensuring food security in China (Tester and Langridge, 2010; NBS, 2021a,b). Another aspect is that rice is more water-consuming and has low water and nitrogen use efficiency compared with other cereal crops (Bouman et al., 2007; Jin et al., 2016; Liang et al., 2021). To improve rice growth, the least costly and environmental-friendly initiative is the optimization of irrigation strategies, also known as water-saving irrigation (Mao, 2002). The alternating wet and dry pattern of water control improves water productivity and nitrogen utilization in rice, reinforces drought tolerance traits in intergenerational genetics, and ultimately increases yield and quality (Belder et al., 2004; Cui et al., 2004; Cheng et al., 2006; Thakur et al., 2014; Pei et al., 2015; Luo et al., 2019). Previous studies have shown that alternating drought and rehydration cultivation environments can cause significant changes in rice yield components including total grain number and seed setting rate (Gao et al., 2019). Intermittent water-saving irrigation can vary shoot vigor, reshape root traits, and lead to changes in N, P, and K uptake rates during the rice growth period (Huang et al., 2019, 2021). An appropriate level of water deficit has a facilitating effect on rice growth, but how to evaluate the intrinsic mechanism of this enhancing function and how to identify the optimal level of drought to avoid yield reduction are the main concerns of water-saving irrigation models for rice (Kang et al., 2021).
Phenotyping traits analysis is an important approach to study the water consumption of rice and analyze its adjustment regulation in coping with drought. It not only provides an efficient tool for the extraction of crop information but also establishes a cross-disciplinary bridge between genomics, environments, and agricultural management (Walter et al., 2015; Ji et al., 2018; Pieruschka and Schurr, 2019; Aasen et al., 2020). Previous studies showed that some phenotypic parameters on a plant scale such as a dark green color fraction, leaf morphology, and leaf size can effectively identify the occurrence of water stress (O’Toole and Cruz, 1980; Briglia et al., 2019; Cal et al., 2019). Since phenomics plays an important role in stress-related research on rice, it is critical to obtain morphological traits of rice and evaluate the response of phenotypic indicators. Accurate phenotype trait measurements require time-consuming and laborious manual work, and destructive sampling is prohibitive for continuous observation. Recently, the method based on digital image analysis seems to be an effective and reliable method for the measurement of rice phenotype. Image-based phenotyping measurement is not only about “taking pictures” but also about analyzing the interaction between plant pixels and light and shadow in the images (Li et al., 2014), which digitizes and extracts the response of rice to the real-world environments into the matrix of pixel cells. Several stress-sensitive visual indicators can be extracted from images of crops taken from a certain viewing angle or multiple dimensions (Moshou et al., 2014; Anshori et al., 2018; Laraswati et al., 2021). To determine the progression of senescence (maturity) and water deficit status of the plant quantitatively, some color index (CRI) is derived by partitioning pixels into green and non-green groups and calculating the color space characteristics. Besides, the analysis of the pixel number and area enables the estimation of the plant biomass ratio, which is useful for the assessment of plant growth status under stress (Petrozza et al., 2014; Malinowska et al., 2017; Zhuang et al., 2017; Mohan and Gupta, 2019). From a holistic perspective, image-based phenotypic traits that combine color, size, and structure can express richer information about crop physiology and are explanatory for the mechanism of crop response to water stress. As a representative study, Duan et al. (2018) propose four visual features from RGB images of individual rice, which are proved sensitive to the imposition of drought at different growth stages.
In addition to a single indicator, the combined analysis of multiple sources of phenotypic data can provide a more comprehensive description of the water physiological condition of the plant (Chen et al., 2014), which made more reliable and interpretable conclusions to assess the effect of rice environmental stress on phenotyping traits. In this paper, we developed a vertical distribution form of phenotypic traits to describe the overall rice (and possibly generalize to other crops) characteristics and its response to different water stress levels based on image visual technology.
The transfer and interception of photosynthetically active radiation (PAR) in the plant canopy is a top-to-bottom vertical movement, while the transport and absorption of nutrients and water in plant growth are dominated by a bottom-to-top vertical process. Thereby, the physiological and morphological traits of crops form distributional differences in the vertical direction (Song et al., 1997). The heterogeneity mutates following certain regulations under the stress of the external environment as well. It was shown that the chlorophyll content of the plant is unevenly spread over the vertical profile as influenced by the internal light distribution in the canopy, which could be expressed by the spectral reflectance (Barton, 2001; Ciganda et al., 2008). Likewise, the leaf nitrogen content (LNC) in the horizontal layers varies across different heights of the canopy, and the response of LNC to soil nutrients also differs at different nutrient stress levels (He et al., 2020). Externally, the vertical morphology of congeneric crops has similar genetic attributes and specific patterns. Some structural indicators, including leaf size, leaf angle, branch number, etc., conform to certain distribution formulas. Information regarding leaf area (LA) index vertical distribution is helpful to analyze the effect of canopy structure on photosynthetic ability and dry matter accumulation (Hirooka et al., 2018). Suitable vertical heterogeneity distribution of LA optimizes light transmission path, improves PAR interception efficiency, and enhances aeration at the canopy levels. Moreover, it notably avoids oversaturation of radiation in the upper part of the plant and undersaturation in the lower part. Phenotypic heterogeneity of high-yield varieties has high heritability and can be a dominant morphological trait in generational selection (Li and Wang, 2013; Perez et al., 2019). The existing problem is how to qualify the phenotypic vertical heterogeneity of plants, in the form of a single index or expression with several parameters. The practice was pioneered in the field of forestry. Branch, crown vertical LA distribution models have been developed for the broadleaf forest to find species-specific differences based on right-truncated Weibull distribution models (Nelson et al., 2014). Studies on maize used a simplified form of the bell-shaped function to describe the relationship between leaf rank and LA (Fan et al., 2020).
However, there were few studies on the vertical phenotype of rice response to environmental stress. On the one hand, since the single plant morphological traits of rice are complex with a large number of tillers and leaves, it is difficult to generalize the characteristics from digital images. On the other hand, data were scarce for research on the vertical phenotype of rice due to the time-consuming and intermittent drawbacks of traditional observation methods. Therefore, in this paper, we proposed a simple and efficient visual analyzing method for the study of phenotypic traits, which combined a computer vision algorithm with vertical phenotyping analysis. By designing experiments with different water stress levels, this paper aimed to understand the response of rice vertical phenotypic distribution traits to changing soil water conditions. The results of the experimental analysis can be applied to interpret the physiological functions of vertical morphology of rice under changing water conditions in soil and thus understand the adjustments made in appearance morphology when rice encounters external stresses. The main objectives of the paper were to (1) develop a novel image processing and data interpretation method for analyzing the vertical heterogeneity of rice canopy, (2) propose several statistical indicators to quantitatively represent the vertical distribution of structural phenotypes and identify the stress-sensitive factors involved, and (3) compare the correlation between the proposed indicators and the rice growth status and evaluate their indication capacity of the effect of water stress.
Experiments with different water stress levels were conducted at the Irrigation and Drainage Experimental Site of State Key Laboratory of Water Resources and Hydropower Engineering Science, Wuhan University (114°37′E, 30°54′N). The rice seedlings were cultivated in Jingmen, Hubei, on 31 May 2021, and transplanted in experimental pots on 1 June, which have an inner diameter of 20 cm and a depth of 25.5 cm. Two rice seedlings were transplanted into each pot. The rice for experiments was a kind of indica two-series hybrid rice, with a seedling age of about 30 days and a total fertility period of about 140 days. The pots were filled with 6.4 kg of air-dried soil that passed through a 2-mm sieve, and the measured soil bulk density was about 1.2 g.cm3. In this study, we artificially regulated the degree of water stress by controlling the soil moisture content (SMC). Before the experiments, the soil retention curve was fitted by measuring soil water potential and SMC at different soil saturation levels. In addition, the parameters of soil for experimental cultivation were provided in Supplementary Table 2.
By design, the soil water potential subjected to mild drought stress was maintained between -20 and -10 kPa (80% of field capacity), while severe drought stress was between -35 and -25 kPa (60% of field capacity). We monitored SMC roughly by weighing the pots every half-day and determined the current soil water potential value based on the soil water retention curve measured in advance. When observing that the negative soil pressure dropped to the lower limit of the design, we replenished the appropriate amount of water to keep the predesigned soil water potential.
During the whole growth period of rice, we designed three water treatment groups, one for flood irrigation treatment (WF), i.e., always keeping a shallow water layer of 5–50 mm, one for mild drought stress (WM), and another group was for severe drought stress (WS). The drought process started from the 25th day after transplanting (25th June) until maturity for harvest.
To understand the pattern of water consumption and response to water stress in rice at different growth stages, we set up drought treatments at the heading stage (HS) specifically. After being observed to have entered the specified growth period, the potted plants began to drain and dry until SMC was reduced to a set level and resumed flood irrigation by the end of the period. Figure 1 showed an overview of the site where the experiment was conducted and how the images of rice samples were obtained. The periodic water treatments for the four groups are illustrated in Figure 1B, and the details about the experimental design were provided in Supplementary Table 1.
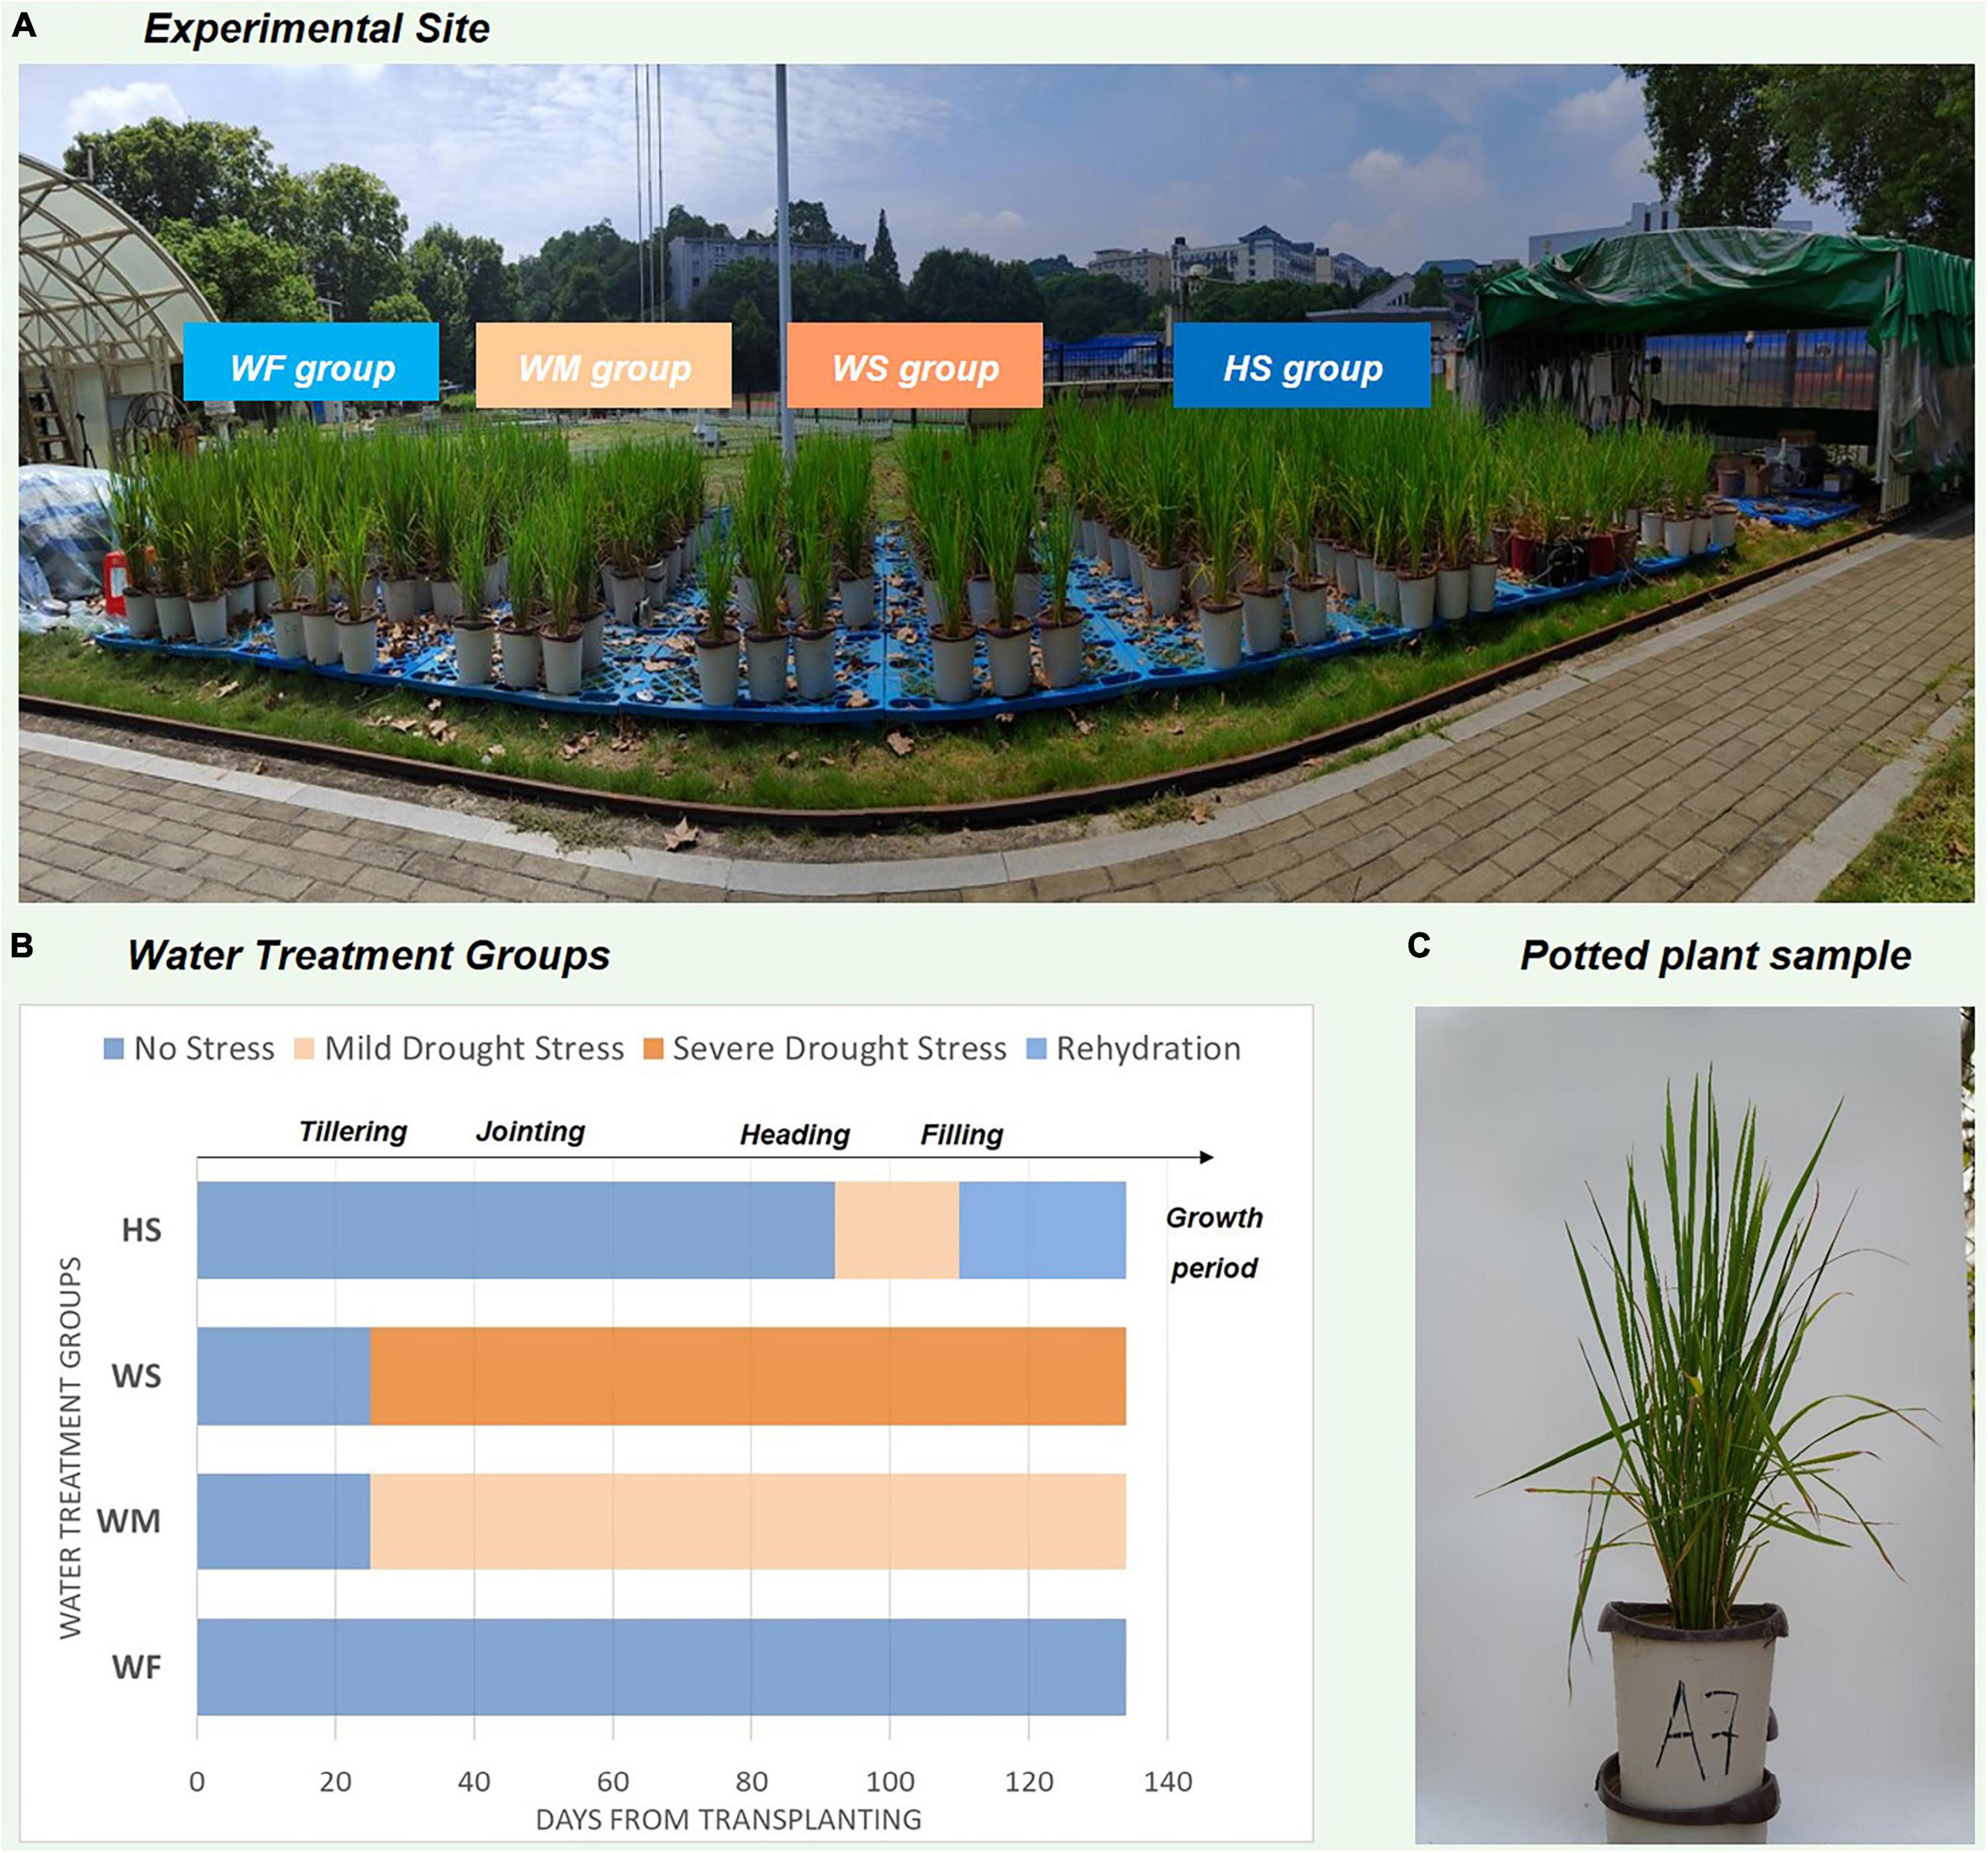
Figure 1. Description of the experiment conducted and the water treatment process. (A) Experimental site, (B) The degree and duration of water stress in different water treatment groups. The x-axis number refers to time-elapsed from rice transplanting (Jun 1st), (C) Plant sample of potted rice.
At each sampling date, we examined various physiological and phenotypic indicators of potted rice samples, including plant height (PH; measured by tapeline), PAR (measured by handle radiometer), and LA (measured by green LA scanner), biomass, and SMC, etc. Front-view images of potted planting rice were captured using a SONY a7m3 digital SLR camera with an exposure value set to 0. The shooting distance was 1.2 m ± 0.1 m. Each potted sample was oriented with the widest side (most extension side) facing toward the camera imaging side (target side). All the image thumbnails of the potted plants were provided in the Supplementary Image Series.
After the data collection and image acquisition work, the rice images were processed according to the following steps, including the calculation of the vertical phenotypic traits distributions, and the analysis of the variability of traits and the correlation between each other (Figure 2).
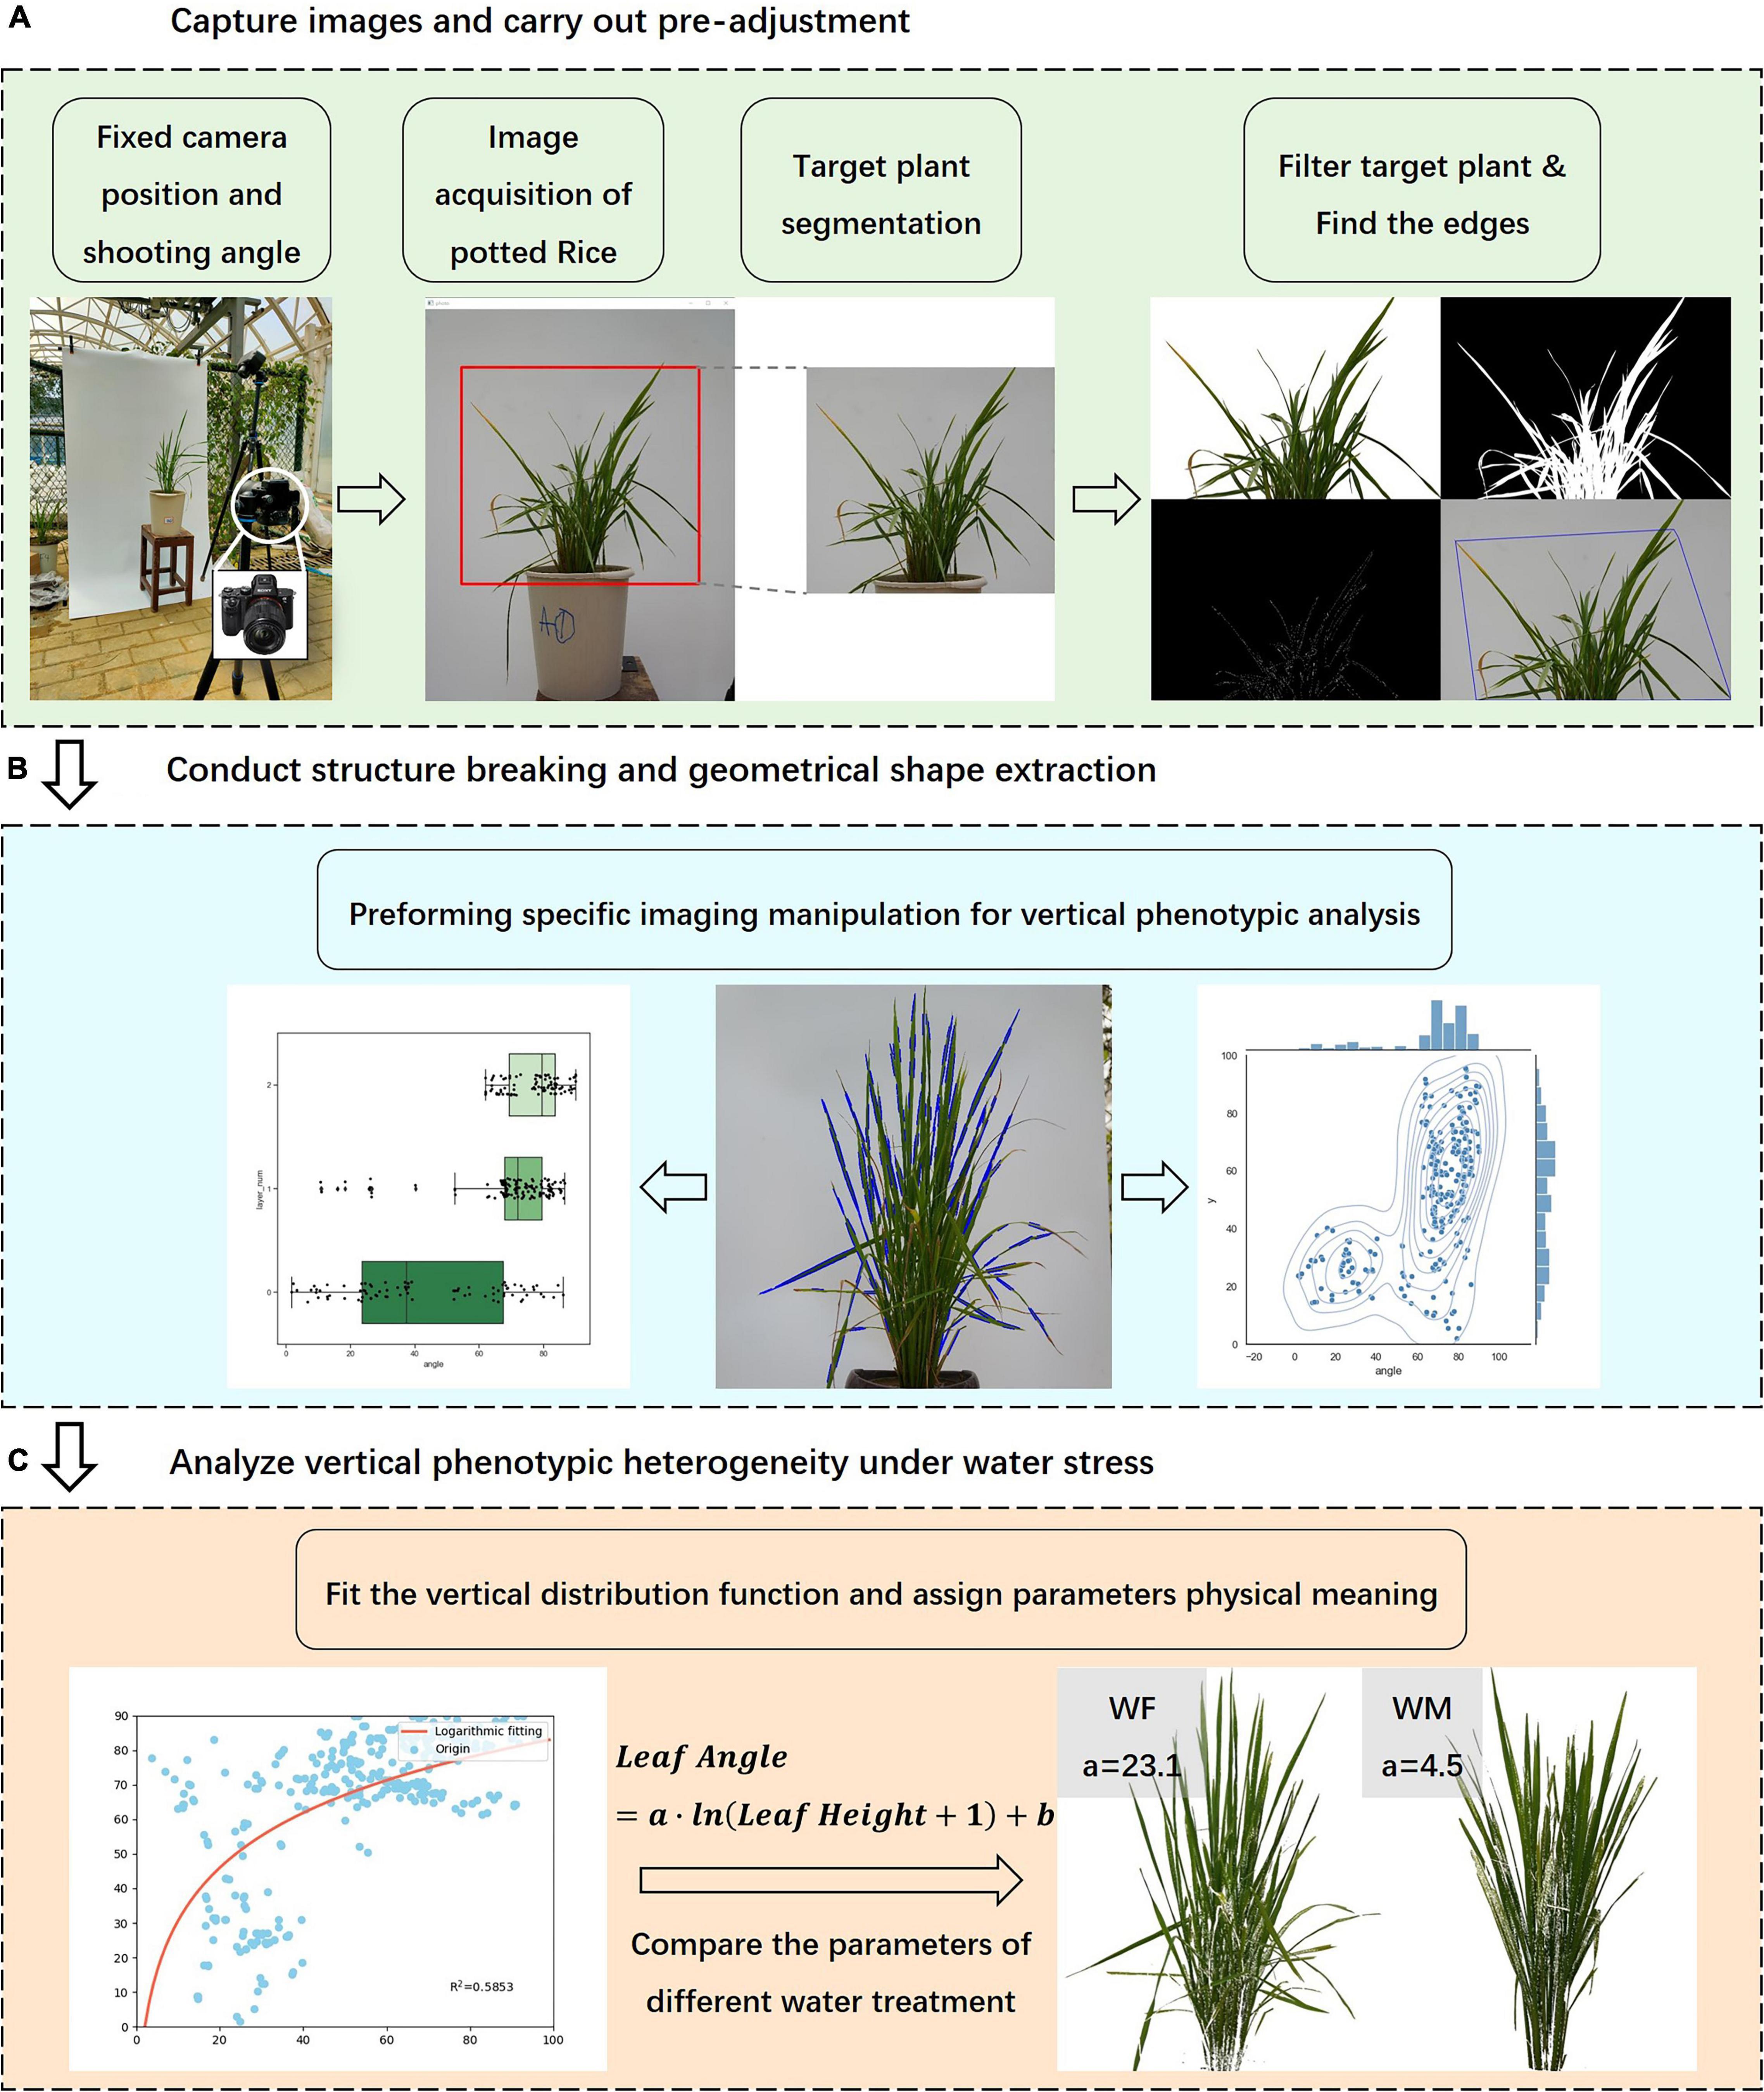
Figure 2. Experimental procedure and image data analysis process. (A) Acquisition and pre- processing of rice front- view images, (B) Extraction of the geometry of rice subjects, (C) Analysis of the characteristics of vertical traits.
(A) The pre-processing of rice images included region of interest cropping, rice subject identification and segmentation, edge detection, contour depiction, external convex hull extraction, etc. The purpose was to avoid the interference of background and clutter and to emphasize the geometric structures of the plant. The segmentation of the plant was completed by color thresholding. The cropped image was transformed to HSV color space which is more conducive to identifying green plants, and then background pixels and rice pixels were discriminated using set coupled thresholds. The boundary lines of the plant were extracted using a Canny edge detector (Thanikkal et al., 2018), and the bounding polygon was portrayed by Harris detection and the Convexhull algorithm (Hamuda et al., 2018; Wang et al., 2019).
(B) In this step, the centroid of the plant contour was located, which determined the pixel coordinates of the plant center. The plant edges were turned into line segments by the Hough transform algorithm, and the inclination of the lines was consistent with those of the leaves. Through the above operation, the plant structural morphology was reduced to a relatively simple geometric trait, preserving the three-dimensional features and facilitating the subsequent phenotypic traits calculations.
(C) Finally, we computed several phenotypic traits based on image processing results and fitted the vertical distribution function of leaf inclination angle, attributing physical significance to the parameters. These traits reflected the vertical characteristics of rice, and we were to study the physiological mechanisms of the crop under water stress by analyzing the correlation of the characteristics with rice growth status.
As with traditional phenotyping research, we measured a series of rice phenotypic traits to monitor the changes under different water stress conditions. Besides, based on digital images and computer vision techniques, we innovatively proposed independent traits and a fitting function to characterize the vertical heterogeneity of rice phenotyping traits.
In Supplementary Table 3, some of the traits have been rather maturely explored in previous studies, and while we focused on such conventional features, we proposed novel traits for analysis, which proved more efficient in indicating the growth status of rice. In addition, the raw data of the observed traits mentioned in Supplementary Table 3 were provided in Supplementary Table 4.
The independent vertical feature was the relative height of the plant centroid (RHC), which means the ratio of the distance from the center of mass of the plant to the ground to the whole PH. The definition and calculation of RHC are provided in Eq. (1).
In Eq. (1), both Centroid Height and Plant Height refer to the pixel size in the front-view image. First, the topmost and bottommost pixel points were retrieved using the filtering algorithm, and the vertical distance between the top and bottom pixels was figured out as the Plant Height (excluding drooping leaves pixels). Second, the segmented plant was transformed into a binary image mask, and the moments algorithm was used to find out the shape center position. The vertical pixel distance between the centroid and the bottommost pixel was used as the Centroid Height. Finally, the ratio of the two was defined as the RHC. Figure 3A illustrated the procedures to calculate RHC from plant images.
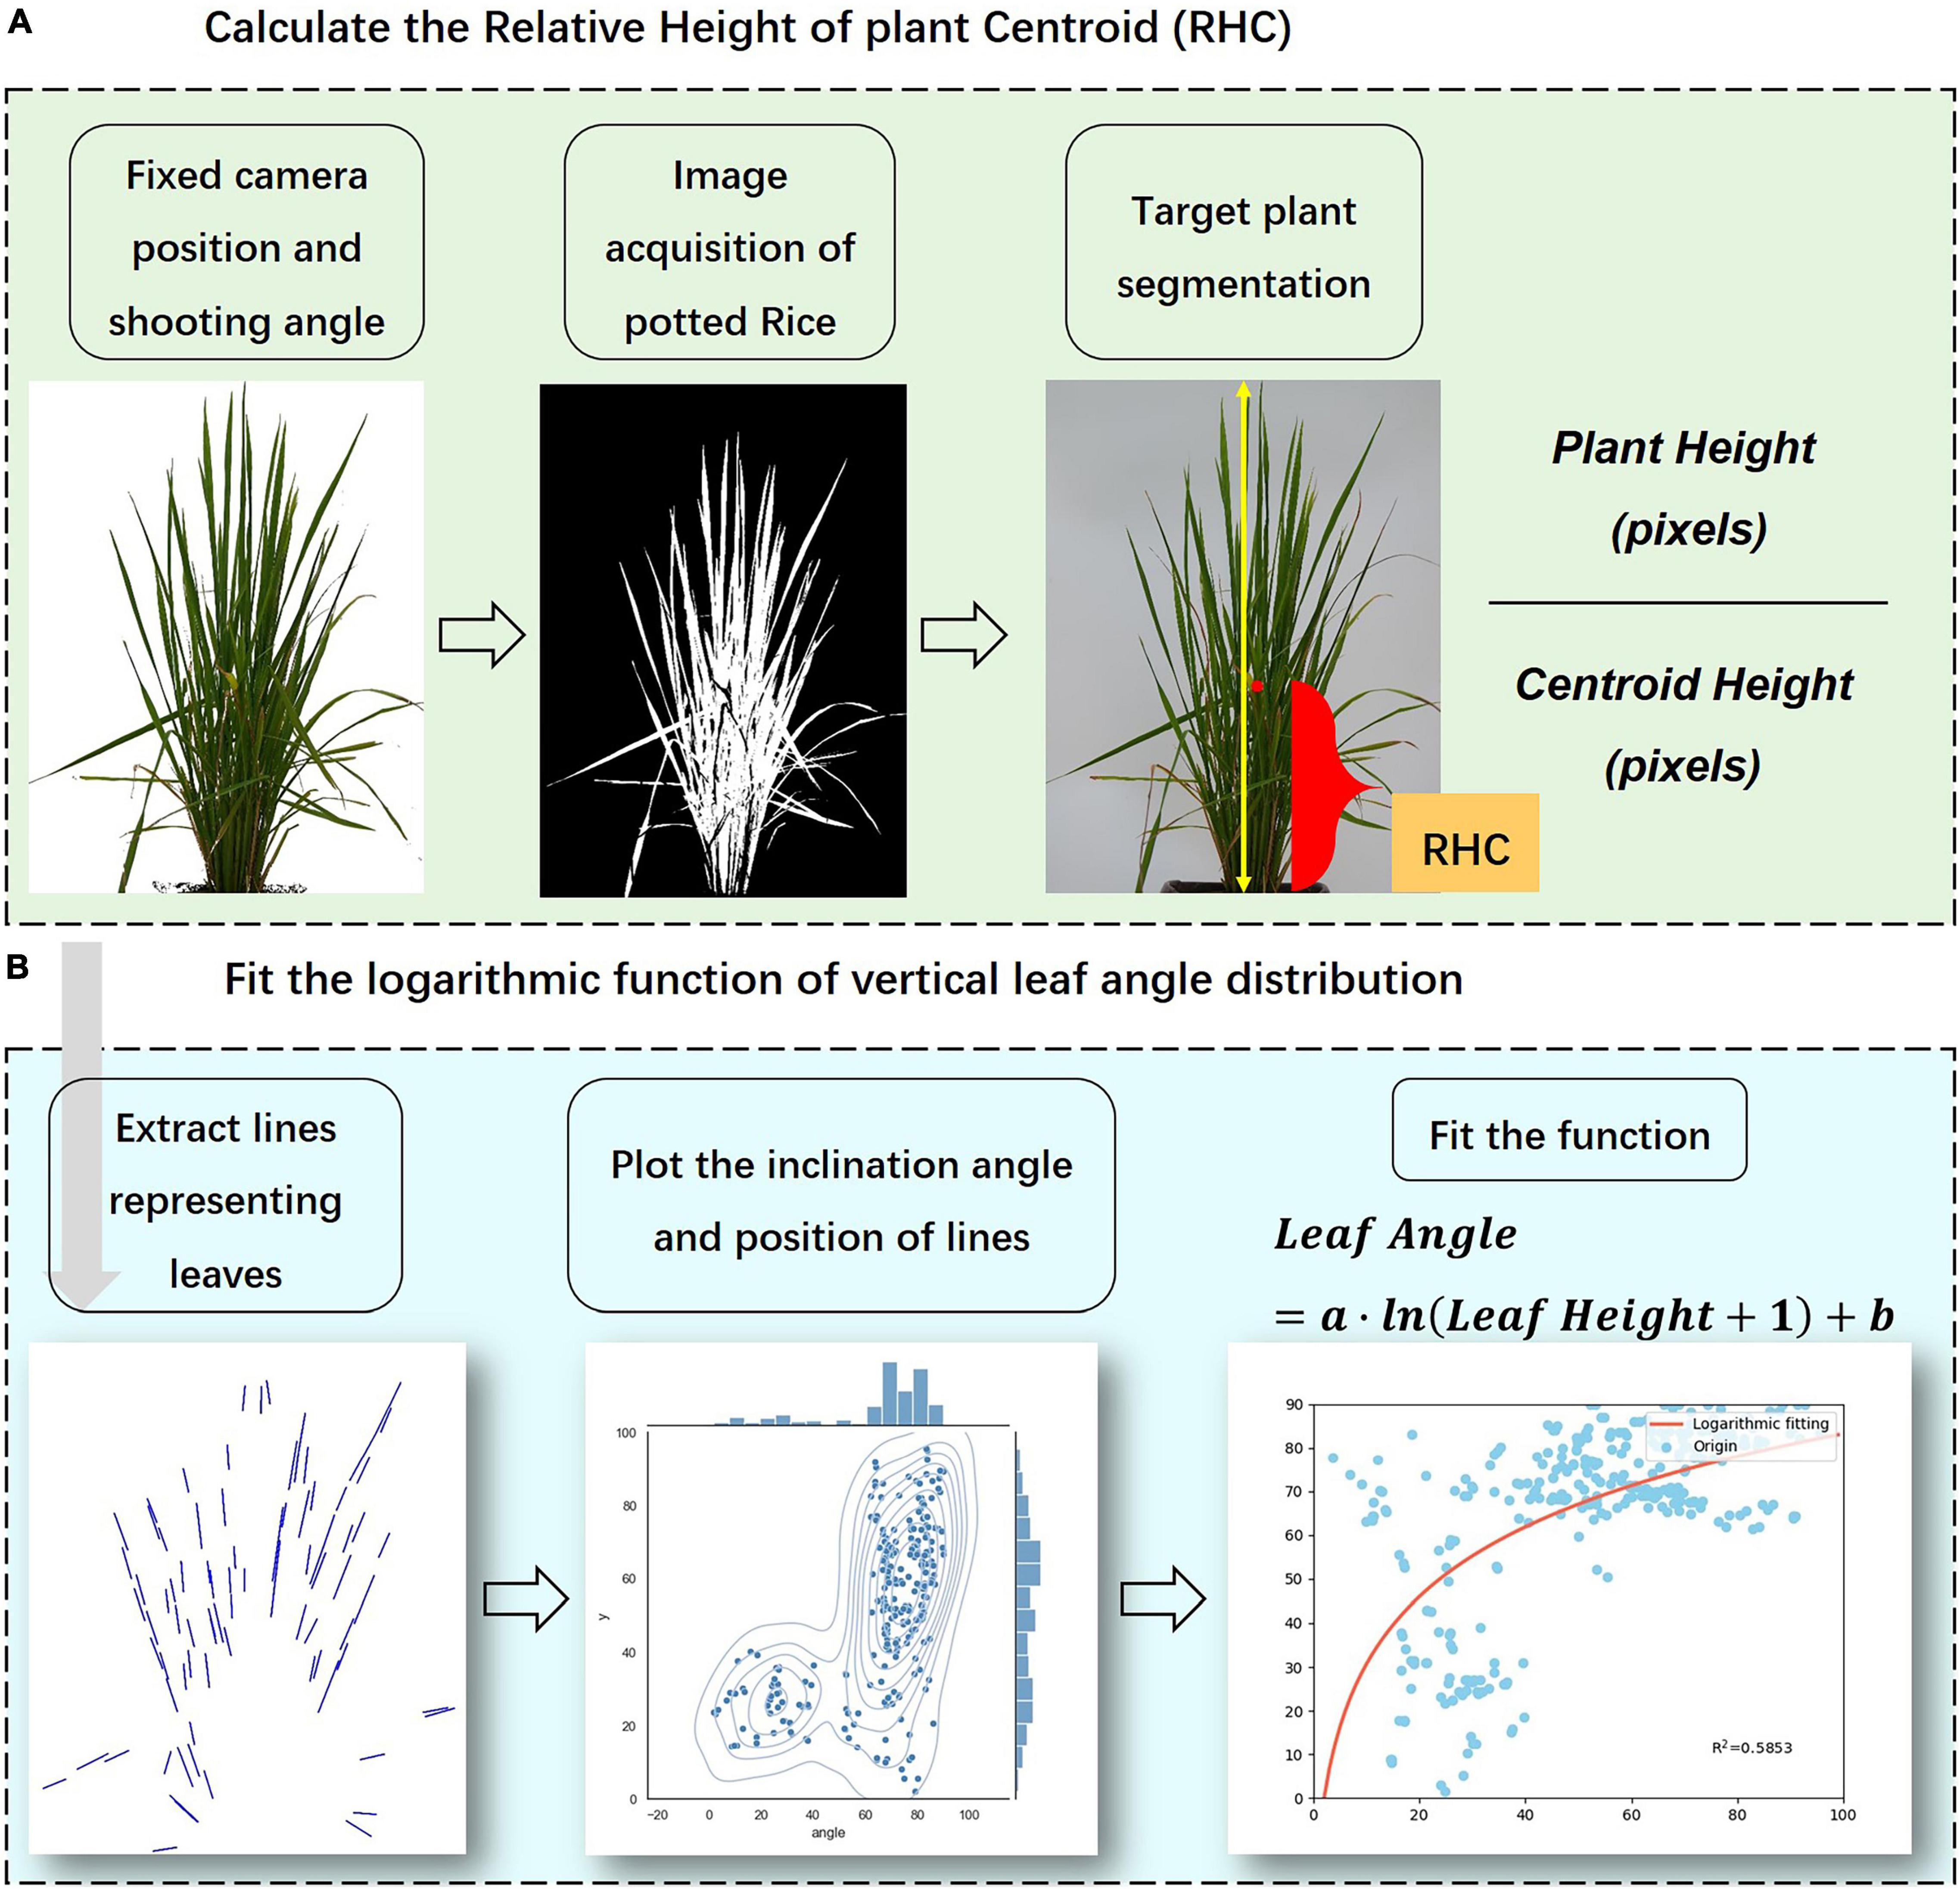
Figure 3. Calculation of the visual indicators according to image processing results. (A) Calculation of RHC, (B) Fitting of vertical distribution model.
Leaf angle is defined as the angle between the normal of the leaf outer surface and the zenith direction, numerically equal to the angle between the leaf surface and the horizontal plane (Campbell, 1990; Campbell and Norman, 1990). In this paper, we not only calculated the average angle of rice leaves (ALA) but also established the corresponding equation for the leaf angle and the leaf position to quantitatively describe the continuous vertical phenotypic characteristics of rice plants. There are two main reasons for using leaf angle as the object of research for the vertical phenotypic distribution: (1) Angular features are scaled projection invariant, so the value of leaf angle can be calculated from the front-view images precisely and non-destructively. (2) Leaf angle is one of the key traits expressing plant shape of rice, which not only directly determines leaf light exposure area to affect the interception of radiation by the canopy but also has a high contribution to rice yield (Mantilla-Perez and Salas Fernandez, 2017; Hu et al., 2019). According to the performance of experimental data, the vertical distribution of rice leaf angle showed a trend of increasing from bottom to top, and the increase slows down with the rise of relative height. This variation feature is similar to the shape of the logarithmic curve, so this paper tried to use the logarithmic function as the fitting form to describe the vertical traits of the leaf angle. Figure 3B displays the flowchart to fit the vertical distribution function of leaf angle. The data pair of leaf angle combined with its relative height was obtained and then fitted by the non-linear least squares method, obtaining the logarithmic function as shown in Eqs (2, 3):
where Al refers to the inclination angle of the leaf line, RHl refers to the relative leaf height which can be calculated by Eq. (3), and Hl refers to the distance of the midpoint of the line representing the leaf from the bottommost, PH refers to the plant height, a and b in Eq. (2) are fitting parameters influencing the shape of the curve (Figure 4). The logarithmic model is the result of a scatter fit to the leaf angle data, and the independent variable is the relative height indicating the leaf position, taking value in the range of 0–100, which is used to estimate leaf angle at different heights of the plant. First, the inclination angle of the line segments representing the leaves was calculated by image processing and skeleton extraction algorithm. These lines were retrieved by the Hough line-detection algorithm. Second, the midpoint coordinate of each line segment was considered as the value characterizing the relative vertical position of the leaf, and the relative distance to the bottommost in relation to the whole plant was computed as the RHl. Finally, after completing the calculation of Al and RHl, the paired data sets were fitted with the curve-fitting algorithm to obtain the logarithmic model parameters a and b. According to the calculation, the range of values of a was 0–20 and the range of values of b was -20 to 90 at most growth stages, thus Figure 4 shows the effects of a and b on the distribution shape. The value of a affects the rising (falling) trend of the logarithmic curve, while the value of b mainly controls the starting point of the curve (when RHl = 0). In this paper, we analyzed the response pattern of the vertical distribution model to different water stress levels, and the indication of plant growth, to verify the model’s performance in describing the vertical morphological heterogeneity of rice.
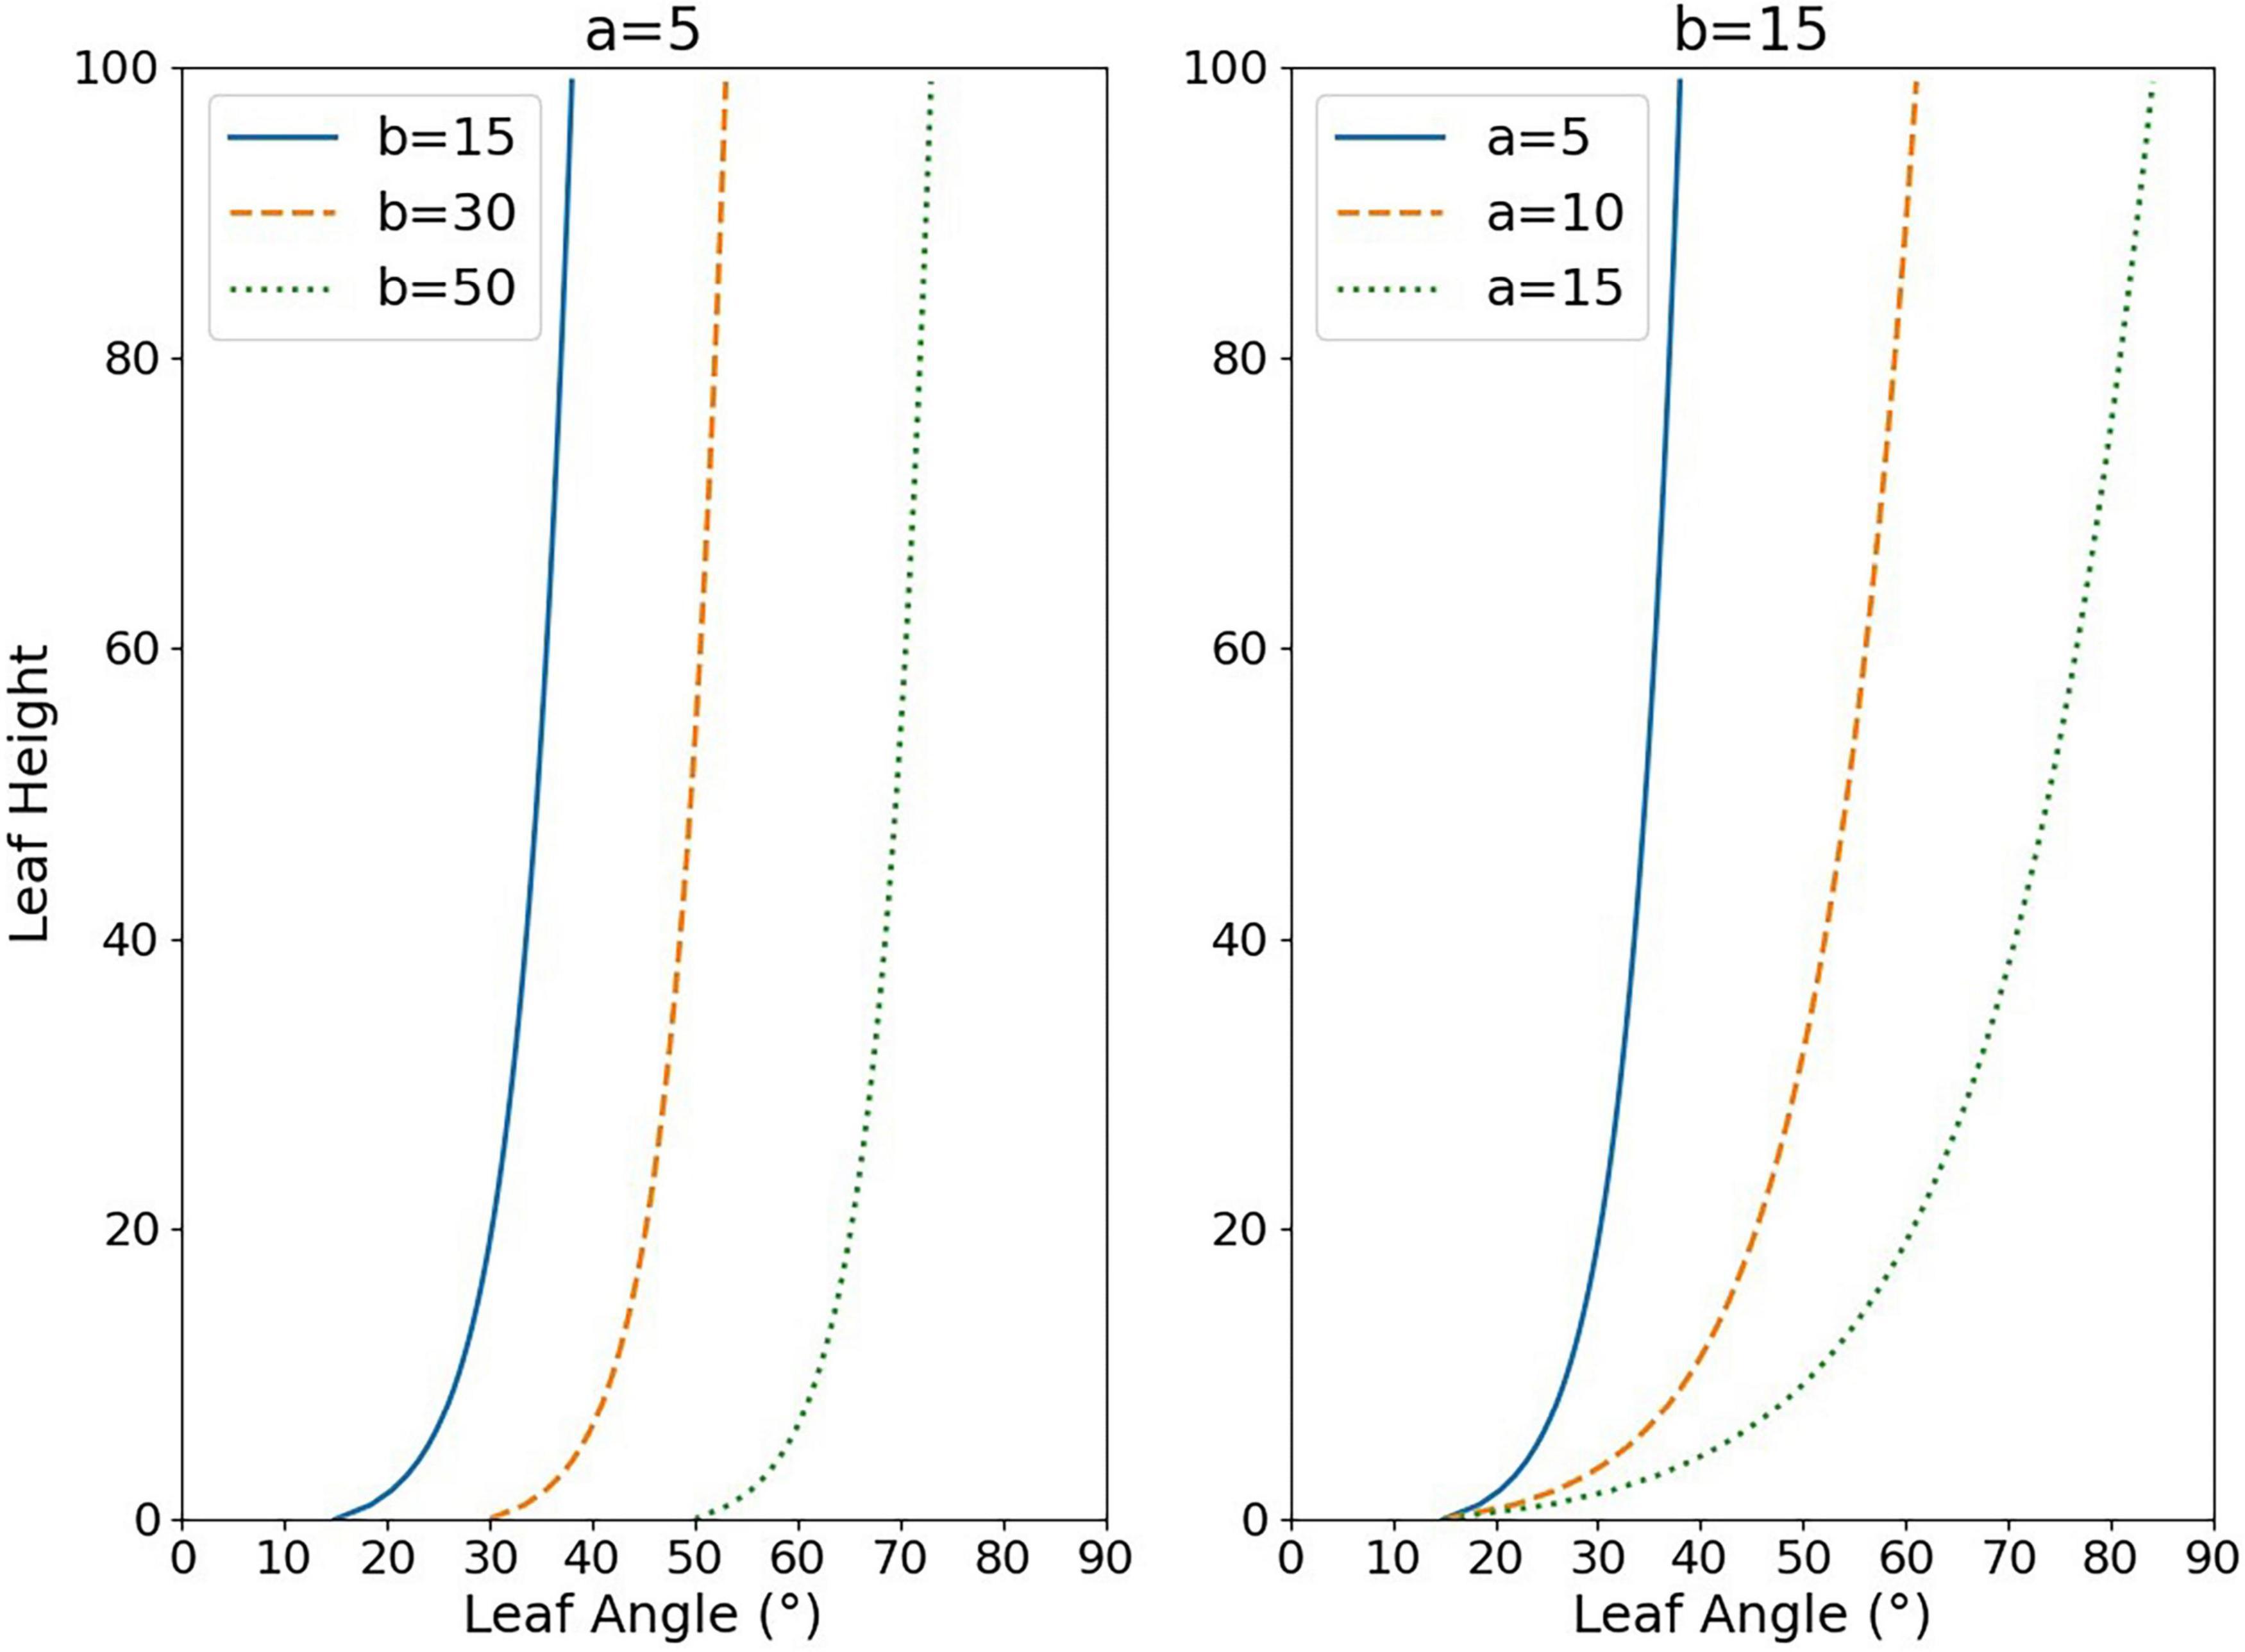
Figure 4. Effect of changes in the values of parameters a and b on the fitted logarithmic function curve shape. The y-axis represents the relative height of the leaf (RHl), while the x-axis represents the leaf inclination angle at that height position (Al).
In the analysis of experimental data, the accuracy of the phenotypic traits calculated using the computer vision method was verified by the Pearson correlation coefficient analysis, and the root-mean-square error compared with the manually measured values was calculated. The parameters a and b in Eq. (2) were fitted using non-linear regression analysis, and the correlation coefficient was used to evaluate the accuracy.
To test the response of physiological and morphological expressions to different water treatments, the one-way analysis of variance (ANOVA) with post hoc comparison using Tukey’s HSD method was applied at a 95% confidence level. In parallel, multivariate linear regression (MLR) was employed to analyze the performances of different traits combinations to indicate the growth and radiation interception capacity of rice.
The concrete results of statistical analysis in this study were provided in Supplementary Tables 5–7.
Under normal irrigation conditions (WF), both PH and average leaf angle (ALA) increased during the maturation of rice, while LA went through a process of increasing and then decreasing, as the green leaves dropped significantly after the panicles were tasseled. As shown in Figure 5, the temporal changes of PH, LA, and ALA were all affected by long-term water stress to different degrees, presenting regular variations. During long-term water stress, PH was always at a lower level (Figure 5A). Second, LA was significantly lower at the increasing stage and declined more slowly at the decreasing stage (Figure 5B). Third, ALA was higher at the early stage but by the end of the HS, the differences were not significant (Figure 5C). Moreover, Figure 5D showed that the greenness of rice declined continuously with growth.
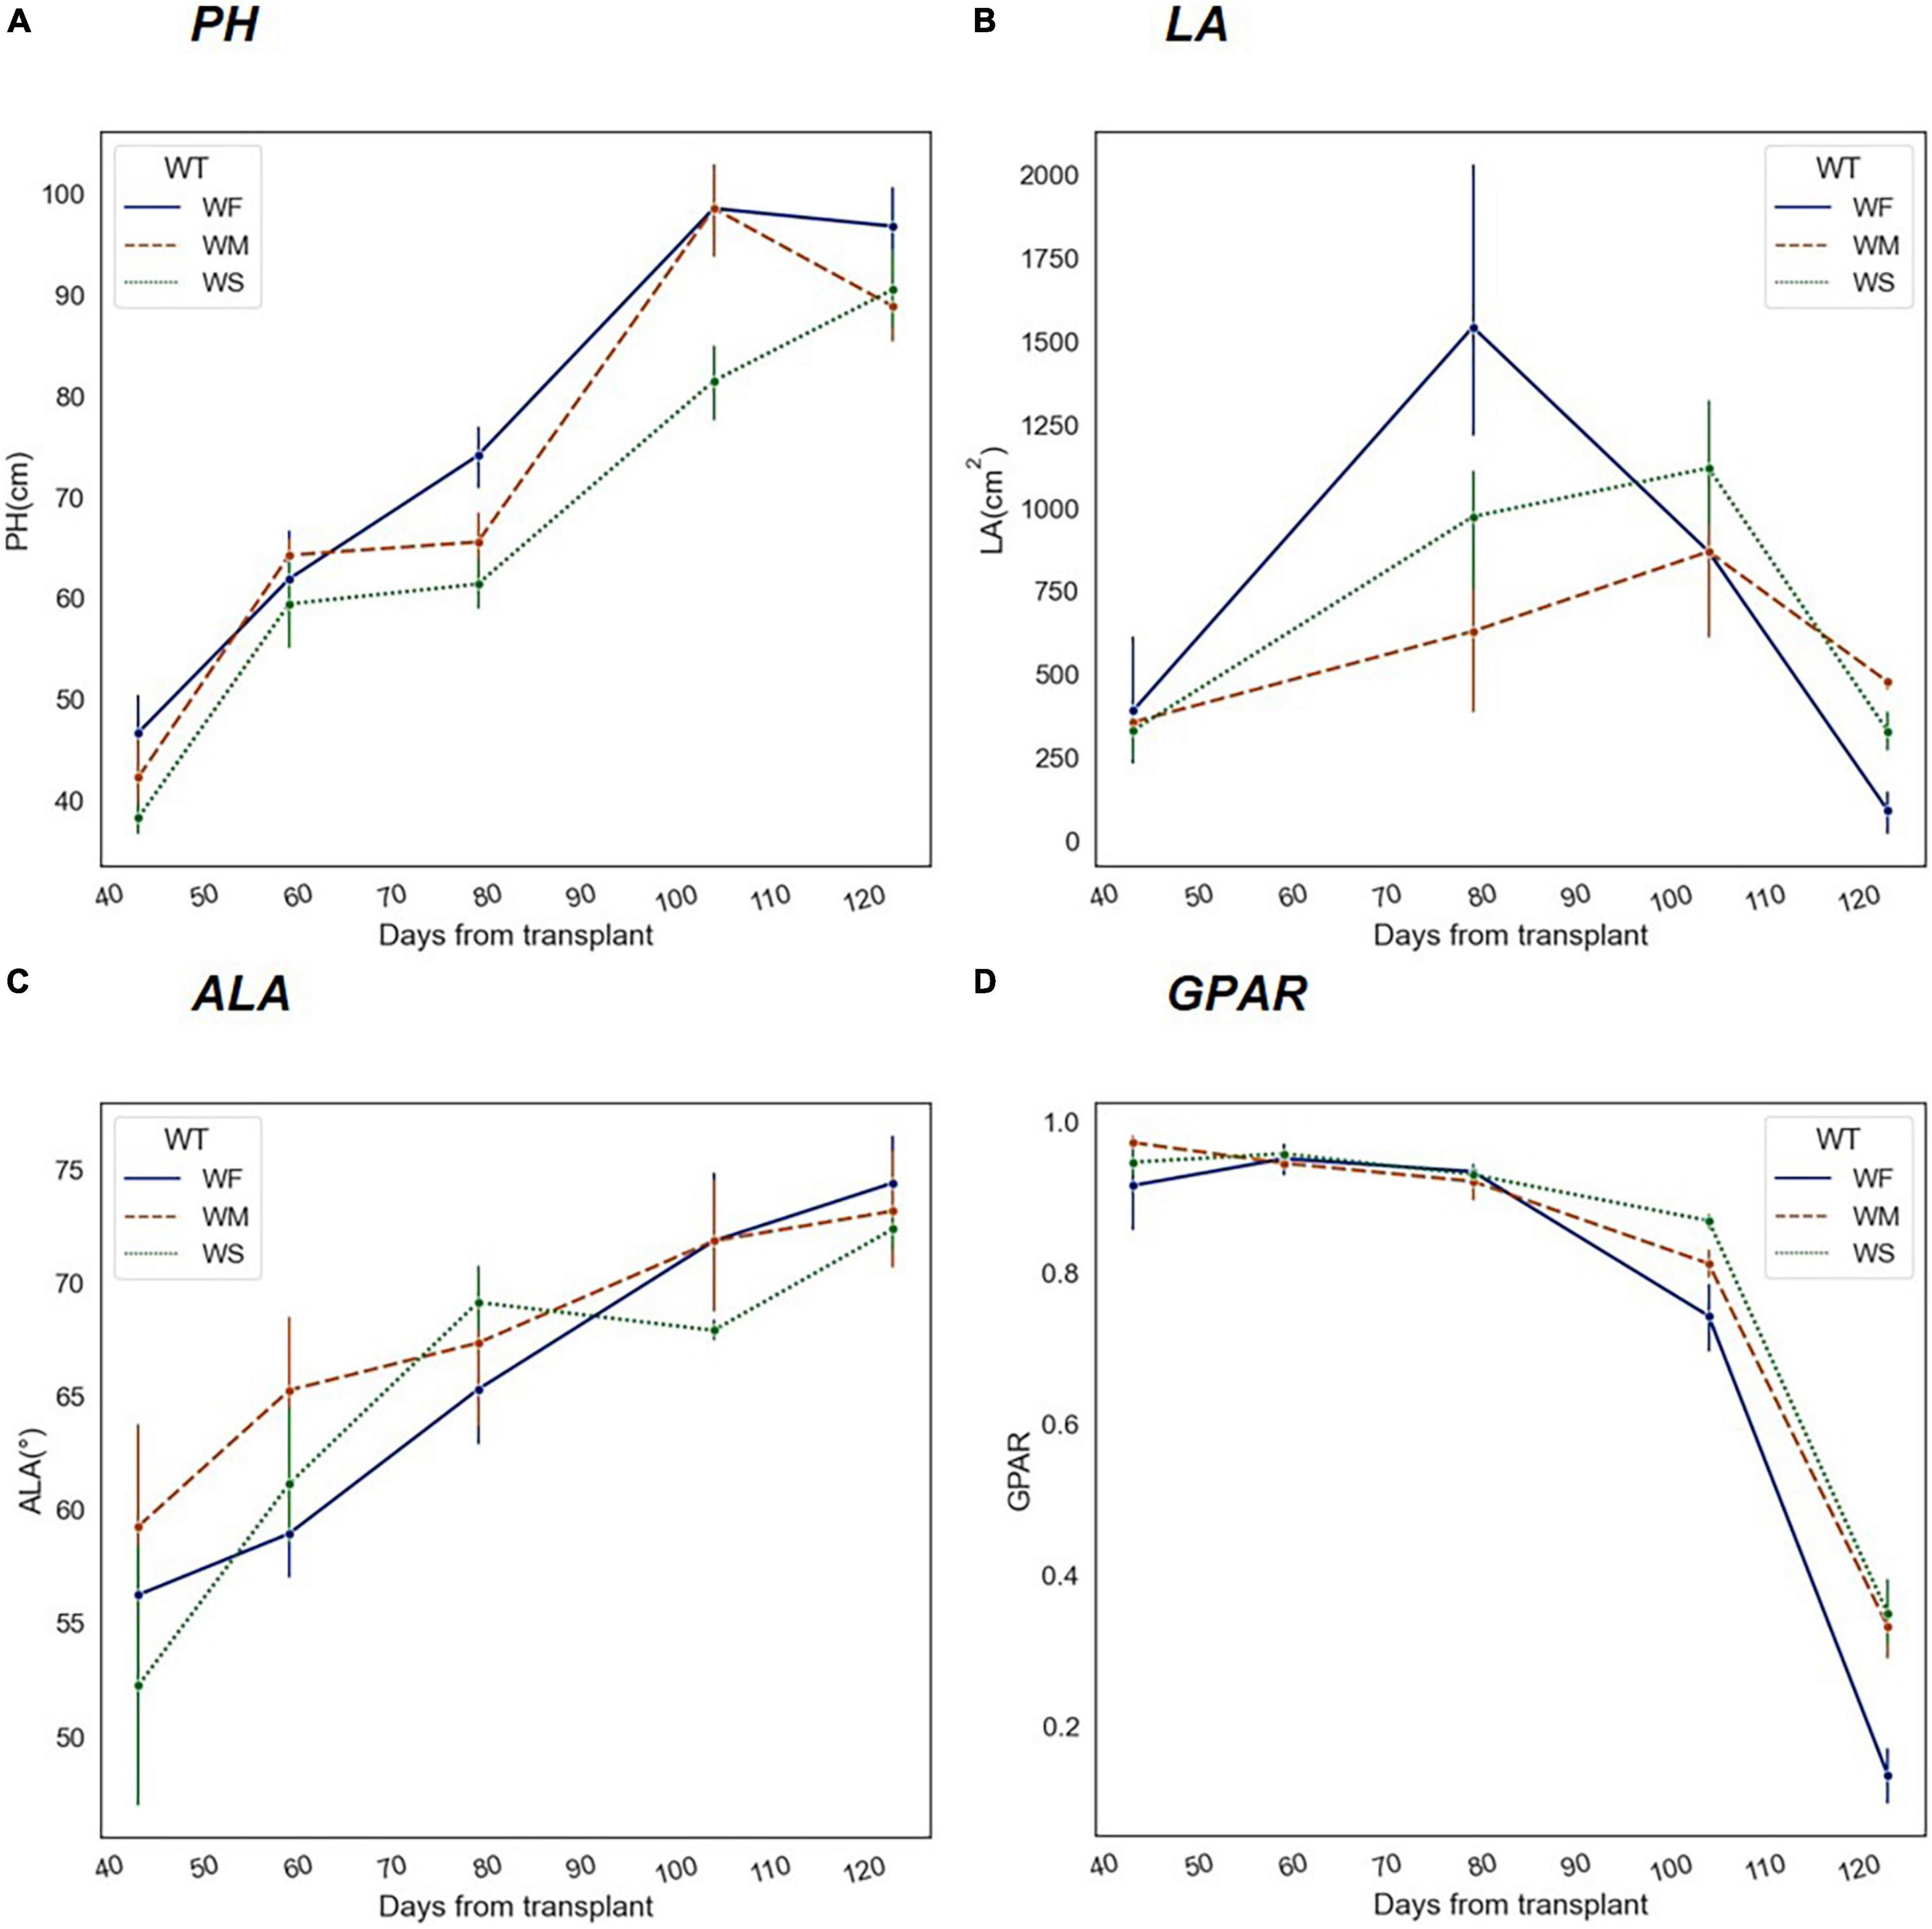
Figure 5. Trends of phenotypic traits in different water treatment groups (WF, WM, and WS) during the whole growth period. The x-axis represents the number of days experienced after rice transplanting. (A) Plant height (PH), (B) Leaf area (LA), (C) Average leaf angle (ALA), and (D) Greenness ratio (GPAR).
As shown in Figure 6A, RHC continuously increased during the whole growth period. After transplanting, the growing focus of rice shifted from underground to the surface when the root system was well developed. With the accumulation of aboveground biomass, the geometric center (i.e., the centroid) of the plant also rose. At the heading and filling stages, the increasing rate of RHC accelerated evidently until the final yield was formed.
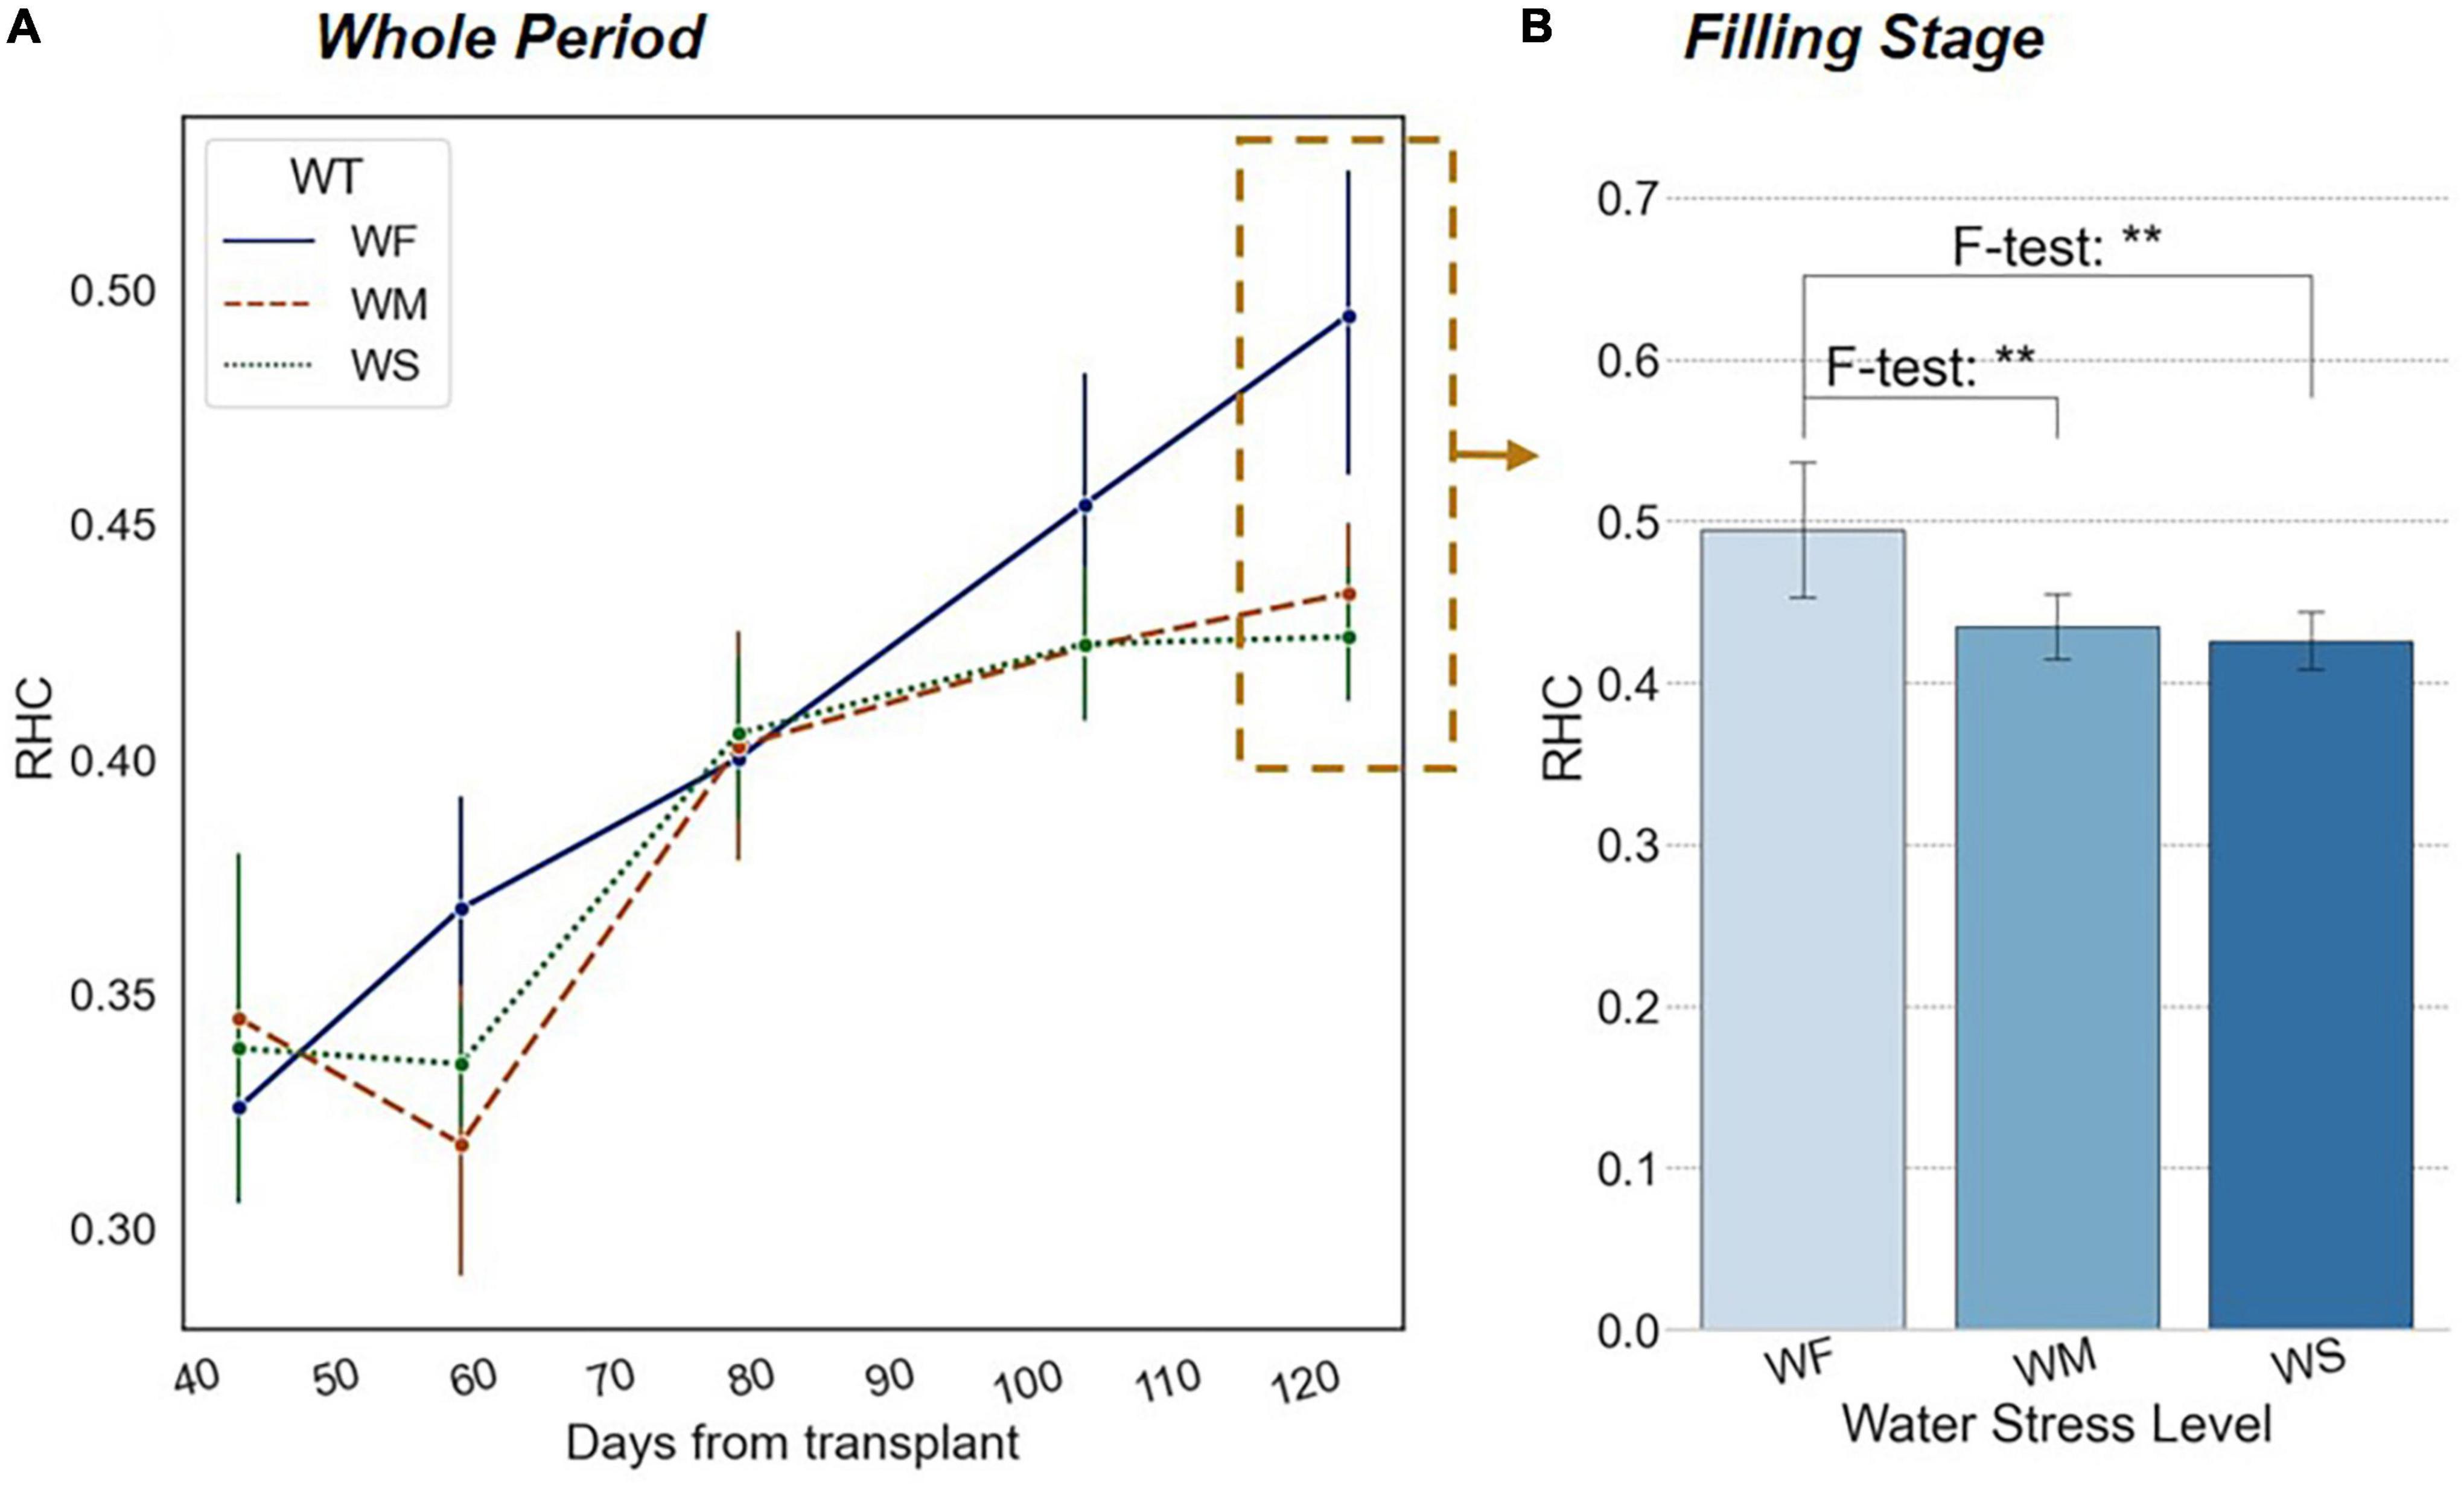
Figure 6. (A) Trends of RHC in different long-term water treatment groups during the whole growth period. (B) Significant differences in RHC among three water treatment groups at the filling stage. The x-axis represents water treatment groups. The blue bars indicate the value of RHC. The number of asterisk (*) represents the degree of the significance (p-value of < 0.05 *, p-value of < 0.01 **, and p-value of < 0.001 ***).
According to the results of the experimental groups WM and WS in Figure 6A, the increasing trend of RHC was significantly suppressed under long-term water stress. Mainly during the yield formation period, the process of rice heading, fruiting, and filling was notably delayed by water stress, thus the corresponding RHC was lower. The differences were significant in the observation at the reproductive growth stage (i.e., filling and mike-riping stage) based on a one-way ANOVA result, while multiple post hoc tests proved that the RHC values of the WF group were significantly higher than those of WM and WS groups, but the difference between WM and WS groups was not significant (Figure 6B).
It can be illustrated that long-term stress caused the decrease in the panicles number and seed setting rate, which led to the reduction in yield. The effect on rice external morphology showed a decrease in the growth rate of RHC. In contrast, during the period when nutrient accumulation was mainly carried out (i.e., tillering and jointing stage), we noticed a significant change in the vertical heterogeneity characteristics of the rice plants.
As shown in Figures 7A,B, after the rice tillering process, the spreading degree of the rice plant reached its maximum. During this period, the plant had a small leaf inclination angle, an extended LA, and a high PH growing rate. The upper leaves of the plant were biased erect and the middle and bottom leaves tended to spread out, forming an optimized shape that was narrow at the top and wide at the bottom. The above-mentioned vertical distribution pattern was conducive to radiation interception and light absorption, as well as to increasing the diurnal temperature difference and enhancing aeration in the rice canopy (Wang and Li, 2005; Springer, 2010; Xiao et al., 2021). The dashed lines in Figures 7A,B represented the results of the experimental groups WM and WS. Parameter a under long-term water stress reached its maximum at the end of the tillering stage as well, but this maximal value was much smaller than that of WF groups. The differences were proved to be significant in the ANOVA results and persisted until the HS (about 100 days after transplanting). Parameter b had a similar pattern as a. The statistical analysis results showed that the vertical heterogeneity of leaf angle was significantly affected by water stress when the rice plants were in the nutrient accumulation period of tillering and jointing within 50–100 days after transplanting (Figure 7C). It was thus clear that long-term water stress has shaped a more compact morphology of rice, and the vertical heterogeneity was lower.
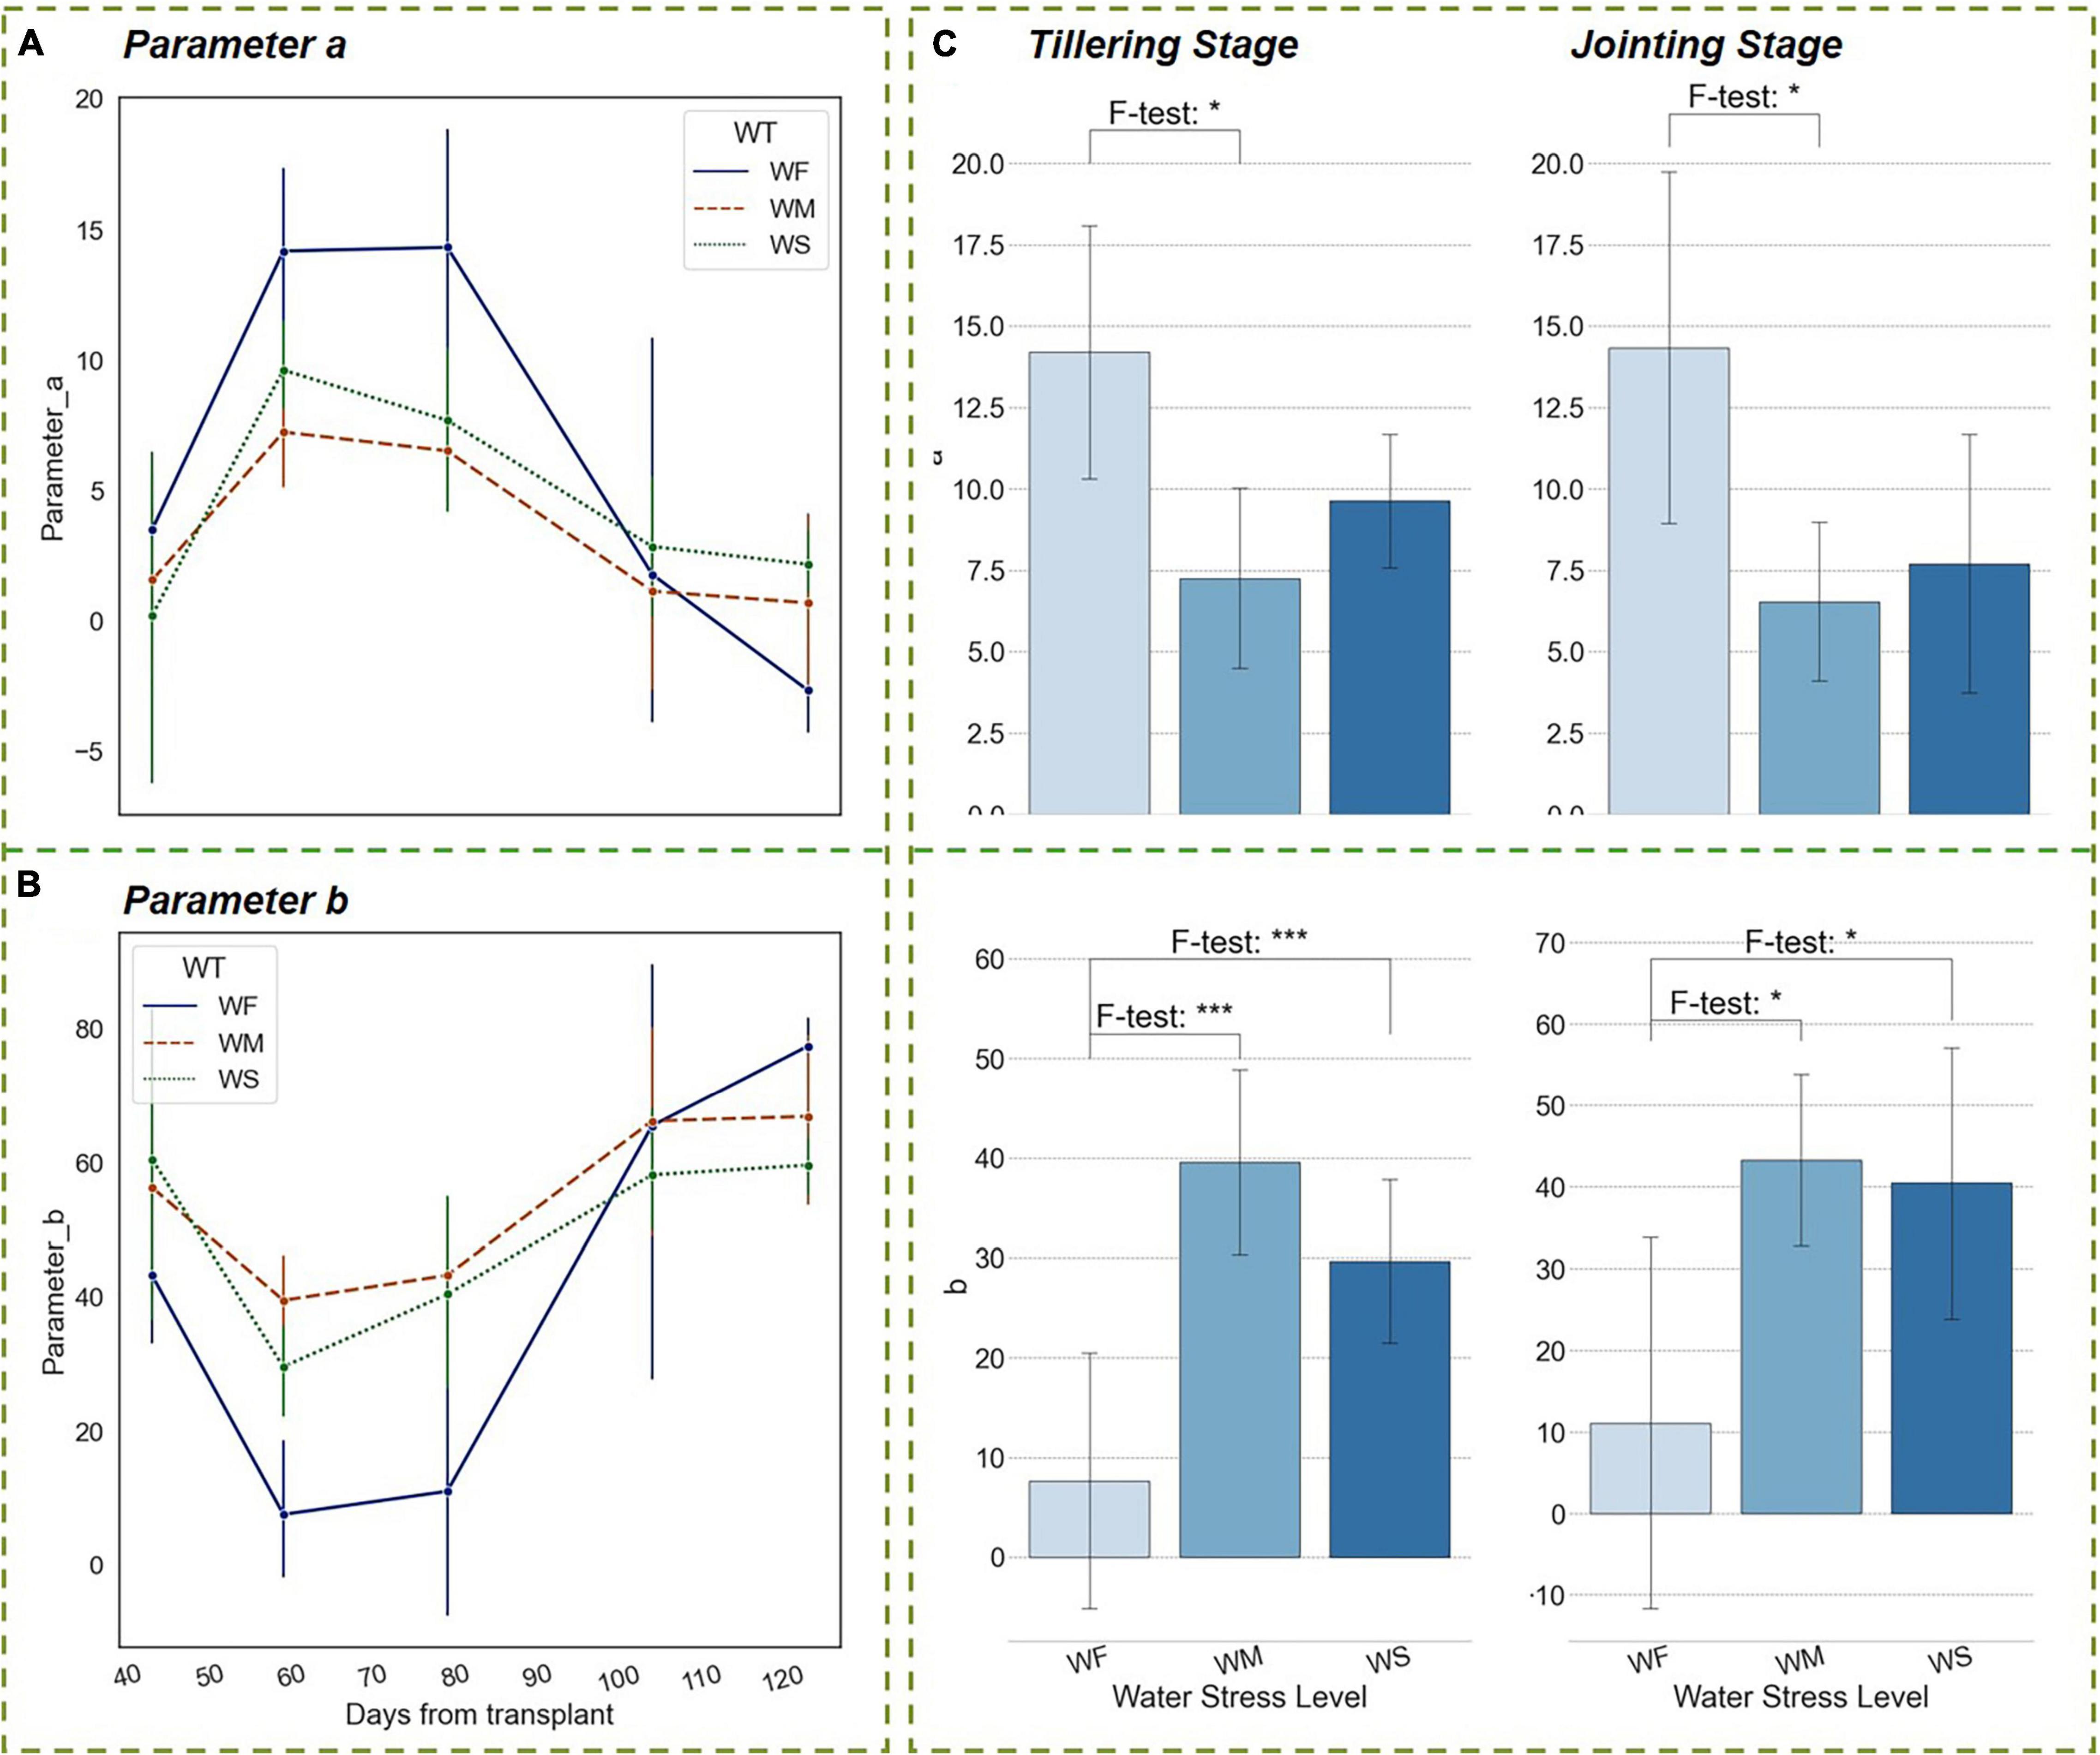
Figure 7. Trends of parameters of the vertical distribution function in different water treatment groups during the whole growth period. (A) Parameter a, (B) Parameter b. (C) Significant differences in parameters among three water treatment groups at the tillering and jointing stages. The blue bars indicate the value of parameter a or b. The number of asterisk (*) represents the degree of the significance (p-value of < 0.05 *, p-value of < 0.01 **, and p-value of < 0.001 ***).
In actual agricultural production, short-term drought is a relatively common stress situation. To verify the response pattern of the vertical phenotypic traits that we proposed to short-term water stress, a specific type of experimental group was implemented at the HS (Figure 1B).
The HS is a critical period for rice yield formation during which the rice panicle begin to emerge from the sheath until completely withdrawn (Meier, 2001). Therefore, changes in rice phenotype during this stage could visually interpret the effect of water treatments on rice growth status. Functional leaves remain erect, while ineffective tillers begin to wither, and non-functional leaves stretch or shrivel. During this period, the accumulation of above-ground biomass accelerated, and therefore the increasing rate of RHC rose, indicating that the growth focus of rice shifted upward to the panicles. When plants were subjected to short-term water stress at the HS, as shown in Figure 8, RHC values experienced a significant decrease within 1–4 days of drought onset and then continued to increase tardily after 4 days, but produced differences from normal levels, which were proved significant by the ANOVA test. This result indicated that short-term water stress leads to a lower growth focus during the rice heading process. In terms of plant physiology, the short-term drought delayed the emergence of rice panicles, and this effect prolonged the process of nutrient accumulation in rice, which improved the final yield. This was similar to the variation model of RHC in rice under long-term drought, and there was a regular response pattern of the RHC indicator for both long-term and short-term water stress, which suggested that RHC is a drought-sensitive visual feature with certain physical interpretability.
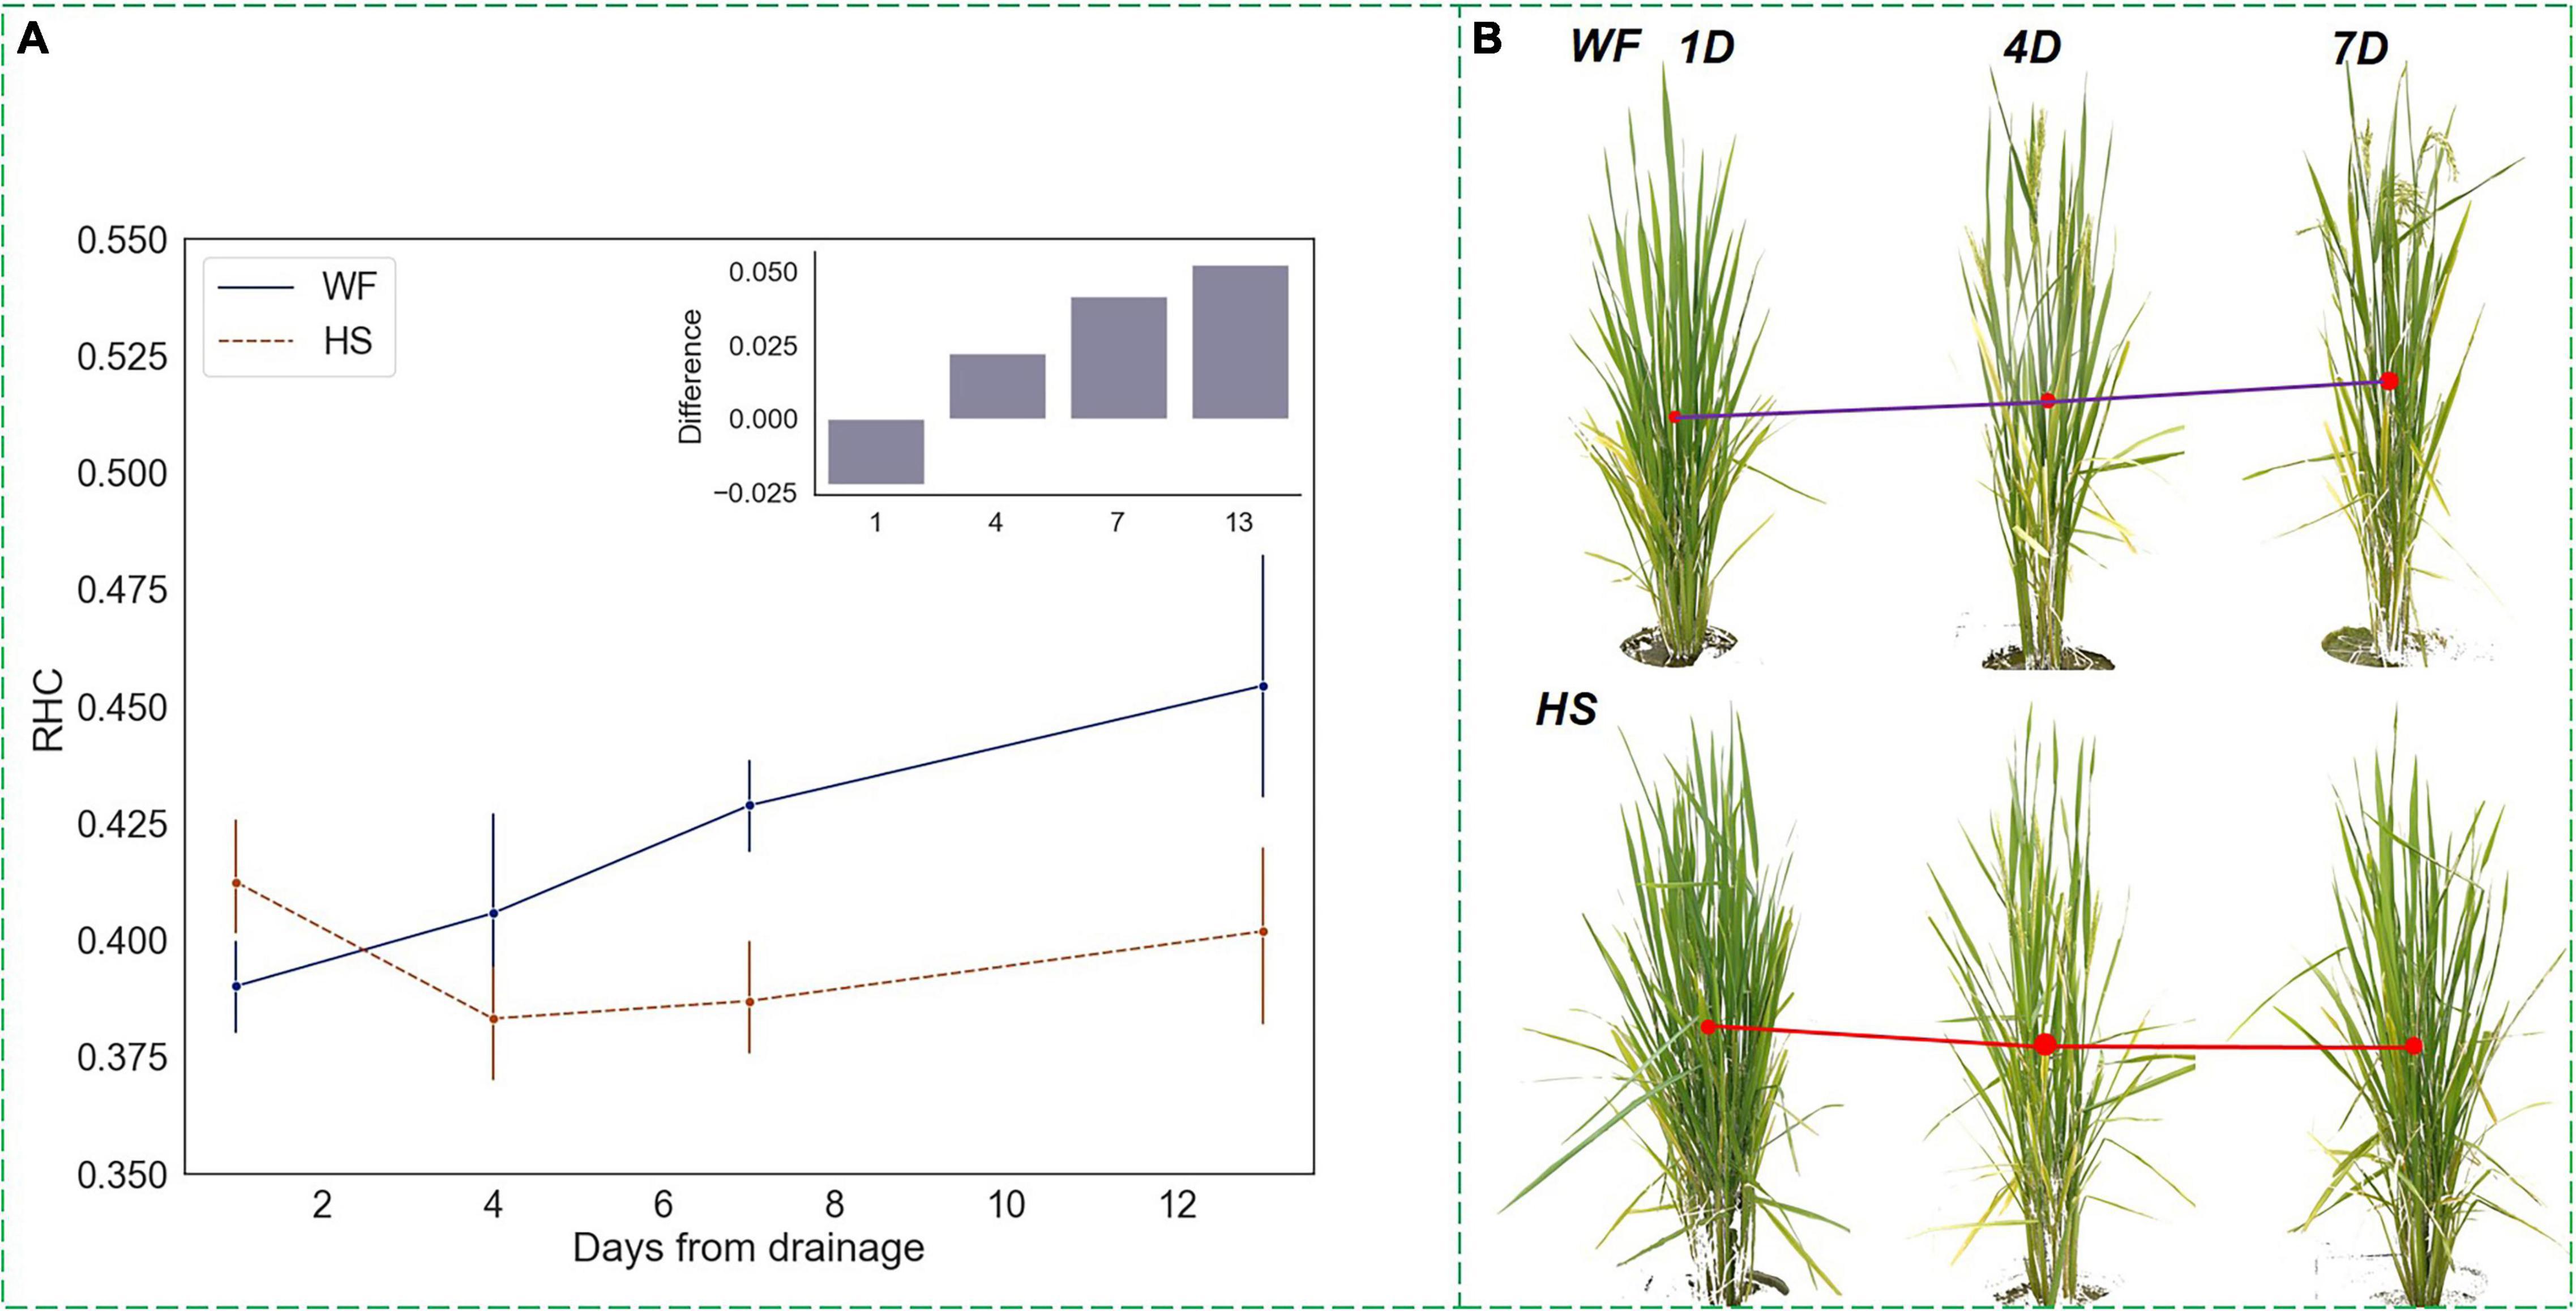
Figure 8. Changing trends of RHC under short-term water stress at the heading stage. (A) RHC trends and differences. (B) Changes in the front-view images of rice 7 days after drought. The blue line (upper) represents the RHC of plants in the WF group, while the red line (lower) represents the RHC of plants in the HS group. The y-axis of the histogram represents the difference between RHC of the WF group minus that of the HS group.
Compared to the RHC, parameters a and b had less drought sensitivity but were significantly discriminated under short-term water stress as well. As shown in Figure 9, at the HS, parameter a kept decreasing in the WF group, while parameter b kept increasing, indicating that the vertical phenotypic heterogeneity would diminish during the rice heading process. The degree of leaf spreading weakened, the difference in leaf angle between the top and bottom layers narrowed, and the plant morphological shape became more compact. However, after being subjected to mild water stress, the downtrend (uptrend) of parameters a and b became flatter, and the differences from the value of the WF group reached a significant degree when the drought proceeded to day 13, which was proved by the ANOVA test that p-value of < 0.05. Examples of front-view images of rice samples under different water treatment conditions are shown in Figure 9B. It can be seen that during the 7 days of drought lasted, parameter a was positive and the differences between the two experimental groups were not significant. However, on the 13th day of drought, when the plants in the WF group had a higher degree of tasseling, a decreased to a negative value, and the HS group maintained a higher value of a. As can be seen in the sampling images, the plants in the WF group were significantly more compact and the lower leaves were almost non-existent, while the plants of the HS group retained some of the lower leaves and had a more spread morphology. In conclusion, the results indicated that the short-term drought at the HS maintained a high heterogeneity in rice vertical morphology rather than causing it to diminish rapidly.
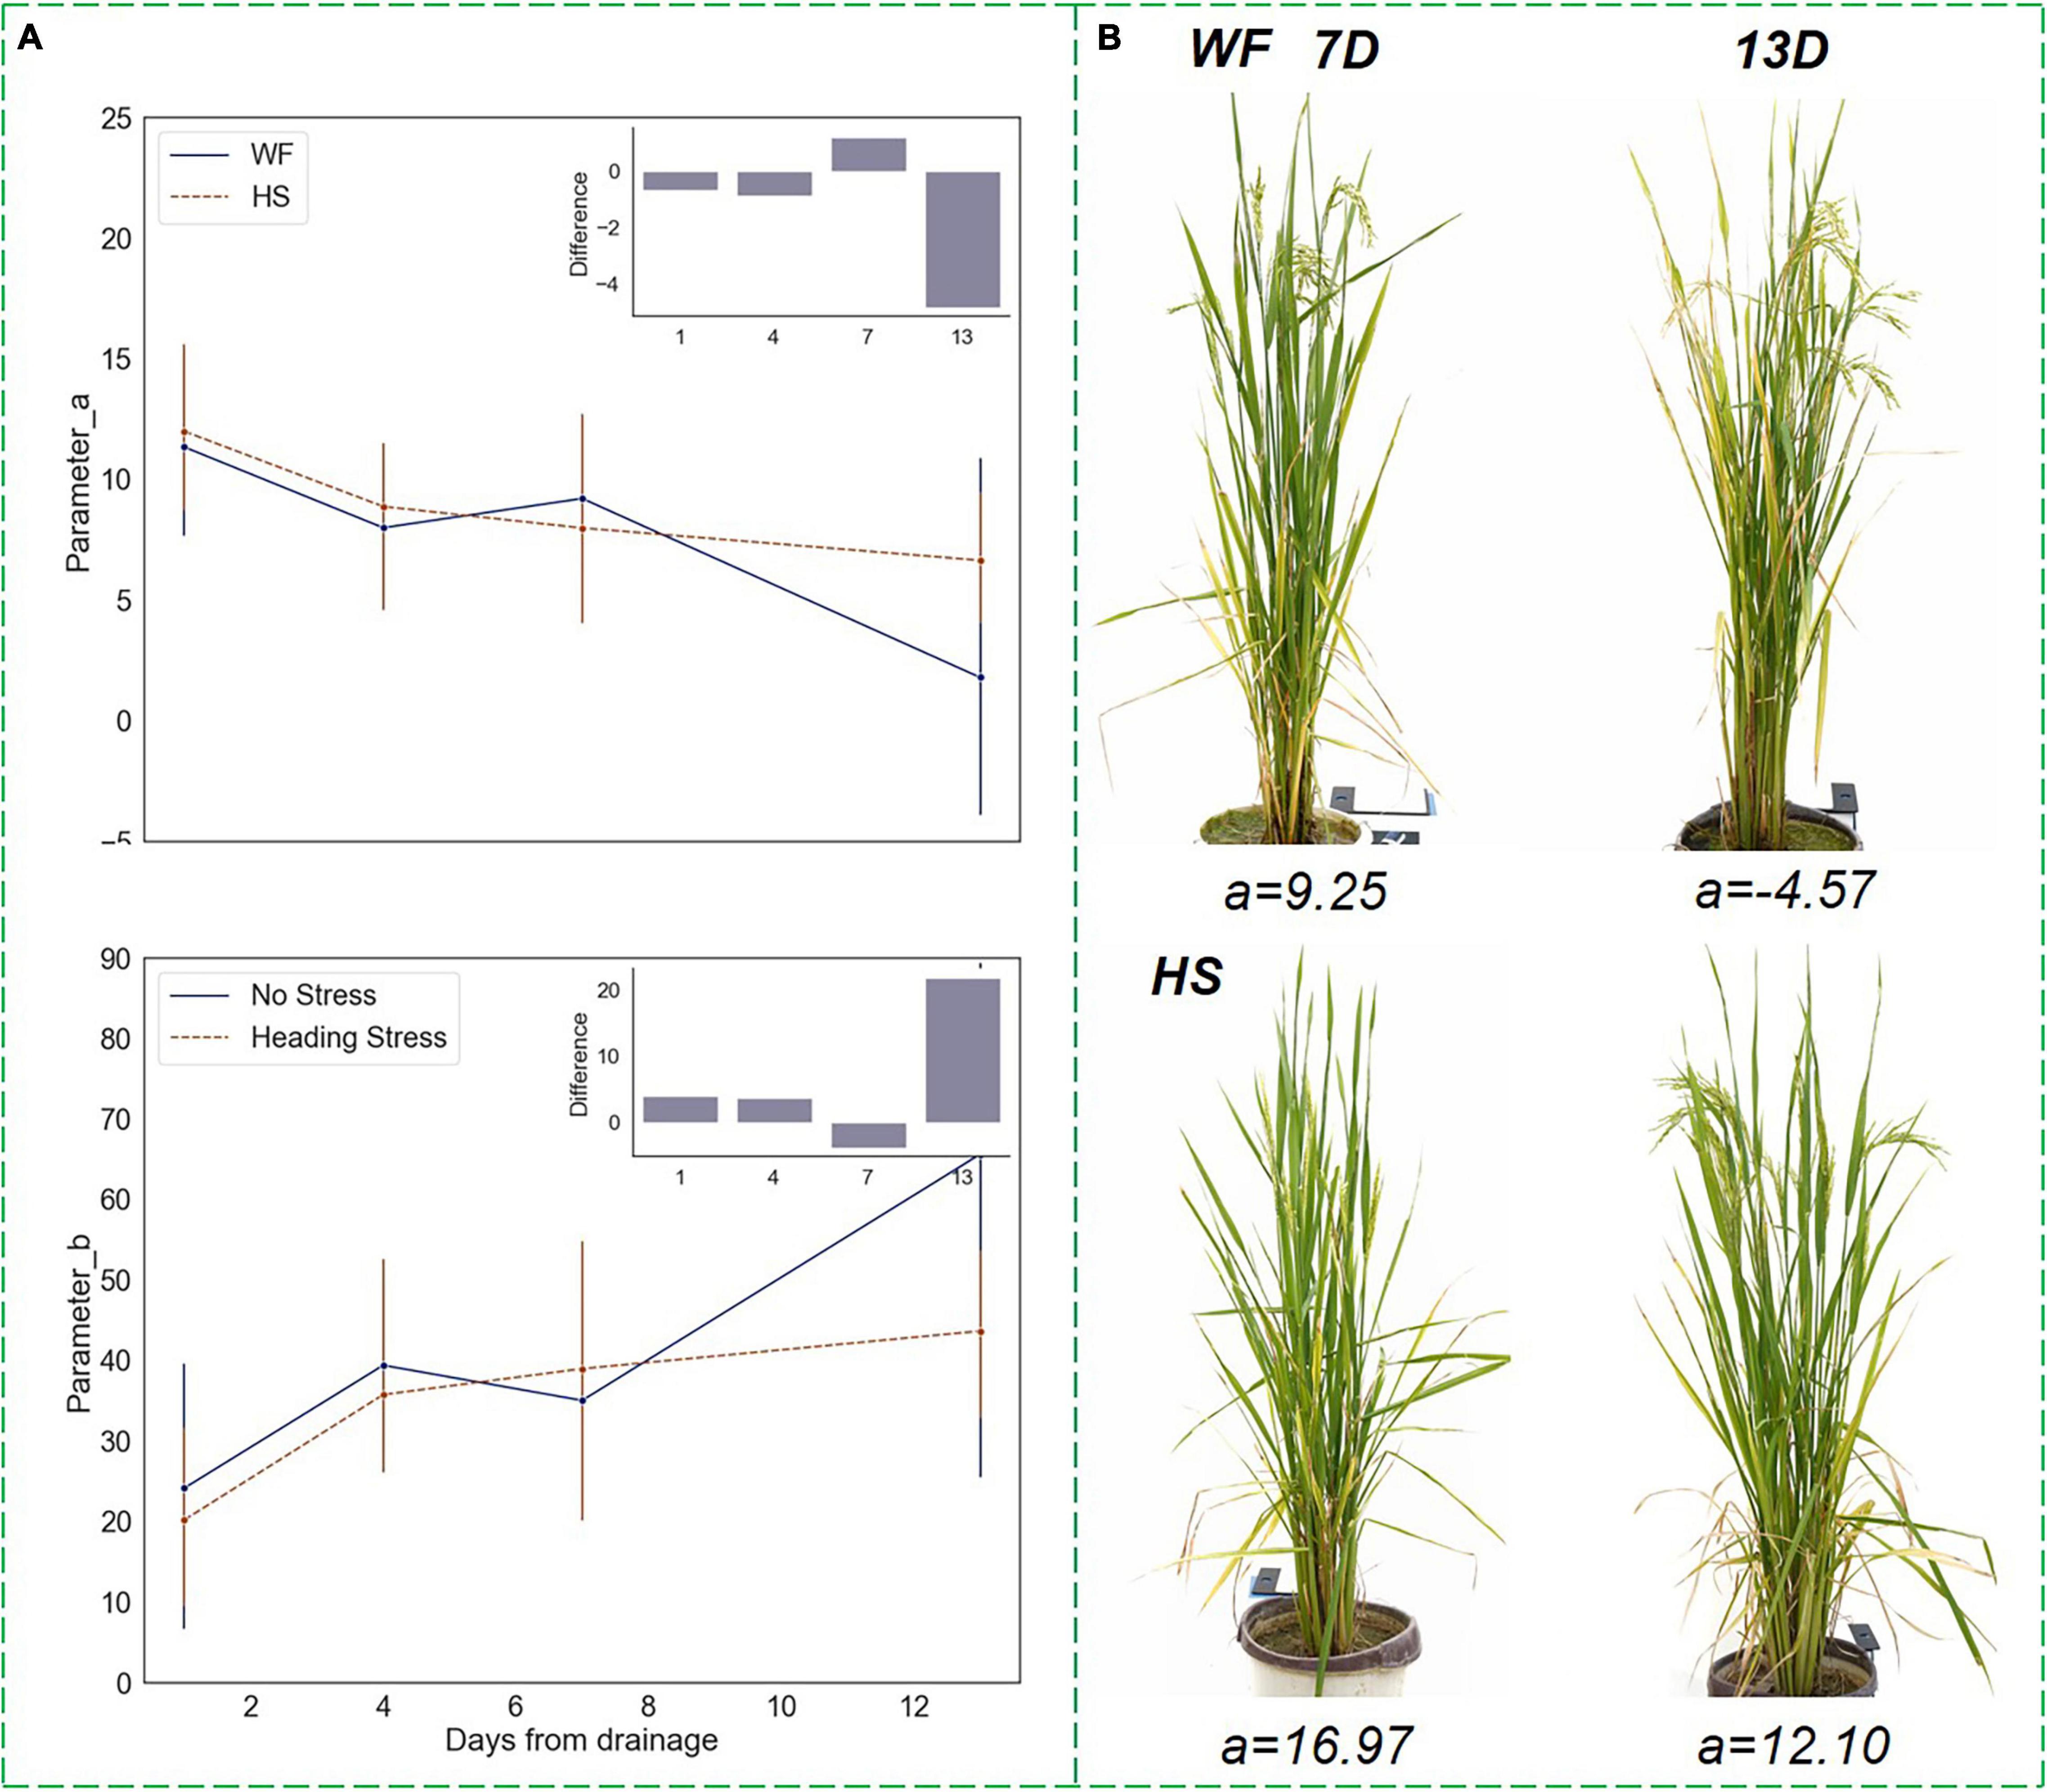
Figure 9. Changing trends of parameters in the vertical distribution function under short-term water stress during the heading stage. (A) Parameters a and b trends. (B) Changes in the front-view image within 7–13 days after drought, where the upper images showed the plants in the WF group, and the lower images showed the plants in the HS group.
The response patterns of the vertical leaf angle distribution function to long-term and short-term drought were different. In the model of long-term water stress, the differences in the vertical distribution function parameters mainly occurred at the tillering and jointing stages, and largely disappeared after heading, indicating that prolonged drought mostly affected the morphological traits of the plants during the nutrient accumulation period and eventually impacted the yield, while the effects of short-term drought occurring during the reproductive growth period on the vertical phenotypes were relatively lagging and insignificant.
After the effects of drought are detected by visual phenotypic analysis, compensatory rehydration irrigation is usually performed in agricultural production. In our experimental design, after a period of water stress lasting at the rice HS, flood irrigation was applied on day 19 of the drought to restore SMC to the field capacity rate. The SMC of the HS group was consistent with the WF group until the 32nd day from the drainage, and the rehydration lasted 14 days. This drainage-rehydration operation spanned the heading and filling stages and was completed at the milk-ripe stage.
Figure 10 showed the results of changing trends of leaf phenotyping traits. During the reproductive growth period when the LA began to decline, short-term water stress attenuated the decreasing trend, resulting in a higher LA in the HS group than that in the WF group. In contrast, the advantage in LA disappeared on the first day after resuming flood irrigation, and the LA in the HS group decreased rapidly, although it was still slightly higher than that in the WF group, the difference was not significant (Figure 10A). In the short-term drought at the HS, we found that the ALA of the HS group decreased after the drainage and was significantly lower than that of the WF group. After the resuming flood irrigation, the ALA of the HS group increased rapidly and the gap with the WF group narrowed (Figure 10B). The differences in leaf phenotypic traits, mainly LA and ALA, experienced a process of increasing and then decreasing during the drought-rehydration period, i.e., the leaf phenotypes of rice were significantly different from the normal level within 1–4 days after drought beginning, and these differences were nearly eliminated after 1 day of restoration of flooding irrigation.
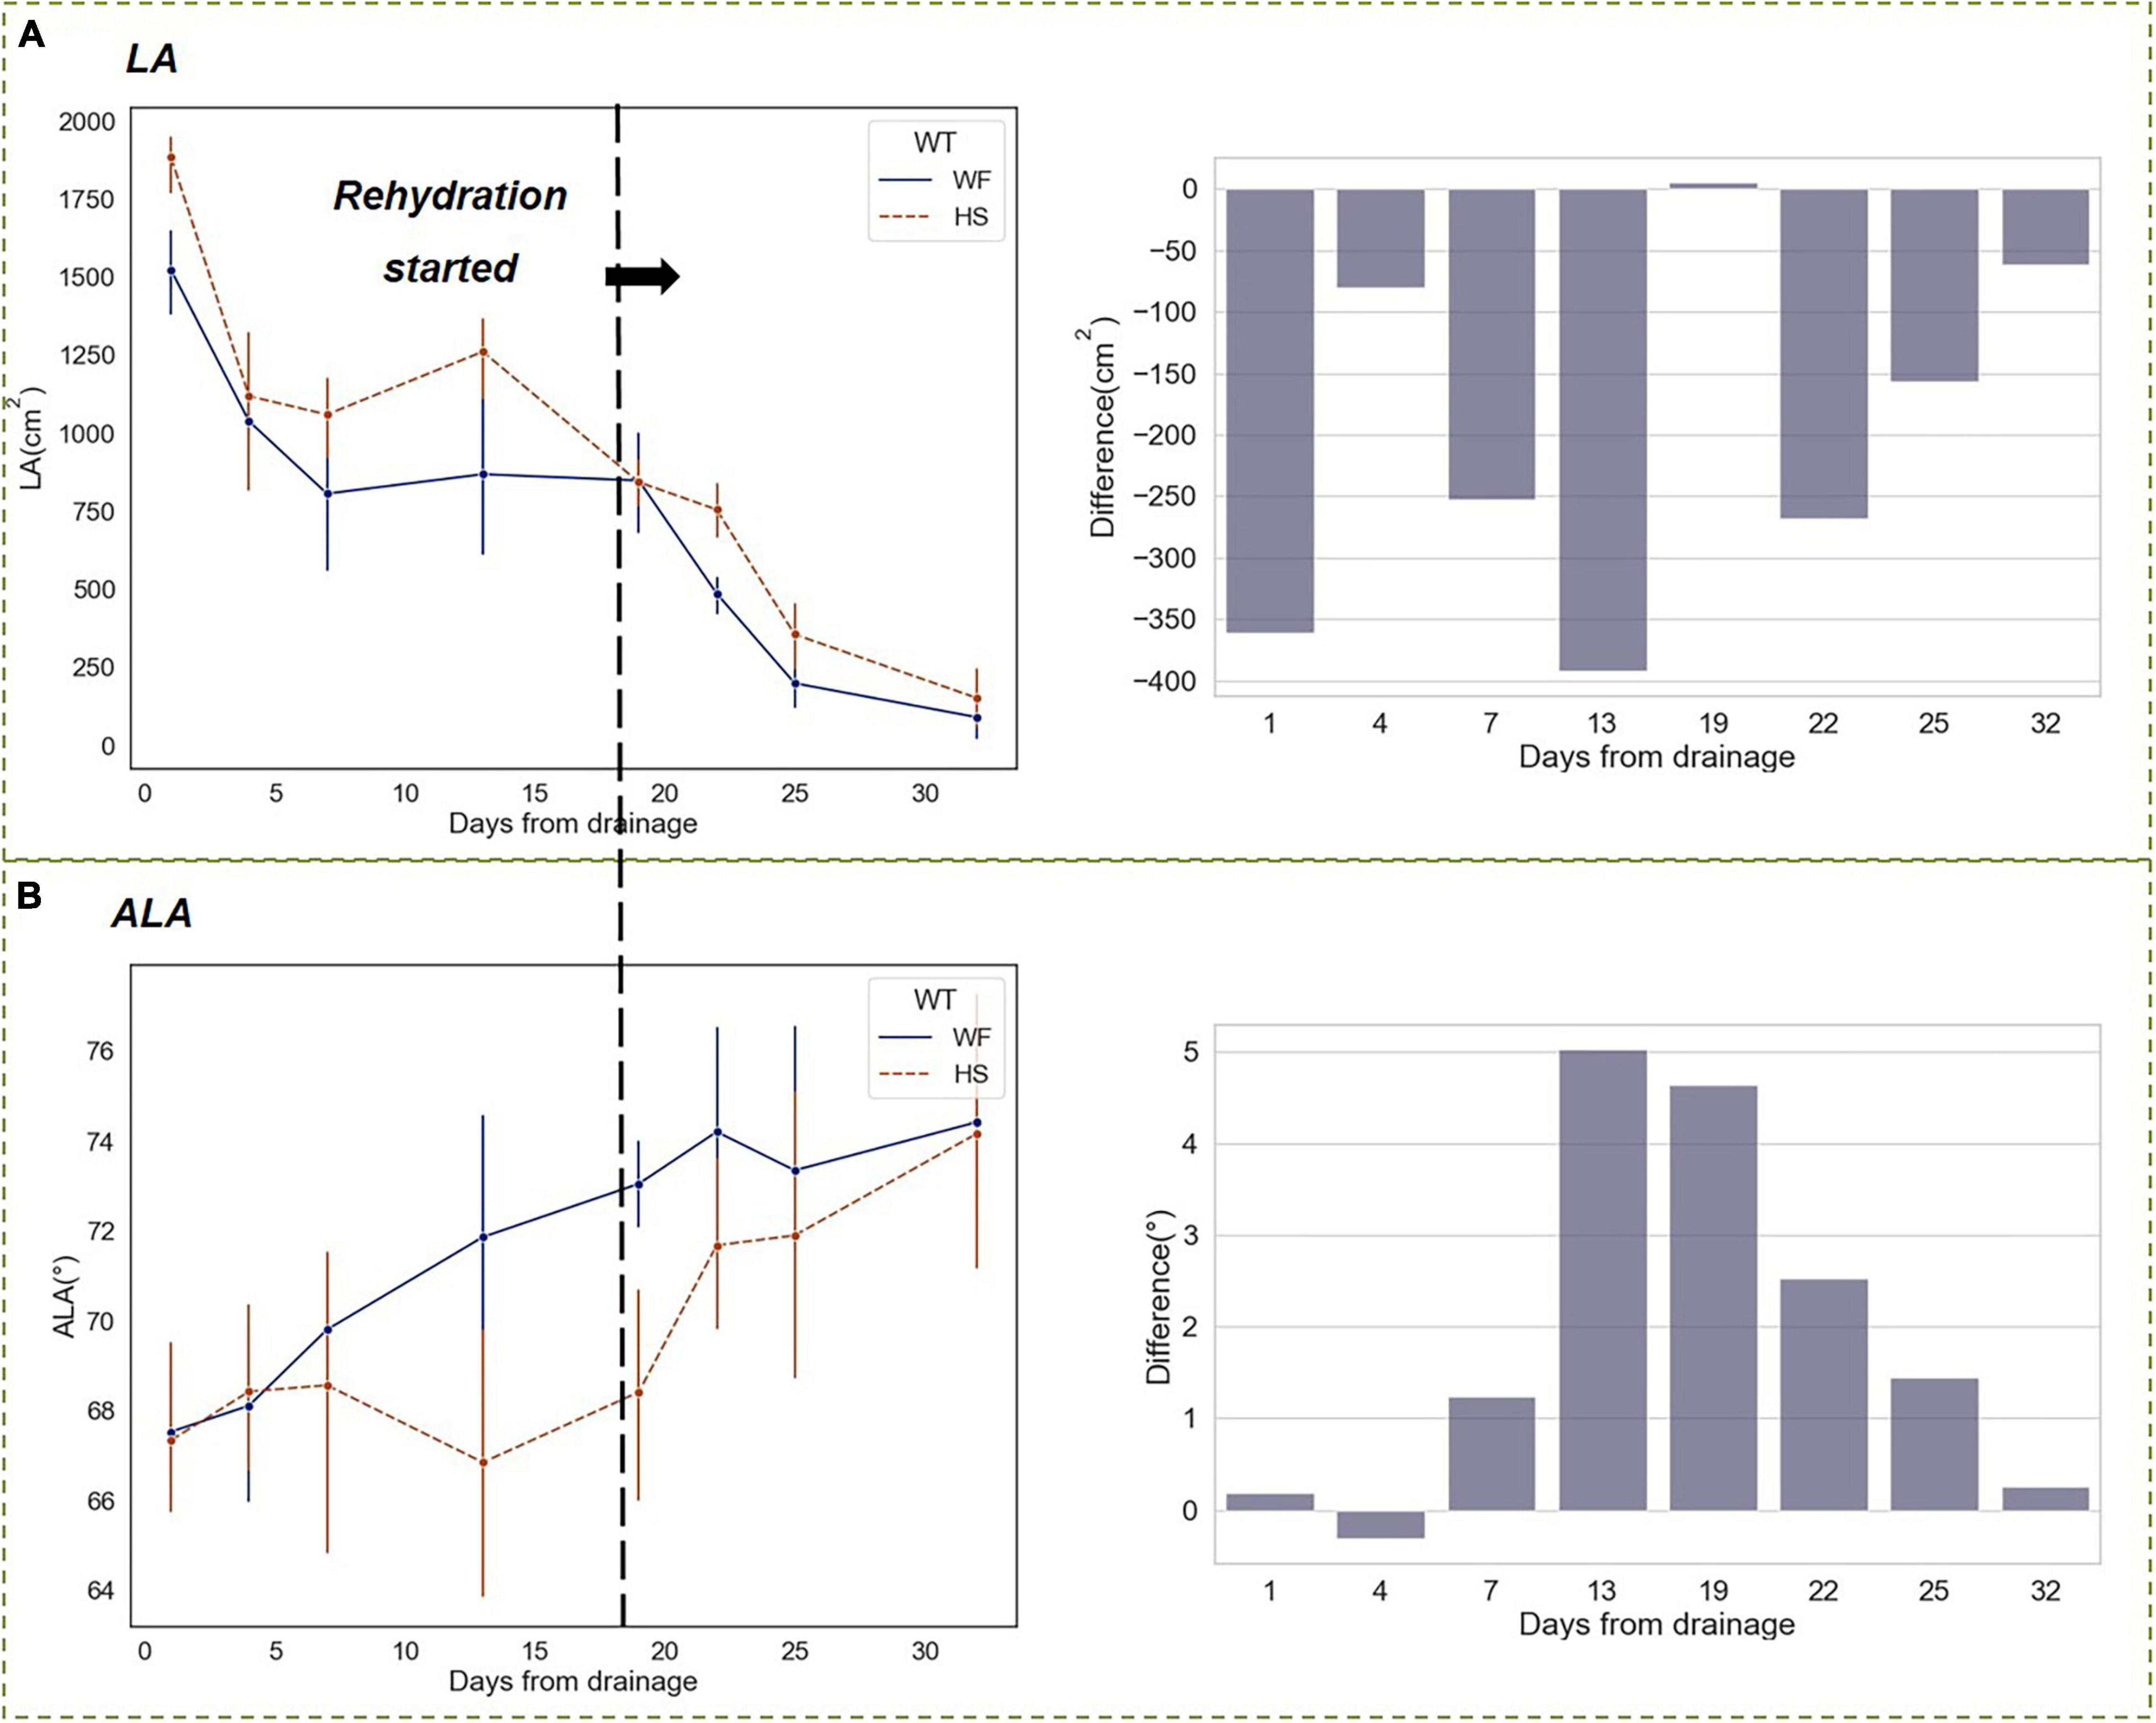
Figure 10. Changing trends of phenotypic traits under short-term drought-rehydration at heading and filling stages. (A) Leaf area (LA). (B) Average leaf angle (ALA).
The above analysis indicated that the restoration irrigation after short-term water stress at the rice HS led to a compensatory adjustment of some physiological functions of rice, which was reflected in the recovery of the phenotypic traits. Likewise, the trend of the vertical phenotypic distribution traits can be consistent with this pattern.
As shown in Figure 11, during the drought-rehydration process, the differences in RHC between HS and WF groups experienced a fluctuant change that first increase and then decrease. On the first day after the resumption of flooding irrigation, the differences in RHC largely disappeared. In the following days, the RHC value of the HS group was still lower than that of the WF group, but the difference was smaller than that during the drought (Figure 11B). In contrast to the changing trends in leaf phenotyping traits analyzed above, the differences in the RHC during short-term water stress did not disappear completely after rehydration.
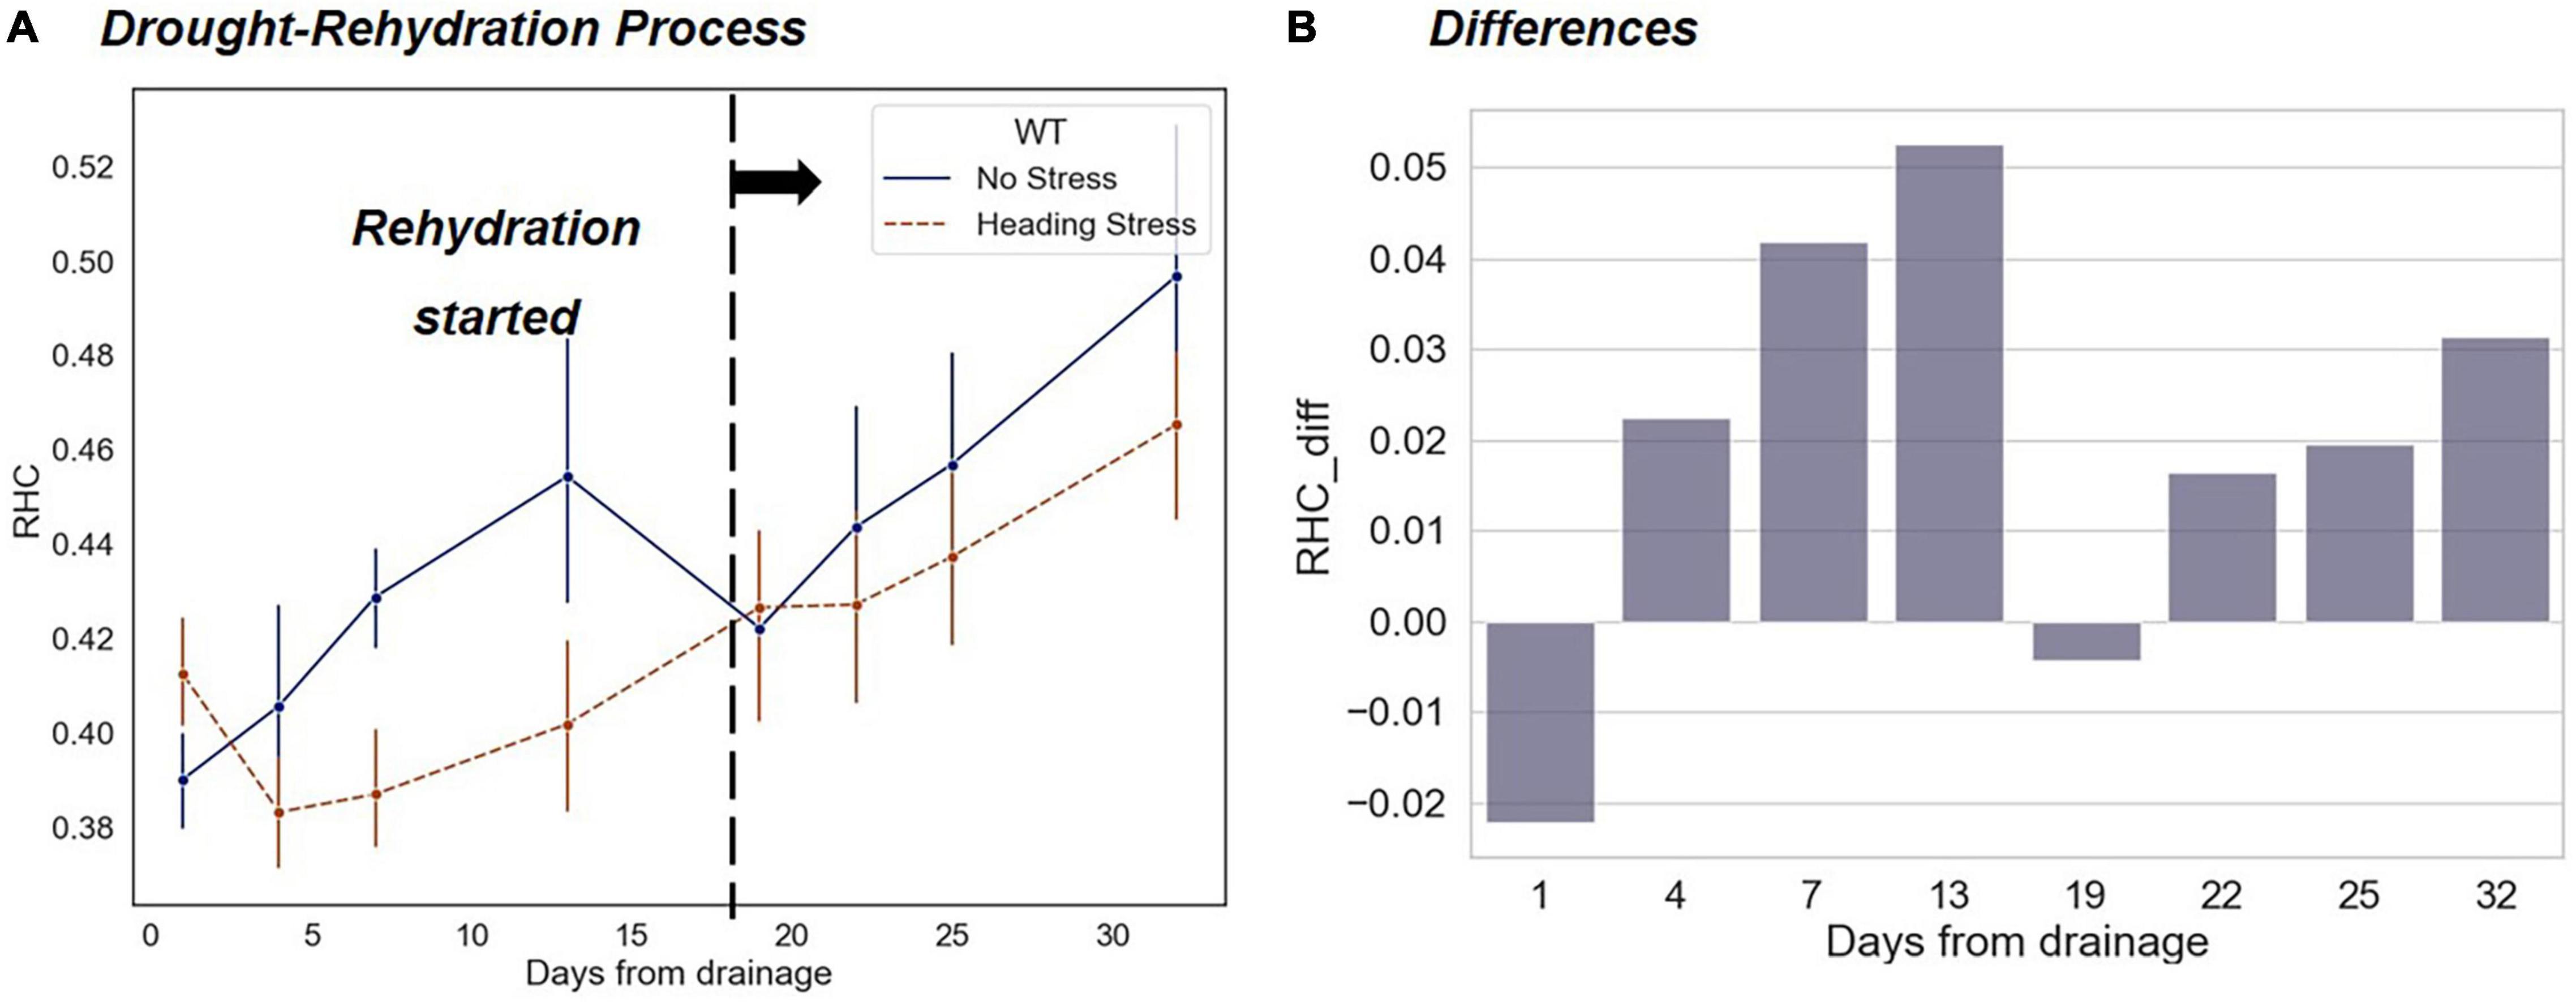
Figure 11. Changing trends of RHC indicators under short-term drought-rehydration during the heading and filling stage. (A) Comparison of changes between the HS and WF groups over 32 days after drought beginning. (B) Changes in RHC differences between the HS and WF groups.
The differences in the vertical function parameters a and b between the HS and WF groups reached their maximum after experiencing a 2-week drought. Similar to the changes in RHC, the differences vanished on the first day after rehydration. However, as the growth period developed, the rice entered the stage of filling and milk-riping, and the differences in parameters a and b between the two experimental groups remained at a certain level, which was lower than that of the drought stage though (Figure 12).
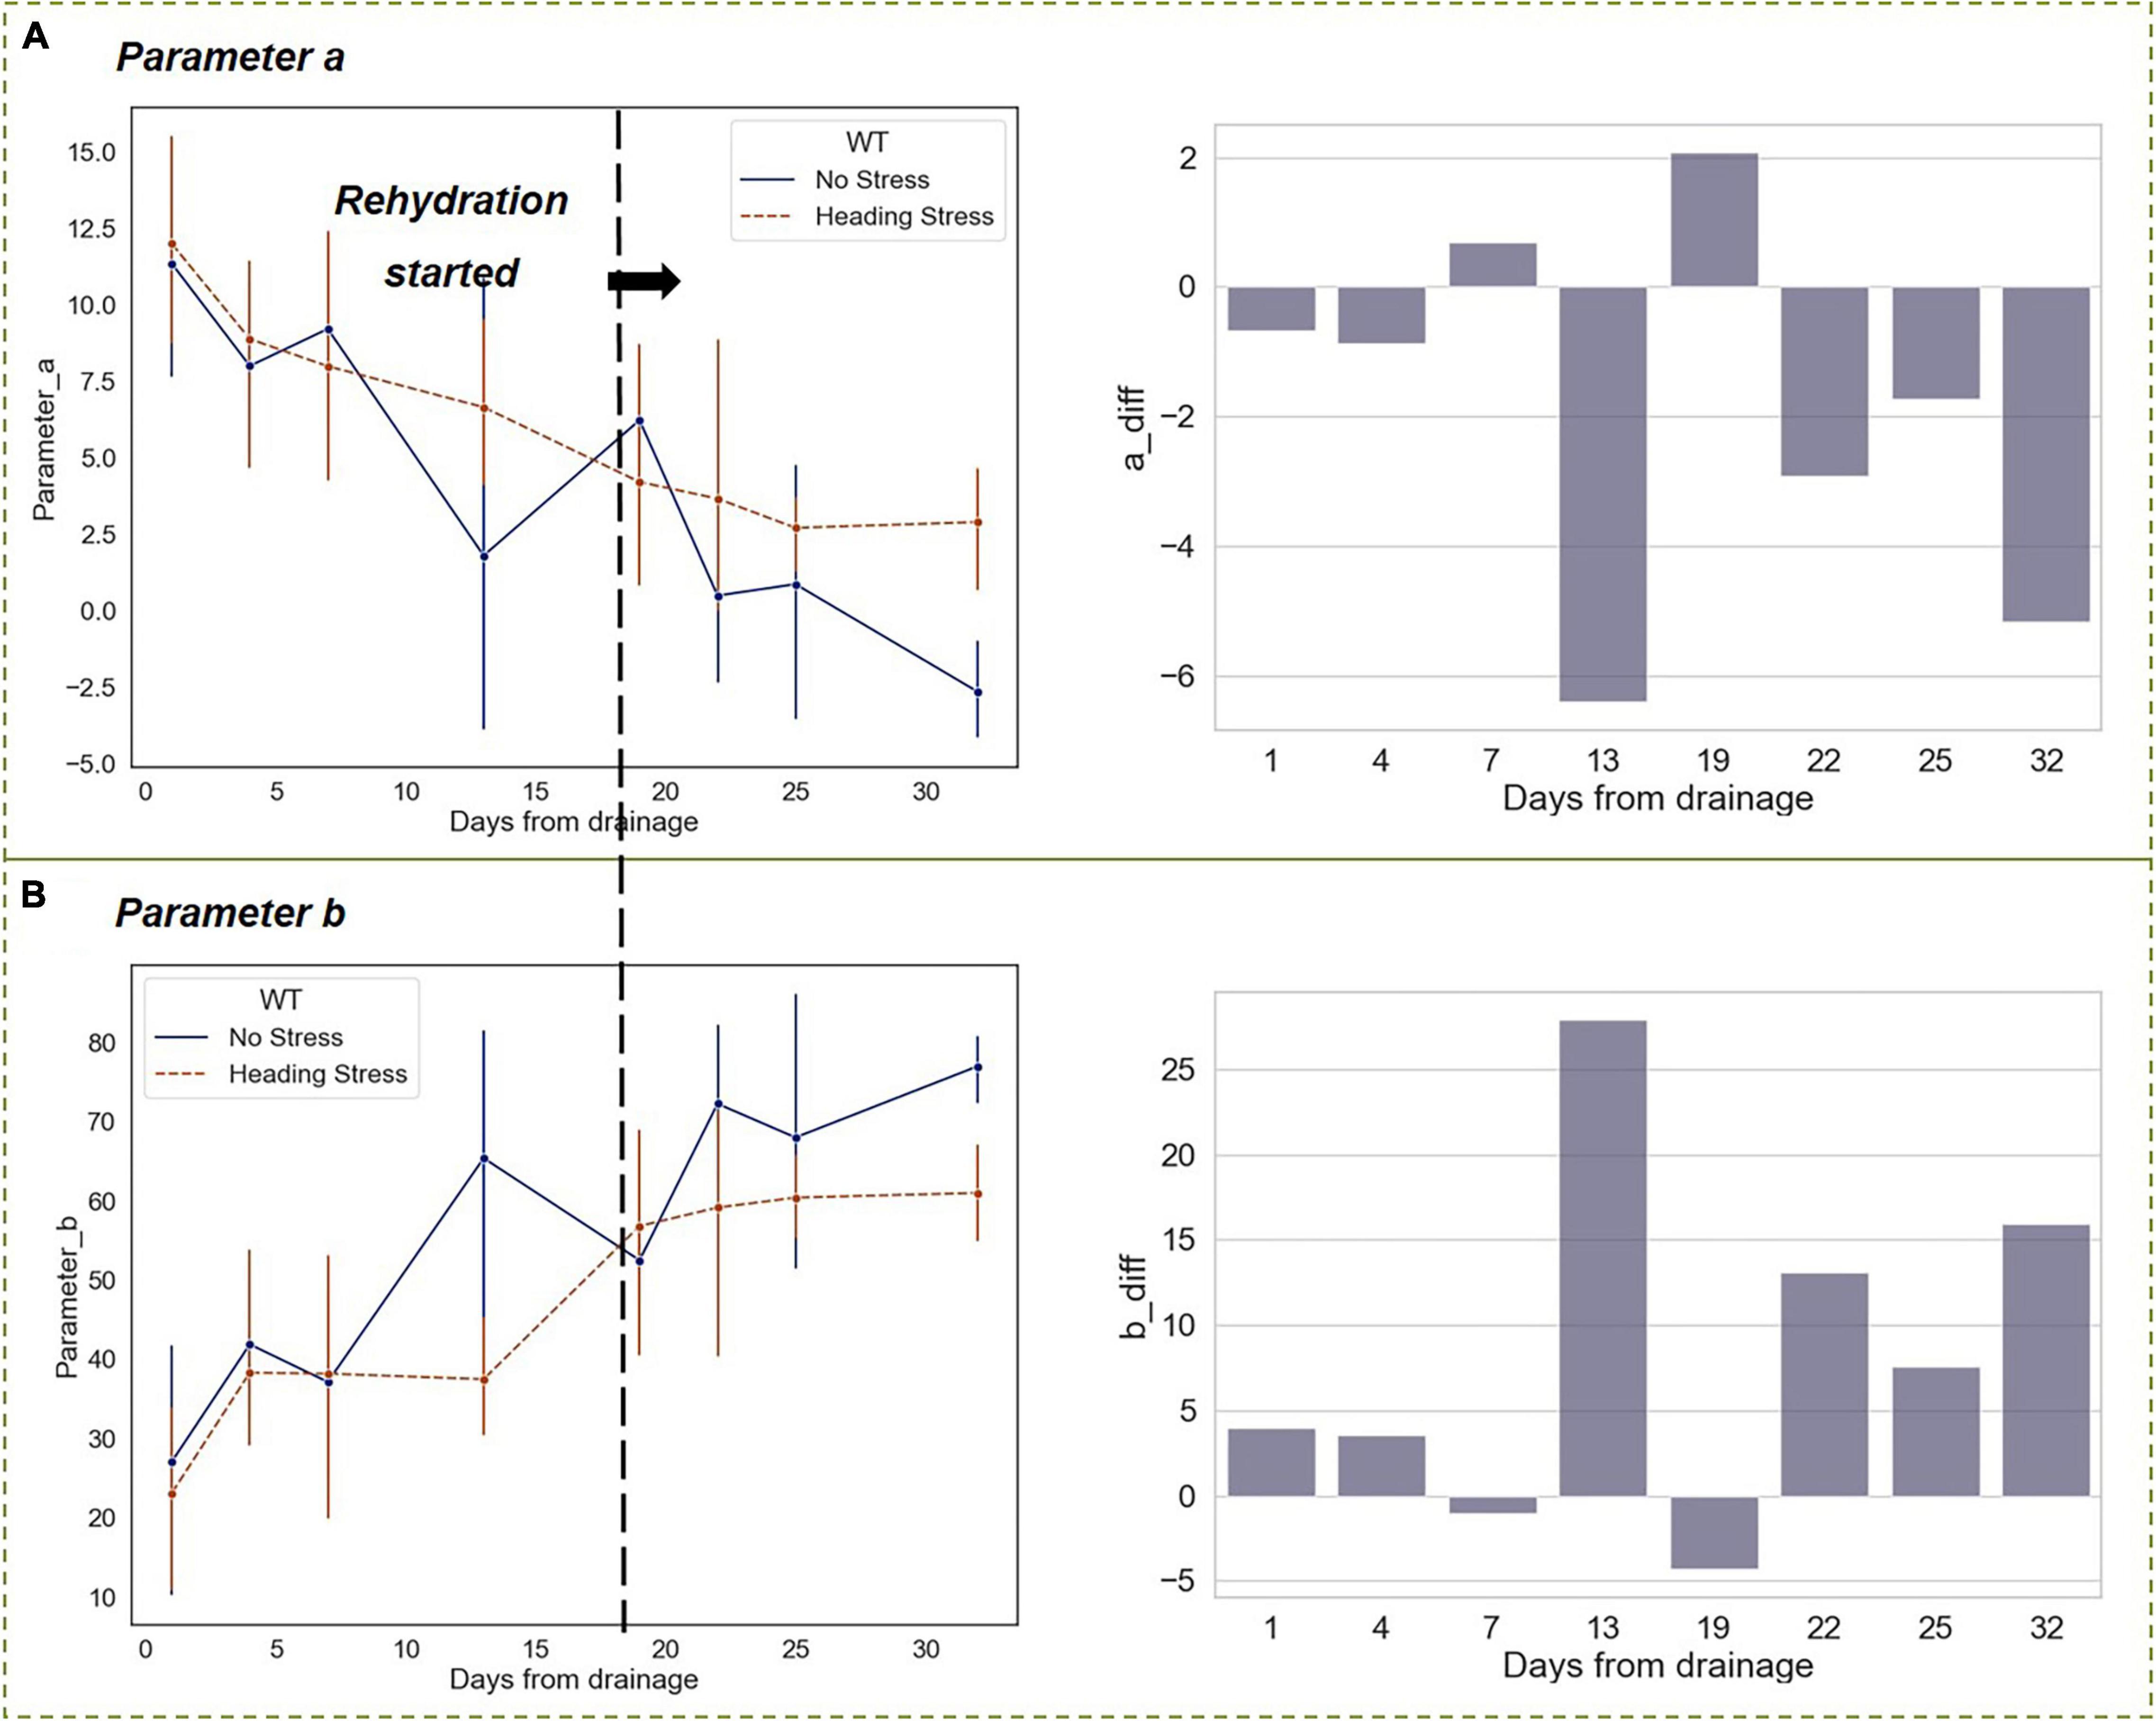
Figure 12. Changing trends of parameters a and b in the vertical distribution function under short-term drought-rehydration during the heading stage. (A) Parameter a. (B) Parameter b.
The trends of RHC and parameters a and b indicated that the short-term drought-rehydration process had irreversible influences on rice at the HS, which were continuous and mechanistic. This response pattern can be used to illustrate the final yield differences, with the HS group subjected to short-term water stress having a higher yield instead. As Figure 13 represented, the yield of the WF group with flooding irrigation during the whole growth period was significantly higher than that of the WM and WS groups, which were subjected to mild or severe water stress, but the HS group had higher yields. During rice heading, the growth process of rice panicles was significantly slowed down under insufficient water supply, which could be informed by the changes in the RHC index. After rehydration in the HS group, the RHC maintained a steady and slow rising trend compared with the normal level, indicating that despite the resumption of irrigation, rice kept a lower growth focus. The drought-rehydration process gave a drawn-out period for the rice spike to grow and resulted in more nutrient accumulation. On the other hand, through the changing trends of the parameters a and b, it can be seen that the evolution of rice light interception morphology during the short-term drought-rehydration process. Under the drought condition, the functional leaves of the rice plant maintained a high degree of uprightness, and part of the leaves in the lower and middle layers was retained instead of falling, thus the radiation transfer efficiency of the plant was improved obviously.
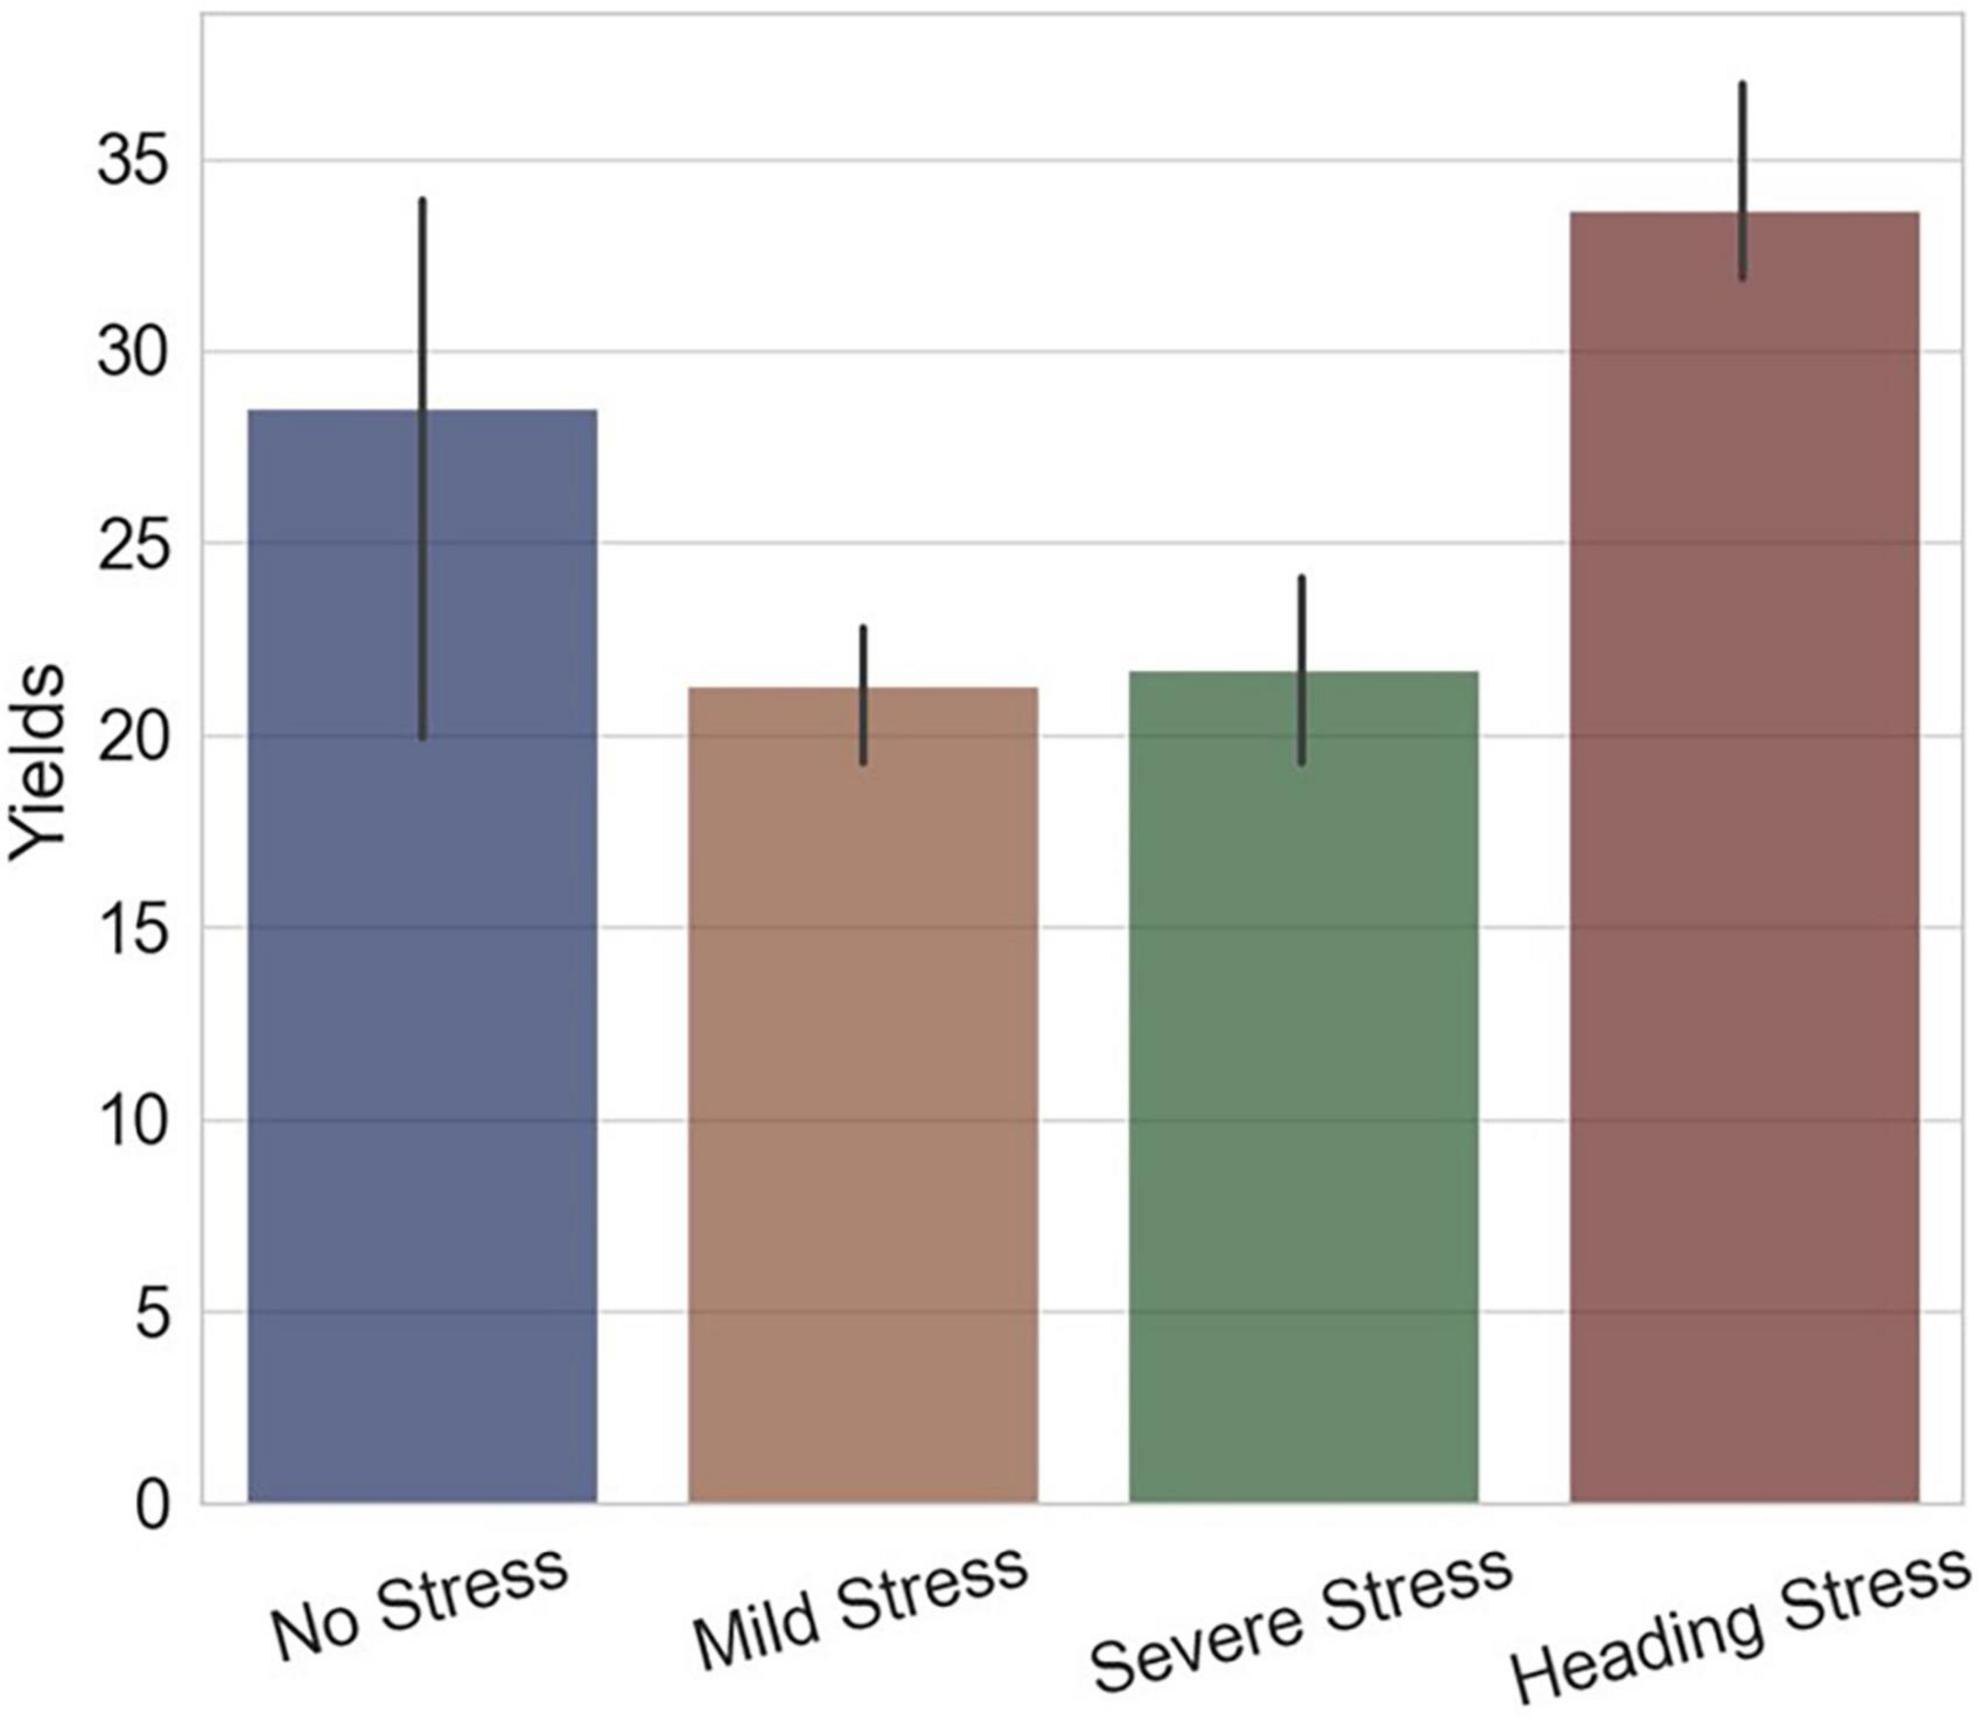
Figure 13. The final yields of experimental groups of different water treatments, the x-axis represents the groups and the y-axis represents the yields (g per plant).
The irrigation model of short-term drought-rehydration during the rice heading and filling stages was proved to be conducive to improving the plant morphology and structure, which was less compact and more suitable for radiation interception. Moreover, the problems of weak and bent stems and low rice panicle set rate due to prolonged flooding irrigation were mostly avoided.
The vertical distribution characteristics which were worked out from digital images were proved to be effective indicators for the detection of drought response in rice plants. Many previous studies have shown that visual phenotypic indicators estimated from images can be well correlated with crop biomass as well as growth status, while the digital features involved in these studies are mainly projection areas of the plants (Honsdorf et al., 2014; Fisher et al., 2016; Duan et al., 2018). In this paper, we also analyzed the correlation between the vertical distribution traits and rice growth status. The growth and radiation interception capacity of rice were evaluated by the above-ground dry matter (ADM) and the extinction coefficient (K; Supplementary Table 3).
To test the capacity of different types of phenotypic traits to estimate plant growth, we grouped the calculated indicators by type and performed a multivariate correlation analysis with the measured ADM values separately (Figure 14). Tiller number (F), PH, ALA, and LA were combined into a group. These traditional phenotypic indicators have been commonly used in previous studies (Peng, 2000; Rahaman et al., 2015; Peng and Xie, 2020). They describe the crop morphology in more comprehensive dimensions, which indicate how many tillers, stem length, degree of leaf erectness, and leaf size of rice. Therefore, this combination of parameters had a good capacity for indicating dry matter accumulation in rice plants (Figure 14A). However, among these widely used traits, F and LA require destructive sampling measurements to obtain accurate values, which is uncomplicated, and only ALA can be derived from a single image. For rapid acquisition of plant morphological features from images, Duan et al. (2018) proposed two shape descriptors, GPAR and PAR, which were proved to be effective in the quantification of drought response of rice. GPAR is the greenness projected plant area ratio of rice that represents the proportion of the green organs in rice, and PAR is the perimeter area ratio which indicates the compactness of rice tillers. By calculating these two shape descriptors on our experimental images, we discovered that GPAR and PAR were not only advantageous indicators of drought response in rice but also had a high correlation with above-ground biomass. The trait set with GPAR, PAR, and PH as a combination had the highest accuracy of regression analysis for ADM (Figure 14B). The novel phenotypic traits we proposed in this paper include RHC and parameters a and b, which also correlated relatively well with rice biomass. Figures 14D,E showed the MLR results of the combination of RHC and PH, and the traits combination of a, b, RHC, and PH on ADM. The results showed that the relative centroid height and the vertical phenotypic distribution features could be a good indication of the rice growth status, and this indicating capacity was outperformed by the combination of traditional phenotypic parameters. Meanwhile, we noticed a high correlation between PH and ADM, which was because the PH information indicates the length of rice stems that occupy a large portion of above-ground biomass. However, accurate PH required manual measurements or calibrated photography measurements so that it cannot be obtained by a single digital image directly. Therefore, we analyzed the correlation between only image visual features and rice biomass when PH was not involved in the parameter combination. The results showed that the traits combination of a, b, and RHC was slightly more correlated with rice biomass than that of GPAR and PAR (Figures 14C,F).
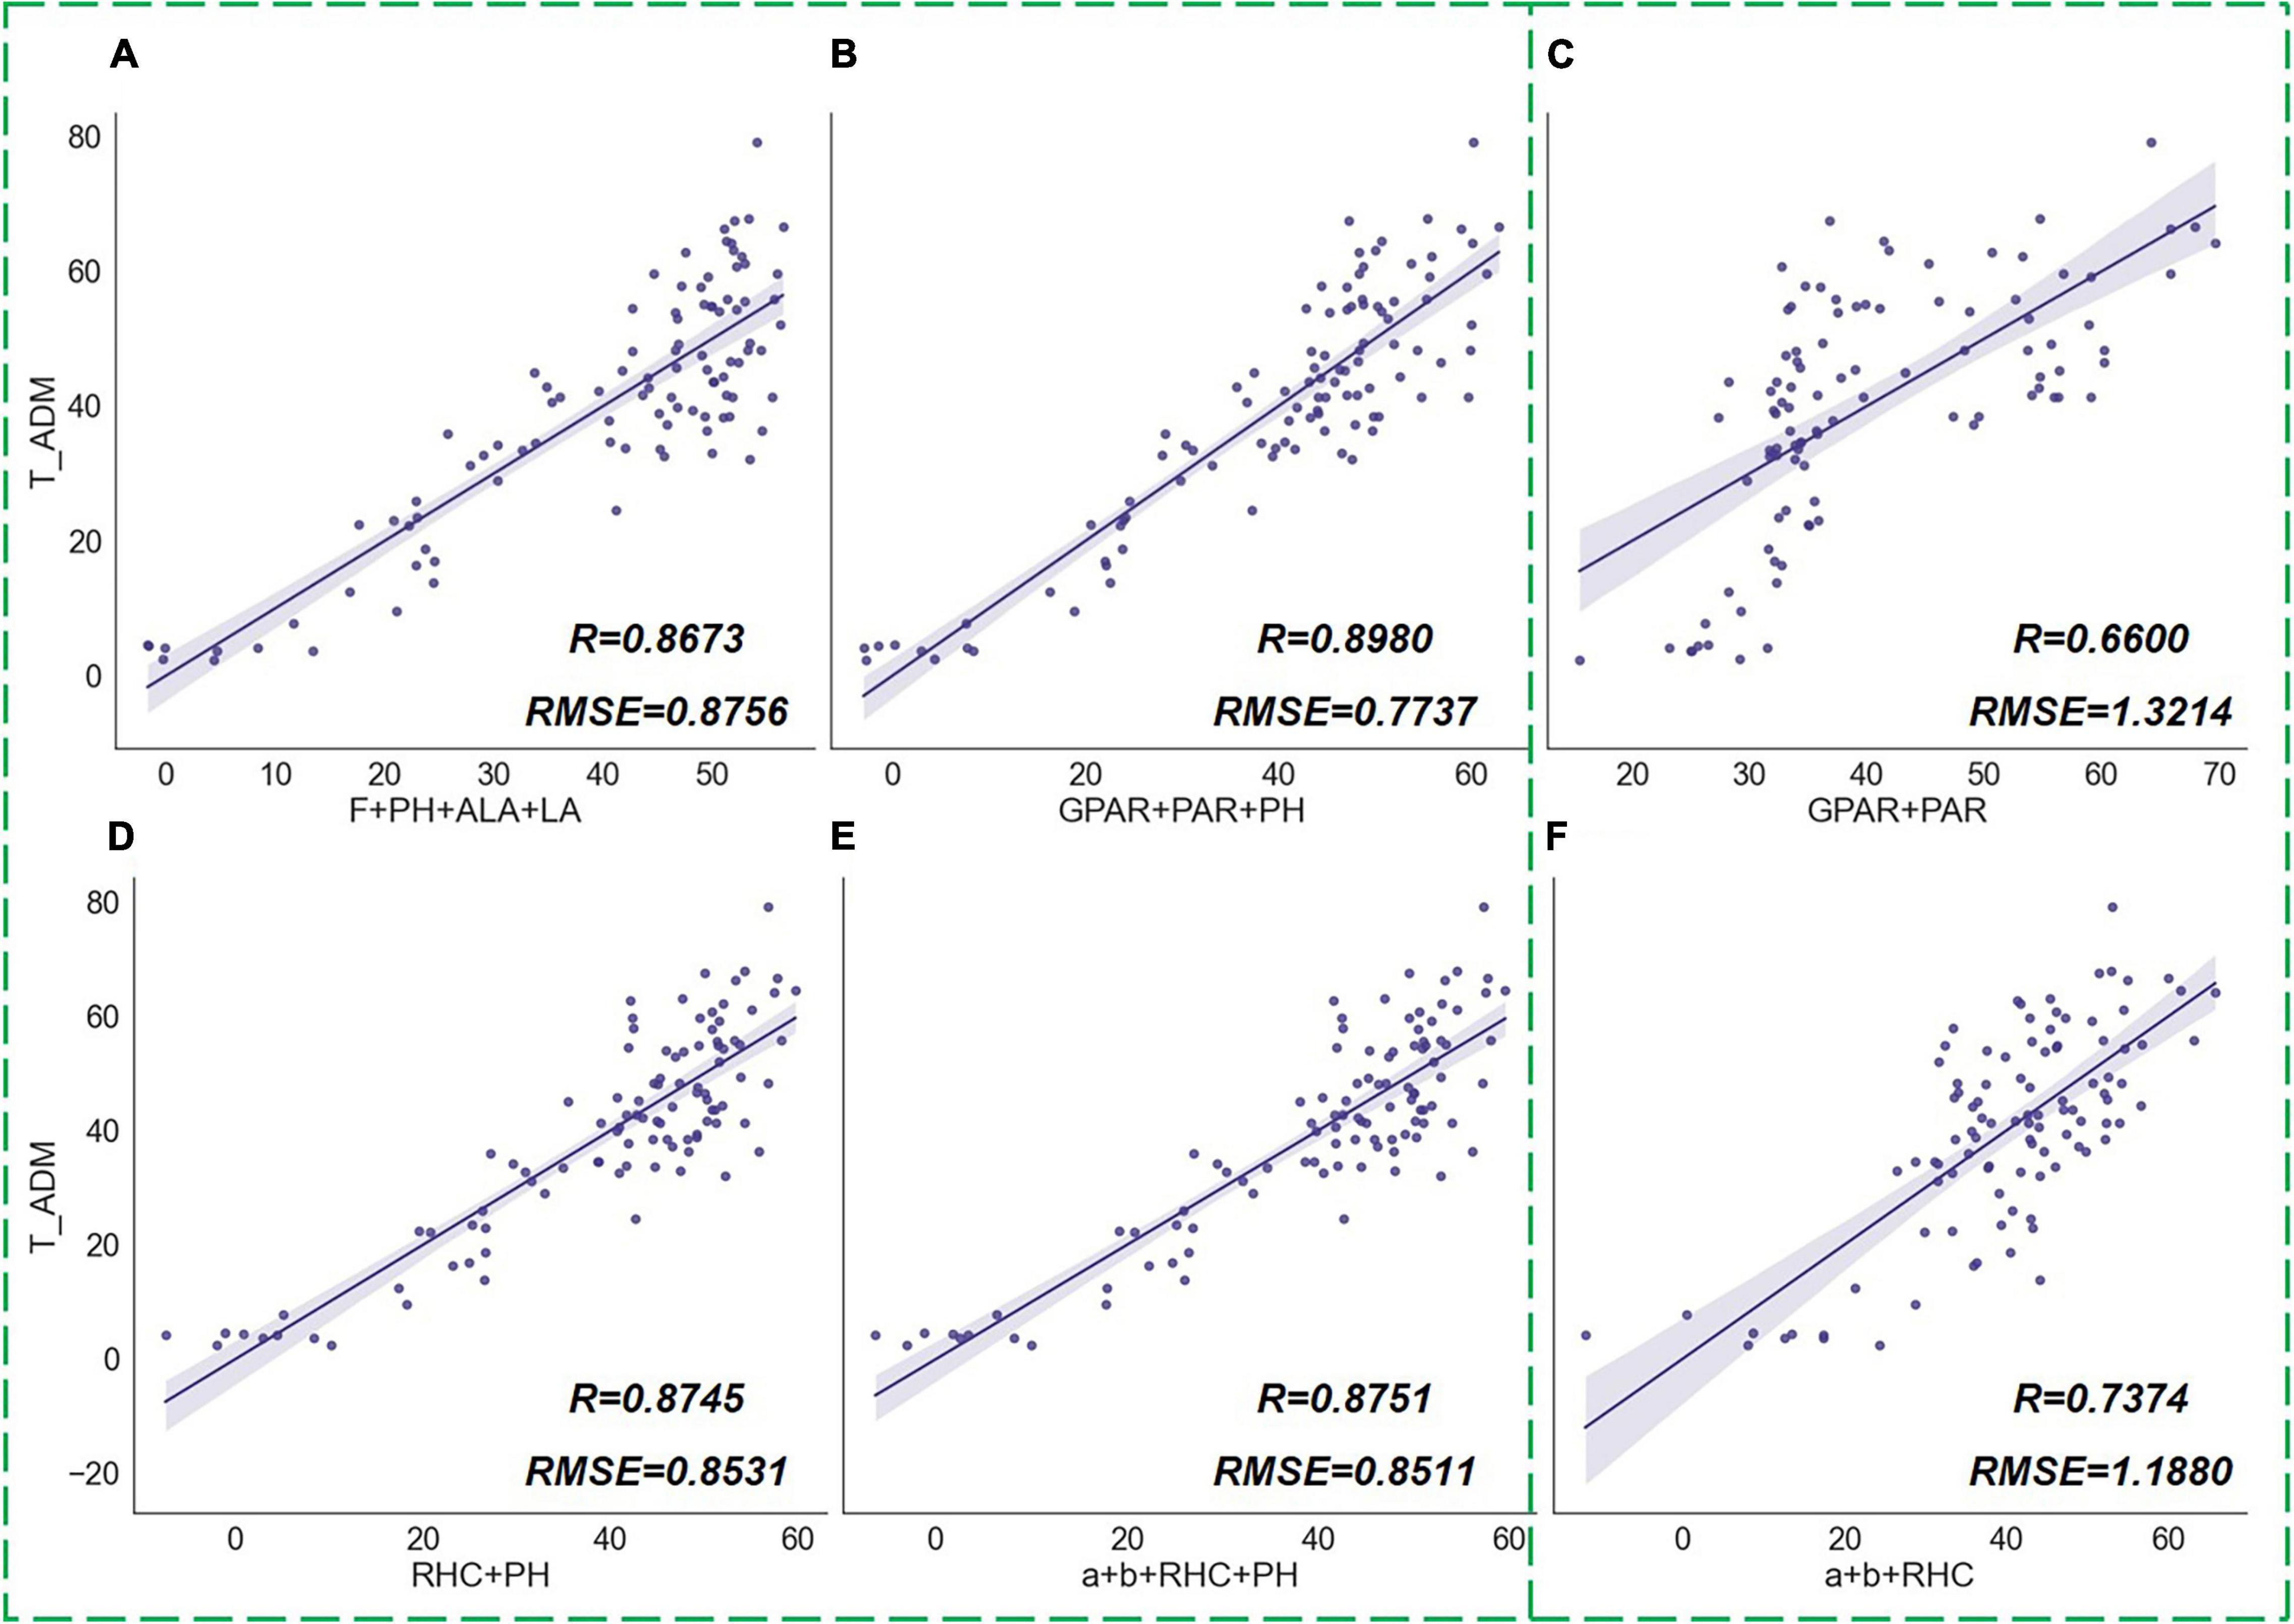
Figure 14. MLR results of phenotypic traits groups and above-ground dry matter of rice (ADM). The scatter graphs show the Pearson correlation test results between the regression values and the true measurement values. The x-axis represents the ADM values derived from the regression model, and the y-axis represents the measured ADM values. Different combinations of traits are (A) [F, PH, ALA, LA], (B) [GPAR, PAR, PH], (C) [GPAR, PAR], (D) [RHC, PH], (E) [a, b, RHC, PH], (F) [a, b, RHC].
The extinction coefficient (K) is also one of the most significant indicators describing the growth status of the crop. Unlike ADM which measures the amount of nutrient material accumulated by the plant, K is used to characterize the interception and absorption of light by the canopy, which is of interest for evaluating the photosynthetic efficiency. Plant morphological structure is the key factor affecting the process of radiation transformation in the canopy, so the extinction coefficient is sensitive to changes in phenotypic traits. Thus, quantifying morphological features is an important tool to evaluate the photosynthetic efficiency of plants (Saitoh et al., 2002; Duursma and Mäkelä, 2007).
To test the capacity of the phenotypic traits to describe rice structure and their correlation with the extinction coefficients, we grouped the phenotype traits by type. The results were shown in Figure 15. Among the traits groups, the conventional traits combination of F, PH, ALA, and LA was correlated with K to some extent, the regression accuracy of the combination of GPAR and PAR was lower, while the combination of parameters a and b had the highest regression accuracy for K. Among the conventional traits set, ALA and LA were indicators describing the degree of leaf inclination and leaf size, respectively. The angle and size constitute the basic structural elements in the canopy and therefore possess a certain ability to estimate the extinction coefficient. Parameters a and b had the highest regression accuracy for K, while the combination of GPAR and PAR had a lower correlation with K. The results illustrated that the vertical distribution model well described the structure of rice plants, and the hierarchical modeling contributed to the study of rice traits related to light interception and radiation transformation. GPAR and PAR, on the other hand, lack representation of the three-dimensional structure and vertical heterogeneity. It should be noted that the MLR analysis of K for all combinations of phenotypic traits in this research did not exhibit a very high correlation since at the single plant scale; external factors interfering with radiation measurements below the plants were complex and scabrous.
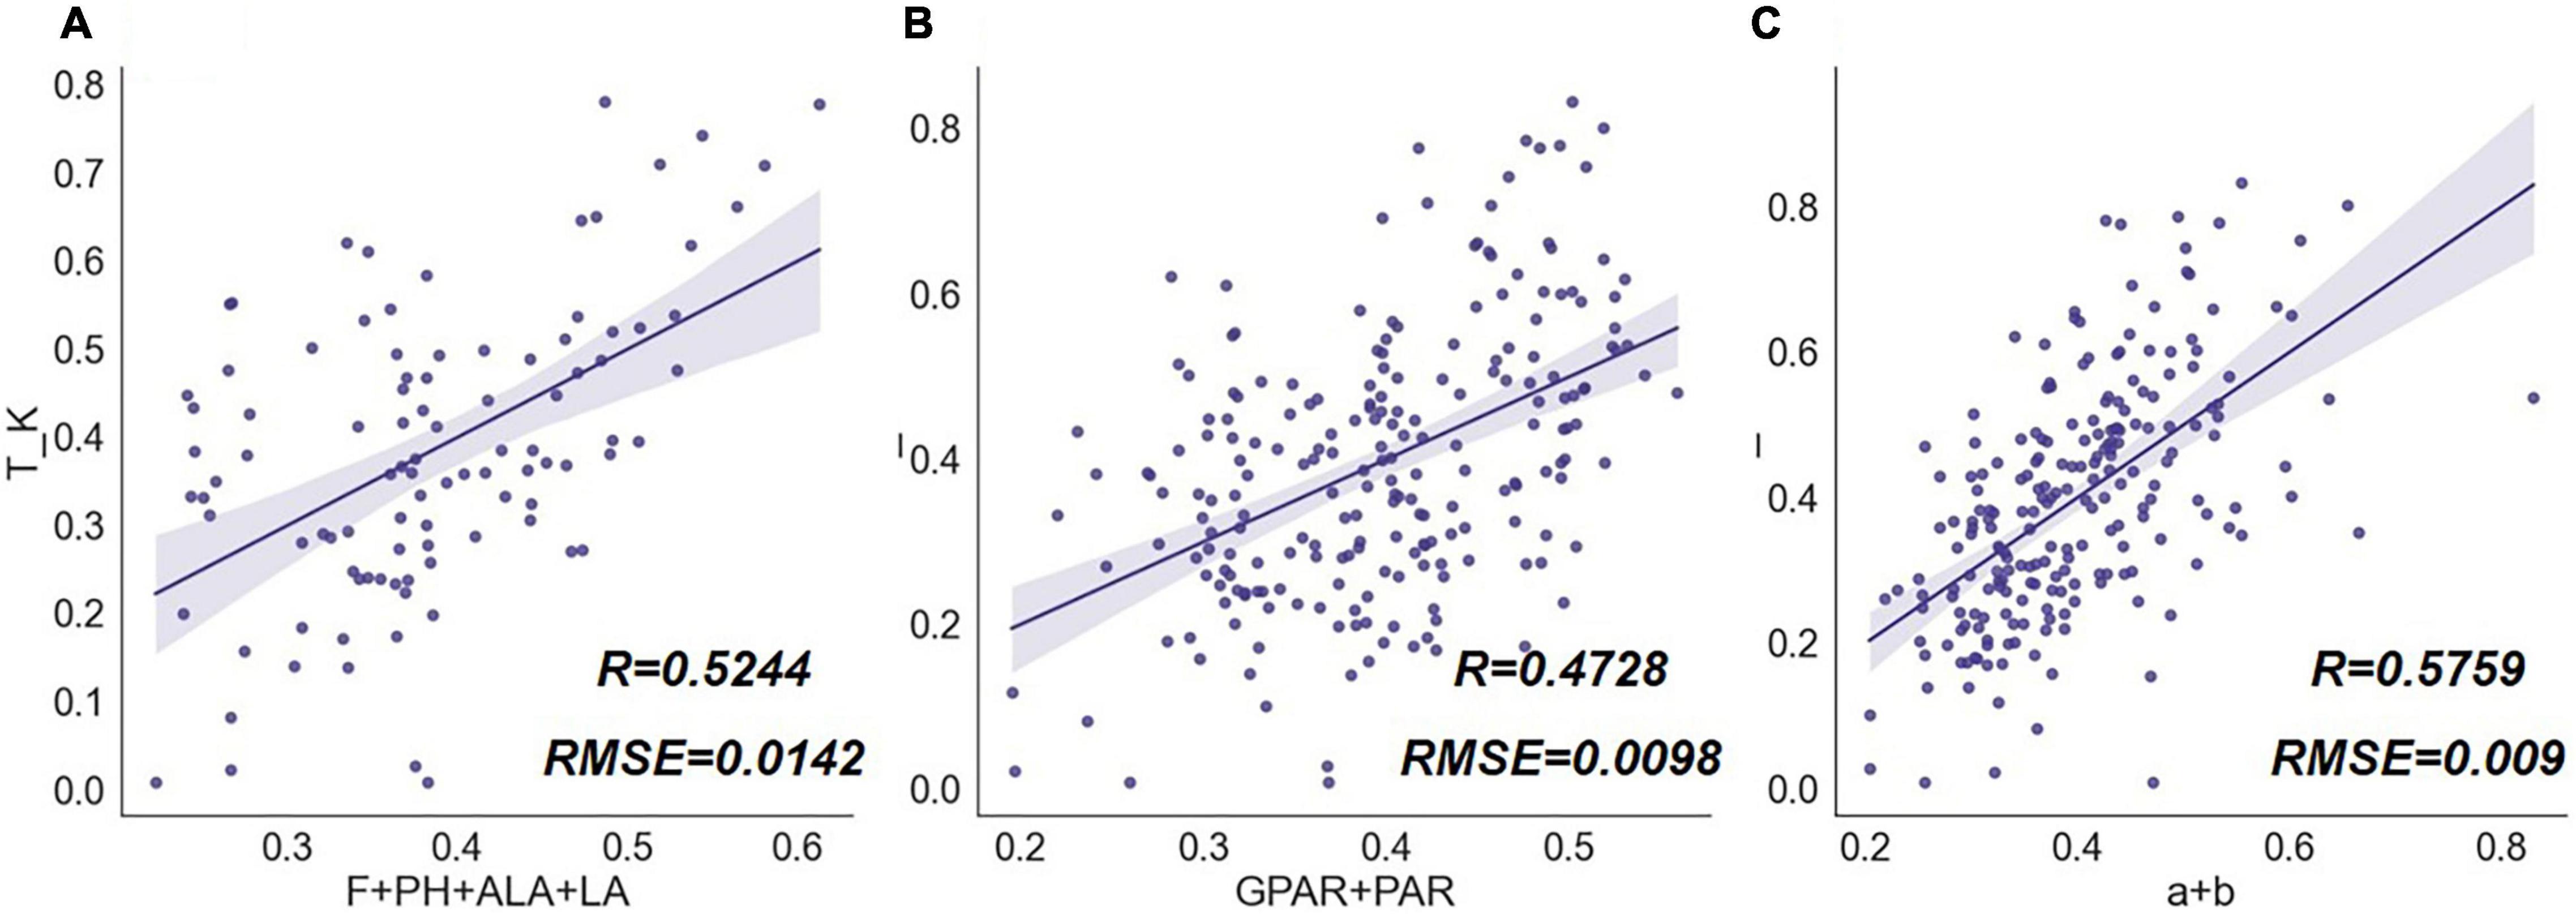
Figure 15. MLR results of phenotypic trait combinations and extinction coefficient (K). The scatter graphs show the Pearson correlation test results between the regression values and the true measurement values. The x-axis represents the K values derived from the regression model, and the y-axis represents K values measured by a radiometer. Different combinations of rice traits are (A) [F, PH, ALA, LA], (B) [GPAR, PAR], (C) [a, b].
The vertical architecture of gramineous plants is primarily formed by the leaves and their distribution, so it is complex and difficult to accurately carve the vertical structures. Previously, methods such as manual measurement and LiDAR scanning reconstruction have been mainly applied (Fournier and Pradal, 2012; Martin-Ducup et al., 2018; Perez et al., 2019). To avoid the high cost and complicated measurement, we designed several traits to characterize the vertical morphology of rice based on a simpler image process method. By implementing experiments with several water treatments, we understood the characteristics of rice response to water stress at different growth stages with the application of these traits. Meanwhile, these traits have a good correlation with rice growth status, so while reflecting the effects of water stress, they can indicate changes in rice physiology as well as provide a more reasonable explanation for the formation of rice yield. Compared to previous drought experiments, the experiment in this study focused on a more practical irrigation model of drought-rehydration. In the experiment, the water stress was not so severe as to cause leaf rolling and wilting, but it still significantly affected the yield. Some conventional drought-sensitive indicators cannot reflect the changes in rice physiology and morphology under this situation. The novel proposed vertical traits helped to gain more knowledge about the growth compensation effect of rice under alternating drought-rehydration scenarios. For future field applications, our research results will be used to improve the phenotype module and stress description in the crop model. We aim to identify the effects of different levels of water stress on crop growth at different times through crop modeling. The image analysis model combining phenotype detection and stress identification will be used for farm management and irrigation decisions. The scientific determination of irrigation timing and quantity from rice growth mechanism is the significance of our research and the future development trend. The drought-detection method we proposed has the flexibility to realize through the photography function of a smartphone, which can be applied in other similar species and different scenarios.
(1) It was found that the distribution of rice leaf angle in the vertical direction has a certain pattern, which can be expressed quantitatively by the logarithmic model and its parameters a and b. Meanwhile, this paper proposed that the relative focused location of nutrient accumulation and transformation in rice can be described by the RHC index.
(2) Long-term water stress produced various effects on rice growth at the nutritional and reproductive growth stages and was reflected in differences in vertical phenotypic traits. In addition, reasonable short-term water regulation had the effect of optimizing rice architecture and increasing yield accumulation, which could be reflected by changes in the vertical phenotypic traits as well.
In conclusion, water regulation affects physiological processes such as water use, photosynthesis, and nutrient transformation in rice by altering plant morphological characteristics. Our research is helpful in evaluating the real-time effects of water regulation, providing a decision basis for rationalizing irrigation systems, and adjusting water conditions, which is enlightening for studying water-use mechanisms in rice under various water conditions.
The original contributions presented in this study are included in the article/Supplementary Material, further inquiries can be directed to the corresponding author.
YFZ designed and performed the experiments, wrote the algorithm, analyzed the data, and wrote the manuscript. YYZ put forward the hypothesis and edited the manuscript. YW designed and performed the experiments. HQ participated in the experimental work. XJ contributed to editing and revising the manuscript. All authors contributed to the article and approved the submitted version.
This work was supported by the National Key Research and Development Program of China (2021YFC3201204), Key Research and Development Program in Guangxi (AB19245039), Pudong New Area Science and Technology Development Fund (PKX2020-R07), Fundamental Research Funds for the Central Universities (2042021kf0200), and Open Research Fund of Guangxi Key Laboratory of Water Engineering Materials and Structures, Guangxi Institute of Water Resources Research (GXHRI-WEMS-2022-01).
The authors declare that the research was conducted in the absence of any commercial or financial relationships that could be construed as a potential conflict of interest.
All claims expressed in this article are solely those of the authors and do not necessarily represent those of their affiliated organizations, or those of the publisher, the editors and the reviewers. Any product that may be evaluated in this article, or claim that may be made by its manufacturer, is not guaranteed or endorsed by the publisher.
The Supplementary Material for this article can be found online at: https://www.frontiersin.org/articles/10.3389/fpls.2022.942110/full#supplementary-material
Aasen, H., Kirchgessner, N., Walter, A., and Liebisch, F. (2020). PhenoCams for Field Phenotyping: using very high temporal resolution digital repeated photography to investigate interactions of growth, phenology, and Harvest traits. Front. Plant Sci. 11:593. doi: 10.3389/fpls.2020.00593
Anshori, M. F., Purwoko, B. S., Dewi, I. S., Ardie, S. W., Suwarno, W. B., and Safitri, H. (2018). Determination of selection criteria for screening of rice genotypes for salinity tolerance. SABRAO J. Breed. Genet. 50, 279–294.
Barton, C. V. M. (2001). A theoretical analysis of the influence of heterogeneity in chlorophyll distribution on leaf reflectance. Tree Physiol. 21, 789–795. doi: 10.1093/treephys/21.12-13.789
Belder, P., Bouman, B. A. M., Cabangon, R., Guoan, L., Quilang, E. J. P., Yuanhua, L., et al. (2004). Effect of water-saving irrigation on rice yield and water use in typical lowland conditions in Asia. Agric. Water Manage. 65, 193–210. doi: 10.1016/j.agwat.2003.09.002
Bouman, B. A. M., Humphreys, E., Tuong, T. P., and Barker, R. (2007). Rice and Water. Adv. Agron. 92, 187–237. doi: 10.1016/S0065-2113(04)92004-4
Briglia, N., Montanaro, G., Petrozza, A., Summerer, S., Cellini, F., and Nuzzo, V. (2019). Drought phenotyping in Vitis vinifera using RGB and NIR imaging. Sci. Hortic. 256:108555. doi: 10.1016/j.scienta.2019.108555
Cal, A. J., Sanciangco, M., Rebolledo, M. C., Luquet, D., Torres, R. O., McNally, K. L., et al. (2019). Leaf morphology, rather than plant water status, underlies genetic variation of rice leaf rolling under drought. Plant Cell Environ. 42, 1532–1544. doi: 10.1111/pce.13514
Campbell, G. S. (1990). Derivation of an angle density function for canopies with ellipsoidal leaf angle distributions. Agric. For. Meteorol. 49, 173–176. doi: 10.1016/0168-1923(90)90030-A
Campbell, G. S., and Norman, J. M. (1990). “The description and measurement of plant canopy structure,” in Plant Canopies: Their Growth, Form and Function Society for Experimental Biology, Seminar Series 29, eds G. Russell, B. Marshall, and P. G. Jarvis (New York, NY: Cambridge University Press). doi: 10.1017/cbo9780511752308.002
Chen, D., Neumann, K., Friedel, S., Kilian, B., Chen, M., Altmann, T., et al. (2014). Dissecting the phenotypic components of crop plant growthand drought responses based on high-throughput image analysis. Plant Cell 26, 4636–4655. doi: 10.1105/tpc.114.129601
Cheng, J., Cao, C., Cai, M., Wang, J., Yuan, B., Wang, J., et al. (2006). Effects of different irrigation modes on biological characteristics and water use efficiency of paddy rice. Chin. J. Appl. Ecol. 17, 1859–1865.
Ciganda, V., Gitelson, A., and Schepers, J. (2008). Vertical profile and temporal variation of chlorophyll in maize canopy: quantitative “crop vigor” indicator by means of reflectance-based techniques. Agron. J. 100, 1409–1417. doi: 10.2134/agronj2007.0322
Cui, Y., Li, Y., Lu, G., and Sha, Z. (2004). Nitrogen movement and transformation with different water supply for paddy rice. Adv. Water Sci. 15, 280–285. doi: 10.1201/9780203086841
Duan, L., Han, J., Guo, Z., Tu, H., Yang, P., Zhang, D., et al. (2018). Novel digital features discriminate between drought resistant and drought sensitive rice under controlled and field conditions. Front. Plant Sci. 9:492. doi: 10.3389/fpls.2018.00492
Duursma, R. A., and Mäkelä, A. (2007). Summary models for light interception and light-use efficiency of non-homogeneous canopies. Tree Physiol. 27, 859–870. doi: 10.1093/treephys/27.6.859
Fan, P. P., Li, Y. Y., Evers, J. B., Ming, B., Wang, C. X., Li, S. K., et al. (2020). A new empirical equation to describe the vertical leaf distribution profile of maize. J. Agric. Sci. 158, 676–686. doi: 10.1017/S0021859621000010
Fisher, L. H. C., Han, J., Corke, F. M. K., Akinyemi, A., Fisher, L. H. C., Nielsen, K. K., et al. (2016). Linking dynamic phenotyping with metabolite analysis to study natural variation in drought responses of brachypodium distachyon. Front. Plant Sci. 7:1751. doi: 10.3389/fpls.2016.01751
Fournier, C., and Pradal, C. (2012). “A plastic, dynamic and reducible 3D geometric model for simulating gramineous leaves,” in Proceedings of the 2012 IEEE 4th International Symposium on Plant Growth Modeling, Simulation, Visualization and Applications, PMA, Shanghai, 125–132. doi: 10.1109/PMA.2012.6524823
Gao, Y., Hu, T., Wang, Q., Yuan, H., and Yang, J. (2019). Effect of drought–Flood abrupt alternation on rice yield and yield components. Crop Sci. 59, 280–292. doi: 10.2135/cropsci2018.05.0319
Hamuda, E., Mc Ginley, B., Glavin, M., and Jones, E. (2018). Improved image processing-based crop detection using Kalman filtering and the Hungarian algorithm. Comput. Electron. Agric. 148, 37–44. doi: 10.1016/j.compag.2018.02.027
He, J., Zhang, X., Guo, W., Pan, Y., Yao, X., Cheng, T., et al. (2020). Estimation of vertical leaf nitrogen distribution within a rice canopy based on Hyperspectral Data. Front. Plant Sci. 10:1802. doi: 10.3389/fpls.2019.01802
Hirooka, Y., Homma, K., and Shiraiwa, T. (2018). Parameterization of the vertical distribution of leaf area index (LAI) in rice (Oryza sativa L.) using a plant canopy analyzer. Sci. Rep. 8:6387. doi: 10.1038/s41598-018-24369-0
Honsdorf, N., March, T. J., Berger, B., Tester, M., and Pillen, K. (2014). High-throughput phenotyping to detect drought tolerance QTL in wild barley introgression lines. PLoS One 9:e97047. doi: 10.1371/journal.pone.0097047
Hu, J., Lin, H., Xu, N., Jiao, R., Dai, Z., Lu, C., et al. (2019). Advances in molecular mechanisms of rice leaf inclination and its application in breeding. Chin. J. Rice Sci. 33, 391–400. doi: 10.16819/j.1001-7216.2019.9029
Huang, J., Hu, T., Yasir, M., Gao, Y., Chen, C., Zhu, R., et al. (2019). Root growth dynamics and yield responses of rice (Oryza sativa L.) under drought—Flood abrupt alternating conditions. Environ. Exp. Bot. 157, 11–25. doi: 10.1016/j.envexpbot.2018.09.018
Huang, J., Wu, F., Hu, T., Liu, L., Wang, J., Wang, X., et al. (2021). Interactive Effects of Drought–Flood Abrupt Alternation on Morpho-Agronomic and Nutrient Use Traits in Rice. Agronomy 11:2103. doi: 10.3390/agronomy11112103
Ji, Z., Tardieu, F., Pridmore, T., Doonan, J., Reynolds, D., Hall, N., et al. (2018). Plant phenomics: history, present status and challenges. J. Nanjing Agric. Univ. 41, 580–588.
Jin, X., Zuo, Q., Ma, W., Li, S., Shi, J., Tao, Y., et al. (2016). Water consumption and water-saving characteristics of a ground cover rice production system. J. Hydrol. 540, 220–231. doi: 10.1016/j.jhydrol.2016.06.018
Kang, J., Hao, X., Zhou, H., and Ding, R. (2021). An integrated strategy for improving water use efficiency by understanding physiological mechanisms of crops responding to water deficit: present and prospect. Agric. Water Manage. 255:107008. doi: 10.1016/j.agwat.2021.107008
Laraswati, A. A., Padjung, R., Farid, M., Nasaruddin, N., Anshori, M. F., Nur, A., et al. (2021). Image-based phenotyping and selection index based on multivariate analysis for rice hydroponic screening under drought stress. Plant Breed. Biotechnol. 9, 272–286. doi: 10.9787/PBB.2021.9.4.272
Li, L., Zhang, Q., and Huang, D. (2014). A review of imaging techniques for plant phenotyping. Sensors 14, 20078–20111. doi: 10.3390/s141120078
Li, P., and Wang, Q. (2013). Developing and validating novel hyperspectral indices for leaf area index estimation: effect of canopy vertical heterogeneity. Ecol. Indic. 32, 123–130. doi: 10.1016/j.ecolind.2013.03.025
Liang, H., Yang, S., Xu, J., and Hu, K. (2021). Modeling water consumption, N fates, and rice yield for water-saving and conventional rice production systems. Soil Tillage Res. 209:104944. doi: 10.1016/j.still.2021.104944
Luo, L., Mei, H., Yu, X., Xia, H., Chen, L., Liu, H., et al. (2019). Water-saving and drought-resistance rice: from the concept to practice and theory. Mol. Breed. 39:145. doi: 10.1007/s11032-019-1057-5
Malinowska, M., Donnison, I. S., and Robson, P. R. H. (2017). Phenomics analysis of drought responses in Miscanthus collected from different geographical locations. GCB Bioenergy 9, 78–91. doi: 10.1111/gcbb.12350
Mantilla-Perez, M. B., and Salas Fernandez, M. G. (2017). Differential manipulation of leaf angle throughout the canopy: current status and prospects. J. Exp. Bot. 68, 5699–5717. doi: 10.1093/jxb/erx378
Martin-Ducup, O., Schneider, R., and Fournier, R. A. (2018). Analyzing the vertical distribution of crown material in mixed stand composed of two temperate tree species. Forests 9, 1–23. doi: 10.3390/f9110673
Meier, U. (2001). Growth Stages of Mono-and Dicotyledonous Plants: BBCH Monograph, 2nd Edn. (Berlin: Federal Biological Research Centre for Agriculture and Forestry), 66–70.
Mohan, P. J., and Gupta, S. D. (2019). Intelligent image analysis for retrieval of leaf chlorophyll content of rice from digital images of smartphone under natural light. Photosynthetica 57, 388–398. doi: 10.32615/ps.2019.046
Moshou, D., Pantazi, X. E., Kateris, D., and Gravalos, I. (2014). Water stress detection based on optical multisensor fusion with a least squares support vector machine classifier. Biosyst. Eng. 117, 15–22. doi: 10.1016/j.biosystemseng.2013.07.008
Nelson, A. S., Weiskittel, A. R., and Wagner, R. G. (2014). Development of branch, crown, and vertical distribution leaf area models for contrasting hardwood species in Maine, USA. Trees 28, 17–30. doi: 10.1007/s00468-013-0926-5
O’Toole, J. C., and Cruz, R. T. (1980). Response of Leaf Water Potential, Stomatal Resistance, and Leaf Rolling to Water Stress. Plant Physiol. 65, 428–432. doi: 10.1104/pp.65.3.428
Pei, Q., Yuanlai, C., Huanhao, H., and Bo, L. (2015). Effect of flooding irrigation and intermittent irrigation patterns on weed community diversity in late rice fields. Trans. Chin. Soc. Agric. Eng. 31, 115–121.
Peng, S. (2000). Redesigning rice photosynthesis to increase yield, proceedings of the workshop on the quest to reduce hunger:redesigning rice photosynthesis. Stud. Plant Sci. 7, 213–228. doi: 10.1016/S0928-3420(00)80017-8
Peng, Y., and Xie, X. (2020). Application of phenomics in rice research. Chin. J. Rice Sci. 34, 300–306. doi: 10.16819/j.1001-7216.2020.9083
Perez, R. P. A., Fournier, C., Cabrera-Bosquet, L., Artzet, S., Pradal, C., Brichet, N., et al. (2019). Changes in the vertical distribution of leaf area enhanced light interception efficiency in maize over generations of selection. Plant Cell Environ. 42, 2105–2119. doi: 10.1111/pce.13539
Petrozza, A., Santaniello, A., Summerer, S., Di Tommaso, G., Di Tommaso, D., Paparelli, E., et al. (2014). Physiological responses to Megafol® treatments in tomato plants under drought stress: a phenomic and molecular approach. Sci. Hortic. 174, 185–192. doi: 10.1016/j.scienta.2014.05.023
Pieruschka, R., and Schurr, U. (2019). Plant phenotyping: past, present, and future. Plant Phenomics 2019:7507131. doi: 10.34133/2019/7507131
Rahaman, M. M., Chen, D., Gillani, Z., Klukas, C., and Chen, M. (2015). Advanced phenotyping and phenotype data analysis for the study of plant growth and development. Front. Plant Sci. 6:619. doi: 10.3389/fpls.2015.00619
Saitoh, K., Yonetani, K., Murota, T., and Kuroda, T. (2002). Effects of flag leaves and panicles on light interception and canopy photosynthesis in high-yielding rice cultivars. Plant Prod. Sci. 5, 275–280. doi: 10.1626/pps.5.275
Song, B., Chen, J., Desanker, P. V., Reed, D. D., Bradshaw, G. A., and Franklin, J. F. (1997). Modeling canopy structure and heterogeneity across scales: from crowns to canopy. For. Ecol. Manage. 96, 217–229. doi: 10.1016/S0378-1127(97)00021-2
Tester, M., and Langridge, P. (2010). Breeding technologies to increase crop production in a changing world. Science 327, 818–822. doi: 10.1126/science.1183700
Thakur, A. K., Mohanty, R. K., Patil, D. U., and Kumar, A. (2014). Impact of water management on yield and water productivity with system of rice intensification (SRI) and conventional transplanting system in rice. Paddy Water Environ. 12, 413–424. doi: 10.1007/s10333-013-0397-8
Thanikkal, J. G., Dubey, A. K., and Thomas, M. T. (2018). “Advanced plant leaf classification through image enhancement and canny edge detection,” in Proceedings of the 2018 7th International Conference on Reliability, Infocom Technologies and Optimization: Trends and Future Directions, ICRITO, Noida, 518–522. doi: 10.1109/ICRITO.2018.8748587
Walter, A., Liebisch, F., and Hund, A. (2015). Plant phenotyping: from bean weighing to image analysis. Plant Methods 11:14. doi: 10.1186/s13007-015-0056-8
Wang, D., Fu, Y., Yang, G., Yang, X., Liang, D., Zhou, C., et al. (2019). Combined use of FCN and harris corner detection for counting wheat ears in field conditions. IEEE Access 7, 178930–178941. doi: 10.1109/ACCESS.2019.2958831
Wang, Y., and Li, J. (2005). The plant architecture of rice (Oryza sativa). Plant Mol. Biol. 59, 75–84. doi: 10.1007/s11103-004-4038-x
Xiao, F., Li, W., Xiao, M., Yang, Z., Cheng, W., Gao, S., et al. (2021). A novel light interception trait of a hybrid rice ideotype indicative of leaf to panicle ratio. Field Crops Res. 274:108338. doi: 10.1016/j.fcr.2021.108338
Keywords: drought response, drought-rehydration, image processing, vertical structural traits, rice vertical heterogeneity
Citation: Zhang Y, Zha Y, Jin X, Wang Y and Qiao H (2022) Changes in Vertical Phenotypic Traits of Rice (Oryza sativa L.) Response to Water Stress. Front. Plant Sci. 13:942110. doi: 10.3389/fpls.2022.942110
Received: 12 May 2022; Accepted: 20 June 2022;
Published: 14 July 2022.
Edited by:
Sruti Das Choudhury, University of Nebraska-Lincoln, United StatesReviewed by:
Yong Suk Chung, Jeju National University, South KoreaCopyright © 2022 Zhang, Zha, Jin, Wang and Qiao. This is an open-access article distributed under the terms of the Creative Commons Attribution License (CC BY). The use, distribution or reproduction in other forums is permitted, provided the original author(s) and the copyright owner(s) are credited and that the original publication in this journal is cited, in accordance with accepted academic practice. No use, distribution or reproduction is permitted which does not comply with these terms.
*Correspondence: Yuanyuan Zha, emhheXVhbjg3QHdodS5lZHUuY24=
Disclaimer: All claims expressed in this article are solely those of the authors and do not necessarily represent those of their affiliated organizations, or those of the publisher, the editors and the reviewers. Any product that may be evaluated in this article or claim that may be made by its manufacturer is not guaranteed or endorsed by the publisher.
Research integrity at Frontiers

Learn more about the work of our research integrity team to safeguard the quality of each article we publish.