 Caijing Li1,2†Changsheng Lu1,2†Baoli Zou1,2Mengmeng Yang1,2Guangliang Wu1,2Peng Wang1,2Qin Cheng1,2Yanning Wang1,2
 Qi Zhong1,2Shiying Huang1,2Tao Huang1,2Haohua He1,2*
 Jianmin Bian1,2*
- 1Key Laboratory of Crop Physiology, Ecology and Genetic Breeding, Ministry of Education, Nanchang, China
- 2Key Laboratory of Crop Physiology, Ecology and Genetic Breeding, Nanchang, China
Salt stress is one of the factors that limits rice production, and an important task for researchers is to cultivate rice with strong salt tolerance. In this study, 211 rice accessions were used to determine salt tolerance germinability (STG) indices and conduct a genome-wide association study (GWAS) using 36,727 SNPs. The relative germination energy (RGE), relative germination index (RGI), relative vigor index (RVI), relative mean germination time (RMGT), relative shoot length (RSL), and relative root length (RRL) were used to determine the STG indices in rice. A total of 43 QTLs, including 15 for the RGE, 6 for the RGI, 7 for the RVI, 3 for the RMGT, 1 for the RSL, and 11 for the RRL, were identified on nine chromosome regions under 60 and 100 mM NaCl conditions. For these STG-related QTLs, 18 QTLs were co-localized with previous studies, and some characterized salt-tolerance genes, such as OsCOIN, OsHsp17.0, and OsDREB2A, are located in these QTL candidates. Among the 25 novel QTLs, qRGE60-1-2 co-localized with qRGI60-1-1 on chromosome 1, and qRGE60-3-1 and qRVI60-3-1 co-localized on chromosome 3. According to the RNA-seq database, 16 genes, including nine for qRGE60-1-2 (qRGI60-1-1) and seven for qRGE60-3-1 (qRVI60-3-1), were found to show significant differences in their expression levels between the control and salt treatments. Furthermore, the expression patterns of these differentially expressed genes were analyzed, and nine genes (five for qRGE60-1-2 and four for qRGE60-3-1) were highly expressed in embryos at the germination stage. Haplotype analysis of these nine genes showed that the rice varieties with elite haplotypes in the LOC_Os03g13560, LOC_Os03g13840, and LOC_Os03g14180 genes had high STG. GWAS validated the known genes underlying salt tolerance and identified novel loci that could enrich the current gene pool related to salt tolerance. The resources with high STG and significant loci identified in this study are potentially useful in breeding for salt tolerance.
Introduction
As the world's population continues to increase, researchers predict that food production must increase by at least 70% over the next 40 years to meet demand (Tilman et al., 2011). Rice is one of the world's most important food crops and feeds more than half of the world's population. Therefore, improving rice yields under conditions of limited arable land is an urgent problem for researchers to solve. The traditional rice transplanting mode is time-consuming and labor-intensive and has been gradually replaced in recent years by a direct seeding mode in many areas (Wang et al., 2011); at the same time, this development also means higher requirements for the germination ability of rice seeds in harsh environments.
Salt stress is one of the main factors that limits direct seeding of rice. Salinity alters the osmotic potential of the germination medium, enzyme activities in cells, and destroys cell structures so that seeds cannot germinate normally and establish stable stands of seedlings, which finally affects rice yields (Koyro, 2002; Khan and Weber, 2006; Gomes-Filho et al., 2008). Therefore, unraveling the genetic architecture for salt tolerance germinability and cultivating rice varieties with high STG are very important in accomplishing direct rice seeding.
To our knowledge, only a few genes have been reported to be involved in STG. Of those, OsHsp17.0 encodes heat shock proteins (Hsps), and its overexpression in plants demonstrated higher germination abilities than those of wild-type (WT) plants when subjected to NaCl (Zou et al., 2012). The basic helix-loop-helix (bHLH) transcription factor, OsbHLH035, is a salt-induced gene, and Osbhlh035 mutants exhibit delayed seed germination, especially under salt stress conditions (Chen et al., 2018). Under salt stress, qSE3 promoted the absorption of K+ and Na+, induced abscisic acid biosynthesis and abscisic acid signaling pathway gene expression, inhibited the accumulation of reactive oxygen species in seeds, and thus improved the salt tolerance of seeds during germination (He et al., 2019). NaCl promoted the expression of OsNAC45 in roots, and the knockout of OsNAC45 resulted in greater ROS accumulations in roots and increased the sensitivity of rice to salt stress (Zhang et al., 2020). Therefore, to obtain more causal genes, we must use more germplasm resources, identify more QTLs, and screen more candidate genes to better understand the genetic mechanism of STG.
Salt tolerance is a complex quantitative trait that is often controlled by multiple genes and the environment. To better understand the genetic mechanism of salt tolerance in rice at the germination stage, many QTLs have been identified by using traditional QTL mapping methods in biparental populations. A total of 16 QTLs were detected during the germination stage under 100 mM NaCl conditions from a RILs that were derived from a cross between Jiucaiqing (salt-tolerant) and IR26 (salt-susceptible; Wang et al., 2011); a total of 11 QTLs were identified for their salt tolerance (1.5% NaCl) at the germination stage by using linkage mapping from a BC2F2:3 population including 190 accessions that were derived from Dongnong 425 and Changbai 10 (Zheng et al., 2014); 17 QTLs that were related to germination traits under salt stress (80 mM NaCl) in an F2:4 population were detected, which were derived from a cross between the salt-tolerant variety “Gharib” and salt-sensitive variety “Sepidroud” (Mardani et al., 2014); 10 QTLs for five salt stress (0.01 mol L−1)-related traits were detected a population of backcross inbred lines, which was derived from a cross between Changhui 891 and 02428 with 3,057 bin markers (Luo et al., 2020); 13 QTLs were identified under H2O conditions and salt conditions (300 mM NaCl) by using a BC1F2 population that derived from a WJZ/Nip cross (Zeng et al., 2021); 23 QTLs for germination parameters were detected under 18 dS m−1 NaCl solution conditions by using a BIL population that was derived from a backcross of an African rice, ACC9, as the donor and indica cultivar Zhenshan97 (ZS97) as the recurrent parent (Nakhla et al., 2021). Biparental populations, although, have played an important role in the past to provide a resource for researchers to work with; construction of populations entails major investments in time, which has therefore limited the number of genes identified to date (Bian et al., 2010).
With the rapid development of NGS (next-generation sequencing) and the existence of high-density SNP markers obtained through resequencing, an increasing number of studies have used GWAS as an efficient strategy to replace the traditional QTL mapping method (Huang et al., 2012). In rice, some studies have applied this method to study rice STG indices. A total of nine significant markers were identified under salt conditions by using 276 indica accessions (Cheng et al., 2015); 11 QTLs were identified based on the stress-susceptibility indices (SSIs) of the vigor index (VI) and mean germination time (MGT) in 478 diverse rice accessions (Shi et al., 2017); six quantitative trait nucleotides (QTNs) that affect salt tolerance at the germination stage were identified by GWAS using a panel of 208 rice mini-core accessions (Naveed et al., 2018); 371 QTNs were identified by using six multilocus GWAS methods for the salt tolerance traits of 478 rice accessions at the seed germination stage (Cui et al., 2018); a total of 12 associated peaks were detected by using GWAS in 295 rice accessions during the germination stage (Yu et al., 2018); and 21 QTLs associated with salinity stress were detected in 498 highly diverse rice accessions (Islam et al., 2022). However, to our knowledge, there are still few studies on the identification of QTLs/genes, particularly for the salt tolerance in the germination stage using GWAS in rice. Here, we applied GWAS mapping and used 36,727 SNPs that covered all 12 rice chromosomes in a natural population that consisted of 211 rice accessions to identify QTLs/candidate genes that may contribute to salt tolerance during the rice germination stage with the aim of guiding the breeding of salt-tolerant rice varieties.
Materials and Methods
Plant Materials
All materials used in this study were derived from Li et al. (2021). A set of 211 accessions of diverse germplasm accessions representing the major rice-growing regions in China was selected from the International Rice Research Institute (https://www.irri.org/) to comprise the materials used in this work. All data of 36,727 SNPs are published at https://snp-seek.irri.org/. This pool of germplasm accessions consists of two subpopulations, including 130 indica and 81 japonica, and these 211 rice accessions were divided into two subgroups by using principal component analysis and relationship analysis, which suggested that these germplasm resources had abundant genetic diversity, which was beneficial for performing GWAS.
Evaluation of Salt Tolerance Germinability
All of the yellow, ripe seeds from each accession were dried at 45°C for 2 days to break seed dormancy. The seeds were surface-sterilized with a 15% sodium hypochlorite solution for 15 min and then rinsed three times with sterile distilled water before the germination experiment. A total of 30 sterilized seeds from each accession were placed on two filter papers soaked with 10 ml of sodium chloride in Petri plates (9 cm) during the germination stage to screen the salinity tolerances, and the concentrations of the sodium chloride solutions were 60 and 100 mM. In the control treatment, the same number of seeds per line was placed on filter papers in Petri dishes that were soaked in 10 ml of distilled water. All Petri dishes were incubated under controlled conditions in a growth chamber at a temperature of 28°C with 12 h each of light and dark. The seed germination time was 7 days, and the numbers of seeds from each accession that germinated were recorded each day. On the 7th day, 10 seedlings from each accession were selected for calculations of shoot length (SL) and root length (RL), and the sodium chloride solutions in the Petri dishes were changed every 2 days. All experiments were repeated three times. The relative germination energy (RGE), relative germination index (RGI), relative vigor index (RVI), relative mean germination time (RMGT), relative shoot length (RSL), and relative root length (RRL) were calculated and subjected to a GWAS, and the calculation formula refers to Yu et al. (2018).
GE = Number of germinated seeds at 4 days/Total number of seeds tested × 100%.
GI = Σ(Gt/t), where Gt is the number of seeds that germinated on day t.
VI = GI × SL
MGT = Mean germination time (MGT) = ∑Dn/∑n, where n is the number of seeds that germinated on D day, and D is the number of days counted.
Relative value = Value under salt stress/control.
All phenotypic data are presented in Supplementary Table 1. Each index at the two concentrations is divided into five parts. The larger the RMGT value is, the lower the score, and the larger the values of other indices are, the higher the score. The total score of the 12 indices for each accession represents the STG of this accession, and the specific evaluation criteria are shown in Supplementary Table 2.
Genome-Wide Association Analysis
The Tassel 5.2.73 software and a mixed linear model (MLM) with a PCA matrix (the first five PCs were used) and kinship (K matrix) were used to determine the associations among SNP markers and the 12 phenotypic traits. To ensure data accuracy, the phenotypic data were standardized, and the SNP data (36,727 SNPs) were filtered (in Tassel 5.2.73, the genotypic data were first numerically analyzed, then SNPs with minor allele frequencies <0.05 were removed, and 33,777 SNPs were finally obtained and used for GWAS) before association mapping. Manhattan plots were generated using the Cloud platform (http://www.cloud.biomicroclass.com/).
Candidate Gene Analyses
The LD blocks were used to identify candidate gene regions using the Haploview 4.2 software (Barrett et al., 2005). The SNPs with the most significant associations in a block were identified as the leading SNPs, and LD blocks containing significantly associated SNPs were defined as candidate genomic regions. Differentially expressed genes were identified using the Plant Public RNA-seq Database (Yu et al., 2022). The expression patterns of the differentially expressed genes were analyzed using publicly available microarray data (http://www.genevestigator.com/). Haplotype analyses were performed using RiceVarMap V2.0 (Zhao et al., 2015). Information on candidate genes was collected and classified by the NCBI (https://www.ncbi.nlm.nih.gov/), China Rice Data Center (https://www.ricedata.cn/), and the Rice Genome Annotation Project (http://rice.uga.edu/index.shtml).
Quantitative Real-Time PCR Analysis
Embryos of seeds that were germinated in water and in 60 mM NaCl solutions for 2 days were collected for expression analysis. Total RNA was prepared using a MiniBEST Plant RNA Extraction kit (Takara, China). The corresponding sequences of these genes were obtained from the Rice Genome Annotation Project (http://rice.uga.edu/index.shtml). The primers (e.g., LOC_Os03g13560-F: CAGATTGTGATATGGTGTTCGGC; LOC_Os03g13560-R: GGAGACTGAGAAGCTGTCATCAT; LOC_Os03g13840-F: CTGGACAAGGTACTGGAGGAGTA; LOC_Os03g13840-R: CGTTCTTTCCAGACACCTCTACA; LOC_Os03g14180-F: AGGTGAGGATGCGGTTCG; and LOC_Os03g14180-R: CGCTCACAGGCTCACATCC) were designed based on the CDSs of the corresponding genes by using Primer3Plus (https://www.primer3plus.com/). OsActin was used as the internal control. Real-time PCR was carried out using the SYBR Green method, and the relative expression levels were calculated using the 2−ΔΔCT method.
Statistical Analysis and Mapping
The mean values and standard errors of the phenotypic data were calculated using Microsoft Excel 2010, and the correlation coefficients were calculated using the SPSS 26.0 software. Box plots were created using the OriginPro 2021 software.
Results
Phenotypic Analysis of the 211 Rice Accessions and Correlations Among STG Indices
In this study, two sodium chloride concentrations (e.g., 60 and 100 mM) were selected to conduct an STG assessment. After 7 days of germination, the growth states of 211 rice varieties under the two salt solutions were inhibited compared with the control treatment, but the distribution of the inhibition degree among different varieties was different (Figure 1), which indicates that both sodium chloride concentrations are suitable for screening salt-tolerant and salt-sensitive varieties. The salt-tolerant rice varieties identified in this study can be used as excellent parent resources in subsequent breeding projects.
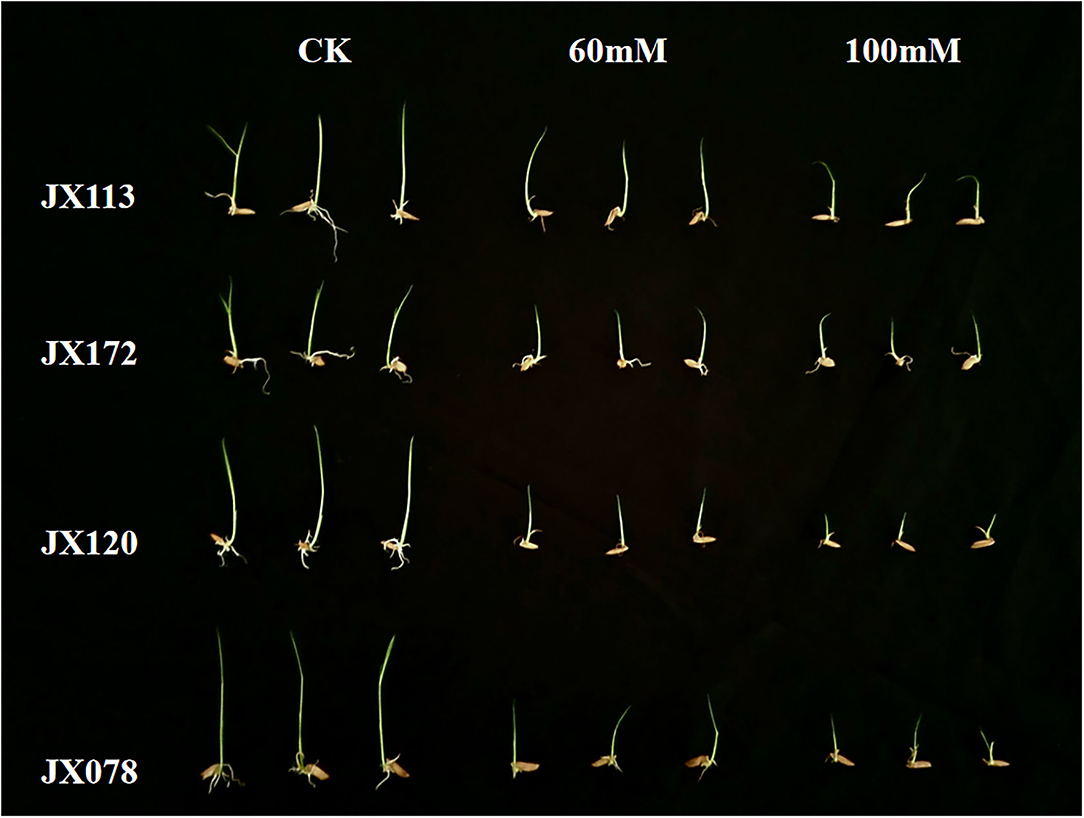
Figure 1. Comparison of growth status of two salt-tolerant rice varieties (JX 113 and JX 172) and two salt-sensitive rice varieties (JX 120 and JX 078) after 7 days of control treatment and 60 and 100 mM NaCl solution.
Six indices obtained under two sodium chloride concentrations were used to evaluate the STG in this natural population, and all of the indices showed large phenotypic variations among the rice accessions (Table 1). In particular, except for RMGT60 and RMGT100, the values of all indices were widely distributed, and the coefficients of variation were very large. This result suggested that these STG indices may be suitable for performing a GWAS. In addition, six STG-related indices were compared among different subgroups in the population (Figure 2; Supplementary Figure 1). Under the 60 mM NaCl condition, the RSL, RGE, RGI, and RVI values of the japonica group were significantly lower than those of the indica group (p < 0.01), but the RRL and RMGT values exhibited no significant differences between the two subgroups. On contrary, at an NaCl concentration of 100 mM, the RSL, RGE, RGI, and RVI values in the indica subgroup were higher than those in the japonica subgroup, but the RRL values in the japonica subgroup were higher than those in the indica subgroup, and there were no significant differences in the RMGT values between the two subgroups. We used these six indices to define a scoring standard to screen varieties with high STG, and the results showed that most indica rice varieties generally had greater STG than the japonica rice varieties (Figure 3).
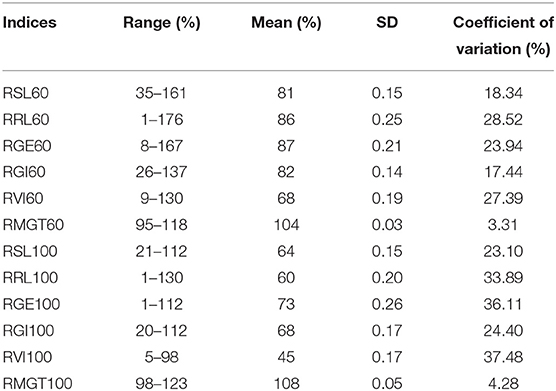
Table 1. The distribution of STG indices in 211 rice accessions.
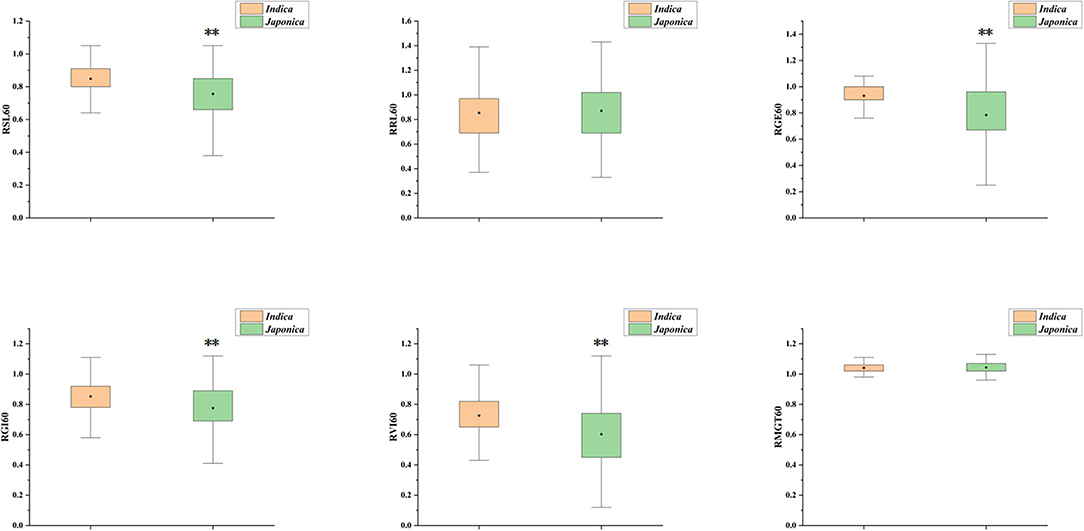
Figure 2. Box plot for comparison of six indices between indica and japonica subgroups under 60 mM NaCl. The yellow box represents indica, the green box represents japonica, the black dot in the box represents the median, and the value range of the box is 25–75%, **Indicates significance at the 1% level.
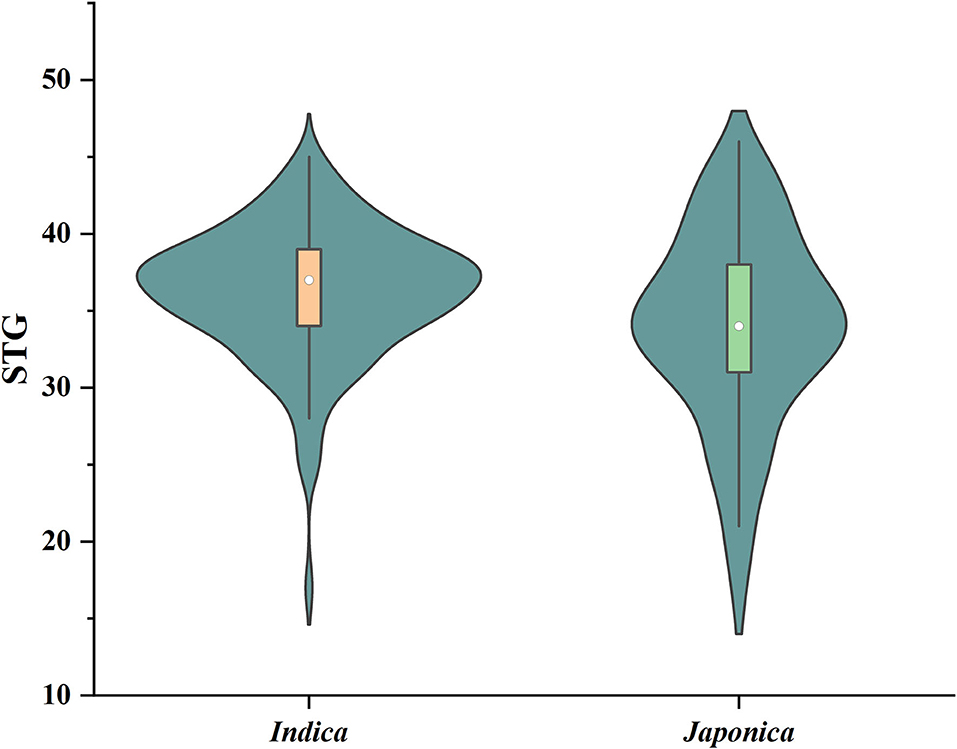
Figure 3. Violin diagram of the distribution of STG values of indica and japonica subgroups. Boxes in violins range in value from 25 to 75%, with white dots representing the median.
To determine how the mean values of the different STG indices for each accession compared to each other, pairwise Pearson's correlation analysis was conducted (Figure 4). Under the 60 mM NaCl condition, the RSL, RRL, RGE, RGI, and RVI values were all positively correlated to varying degrees, and they were all significantly negatively correlated with the RMGT. However, the RSL had no correlation with RRL at a concentration of 100 mM, but both were significantly positively correlated with the RGE, RGI, and RVI values, and the RMGT was significantly negatively correlated with the other five indices. These results suggest that the RGE, RGI, RVI, and RMGT indices might share genetic pathways under both the 60 and 100 mM salt treatments. In addition, a correlation analysis between the two treatments was conducted. The results showed that there were significant positive correlations between the two, and the correlation coefficient was 0.568.
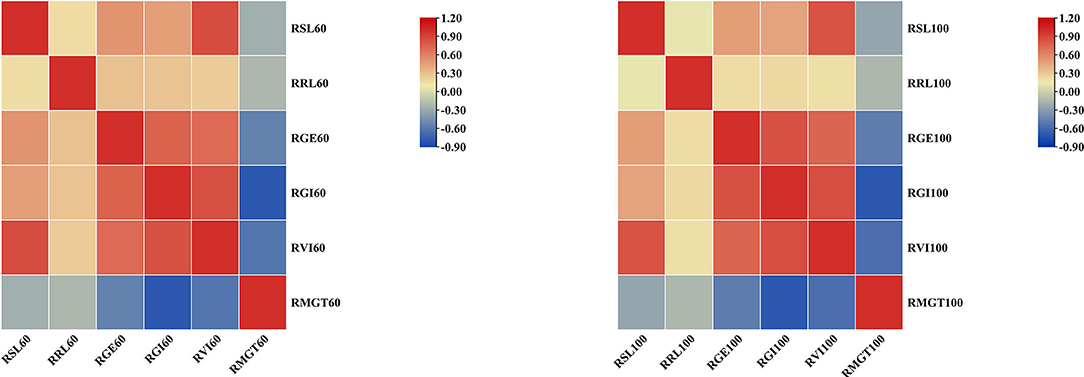
Figure 4. Heat map of correlation analysis between six indices under two different concentrations of salt solution. Blocks that tend to be red or blue indicate greater absolute values of the correlation coefficients.
Identification of QTLs for Salt Tolerance Germinability by GWAS
To investigate the possible genetic architecture of STG, a GWAS was conducted, and Manhattan plots were generated to illustrate the significant SNP associations with STG (Figure 5; Supplementary Figure 2). A total of 43 QTLs, including 15 for RGE, 6 for RGI, 7 for RVI, 3 for RMGT, 1 for RSL, and 11 for RRL, which were associated with STG, were identified in rice (Table 2). On chromosome 1, 10 QTLs were discovered for the first time, among which qRGE60-1-2 overlapped with qRGI60-1-1 and was located at 1.2 Mb, and qRVI60-1-2 and qRGI60-1-4 were co-localized at 3.5 Mb. In addition, nine QTLs were co-localized with those described in previous studies: qRRL-100-1 was located at 0.2 Mb and overlapped with OsCOIN (Liu et al., 2007); qRGE60-1-2, qRGI60-1-2 and qRMGT60-1-1 overlapped with each other, and a previously cloned gene related to salt stress, OsHsp17.0 (Zou et al., 2012), was located in this region; at ~3 Mb, three QTLs (e.g., qRGI60-1-3, qRVI60-1-1, and qRGE60-1-4) were co-located with each other, and OsDREB2A (Mallikarjuna et al., 2011) was located in this region; and two QTLs related to RRL, namely, qRRL60-1-2 and qRRL60-1-3, overlapped with OsPLDα1 (Shen et al., 2011) and OrbHLH001 (Chen et al., 2013), respectively. These QTLs had explained phenotypic variances (R2) ranging from 5.48% for qRGE60-1-2 to 9.76% for qRGE60-1-3. Only three QTLs were identified on chromosome 2, among which qRRL60-2-1 overlapped with a previously reported STG QTL, qGR-3d2 (Nakhla et al., 2021), and the peak SNP was chrA02_4380604. Seven QTLs mapped to chromosome 3 and qRGE60-3-1 and qRVI60-3-1 shared the same SNP peak at 7.66 Mb, three QTLs from two indices (e.g., qRGE60-3-3, qRGE100-3, and qRVI60-3-2) shared the same SNP peak at 9.85 Mb, while this QTL region contains OsMAPK5 (Xiong and Yang, 2003), a salt stress-related gene. These QTLs had explained phenotypic variances (R2) ranging from 7.46% for qRVI60-3-1 to 12.27% for qRGE60-3-3. In the remaining chromosomes, 5, 6, 7, 9, 10, and 11, five QTL regions were co-localized with previously reported salt-tolerant QTLs or genes (Park et al., 2010; Li et al., 2015; Nakhla et al., 2021), and the explained phenotypic variances (R2) ranged from 5.41% for qRVI60-5 to 10.14% for qRGE60-11. We noted that many RGE, RGI, RVI, and RMGT QTLs mapped to identical locations with the same peak SNPs. This supports our previous speculation that these four indices might share genetic pathways.
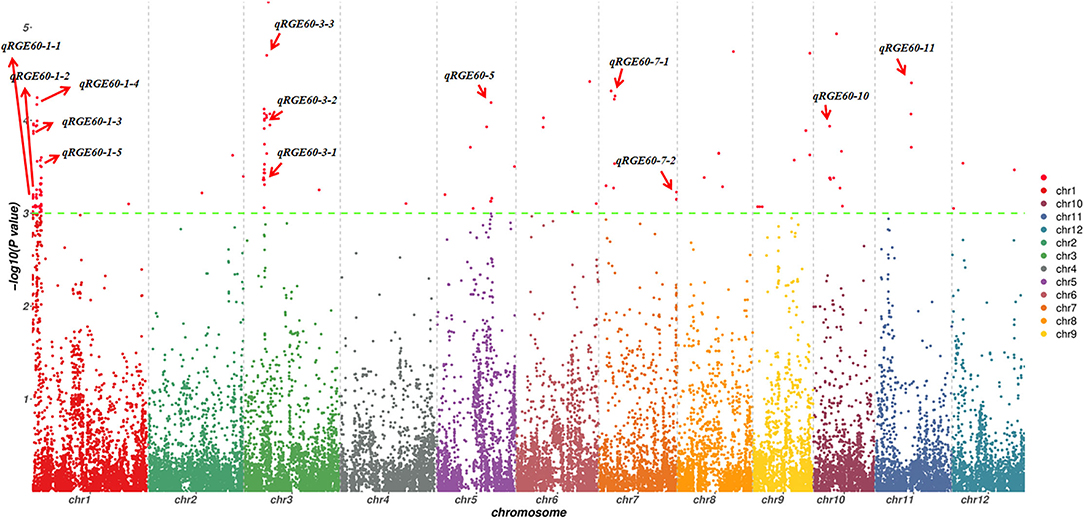
Figure 5. Manhattan plots of GWAS for RGE under 60 mM NaCl. The red arrow indicates QTLs detected from six indices.
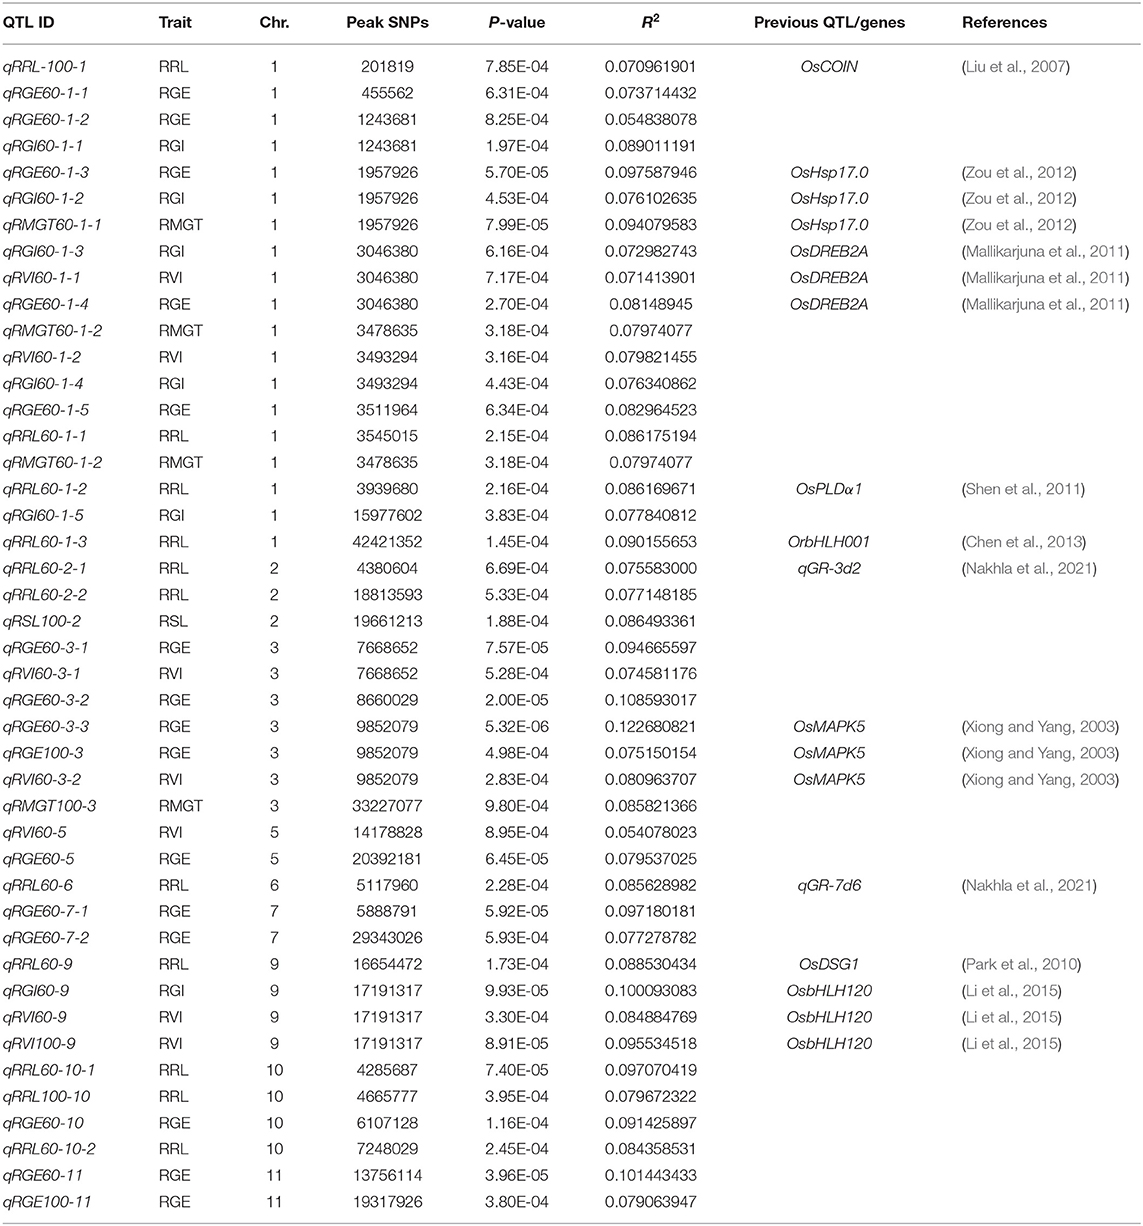
Table 2. Summary of the significant SNPs detected by GWAS and the overlapping QTLs reported previously.
Candidate Gene Prediction and Expression Profiling
One QTL, qRGE60-1-2 (qRGI60-1-1), which controls both RGE and RGI on chromosome 1, was identified by GWAS. According to the LD decay analysis, a 321-kb region was identified as the candidate region for qRGE60-1-2 (Figure 6A), which contained 52 genes, including 25 functionally annotated genes, 18 expressed proteins with unknown functions, four retrotransposon proteins, three transposon proteins, and two hypothetical proteins (Supplementary Table 3). To decrease the number of candidate genes, genes categorized as expressed proteins, hypothetical proteins, retrotransposons, and transposons were discarded. Among the 25 functionally annotated genes, nine genes were found to exhibit significant differences in their expression levels between the control and salt treatments according to the Plant Public RNA-seq Database (|logFoldChange| ≥ 1.5), among which seven genes were upregulated under salt stress, one gene was downregulated, and the other gene had different expression trends under the different projects (Supplementary Table 4).
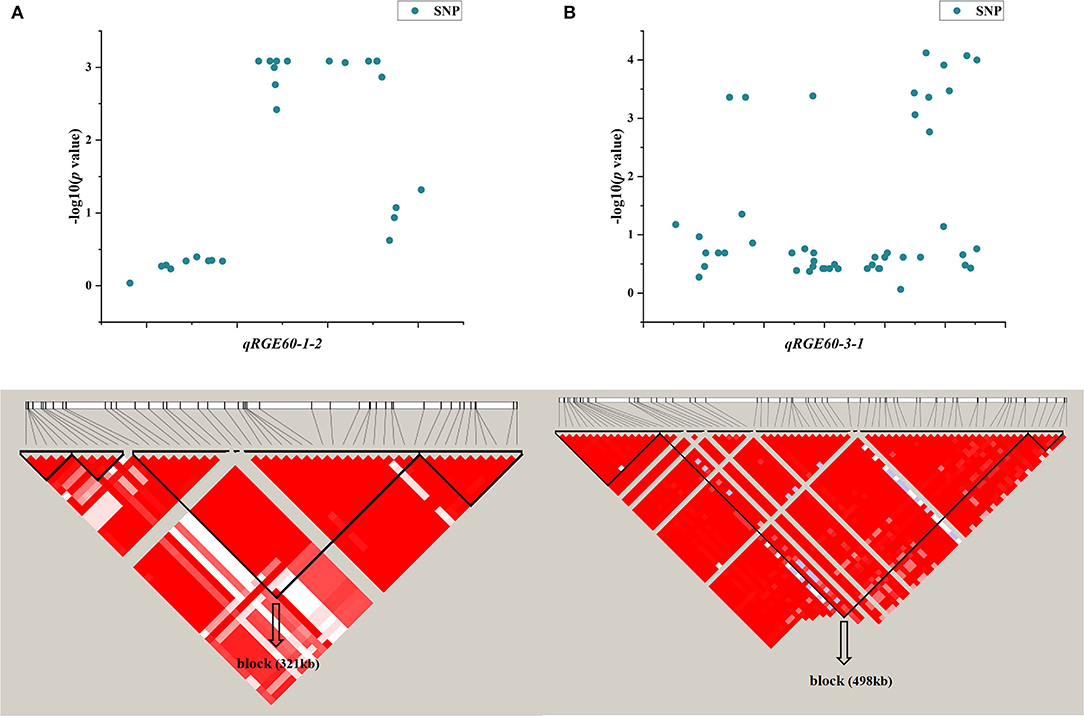
Figure 6. LD block of candidate region estimation of two major QTLs, namely, qRGE60-1-2 (A) and qRGE60-3-1 (B).
Another QTL, qRGE60-3-1 (qRVI60-3-1), is also considered a candidate, which controls both RGE and RVI on chromosome 3. According to the LD decay analysis, a 489-kb region was identified as the candidate region (Figure 6B), and it contained 42 functionally annotated genes (Supplementary Table 3). According to the RNA-seq database (|logFoldChange| ≥ 1.5), the expression levels of seven genes were changed under salt stress, among which four genes were upregulated and three genes were downregulated (Supplementary Table 4).
To further decrease the number of candidate genes, the expression patterns of these 16 differentially expressed genes were identified by using Genevestigator. Fortunately, nine genes (e.g., LOC_Os01g02930, LOC_Os01g02940, LOC_Os01g03330, LOC_Os01g03340, LOC_Os01g03360, LOC_Os03g13560, LOC_Os03g13840, LOC_Os03g14050, and LOC_Os03g14180) were determined to be highly expressed in embryos (Figure 7; Supplementary Figure 3), which suggested that these nine genes are involved in rice seed germination under salt stress and could be candidates for STG.
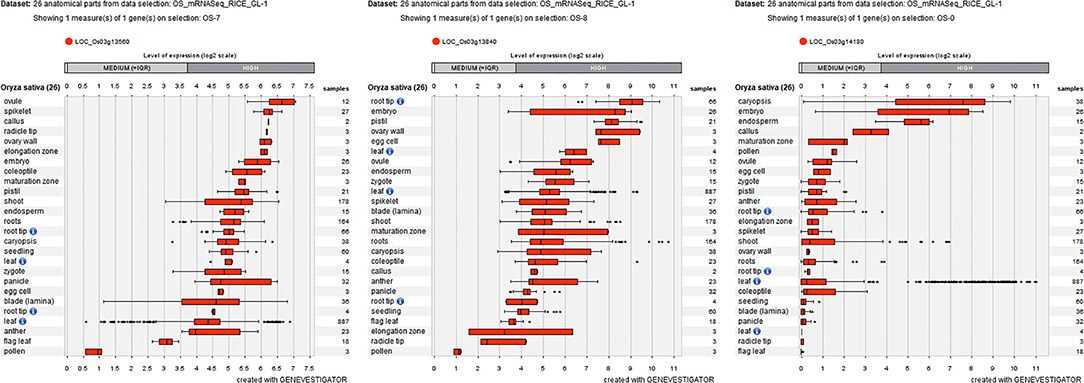
Figure 7. Three differentially expressed genes (LOC_Os03g13560, LOC_Os03g13840, and LOC_Os03g14180) are highly expressed in embryos labeled by Geneinvestigator. The * represent discrete point.
Natural Allelic Variations of Candidate Genes Contribute to Salt Tolerance Germinability
As noted above, most indica rice varieties in our population had higher STG levels than japonica rice varieties, and we therefore investigated whether variations in the candidate gene alleles contributed to these differences. Haplotype analyses were performed using all non-synonymous SNPs within their ORFs by RiceVarMap v2.0. Finally, it was found that three genes had different haplotypes between indica and japonica. The LOC_Os03g13560 gene harbored a total of four non-synonymous SNPs, namely, vg0307328618 (G/T), vg0307330319 (A/G), vg0307331295 (C/T), and vg0307334743 (C/T). Four distinct haplotypes, including two major haplotypes, namely, Hap I and Hap II, were identified based on the four non-synonymous SNPs in cultivated rice and exhibited large genetic differences between indica and japonica (Figure 8A). There are five non-synonymous SNPs in LOC_Os03g13840, namely, vg0307499320 (C/T), vg0307500449 (G/C), vg0307501727 (G/A), vg0307503107 (C/A), and vg0307503164 (C/T). Six major haplotypes were observed at LOC_Os03g13840, which encodes a senescence-associated protein. Hap I was present in japonica, and Hap II, III, and IV were present primarily in indica (Figure 8B). Interestingly, Hap II was carried in ~16% of japonica accessions, which indicated that elite indica alleles had been introgressed into japonica accessions through breeding to the extent that a small percentage of the japonica accessions (such as JX172 and JX224) included in our population had high STG levels. A total of three non-synonymous SNPs [e.g., vg0307697206 (C/G), vg0307697461 (G/T), and vg0307697508 (C/T)] in LOC_Os03g14180 identified three haplotypes (Figure 8C). The vast majority of indica accessions were Hap III, while the japonica accessions were Hap I or Hap II. Taken together, these results indicate that the natural allelic variations in these three candidate genes appeared to be associated with the different STG levels observed among the 211 rice accessions.
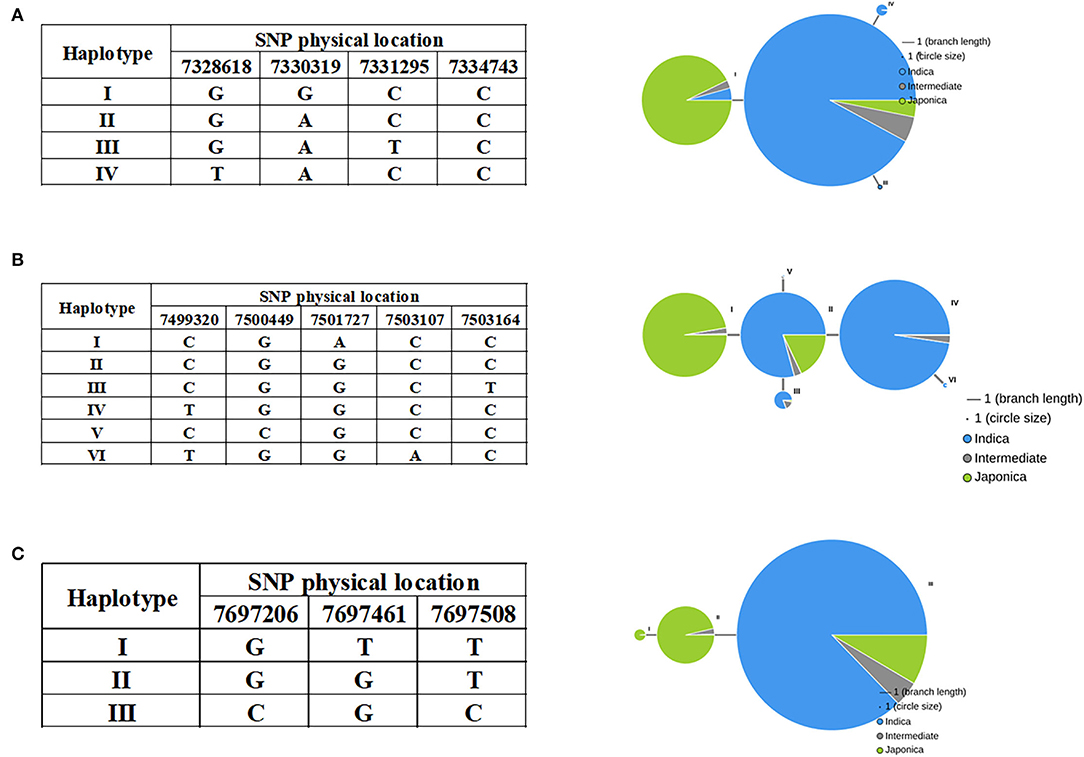
Figure 8. Haplotypes of LOC_Os03g13560 (A), LOC_Os03g13840 (B), and LOC_Os03g14180 (C) are associated with STG in rice.
To further verify whether the three genes respond to salt stress and have indica–japonica specificity in the individuals examined in our population, quantitative real-time PCR (qRT-PCR) was performed with two salt-sensitive varieties (e.g., S1 and S2) and two salt-tolerant varieties (e.g., T1 and T2) under control and 60 mM NaCl conditions. The results showed that these three genes were differentially expressed under salt stress (Figure 9). For LOC_Os03g13560, the expressions in salt-sensitive cultivars were downregulated, while the expressions in salt-tolerant cultivars were upregulated under salt stress (Figure 9A). In addition, the downregulation times of S1 (indica) were much higher than those of S2 (japonica) in the two salt-sensitive varieties, and the upregulation times of T2 (japonica) were much higher than those of T1 (indica) in the two salt-tolerant varieties. The LOC_Os03g13840 gene was upregulated under salt stress in both salt-sensitive and salt-tolerant varieties, and the upregulated LOC_Os03g13840 expressions in the two indica rice varieties were higher than those in japonica rice (Figure 9B). The LOC_Os03g14180 gene responded to salt stress in all four rice varieties and was upregulated under 60 mM NaCl conditions (Figure 9C). Similarly, the changes in the expression levels of LOC_Os03g14180 were indica–japonica specific. After salt stress, the change times of S2 were higher than those of S1, and the change times of T1 were higher than those of T2.
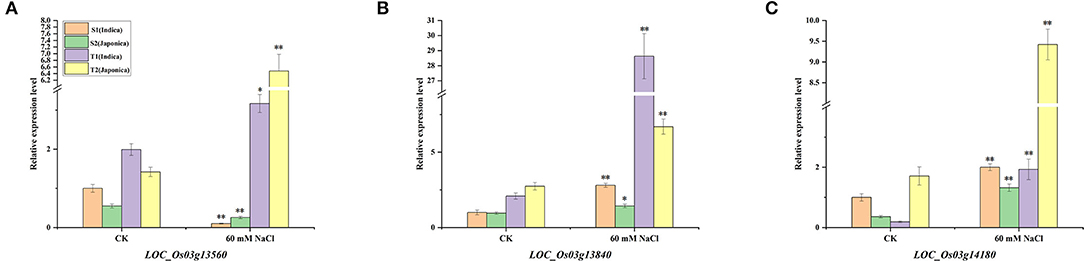
Figure 9. Expression patterns of LOC_Os03g13560 (A), LOC_Os03g13840 (B), and LOC_Os03g14180 (C) under normal growth conditions and salt stress conditions. *Indicates significance at the 5% level, **Indicates significance at the 1% level.
Discussion
Direct seeding of rice has become popular in many Asian countries because of its time-saving, labor-saving, and cost-effective advantages. However, to develop high-yield and high-quality rice varieties for use in the direct seeding mode, rice seeds must have strong germination abilities under various abiotic stresses and strong growth abilities after abiotic stresses. Therefore, cultivating rice varieties with high STG has become an inevitable trend. In our study, six indices containing four indices (e.g., RGE, RGI, RVI, and RMGT) associated with seed germination and two indices (e.g., RSL and RRL) associated with seed growth capacity after salt stress were used to evaluate STG levels. These indices have been used successfully in previous GWAS studies on salt tolerance at the rice germination stage (Shi et al., 2017; Yu et al., 2018). Our study showed that additions of salt solutions inhibited seed germination compared with the control treatment; that is, the GE, GI, VI, and MGT values of seeds decreased, and the inhibition degrees also increased with increasing salt solution concentrations (Table 1). Despite salt stress, nearly all rice accessions germinated successfully in the following days, but this does not mean that salt stress prolonged only the germination time and did not have other effects because after 7 days of salt stress, we found that the SL and RL values of rice were reduced compared to the control group, which suggested that salinity can influence the germination quality of seeds.
Different conclusions have been reached in different studies on the salt tolerance of different rice subgroups in the germination stage. According to Shi et al. (2017), japonica varieties had higher tolerance to salt stress at the germination stage than did the other subgroups, which was determined by measuring the SSIs of VI and GR at 10 days. However, Yu et al. (2018) and Islam et al. (2022) suggested that the salt tolerance levels during the seed germination stage are not well-correlated with rice subgroups. In our study, a scoring rule was developed based on six indices under two different salt solution concentrations to determine the STG level of each rice accession, and the results showed that the STG of indica rice was generally significantly higher than that of japonica rice. No significant differences in RMGT values were observed between the two subgroups at either salt solution concentration, but the RSL, RGE, RGI, and RVI values of indica for the two salt solution concentrations were significantly greater than those of japonica. There were no significant differences between the two subgroups under the 60 mM condition, but the RRL values of japonica were greater than those of indica under the 100 mM condition, which was probably because with the increased salt solution concentration, salt-sensitive rice varieties needed to extend their roots longer to increase their water uptake areas to survive.
The purpose of using a variety of indices to evaluate rice STG is to obtain a more comprehensive understanding of the genetic mechanisms of rice varieties subjected to salt stress in the germination stage. The correlations among the six indices were analyzed, and the results showed that the RGE, RGI, and RVI values were significantly positively correlated with each other and were negatively correlated with RMGT regardless of whether concentrations of 60 or 100 mM were used, which may indicate that the four indices are regulated by a consistent genetic pathway. This inference was confirmed by the subsequent GWAS analysis.
A total of 33 distinct QTL regions were identified by GWAS using six indices and two concentrations, among which 10 QTLs were found to be co-localized in the same or overlapping regions of previously reported salt stress QTLs/genes. The QTL qRRL-100-1 overlapped with OsCOIN, a gene encoding ring zinc finger protein that is located in the nucleus and plasma membrane, and OsCOIN is expressed in all organs of rice and is strongly induced by low temperatures, ABA, salt and drought. Overexpression of OsCOIN upregulated the expression of OsP5CS and increased intracellular proline contents, which ultimately significantly enhanced the resistance of transgenic rice to cold, salt, and drought (Liu et al., 2007). A small heat shock protein, OsHSP17.0, appeared in a QTL region that was repeatedly detected (e.g., qRGE60-1-3/qRGI60-1-2/qRMGT60-1-1) in our study. The germination capacities of OsHsp17.0-overexpressing transgenic lines in NaCl was stronger than that of wild-type plants, and phenotypic analysis showed that transgenic rice lines were more tolerant to salt stress than WT rice lines (Zou et al., 2012). An AP2/EREBP transcription factor, OsDREB2A, was located in a candidate region that contains three co-localized QTLs (e.g., qRGI60-1-3, qRVI60-1-1, and qRGE60-1-4). OsDREB2A expression was induced by high salinity stress (Dubouzet et al., 2003), and its overexpressed lines were significantly tolerant to osmotic stress, drought stress, salt stress, and dehydration stress, and their growth performance was enhanced (Cui et al., 2011; Mallikarjuna et al., 2011). Five RRL-related QTLs (e.g., qRRL60-1-2, qRRL60-1-3, qRRL60-2-1, qRRL60-6, and qRRL60-9) that were evaluated in our study were co-localized with previously reported salt stress QTLs/genes (e.g., OsPLDα1, OrbHLH001, qGR-3d2, qGR-7d6, and OsDSG1). OsPLDα1 is involved in the salt tolerance of rice by regulating the activity and expression of H+-ATPase (Shen et al., 2011). Overexpression of OrbHLH001, a putative helix-loop-helix transcription factor, causes increased expression of AKT1 and maintains ionic balance under salt stress in rice (Chen et al., 2013). qGR-3d2 and qGR-7d6 are two QTLs associated with germination rates that were detected in the germination stage (Nakhla et al., 2021). OsDSG1 is a gene that affects seed germination, and loss of this gene results in delayed seed germination, shorter plants, and greater tolerance to high salt and drought stresses (Park et al., 2010). A QTL containing three co-located QTLs (e.g., qRGE60-3-3, qRGE100-3, and qRVI60-3-2) on chromosome 3 explained the largest phenotypic variations in our study, and this QTL region contained a characterized salt-tolerant gene, OsMAPK5, which is a mitogen-activated protein that can positively regulate the tolerance of rice to drought, salt, and cold stresses (Xiong and Yang, 2003). Similarly, a QTL (e.g., qRGI60-9/qRVI60-9/qRVI100-9) is present in 17.19 Mb of chromosome 9 that explains the large phenotypic variations. This region contains a basic helix-loop-helix transcription factor called OsbHLH120, and the expression of OsbHLH120 in IL392 (an introgression line) roots was higher than that of Yuefu (parent) under PEG and salt stresses (Li et al., 2015). In addition, 23 new loci were identified in this study, among which three loci contained more than one QTL. These new QTLs detected by multiple indices will provide important genetic resources for identifying candidate salt genes.
Hence, the exact candidate intervals were determined by LD blocks for two new QTLs, qRGE60-1-2 and qRGE60-3-1, with high explained phenotypic variations, which were detected in multiple indices. According to a previous study (Neang et al., 2020), only 67 functionally annotated genes were retained in these two QTLs. We used multiple databases to determine the expression patterns of these functional annotation genes and whether they responded to abiotic stress. Finally, nine genes that respond to salt stress and are highly expressed in embryos were selected as candidate genes. Interestingly, the haplotype analysis suggested that the haplotypes of three candidate genes (e.g., LOC_Os03g13560, LOC_Os03g13840, and LOC_Os03g14180) exhibited some indica–japonica specificity, which was consistent with our phenotypic results that the STG levels of indica and japonica rice were significantly different. LOC_Os03g13560 encodes a hydroxyproline-rich glycoprotein family protein. A previous study revealed that hydroxyproline-rich glycoprotein family proteins may be involved in the chilling response of soybean (Xu et al., 2016). LOC_Os03g13840 encodes senescence-associated protein (SAP). A gene ontology classification was used to predict its function, and the results showed that there were two major GO accessions for this candidate gene, namely, GO:0009628 (response to abiotic stimulus) and GO:0006950 (response to stress). Ubaidillah et al. (2013) revealed that OsSAP was both highly and rapidly expressed in response to drought stress. LOC_Os03g14180 is a rice heat shock protein gene named OsHSP26.7. The transcript levels of OsHSP26.7 were also high in the imbibed seed embryos but were very low in other organs and were significantly induced by heat treatment and high salt stress (Zou et al., 2009). In conclusion, the identification of candidate genes and their elite haplotypes for QTLs provides important information to identify the causal genes and facilitate further validation and application of the identified QTLs in trait improvements.
Data Availability Statement
The datasets presented in this study can be found in online repositories. The names of the repository/repositories and accession number(s) can be found at: https://ngdc.cncb.ac.cn/gvm/, GVM000333.
Author Contributions
CLi designed experiments, analyzed data, and wrote the manuscript. CLi, CLu, and BZ performed all the phenotypic evaluations. MY, GW, PW, QC, YW, QZ, SH, TH, and HH participated in performing experiments. JB conceived and supervised the experiments. All authors have read and agreed to the published version of the manuscript.
Funding
This study was supported by a grant (32160485) from the National Natural Science Foundation of China, a grant (YC2021-S341) from the Innovation Fund Designated for Graduate Students of Jiangxi Province, and College Students Innovative Entrepreneurial Training Plan Program (Grant No. 202210410002). These funding institutions provided financial support for material collection, high-throughput sequencing, and data analysis in this study.
Conflict of Interest
The authors declare that the research was conducted in the absence of any commercial or financial relationships that could be construed as a potential conflict of interest.
Publisher's Note
All claims expressed in this article are solely those of the authors and do not necessarily represent those of their affiliated organizations, or those of the publisher, the editors and the reviewers. Any product that may be evaluated in this article, or claim that may be made by its manufacturer, is not guaranteed or endorsed by the publisher.
Acknowledgments
We thank the referees for their critical comments on this manuscript.
Supplementary Material
The Supplementary Material for this article can be found online at: https://www.frontiersin.org/articles/10.3389/fpls.2022.934515/full#supplementary-material
Supplementary Figure 1. Box plot for comparison of six indices between indica and japonica subgroups under 100 mM NaCl. The yellow box represents indica, the green box represents japonica, the black dot in the box represents the median, and the value range of the box is 25–75%, **Indicates significance at the 1% level.
Supplementary Figure 2. Manhattan plots of GWAS for RGI (A), RVI (B), RMGT (C), RRL (D), under 60 mM NaCl and RGE (E), RVI (F), RMGT (G), RSL (H), and RRL (I) under 100 mM NaCl. The red arrow indicates QTLs detected from six indices.
Supplementary Figure 3. Five differentially expressed genes (A–E) for qRGE60-1-2 and a gene LOC_Os03g14050 (F) for qRGE60-3-1 are highly expressed in embryos labeled by Geneinvestigator.
Supplementary Table 1. Phenotypic data and information of the 211 rice varieties.
Supplementary Table 2. Criteria for scoring the phenotype of each individual in the population.
Supplementary Table 3. The candidate genes for qRGE60-1-2 and qRGE60-3-1.
Supplementary Table 4. The differentially expressed genes for qRGE-1-2 and qRGE-3-1 from the RNA-seq database.
References
Barrett, J. C., Fry, B., Maller, J., and Daly, M. J. (2005). Haploview: analysis and visualization of LD and haplotype maps. Bioinformatics 21, 263–265. doi: 10.1093/bioinformatics/bth457
Bian, J. M., Jiang, L., Liu, L. L., Wei, X. J., Xiao, Y. H., Zhang, L. J., et al. (2010). Construction of a new set of rice chromosome segment substitution lines and identification of grain weight and related traits QTLs. Breed Sci. 60, 305–313 doi: 10.1270/jsbbs.60.305
Chen, H. C., Cheng, W. H., Hong, C. Y., Chang, Y. S., and Chang, M. C. (2018). The transcription factor OsbHLH035 mediates seed germination and enables seedling recovery from salt stress through ABA-dependent and ABA-independent pathways, respectively. Rice 11:50. doi: 10.1186/s12284-018-0244-z
Chen, Y., Li, F., Ma, Y., Chong, K., and Xu, Y. (2013). Overexpression of OrbHLH001, a putative helix–loop–helix transcription factor, causes increased expression of AKT1 and maintains ionic balance under salt stress in rice. J. Plant Physiol. 170, 93–100. doi: 10.1016/j.jplph.2012.08.019
Cheng, J., He, Y., Yang, B., Lai, Y., Wang, Z., and Zhang, H. (2015). Association mapping of seed germination and seedling growth at three conditions in indica rice (Oryza sativa L.). Euphytica 206, 103–115. doi: 10.1007/s10681-015-1477-1
Cui, M., Zhang, W., Zhang, Q., Xu, Z., Zhu, Z., Duan, F., et al. (2011). Induced over-expression of the transcription factor OsDREB2A improves drought tolerance in rice. Plant Physiol. Biochem. 49, 1384–1391. doi: 10.1016/j.plaphy.2011.09.012
Cui, Y., Zhang, F., and Zhou, Y. (2018). The application of Multi-Locus GWAS for the detection of Salt-Tolerance loci in rice. Front. Plant Sci. 9:1464. doi: 10.3389/fpls.2018.01464
Dubouzet, J. G., Sakuma, Y., Ito, Y., Kasuga, M., Dubouzet, E. G., Miura, S., et al. (2003). OsDREB genes in rice, Oryza sativa L., Encode transcription activators that function in drought-, high-salt- and cold-responsive gene expression. Plant J. 33, 751–763. doi: 10.1046/j.1365-313X.2003.01661.x
Gomes-Filho, E., Lima, C. R., Costa, J. H., Da, S. A., Da, G. S. L. M., De, L. C., et al. (2008). Cowpea ribonuclease: properties and effect of NaCl-salinity on its activation during seed germination and seedling establishment. Plant Cell Rep. 27, 147–157. doi: 10.1007/s00299-007-0433-5
He, Y., Yang, B., He, Y., Zhan, C., Cheng, Y., Zhang, J., et al. (2019). A quantitative trait locus, qSE3, promotes seed germination and seedling establishment under salinity stress in rice. Plant J. 97, 1089–1104. doi: 10.1111/tpj.14181
Huang, X., Zhao, Y., Wei, X., Li, C., Wang, A., Zhao, Q., et al. (2012). Genome-wide association study of flowering time and grain yield traits in a worldwide collection of rice germplasm. Nat. Genet. 44, 32–39 doi: 10.1038/ng.1018
Islam, M. R., Naveed, S. A., Zhang, Y., Li, Z., Zhao, X., Fiaz, S., et al. (2022). Identification of candidate genes for salinity and anaerobic tolerance at the germination stage in rice by genome wide association analyses. Front. Genet. 13:822516. doi: 10.3389/fgene.2022.822516
Khan, M., and Weber, D. (2006). Ecophysiology of High Salinity Tolerant Plants. New York, NY: Springer Science & Business Media. doi: 10.1007/1-4020-4018-0
Koyro, H. (2002). Ultrastructural Effects of Salinity in Higher Plants. In Salinity, Environment-Plants-Molecules. New York, NY: Springer.
Li, C., Liu, J., Bian, J., Jin, T., Zou, B., Liu, S., et al. (2021). Identification of cold tolerance QTLs at the bud burst stage in 211 rice landraces by GWAS. BMC Plant Biol. 21:7. doi: 10.1186/s12870-021-03317-7
Li, J., Han, Y., Liu, L., Chen, Y., Du, Y., Zhang, J., et al. (2015). qRT9, a quantitative trait locus controlling root thickness and root length in upland rice. J. Exp. Bot. 66, 2723–2732. doi: 10.1093/jxb/erv076
Liu, K., Wang, L., Xu, Y., Chen, N., Ma, Q., Li, F., et al. (2007). Overexpression of OsCOIN, a putative cold inducible zinc finger protein, increased tolerance to chilling, salt and drought, and enhanced proline level in rice. Planta 226, 1007–1016. doi: 10.1007/s00425-007-0548-5
Luo, X., Deng, H., Wang, P., Zhang, X., Li, C., Tan, J., et al. (2020). Genetic analysis of germinating ability under alkaline and neutral salt stress by a high-density bin genetic map in rice. Euphytica 216, 107. doi: 10.1007/s10681-020-02623-9
Mallikarjuna, G., Mallikarjuna, K., Reddy, M. K., and Kaul, T. (2011). Expression of OsDREB2A transcription factor confers enhanced dehydration and salt stress tolerance in rice (Oryza sativa L.). Biotechnol. Lett. 33, 1689–1697. doi: 10.1007/s10529-011-0620-x
Mardani, Z., Rabiei, B., Sabouri, H., and Sabouri, A. (2014). Identification of molecular markers linked to salt-tolerant genes at germination stage of rice. Plant Breed 133, 196–202. doi: 10.1111/pbr.12136
Nakhla, W. R., Sun, W., Fan, K., Yang, K., Zhang, C., and Yu, B. (2021). Identification of QTLs for salt tolerance at the germination and seedling stages in rice. Plants 10:30428. doi: 10.3390/plants10030428
Naveed, S. A., Zhang, F., Zhang, J., Zheng, T. Q., Meng, L. J., Pang, Y. L., et al. (2018). Identification of QTN and candidate genes for salinity tolerance at the germination and seedling stages in rice by Genome-Wide association analyses. Sci. Rep 8:6505. doi: 10.1038/s41598-018-24946-3
Neang, S., de Ocampo, M., Egdane, J. A., Platten, J. D., Ismail, A. M., Seki, M., et al. (2020). A GWAS approach to find SNPs associated with salt removal in rice leaf sheath. Ann. Bot. London 126, 1193–1202. doi: 10.1093/aob/mcaa139
Park, G., Park, J., Yoon, J., Yu, S., and An, G. (2010). A RING finger E3 ligase gene, Oryza sativa Delayed Seed Germination 1 (OsDSG1), controls seed germination and stress responses in rice. Plant Mol. Biol. 74, 467–478. doi: 10.1007/s11103-010-9687-3
Shen, P., Wang, R., Jing, W., and Zhang, W. (2011). Rice phospholipase Dalpha is involved in salt tolerance by the mediation of H+-ATPase activity and transcription. J. Integr. Plant Biol. 53, 289–299. doi: 10.1111/j.1744-7909.2010.01021.x
Shi, Y., Gao, L., Wu, Z., Zhang, X., Wang, M., Zhang, C., et al. (2017). Genome-wide association study of salt tolerance at the seed germination stage in rice. BMC Plant Biol. 17:92. doi: 10.1186/s12870-017-1044-0
Tilman, D., Balzer, C., Hill, J., and Befort, B. L. (2011). Global food demand and the sustainable intensification of agriculture. Proc. Natl. Acad. Sci. U. S. A. 108, 20260–20264. doi: 10.1073/pnas.1116437108
Ubaidillah, M., Kim, K. A., Kim, Y. H., Lee, I-J., Yun, B. W., Kim, D. H., et al. (2013). Identification of a drought-induced rice gene, OsSAP, that suppresses bax-induced cell death in yeast. Mol. Biol. Rep. 40, 6113–6121. doi: 10.1007/s11033-013-2723-z
Wang, Z. F., Wang, J. F., Bao, Y. M., Wu, Y. Y., and Zhang, H. S. (2011). Quantitative trait loci controlling rice seed germination under salt stress. Euphytica 178, 297–307 doi: 10.1007/s10681-010-0287-8
Xiong, L., and Yang, Y. (2003). Disease resistance and abiotic stress tolerance in rice are inversely modulated by an abscisic acid–inducible Mitogen-Activated protein kinase. Plant Cell 15, 745–759. doi: 10.1105/tpc.008714
Xu, S., Liu, N., Mao, W., Hu, Q., Wang, G., and Gong, Y. (2016). Identification of chilling-responsive microRNAs and their targets in vegetable soybean (Glycine max L.). Sci. Rep. 6:26619. doi: 10.1038/srep26619
Yu, J., Zhao, W., Tong, W., He, Q., Yoon, M. Y., Li, F. P., et al. (2018). A Genome-Wide association study reveals candidate genes related to salt tolerance in rice (Oryza sativa) at the germination stage. Int. J. Mol. Sci. 19:103145. doi: 10.3390/ijms19103145
Yu, Y., Zhang, H., Long, Y., Shu, Y., and Zhai, J. (2022). Plant Public RNA-seq Database: a comprehensive online database for expression analysis of ~45,000 plant public RNA-Seq libraries. Plant Biotechnol. J. 2022:pbi.13798. doi: 10.1111/pbi.13798
Zeng, P., Zhu, P., Qian, L., Qian, X., Mi, Y., Li, Z., et al. (2021). Identification and fine mapping of qGR6.2, a novel locus controlling rice seed germination under salt stress. BMC Plant Biol. 21:36. doi: 10.1186/s12870-020-02820-7
Zhang, X., Long, Y., Huang, J., and Xia, J. (2020). OsNAC45 is involved in ABA response and salt tolerance in rice. Rice 13:79. doi: 10.1186/s12284-020-00440-1
Zhao, H., Yao, W., Ouyang, Y., Yang, W., Wang, G., Lian, X., et al. (2015). RiceVarMap: a comprehensive database of rice genomic variations. Nucl. Acids Res. 43, D1018–D1022. doi: 10.1093/nar/gku894
Zheng, H., Liu, B., Zhao, H., Wang, J., Liu, H., Sun, J., et al. (2014). Identification of QTLs for salt tolerance at the germination and early seedling stage using linkage and association analysis in japonica rice. Chin. J. Rice Sci. 28, 358–366. doi: 10.3969/j.issn.1001-7216.2014.04.004
Zou, J., Liu, A., Chen, X., Zhou, X., Gao, G., Wang, W., et al. (2009). Expression analysis of nine rice heat shock protein genes under abiotic stresses and ABA treatment. J. Plant Physiol. 166, 851–861. doi: 10.1016/j.jplph.2008.11.007
Keywords: salt tolerance germinability, rice accessions, GWAS, QTLs, haplotype analysis
Citation: Li C, Lu C, Zou B, Yang M, Wu G, Wang P, Cheng Q, Wang Y, Zhong Q, Huang S, Huang T, He H and Bian J (2022) Genome-Wide Association Study Reveals a Genetic Mechanism of Salt Tolerance Germinability in Rice (Oryza sativa L.). Front. Plant Sci. 13:934515. doi: 10.3389/fpls.2022.934515
Received: 02 May 2022; Accepted: 16 June 2022;
Published: 15 July 2022.
Edited by:
Xiaojin Luo, Fudan University, ChinaReviewed by:
Yoshiaki Ueda, Japan International Research Center for Agricultural Sciences (JIRCAS), JapanLiang Chen, Shanghai Agrobiological Gene Center, China
Hongwei Cai, China Agricultural University, China
Copyright © 2022 Li, Lu, Zou, Yang, Wu, Wang, Cheng, Wang, Zhong, Huang, Huang, He and Bian. This is an open-access article distributed under the terms of the Creative Commons Attribution License (CC BY). The use, distribution or reproduction in other forums is permitted, provided the original author(s) and the copyright owner(s) are credited and that the original publication in this journal is cited, in accordance with accepted academic practice. No use, distribution or reproduction is permitted which does not comply with these terms.
*Correspondence: Haohua He, aGhodWE2NEAxNjMuY29t; Jianmin Bian, am1iaWFuODFAMTI2LmNvbQ==
†These authors have contributed equally to this work