- 1Department of Bio-Industrial Machinery Engineering, Kyungpook National University, Daegu, South Korea
- 2Upland-Field Machinery Research Centre, Kyungpook National University, Daegu, South Korea
- 3Smart Agriculture Innovation Center, Kyungpook National University, Daegu, South Korea
- 4Department of Artificial Intelligence, School of Electronics Engineering, Kyungpook National University, Daegu, South Korea
Plant production systems such as plant factories and greenhouses can help promote resilience in food production. These systems could be used for plant protection and aid in controlling the micro- and macro- environments needed for optimal plant growth irrespective of natural disasters and changing climate conditions. However, to ensure optimal environmental controls and efficient production, several technologies such as sensors and robots have been developed and are at different stages of implementation. New and improved systems are continuously being investigated and developed with technological advances such as robotics, sensing, and artificial intelligence to mitigate hazards to humans working in these systems from poor ventilation and harsh weather while improving productivity. These technological advances necessitate frequent retrofits considering local contexts such as present and projected labor costs. The type of agricultural products also affects measures to be implemented to maximize returns on investment. Consequently, we formulated the retrofitting problem for plant production systems considering two objectives; minimizing the total cost for retrofitting and maximizing the yearly net profit. Additionally, we considered the following: (a) cost of new technologies; (b) present and projected cost for human labor and robotics; (c) size and service life of the plant production system; (d) productivity before and after retrofit, (e) interest on loans for retrofitting, (f) energy consumption before and after retrofit and, (g) replacement and maintenance cost of systems. We solved this problem using a multi-objective evolutionary algorithm that results in a set of compromised solutions and performed several simulations to demonstrate the applicability and robustness of the method. Results showed up to a 250% increase in annual net profits in an investigated case, indicating that the availability of all the possible retrofitting combinations would improve decision making. A user-friendly system was developed to provide all the feasible retrofitting combinations and total costs with the yearly return on investment in agricultural production systems in a single run.
Introduction
Plant production systems offer numerous opportunities and benefits for growers, such as year-round cultivation, improved growing conditions for ornamental crops and vegetables, and control of micro- and macro- environments (Gerson and Weintraub, 2007; Van Straten et al., 2010; Nordey et al., 2017). These systems have been serving communities for decades. They have transformed from simple structures to grow vegetables in temperate regions during the cold winter months to advanced facilities currently used to grow in tropics, including deserts (Wittwer and Castilla, 1995; Gullino et al., 1999; Shamshiri et al., 2018).
The advancement in these protected cultivation structures is still ongoing, with the world incessantly requiring improvements to cater to the fast-growing populace demanding healthier food. Top on this list is the diminishing skilled farm labor, rapidly changing climate, and disasters such as the COVID 19 outbreak caused by the SARS-CoV-2 virus (Wang et al., 2020) that became widespread at the beginning of 2020, leading to difficulties in international travels for migrant workers (Lima et al., 2020). Most countries were forced to close their borders or place stringent entry procedures (Barua, 2020; Wells et al., 2020). This has led to various farm losses (Galanakis, 2020; Helm, 2020; Nicola et al., 2020; Sahoo and Rath, 2020). Autonomous growing has been under investigation to resolve labor accessibility and precision issues. Also, the environment in plant production systems is toxic to humans because of the poor ventilation and high temperature and humidity content. Advanced plant production systems are complex multi-input structures that come at a high cost (Stanghellini and Montero, 2010; Baeza et al., 2011; Reddy, 2016). This necessitates the proper implementation of new and/or existing technologies.
Plant production systems existed for centuries (42 BC–37 AC), but the major advancement occurred in the early 1950s and has continuously improved to the current phase (Jensen and Malter, 1995; Paul and Gwynn-Jones, 2003; Raviv and Antignus, 2004; Nordey et al., 2017). Most plant production systems, such as plant factories and greenhouses, were not designed to adopt the new technologies. Furthermore, building new structures also needs proper planning and implementation. This contrasts with the open field cultivation system that requires less planning. Plant production systems could be catastrophic if proper planning and implementation are neglected despite having positive returns. With the current evolution in technologies, the grower should have an appropriate decision-making system that considers investment capital, interest on loans, market opportunities, and profit, which are critical to sustainability.
Structural upgrades are often required for implementing new technologies. Retrofitting is usually adopted as the choice approach. This has been applied majorly to residential buildings to save energy and limit greenhouse gas emissions (Dixon et al., 2008), simultaneously considering several environmental and economic criteria (Antipova et al., 2014), comparing internal and external thermal insulation systems for residential buildings (Kolaitis et al., 2013), and several other retrofitted buildings with focus on energy saving (Xu et al., 2011, 2015; Xu and Chan, 2013; Wu et al., 2016; El-Darwish and Gomaa, 2017; Fan and Xia, 2017, 2018; Liu et al., 2018). In this scenario, the combination of retrofitting measures and strategies has proven to be complex and requires tradeoffs. In residential buildings, the measures adopted to retrofit the buildings for energy efficiency are categorized into the following groups: (a) measures to reduce load; (b) measures to control and monitor loads; (c) enveloping measures such as insulation and sealing roofs or ceilings; (d) alter energy consumption patterns of the occupants; and (e) adoption of renewable energy sources (Diakaki et al., 2008; Marszal et al., 2011; Ma et al., 2012; Malatji et al., 2013).
Retrofitting plant production systems to cover the progress in efficient growing technologies is much more complex than residential buildings that focus primarily on energy. The energy retrofitting benefits could be social, which has to do with enhancing the health and comfort of the occupants, reducing air emissions hurting the environment, and economic perspective in reduction of operation costs (Jafari et al., 2016). The dynamics in plant production systems are numerous, requiring multi-objective optimization approach, and the strategy to adopt and/or retrofit the existing system is much more challenging and delicate. These include (a) plant production systems are far more extensive than regular residential houses reaching 215 square feet (Robinson, 2018); (b) the advancement in technologies used in growing are occurring simultaneously in different aspects of protected cultivation and at a much faster rate than residential houses (Uyeh et al., 2019b; Raviteja and Supriya, 2020; Rayhana et al., 2020); (c) unlike in residential buildings where the primary concern is energy consumption for heating and cooling (Jafari and Valentin, 2017), plant production systems require energy for similar purposes in addition to other technological advancements such as autonomous growing that needs to be retrofitted (Bogue, 2020; Kurtser and Edan, 2020); and (d) wrong retrofitting strategy would not result in discomfort as in residential buildings but an irreversible loss of the plants accompanied with substantial economic losses. These make the retrofitting problem in protected cultivation non-deterministic polynomial-time hard (NP-hard) (Bagnall et al., 2001).
Multi-objective optimization requires maximizing or minimizing multiple objective functions that are constrained. These include analyzing design, selecting process designs or optimal products, tradeoffs, or applications where optimal solutions are needed with tradeoffs between two or more conflicting objectives. The conventional approaches for this type of optimization include the Pareto front, goal attainment, and minimax. In Pareto fronts, noninferior solutions are found. These are solutions in which an improvement in one objective requires a degradation in another.
On the other hand, goal attainment reduces the values of a linear or nonlinear vector function to attain the goal values given in a goal vector. The comparative significance of the goals is shown by applying a weight vector, and goal fulfillment problems may also be subject to linear and nonlinear constraints. Finally, minimax, minimizes the worst-case values of a set of multivariate functions, probably subject to linear and nonlinear constraints (MathWorks, 2021).
Multi-objective techniques are popular due to their capabilities in solving a wide range of real-world problems (Saini and Saha, 2021). For example, Fonseca and Fleming (1993) Multiple Objective Genetic Algorithm enables decision-makers to progressively articulate their preferences while learning about the problem under consideration. Srinivas and Deb’s (1994) Nondominated Sorting in Genetic Algorithms adopted Goldberg’s notion of nondominated sorting in genetic algorithms and a niche and speciation method to find multiple Pareto-optimal points simultaneously. Horn et al.’s (1993) Niched Pareto genetic algorithm, a multi-objective optimization algorithm, is adopted to find the Pareto optimal set. The previously discussed algorithms are some of the elitist multi-objective methods that non-dominated sorting genetic algorithm II (NSGA II) used in this study have been proven to be better (Deb et al., 2002). These methods are limited in their computational complexity (the number of objectives and population size), non-elitism approach; and the need for specifying a sharing parameter that alleviates all the above three difficulties.
In summary, Pareto optimality which is the backdrop on which NSGA II is built, has been reported to be the best approach to describe multi-objective optimization since there is no single global solution. It is often necessary to determine a set of points that all fit a predetermined definition for an optimum (Marler and Arora, 2004). NSGA II is undoubtedly the elitist method (Deb et al., 2000; Kannan et al., 2008; Li and Zhang, 2008; Yusoff et al., 2011). NSGA-II, a multi-objective evolutionary algorithm, improves the difficulties of using multi-objective optimization. These include the need to specify a sharing parameter, computational complexity, and a non-elitism approach. It possesses a selection operator that generates a mating pool by merging the parent and offspring populations and selecting the best N solutions (Deb et al., 2002).
Consequently, in this study, we formulated the protected cultivation retrofitting problem considering; (a) cost of retrofitting items such as sensors and robots; (b) cost of labor and cost-benefits obtainable from replacing human labor with robots; (c) size and service life of the plant production system; (d) impact of retrofitting on productivity and consequently profit; and (e) category of retrofitting to be implemented which delivers tradeoff solutions that represent the possible retrofits associated with expenditure and benefits. This problem was then solved using NSGA-II. Parameters such as present and projected cost of labor and agricultural products can be set to the user’s local context. Due to the conflicting nature of the objectives, NSGA-II can provide a tradeoff solution that can enable better decision-making when selecting retrofit measures. We demonstrated the applicability of this method by carrying out experimental simulations on different plant production system sizes.
Retrofitting in Plant Production Systems
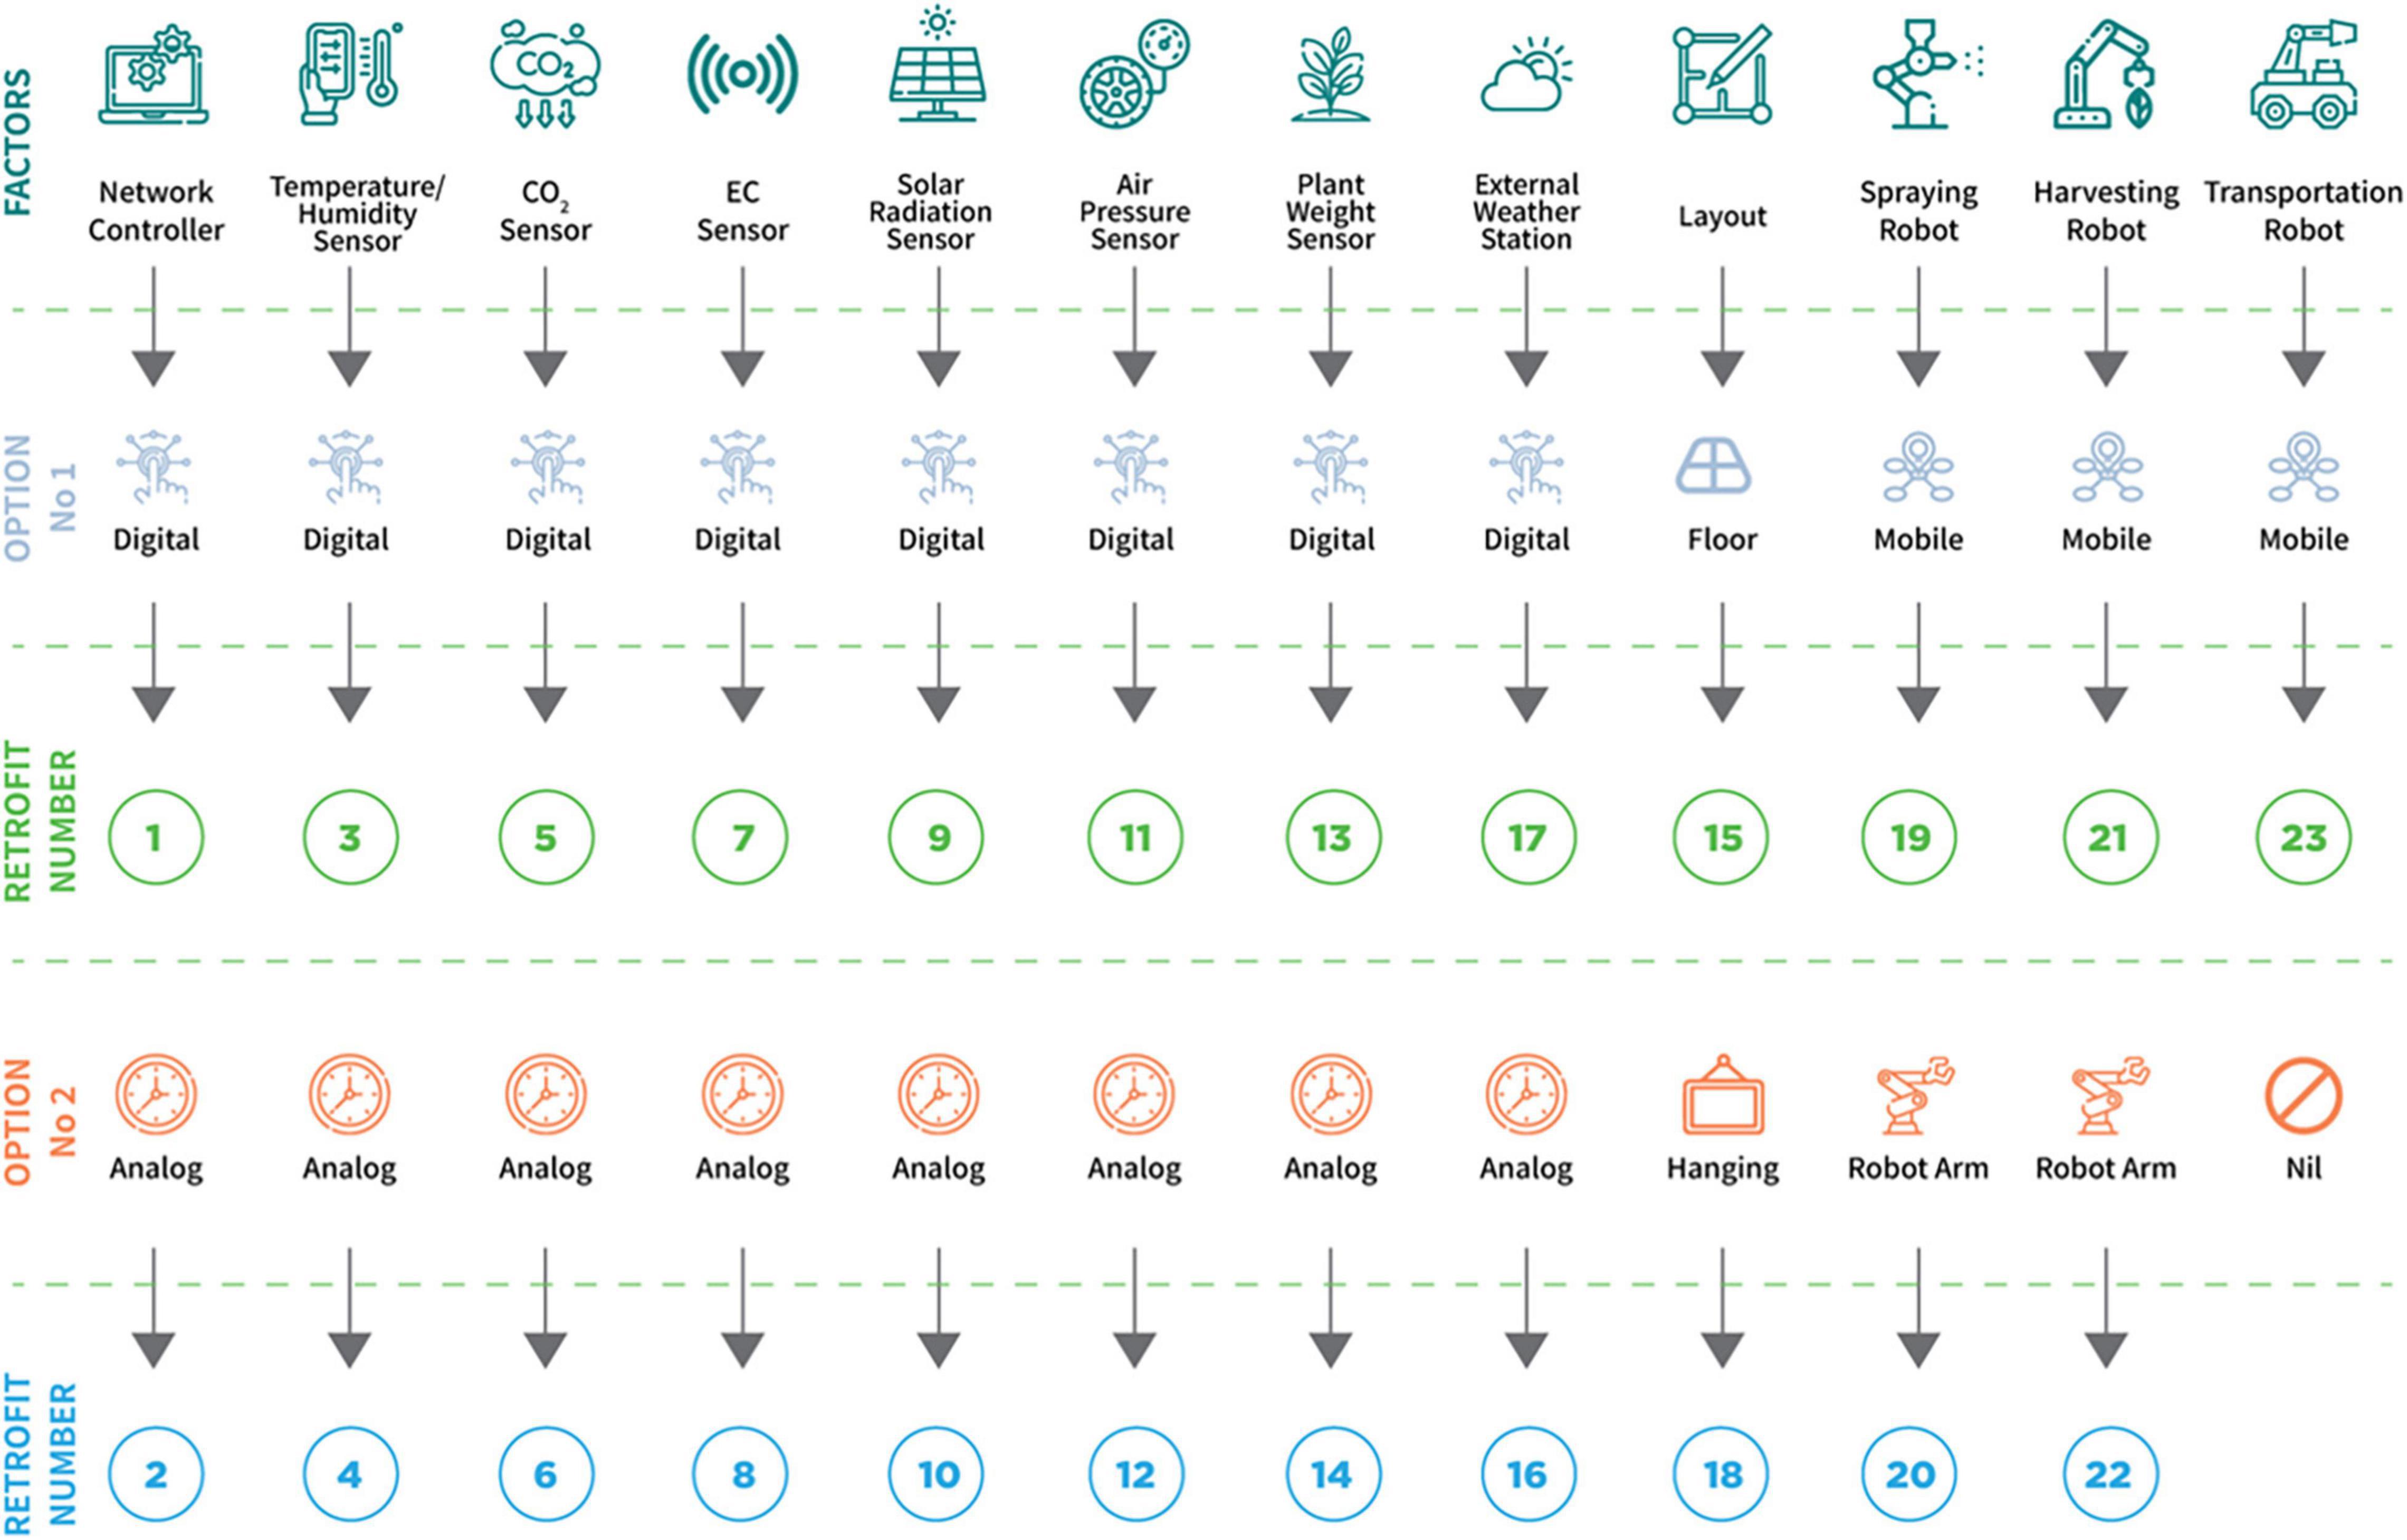
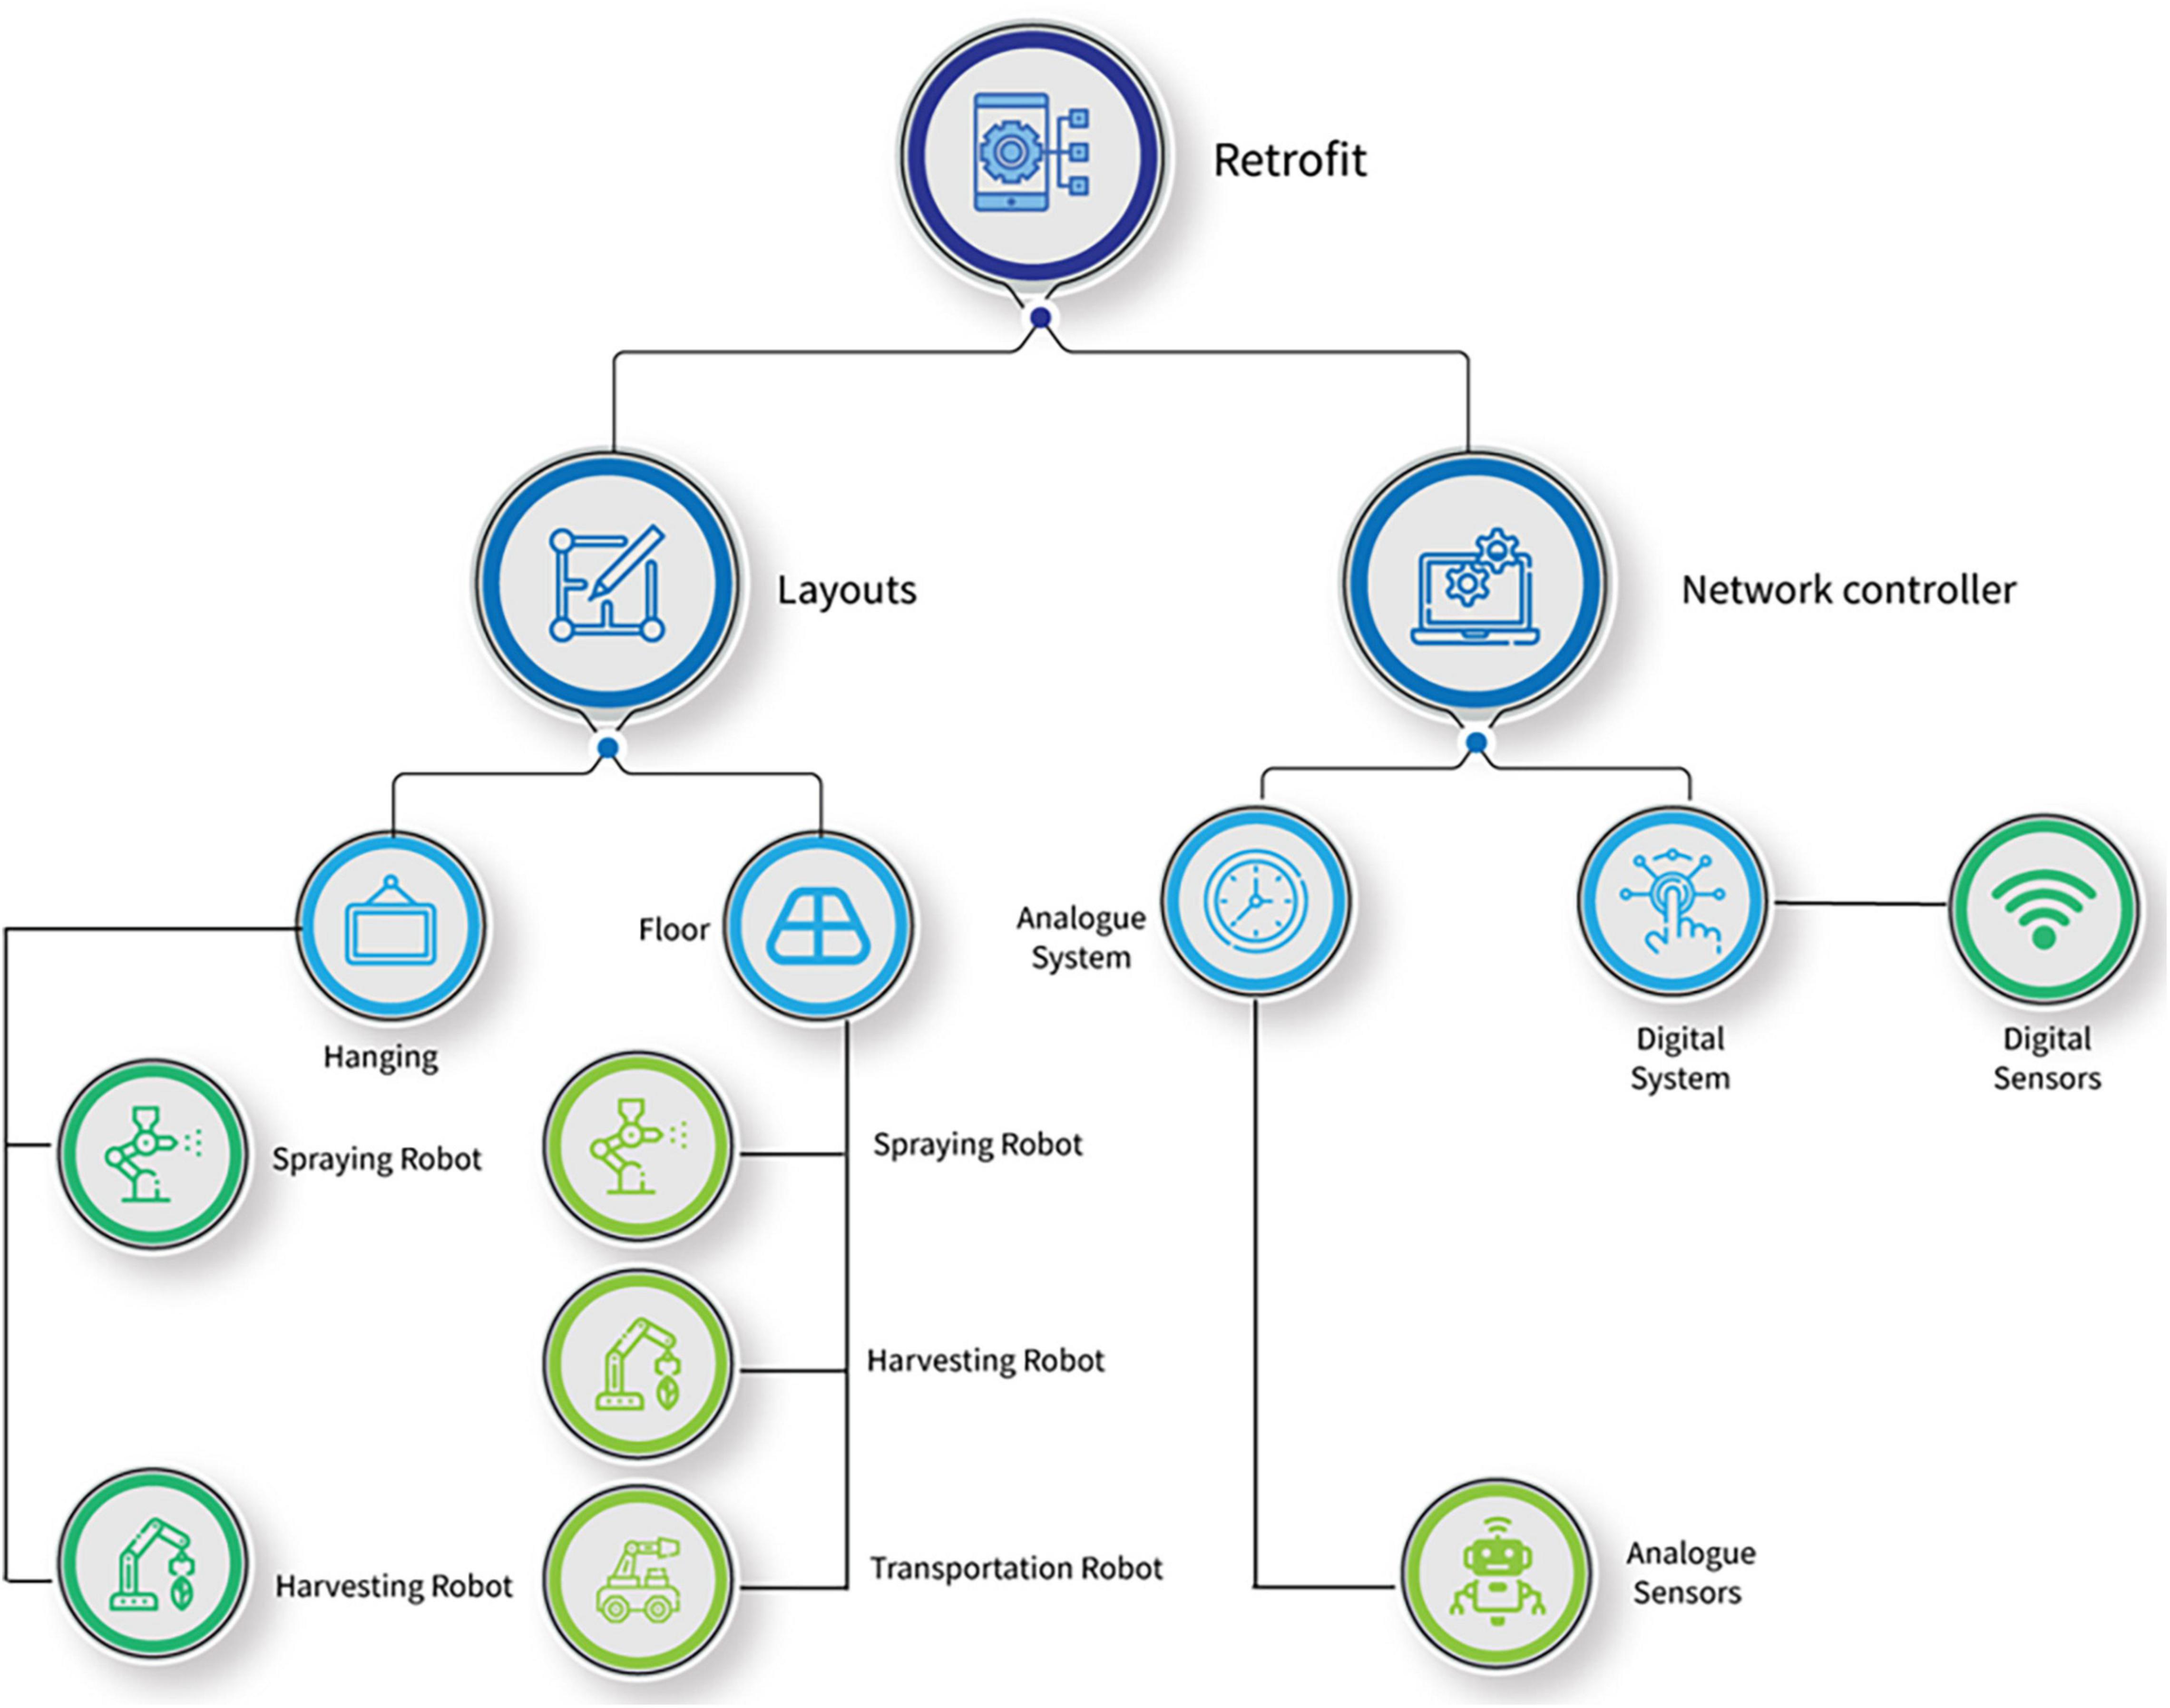
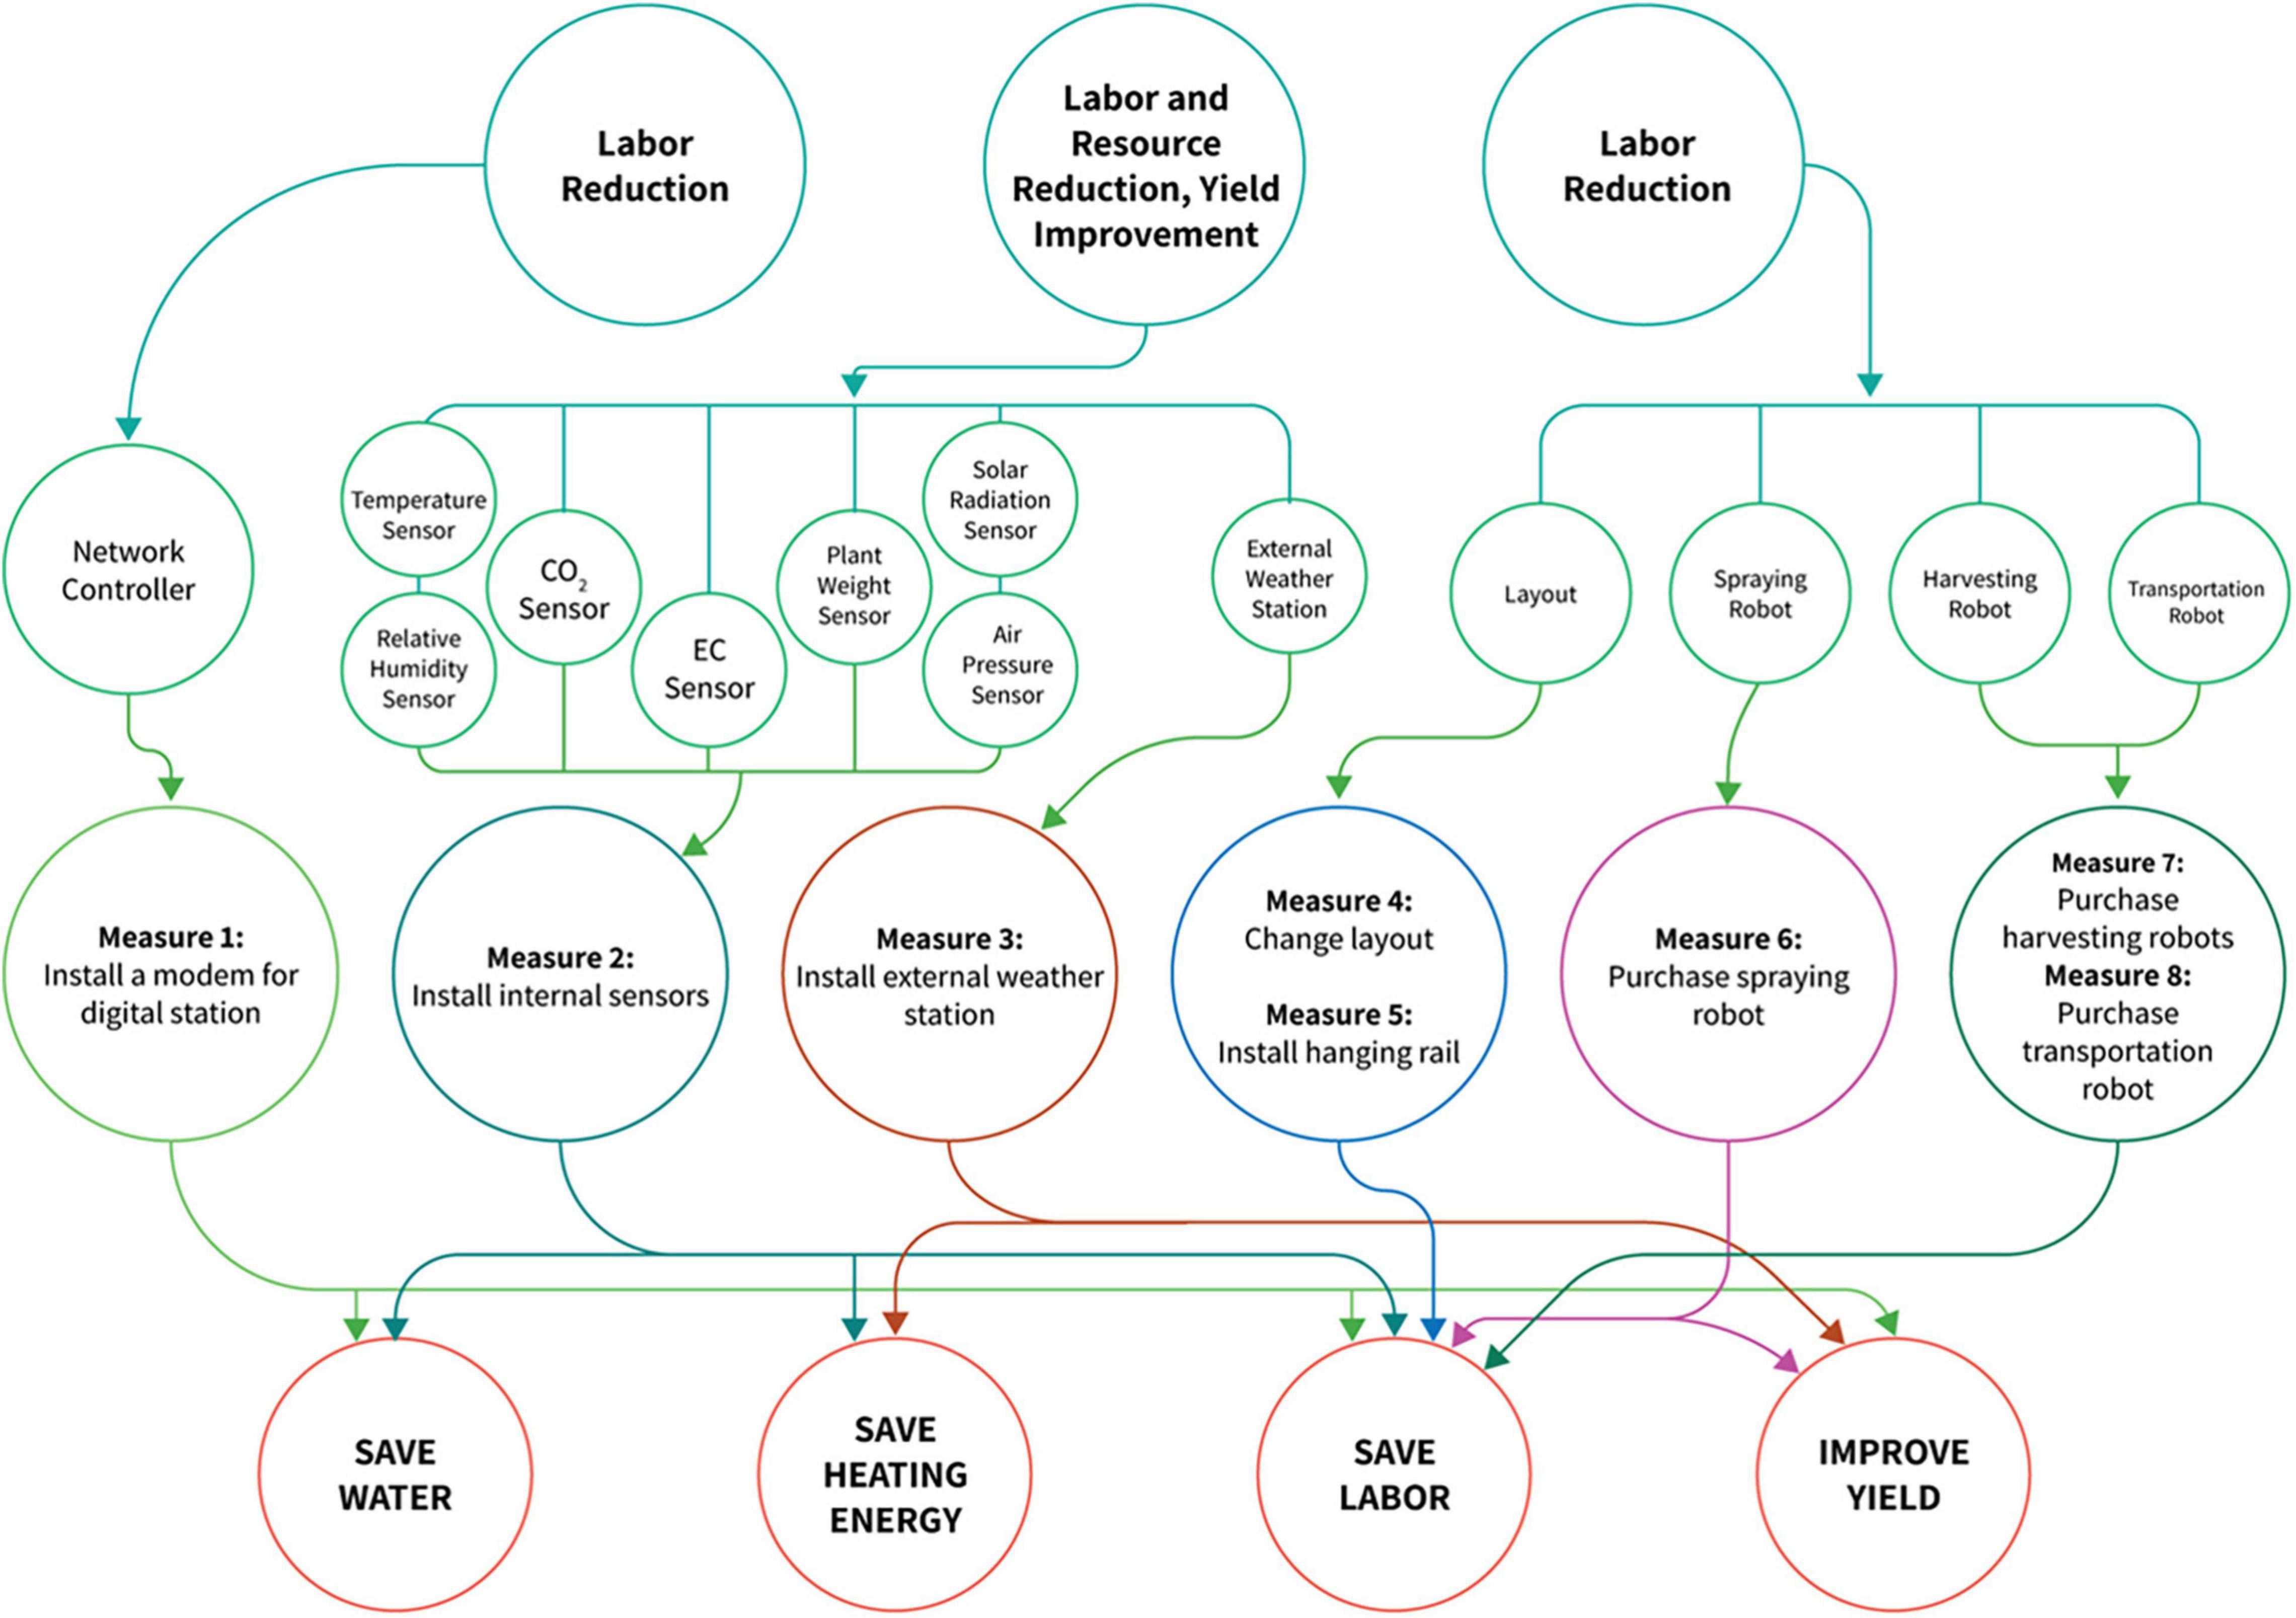
Figure 1 shows the factors and options available for retrofitting a plant production system. In this study, a prospective retrofit is represented as “RM”. Furthermore, some options are limited by constraints, as shown in Figure 2. Two options are available in retrofitting the plant production system to include a network controller (Figure 2). If an analogous network controller is selected, all sensors to be selected must be analog. A similar procedure would occur if a digital network controller were selected and with the type of layout and robots, respectively. Retrofit number 23 (Transportation robot) was considered nil only in Option 2 because a transport robot is not required in this situation. Figure 3 shows the benefits derived from the combination of different retrofit measures.
The factors are represented with vector “X” as shown below:


The prospective retrofit represented with vectors RM1, RM2,… above presents the feasible retrofit measures that could be implemented. The selected retrofit measure denoted with “ℝ” corresponds to the factor number (X) for a given feasible retrofit vector “RM”.
The retrofitting problem in a plant production system differs from conventional residential buildings. In this study and referring to the scenario in the Republic of Korea, the following variables were considered:
(a) Size of the plant production system.
(b) The service life of the plant production system (m).
(c) Cost of the items for retrofitting (Ci).
(d) Cost of electricity per unit (UCE).
(e) Impact of retrofitting on electricity consumption (ECC).
(f) The initial estimated cost of energy consumption.
(g) Interest paid on loans for retrofitting items.
(h) The annual rate of increase in energy cost (e).
(i) Maintenance and replacement period for each retrofitted item (tRMi).
(j) Number of maintenance and replacements needed to be done during the service life of the system (nRMi).
(k) Production before and after retrofitting was done (PBR).
(l) Price per unit of production.
(m) Projections in the price of the product.
(n) Labor cost before and after retrofit.
(o) Projections in the cost of labor.
(p) Profit (P).
Problem Formulation
Expenditures in Retrofitting a Plant Production System
Initial Cost of Investment
To calculate the initial cost of investment (ICI) to retrofit in a plant production system, the cost of purchasing sensors (digital or analog) for precision and improved decision making, retrofitting the navigation system for the robots (mobile rail or hanging system), and purchase cost of robots were considered and computed in Eq. 1.
Where Ci is the cost of implementing the ith retrofitting measure, which is the cost of the items for retrofitting, and yi is an indication variable demonstrating if the ith retrofitting measure is selected in the automation strategy. Furthermore, n is the total number of potential retrofitting measures.
Energy Consumption Cost
To compute the current energy consumption cost from retrofitting (ECC) the protected cultivation system, Eqs 2, 3 were used (Fan and Xia, 2018).
Where YEC is the estimated yearly energy consumption cost of the plant production system in the first year, Ir is the interest rate, e is the annual rate of energy cost increase (a rate of 5% was considered), and m is the service life of the plant production system.
The yearly energy consumption of the plant production system in the first year can be calculated as the sum of the estimated electricity per year as follow:
Where AEC is the annual energy consumption of the plant production system before implementing the energy retrofit, EC is the energy consumption of the items in retrofitting the plant production system, and UCE is the unit cost of electricity.
Replacement and Maintenance Cost
To estimate the replacement and maintenance cost because of retrofitting the plant production system, the number of replacements during the service life of the system is calculated using Eqs 4, 5 (Fan and Xia, 2018):
Where nRMi is the number of times replacements and maintenance are required for the ith measure during the service life of the plant production system, and tRMi is the replacement and maintenance period for the ith measure.
Furthermore, to compute the current replacement and maintenance cost from the retrofits, the equation below was used.
Where EMRi is the expenditure estimated from replacement and maintenance to implement the ith activity after its replacement and maintenance period.
Total Expenditure in Retrofitting a Plant Production System
The total expenditure is computed using Eq. 6:
Where CR is the cost of the systems used in the retrofits, ECC is the current energy consumption cost from retrofitting the system and ECCRC is the replacement and maintenance cost for the retrofitted items.
The Net Profit Derived From Retrofitting a Plant Production System
The profit gotten from the retrofit is assumed from two perspectives in this study. These were computed using Eqs 7–10.
Net Profit From Improved Productivity
This was calculated as follows:
Where YEC is the estimated yearly energy consumption cost of the plant production system in the first year, P is profit from the retrofit, Ir is the interest rate, e is the annual rate of energy cost increase (a rate of 5%), and m is the service life of the plant production system.
Where YECP is the estimated yearly energy cost of production in the plant production system for the first year, ELP is estimated annual production in the first year due to retrofit, and UELP is the price per unit productivity.
Net Profit From Savings in the Cost of Labor
Where YEC is the estimated yearly energy consumption cost of the plant production system in the first year, L is the Labor cost, Ir is the interest rate, e is the annual rate of energy cost increase (a rate of 5%), and m is the service life of the plant production system.
Consequently, the total net profit, which is the increased income from added productivity due to the new items used in retrofitting the plant production system and the money saved from labor spending because of the new systems that were retrofitted and replaced labor cost was calculated as:
Optimization Model
The optimization problem was formulated with two objectives: to minimize the total expenditure to retrofit for the lifespan of the plant production system (Eq. 11) while maximizing the yearly net profit derived from retrofitting the system (Eq. 12). This is shown below as objectives 1 and 2.
Objective 1: Expenditure for Retrofitting a Plant Production System
Where CR is the cost of the systems used in the retrofits, ECC is the energy consumption cost because of retrofitting new systems and ECCRC is the replacement and maintenance cost for the retrofitted items.
Objective 2: Net Profit From Retrofitting a Plant Production System
The profit from the retrofit is the summation of the increased income from added productivity due to the new items used in retrofitting the plant production system and the money saved from labor spending because of the new systems that were retrofitted and replaced labor costs.
Constraints in Carrying Out Retrofits
In addition to the two objectives, the following constraints were implemented in this study, as shown earlier in Figure 2. The problem formulation could be tuned to incorporate other constraints depending on the system.
Selection of Sensors and Network Controller for Retrofitting
Since digital network controllers are meant to transmit data remotely, the type of sensors that could synchronize with it must have certain features. We formulated a constraint that only sensors with this capacity should be picked if a digital network controller is selected. This was also extended to the on-site network controller (Eq. 13).
Given that, i = 1……..11 (retrofitting number).
Selection of Layouts for Retrofitting
With the current advances in plant production systems, two types of robotic navigation systems have been studied. These are mobile robots that navigate on the floor of the plant production system (Uyeh et al., 2019b) and hanging types of robots suspended above the plants and hung to the roof of the plant production system. In this constraint, the problem is formulated that if the hanging type of layout is picked for retrofit, then the selected harvesting and spraying robots should be robot arms, and no transportation robot should be chosen. If otherwise, then all types of robots could be selected (Eqs 14, 15).
Where x is the number of item for retrofit.
The Search Algorithm Used in This Study
The two objectives considered in the study – (a) minimization of investment cost and (b) maximizing the profit, are conflicting. In other words, minimizing investment costs results in lesser profits while maximization of profits demands more investments. Therefore, the optimization of multi-objective optimization problems does not provide a single optimal solution but a set of tradeoff solutions referred to as Pareto-optimal solutions. Population-based evolutionary algorithms are considered to solve the multi-objective problem due to their effectiveness and ability to provide the entire tradeoff solutions in a single run. Specifically, NSGA-II (Deb et al., 2002) is a more popular multi-objective evolutionary algorithm and has been widely adopted for real-world optimization problems. The general flowchart of NSGA-II is shown in Figure 4. NSGA-II starts with a randomly generated population of size (N), whose objective values are evaluated. The initialized population evolves over the generations through variation operators such as mutation, crossover, and environmental selection. The variation operators aim to produce effective solutions (referred to as offspring members) by using the information present in the solutions of the current population (referred to as the parent population).
On the other hand, environmental selection aims to select effective solutions from the combination of parent and offspring populations (P). In other words, environmental choice drives the entire population toward convergence to the Pareto-optimal solutions. The process of producing offspring members and environmental selection is repeated until the termination criteria are met. The variation operators considered in the current study are polynomial mutation and binomial crossover. Multi-objective optimization aims to obtain a set of converged well-spread diverse Pareto-optimal solutions. Thus, in NSGA-II, the environmental selection is made using non-dominated sorting followed by crowding distance, which is supposed to provide convergence and diversity. Non-dominated sorting and crowding distance are used in NSGA II to obtain the Pareto dominance of final tradeoff solutions (Uyeh et al., 2019a). The parameters of the optimization algorithm were set as follows:
Maximum number of generations (termination criteria): 500.
Population size (N): 500.
Crossover: Simulated binary crossover.
Constraint bond: 0–20.
Distribution indices for mutation (nm): 20.
Distribution indices for crossover (nc): 20.
Probability of crossover (Pc): 1.0.
Probability of mutation (Pm): 1/10.
Mutation: Polynomial mutation.
The average run time for the proposed algorithm was 180 s. The simulations were done on a 3.59 GHz AMD Ryzen 5 3500X 6-Core processor, 16 GB random access memory, and 256 GB solid-state drive with Windows 10 operating system in MATLAB (Matlab and Simulink, 2012). We conducted several simulations using guidelines from a previous manuscript (Deb et al., 2002) that proposed the algorithm and our experience working with this algorithm (Uyeh et al., 2018, 2019a,b). We finetuned and gradually increased the generations (iteration) until we got no further improvements. The number of generations that converged served as a termination value.
Experimental Design and Data Used in the Simulation
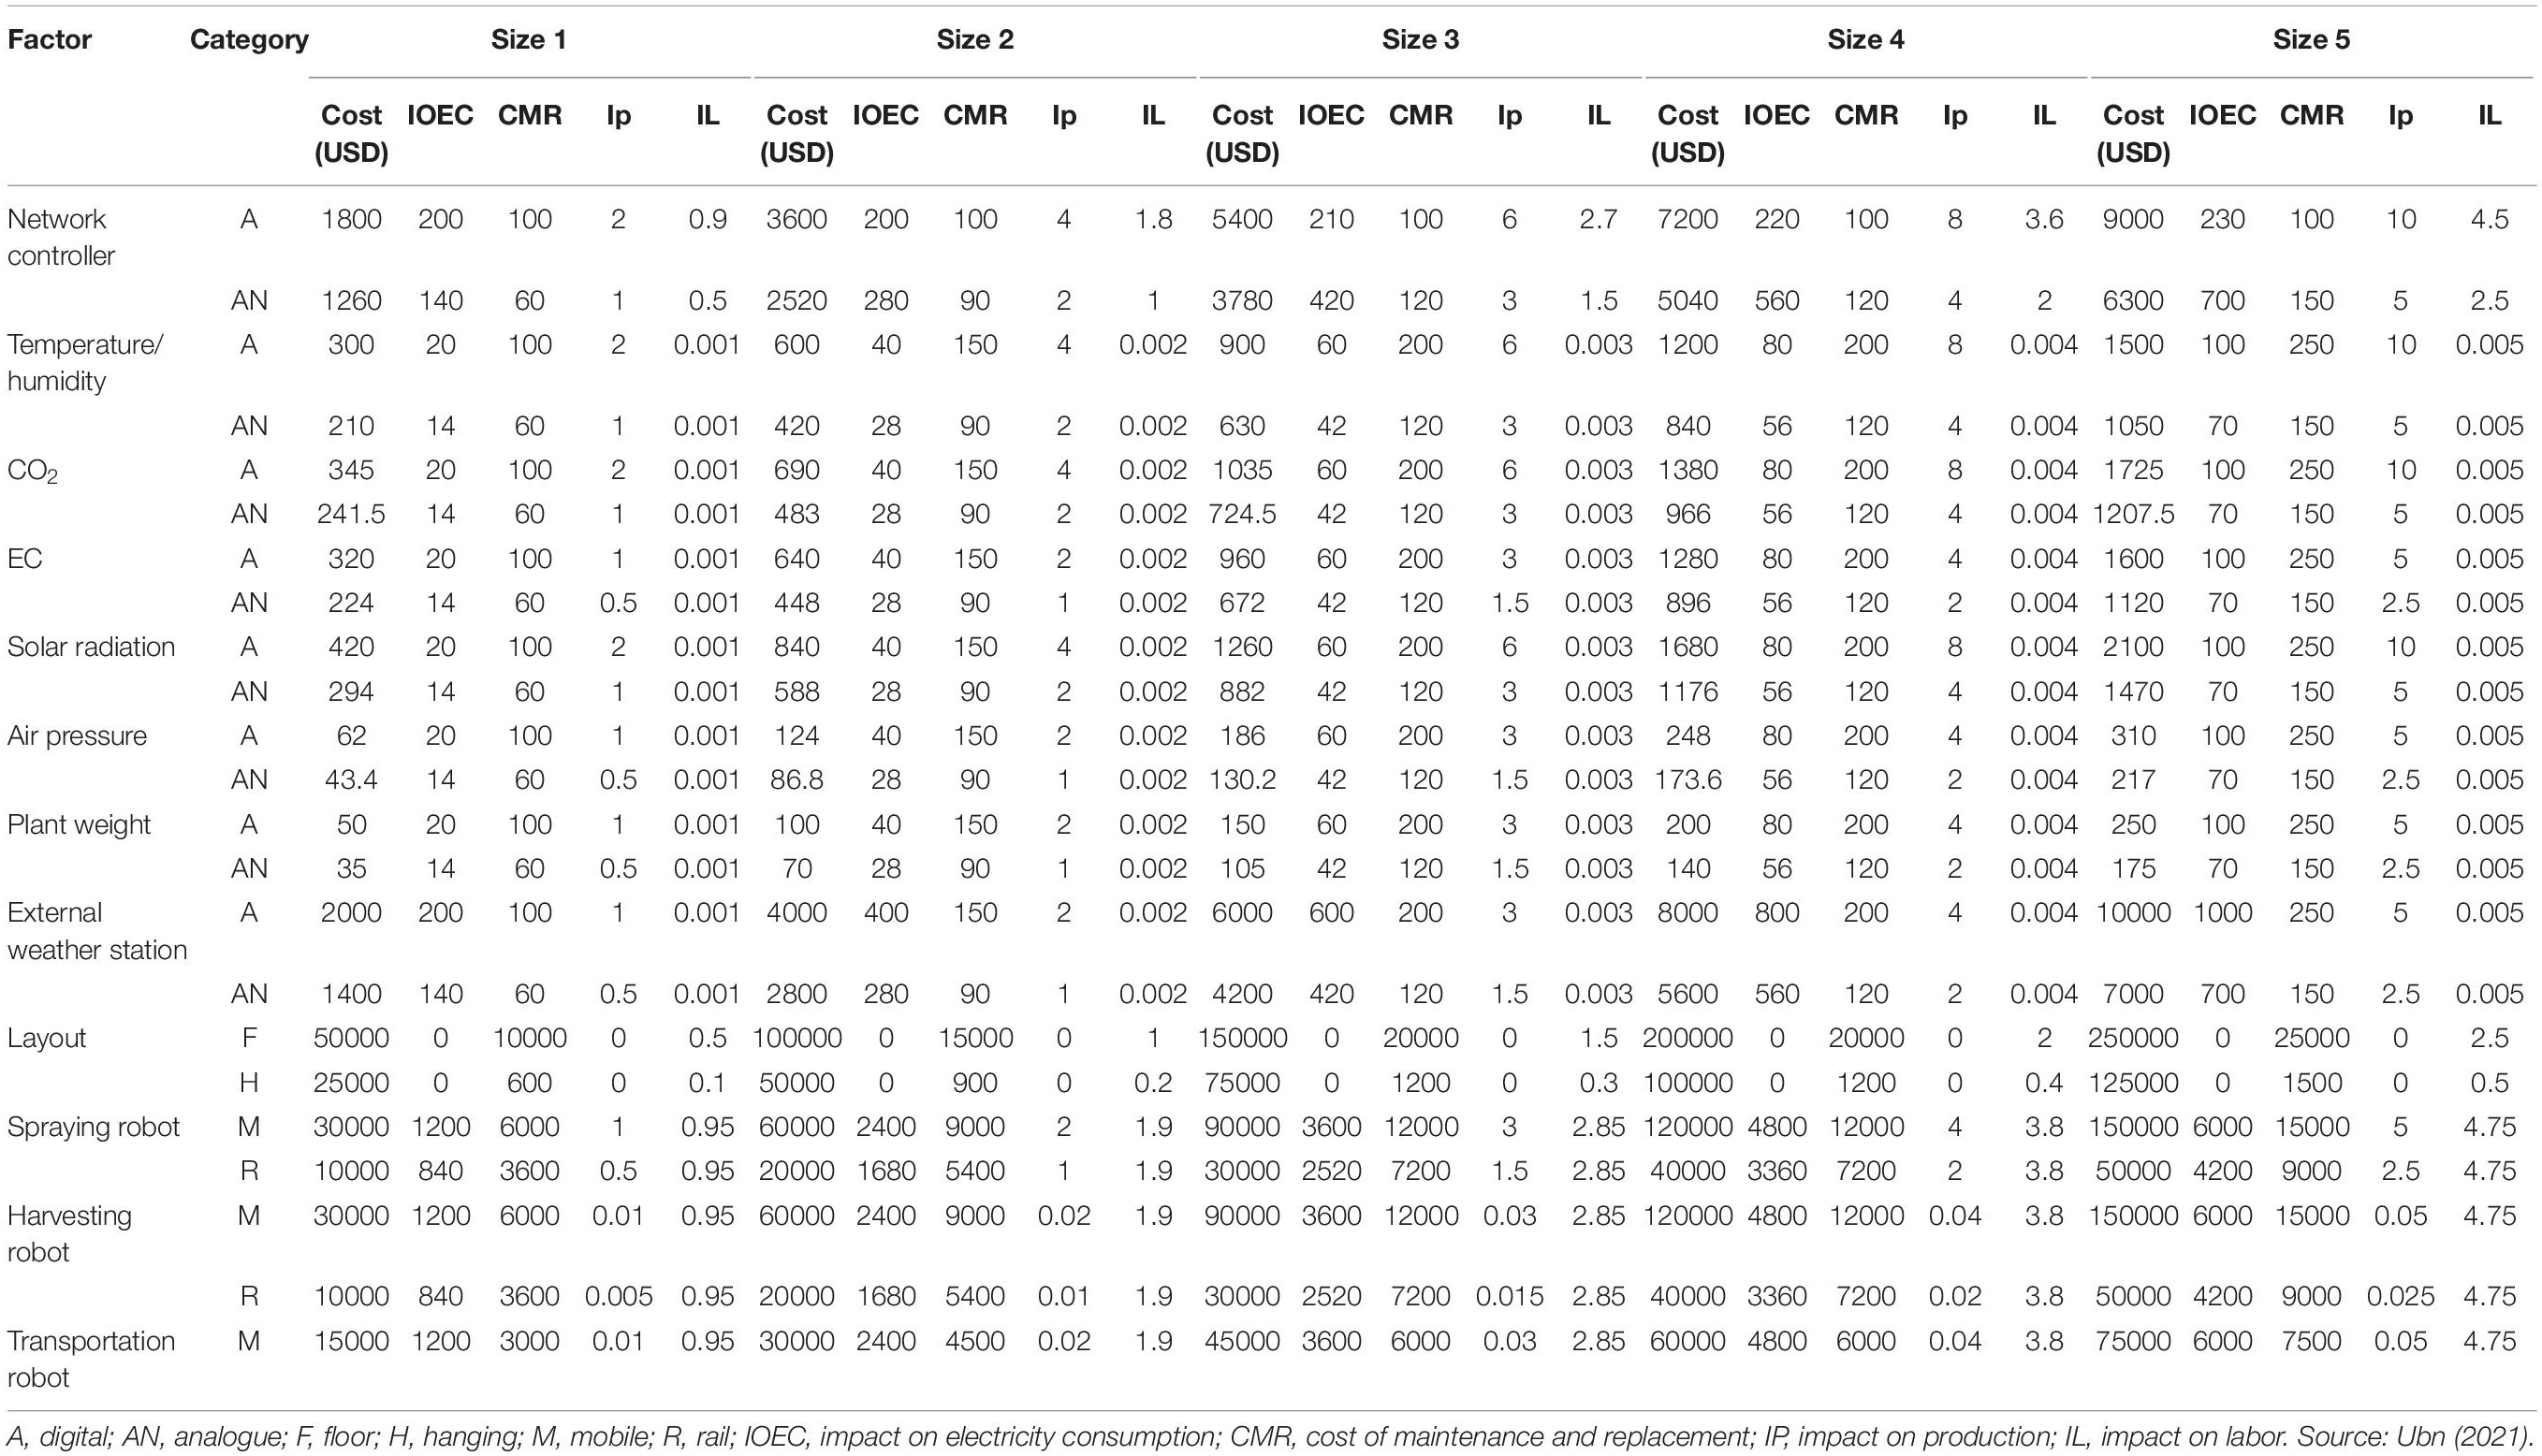
To evaluate the robustness of the proposed method, two sub-factors of the investigated factors were considered (Table 1) with three Cases and five sizes of a plant production system. The plant production system used for this study had five compartments of similar sizes. Size one represented one compartment, size two represented two compartments, and up to size five represented all compartments. The schematic is shown in Figure 5. Usually, growers have their systems divided into compartments of similar sizes for different reasons, such as ease of management. Protected cultivation systems are typically single large structures divided into smaller simple compartments. Depending on the local situation and resources of the grower, the system could be divided into various compartments (Research Wua, 2021). For example, The Radix Serre Plant production system in the Netherlands has 9,000 m2 glass and comprises over 100 compartments (Research Wua, 2021). Each is considered and treated as an individual system. This study selected a plant production system with one to five compartments. Depending on the factor (type of equipment) and the number of compartments, the relationship between the variables at different sizes (compartments) would be linear as the compartments would require the same number of equipment such as the sensors (temperature and humidity). Since the compartments in the protected cultivation system have similar sizes, cost, impact on electricity consumption, production, and labor cost had a linear relationship. When it comes to the cost of maintenance and replacement, it can be linear in some situations and not linear in others, as there are ranges that these are priced. For example, only a single network controller is required in a plant production system irrespective of the number of compartments; the cost of maintenance and replacement of the network controller would not be linear compared to temperature and relative humidity sensors. The number of sensors and other retrofitting measures in one compartment (Size 1) of the plant production system was selected based on Korean industrial standards (UBN, 2021; Table 2). A compartment of the system had a height of 6,700 mm, a width of 8,000 mm, and a length of 16,700 mm. This formed the basis for selecting the number of retrofitting measures required for the other system sizes (Sizes 2–5).
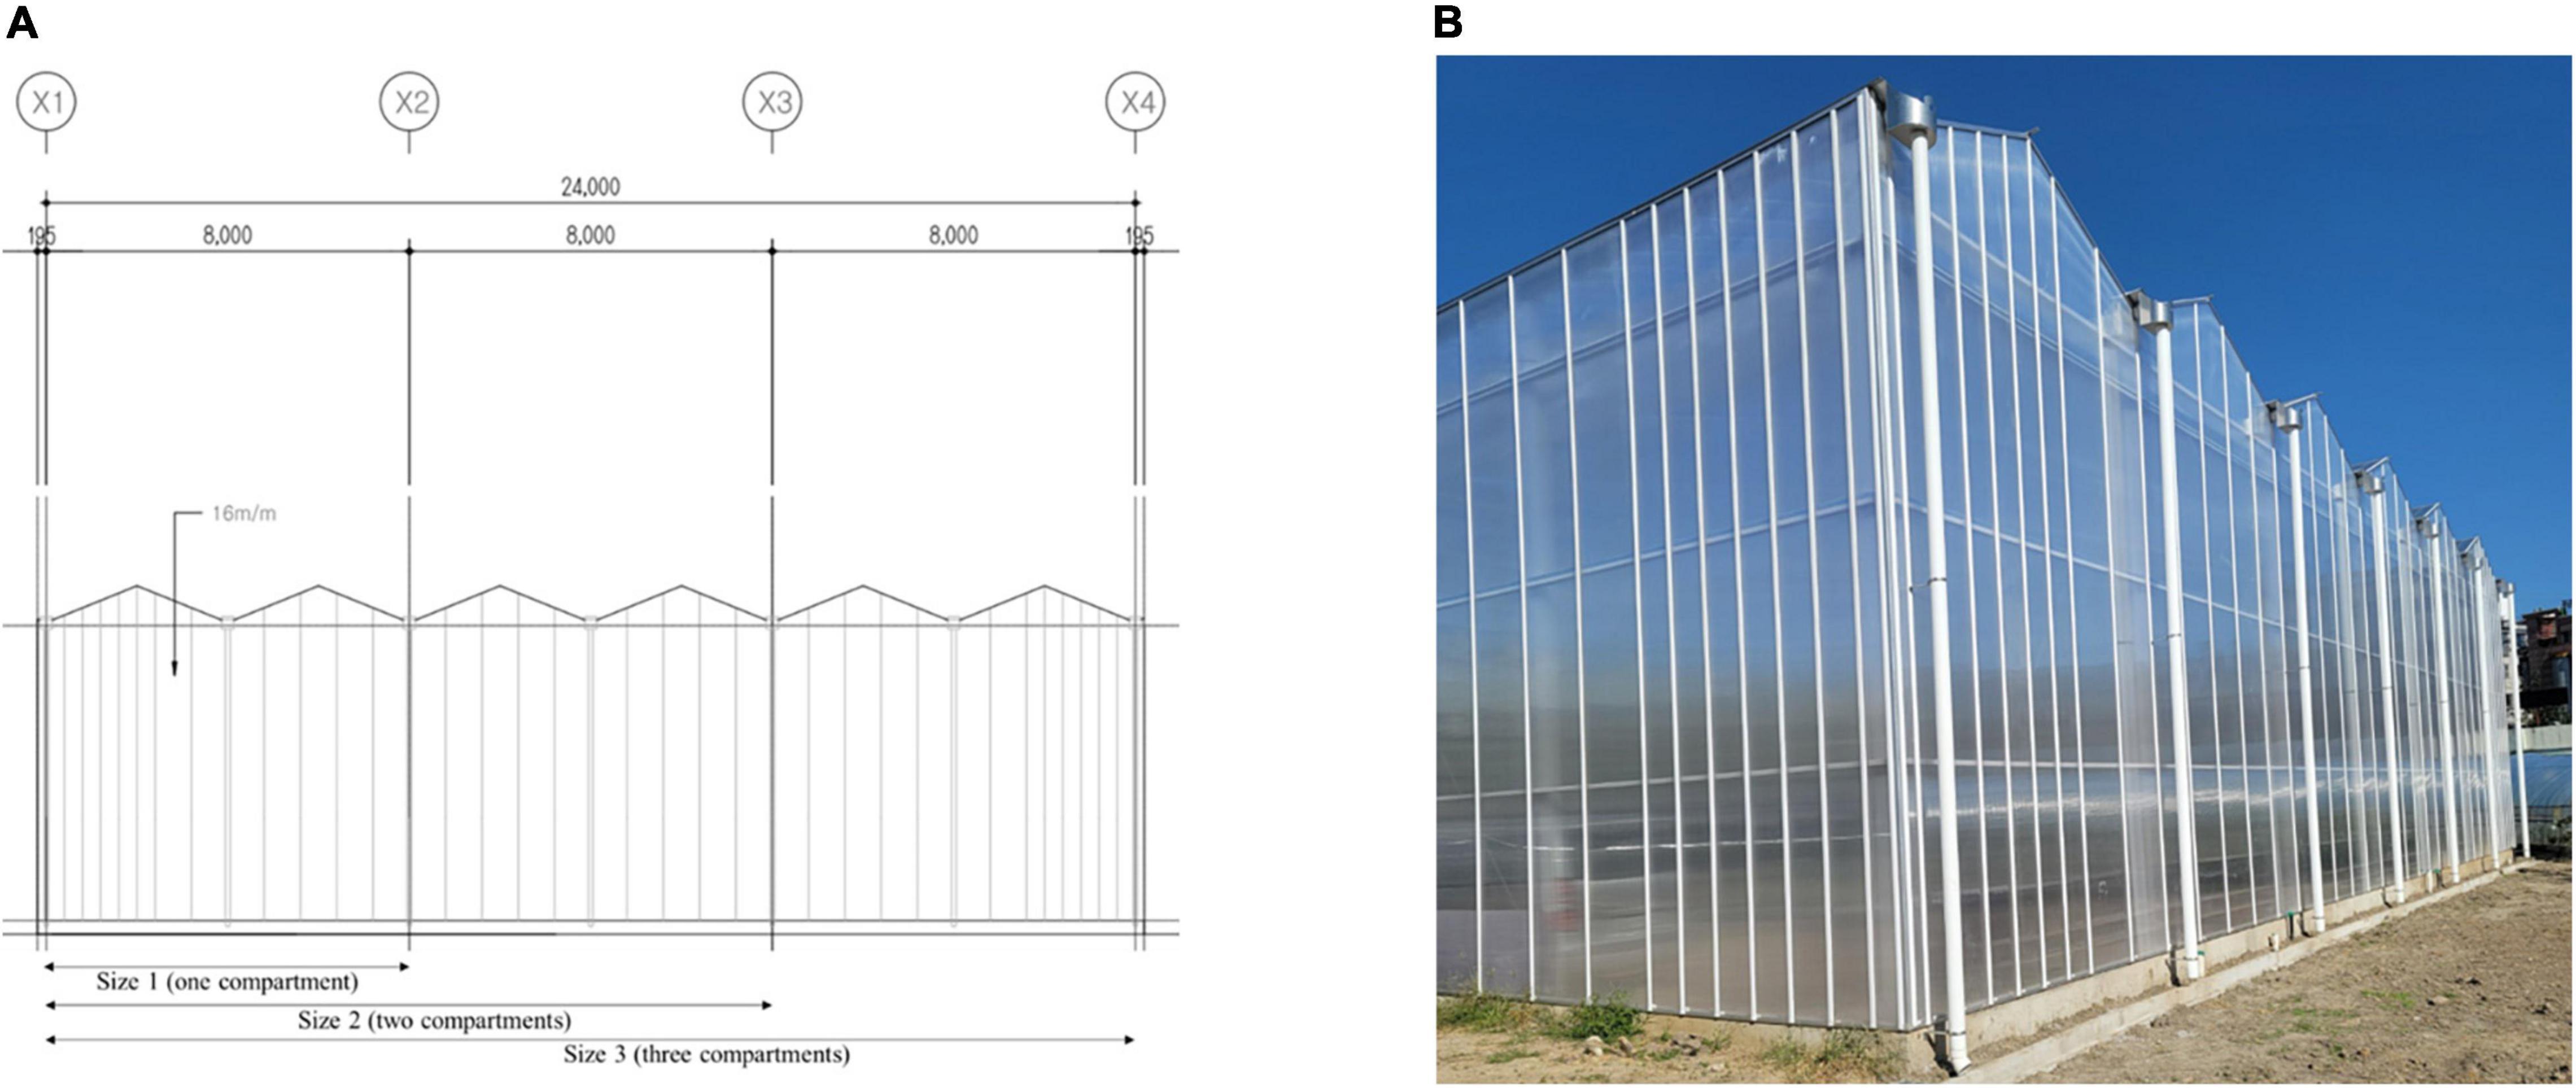
Figure 5. Schematic of the experimental plant production system with one to three compartments (X1–X2: Size 1, X2–X3: Size 2, X3–X4: Size 3) (A), and external view of the system (B).
The yield data (Table 1) used was guided by visits to plant production system growers in the Republic of Korea to validate the optimization model. Strawberry yields are dependent on the environmental conditions, systems, techniques of production, and type of plant production system, which includes plant factories and greenhouses, as also reported by Kubota (2015).
Computation of Impact of Automation on Labor
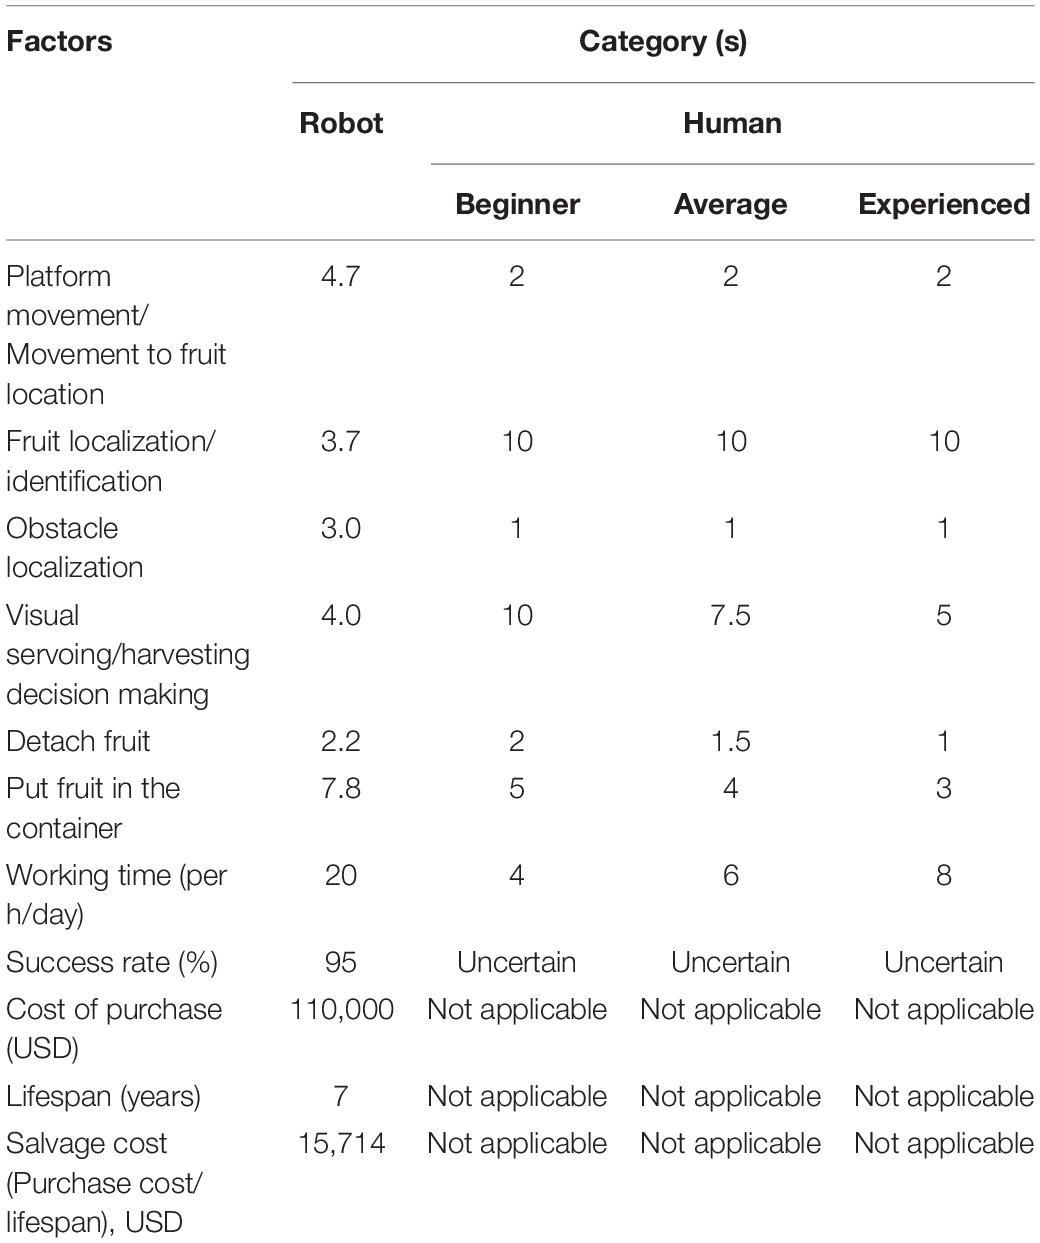
Data were acquired using structured questionnaires from growers adopting plant production systems to demonstrate the importance of retrofitting robotics in a plant production system. The human category was divided into three groups based on their expertise. Finally, we considered a real-world scenario of the first-of-its-kind strawberry harvesting robot (Table 3) as a comparison.
The factors (Sweeper, 2020) given in Table 3 were considered in deciding the impact of operating a robot on labor cost and yield.
Additionally, there are numerous benefits of using robotics in a plant production system that is near impossible to quantify in terms of monetary benefits but rather impact. These include:
(i) Safety of products.
(ii) Availability of skilled workers.
(iii) Incessant increase in wages of skilled workers as seen in the context of the Republic of Korea and other OECD countries.
Also, the data for the sensors were collected from the UBN sensors company (UBN, 2021) and used in the simulation.
Overall, the developed system provides the user with the possibilities of specifying their local context (Size and service life of the plant production system, cost of the items for retrofitting, cost of electricity per unit and impact of retrofitting on electricity consumption, interest paid on loans for retrofitting items, the annual rate of increase in energy cost, maintenance, and replacement period for each retrofitted item, projected production before and after retrofitting, projections in the price of the product, labor cost before and after retrofit, projections in the cost of labor and profit).
Simulation Results and Discussion
Measures, Cost of Expenditure, and Profit for Retrofitting Case 1 Plant Production Systems
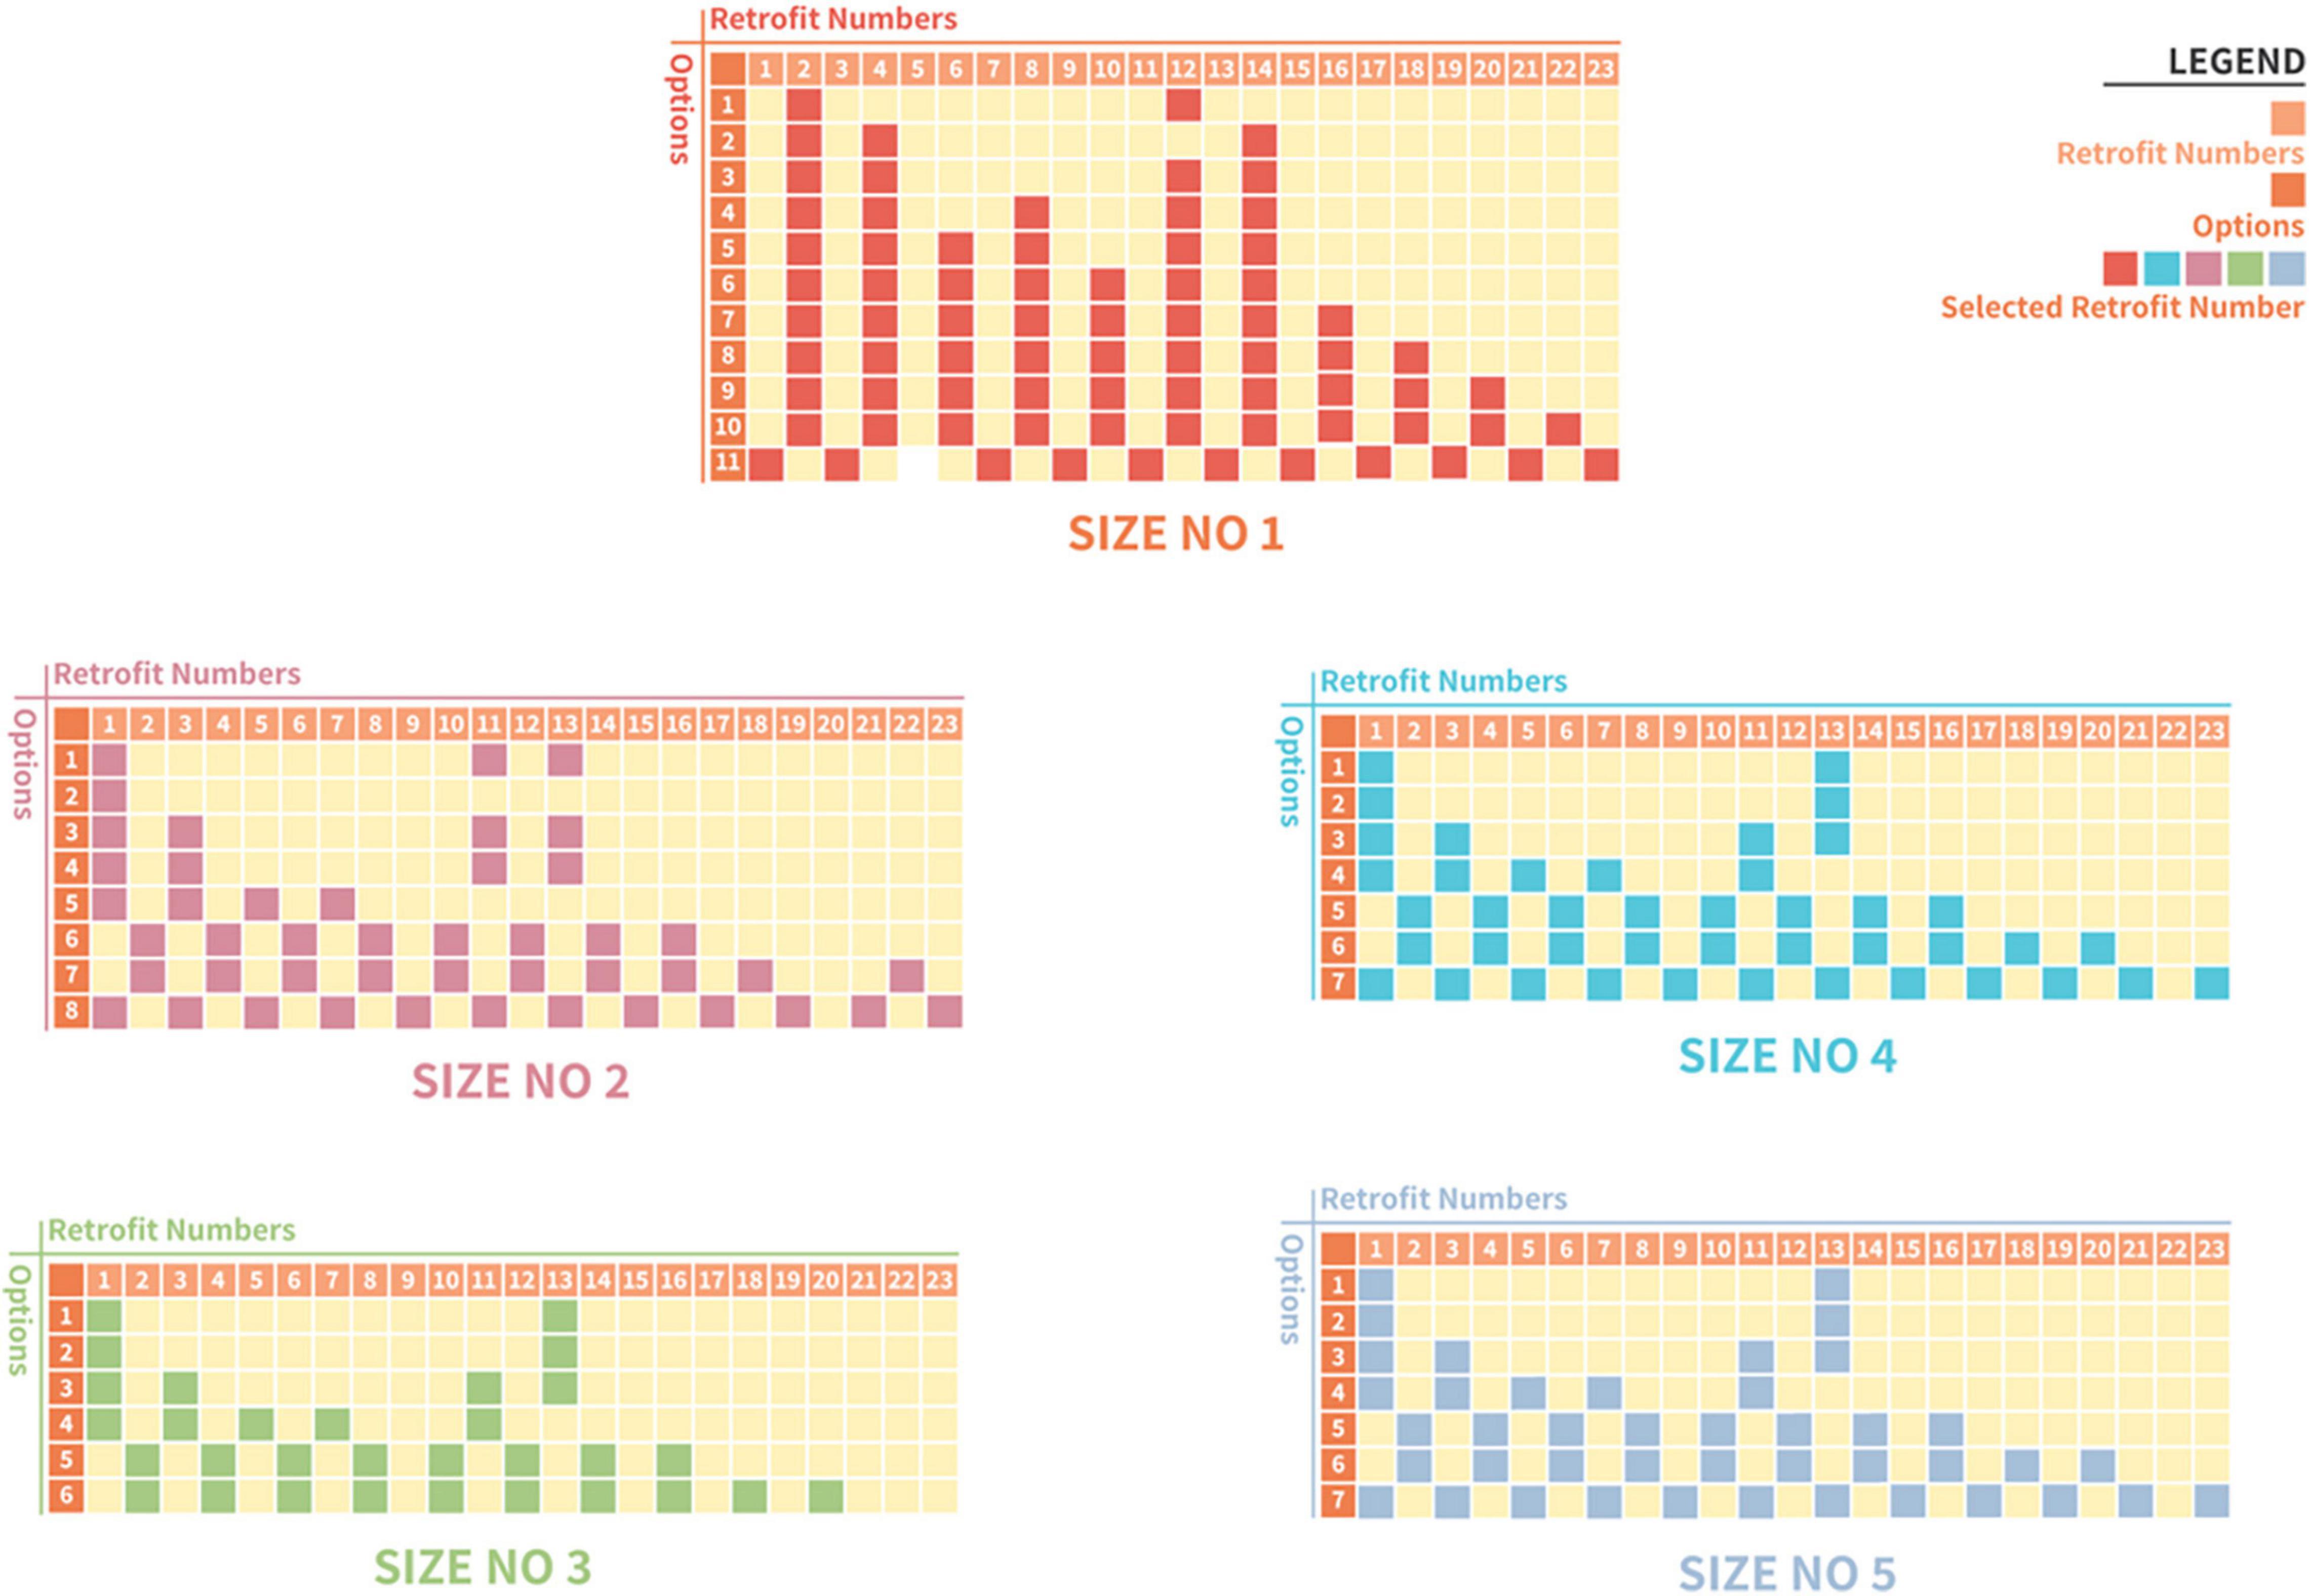
The simulation results show feasible combinations at different sizes for Case 1, represented with different colors for the selected measures (Figure 6). Each combination shows the total expenditure required to carry out the retrofit for the lifespan of the plant production system and the projected net profit per year (Figure 7). The feasible retrofits and tradeoff total expenditure versus the net profit per year are presented for all sizes. In Case 1, in size 1 of the retrofitting combinations, multiple feasible combinations were obtained compared to sizes 2–5 (Figure 6). However, the few possible retrofit combinations in sizes 2–5 show more return on investments (ROI) than the multiple feasible combinations in size 1. This demonstrates that despite the grower with size 1 having numerous possible combinations, the size of a system is more critical for profitability (Figure 7). The results also indicate that introducing new technologies might not necessarily mean a return on investment in an optimum way without analyzing all possible factors, such as current and projected labor costs and electricity consumption. The results in Figure 6 also show that despite a similar amount of money being spent to carry out the retrofit at a point across the different sizes of the plant production system, the net profit increased with the size of the system.
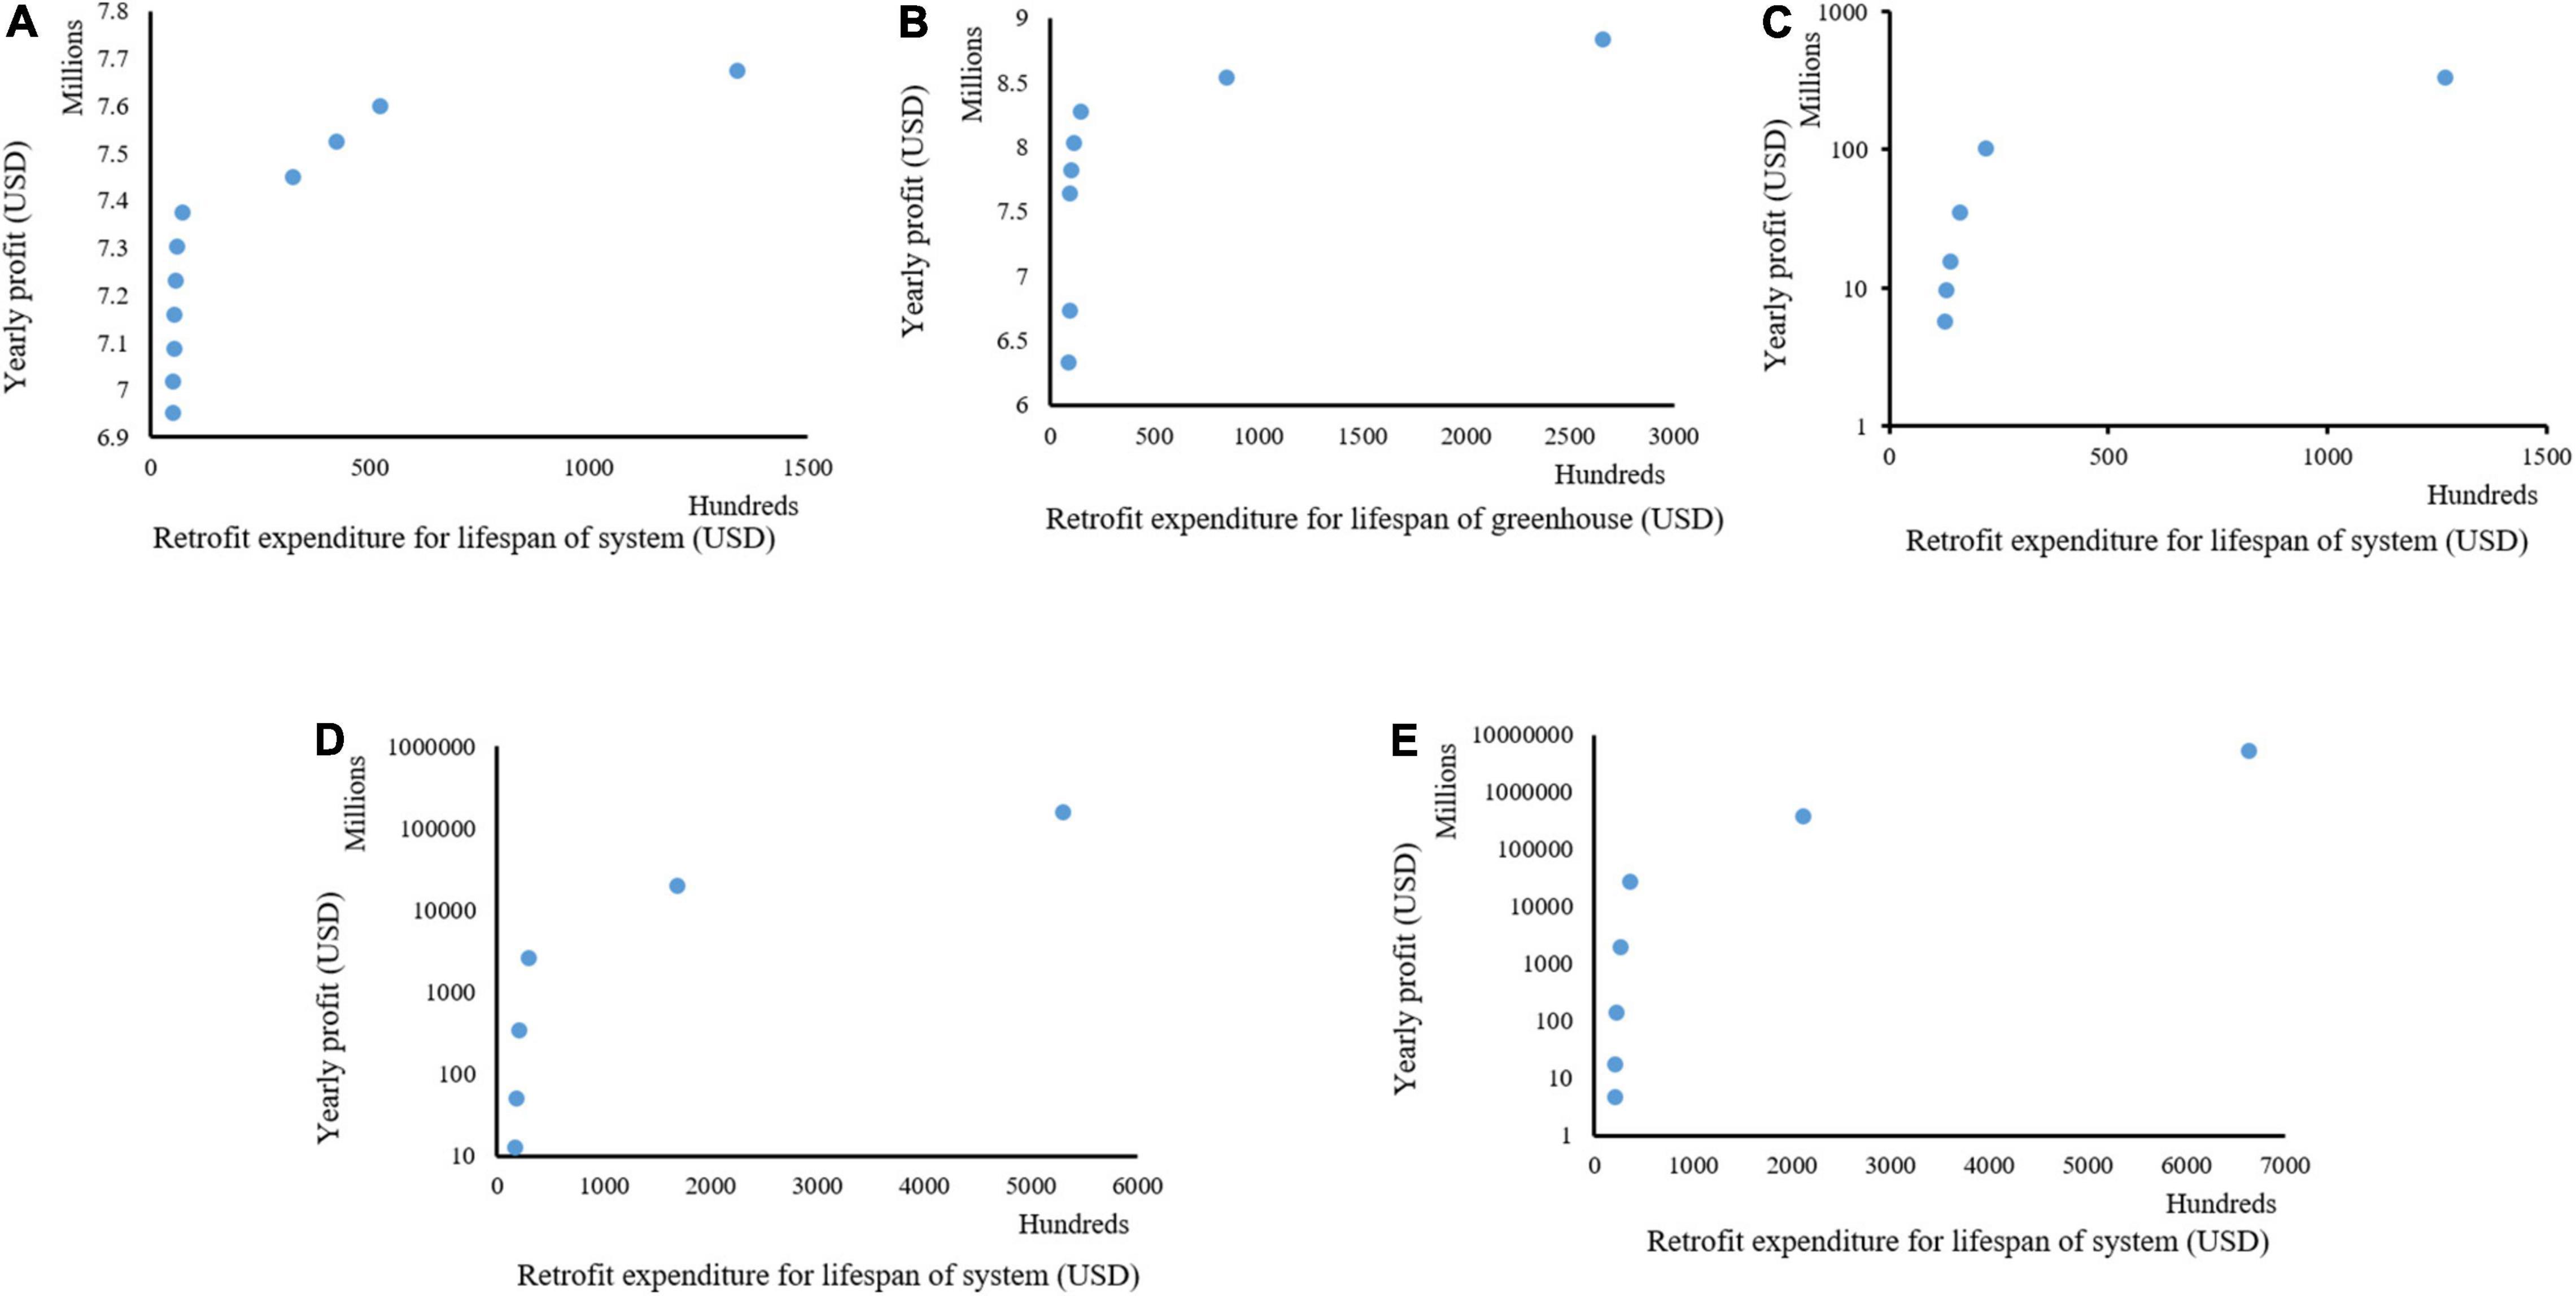
Figure 7. Different combinations of cost of retrofitting and yearly profit derived at different sizes of a plant production system for Case 1; size 1 (A), size 2 (B), size 3 (C), size 4 (D), and size 5 (E).
Further analyses of the return on investment in the size 1 (Figure 7A) in Case 1 showed a similar cost. Subsequently, retrofit combinations were available to be implemented that significantly increased the net profits. For example, there was a 4.03% increase in yearly net profit between two retrofit combinations with an investment cost of 4,990 and 5,700 USD (Figure 7A). An increase of 700 USD investment would result in about 280,000 USD or 4.03% in yearly net profit in this situation. In these combinations, the combination at the cost of 4,990 USD had selected retrofit measures 2 and 12 (Figure 6), which are analog network controller and temperature/humidity sensors (Figure 1). However, in the combination of 5,700 USD, the selected retrofit measures were 2, 4, 6, 8, 12, and 14 (Figure 6). This combination picked additional measures in addition to the two chosen at the cost of 4,990 USD. These were sensors for CO2, solar radiation, air pressure, and plant weight (Figure 6). Both combinations picked only analog measures. The sensors picked at the cost of 5,700 USD facilitated improved decision-making, thus increasing yearly productivity and extension profit.
Further analysis showed that all cost combinations except one selected the analog category instead of the digital. However, despite the investment cost of about 133,984 USD compared to the closest cost combination of about 52,394 USD which is less than half, the return on investments is approximately 7,675,358 USD and 7,599,365 USD, respectively (Figure 7A). This was a 1% increase compared to the 155% increase in investment cost. This analysis shows the importance of this system and the need to consider various factors when carrying out retrofits.
Measures, Cost of Expenditure, and Profit for Retrofitting Case 2 Plant Production Systems
In Case 2 retrofitting measures for a plant production system (Figure 8), an increase in productivity at a similar labor cost in Case 1 was investigated. These analyses were done to ascertain the impact of production on retrofit. Despite the cost of investment was similar, there was a significant increase in the return on investment when the productivity was doubled. This was around a 100% increase in the return on investment in size 1 of the system (Figure 8A). However, as the size of the system increased (Figures 8B–E), despite the similarity in the investment cost for retrofitting between Case 1 and 2, and the doubling of the productivity, a different trend was seen with the return on investment of around 132% for sizes 2 (Figures 7B, 8B), 121% for sizes 3 (Figures 7C, 8C), 136% for sizes 4 (Figures 7C, 8D), and 155% for size 5 (Figure 8E). This demonstrates that the size of the system and productivity are essential factors to consider in retrofitting. A similar trend in combinations of retrofit measures to be implemented was seen between Case 1 and Case 2.
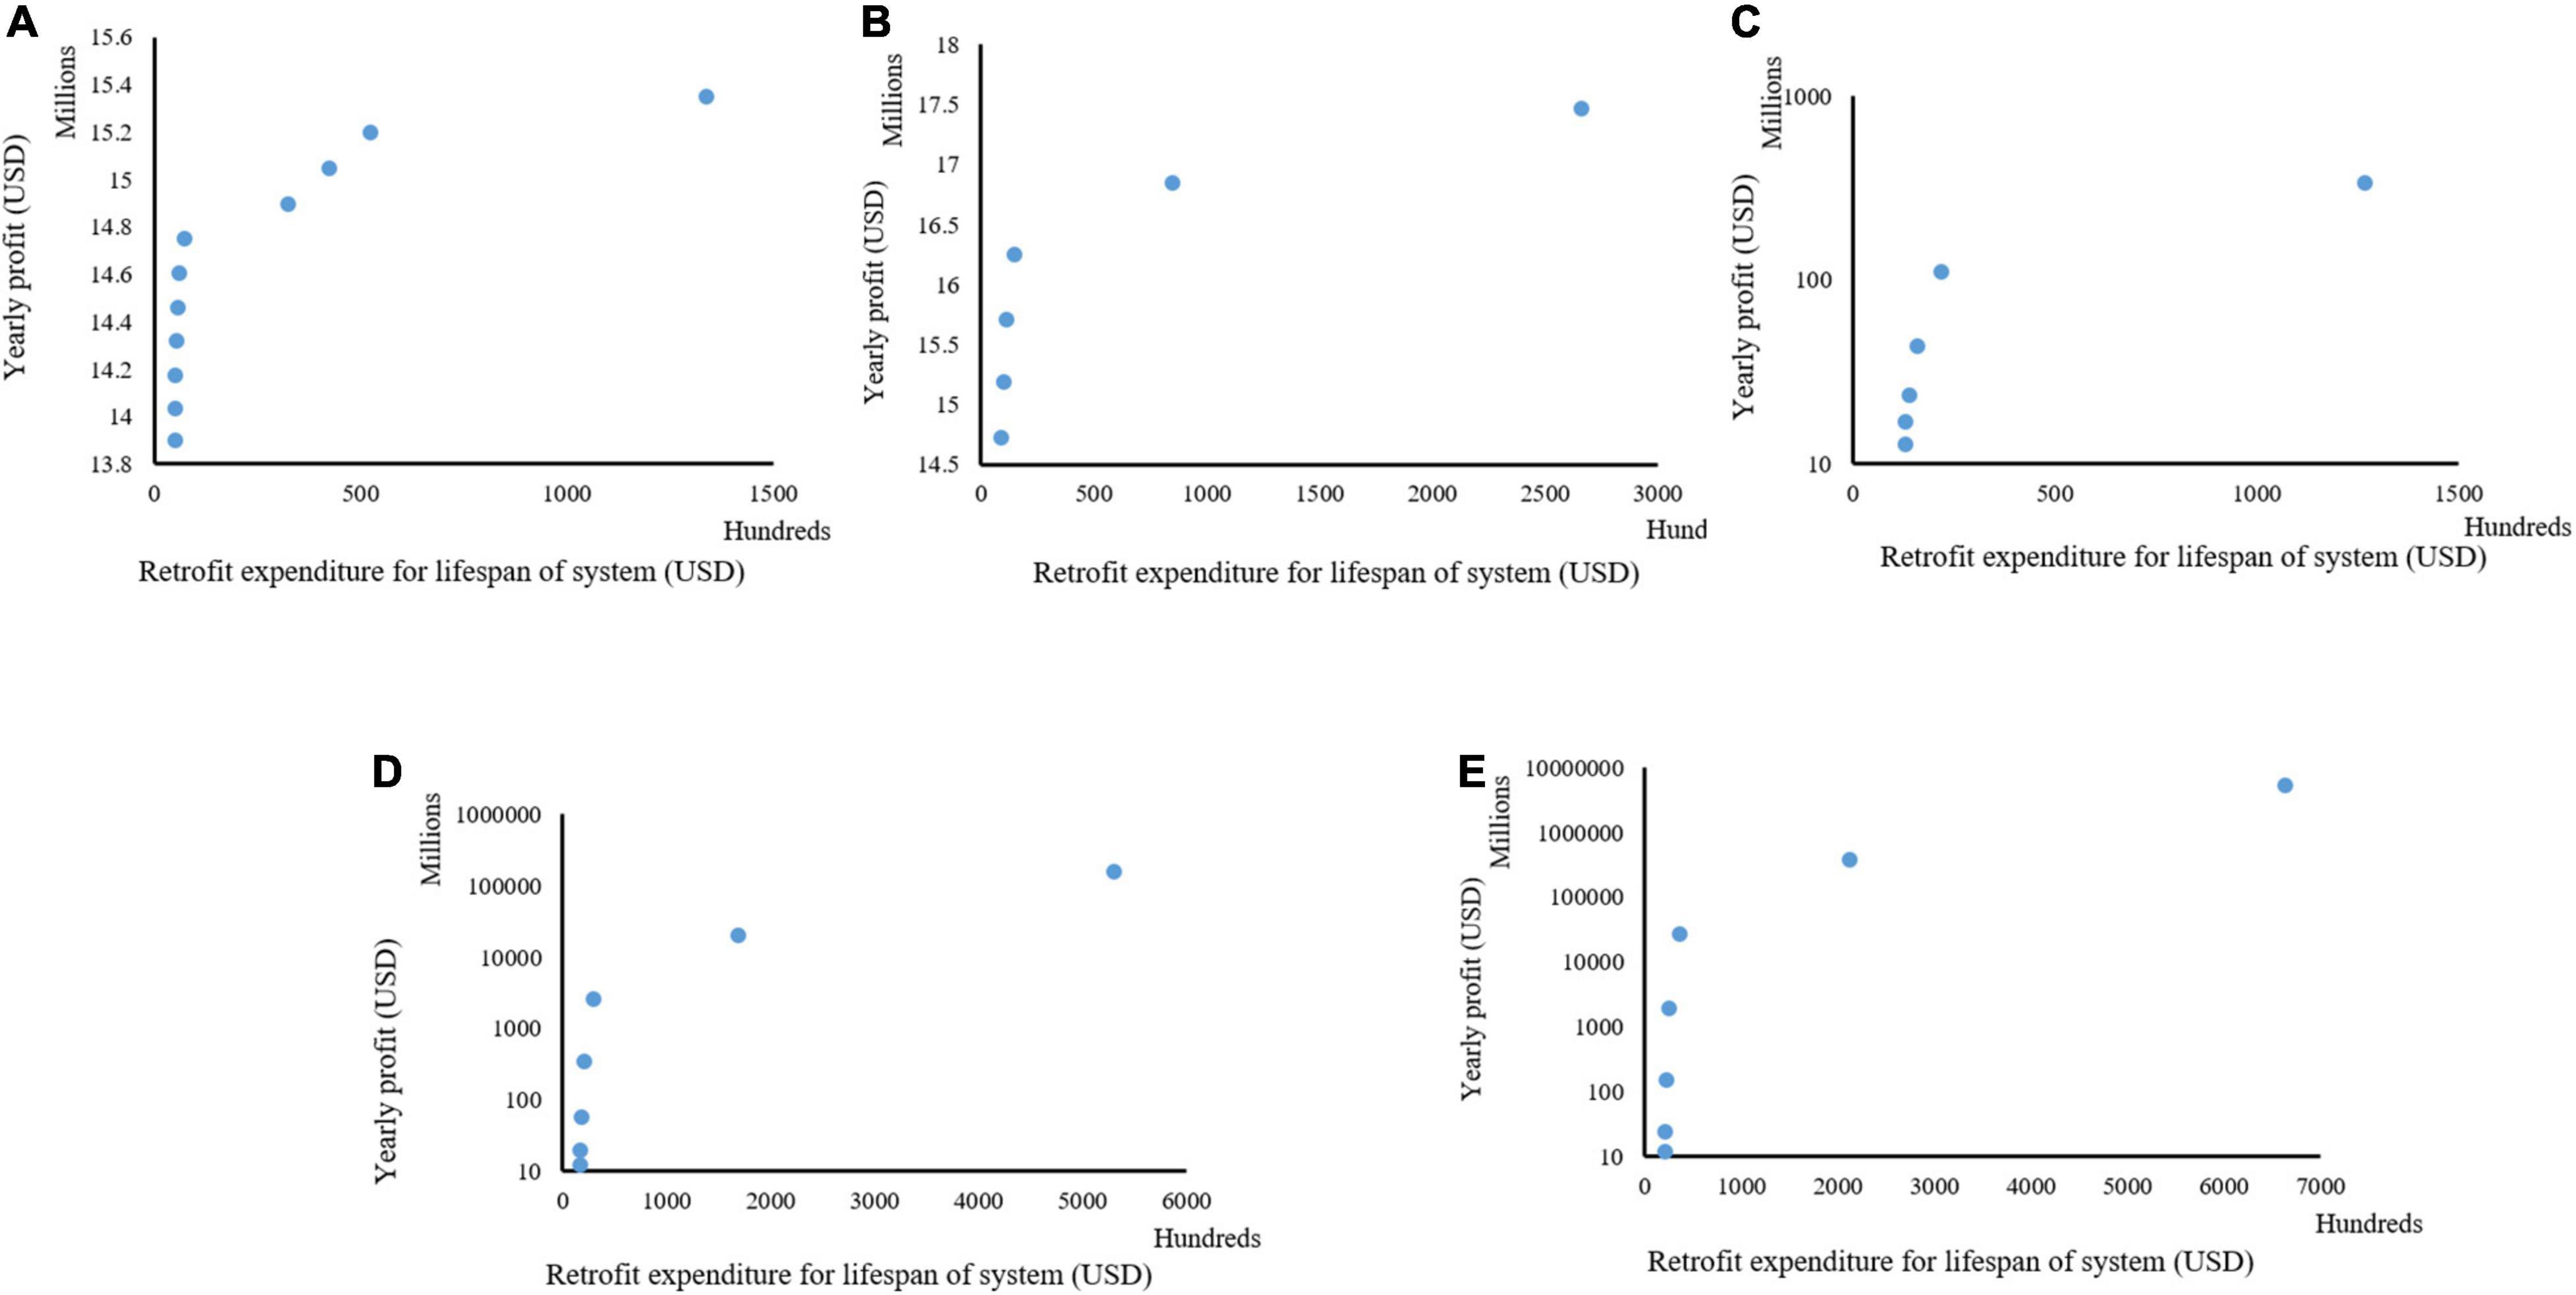
Figure 8. Different combinations of cost of retrofitting and yearly profit derived at different sizes of a plant production system for Case 2; size 1 (A), size 2 (B), size 3 (C), size 4 (D), and size 5 (E).
Measures, Cost of Expenditure, and Profit for Retrofitting Case 3 Plant Production Systems
Case 3 was designed to investigate the impact of labor cost on the retrofit measures, cost of investment, and return on investment. This case was investigated because of the similarities in productivity that are sometimes found in plant production systems from the optimal control of the micro- and macro- environments but the difference in the local contexts with labor cost because of the disparity in standard of living and development. In this Case, the productivity was kept like in Case 1, but the labor cost was doubled in Case 3. Size 1 (Figure 9A) showed no difference between Case 1 and Case 3 at comparable investment costs, even though the labor cost in Case 3 doubled that in Case 1. However, in the size 2 (Figure 9B) of Case 3, a different trend was seen compared to Case 1. The results show that the least amount of money for retrofit (around 9,000 USD) had a better return on investment than the most expensive combination (about 26,000 USD) for retrofits in Cases 1 and 3. These were a 29% increase in return on investment in Case 1 compared to Case 3 at the least combination of retrofit factors and around a 2% increase in return on investment in Case 1 compared to Case 3 for the maximum combination of retrofit factors. This was even more with the comparisons in investment cost and the cost of labor in Case 3 being a 100% increase from Case 1. To validate our method, we analyzed the components selected in both situations (least and highest cost of investment). Only two retrofit measures were selected at the least cost of investment: a digital network controller and an air pressure sensor for Case 1. In Case 2, only the digital network controller was selected. The selected retrofit measures in both Case 1 and Case 3 have minimal impact on productivity and cost of labor. This verifies the increase in return on investment of around 29% in Case 1, size 2 from that of Case 3. The increase was because of the savings from labor costs in Case 1. However, with the maximum investment cost, all the automated measures were selected in Case 1 and Case 3. With this, the labor cost did not significantly impact the return on investment, thus leading to only a 2% increase in return on investment of Case 1 compared to Case 3.
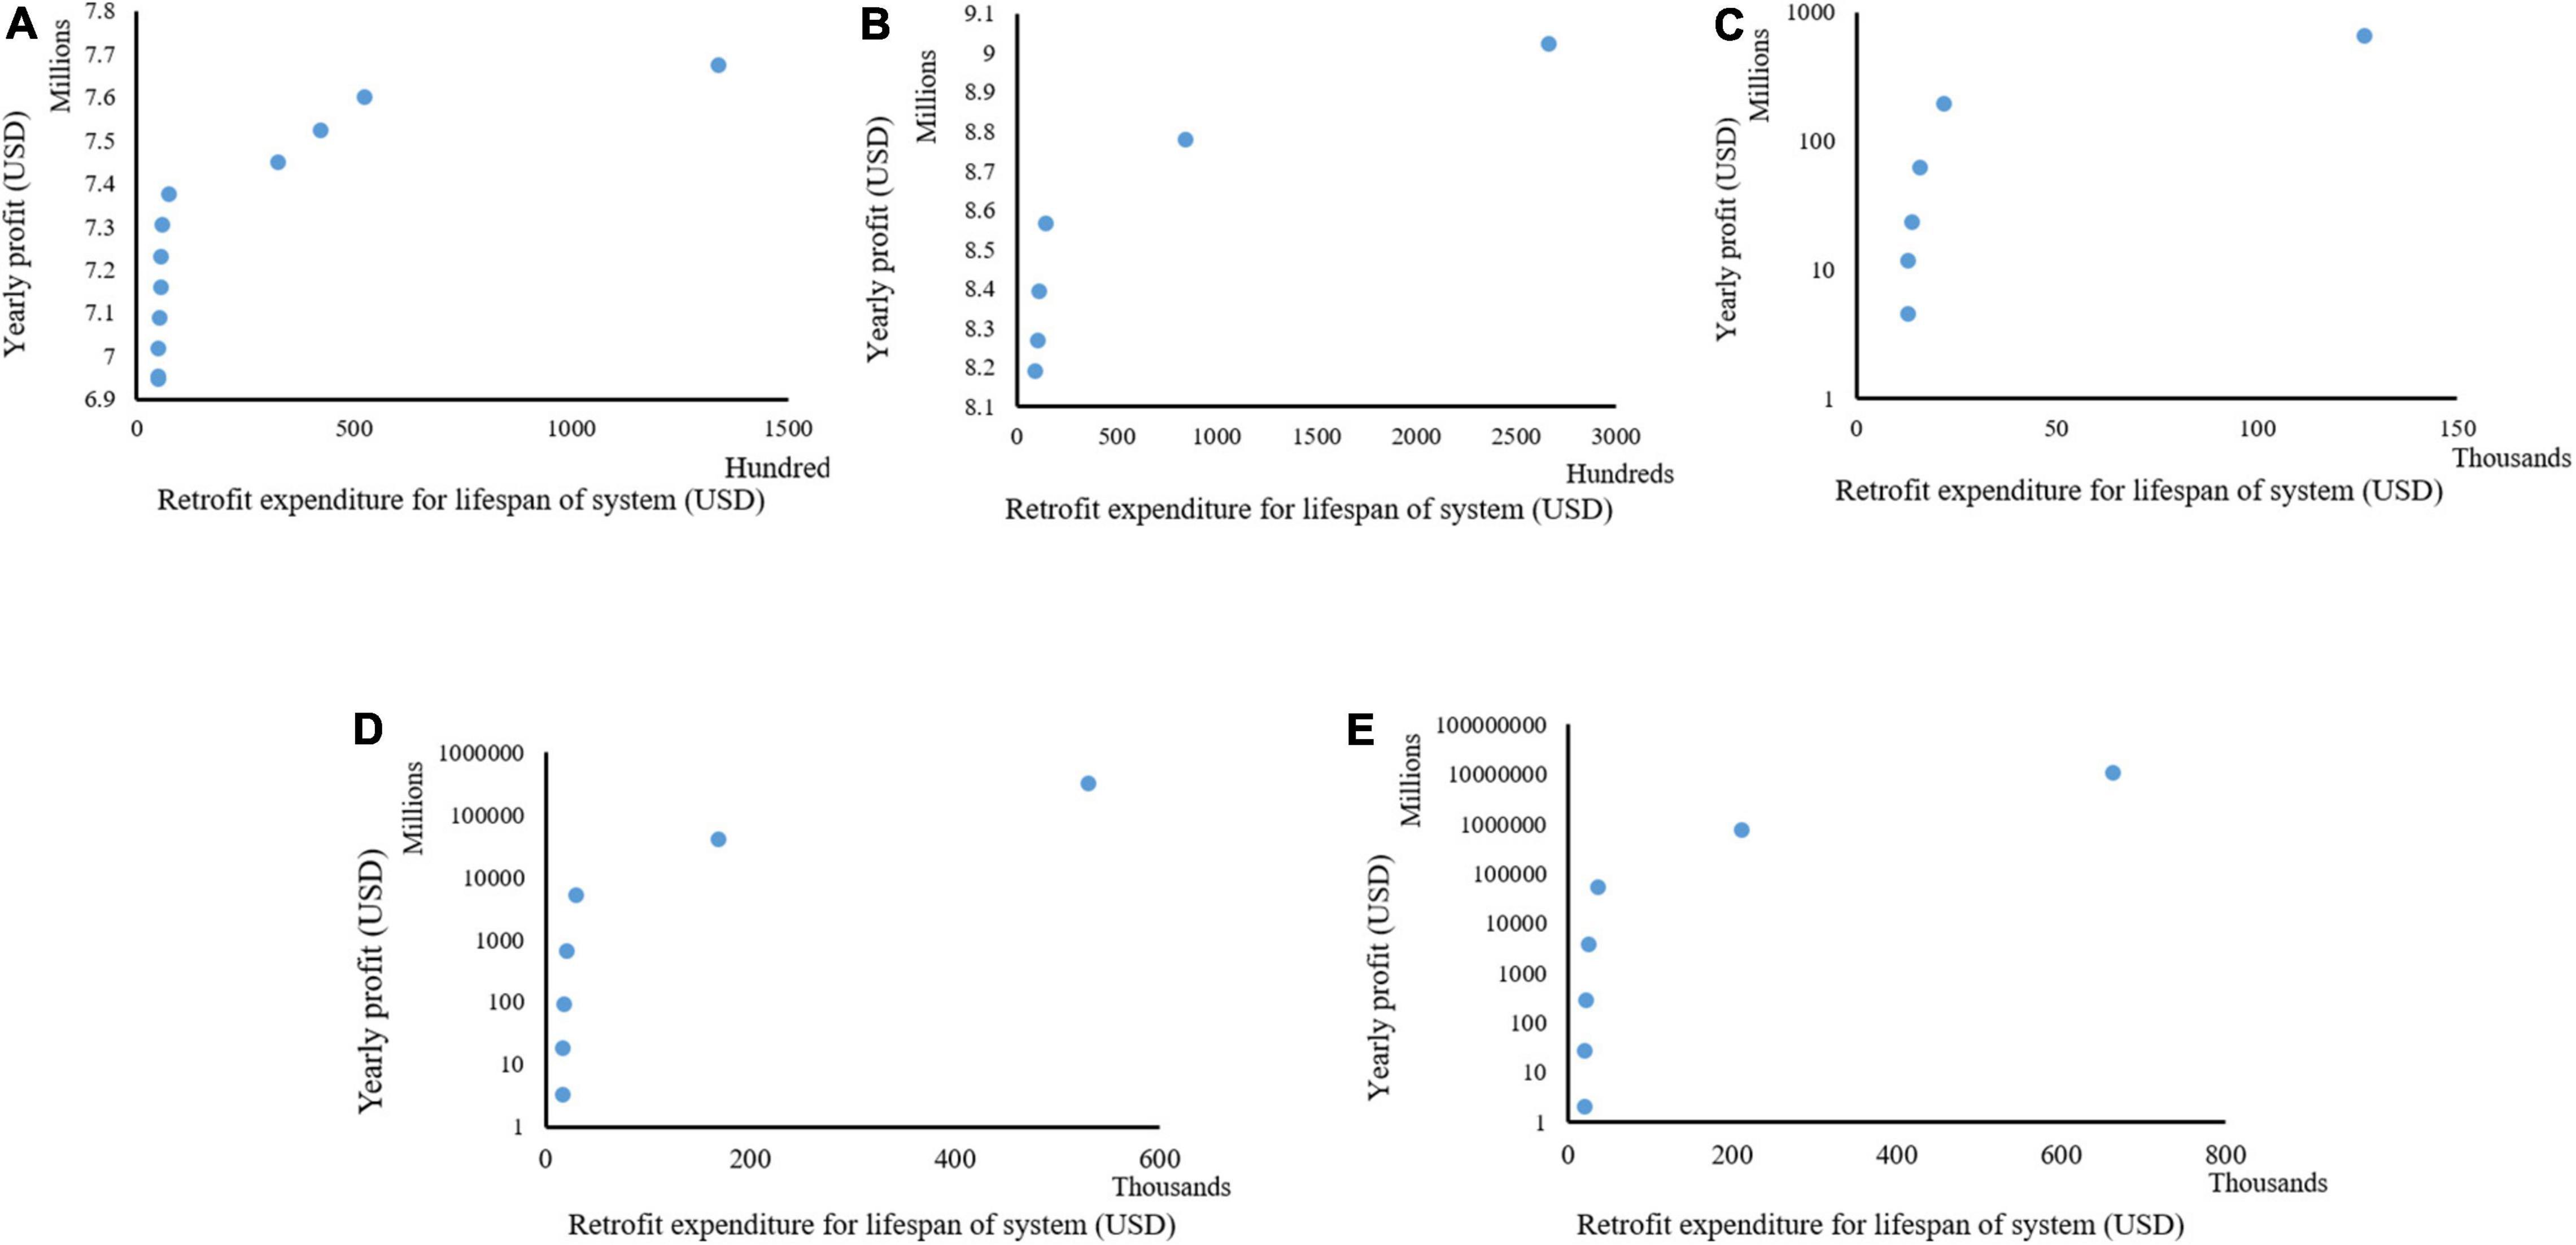
Figure 9. Different combinations of cost of retrofitting and yearly profit derived at different sizes of a plant production system for Case 3; size 1 (A), size 2 (B), size 3 (C), size 4 (D), and size 5 (E).
Impact of Labor Cost and Productivity on Return in Investment in Retrofitting
Figures 7–9 shows the combination of the total expenditure required to carry out the retrofit for the lifespan of the plant production system and the projected net profit per year for three investigated cases. These cases varied in the production quantity before retrofits and local labor costs. These were done to explore what would impact the retrofitting expenditure and profits as different yields are gotten across different systems depending on the cultivated variety and other inputs. The labor cost also varies with the local situation as systems closer to the urban centers would have more expenditure on labor costs than those located farther from the cities. Analyses of the results showed that despite having similar spending for the three investigated scenarios of labor cost and yields, the total maximum yearly profit was similar for Cases 1 and 3 but was double for Case 2 from what was recorded in Cases 1 and 3 for size 1. A similar scenario was recorded in Size 2. In sizes 3–5, a similar maximum profit was recorded in all the investigated cases. This points out that despite the labor cost being double in Case 3, the similar productivity in Cases 1 and 3 would result in similar profits at a smaller production capacity, but this would change as the size of the production system increases. Also, our analyses show that at a smaller production capacity, the grower needs to pay attention to the best variety for productivity when retrofitting. This becomes less important when the size of the system increases. These analyses point to the importance of this decision-making tool when deciding to retrofit.
Conclusion
A user-friendly system to generate all the feasible tradeoff retrofit combinations for agricultural production systems such as plant factories and greenhouses was developed in this study. Cost of new technologies, interest on loans for retrofitting, size and service life of the production system, the present and projected cost for human labor and robotics, productivity, energy consumption, and replacement and maintenance costs were considered in the developed system. The presentation of tradeoff solutions of possible retrofit combinations, total expenditure, and net profit per year that is made possible by the developed system would improve decision-making. For example, an investigated case showed an increase of up to 250% in net profits. We propose a multi-objective retrofitting method for agricultural production systems to minimize the total cost of investment and maximize the yearly net profit.
Data Availability Statement
The original contributions presented in this study are included in the article/Supplementary Material, further inquiries can be directed to the corresponding author.
Author Contributions
DU: conceptualization, methodology, software, investigation, formal analysis, data curation, visualization, and writing – original draft. RM: methodology, investigation, software, data curation, visualization, and writing – review and editing. TP and YH: validation, resources, writing – review and editing, supervision, and funding acquisition. SW: validation, visualization, funding acquisition, and project administration. All authors contributed to the article and approved the submitted version.
Funding
This work was supported by Korea Institute of Planning and Evaluation for Technology in Food, Agriculture, and Forestry (IPET) through the Agriculture, Food and Rural Affairs Convergence Technologies Program for Educating Creative Global Leader, funded by the Ministry of Agriculture, Food and Rural Affairs (MAFRA) (320001-4) and (716001-7), Republic of Korea and Rural Development Administration (RDA) through the development of data application technology for postharvest management of the agricultural & livestock product project, funded by the Ministry of Agriculture, Food and Rural Affairs (MAFRA) (PJ016981).
Conflict of Interest
The authors declare that the research was conducted in the absence of any commercial or financial relationships that could be construed as a potential conflict of interest.
Publisher’s Note
All claims expressed in this article are solely those of the authors and do not necessarily represent those of their affiliated organizations, or those of the publisher, the editors and the reviewers. Any product that may be evaluated in this article, or claim that may be made by its manufacturer, is not guaranteed or endorsed by the publisher.
Supplementary Material
The Supplementary Material for this article can be found online at: https://www.frontiersin.org/articles/10.3389/fpls.2022.929672/full#supplementary-material
References
Antipova, E., Boer, D., Guillén-Gosálbez, G., Cabeza, L. F., and Jiménez, L. (2014). Multi-objective optimization coupled with life cycle assessment for retrofitting buildings. Energy Build. 82, 92–99. doi: 10.1016/j.enbuild.2014.07.001
Baeza, E., Stanghellini, C., and Castilla, N, editors (2011). “Protected cultivation in Europe,” in Proceedings of the International Symposium on High Tunnel Horticultural Crop Production 987. State College.
Bagnall, A. J., Rayward-Smith, V. J., and Whittley, I. M. (2001). The next release problem. Inform. Softw. Technol. 43, 883–890. doi: 10.1016/S0950-5849(01)00194-X
Barua, S. (2020). Understanding coronanomics: the economic implications of the coronavirus (COVID-19) pandemic. SSRN Electr. J. doi: 10.2139/ssrn.3566477
Bogue, R. (2020). Fruit picking robots: has their time come? Ind. Robot 47, 141–145. doi: 10.1108/IR-11-2019-0243
Deb, K., Agrawal, S., Pratap, A., and Meyarivan, T, editors (2000). “A fast elitist non-dominated sorting genetic algorithm for multi-objective optimization: NSGA-II,” in Proceedings of the International Conference on Parallel Problem Solving from Nature. (Heidelberg: Springer). doi: 10.1007/3-540-45356-3_83
Deb, K., Pratap, A., Agarwal, S., and Meyarivan, T. (2002). A fast and elitist multiobjective genetic algorithm: NSGA-II. IEEE Trans. Evol. Comput. 6, 182–197. doi: 10.1109/4235.996017
Diakaki, C., Grigoroudis, E., and Kolokotsa, D. (2008). Towards a multi-objective optimization approach for improving energy efficiency in buildings. Energy Build. 40, 1747–1754. doi: 10.1016/j.enbuild.2008.03.002
Dixon, T., McNamara, P., Miller, E., and Buys, L. (2008). Retrofitting commercial office buildings for sustainability: tenants’ perspectives. J. Prop. Invest. Finance 26, 552–561. doi: 10.1108/14635780810908398
El-Darwish, I., and Gomaa, M. (2017). Retrofitting strategy for building envelopes to achieve energy efficiency. Alex. Eng. J. 56, 579–589. doi: 10.1016/j.aej.2017.05.011
Fan, Y., and Xia, X. (2017). A multi-objective optimization model for energy-efficiency building envelope retrofitting plan with rooftop PV system installation and maintenance. Appl. Energy. 189, 327–335. doi: 10.1016/j.apenergy.2016.12.077
Fan, Y., and Xia, X. (2018). Energy-efficiency building retrofit planning for green building compliance. Build. Environ. 136, 312–321. doi: 10.1016/j.buildenv.2018.03.044
Fonseca, C. M., and Fleming, P. J. (1993). “Genetic algorithms for multiobjective optimization: formulation, discussion and generalization,” in Proceedings of the 5th International Conference on Genetic Algorithms (ICGA-93), 17-22 July 1993, Vol. 93, San Mateo, CA, Urbana-Champaign. 416–423.
Galanakis, C. M. (2020). The food systems in the era of the coronavirus (COVID-19) pandemic crisis. Foods. 9:523. doi: 10.3390/foods9040523
Gerson, U., and Weintraub, P. G. (2007). Mites for the control of pests in protected cultivation. Pest Manag. Sci. Form. Pestic. Sci. 63, 658–676. doi: 10.1002/ps.1380
Gullino, M. L., Albajes, R., and van Lenteren, J. C. (1999). “Setting the stage: characteristics of protected cultivation and tools for sustainable crop protection,” in Integrated Pest and Disease Management in Greenhouse Crops Developments in Plant Pathology, eds R. Albajes, M. Lodovica Gullino, J. C. van Lenteren, and Y. Elad (Dordrecht: Springer), 1–15. doi: 10.1007/0-306-47585-5_1
Helm, D. (2020). The environmental impacts of the coronavirus. Environ. Resour. Econo. 76, 21–38. doi: 10.1007/s10640-020-00426-z
Horn, J., Nafpliotis, N., and Goldberg, D. E. (1993). Multiobjective Optimization Using the Niched Pareto Genetic Algorithm. IlliGAL Report 93005. Urbana: University of Illinois.
Jafari, A., and Valentin, V. (2017). An optimization framework for building energy retrofits decision-making. Build. Environ. 115, 118–129. doi: 10.1016/j.buildenv.2017.01.020
Jafari, A., Valentin, V., and Bogus, SM, editors (2016). “Assessment of social indicators in energy housing retrofits,” in Proceedings of the Construction Research Congress 2016. (San Juan). doi: 10.1061/9780784479827.109
Jensen, M. H., and Malter, A. J. (1995). Protected Agriculture: a Global Review. Washington, DC: World Bank Publications.
Kannan, S., Baskar, S., McCalley, J. D., and Murugan, P. (2008). Application of NSGA-II algorithm to generation expansion planning. IEEE Trans. Power Syst. 24, 454–461. doi: 10.1109/TPWRS.2008.2004737
Kolaitis, D. I., Malliotakis, E., Kontogeorgos, D. A., Mandilaras, I., Katsourinis, D. I., and Founti, M. A. (2013). Comparative assessment of internal and external thermal insulation systems for energy efficient retrofitting of residential buildings. Energy Build. 64, 123–131. doi: 10.1016/j.enbuild.2013.04.004
Kubota, C. (2015). Strawberry Production Costs in Greenhouse. Available online at https://cals.arizona.edu/strawberry/Hydroponic_Strawberry_Information_Website/Costs.html (accessed July 12, 2021).
Kurtser, P., and Edan, Y. (2020). Planning the sequence of tasks for harvesting robots. Robot. Auton. Syst. 131:103591. doi: 10.1016/j.robot.2020.103591
Li, H., and Zhang, Q. (2008). Multiobjective optimization problems with complicated Pareto sets. MOEA/D and NSGA-II. IEEE Trans. Evol. Comput. 13, 284–302. doi: 10.1109/TEVC.2008.925798
Lima, C. K. T., de Medeiros Carvalho, P. M., Lima, I. A. A. S., de Oliveira Nunes, J. V. A., Saraiva, J. S., de Souza, R. I., et al. (2020). The emotional impact of Coronavirus 2019-nCoV (new Coronavirus disease). Psychiatry Res. 287, 112915. doi: 10.1016/j.psychres.2020.112915
Liu, Y., Liu, T., Ye, S., and Liu, Y. (2018). Cost-benefit analysis for energy efficiency retrofit of existing buildings: a case study in China. J. Clean. Prod. 177, 493–506. doi: 10.1016/j.jclepro.2017.12.225
Ma, Z., Cooper, P., Daly, D., and Ledo, L. (2012). Existing building retrofits: methodology and state-of-the-art. Energy Build. 55, 889–902. doi: 10.1016/j.enbuild.2012.08.018
Malatji, E. M., Zhang, J., and Xia, X. (2013). A multiple objective optimisation model for building energy efficiency investment decision. Energy Build. 61, 81–87. doi: 10.1016/j.enbuild.2013.01.042
Marler, R. T., and Arora, J. S. (2004). Survey of multi-objective optimization methods for engineering. Struct multidisciplinary Optimiz. 26, 369–395. doi: 10.1007/s00158-003-0368-6
Marszal, A. J., Heiselberg, P., Bourrelle, J. S., Musall, E., Voss, K., Sartori, I., et al. (2011). Zero energy building – a review of definitions and calculation methodologies. Energy Build. 43, 971–979. doi: 10.1016/j.enbuild.2010.12.022
MathWorks (2021). Minimize Multiple Objective Functions Subject to Constraints. Natick, MA: MathWorks.
Nicola, M., Alsafi, Z., Sohrabi, C., Kerwan, A., Al-Jabir, A., Iosifidis, C., et al. (2020). The socio-economic implications of the coronavirus pandemic (COVID-19): A review. Int. J. Surg. 78:185. doi: 10.1016/j.ijsu.2020.04.018
Nordey, T., Basset-Mens, C., De Bon, H., Martin, T., Déletré, E., Simon, S., et al. (2017). Protected cultivation of vegetable crops in sub-Saharan Africa: limits and prospects for smallholders. A review. Agron. Sustain. Dev. 37:53. doi: 10.1007/s13593-017-0460-8
Paul, N. D., and Gwynn-Jones, D. (2003). Ecological roles of solar UV radiation: towards an integrated approach. Trends Ecol. Evol. 18, 48–55. doi: 10.1016/S0169-5347(02)00014-9
Raviteja, K., and Supriya, M. (2020). “IoT-based agriculture monitoring system,” in Data Engineering and Communication Technology. Advances in Intelligent Systems and Computing, Vol. 1079, eds K. Raju, R. Senkerik, S. Lanka, and V. Rajagopal (Singapore: Springer), 473–483.
Raviv, M., and Antignus, Y. (2004). UV radiation. Photochem. Photobiol. 79, 219–226. doi: 10.1562/SI-03-14.1
Rayhana, R., Xiao, G., and Liu, Z. (2020). Internet of Things Empowered Smart Greenhouse. IEEE J. Radio Freq Identif. 4, 195–211. doi: 10.1109/JRFID.2020.2984391
Reddy, P. P. (2016). Sustainable Crop Protection Under Protected Cultivation. Singapore: Springer. doi: 10.1007/978-981-287-952-3
Research Wua (2021). Greenhouses. Available online at: https://www.wur.nl/en/Research-Results/Projects-and-programmes/Unifarm-1/Facilities/Greenhouses.htm (accessed October 11, 2021).
Robinson, J. (2018). World’s Largest Single-Domed Tropical Greenhouse is Coming to France. London: The Vinyl Factory Group.
Sahoo, P. P., and Rath, S. (2020). Potential impact of corona virus on agriculture sector. Biotica Res. Today 2, 64–65.
Saini, N., and Saha, S. (2021). Multi-objective optimization techniques: a survey of the state-of-the-art and applications. Eur. Phys. J. Spec Top. 230, 2319–2335. doi: 10.1140/epjs/s11734-021-00206-w
Shamshiri, R., Kalantari, F., Ting, K., Thorp, K. R., Hameed, I. A., Weltzien, C., et al. (2018). Advances in greenhouse automation and controlled environment agriculture: a transition to plant factories and urban agriculture. Int. J. Agric. Biol. Eng. 11, 1–22. doi: 10.25165/j.ijabe.20181101.3210
Srinivas, N., and Deb, K. (1994). Muiltiobjective optimization using nondominated sorting in genetic algorithms. Evol. Comput. 2, 221–248. doi: 10.1162/evco.1994.2.3.221
Stanghellini, C., and Montero, J. I. (2010). “Resource use efficiency in protected cultivation: towards the greenhouse with zero emissions,” in Proceedings of the XXVIII International Horticultural Congress on Science and Horticulture for People (IHC2010), Vol. 927, Lisbon, 91–100.
Sweeper (2020). Sweet Pepper Harvesting Robot. Available online at: http://www.sweeper-robot.eu/ (accessed February 13, 2021).
UBN (2021). UBN Smartfarm System. Available online at: http://farmlink.ubncorp.co.kr/eng/main.php (accessed December 10, 2021).
Uyeh, D. D., Mallipeddi, R., Pamulapati, T., Park, T., Kim, J., Woo, S., et al. (2018). Interactive livestock feed ration optimization using evolutionary algorithms. Comput. Electr. Agric. 155, 1–11. doi: 10.1016/j.compag.2018.08.031
Uyeh, D. D., Pamulapati, T., Mallipeddi, R., Park, T., Asem-Hiablie, S., Woo, S., et al. (2019a). Precision animal feed formulation: an evolutionary multi-objective approach. Animal Feed Sci Technol. 256, 114211. doi: 10.1016/j.anifeedsci.2019.114211
Uyeh, D. D., Ramlan, F. W., Mallipeddi, R., Park, T., Woo, S., Kim, J., et al. (2019b). Evolutionary greenhouse layout optimization for rapid and safe robot navigation. IEEE Access. 7, 88472–88480. doi: 10.1109/ACCESS.2019.2926566
Van Straten, G., van Willigenburg, G., van Henten, E., and van Ooteghem, R. (2010). Optimal Control of Greenhouse Cultivation. Boca Raton, FL: CRC press. doi: 10.1201/b10321
Wang, C., Horby, P. W., Hayden, F. G., and Gao, G. F. (2020). A novel coronavirus outbreak of global health concern. Lancet 395, 470–473. doi: 10.1016/S0140-6736(20)30185-9
Wells, C. R., Sah, P., Moghadas, S. M., Pandey, A., Shoukat, A., Wang, Y., et al. (2020). Impact of international travel and border control measures on the global spread of the novel 2019 coronavirus outbreak. Proc. Natl Acad. Sci. U.S.A. 117, 7504–7509. doi: 10.1073/pnas.2002616117
Wittwer, S. H., and Castilla, N. (1995). Protected cultivation of horticultural crops worldwide. HortTechnology 5, 6–23. doi: 10.21273/HORTTECH.5.1.6
Wu, Z., Wang, B., and Xia, X. (2016). Large-scale building energy efficiency retrofit: concept, model and control. Energy 109, 456–465. doi: 10.1016/j.energy.2016.04.124
Xu, P., and Chan, E. H. (2013). ANP model for sustainable building energy efficiency retrofit (BEER) using energy performance contracting (EPC) for hotel buildings in China. Habit. Int. 37, 104–112. doi: 10.1016/j.habitatint.2011.12.004
Xu, P., Chan, E. H., Visscher, H. J., Zhang, X., and Wu, Z. (2015). Sustainable building energy efficiency retrofit for hotel buildings using EPC mechanism in China: analytic network process (ANP) approach. J. Clean. Prod. 107, 378–388. doi: 10.1016/j.jclepro.2014.12.101
Xu, P., Chan, E. H.-W., and Qian, Q. K. (2011). Success factors of energy performance contracting (EPC) for sustainable building energy efficiency retrofit (BEER) of hotel buildings in China. Energy Policy 39, 7389–7398.
Keywords: decision making, greenhouse, non-dominated sorting genetic algorithm, plant factory, return on investment, resilient food systems
Citation: Uyeh DD, Mallipeddi R, Park T, Woo S and Ha Y (2022) Technological Advancements and Economics in Plant Production Systems: How to Retrofit? Front. Plant Sci. 13:929672. doi: 10.3389/fpls.2022.929672
Received: 27 April 2022; Accepted: 06 June 2022;
Published: 01 July 2022.
Edited by:
Yuxin Tong, Institute of Environment and Sustainable Development in Agriculture (CAAS), ChinaReviewed by:
Toyoki Kozai, Japan Plant Factory Association, JapanLixia Kang, Xi’an Jiaotong University, China
Copyright © 2022 Uyeh, Mallipeddi, Park, Woo and Ha. This is an open-access article distributed under the terms of the Creative Commons Attribution License (CC BY). The use, distribution or reproduction in other forums is permitted, provided the original author(s) and the copyright owner(s) are credited and that the original publication in this journal is cited, in accordance with accepted academic practice. No use, distribution or reproduction is permitted which does not comply with these terms.
*Correspondence: Yushin Ha, eXVzaGluNzJAa251LmFjLmty
 Daniel Dooyum Uyeh
 Rammohan Mallipeddi4
 Tusan Park