 Zhi-Qiang Chen1
 Yanjun Zan1
 Linghua Zhou1Bo Karlsson2
 Hannele Tuominen1Maria Rosario García-Gil1
 Harry X. Wu1,3*
- 1Department Forest Genetics and Plant Physiology, Umeå Plant Science Centre, Swedish University of Agricultural Sciences, Umeå, Sweden
- 2Skogforsk, Ekebo, Svalöv, Sweden
- 3The Commonwealth Scientific and Industrial Research Organisation (CSIRO) National Collection Research Australia, Black Mountain Laboratory, Canberra, ACT, Australia
Genetic control of tree growth and wood formation varies depending on the age of the tree and the time of the year. Single-locus, multi-locus, and multi-trait genome-wide association studies (GWAS) were conducted on 34 growth and wood property traits in 1,303 Norway spruce individuals using exome capture to cover ~130K single-nucleotide polymorphisms (SNPs). GWAS identified associations to the different wood traits in a total of 85 gene models, and several of these were validated in a progenitor population. A multi-locus GWAS model identified more SNPs associated with the studied traits than single-locus or multivariate models. Changes in tree age and annual season influenced the genetic architecture of growth and wood properties in unique ways, manifested by non-overlapping SNP loci. In addition to completely novel candidate genes, SNPs were located in genes previously associated with wood formation, such as cellulose synthases and a NAC transcription factor, but that have not been earlier linked to seasonal or age-dependent regulation of wood properties. Interestingly, SNPs associated with the width of the year rings were identified in homologs of Arabidopsis thaliana BARELY ANY MERISTEM 1 and rice BIG GRAIN 1, which have been previously shown to control cell division and biomass production. The results provide tools for future Norway spruce breeding and functional studies.
Introduction
Forest trees, particularly conifers, produce wood with distinct properties depending on their developmental stage (age) and the annual season (Li et al., 2011). At young ages, conifer trees typically produce so-called juvenile wood (JW) that has lower wood density and stiffness than mature wood (MW) formed at older ages (Zobel and Sprague, 1998). The seasonal variation, manifested by the formation of earlywood (EW), transition wood (TW), and latewood (LW), results in drastic changes in wood density, cell size, and cell wall thickness (Olsson et al., 1998; Park and Spiecker, 2005). Trees in the spring experience fast growth with new needles and little environmental stress except for short cold snaps, while trees in the autumn usually experience slow growth associated with drought and short days, with wood cells becoming smaller, but with thicker cell walls.
Conifer breeding has traditionally focused on growth traits (Wu et al., 2007; Isik and McKeand, 2019), resulting often in unfavorable effects on wood quality (Bouffier et al., 2008; Wu et al., 2008) due to the negative genetic correlations between growth rate and wood quality traits, such as wood density (Baltunis et al., 2007; Lenz et al., 2010; Chen et al., 2014; Hong et al., 2014; Hayatgheibi et al., 2017). During the last two decades, considerable efforts have been made to improve wood quality in several conifer species (Isik and Li, 2003; Chen et al., 2015). Genetic variation in wood properties has been quantified for many conifers (Wu et al., 2008), and new breeding strategies including both growth and wood properties have been developed (Wu and Sanchez, 2011; Hallingback et al., 2014). Examples of the novel breeding targets include acceleration of the transition from the JW to MW (Gapare et al., 2006; Hayatgheibi et al., 2018) and improved quality of JW using index selection (Ivković et al., 2010). However, breeding for these properties is hampered by the poor knowledge of the effect of tree age and seasonality on the genetic architecture of growth and wood properties in conifers.
Genome-wide association studies (GWAS) have contributed to substantial advances in human, animal, and plant genetic research (Goddard and Hayes, 2009; Visscher et al., 2017; Mills and Rahal, 2019). However, in conifers, the contribution of GWAS has been more limited due to their large genome size (~15–40 Gb) that challenges the development of a sufficient number of markers (Neale and Kremer, 2011) and the insufficient numbers (commonly <500 individuals) of trees genotyped (Hall et al., 2016; Chen et al., 2021). More recently, several reference genomes and transcriptome assemblies have been made available in tree species, such as Norway spruce (Picea abies L. Karst) (Nystedt et al., 2013), loblolly pine (Pinus taeda L.) (Neale et al., 2014), white spruce (Picea glauca) (Warren et al., 2015), and sugar pine (Pinus lambertiana Doug) (Stevens et al., 2016), which now allow GWAS based on exome capture (Vidalis et al., 2018), genotyping-by-sequencing (GBS) (Pan et al., 2015), SNP arrays from transcripts (Howe et al., 2020), and re-sequencing (Wang et al., 2018; De La Torre et al., 2019; Bernhardsson et al., 2021).
Norway spruce (Picea abies) is the most important commercial tree species in Northern Europe. GWAS has been conducted for several wood properties using 517 Norway spruce individuals (Baison et al., 2019, 2020). SNPs have been identified for the traits of wood density, stiffness, the number of cells, and cell wall thickness. However, the genetic architecture of wood traits measured at different seasons and ages has not been systematically investigated by GWAS for Norway spruce or any other forest tree species (Beaulieu et al., 2011). In this study, we implemented GWAS to study how tree age and seasonal variation influence the genetic architecture of growth and wood traits in 1,303 trees of Norway spruce. The accuracy of the GWAS analyses was the highest possible due to sufficient SNP coverage and the availability of improved genome annotation. The GWAS revealed genes that have earlier been implicated in the seasonal and developmental control of growth and wood properties but also novel genes that putatively shape the seasonal and developmental changes in wood formation. In addition, we examined whether multi-locus and multi-trait models could improve the statistical accuracy of GWAS.
Materials and methods
Plant materials
Two large progeny trials, locally called Höreda (57° 37′N and 15° 00′E) and Maltesholm (55° 53′N and 13° 55′E), were established in 1990 in southern Sweden, using 1,375 open-pollinated families (Chen et al., 2015). A randomized incomplete block design with single-tree plots was used in the two trials. Details on the field design, soil type, and climate condition can be found in Chen et al. (2014). A total of 1,303 wood samples, one tree per family, were taken in two different years from the Höreda trial. The first batch of 505 increment cores (12 mm) was sampled in 2010 as part of an earlier project (5,618 increment cores sampled from 524 open-pollinated families from both trials) (Chen et al., 2014). In 2015, we sampled the second batch of 798 wood disks cut at breast height from another 798 open-pollinated families. A diagram of the development of the plant materials, including the samples used for analyses and references to previous work using the same population, is shown in Supplementary Figure S1.
The mothers of these 1,303 open-pollinated families had been selected from forest stands in Sweden based on their outstanding phenotypic values (e.g., height, diameter, and branch quality) and grafted in two clonal common gardens (Zhou et al., 2019). The geographical origin of the mother trees covers the whole distribution range of Norway spruce, except northern Scandinavia (Figure 1A). We also sampled one increment core from each of the 476 mother trees.
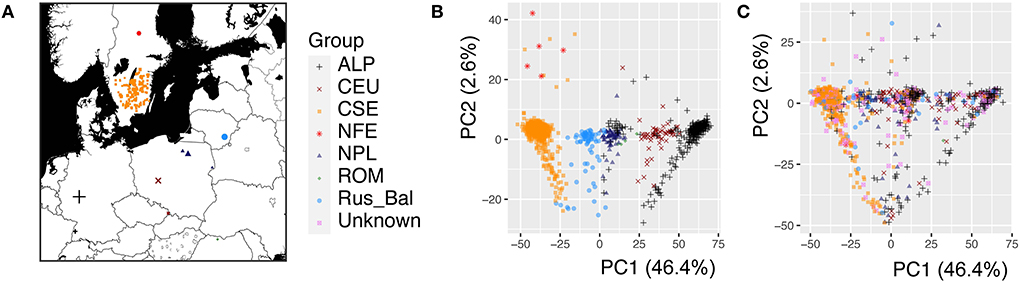
Figure 1. The geographic origin and population structure of the Picea abies trees used for the genome-wide association study. (A) Geographic distribution of the P. abies mother trees (1,080 mother trees genotyped), and the color and shape of the dots represent the genetic cluster indicated in the PCA analysis, (B) Population structure of the 1,080 mother trees visualized by the first two principal components (PCs), and (C) Population structure of the 1,303 progenies. A total of 1,080 mother trees cluster into seven genetic groups (Chen et al., 2021), but the genetic group is unknown for 223 mother trees. The PCA analysis was performed by combining the parental and progeny datasets. The different genetic clusters were marked (Carpathian including Romania, forest green, ROM; Alpine, black, ALP; Central Europe, dark red, CEU; Northern Poland, midnight blue, NPL; Russia-Baltic, dodgerblue, Rus-Bal; central and southern Sweden, dark orange, CSE; Fennoscandia, red, NFE; Unknown in violet represents unknown progenies).
Phenotyping
In this study, we phenotyped the second batch of 798 woody disks for wood traits using the SilviScan technology (Lundqvist and Evans, 2004) which combines X-ray, microscopy, and image analysis at RISE (https://www.ri.se/en, Stockholm, Sweden). The annual ring width, number of cells, radial and tangential tracheid width, and cell-wall thickness were recorded from microscopy images and image analysis from the pith to the bark for consecutive radial intervals of 25 μm. Wood density (WD) was measured by X-ray absorption at a sampling interval of 25 μm and microfibril angle (MFA) by X-ray diffraction at a sampling interval of 5 mm as previously described (Lundqvist and Evans, 2004). Wood coarseness, number of cells, and wood stiffness expressed as modulus of elasticity (MOE) were predicted based on SilviScan measured traits (Supplementary Methods S1). We combined SilviScan data from the two batches of woods (n = 1,303) for our GWAS analysis. The SilviScan data of 476 mother trees were used for candidate SNP validation (Zhou et al., 2019).
Juvenile wood (JW), mature wood (MW), and whole core wood (WCW)
The JW and MW were demarcated according to the age curve of MFA for Norway spruce (Hayatgheibi et al., 2018). It was observed that MFA was high (above 20°) until age five, but decreased after that and stabilized at around age 10 (ca. 10°). The distribution of the number of annual rings per sample for our GWAS population is shown in Supplementary Figure S2. In both datasets (n = 798 and n = 505), we defined the annual rings 1–5 from pith as the JW and the rings 11–15 from pith as the MW. We also defined the wood from the annual ring 1 to ring 15 as the whole core wood (WCW) (Figures 2A,B). In this way, the phenotypic traits from annual rings of the same age were analyzed for GWAS in the two different batches of trees. A total of 34 traits, obtained from each of the JW, MW, and WCW, are shown in Table 1.
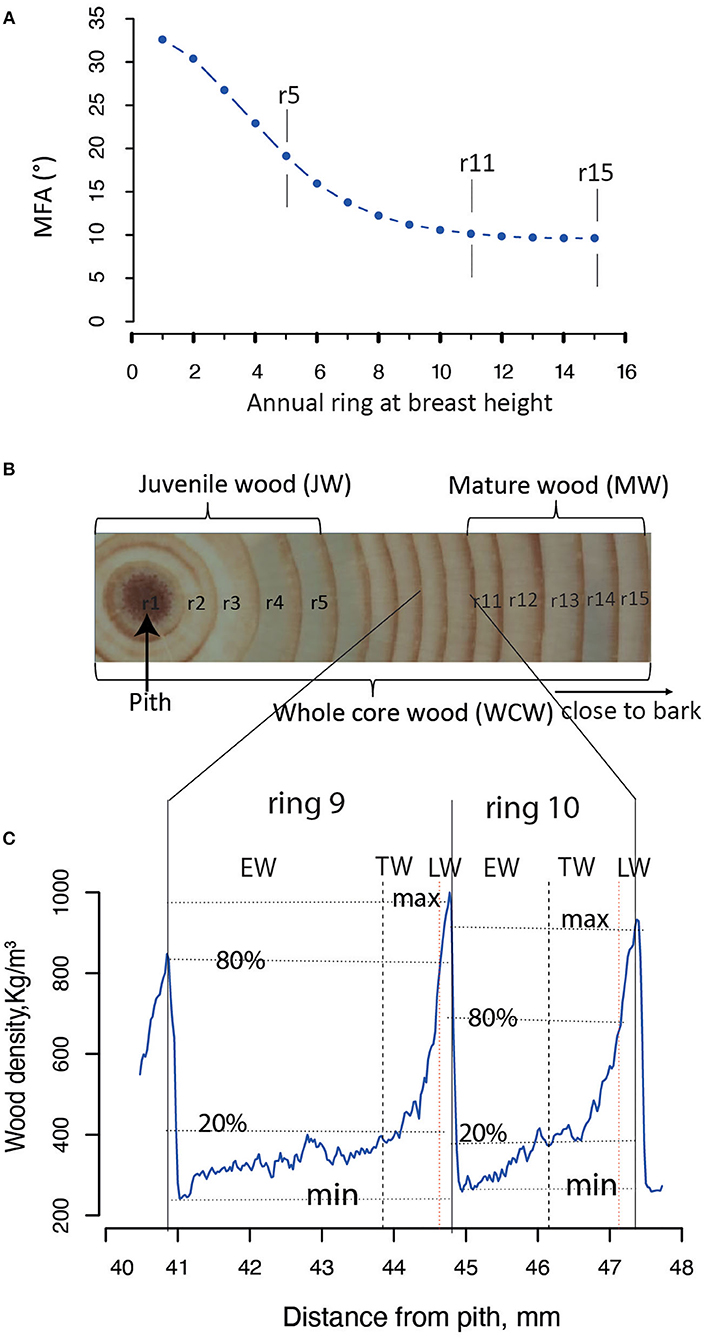
Figure 2. Definition of different wood sections in Picea abies. (A) The mean microfibril angle (MFA) for each annual ring at the breast height (1.3 m). All the SilviScan samples from Höreda trial were used to estimate the year ring mean value for MFA. (B) The juvenile wood (JW) and mature wood (MW) were defined based on a previous study (Hayatgheibi et al., 2018); JW: rings 1–5, MW: rings 11–15. The whole core wood (WCW) was defined as year rings from pith to bark (rings 1–15). (C) Each annual ring wood (ARW, e.g., rings 9 and 10) was demarcated into earlywood (EW), transition wood (TW), and latewood (LW), based on a “20–80” wood density threshold definition according to the previously published paper (Lundqvist et al., 2018).
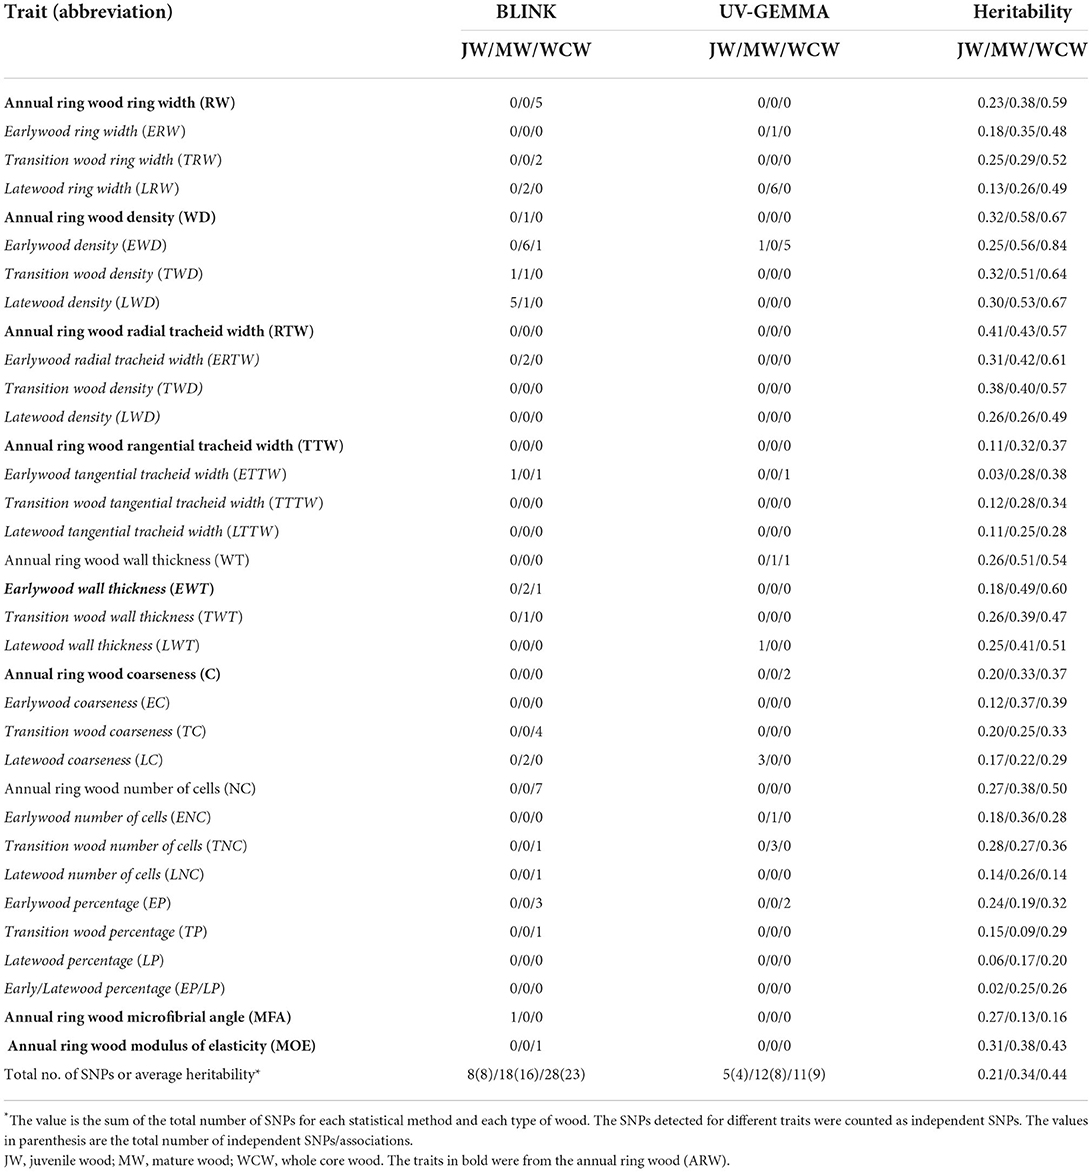
Table 1. List of the measured traits, their abbreviations, the number of independent SNPs detected, and the pedigree-based narrow-sense heritability for three wood types (JW/MW/WCW) based on 524 half-sib families.
Earlywood (EW), transition wood (TW), and latewood (LW)
The annual ring wood (ARW) was divided into EW, TW, and LW based on WD within the ring of each year (Figure 2C). Ring area with WD <20%, between 20 and 80%, and more than 80% of the maximum WD was defined as EW, TW, and LW, respectively (Lundqvist et al., 2018).
Genotypic data
DNA extraction, sequence capture, and SNP calling
Buds and needles were collected from 1,303 progenies and 476 mother trees. Thereafter, total genomic DNA was extracted using the Qiagen Plant DNA extraction protocol with DNA quantification performed using the Qubit® ds DNA Broad Range Assay Kit (Qiagen, Oregon, USA). Exome sequence capture was performed using the 40,018 probes previously designed and evaluated for these materials (Vidalis et al., 2018), and the samples were sequenced to an average depth of 15x in an Illumina HiSeq 2500 platform. The probes were designed to be located inside a coding region. Raw reads based on 2 × 100 bp sequencing mode were mapped to the P. abies reference genome v1.0 using BWA-mem (Langmead and Salzberg, 2012). The details of the SNP calling are found in Supplementary Methods S2.
Quality control of called SNPs
Several steps of quality control, such as removing indels and sites with call rates < 70%, were performed using VCFtools (Danecek et al., 2011) (Supplementary Methods S3). After these filtering steps, a total of ~300K SNPs with minor allele frequency (MAF) >0.005 were left for population structure analysis. Beagle v4.1 was used to impute the missing genotypes. The mean accuracy of the imputed genotypes was 0.97 at both individual and SNP levels based on a full dataset [ca. 8,000 individuals including the dataset published in Chen et al. (2021)].
Statistical analysis
Adjusting phenotypic values
Tree height and diameter at breast height (DBH) were measured for all the trees (n = 12,844) in the Höreda trial. The wood quality traits were only measured for one to a few individuals per family. Since a strong spatial effect was earlier observed in this trial (Chen et al., 2017), multivariate linear mixed models were employed to adjust for the environmental effects (Supplementary Methods S4).
Estimation of the variance components
Variance components were estimated by fitting a univariate linear mixed model for the 1,303 unrelated progeny trees
where y is the vector of adjusted phenotypic trait, β is the vector of fixed effect including an intercept as the grand mean, and a is the vector of random additive effects, following . G is the genomic-based relationship matrix (GRM) estimated based on the method “VanRaden” (VanRaden, 2008) using AGHmatix package in R (Amadeu et al., 2016). is the additive variance. X and Z are the related design matrices of β and a, and e is the vector of residuals. All analyses were done using ASReml R v4.0.
To compare pedigree-based narrow-sense heritability with SNP-based narrow-sense heritability, we performed a pedigree-based model fitting using SilviScan data from 5,618 increment cores of the 524 half-sib families from the two sites in Horeda and Maltesholm, as described and used in the previous paper (Chen et al., 2014). Equations of estimating the pedigree-based narrow-sense heritability and SNP-based narrow-sense heritability are shown in Supplementary Methods S5.
Population structure
The population structure of the mother trees has been described for a much larger population in a previous study (Chen et al., 2021). Here, the population structure of the mothers and the progenies was visualized by principal component analysis (PCA) using the prcomp function in R v3.6.1.
SNP-trait association
We performed GWAS by three methods. The first method was BLINK which conducts two fixed-effect models and one filtering process (Huang et al., 2019). The details of the method are given in Supplementary Methods S6. The second method was univariate GWAS (UV-GEMMA), which was performed using genome-wide efficient mixed-model analysis (GEMMA). The third method was multivariate GWAS (MV-GEMMA), which was also performed using GEMMA (Zhou and Stephens, 2014). After filtering locus with MAF < 0.03, 131,131 SNPs were used in GWAS. Univariate GWAS was run for the 34 traits from each developmental stage of wood formation (Table 1). The UV-GEMMA from GEMMA was as follows:
where y is the vector of adjusted phenotypic values, α is a vector of corresponding fixed effects including the intercept and the principal components/admixture Q matrix if it is fitted, β is a vector of the marker effects, u is a vector of the polygenetic additive effects, and ϵ is a vector of residuals. W , X , and Z are the related design matrices. Population structure was considered if the genomic inflation factor (IF), which expresses the deviation of the distribution of the observed test statistic compared to the distribution of the expected test statistic, is not within 1 ± 0.05 (Yang et al., 2011). However, because the values of IF were all within 1 ± 0.05 (Supplementary Figure S3), the population structure in Equation (2) was excluded in the later analysis. The details of the MV-GEMMA model are provided in Supplementary Methods S7. The percentage of variation explained (PVE) by each SNP was estimated using the formula in Shim et al. (2015). The cumulative PVE of all candidate SNPs for each trait was estimated using a genomic prediction model within all candidate SNPs for each trait as fixed effects (Supplementary Methods S8).
Trait selection for GEMMA multivariate GWAS
Multivariate sets of traits were created based on phenotypic or genetic correlations among the phenotypes, and structural and functional relationships of the traits (Chen et al., 2014, 2016). A moderate phenotypic and/or genetic correlation could be important for fitting multivariate GWAS (Stephens, 2013). Therefore, to obtain interesting multivariate sets, we estimated pairwise phenotypic correlations. Finally, 21 multivariate sets (Table 2) for each type of wood (JW, MW, and WCW) were selected as traits for multivariate GWAS. Based on phenotypic correlation and different selection criteria, we separated these multivariate sets into three types: (a) multivariate set based on the same trait along with seasonal change, such as ring width of earlywood (ERW), transition wood (TRW), latewood (LRW), and annual wood ring wood (ARW), named as RW(ARW_EW_TW_LW); (b) multivariate set based on the phenotypic correlation among traits from ARW, e.g., ring width, WD, coarseness, and number of cells, named as ARW(RW_WD_C_NC); and (c) multivariate set based on the mathematical relationship among traits from ARW, such as modulus of elasticity = WD × MFA, called ARW(MOE_WD_MFA).
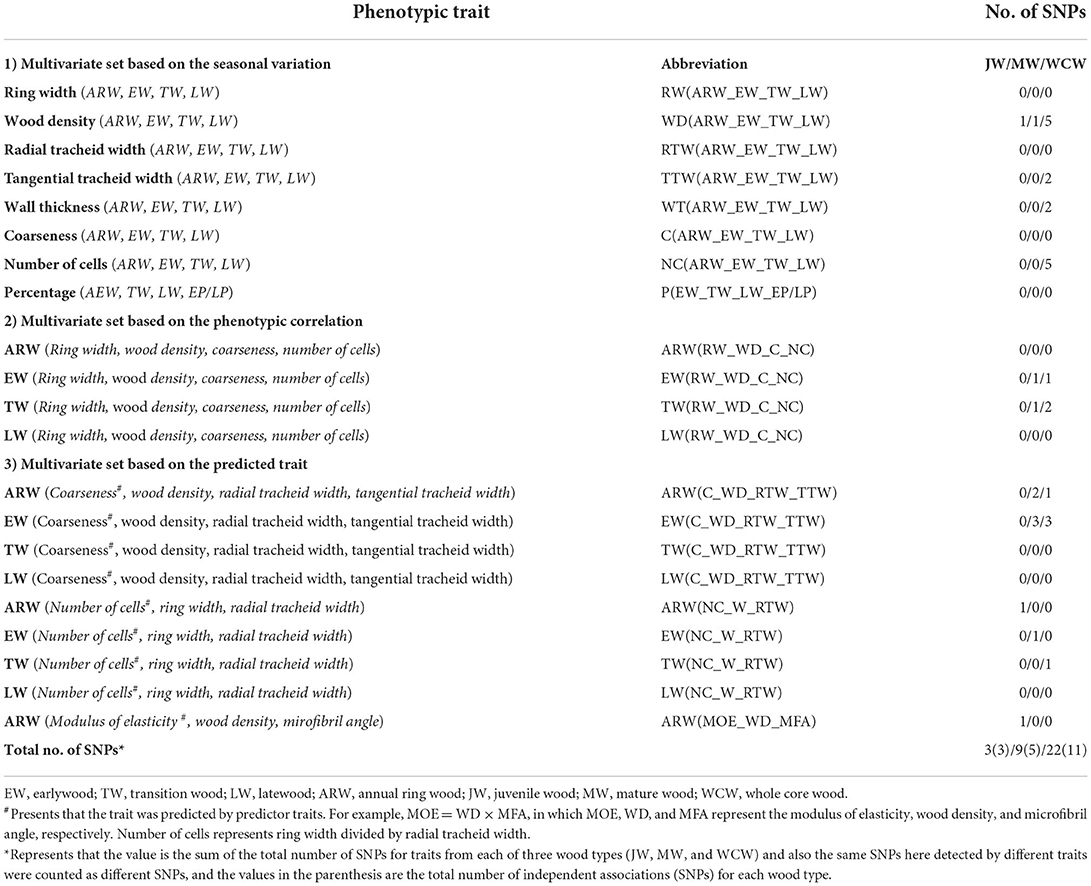
Table 2. List of 21 multivariate sets used for multivariate GEMMA (MV-GEMMA), their abbreviations, and the number of independent SNPs detected using MV-GEMMA.
Spatial and temporal expression pattern of the associated candidate genes
Data for the spatial and seasonal expression patterns of the identified candidate genes were retrieved from previously published RNA-seq analyses in Norway spruce (Jokipii-Lukkari et al., 2017, 2018), downloaded from plantgenie.org. The heatmaps are visualized by the pheatmap function in the pheatmap R package (Kolde and Kolde, 2015).
Validation of the GWAS signals using parental population
Finally, we performed validation tests using a randomly selected part (n = 476) of the 1,303 mother trees. A mixed linear model (MLM) with a genomic-based relationship matrix (GRM) was used to test whether an SNP was associated with a trait (Supplementary Methods S9) (Zan and Carlborg, 2018).
Variant annotation for significant associations
Significantly associated SNPs at a 5% false discovery rate (FDR) were annotated using SnpEff 4.3 with default parameters (Cingolani et al., 2012). The general transfer format (GTF) from Ensembl was utilized to build the P. abies SnpEff database. To summarize the results, significant SNPs within a gene model were merged and counted as a single significant locus. To assess the variant effect of the associated SNPs, annotation of the putative genes, genome ontology (GO), and their associated Arabidopsis and Populus orthologs were performed using the P. abies v1.0 genome on ConGenIE database (Sundell et al., 2015). All genes within a contig harboring the associated SNPs were extracted from ConGenIE. Due to the repetitive nature of conifer genomes (Niu et al., 2022), the candidate genes located in the same contig harboring an associated SNP and annotated with a similar biological function were also extracted in this study.
Results
In this study, 1,303 Norway spruce progenies were analyzed for growth and wood properties to investigate the effect of tree age and seasonal cycle on the underlying genetic architecture. A large amount of variation in these properties was expected due to the rather wide geographic distribution of the mother trees (Figure 1A). In a previous study (Chen et al., 2021), the mother trees of these progenies were clustered into seven genetic groups (Figure 1B). The clustering of the progenies that were obtained by open pollination was slightly different from that of the mother trees (Figure 1C). These results suggest that population structure is very important in F1 generation/progeny and should be fitted in Norway spruce traditional genetic analysis, genomic selection, and GWAS.
Estimates of heritabilities for tree growth and wood properties
We estimated both pedigree- and SNP-based narrow-sense heritabilities of 34 traits for each developmental stage of wood formation (Supplementary Table S1). Overall, SNP-based heritabilities were much lower than the pedigree-based heritabilities, except for tangential tracheid width (TTW) from JW. As we expected, SNP-based heritability (based on a single tree per family) had a larger standard error than that of pedigree-based heritability (based on 12 trees per family). Thus, we focused only on the results from the pedigree-based heritability in the following sections (Table 1). On average, traits from JW had significantly lower heritability (0.21 ± 0.02) than those obtained from the MW (0.34 ± 0.02) and WCW (0.44 ± 0.03) (Figure 3A). Traits from EW, TW, and ARW had higher average heritability than those obtained from LW in JW, MW, and WCW (Figure 3B) and in all three kinds of wood (Figure 3C), but the difference was non-significant. In general, the traits related to wood density (WD) showed higher heritabilities than most other traits (Table 1). Taken together, the range of heritabilities suggests that the environment shapes the wood traits more in the JW than in the MW or WCW, and more in the LW than in the EW, TW, or ARW.
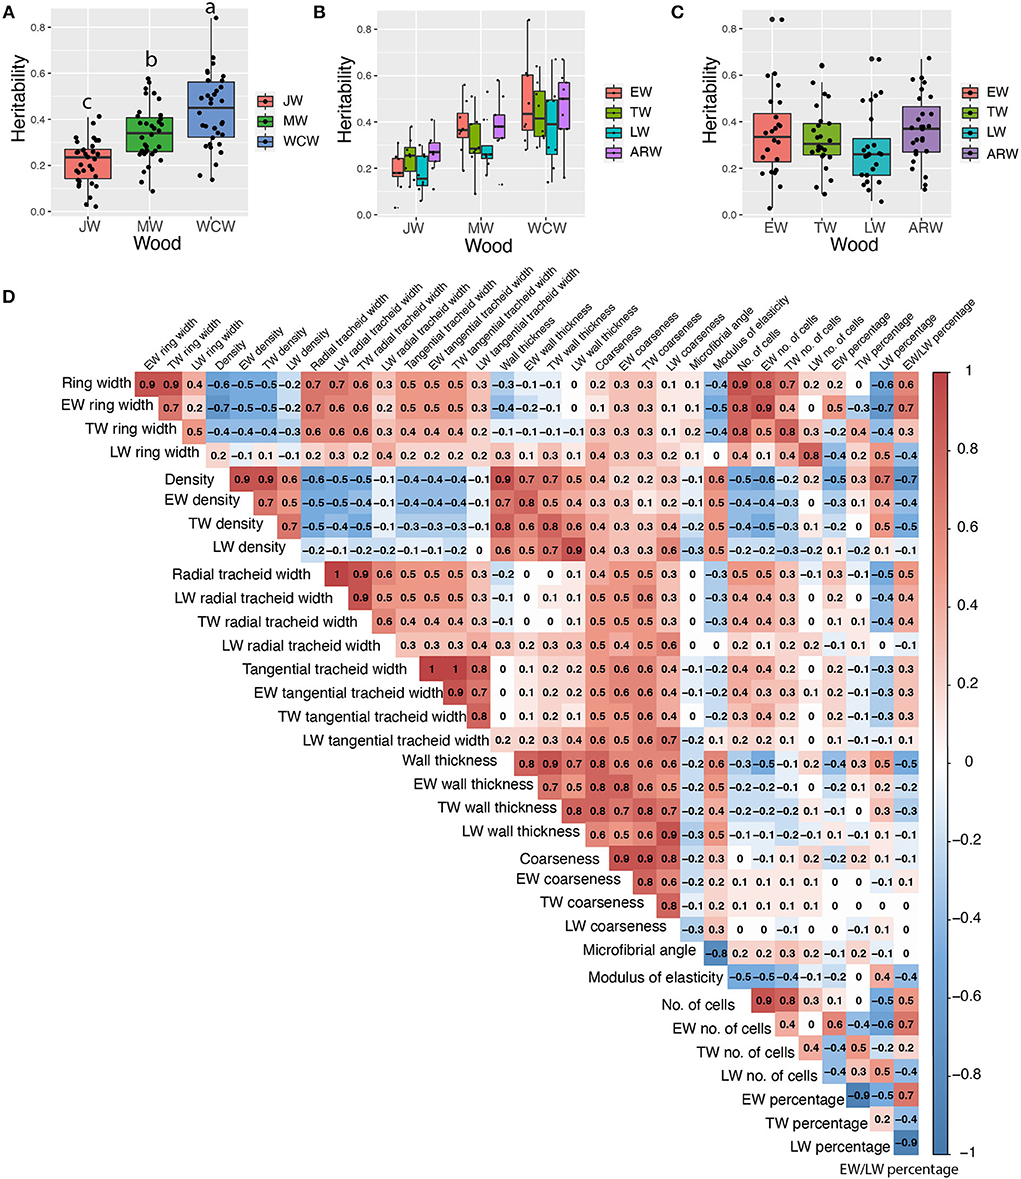
Figure 3. Estimated narrow-sense heritabilities of growth and wood quality traits and pairwise Pearson phenotypic correlations among all wood traits from the whole core wood (WCW). (A) Boxplots of pedigree-based narrow-sense heritabilities of 34 traits from juvenile (JW), mature (MW), and WCW using 505 half-sib families. (B) Boxplots of pedigree-based heritabilities of 34 traits from earlywood (EW), transition wood (TW), latewood (LW), and annual ring wood (ARW) using 505 half-sib families. (C) Boxplots of pedigree-based heritabilities for growth and wood quality traits produced at different seasons in JW, MW, and WCW using 505 half-sib families. (D) Pairwise Pearson phenotypic correlations among all wood traits from the whole core wood (WCW). The color spectrum indicates highly positive (red) to highly negative (blue) correlations, and the number indicates the correlation values. The blank indicates a lack of significant correlation (P > 0.01). In (A), the different letters between mean heritabilities in JW, MW, and WCW represent significant differences (P > 0.01).
Phenotypic correlation between traits
Phenotypic correlations were analyzed between all the measured traits in the whole wood (whole core wood, WCW) (Figure 3D) by Pearson pairwise correlation analysis. As expected, growth-related traits, such as ring width, number of cells, and tracheid number, correlated positively with each other. Wood density (WD) also showed an expected positive correlation with cell wall thickness and a negative correlation with the ring width. Similar correlations were observed in JW (Supplementary Figure S4) and MW (Supplementary Figure S5). The seasonal effect was represented by the earlywood/latewood ratio that correlated positively with the ring width but negatively with wood density and cell wall thickness (Figure 3D).
Genetic association analyses can be done for either single traits or simultaneously for multiple traits. As several of the traits analyzed here had moderate to high correlations with each other (Figure 3D), multivariate sets of traits were identified that could be utilized in our genetic studies. For each developmental stage (JW, MW, and WCW), 21 sets of traits (Table 2) were identified based on moderate to high phenotypic correlations (Figure 3D). In group 1, eight multivariate sets were selected based on a high positive pairwise correlation of traits within EW, TW, and LW. In group 2, four multivariate sets were selected based on a moderate phenotypic correlation between traits within the same seasonal and developmental stage of the wood within the rings (for instance, all traits from EW of JW). In group 3, each set was selected from the SilviScan data for a predicted trait and its predictor traits within the same part of the wood (Table 2). These predicted traits, including coarseness, number of cells, and modulus of elasticity (MOE), also showed moderate to high phenotypic correlations with the predictor traits (Figure 3D).
Genome-wide association between growth and wood traits
We conducted GWAS using univariate BLINK and GEMMA (UV-GEMMA) for 34 traits and multivariate GEMMA (MV-GEMMA) for 21 multivariate sets from each of JW, MW, and WCW. We found that all the associated SNPs within a contig were in strong LD (r2 > 0.2, Supplementary Table S2). Thus, we considered the SNPs that occurred within the same genomic contig as one independent association. We also considered the SNPs simultaneously detected by two or more traits as one independent association. In total, we identified 74 independent SNPs that were significantly associated with 63 of the altogether 102 traits after multiple testing corrections with the FDR-adjusted p < 0.05 (Supplementary Tables S2, S3, and Table 1). These SNPs were located within 74 gene models (Supplementary Table S4). In addition, there were another 11 gene models located nearby these SNPs (±20 kb) within the same contigs, amounting to a total of 85 gene models derived from the GWAS analysis (Supplementary Table S4). A subset of the important genes based on possible biological meaning is presented in Table 3. The proportion of phenotypic variance explained (PVE) by each candidate SNP ranged from ca. 0 to 4.23%. Cumulative PVEs of all candidate SNPs for each trait ranged from 0 to 9.8% (Supplementary Table S5). We also tested the associated SNPs in a subset of the mother population (n = 476) and found that nine independent SNPs were significantly associated with the respective traits also in this population (P < 0.05) (Supplementary Table S6).
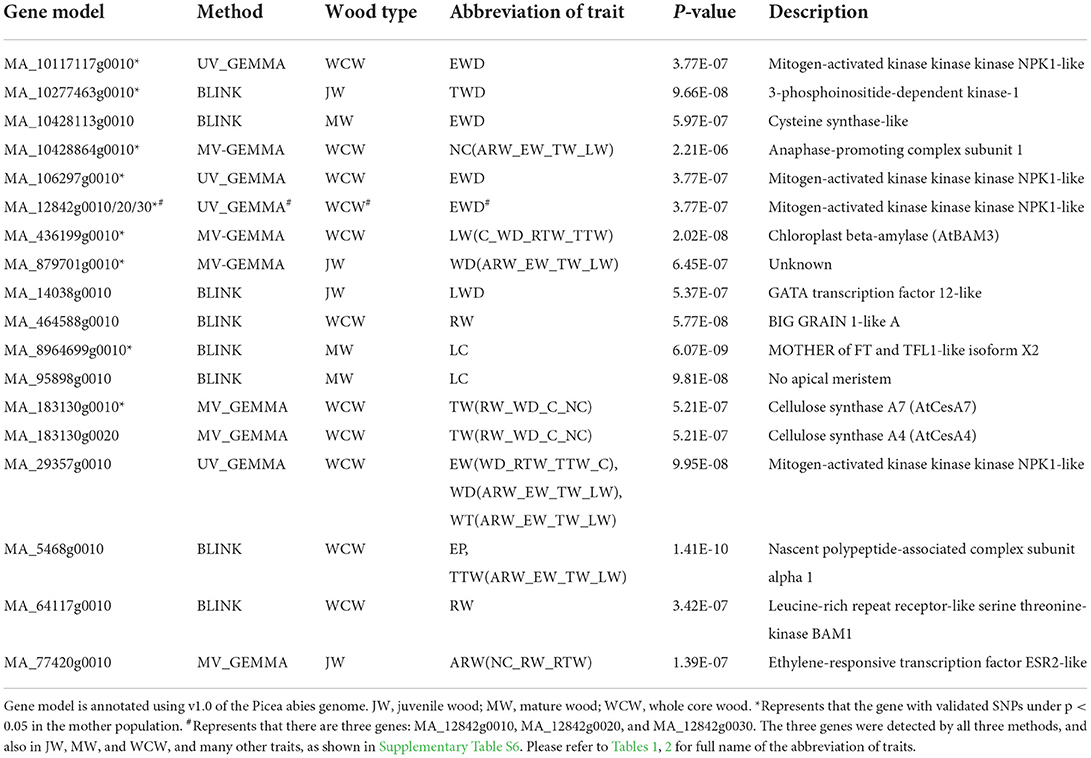
Table 3. A selection of genes with significant SNPs associated with different traits in juvenile, mature, and whole core wood in the three different types of GWAS analyses.
The effect of tree age on the genetic architecture of growth and wood properties
Tree aging is concomitant with the transition from JW to MW formation. We found in the current population that JW was formed typically until the annual ring 5 at breast height and MW after the annual ring 10 (Figure 2). To estimate the effect of these developmental changes on the genetic architecture of growth and wood properties, we surveyed the SNPs identified by GWAS for traits in JW, MW, and WCW (Figure 4A). Among them, only one SNP from contig MA_12842 was shared by the different age classes. These results suggest that the genetic architecture of the wood traits is largely dependent on the age of the trees.
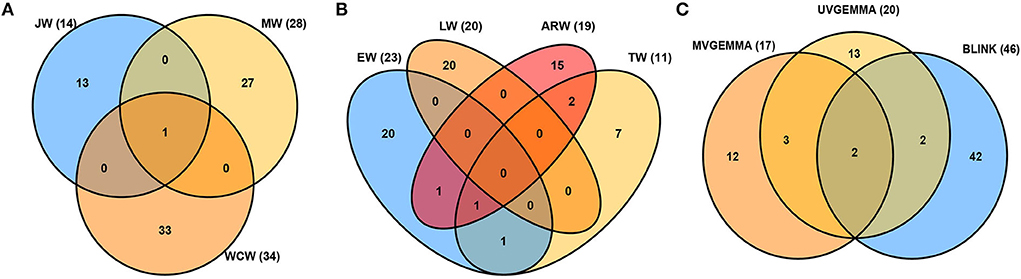
Figure 4. Venn diagrams of associated single-nucleotide polymorphisms (SNPs) detected for all traits. (A) Juvenile wood (JW), mature wood (MW), and whole core wood (WCW). (B) Earlywood (EW), transition wood (TW), latewood (LW), and annual ring wood (ARW). (C) Comparison of the univariate GEMMA (UV-GEMMA), multivariate GEMMA (MV-GEMMA), and univariate BLINK (BLINK) GWAS methods. The value inside the parenthesis is the number of associated SNPs.
As an example of an association specific to JW, an SNP in the gene model MA_77420g0010, encoding a putative member of the ethylene response factor family, was associated with the multi-traits composed of the number of cells, ring width, and tangential ring width (Table 3). The homologous Arabidopsis thaliana gene AT1G24590 controls organogenesis and is also linked to provasculature development (Glowa et al., 2021). An SNP in another gene model MA_14038g0010, encoding a member of the GATA transcription factor family, was associated with latewood density in JW (Table 3).
In MW, an SNP in MA_95898g0010 was associated with LW coarseness (LC). MA_95898g0010 is a member of the NAC transcription factor family. The expression of MA_95898g0010 varies according to different developmental zones (Figure 5A) and the season (Figure 5B) and is strictly coregulated with secondary cell wall CesAs in Norway spruce wood (Jokipii-Lukkari et al., 2017). Another interesting SNP was located in the gene model MA_8964699g0010, which, similar to the SNP in MA_95898g0010, was associated with the LW coarseness in MW. MA_8964699g0010 is annotated in Norway spruce as MOTHER OF FT AND TFL1-like and validated in the mother population (Table 3).
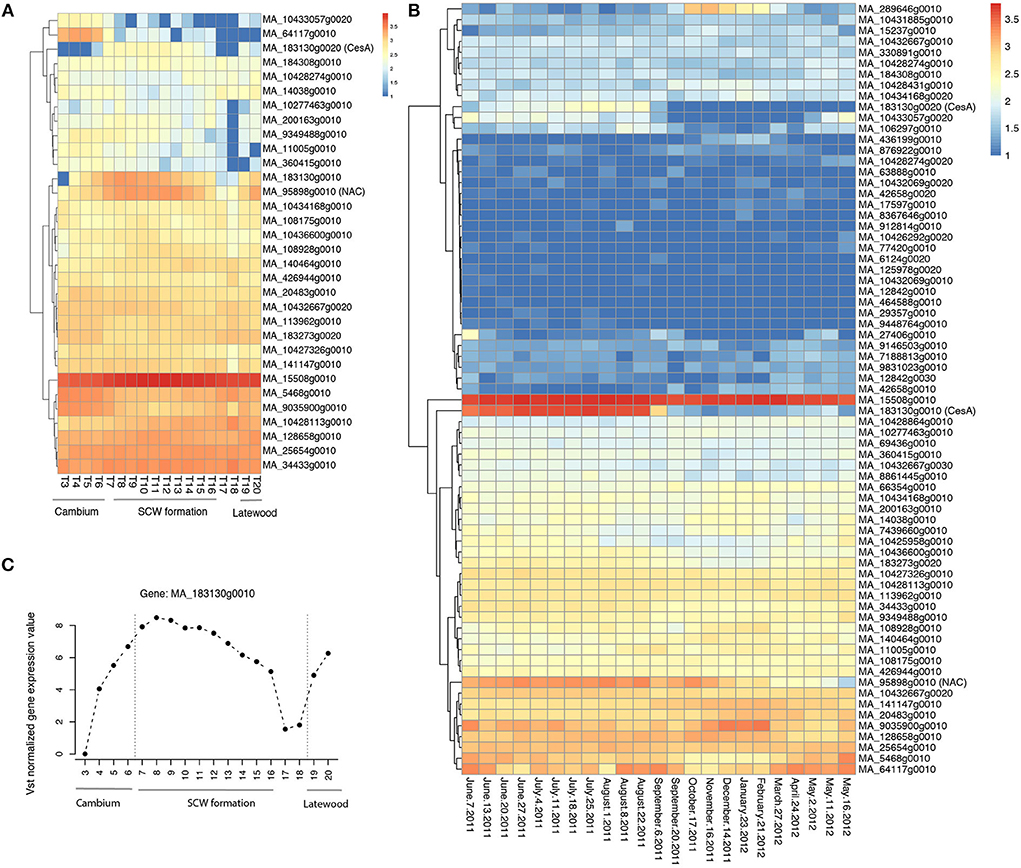
Figure 5. Spatial and temporal expression pattern of the identified candidate genes in Norway spruce. (A) Heatmap of RNA-seq data from the different wood developmental zones of Norway spruce stem (tree 1; Jokipii-Lukkari et al., 2017); (B) Heatmap of RNA-seq data in a whole seasonal cycle for the xylem of Norway spruce; (C) The expression of the candidate gene MA_183130g0010 in Norway spruce (tree 1; Jokipii-Lukkari et al., 2017). Vst means variance-stabilizing transformation. The data used in (A–C) can be downloaded from the website (https://plantgenie.org). SCW is the secondary cell wall.
When considering the whole core wood (WCW), associations were found between ring width and SNPs in two gene models that on the basis of the functional characterization of the Arabidopsis thaliana (hereafter “Arabidopsis”) homologs putatively promote growth or biomass production. MA_64117g0010 encodes a homolog of Arabidopsis BARELY ANY MERISTEM 1 (BAM1), which is a CLAVATA1-related receptor kinase-like protein required for formative cell divisions and xylem patterning in the root (Crook et al., 2020; Fan et al., 2021). MA_464588g0010, on the other hand, encodes a homolog of rice BIG GRAIN 1, which stimulated biomass accumulation when overexpressed in rice (Liu et al., 2015). These two genes could possibly act to control cell divisions and biomass production from the vascular cambium, which is supported for MA_64117g0010 by its specific expression pattern in the vascular cambium of Norway spruce stem (Figure 5A; see also the Norwood data in https://plantgenie.org; Jokipii-Lukkari et al., 2017).
The effect of the annual season on the genetic architecture of growth and wood properties
The seasonality of cambial growth is manifested by the transition from EW to LW formation along with the shortening of the day length. GWAS detected a total of 23, 11, 20, and 19 SNPs associated with the traits of EW, TW, LW, and ARW, respectively (Figure 4B). There were no common SNPs between EW and LW, showing contrasting genetic architecture of growth and wood properties not only in response to tree age but also to the seasonal changes.
In EW, GWAS detected two candidate genes (MA_10117117g0010 and MA_29357g0010, annotated as mitogen-activated protein kinase kinase kinase, MAP3K) that were associated with earlywood density and also validated in the mother population (Table 3 and Supplementary Table S6). Three other MAP3Ks (MA_12842g0010, MA_12842g0020, and MA_12842g0030) were also identified in the GWAS analysis. They were associated with several traits, including ring width and WD, and were also validated in the mother population (Table 3 and Supplementary Table S6). All these MAP3K gene models correspond to the Arabidopsis gene AT5G55090 which has been linked to drought resistance (Pieczynski et al., 2018). Increased expression of MA_12842g0030 was observed in early spring and July throughout the season in the woody tissues (Figure 5B), as well as in buds between the early bud stage and late bud stage, of Norway spruce (Chen et al., 2021).
In TW, it was interesting to identify SNPs in a secondary cell wall cellulose synthase (CesA) gene model MA_183130g0010 that associated with a multivariate set of traits (ring width, WD, coarseness, and number of cells) (Table 3; Supplementary Table S7). Also, enhanced expression of MA_183130g0010 was found during the formation of the secondary cell wall (Figure 5A) in the growing season and less in autumn and winter seasons (Figures 5B,C; Jokipii-Lukkari et al., 2018), which together with the GWAS data suggests that transition from earlywood to latewood is associated with increased activity of cellulose synthesis mediated by changes in the expression of these CesAs.
In LW, SNPs were identified in the earlier mentioned MOTHER OF FT AND TFL1-like gene (MA_8964699g0010) in association with LW coarseness in MW (Table 3; Supplementary Table S7). Interestingly, this gene belongs to the same gene family as the TERMINAL FLOWER genes TFL1 and TFL2 that have been linked earlier to seasonality in Norway spruce (Klintenäs et al., 2012; Karlgren et al., 2013). A latewood multi-trait LW(C_WD_RTW_TTW) was associated with an SNP in a β-amylase (MA_436199g0010 in Table 3; Supplementary Table S7), which is homologous to an Arabidopsis BAM3 with a proposed function in cold response (Monroe et al., 2014).
Comparison of results detected by three GWAS methods
The GWAS method BLINK detected higher number (46) of independent SNPs as compared to UV-GEMMA (20) and MV-GEMMA (17) (Figure 4C). To facilitate the presentation of characters of association with the three statistical methods, we divided the association results into the following three categories. First, adjusted p-values of a few SNPs in the MV-GEMMA and BLINK models became significant (i.e., FDR-adjusted p-value of the few SNPs became < 0.05) compared with being non-significant in the univariate UV-GEMMA model (e.g., Figures 6A–C). For example, MV-GEMMA increased the significance level to detect SNP MA_183130_3773 (Figure 6A, dot with blue circle), but with a different contig position than UV-GEMMA and BLINK (Figure 6B). Second, adjusted p-values of a few SNPs became significant only in BLINK when compared with UV-GEMMA and MV-GEMMA (e.g., Figures 6D–F). Third, the number of associated and independent SNPs in all three methods were the same (e.g., Supplementary Figures S6A–C). QQ plots (Supplementary Figures S7, S8) matching the Manhattan plots in Figure 6 showed a clear improvement in detecting the number of significant SNPs using MV-GEMMA and/or BLINK compared with the UV-GEMMA. QQ plots in Supplementary Figure S9 matching the Manhattan plots for all methods in Supplementary Figure S6 were similar due to an equivalent ability to detect the same number of independent SNPs among the three methods (Supplementary Figure S6).
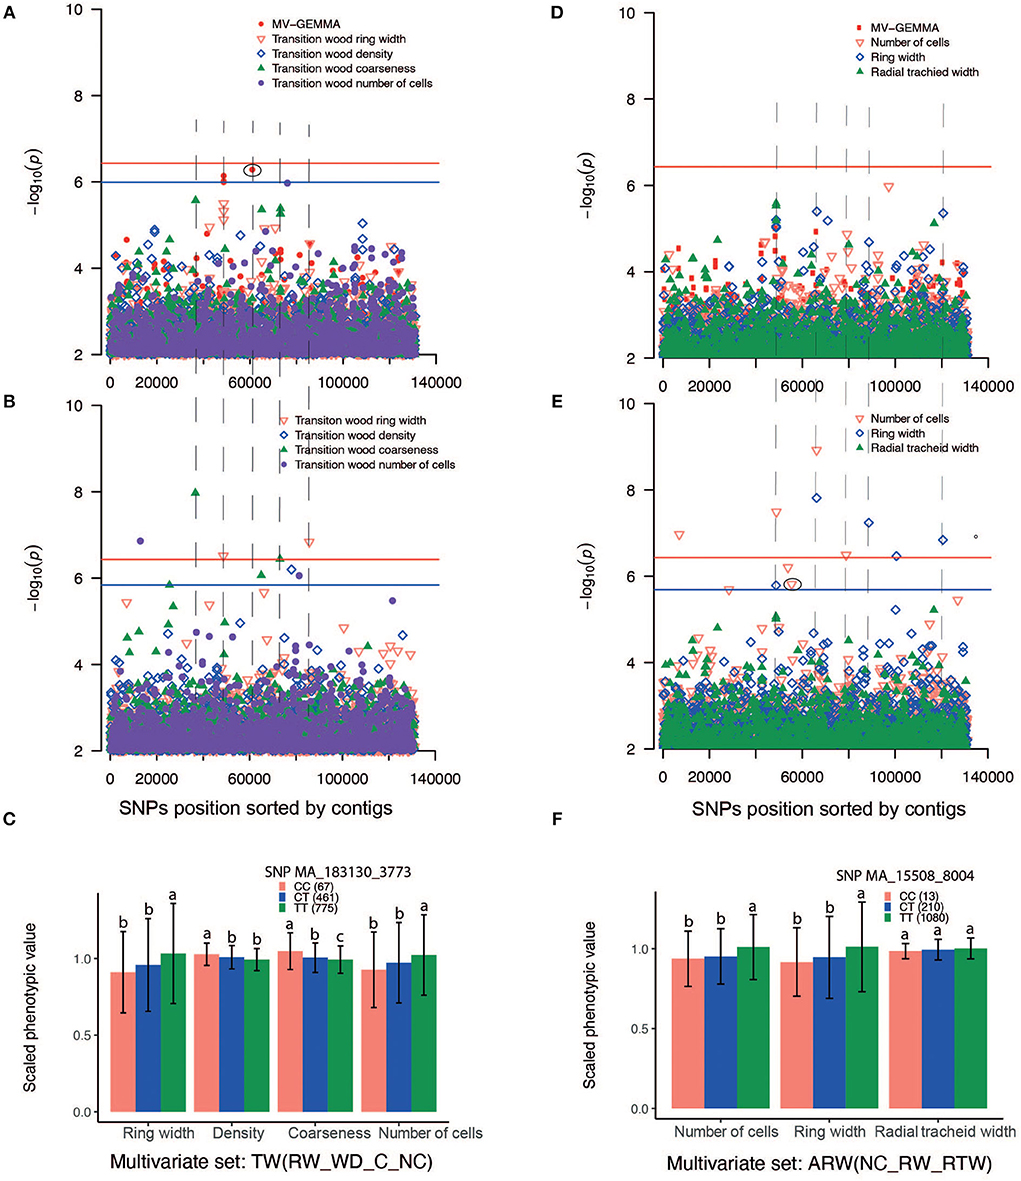
Figure 6. Manhattan plots comparing GEMMA univariate (UV-GEMMA), multivariate (MV-GEMMA), and BLINK GWAS for wood traits measured in Picea abies. P-values are converted to –log10 (P-value). Single-nucleotide polymorphisms (SNPs) above the red lines passed the Bonferroni correction test (P < 3.7 × 10⁻⁷). SNPs above the blue line passed false discovery rate (FDR) (P < 0.05) for the multivariate set in (A), transition wood of coarseness in (B), and the number of cells in (E) (blue line was only shown for the interesting traits and there is SNP passing FDR P < 0.05). Only SNPs with P < 1 × 10⁻² are plotted. (A) Manhattan plot based on multivariate (MV-GEMMA) and univariate (UV-GEMMA) analysis of four traits in the transition wood [ring width, wood density, coarseness, and the number of cells, labeled as TW(RW_WD_C_NC)]. (B) Manhattan plot based on univariate model BLINK only for the same four traits in the transition wood. (C) Allelic effects of SNP MA_183130_3773 on the four traits in the transition wood. CC, CT, and TT are genotypes of the associated SNP. The number in parenthesis is the number of individuals for each of genotypes CC, CT, or TT. (D) Manhattan plot based on multivariate (MV-GEMMA) and univariate (UV-GEMMA) analysis of three traits in the annual ring wood [number of cells, ring width, and radial tracheid width, labeled as ARW(NC_RW_RTW)]. (E) Manhattan plot based on univariate model BLINK only for the same three traits in the annual ring wood. (F) The allelic effects of SNP MA_15508_8004 on the three traits of the annual ring wood. SNPs depicted in (C,F) are eclipsed in the corresponding Manhattan plot, and the error bar represents ±standard deviation for phenotypic values. Different letters represent a significant difference (P < 0.05) between the mean values of different genotypes. Phenotypic values are scaled by their mean value. The dashed lines linking (A,B), and linking (D,E) are drawn to identify if MV-GEMMA or BLINK increases the power in the same contig as UV-GEMMA.
Discussion
Different core genes were involved in the different wood developmental stages
In the present study, we found that the genetic architecture differed significantly between the two developmental stages of juvenile and mature wood formation, as they only shared a single SNP in the GWAS analysis (Supplementary Table S3). Several transcription factors, such as annotated as homologs of AtCesA4, AtCesA7, and AtESR2-like, were among the gene models carrying the SNPs identified by GWAS in the JW or the MW (Table 3). Since the transition from juvenile to mature wood formation dramatically influences the growth and wood properties (Zobel and Jett, 1995), these transcription factors provide interesting tools for future breeding approaches. For instance, improved wood quality is one of the main breeding targets in conifers. For such approaches, it is beneficial that juvenile and mature wood have distinct genetic architectures, and that targeted breeding of juvenile wood does not necessarily affect the properties of the mature wood.
Similar to the tree developmental stage (age), different seasons also influenced the genetic architecture of growth and wood properties in unique ways, as no SNPs were shared between the earlywood and latewood in the GWAS (Figure 4B). Five candidate genes, annotated as mitogen-activated protein kinase kinase kinase (MAP3K) and putatively involved in drought resistance (Pieczynski et al., 2018), were detected only in EW, indicating that abiotic stress tolerance shapes wood formation in spring. Interestingly, MAP3K was associated with spring budburst, frost damage, and stem diameter in an earlier study on Norway spruce (Chen et al., 2021). Specific association of earlywood with SNPs of another gene, the cysteine synthase (MA_10428113g0010) (Table 3), was also reported in an earlier study in white spruce (Beaulieu et al., 2011). The latter parts of the season seemed to be involved in the changes associated with the synthesis of cellulose. A secondary cell wall cellulose synthase (CesA) was identified as a candidate gene in the transition wood, and a NAC transcription factor family MA_95898g0010 which is strictly coregulated in Norway spruce with secondary cell wall CesAs (Jokipii-Lukkari et al., 2018) in the mature wood. These results suggest that secondary cell wall deposition that occurs along with the shortening of the day length might involve unique variants of CesAs and their regulation by the NAC transcription factor MA_95898g0010. Latewood properties were also linked to variation in a β-amylase gene (MA_436199g0010), which is homologous to Arabidopsis cold-induced BAM3. Therefore, our work provides substantial evidence for the seasonal control of wood properties by abiotic factors, such as drought in the spring and cold in the late season.
More putative associations detected by multi-locus BLINK
Many empirical and simulation studies have shown that multi-locus GWAS methodologies, such as FASTmrEMMA (Wen et al., 2017), FarmCPU (Liu et al., 2016), and BLINK (Huang et al., 2019), have more power than single-locus methods, such as standard univariate GEMMA (Xu et al., 2018; Zhang et al., 2019). Also, the multivariate model (e.g., MV-GEMMA) has more power than the standard univariate models (e.g., UV-GEMMA) (Korte et al., 2012; Zhou and Stephens, 2014). Even though the power and Type I errors of the single-locus and multi-locus GWAS methods were not estimated in this study, we did detect more SNPs using the multi-locus and multivariate models. We found that more SNPs were detected by BLINK than by UV-GEMMA and MV-GEMMA. BLINK theoretically selects a set of pseudo-QTNs that are not in LD with each other as covariates, thus only the independent SNPs would be detected in GWAS (Huang et al., 2019). Theoretically, the multivariate model has more power than these standard univariate models because missing data in one of the phenotypic traits could be complemented by other phenotypes based on population correlation (Porter and O'Reilly, 2017). In the present study, however, there is only a slight difference between the number of associations for the two methods. The fact that there was no missing data for the phenotypic traits could be the main reason.
Effect of population size and heritability on GWAS
One of the main issues for GWAS is the validation of detected QTLs. Most of the GWAS in crops and tree species used ~500 individuals/genotypes (Huang et al., 2010; Hall et al., 2016; Fang et al., 2017; Chhetri et al., 2019; Chen et al., 2021). Few, if any, of the SNPs were validated or repeated in similar or even smaller population size (McKown et al., 2014a,b; Chhetri et al., 2019). For example, Elfstrand et al. (2020), performing GWAS for disease resistance traits in Norway spruce using 466 genotypes, did not find any overlapped SNPs with another previous study using 66 genotypes/clones (Mukrimin et al., 2018). We also did not observe the same QTLs detected in two previous studies of Norway spruce using a smaller population (517 trees) (Baison et al., 2019, 2020). In this study, we performed GWAS analysis in a parental population (476 trees) and identified nine SNPs with p < 0.05 that overlapped with the associated SNPs in the GWAS of their progenies (Table 3). We find that three candidate genes annotated as MAP3K for ring width (i.e., diameter) and located in the same contig MA_12842 were observed in a previous study using a larger population (~5,000 trees) (Chen et al., 2021). This finding indicates the importance of a large sample size for effectively detecting and subsequently validating the discovered QTLs. Heritability is also one of the most important factors determining the efficiency of GWAS, with higher heritability usually detecting more SNPs for the same trait (Korte and Farlow, 2013; Wray et al., 2013). In this study, GWAS detected and validated more associated SNPs in WCW than in JW and MW, which may be related to the generally higher heritabilities of traits from WCW than from JW and MW (Figure 3A). GWAS also detected the largest number of associations with traits from EW and the lowest number of associations with traits from LW. This is consistent with the results reported in white spruce (Wray et al., 2013).
Data availability statement
The raw data for exome capture presented in this study can be found in online repositories: (https://www.ncbi.nlm.nih.gov/ PRJNA731384).
Author contributions
HW and Z-QC conceived and designed the study and wrote the manuscript. Z-QC and BK attended data collection. Z-QC performed data analyses. All the authors including HT and MG-G edited the manuscript. All authors contributed to the article and approved the submitted version.
Funding
Funding was received from the Swedish Foundation for Strategic Research (SSF) (Grant Number: RBP14-0040). Z-QC was partly supported by the European Union Horizon 2020 research and innovation program under Grant No. 773383 (B4EST project).
Acknowledgments
We thank Johan Baison for SNP calling and technicians from the Forestry Research Institute of Sweden (Skogforsk) for helping with the fieldwork. Tianyi Liu did the wood preparation for SilviScan in the Research Institutes of Sweden (RISE), Stockholm. Dr. Colin Matheson from CSIRO, Australia, edited the English language. The computations were performed on resources provided by the Swedish National Infrastructure for Computing (SNIC) at UPPMAX and HPC2N.
Conflict of interest
The authors declare that the research was conducted in the absence of any commercial or financial relationships that could be construed as a potential conflict of interest.
Publisher's note
All claims expressed in this article are solely those of the authors and do not necessarily represent those of their affiliated organizations, or those of the publisher, the editors and the reviewers. Any product that may be evaluated in this article, or claim that may be made by its manufacturer, is not guaranteed or endorsed by the publisher.
Supplementary Material
The Supplementary Material for this article can be found online at: https://www.frontiersin.org/articles/10.3389/fpls.2022.927673/full#supplementary-material
References
Amadeu, R. R., Cellon, C., Olmstead, J. W., Garcia, A. A., Resende, M. F. Jr, and Muñoz, P. R. (2016). AGHmatrix: R package to construct relationship matrices for autotetraploid and diploid species: a blueberry example. Plant Gen. 9. doi: 10.3835/plantgenome2016.01.0009
Baison, J., Vidalis, A., Zhou, L., Chen, Z.-Q., Li, Z., Sillanpaeae, M. J., et al. (2019). Genome-wide association study identified novel candidate loci affecting wood formation in Norway spruce. Plant J. 100, 83–100. doi: 10.1111/tpj.14429
Baison, J., Zhou, L., Forsberg, N., Mörling, T., Grahn, T., Olsson, L., et al. (2020). Genetic control of tracheid properties in Norway spruce wood. Sci. Rep. 10, 18089. doi: 10.1038/s41598-020-72586-3
Baltunis, B. S., Wu, H. X., and Powell, M. B. (2007). Inheritance of density, microfibril angle, and modulus of elasticity in juvenile wood of Pinus radiata at two locations in Australia. Can. J. Forest Res. 37, 2164–2174. doi: 10.1139/X07-061
Beaulieu, J., Doerksen, T., Boyle, B., Clément, S., Deslauriers, M., Beauseigle, S., et al. (2011). Association genetics of wood physical traits in the conifer white spruce and relationships with gene expression. Genetics 188, 197–214. doi: 10.1534/genetics.110.125781
Bernhardsson, C., Zan, Y., Chen, Z., Ingvarsson, P. K., and Wu, H. X. (2021). Development of a highly efficient 50K SNP genotyping array for the large and complex genome of Norway spruce (Picea abies L. Karst) by whole genome re-sequencing and its transferability to other spruce species. Mol. Ecol. Resources 21, 880–896. doi: 10.1111/1755-0998.13292
Bouffier, L., Raffin, A., Rozenberg, P., Meredieu, C., and Kremer, A. (2008). What are the consequences of growth selection on wood density in the French maritime pine breeding programme? Tree Genet. Genomes 5, 11–25. doi: 10.1007/s11295-008-0165-x
Chen, Z.-Q., García-Gil, M. R., Karlsson, B., Lundqvist, S.-O., Olsson, L., and Wu, H. X. (2014). Inheritance of growth and solid wood quality traits in a large Norway spruce population tested at two locations in southern Sweden. Tree Genet. Genomes 10, 1291–1303. doi: 10.1007/s11295-014-0761-x
Chen, Z.-Q., Helmersson, A., Westin, J., Karlsson, B., and Wu, H. X. (2017). Efficiency of using spatial analysis for Norway spruce progeny tests in Sweden. Ann. For. Sci. 75, 2. doi: 10.1007/s13595-017-0680-8
Chen, Z.-Q., Karlsson, B., Lundqvist, S.-O., García-Gil, M. R., Olsson, L., and Wu, H. X. (2015). Estimating solid wood properties using Pilodyn and acoustic velocity on standing trees of Norway spruce. Ann. For. Sci. 72, 499–508. doi: 10.1007/s13595-015-0458-9
Chen, Z.-Q., Karlsson, B., Mörling, T., Olsson, L., Mellerowicz, E. J., Wu, H. X., et al. (2016). Genetic analysis of fiber dimensions and their correlation with stem diameter and solid-wood properties in Norway spruce. Tree Genet. Genomes 12, 123. doi: 10.1007/s11295-016-1065-0
Chen, Z.-Q., Zan, Y., Milesi, P., Zhou, L., Chen, J., Li, L., et al. (2021). Leveraging breeding programs and genomic data in Norway spruce (Picea abies L. Karst) for GWAS analysis. Genome Biol. 22, 179. doi: 10.1186/s13059-021-02392-1
Chhetri, H. B., Macaya-Sanz, D., Kainer, D., Biswal, A. K., Evans, L. M., Chen, J. G., et al. (2019). Multi-trait genome-wide association analysis of Populus trichocarpa identifies key polymorphisms controlling morphological and physiological traits. New Phytol. 223, 293–309. doi: 10.1111/nph.15777
Cingolani, P., Platts, A., Wang, L. L., Coon, M., Nguyen, T., Wang, L., et al. (2012). A program for annotating and predicting the effects of single nucleotide polymorphisms, SnpEff: SNPs in the genome of Drosophila melanogaster strain w1118; iso-2; iso-3. Fly 6, 80–92. doi: 10.4161/fly.19695
Crook, A. D., Willoughby, A. C., Hazak, O., Okuda, S., VanDerMolen, K. R., Soyars, C. L., et al. (2020). BAM1/2 receptor kinase signaling drives CLE peptide-mediated formative cell divisions in Arabidopsis roots. Proc. Nat. Acad. Sci. U.S.A. 117, 32750–32756. doi: 10.1073/pnas.2018565117
Danecek, P., Auton, A., Abecasis, G., Albers, C. A., Banks, E., DePristo, M. A., et al. (2011). The variant call format and VCFtools. Bioinformatics 27, 2156–2158. doi: 10.1093/bioinformatics/btr330
De La Torre, A. R., Puiu, D., Crepeau, M. W., Stevens, K., Salzberg, S. L., Langley, C. H., et al. (2019). Genomic architecture of complex traits in loblolly pine. New Phytol. 221, 1789–1801. doi: 10.1111/nph.15535
Elfstrand, M., Baison, J., Lundén, K., Zhou, L., Vos, I., Capador-Barreto, H. D., et al. (2020). Association genetics identifies a specifically regulated Norway spruce laccase gene, PaLAC5, linked to Heterobasidion parviporum-resistance. Plant Cell Environ. 43, 1779–1791. doi: 10.1111/pce.13768
Fan, P., Aguilar, E., Bradai, M., Xue, H., Wang, H., Rosas-Diaz, T., et al. (2021). The receptor-like kinases BAM1 and BAM2 are required for root xylem patterning. Proc. Nat. Acad. Sci. U.S.A. 118, e2022547118. doi: 10.1073/pnas.2022547118
Fang, L., Wang, Q., Hu, Y., Jia, Y., Chen, J., Liu, B., et al. (2017). Genomic analyses in cotton identify signatures of selection and loci associated with fiber quality and yield traits. Nat. Genet. 49, 1089–1098. doi: 10.1038/ng.3887
Gapare, W. J., Wu, H. X., and Abarquez, A. (2006). Genetic control of the time of transition from juvenile to mature wood in Pinus radiata D. Don. Ann. Forest Sci. 63, 871–878. doi: 10.1051/forest:2006070
Glowa, D., Comelli, P., Chandler, J. W., and Werr, W. (2021). Clonal sector analysis and cell ablation confirm a function for DORNROESCHEN-LIKE in founder cells and the vasculature in Arabidopsis. Planta 253, 1–16. doi: 10.1007/s00425-020-03545-5
Goddard, M. E., and Hayes, B. J. (2009). Mapping genes for complex traits in domestic animals and their use in breeding programmes. Nat. Rev. Genet. 10, 381–391. doi: 10.1038/nrg2575
Hall, D., Hallingbäck, H. R., and Wu, H. X. (2016). Estimation of number and size of QTL effects in forest tree traits. Tree Genet. Genomes 12, 110. doi: 10.1007/s11295-016-1073-0
Hallingback, H. R., Sanchez, L., and Wu, H. X. (2014). Single versus subdivided population strategies in breeding against an adverse genetic correlation. Tree Genet. Genomes 10, 605–617. doi: 10.1007/s11295-014-0707-3
Hayatgheibi, H., Forsberg, N. E. G., Lundqvist, S.-O., Mörling, T., Mellerowicz, E. J., Karlsson, B., et al. (2018). Genetic control of transition from juvenile to mature wood with respect to microfibril angle in Norway spruce (Picea abies) and lodgepole pine (Pinus contorta). Can. J. Forest Res. 48, 1358–1365. doi: 10.1139/cjfr-2018-0140
Hayatgheibi, H., Fries, A., Kroon, J., and Wu, H. (2017). Genetic analysis of lodgepole pine (Pinus contorta) solid wood quality traits. Can. J. Forest Res. 47, 1303–1313. doi: 10.1139/cjfr-2017-0152
Hong, Z., Fries, A., and Wu, H. X. (2014). High negative genetic correlations between growth traits and wood properties suggest incorporating multiple traits selection including economic weights for the future Scots pine breeding programs. Ann. For. Sci. 71, 463–472. doi: 10.1007/s13595-014-0359-3
Howe, G. T., Jayawickrama, K., Kolpak, S. E., Kling, J., Trappe, M., Hipkins, V., et al. (2020). An Axiom SNP genotyping array for Douglas-fir. BMC Genom. 21, 9. doi: 10.1186/s12864-019-6383-9
Huang, M., Liu, X., Zhou, Y., Summers, R. M., and Zhang, Z. (2019). BLINK: a package for the next level of genome-wide association studies with both individuals and markers in the millions. Gigascience 8, 1–12. doi: 10.1093/gigascience/giy154
Huang, X., Wei, X., Sang, T., Zhao, Q., Feng, Q., Zhao, Y., et al. (2010). Genome-wide association studies of 14 agronomic traits in rice landraces. Nat. Genet. 42, 961–967. doi: 10.1038/ng.695
Isik, F., and Li, B. L. (2003). Rapid assessment of wood density of live trees using the Resistograph for selection in tree improvement programs. Can. J. Forest Res. 33, 2426–2435. doi: 10.1139/x03-176
Isik, F., and McKeand, S. E. (2019). Fourth cycle breeding and testing strategy for Pinus taeda in the NC State University Cooperative Tree Improvement Program. Tree Genet. Genomes 15, 70. doi: 10.1007/s11295-019-1377-y
Ivković, M., Wu, H., and Kumar, S. (2010). Bio-economic modelling as a method for determining economic weights for optimal multiple-trait tree selection. Silvae Genet. 59, 77–90. doi: 10.1515/sg-2010-0010
Jokipii-Lukkari, S., Delhomme, N., Schiffthaler, B., Mannapperuma, C., Prestele, J., Nilsson, O., et al. (2018). Transcriptional roadmap to seasonal variation in wood formation of Norway spruce. Plant Physiol. 176, 2851–2870. doi: 10.1104/pp.17.01590
Jokipii-Lukkari, S., Sundell, D., Nilsson, O., Hvidsten, T. R., Street, N. R., and Tuominen, H. (2017). NorWood: a gene expression resource for evo-devo studies of conifer wood development. New Phytol. 216, 482–494. doi: 10.1111/nph.14458
Karlgren, A., Gyllenstrand, N., Clapham, D., and Lagercrantz, U. (2013). FLOWERING LOCUS T/TERMINAL FLOWER1-like genes affect growth rhythm and bud set in Norway spruce. Plant Physiol. 163, 792–803. doi: 10.1104/pp.113.224139
Klintenäs, M., Pin, P. A., Benlloch, R., Ingvarsson, P. K., and Nilsson, O. (2012). Analysis of conifer FLOWERING LOCUS T/TERMINAL FLOWER1-like genes provides evidence for dramatic biochemical evolution in the angiosperm FT lineage. New Phytol. 196, 1260–1273. doi: 10.1111/j.1469-8137.2012.04332.x
Kolde, R., and Kolde, M. R. (2015). Package 'pheatmap'. R Package 1, 790. Available online at: https://cran.r-project.org/web/packages/pheatmap/index.html
Korte, A., and Farlow, A. (2013). The advantages and limitations of trait analysis with GWAS: a review. Plant Methods 9, 29. doi: 10.1186/1746-4811-9-29
Korte, A., Vilhjálmsson, B. J., Segura, V., Platt, A., Long, Q., and Nordborg, M. (2012). A mixed-model approach for genome-wide association studies of correlated traits in structured populations. Nat. Genet. 44, 1066–1071. doi: 10.1038/ng.2376
Langmead, B., and Salzberg, S. L. (2012). Fast gapped-read alignment with Bowtie 2. Nat. Methods 9, 357–359. doi: 10.1038/nmeth.1923
Lenz, P., Cloutier, A., MacKay, J., and Beaulieu, J. (2010). Genetic control of wood properties in Picea glauca- an analysis of trends with cambial age. Can. J. Forest Res. 40, 703–715. doi: 10.1139/X10-014
Li, X., Wu, H. X., and Southerton, S. G. (2011). Transcriptome profiling of wood maturation in Pinus radiata identifies differentially expressed genes with implications in juvenile and mature wood variation. Gene 487, 62–71. doi: 10.1016/j.gene.2011.07.028
Liu, L., Tong, H., Xiao, Y., Che, R., Xu, F., Hu, B., et al. (2015). Activation of Big Grain1 significantly improves grain size by regulating auxin transport in rice. Proc. Nat. Acad. Sci. U.S.A. 112, 11102–11107. doi: 10.1073/pnas.1512748112
Liu, X., Huang, M., Fan, B., Buckler, E. S., and Zhang, Z. (2016). Iterative usage of fixed and random effect models for powerful and efficient genome-wide association studies. PLoS Genet. 12, e1005767. doi: 10.1371/journal.pgen.1005767
Lundqvist, S.-O., and Evans, R. (2004). Illustration of Wood and Fiber Measurements With SilviScan. STFI Report 15. Stockholm: STFI-Packforsk.
Lundqvist, S.-O., Seifert, S., Grahn, T., Olsson, L., García-Gil, M. R., Karlsson, B., et al. (2018). Age and weather effects on between and within ring variations of number, width and coarseness of tracheids and radial growth of young Norway spruce. Eur. J. For. Res. 137, 719–743. doi: 10.1007/s10342-018-1136-x
McKown, A. D., Guy, R. D., Klápště, J., Geraldes, A., Friedmann, M., Cronk, Q. C. B., et al. (2014a). Geographical and environmental gradients shape phenotypic trait variation and genetic structure in Populus trichocarpa. New Phytol. 201, 1263–1276. doi: 10.1111/nph.12601
McKown, A. D., Guy, R. D., Quamme, L., Klapste, J., La Mantia, J., Constabel, C. P., et al. (2014b). Association genetics, geography and ecophysiology link stomatal patterning in Populus trichocarpa with carbon gain and disease resistance trade-offs. Mol. Ecol. 23, 5771–5790. doi: 10.1111/mec.12969
Mills, M. C., and Rahal, C. (2019). A scientometric review of genome-wide association studies. Commun. Biol. 2, 1–11. doi: 10.1038/s42003-018-0261-x
Monroe, J. D., Storm, A. R., Badley, E. M., Lehman, M. D., Platt, S. M., Saunders, L. K., et al. (2014). β-amylase1 and β-amylase3 are plastidic starch hydrolases in arabidopsis that seem to be adapted for different thermal, pH, and stress conditions. Plant Physiol. 166, 1748–1763. doi: 10.1104/pp.114.246421
Mukrimin, M., Kovalchuk, A., Neves, L. G., Jaber, E. H., Haapanen, M., Kirst, M., et al. (2018). Genome-wide exon-capture approach identifies genetic variants of Norway spruce genes associated with susceptibility to Heterobasidion parviporum infection. Front. Plant Sci. 9, 793. doi: 10.3389/fpls.2018.00793
Neale, D. B., and Kremer, A. (2011). Forest tree genomics: growing resources and applications. Nat. Rev. Genet. 12, 111–122. doi: 10.1038/nrg2931
Neale, D. B., Wegrzyn, J. L., Stevens, K. A., Zimin, A. V., Puiu, D., Crepeau, M. W., et al. (2014). Decoding the massive genome of loblolly pine using haploid DNA and novel assembly strategies. Genome Biol. 15, R59. doi: 10.1186/gb-2014-15-3-r59
Niu, S., Li, J., Bo, W., Yang, W., Zuccolo, A., Giacomello, S., et al. (2022). The Chinese pine genome and methylome unveil key features of conifer evolution. Cell. 185, 204–217. doi: 10.1016/j.cell.2021.12.006
Nystedt, B., Street, N. R., Wetterbom, A., Zuccolo, A., Lin, Y.-C., Scofield, D. G., et al. (2013). The Norway spruce genome sequence and conifer genome evolution. Nature 497, 579–584. doi: 10.1038/nature12211
Olsson, L., Hedenberg, Ö., and Lundqvist, S. (1998). Measurements of Growth Ring Patterns-Comparisons of Methods. STFI Report TF111. Stockholm: STFI-Packforsk.
Pan, J., Wang, B., Pei, Z.-Y., Zhao, W., Gao, J., Mao, J.-F., et al. (2015). Optimization of the genotyping-by-sequencing strategy for population genomic analysis in conifers. Mol. Ecol. Resour. 15, 711–722. doi: 10.1111/1755-0998.12342
Park, Y.-I., and Spiecker, H. (2005). Variations in the tree-ring structure of Norway spruce (Picea abies) under contrasting climates. Dendrochronologia 23, 93–104. doi: 10.1016/j.dendro.2005.09.002
Pieczynski, M., Wyrzykowska, A., Milanowska, K., Boguszewska-Mankowska, D., Zagdanska, B., Karlowski, W., et al. (2018). Genomewide identification of genes involved in the potato response to drought indicates functional evolutionary conservation with Arabidopsis plants. Plant Biotechnol. J. 16, 603–614. doi: 10.1111/pbi.12800
Porter, H. F., and O'Reilly, P. F. (2017). Multivariate simulation framework reveals performance of multi-trait GWAS methods. Sci. Rep. 7, 38837. doi: 10.1038/srep38837
Shim, H., Chasman, D. I., Smith, J. D., Mora, S., Ridker, P. M., Nickerson, D. A., et al. (2015). A multivariate genome-wide association analysis of 10 LDL subfractions, and their response to statin treatment, in 1868 Caucasians. PLoS ONE 10, e0120758–e0120758. doi: 10.1371/journal.pone.0120758
Stephens, M.. (2013). A unified framework for association analysis with multiple related phenotypes. PLoS ONE 8, e65245. doi: 10.1371/journal.pone.0065245
Stevens, K. A., Wegrzyn, J. L., Zimin, A., Puiu, D., Crepeau, M., Cardeno, C., et al. (2016). Sequence of the sugar pine megagenome. Genetics 204, 1613–1626. doi: 10.1534/genetics.116.193227
Sundell, D., Mannapperuma, C., Netotea, S., Delhomme, N., Lin, Y. C., Sjödin, A., et al. (2015). The plant genome integrative explorer resource: PlantGen IE. org. New Phytologist 208, 1149–1156. doi: 10.1111/nph.13557
VanRaden, P. M.. (2008). Efficient methods to compute genomic predictions. J. Dairy Sci. 91, 4414–4423. doi: 10.3168/jds.2007-0980
Vidalis, A., Scofield, D. G., Neves, L. G., Bernhardsson, C., García-Gil, M. R., and Ingvarsson, P. (2018). Design and evaluation of a large sequence-capture probe set and associated SNPs for diploid and haploid samples of Norway spruce (Picea abies). bioRxiv. doi: 10.1101/291716
Visscher, P. M., Wray, N. R., Zhang, Q., Sklar, P., McCarthy, M. I., Brown, M. A., et al. (2017). 10 years of GWAS discovery: biology, function, and translation. Am. J. Human Genet. 101, 5–22. doi: 10.1016/j.ajhg.2017.06.005
Wang, J., Ding, J., Tan, B., Robinson, K. M., Michelson, I. H., Johansson, A., et al. (2018). A major locus controls local adaptation and adaptive life history variation in a perennial plant. Genome Biol. 19, 72. doi: 10.1186/s13059-018-1444-y
Warren, R. L., Keeling, C. I., Yuen, M. M. S., Raymond, A., Taylor, G. A., and Vandervalk, B. P. (2015). Improved white spruce (Picea glauca) genome assemblies and annotation of large gene families of conifer terpenoid and phenolic defense metabolism. Plant J. 83, 189–212. doi: 10.1111/tpj.12886
Wen, Y.-J., Zhang, H., Ni, Y.-L., Huang, B., Zhang, J., Feng, J.-Y., et al. (2017). Methodological implementation of mixed linear models in multi-locus genome-wide association studies. Brief. Bioinformatics 19, 700–712. doi: 10.1093/bib/bbw145
Wray, N. R., Yang, J., Hayes, B. J., Price, A. L., Goddard, M. E., and Visscher, P. M. (2013). Pitfalls of predicting complex traits from SNPs. Nat. Rev. Genet. 14, 507–515. doi: 10.1038/nrg3457
Wu, H. X., Eldridge, K. G., Matheson, A. C., Powell, M. B., McRae, T. A., Butcher, T. B., et al. (2007). Achievements in forest tree improvement in Australia and New Zealand: 8. Successful introduction and breeding of radiata pine in Australia. Austral. Forestry 70, 215–225. doi: 10.1080/00049158.2007.10675023
Wu, H. X., Ivković, M., Gapare, W. J., Matheson, A. C., Baltunis, B. S., Powell, M. B., et al. (2008). Breeding for wood quality and profit in radiata pine: a review of genetic parameters. N. Zeal. J. Forestry Sci. 38, 56–87.
Wu, H. X., and Sanchez, L. (2011). Effect of selection method on genetic correlation and gain in a two-trait selection scheme. Austral. Forestry 74, 36–42. doi: 10.1080/00049158.2011.10676344
Xu, Y., Yang, T., Zhou, Y., Yin, S., Li, P., Liu, J., et al. (2018). Genome-wide association mapping of starch pasting properties in maize using single-locus and multi-locus models. Front. Plant Sci. 9, 1311. doi: 10.3389/fpls.2018.01311
Yang, J., Weedon, M. N., Purcell, S., Lettre, G., Estrada, K., Willer, C. J., et al. (2011). Genomic inflation factors under polygenic inheritance. Euro. J. Human Genet. 19, 807–812. doi: 10.1038/ejhg.2011.39
Zan, Y., and Carlborg, Ö. (2018). A multilocus association analysis method integrating phenotype and expression data reveals multiple novel associations to flowering time variation in wild-collected Arabidopsis thaliana. Mol. Ecol. Resour. 18, 798–808. doi: 10.1111/1755-0998.12757
Zhang, Y.-M., Jia, Z., and Dunwell, J. M. (2019). The applications of new multi-locus GWAS methodologies in the genetic dissection of complex traits. Front. Plant Sci. 10, 100. doi: 10.3389/fpls.2019.00100
Zhou, L., Chen, Z., Lundqvist, S.-O., Olsson, L., Grahn, T., Karlsson, B., et al. (2019). Genetic analysis of wood quality traits in Norway spruce open-pollinated progenies and their parent plus trees at clonal archives and the evaluation of phenotypic selection of plus trees. Can. J. Forest Res. 49, 810–818. doi: 10.1139/cjfr-2018-0117
Zhou, X., and Stephens, M. (2014). Efficient multivariate linear mixed model algorithms for genome-wide association studies. Nat. Methods 11, 407–409. doi: 10.1038/nmeth.2848
Keywords: wood properties, seasonal variation, developmental stage, genome-wide association, Norway spruce
Citation: Chen Z-Q, Zan Y, Zhou L, Karlsson B, Tuominen H, García-Gil MR and Wu HX (2022) Genetic architecture behind developmental and seasonal control of tree growth and wood properties in Norway spruce. Front. Plant Sci. 13:927673. doi: 10.3389/fpls.2022.927673
Received: 24 April 2022; Accepted: 12 July 2022;
Published: 09 August 2022.
Edited by:
Sujan Mamidi, HudsonAlpha Institute for Biotechnology, United StatesReviewed by:
Jaime Barros-Rios, University of Missouri, United StatesJingna Si, Beijing Forestry University, China
Copyright © 2022 Chen, Zan, Zhou, Karlsson, Tuominen, García-Gil and Wu. This is an open-access article distributed under the terms of the Creative Commons Attribution License (CC BY). The use, distribution or reproduction in other forums is permitted, provided the original author(s) and the copyright owner(s) are credited and that the original publication in this journal is cited, in accordance with accepted academic practice. No use, distribution or reproduction is permitted which does not comply with these terms.
*Correspondence: Harry X. Wu, aGFycnkud3VAc2x1LnNl