 Yi-Chen Lee
 Pei-Ting Tsai
 Huang-Lung Tsai
- Institute of Molecular and Cellular Biology, National Taiwan University, Taipei, Taiwan
BARLEY B-RECOMBINANT/BASIC PENTACYSTEINE (BBR/BPC) family members are plant-specific GAGA-motif binding factors (GAFs) controlling multiple developmental processes of growth and propagation. BPCs recruit histone remodeling factors for transcriptional repression of downstream targets. It has been revealed that BPCs have an overlapping and antagonistic relationship in regulating development. In this study, we showed disturbances interfering with the homeostasis of BPC expressions impede growth and development. The ectopic expression of BPC3 results in the daily growth defect shown by higher-order bpc mutants. Oscillations of multiple circadian clock genes are phase-delayed in the quadruple mutant of bpc1 bpc2 bpc4 bpc6 (bpc1,2,4,6). By introducing the overexpression of BPC3 into wild-type Arabidopsis, we found that BPC3 is a repressor participating in its repression and repressing multiple regulators essential to the circadian clock. However, the induction of BPC3 overexpression did not fully replicate clock defects shown by the quadruple mutant, indicating that in addition to the BPC3 antagonization, BPC members also cofunction in the circadian clock regulation. A leaf edge defect similar to that shown by bpc1,2,4,6 is also observed under BPC3 induction, accompanied by repression of a subset of TCPs required for the edge formation. This proves that BPC3 is a repressor that must be confined during the vegetative phase. Our findings demonstrate that BPCs form a meticulous repressor network for restricting their repressive functions to molecular mechanisms controlling plant growth and development.
Introduction
Plant-specific GAGA-binding factors, BASIC PENTACYSTEINEs (BPCs; also called BARLEY B RECOMBINANTs, BBRs), are transcription factors binding to the GA-dinucleotide repeats (Sangwan and O’Brian, 2002; Santi et al., 2003; Meister et al., 2004; Kooiker et al., 2005; Simonini et al., 2012; Hecker et al., 2015) frequently found in promoters of Arabidopsis genes (Monfared et al., 2011; Hecker et al., 2015). Coincident with the prevalence of GA-repeats in the Arabidopsis genome, BPCs regulate wide-ranged homeotic genes for the maintenance of the shoot apical meristem size (Simonini and Kater, 2014), root development (Monfared et al., 2011; Mu et al., 2017), and developmental transition of the ovule (Meister et al., 2004; Kooiker et al., 2005; Monfared et al., 2011; Simonini et al., 2012; Wu et al., 2020). In Arabidopsis, BPC members are categorized into three subclasses based on protein similarity: BPC1, BPC2, and BPC3 in class I; BPC4, the pseudogene BPC5, and BPC6 in class II; and BPC7 in class III (Meister et al., 2004; Monfared et al., 2011). Each class of BPC functions via targeting class-specific downstream genes. For example, class I members, BPC1 and BPC2, recruit polycomb repressive complex 2 (PRC2) to negatively regulate the spatiotemporal transcription of FUSCA3 in reproductive organs (Wu et al., 2020). Multiple homeotic genes targeted by class I BPC are not significantly changed in mutants related to class II BPC, bpc4 bpc6 or lhp1-4 bpc4 bpc6 (Hecker et al., 2015), supporting that BPCs conduct class-specific functions (Hecker et al., 2015). However, the high-order mutants showing pleiotropic phenotypes, such as bpc1-1 bpc2 (bpc1,2) and bpc1-1 bpc2 bpc4 bpc6 (bpc1,2,4,6), can be partially rescued by the mutation of BPC3. This indicates that classes I and II BPCs (BPC1, BPC2, BPC4, and BPC6) also have overlapping roles in antagonizing BPC3 (Monfared et al., 2011). In addition, it was found that BPCs of classes I and II act redundantly in a general regulatory complex composed of BPCs, MADS-domain factors, and PRCs to confine the homeotic gene SEEDSTICK (STK) expression (Petrella et al., 2020), indicating that the redundancy is not restricted among BPC members belonging to the same subclass.
Developmental defects observed in the BPC mutants, including the defective elongations of the hypocotyl (Dowson-Day and Millar, 1999), petiole (Engelmann and Johnsson, 1998) and inflorescence stem (Jouve et al., 1998), and flowering time control (Shim et al., 2017), are phenotypes commonly shown by circadian clock mutants. The circadian clock in Arabidopsis is composed of the double-negative feedback loop formed by CIRCADIAN CLOCK ASSOCIATED1 (CCA1)/LATE ELONGATED HYPOCOTYL (LHY) and TIMING OF CAB EXPRESSION1 (TOC1; Harmer et al., 2000; Alabadi et al., 2001). The peak expression of the morning genes CCA1/LHY at dawn represses the evening gene TOC1 (Alabadi et al., 2001), whereas TOC1 reciprocally represses CCA1/LHY at dusk (Pokhilko et al., 2010, 2012; Gendron et al., 2012; Huang et al., 2012). Besides TOC1, the expression of the CCA1 during the day can be consecutively repressed by negative regulators PSEUDORESPONSE REGULATOR9 (PRR9), PRR7, PRR5, and CCA1 HIKING EXPEDITION (CHE) from the morning to midnight (Nakamichi et al., 2005, 2010; Pruneda-Paz et al., 2009). Most circadian clock genes encode transcription factors functioning in gene repression. A previous study has shown that the induction of TOC1 upregulates a subset of genes encompassing sequence patterns of GAGA motifs at the promoter regions (Gendron et al., 2012). This indicates that BPCs might regulate the circadian phenotypes with the clock components.
Significant defects showing curled adult leaves are seen in BPC mutants’ rosettes (Monfared et al., 2011), revealing that BPCs play regulatory roles for leaf development. A subset of TEOSINTE BRANCHED1, CYCLOIDEA, PROLIFERATING CELL FACTOR (TCP) transcription factors is involved in leaf development via the overlap of suppressing the serrated edge of adult leaves (Koyama et al., 2010). The exaggerated or deficient activity of the TCP subset results in disorders of leaf edge formation (Koyama et al., 2017). In addition to the transcriptional regulation, the TCP genes are targeted by miR319, which restrains TCP mRNA abundance in an acceptable range at the posttranscriptional stage (Palatnik et al., 2003; Koyama et al., 2017; Jiang et al., 2018). It has been shown that the binding motifs of TCP transcription factors overlap with the DNA-binding properties of BPC6 in addition to GAGA motifs (Shanks et al., 2018), implying that TCPs and BPCs may coordinate the downstream genes in leaf morphology controls.
In this study, we expose the function of BPC3 is transcriptionally repressed by overlapping BPC members during the vegetative phase. BPC3 is involved in regulating its homeostasis of transcript level with other BPCs. BPC3 repression is disrupted by BPC mutations or via introducing BPC3 overexpression broadly interferes with mechanisms, including circadian clock and leaf morphology during vegetative growth. These results suggest that BPC3 is a part of the complex BPC-repressive network confining downstream genes from the exaggerated expression during the vegetative stage.
Materials and Methods
Plant Materials and Growth Conditions
Plants used in this study were under Arabidopsis thaliana Columbia-0 (Col-0) background. Seeds of bpc4 and bpc1-1 bpc2 bpc4 bpc6 were gifts from Charles Gasser (Monfared et al., 2011). Mutant seeds of bpc1-1 bpc2 (CS68700) and bpc1-1 bpc2 bpc3-1 (CS68699) were obtained from Arabidopsis Biological Resource Center (ABRC), and genotypes were validated as previously described (Monfared et al., 2011). Wild-type and mutant seeds were germinated on half-strength Murashige and Skoog medium (Murashige and Skoog, 1962) solidified by 0.8% phytoagar and stratified at 4°C for 3 days under dark. Seedlings grown by white light illumination (75–100 μmol m–2 s–1) at 22°C under a photoperiod of 16-h light/8-h dark or 12-h light/12-h dark for later assessing the gene profiles under continuous light of free-running conditions were used for RNA preparations.
Rosette Area Expansion Analysis
Plant seedlings were grown in soil pots at 22°C under 16 h light/8 h dark at a fluence rate of 45–55 μmol m–2 s–1. The plant’s growth was monitored in a temperature- and light-controlled chamber (Taiwan Hipoint). Lights were produced by LED lamps of 470 ± 30, 560 ± 20, and 660 ± 25 nm output at a 28:14:100 ratio. The fluence rate was measured by using the LI-250 radiometer (LI-COR). Color images of plant growth were taken hourly and processed by preserving green color to represent the rosette area. The rosette area was outlined and measured using the “Wand (tracing) tool” of ImageJ 1.53c on the processed image. The data of the rosette area were averaged across the growth process using a 10-ZT sliding window, and the area expanded per hour was calculated.
DNA Constructions
The fragments of XVE, BAR, the gene of interest, and the EYFP-HA or HA tag generated by PCR were purified and assembled to the pER8 binary vector backbone. The BPC1, BPC3, and BPC4 cDNAs were amplified using Phusion High-Fidelity DNA polymerase (NEB) from cDNAs generated from Arabidopsis rosette leaves and subcloned for use as templates in different destination PCRs. The synthetic XVE gene driven by G10-90 was amplified from pER8. The ProMAS-BAR-TerMAS was amplified from the binary vector pEarleyGate 100. The EYFP gene was amplified from a template derived from the pEYFP plasmid. HA tag possessing triple tandem HA (3 × HA) was fill-in generated using 27-nt-paired DNA oligos. The amplified BPC3 and 3 × HA fragments were assembled with an AscI-SpeI linearized pER8 backbone fragment by using NEBuilder HiFi DNA Assembly Master Mix (NEB) to generate the construct XVE:BPC3-HA. The assembled plasmid was linearized by HindIII and AscI and used as the backbone to assemble with amplified G10-90, XVE, BAR fragments and further modified as the Bar-resistant binary vector, XVE:BPC3-HA. The XVE:BPC4-HA, XVE:BPC3-EYFP-HA, and XVE:BPC4-EYFP-HA constructs were generated using the XhoI-SpeI linearized XVE:BPC3-HA as the backbone for assembling with BPC3 or BPC4, EYFP, and 3 × HA fragments. Forward and reverse primers of interest for DNA amplification are listed in Supplementary Table 1.
RNA Preparation and Quantitative Real-Time PCR
As described below, four to six seedlings grown under the indicated entrainment or free-running conditions were harvested at indicated age and time for total RNA isolation by using the pine tree method (Chang et al., 1993). Seedlings were ground into powder in liquid nitrogen and extracted by 700 μl pine-tree buffer (2% CTAB, 2% PVP, 2M NaCl, 0.5g/L spermidine, 25 mM EDTA, 100 mM Tris pH 8.0, and 2% 2-mercaptoethanol) at 65°C for 5 min. The RNA mixture was extracted with 450 μl of chloroform-isoamyl alcohol (24:1). The aqueous phase of the extraction was saved in 2M LiCl to precipitate RNA at 4°C for overnight. According to the manufacturer’s instruction, two micrograms of prified RNA were used to synthesize cDNA by conducting reverse transcription with Superscript II reverse transcriptase package (Invitrogen). The quantitative real-time PCR reaction was prepared using qPCRBIO SyGreen Mix (Cat. No. PB20.11, PCRBIOSYSTEMS) for performing qPCR in MA-6000 Real-Time Quantitative Thermal Cycler (Molarray). The gene expression relative to the internal control UBQ10 was determined by using the comparative threshold cycle (CT) method. Primers used for the qPCR assays are listed in Supplementary Table 1.
Immunoblot Assays
Total protein was extracted from transiently infected seedlings of AGROBEST or transgenic lines under the indicated conditions in 1 × Laemmli sample buffer (60 mM Tris–HCl pH 6.8, 10% glycerol, 1% SDS, 1% β-mercaptoethanol, and 0.01% bromophenol blue). Protein lysates were separated by 10% SDS-polyacrylamide gel electrophoresis in the Tris-glycine running system and transferred to a polyvinylidene fluoride (PVDF) membrane (Perkin Elmer) for signal detection. HA-tagged proteins were detected using the mouse monoclonal anti-HA antibody (H3663; Sigma-Aldrich).
Chromatin Immunoprecipitation qPCR Assays
Rosette leaves of 22-day-old transgenic plants of XVE:BPC3-EYFP-HA lines grown under 16-h light/8-h dark cycles were cut at ZT9 and floated on half-strength MS solution containing 0 or 50 μM 17-β-estradiol to induce BPC3-EYFP-HA expression for 24 h. The leaf samples were used in Chromatin immunoprecipitation (ChIP) assays as described previously (Wang et al., 2011) with modifications. In brief, the leaves were crosslinked with fixation buffer (0.4 M sucrose, 10 mM Tris-HCl pH 8.0, 1 mM PMSF, 1 mM EDTA, 1% formaldehyde) under vacuum for 20 min and stopped in 125 mM glycine. Leaf materials were ground into powder in liquid nitrogen and lysed 500 μl powder by 800 μl nuclei lysis buffer (50 mM HEPES pH 7.5, 0.1% sodium deoxycholate, 0.5% SDS, 150 mM NaCl, 1% Triton X-100, 0.1 mM PMSF, 1 × Roche protease inhibitor cocktail). The lysate was filtered using a 100-μm nylon mesh. Seven hundred μl of the filtrate with two 3-mm glass beads was sonicated by 70 cycles of 20-sec-on/20-sec-off in a 2-ml tube with the instrument S2 focused-ultrasonicator (Covaris) setting parameters as duty cycle of 20%, intensity of 4, cycles per burst 4, and bath temperature of 7°C to shear chromatins in a length of approximately 0.5 kb. A one-tenth volume of sonicated lysate was saved as the input fraction. Chromatin complexes in the lysate were caught overnight at 4°C by anti-HA magnetic beads (monoclonal clone CB051, Origene) pre-equilibrated by 1 μg/ml salmon sperm DNA and 1 mg/ml BSA. The magnetic beads were washed three times by nuclei lysis buffer, three times by LNDET buffer (0.25 LiCl, 1% Nonidet P-40, 1% sodium deoxycholate, 1 mM EDTA), and three times by TE buffer (10 mM Tris-HCl pH 8.0, 1 mM EDTA). Chromatin complexes immunoprecipitated on beads were eluted by the elution buffer (0.5% SDS, 0.1 M NaHCO3). To release DNA, the cross-linked chromatin complexes were eluted, and input fractions were digested with 0.25 μg/μl Proteinase-K (Boehringer Mannheim) at 65°C overnight. The DNA was purified by using the QIAEXII gel purification kit (Qiagen), and the amount was determined by qPCR with corresponding primers. Primers used in ChIP-qPCR are listed in Supplementary Table 1.
Results
Growth Defects of bpc Mutants Are Anticorrelated With BPC3 Transcript Level
In the previous study, the disruption of BPC3 would partially rescue phenotypic defects in bpc1-1 bpc2 (bpc1,2) and bpc1-1 bpc2 bpc4 bpc6 (bpc1,2,4,6) mutants (Monfared et al., 2011), indicating BPC3 and the other BPC members have antagonistic functions (Monfared et al., 2011). As previously reported, BPC class-I mutant combinations were defective in vegetative growth (Monfared et al., 2011). The bpc1-1 bpc2 (bpc1,2) double mutant was decreased in plant size, which was partially rescued in bpc1-1 bpc2 bpc3-1 (bpc1,2,3), and more reduced in bpc1,2,4,6 (Figure 1A; Monfared et al., 2011), suggesting that BPC3 impeded the growth of bpc1,2. We further profiled the circadian growth of bpc mutants to test if BPCs were involved in rhythmic growth regulation. With the contour of the rosette area across day–night cycles (Figure 1B), the wild type exhibited rhythmic changes in the expansion rate, peaking at night under the day–night process (Figure 1C). The expansion rate of the rosette area at night was inhibited in bpc1,2 (Figure 1C), indicating that BPC1 and BPC2 were required for the growth control. A partial recovery of expansion accelerating before dusk was detected in bpc1,2,3, though the reduced expansion rate in bpc1,2 was not fully rescued in bpc1,2,3 (Figure 1C). This was consistent with the partial rescue of plant size in bpc1,2,3 (Figure 1A). The rosette expansion rate was further impeded in bpc1,2,4,6 (Figure 1D). Coincidently, the extent of inhibited growth observed in bpc1,2 and bpc1,2,4,6 was anticorrelated with the number of BPC genes in plants carrying the wild-type BPC3.
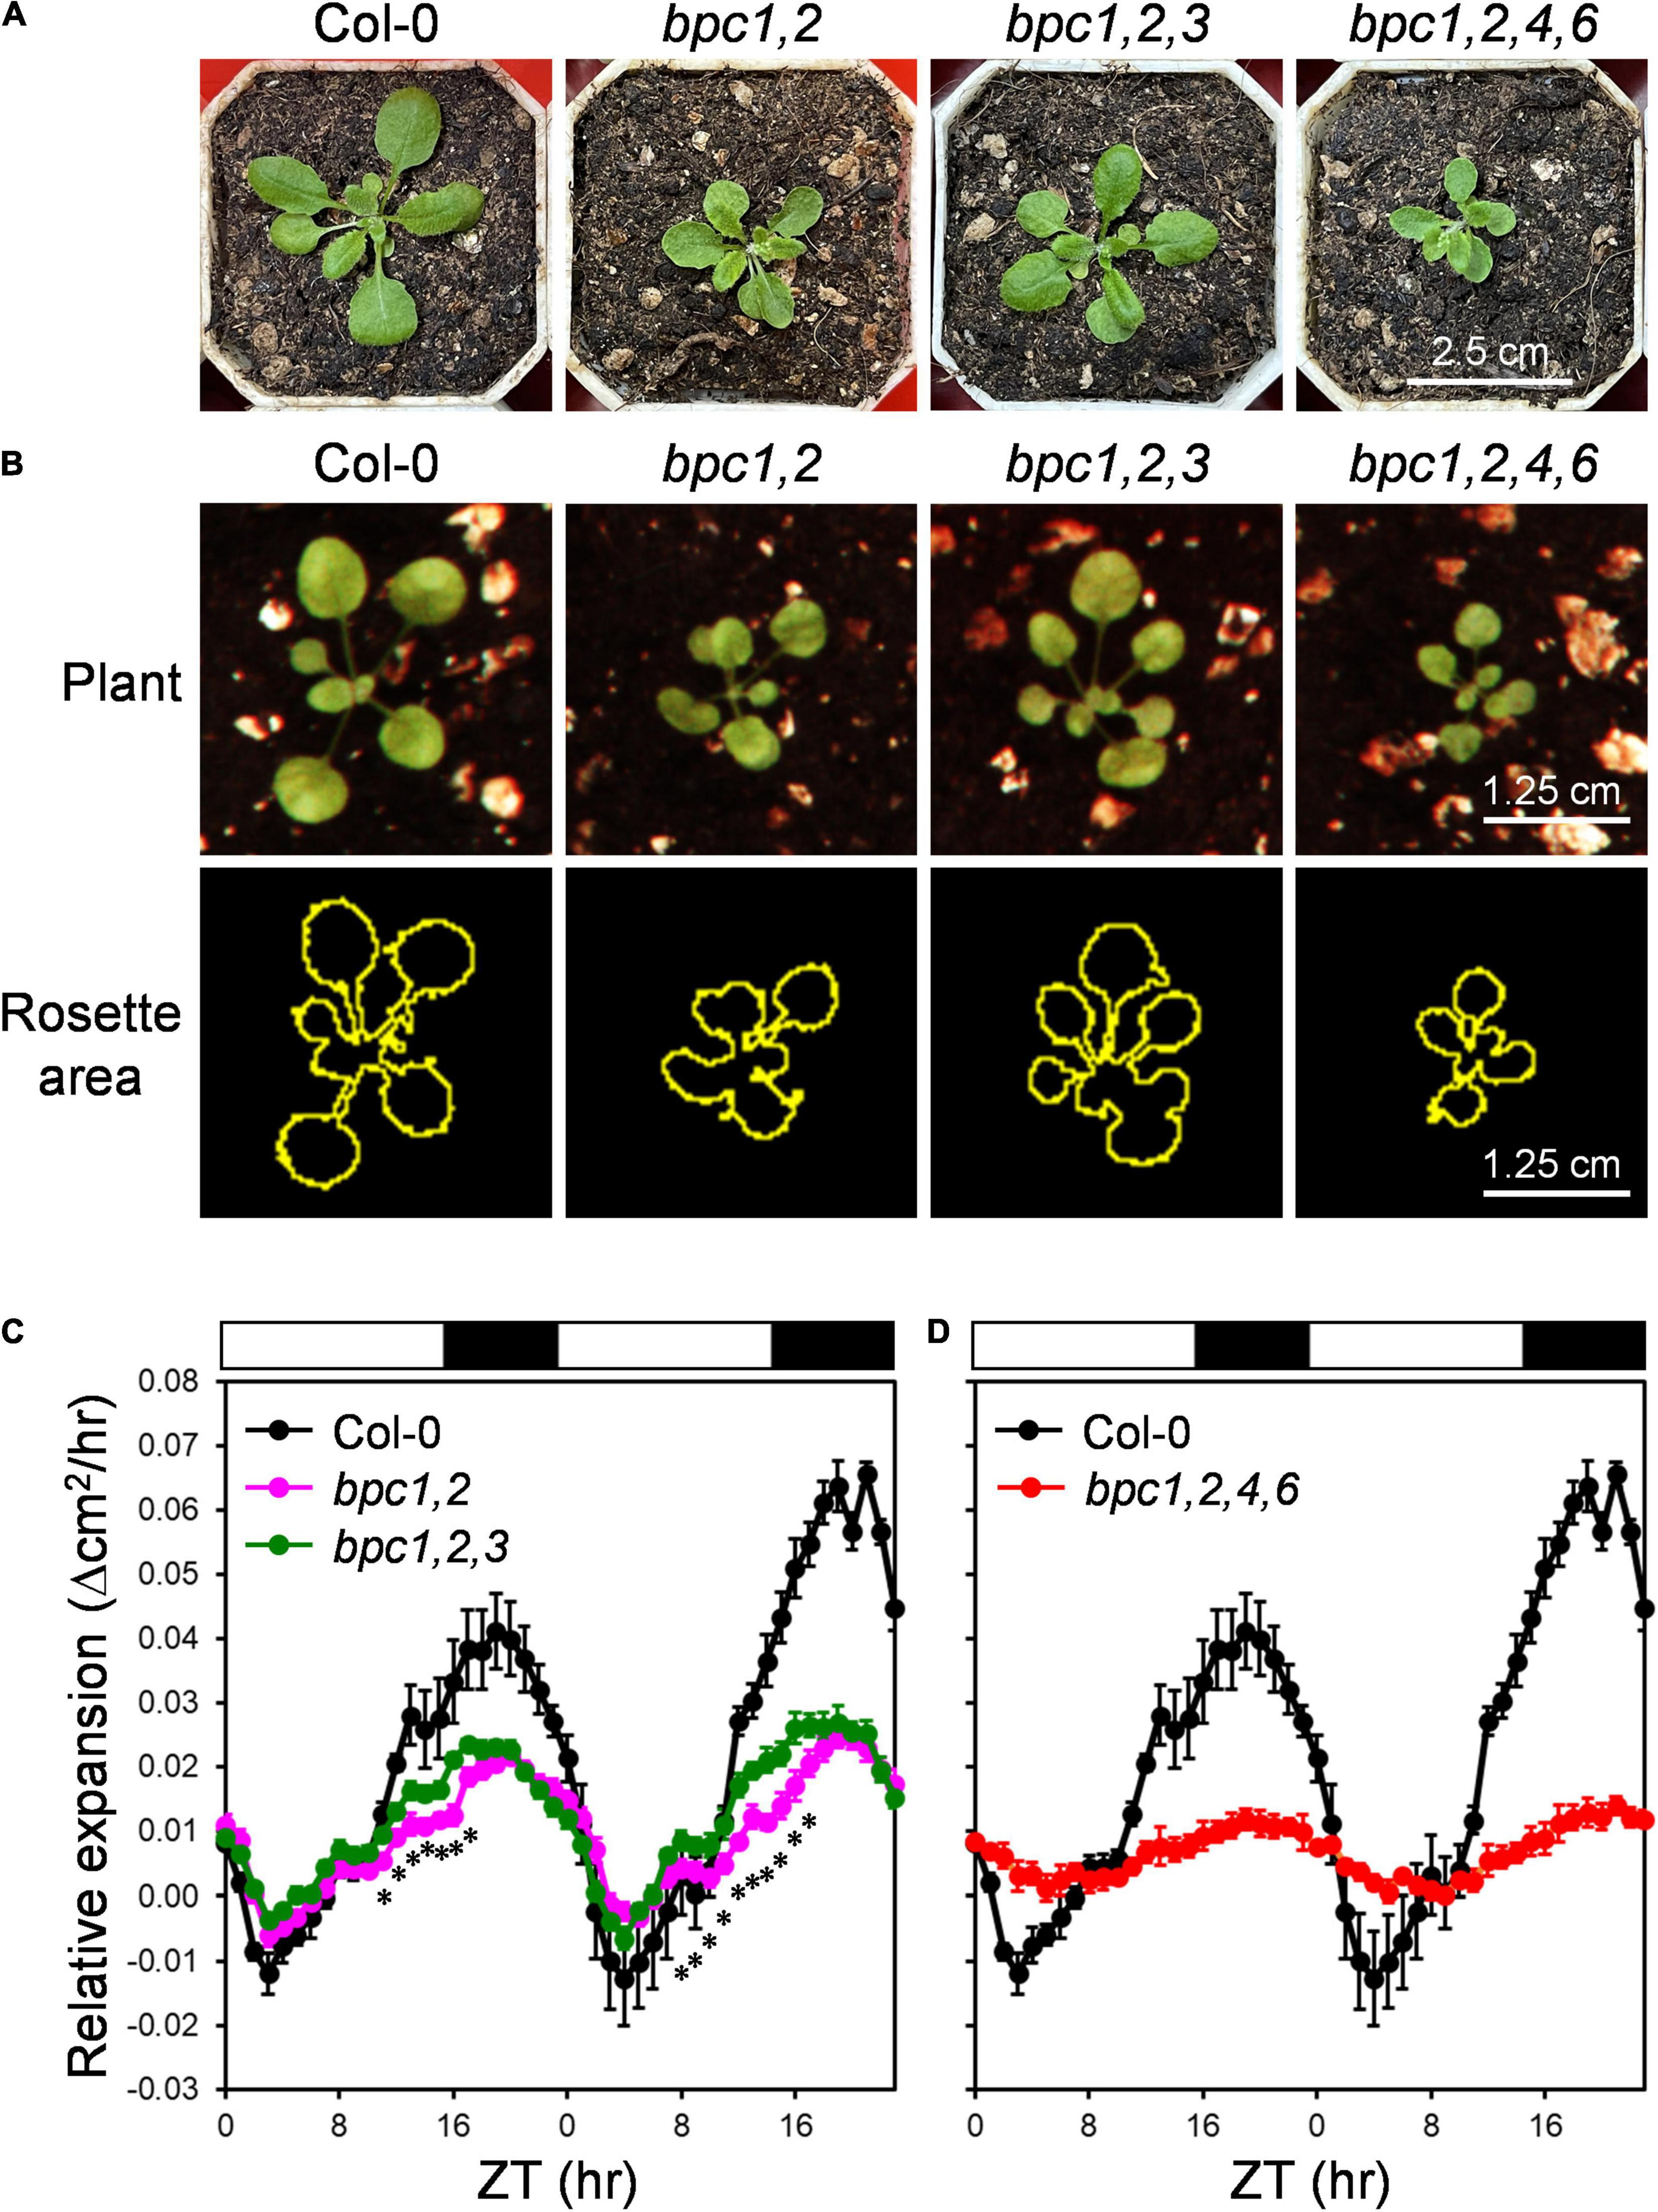
Figure 1. BPC3 antagonized the circadian growth during the vegetative stage. (A) Plants representing wild-type (Col-0), bpc1,2, bpc1,2,3 and bpc1,2,4,6 grown under the long-day condition (16-h light/8-h dark, 45–55 mmol m–2 s–1) was photographed on day 21 for the size comparison. (B) The hour-growth of the indicated plants was image recorded (upper panel) and outlined by using the tracing tool of ImageJ 1.53c (yellow outlines, lower panel) to project the rosette area. (C,D) Relative expansion of rosette area was measured for each plant line from zeitgeber time 0 (ZT 0) on day 14 to ZT 23 on day 15 based on pixel quantitation of plant outlines. Rosette area across ZT points with a 10-ZT sliding window was averaged to lower leaf movement and nutation effects on the area. Data are mean ± S.E. (n = 7–9). Asterisks indicate ZTs on which the expansion rate of bpc1,2,3 was significantly different from that of bpc1,2 (Student’s t-test; *P < 0.01; n = 9). The expansion rate of Col-0 was duplicated in (C,D) for comparisons with bpc mutantsin plot charts. White and black bars indicate the light and dark periods.
BPC Members Are Antagonized Mutually in BPC Transcriptions
It has been shown the promoter activity of BPC3 is low in vegetative tissues where the other BPCs are expressed (Monfared et al., 2011), and the transcript level of BPC3 is elevated in bpc1,2,3,4,6 mutant roots (Shanks et al., 2018). These together implied BPC1, BPC2, BPC4, BPC6, and BPC3 itself could repress the expression of BPC3. We inspected if the transcript level of BPC3 would be altered in bpc4 and bpc1,2,4,6 mutant plants in vegetative tissues aboveground. The transcript level of BPC3 was increased in bpc4 and further enhanced in the quadruple bpc1,2,4,6 mutant (Figure 2A and Supplementary Figure 1A). Moreover, such antagonization of BPC3 was also conducted by BPC3 itself. The expression of BPC3 was increased in bpc1,2 (Figure 2B and Supplementary Figure 1B); once combined with the nonsense bpc3-1 mutation, the transcript level of bpc3-1 allele was further enhanced in bpc1,2,3 (Figure 2B and Supplementary Figure 1B). This indicated that BPC3 was involved in transcriptional repression of BPC3 itself. The antagonistic function of BPC members on BPC3 expression showed a dosage dependence under the vegetative phase (Figure 2 and Supplementary Figure 1). Taken together with the circadian growth results, BPC members were involved in plant growth promotion, at least if not all, via antagonizing the expression of BPC3.
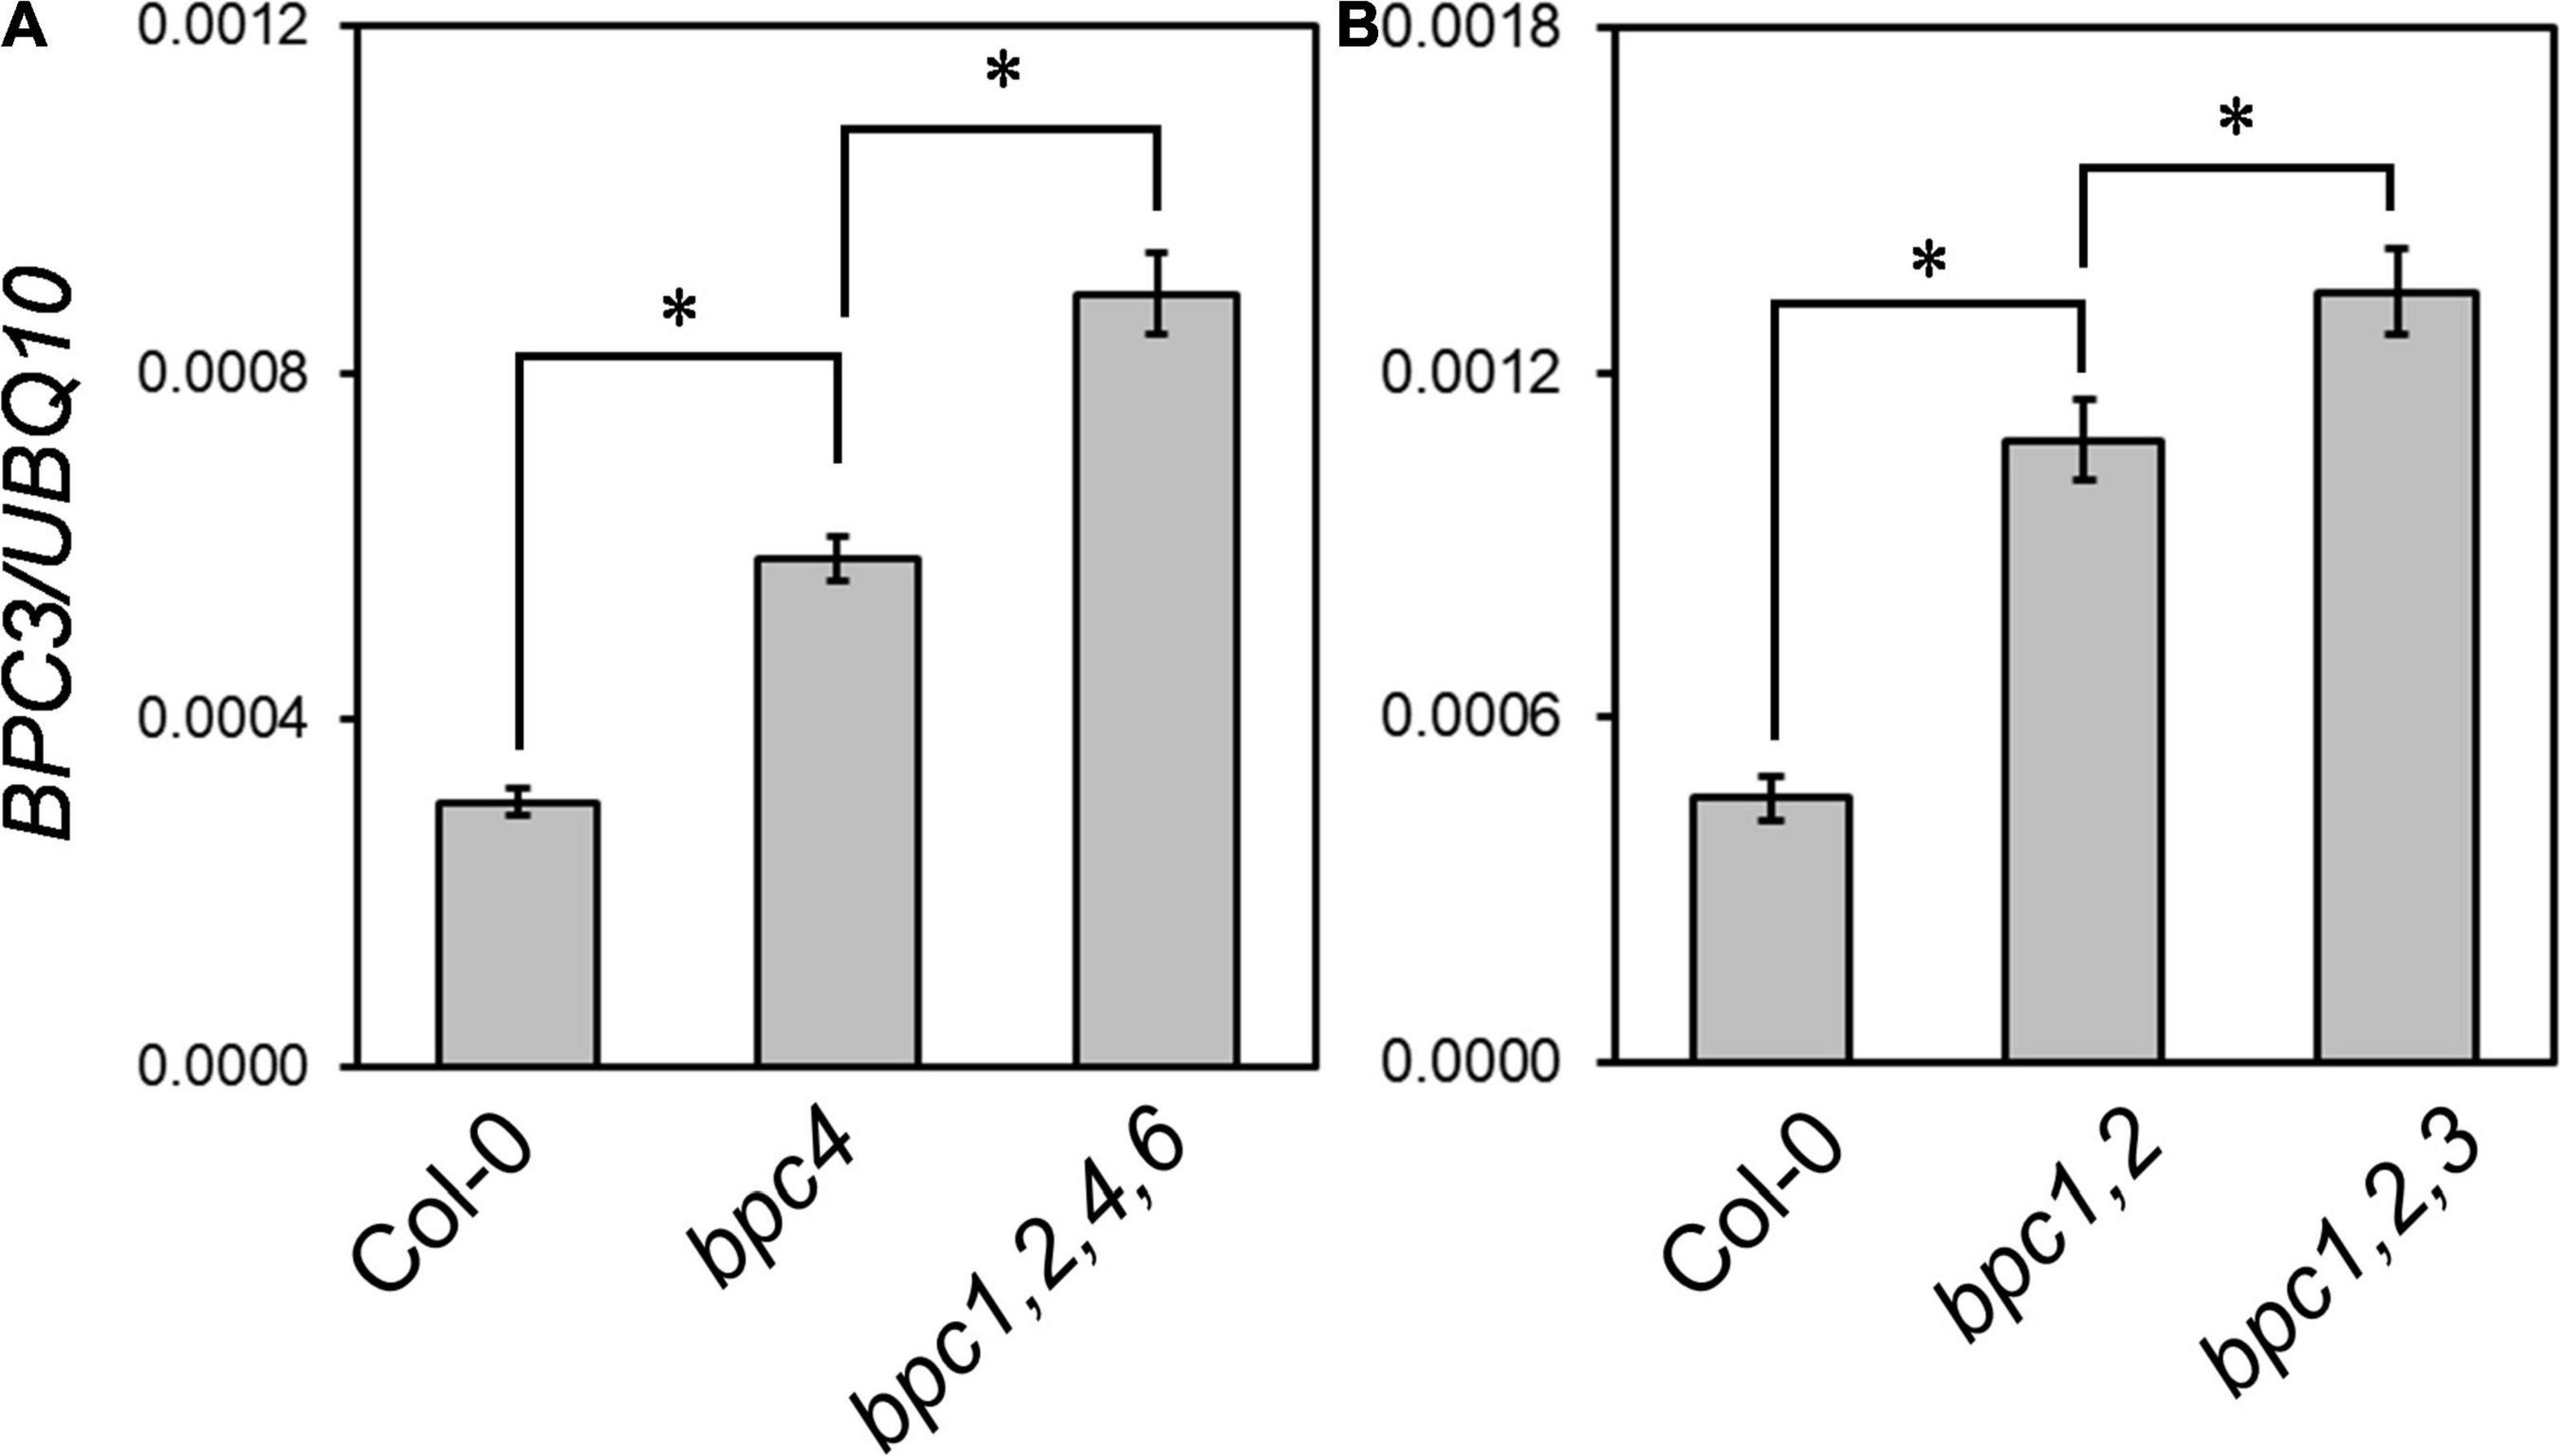
Figure 2. BPC family members antagonize the transcript level of BPC3. The expression levels of BPC3 were determined in 18-day-old plants of Col-0, bpc4, bpc1,2,4,6 (A), Col-0, bpc1,2, and bpc1,2,3 (B) by using qRT-PCR analyses with the amplicon “b” of BPC3 shown in Figure 3A. Data are mean ± S.E. (n = 3 technical replicates, one independent biological replicate was presented in Supplementary Figure 1). Asterisks indicate BPC3 transcript levels of different genetic backgrounds were significantly different (Student’s t-test; *P < 0.01).
DNA affinity purification and sequencing (DAP-seq; O’Malley et al., 2016) has shown that BPC4 and BPC1 potentially bind to the upstream region of the BPC3 coding region (Supplementary Figure 2A). In the transcriptomic analyses of a public database (Winter et al., 2007), the transcript of BPC4 is most abundant compared with those of functional class I and II BPC members across most developmental conditions (Supplementary Figure 3). We applied the XVE chemical system (Zuo et al., 2006) for BPC3 and BPC4 coding DNA sequences (CDS) induction (XVE:BPC3-HA and XVE:BPC4-HA) to examine their antagonistic functions on each other under the wild-type background (CDS, Figure 3A). The transgenic plants of XVE:BPC3-HA and XVE:BPC4-HA were treated with a series of 17-β-estradiol concentrations for 1 day, and the protein expression was determined (Supplementary Figure 4). To obtain an overview of the BPC3 and BPC4 effects on BPC3/BPC4 expression, we profiled the transcript levels of BPC3/BPC4 every 3 h spanning 24 h after 1-day induction.
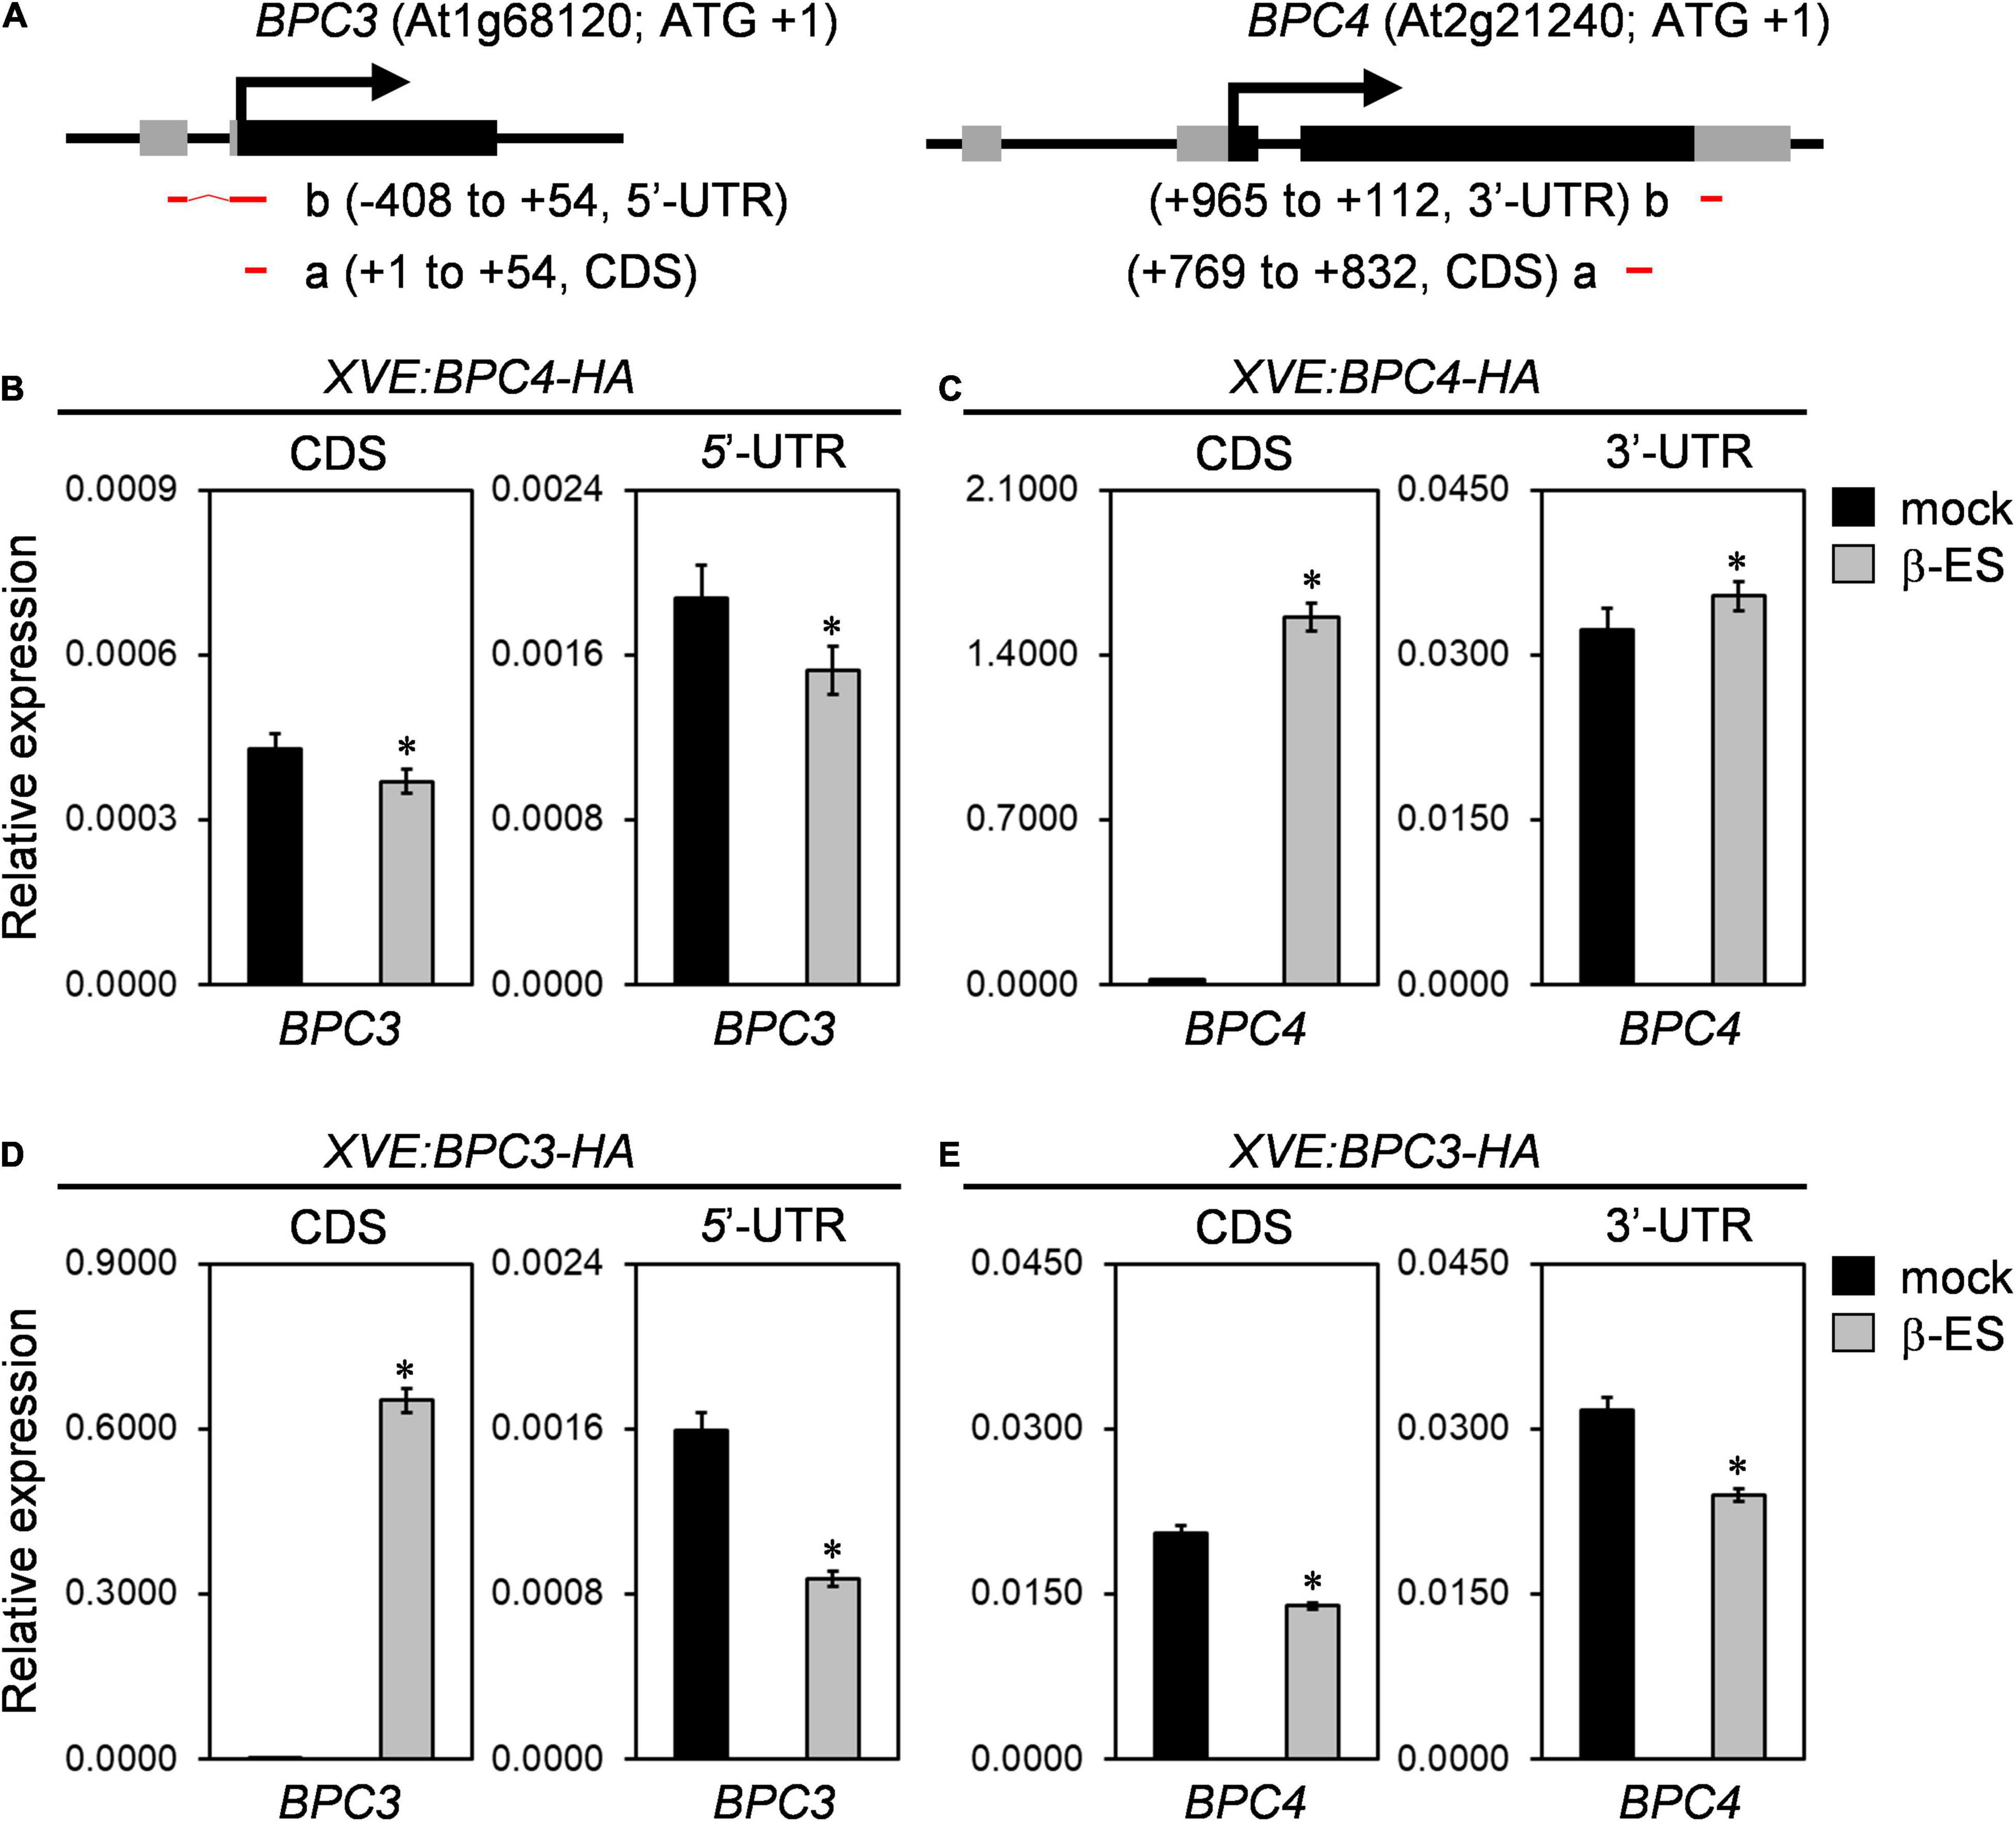
Figure 3. BPC members are mutually antagonized. (A) Diagrams of gene structures of BPC3 (left panel) and BPC4 (right panel). Translational start and exons are marked with arrows and boxes. Black and gray boxes illustrate the coding region sequence (CDS) and untranslated regions (UTR). Red horizontal bars “a” and “b” illustrate amplicons of qPCR. Numbers denoted in parentheses are positioned relatively to translation start site + 1 for amplicons at CDS or UTR. The illustrated BPC3 5′-UTR of the gene structure is revealed by the EST clone “M44A7” but not shown in the gene model of TAIR10. (B–E) The inducible lines of XVE:BPC4-HA (B,C) and XVE:BPC3-HA (D,E) were treated with 0 (mock) or 50 μmM 17-β-estradiol (β-ES) for 24 h and harvested every 3 h for the next day. The transcription levels of BPC4 (C,E) and BPC3 (B,D) relative to that of UBQ10 were analyzed by qRT-PCRs with amplicons located at the indicated CDS or UTR. Data are mean ± S.E. (n = 27, each data includes 3 technical repeats of 9 biological replicates collected every 3 h across the second day after induction; corresponding individual time points and an independent biological replicate are presented in Supplementary Figure 5). Asterisks indicate transcript levels were significantly changed by β-ES treatments (Student’s t-test; *P < 0.05).
The induction of BPC4-HA overexpression slightly compromised the overall level of BPC3 transcript level at both CDS and 5′-UTR (Figure 3B and Supplementary Figures 5A,B). Notably, the BPC3 decrease under BPC4-HA induction was not tremendous. This could be because the BPC redundancy (Monfared et al., 2011; Shanks et al., 2018) in the transgenic lines is functional. Due to that DAP-seq database shows that the BPC4 locus is a potential target of BPC1 (Supplementary Figure 2B); we also examined if BPC4 regulated BPC4 expression. Because the induction of transgenic BPC4-HA would mask the CDS of the endogenous BPC4 profile, we analyzed the endogenous 3′-UTR of the BPC4 transcript, which was not included in the XVE:BPC4-HA construct. The transcript level of the endogenous BPC4 affected by BPC4-HA induction was minor (Figure 3C and Supplementary Figures 5C,D).
The increase in BPC3 transcript level in bpc1,2,3 (Figure 2B and Supplementary Figure 1B) and bpc1,2,3,4,6 (Shanks et al., 2018) indicated that BPC3 could antagonize its expression. We next tested if BPC3 autoregulated BPC3. Upon the induction of BPC3-HA, the endogenous BPC3 transcript level was assessed by the amplicon of 5′-UTR. The endogenous BPC3 was indeed repressed by BPC3-HA (Figure 3D and Supplementary Figures 5E,F), indicating that BPC3 expression was moderated via autoregulatory machinery. Interestingly, the transcript level of BPC4 was also repressed by BPC3-HA (Figure 3E and Supplementary Figures 5G,H), indicating that BPC3 and BPC4 were mutually antagonistic. The downregulation of the endogenous BPC3 5′-UTR by BPC3-HA was more substantial than that by BPC4-HA (Figures 3B,D and Supplementary Figures 5A,B,E,F). This suggested that BPC3 was a more stringent repressor than BPC4 in repressing BPC3.
The Oscillation of the Circadian Clock Is Hampered in bpc1,2,4,6
Since the diel growth of bpc mutants was impeded with lower amplitudes under day–night cycles, we next tested if the circadian clock was affected in the bpc1,2,4,6 mutant. Two representative morning and evening genes, CCA1 and ELF4, were first examined under the day–night cycle. The expression peaks of CCA1 and ELF4 were lately shifted by approximately 3 h (Figures 4A,B and Supplementary Figures 6A,B). The diel changes of CCA1 and ELF4 suggest that the oscillation of the circadian clock could be altered in the quadruple mutant. To clarify this, we characterized the clock oscillation by profiling multiple clock genes in the mutant under the free-running condition. The expression phases of CCA1 and ELF4 were indeed delayed in bpc1,2,4,6 (Figures 4C,D and Supplementary Figures 6C,D). In addition to CCA1 and ELF4, genes consecutively phased spanning from morning to night, including PRR9, PRR7, PRR5, GI, PRR3, and TOC1, were phase-delayed in bpc1,2,4,6 (Figures 4E–J and Supplementary Figures 6E–J). The period length of the circadian clock in the mutant was further analyzed by using the mFourfit method in the BioDare system (Zielinski et al., 2014). Period lengths of genes phased before subjective dusk, including CCA1, PRR9, PRR7, and PRR5, were prolonged (Figure 5A). However, among genes phased after subjective dusk, GI was the only gene prolonging period length. Period lengths of PRR3, ELF4, and TOC1 in bpc1,2,4,6 were not significantly changed (Figure 5B). This revealed that BPCs functioned on the circadian clock in a gene-specific manner.
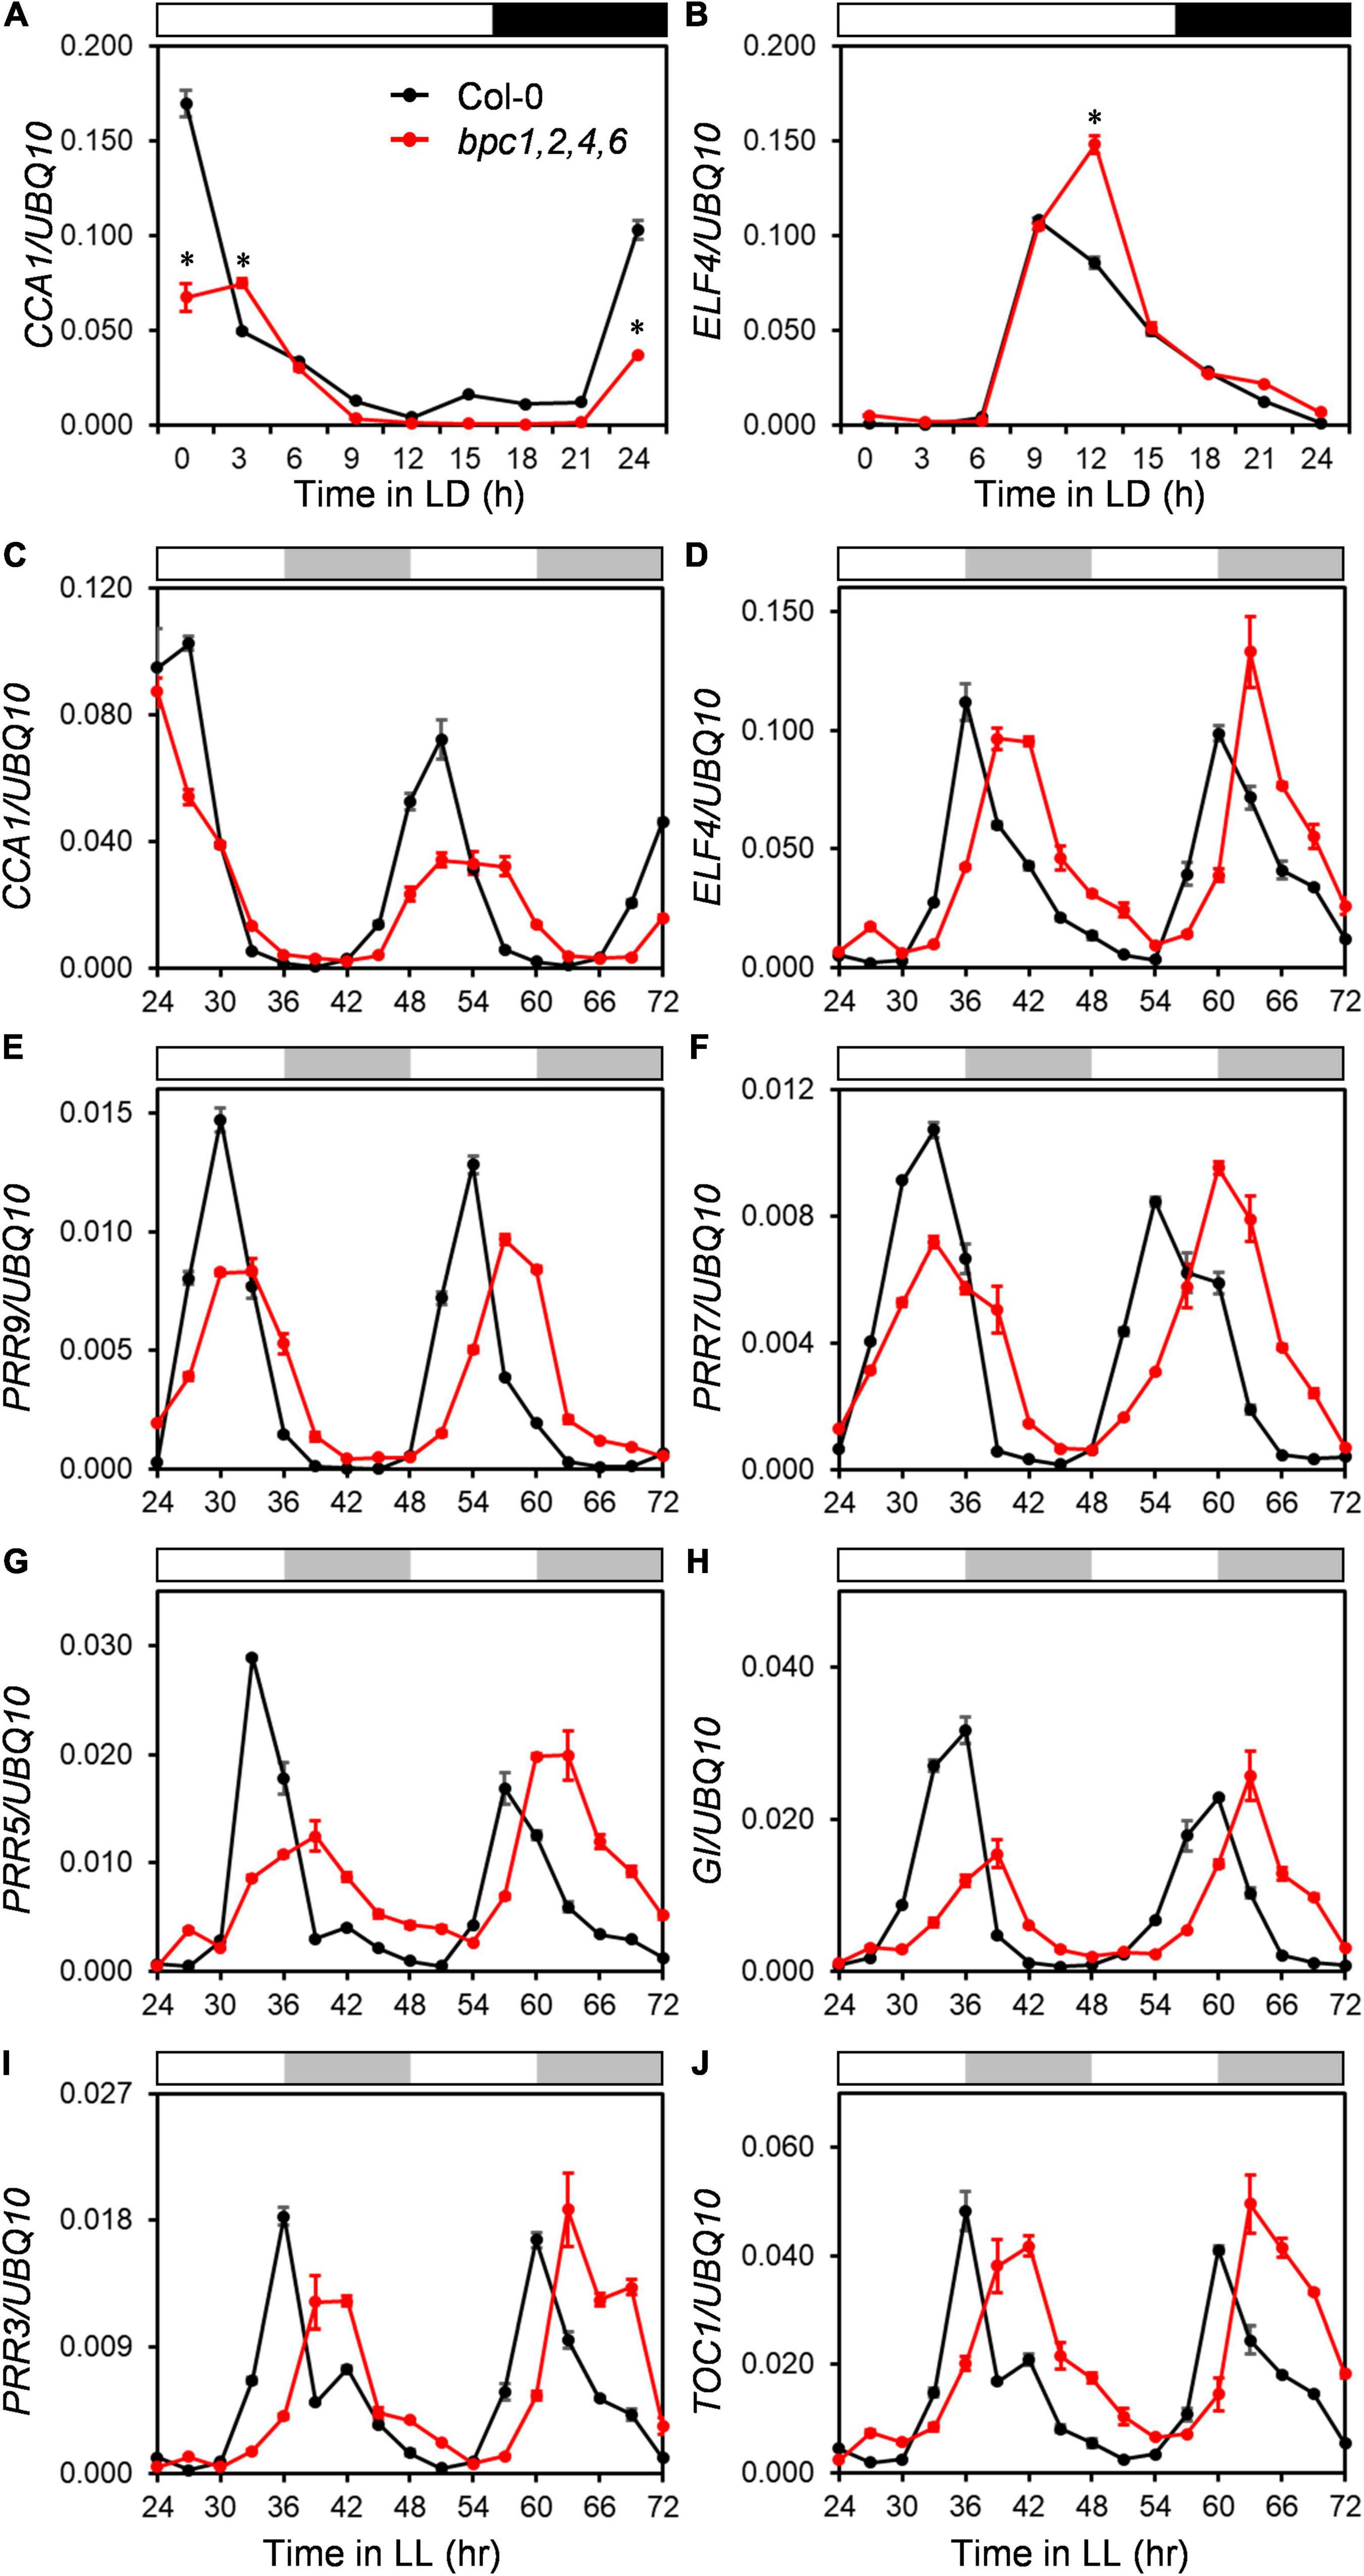
Figure 4. The expression of clock genes are phase-delayed in the bpc1-1 bpc2 bpc4 bpc6 mutant. (A,B) Eighteen-day-old wild-type (Col-0) and bpc1-1 bpc2 bpc4 bpc6 (bpc1,2,4,6) plants grown under long day (16-h light/8-h dark) were harvested at indicated ZT for profiling circadian clock representative morning gene CCA1 (A) and evening gene ELF4 (B). qRT-PCR analyses were conducted, data are mean ± S.E. (n = 3 technical replicates). Asterisks indicate CCA1 transcript levels were significantly altered in mutants (Student’s t-test; *P < 0.01). (C–J) Eighteen-day-old plants grown under midday (12-h light/12-h dark) were transferred to the constant light (LL) and harvested at 3-h intervals from LL24h to LL72h for CCA1 (C), ELF4 (D), PRR9 (E), PRR7 (F), PRR5 (G), GI (H), PRR3 (I), and TOC1 (J) profiling by qRT-PCR analyses. Data are mean ± S.E. (n = 3 technical replicates; one independent biological replicate was presented in Supplementary Figure 6). White, black, and gray bars denote the light, dark, subjective light, and subjective darkness, respectively.
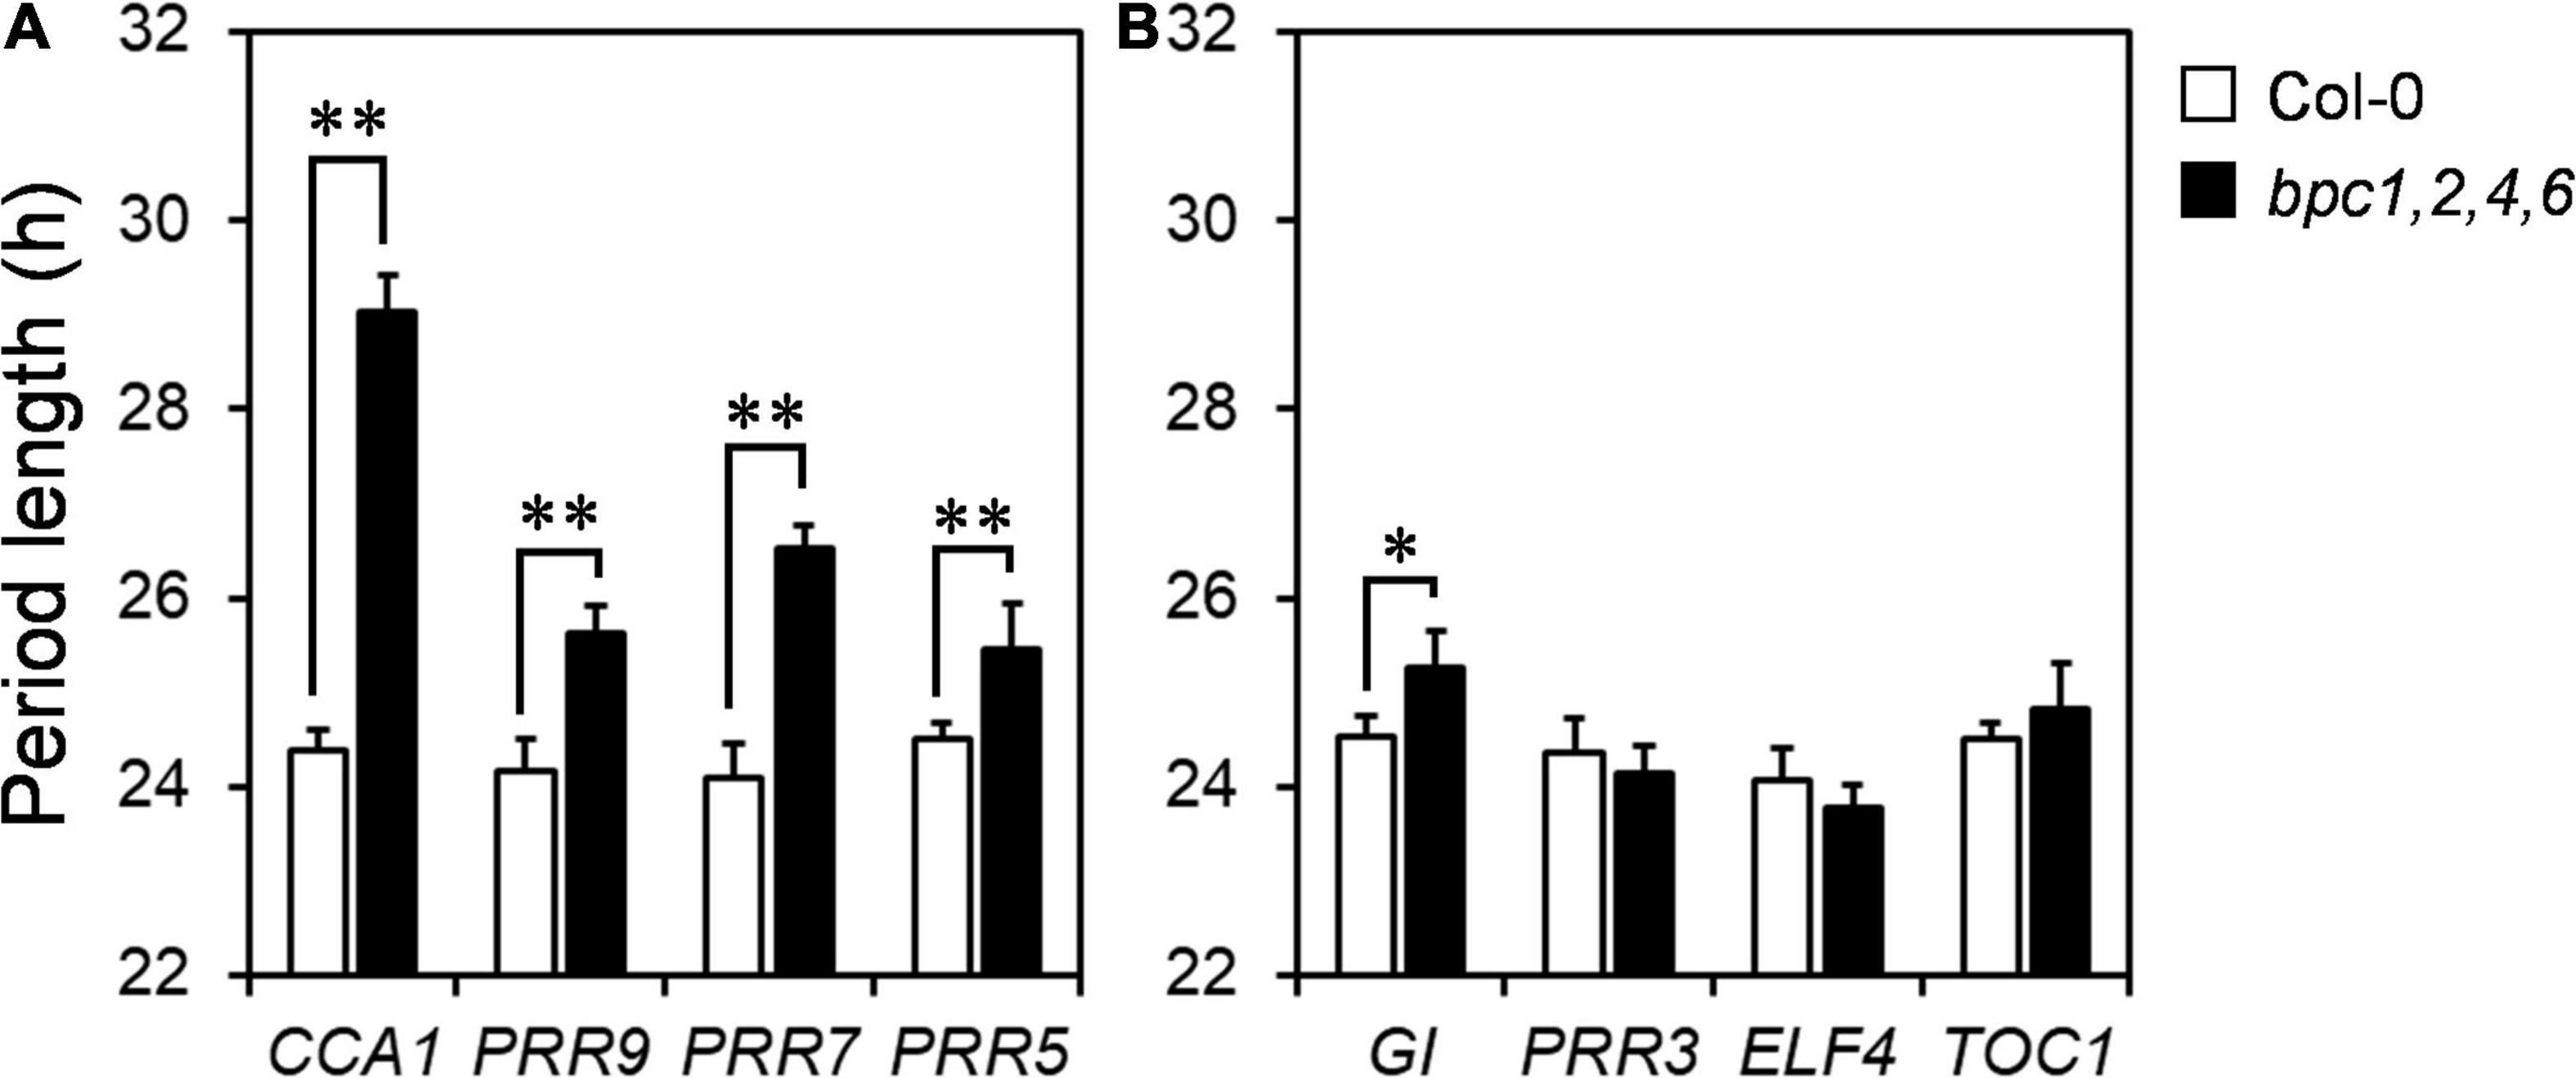
Figure 5. Clock genes are phase delayed in bpc1-1 bpc2 bpc4 bpc6. Period lengths of genes phased before (A) and after evening (B) under constant light were calculated by using MFourFit deposited at BioDare2 (Zielinski et al., 2014; https://biodare2.ed.ac.uk/). Data are mean ± S.E. (n = 6, the data include three technical repeats of two independent biological replicates). Asterisks indicate period length was significantly delayed in bpc1,2,4,6 mutant (Student’s t-test; **P < 0.01, *P < 0.05).
BPCs Are Involved in Clock Regulation
One possibility that phase-delayed in bpc1,2,4,6 could be due to increased BPC3 expression, suggesting that BPC3 was a repressor for clock regulation. We tested if CCA1 could be repressed transcriptionally by BPC3. The overexpression of BPC3-HA was induced, and RNA samples were harvested at 3-h intervals across 24–48 h induction time under the free-running condition. The expression of CCA1 was significantly compromised under the BPC3-HA induction (Figure 6A and Supplementary Figure 7A), indicating that BPC3 was indeed capable of CCA1 repression. The repression of CCA1 under BPC3-HA induction was consistent with the anticorrelation between BPC3 and CCA1 transcript levels in bpc1,2,4,6. The decrease of CCA1 expression in bpc1,2,4,6 was also possibly due to a lack of activation by BPCs except for BPC3. We introduced the overexpression of BPC4-HA to test this hypothesis. Instead of being activated, the expression of CCA1 was slightly repressed under the induction of BPC4-HA overexpression (Figure 6B and Supplementary Figure 7B). This indicates that the role of BPC4 in CCA1 mediation should be negative instead of positive. Such a BPC4-repressive effect was consistent with its overlapping role with BPC6 in class II BPC-dependent recruitment of polycomb-repressive complexes (PRCs) for transcription repression (Hecker et al., 2015).
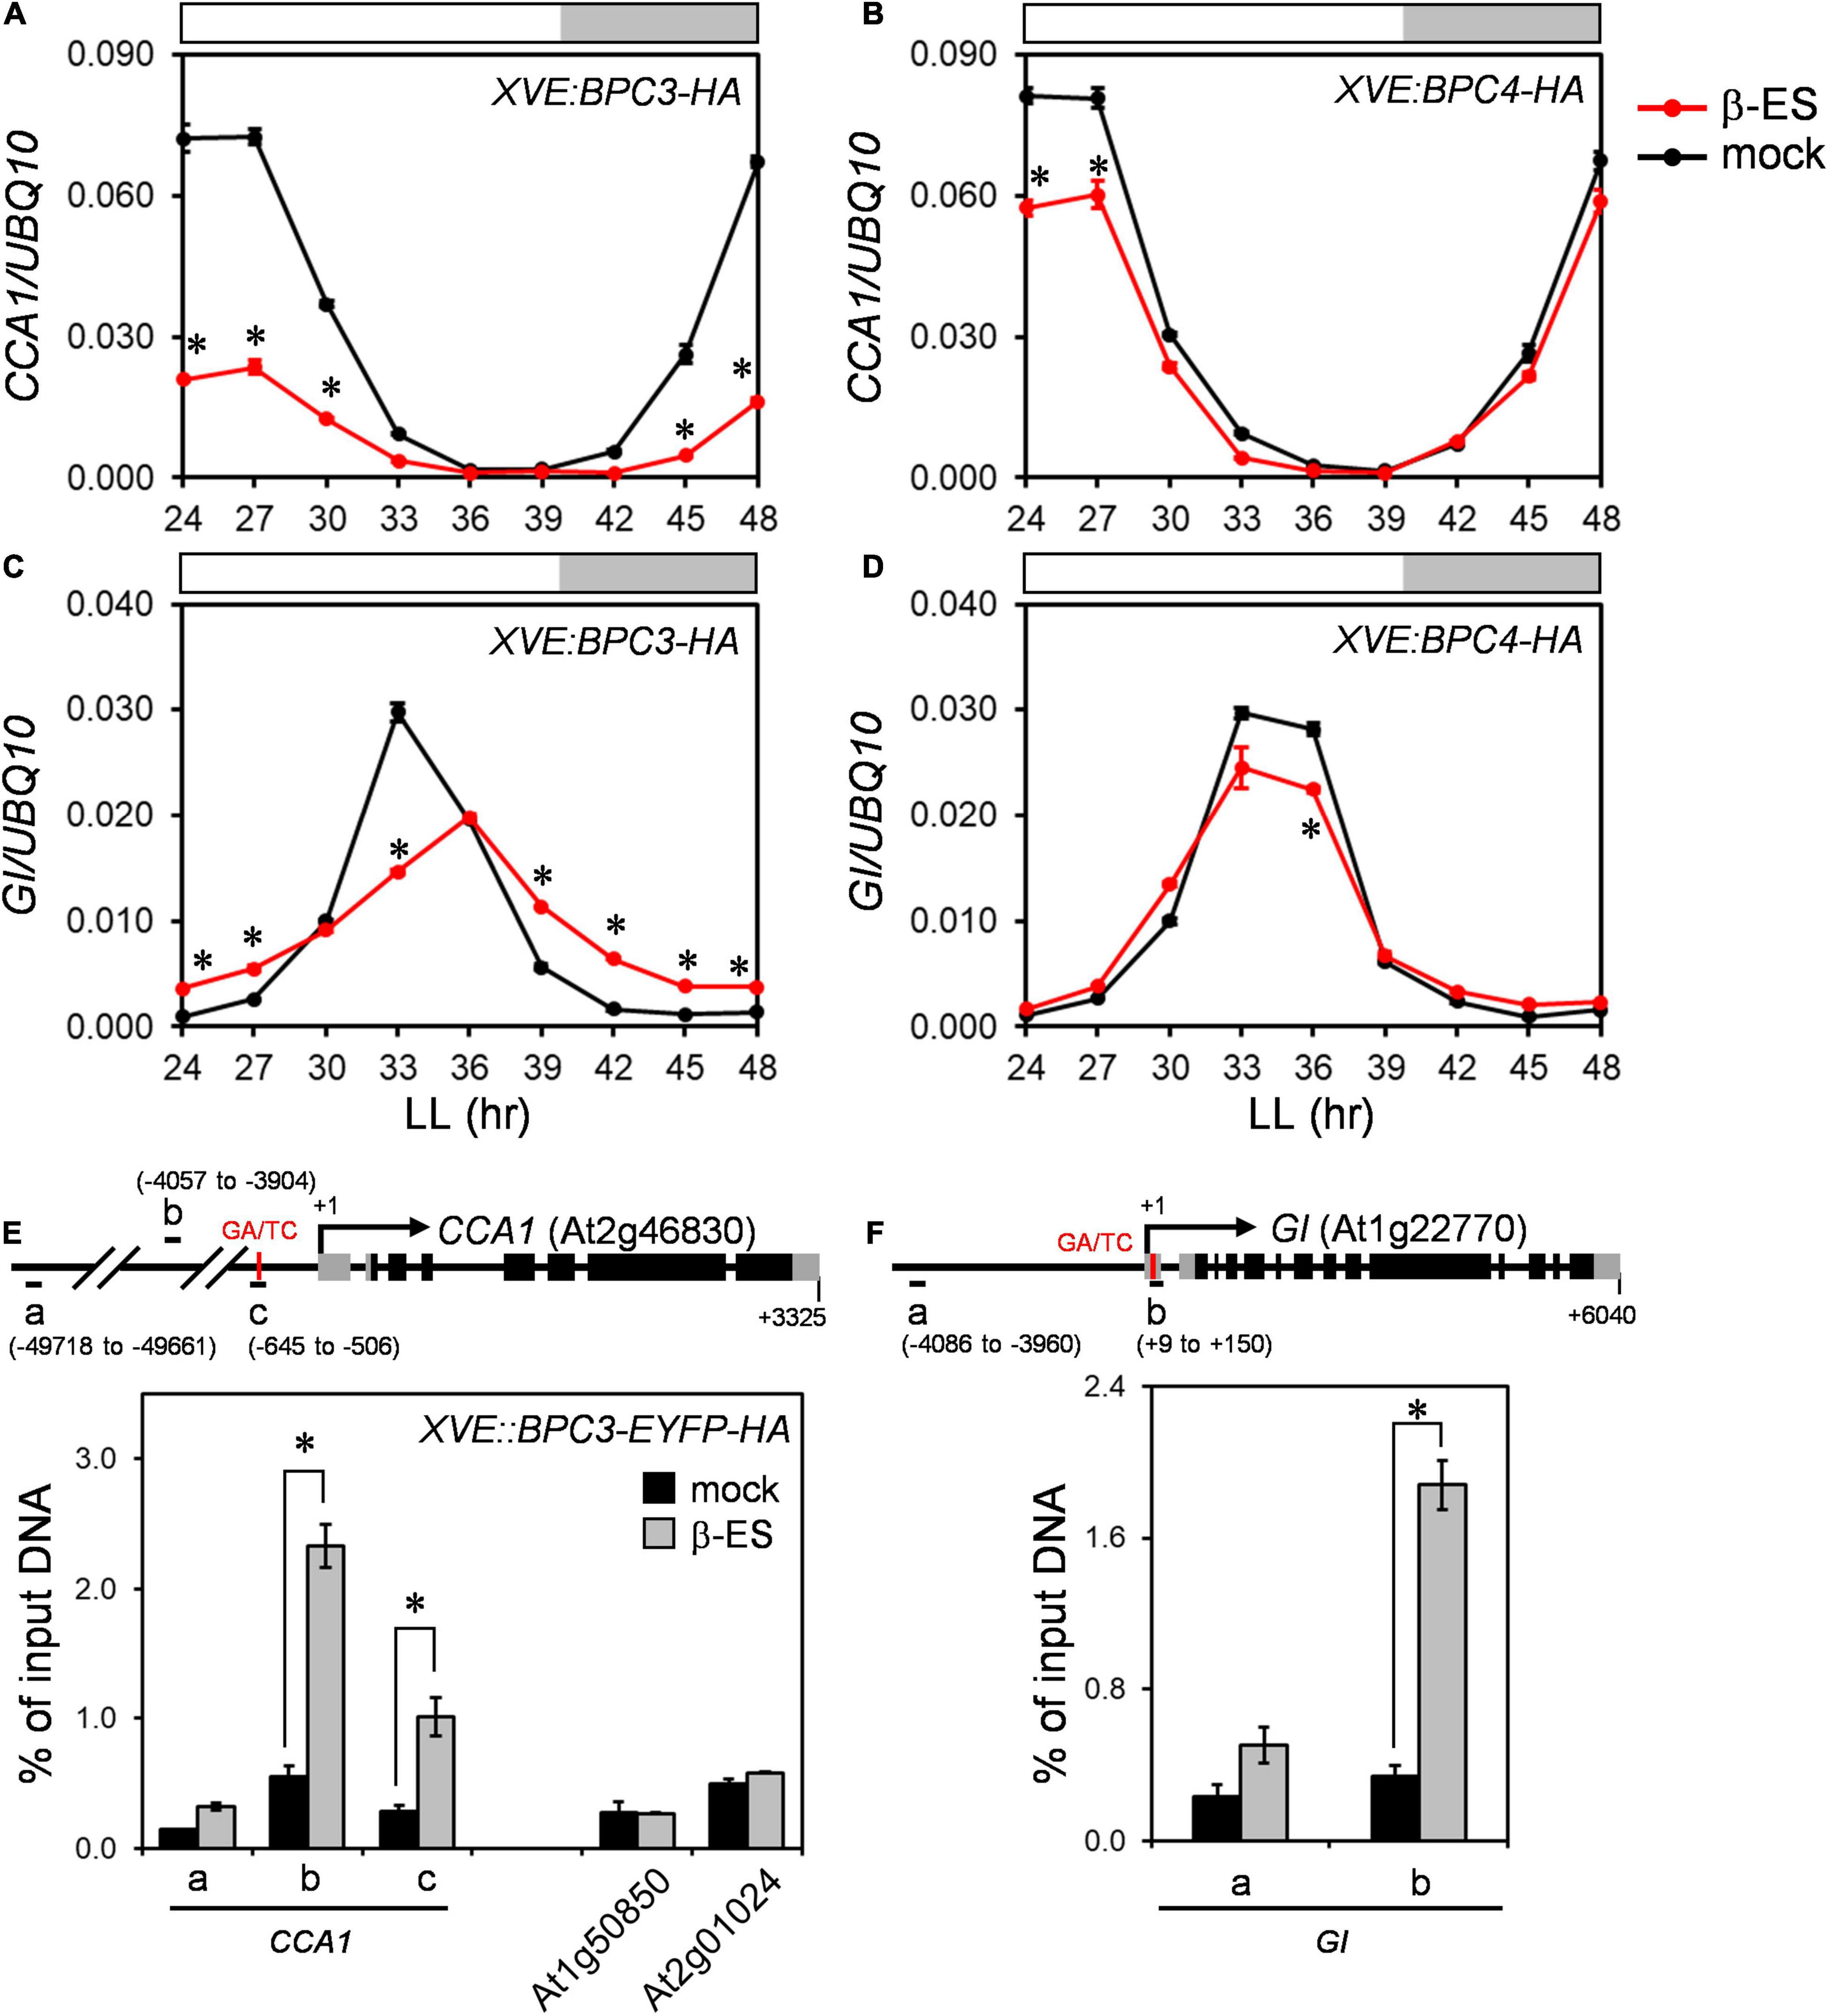
Figure 6. BPC3 is upregulated in the bpc1,2,4,6 and is a negative regulator for CCA1. (A–D) Twelve-day-old plants of XVE:BPC3-HA and XVE:BPC4-HA transgenic lines were treated with 0 (mock) or 50 μM β-estradiol (β-ES) for 24 h when released to LL and harvested at indicated times for profiling CCA1 (A,B) and GI (C,D) by qRT-PCR analyses. Data are means ± S.E. (n = 3 technical replicates; one independent biological replicate was presented in Supplementary Figure 7). Asterisks indicate transcript levels were significantly changed by the β-ES treatment (Student’s t-test; *P < 0.05). (E) BPC3 was associated with the CCA1 promoter in vivo. Leaves of 22-day-old XVE:BPC3-EYFP-HA transgenic plants grown under LD were treated with 0 (mock) or 50 μM β-estradiol at ZT9 for one day and fixed to conduct ChIP-qPCR analyses by using an anti-HA antibody. The diagram shows the translation start site and exons of CCA1 gene structure and upstream region. Gray and black boxes represent untranslated and coding regions, respectively. The amplicons “a,” “b,” and “c” for ChIP-qPCR are indicated by horizontal black bars. Numbers indicate the positions relative to the transcriptional start site + 1 of CCA1. Data are mean ± S.E. (n = 3). Transposable elements At1g50850 and At2g01024 were used as negative controls. Asterisks indicate that amplicons were at least three-fold enriched by the BPC3-EYFP-HA induction significantly (Student’s t-test; *P < 0.01). (F) Chromatin immunoprecipitation qPCR was conducted as described in panel (E). The diagram shows GI gene structure with the amplicons “a” and “b” for ChIP-qPCR assays. Data are mean ± S.E. (n = 3). The asterisk indicates that the amplicon was significantly enriched upon the BPC3-EYFP-HA induction (Student’s t-test; *P < 0.001). An independent biological replicate conducting the GA/TC association tests was shown in Supplementary Figure 7F.
Consistent with weak repression conducted by BPC4-HA on BPC3, we again observed that the induction of BPC4-HA overexpression had just mildly repressed CCA1. Perhaps, endogenous BPC4 might merely leave a subtle extent for transgenic BPC4-HA to repress CCA1. Therefore, the induction of BPC4-HA could not further repress CCA1 drastically. If this was the case, lacking endogenous BPC4 should increase the expression level of CCA1. We examined the CCA1 expression profile in the bpc4 mutant. The expression of the CCA1 level in bpc4 was compromised slightly (Supplementary Figure 7C). This indicated that the endogenous BPC4 unlikely repressed CCA1 significantly. Rationally, the decrease of CCA1 in bpc4 might be due to the ectopic expression of BPC3 in the bpc4 mutant (Figure 2A and Supplementary Figure 1A). Taken together, BPC4 was a less stringent repressor than BPC3 for CCA1 regulation.
The low expression of CCA1 shortens the clock period (Lu et al., 2009). However, the repression of CCA1 in bpc1,2,4,6 prolonged the period (Figures 4A,C, 5A and Supplementary Figures 6A,C). This might be because CCA1 was not the only clock gene repressed by BPC3. The period length analysis showed that the period of GI expression was a dusk gene lengthened in bpc1,2,4,6 (Figures 4H, 5B and Supplementary Figure 6H). We next examined the GI expression under the BPC3-HA induction and found that the peak of GI was indeed compromised and phase-delayed by BPC3-HA (Figure 6C and Supplementary Figure 7D). The induction of BPC4-HA overexpression only slightly compromised the GI peak (Figure 6D and Supplementary Figure 7E). Consistently with the regulation of CCA1, BPC3 and BPC4 would repress GI with different stringencies, indicating that BPCs regulate the circadian clock via multiple genes. Moreover, the simultaneously repressed GI would lengthen the circadian clock period (Fowler et al., 1999). This may best explain the long period caused by the ectopic BPC3 in bpc1,2,4,6 and by BPC3-HA induction while CCA1 was repressed.
BPCs Are Involved in CCA1 and GI Regulation
A cis-element sharing pattern of the “AGARRGARRRAGADR” element of the plant-specific GAGA-motif has been identified in the region (–716 to –704) upstream of the CCA1 transcriptional start site (Gendron et al., 2012). Besides, another potential GAGA-motif comprising a quintuple repeat of GA/TC dinucleotide can be found in the region 122 bp (5 × GA, –581 to –570) next to the above GAGA-motif. We asked if BPC3 directly targeted CCA1 for clock regulation in vivo. An inducible construct of EYFP-HA-tagged BPC3 (BPC3-EYFP-HA) was generated to track the expression of BPC3 in cells. Upon the induction, the BPC3-EYFP-HA protein was detected with the predicted molecular weight in transgenic plants (Supplementary Figure 8A). The BPC3-EYFP-HA showed a punctate pattern across leaf blades (Supplementary Figure 8B), constituted by the nucleus locating signal of BPC3-EYFP-HA under the cellular scope (Supplementary Figure 8C). Chromatins targeted by BPC3-EYFP-HA were then immunoprecipitated with anti-HA antibody and used for the qPCR analysis. The amplicon “c” (–645 to –506 upstream of the transcription start site + 1 of CCA1) comprising the annotated quintuple GA/TC-repeat was enriched only when BPC3-EYFP-HA was induced (Figure 6E and Supplementary Figure 8D). BPC3 did not significantly associate with a remote region upstream of the CCA1 promoter (amplicon “a,” –49718 to –49661, Figure 6E), nor with two transposable element genes, At1g50850 and At2g01024 (Figure 6E). These together indicated that BPC3 specifically targeted the CCA1 promoter in vivo.
Strikingly, amplicon “b” (–4057 to –3904), which is 3.3-kb upstream from the putative GAGA-motif, was also highly enriched in the BPC3 associated chromatin (Figure 6E), 1 kb from the nearest pentamerous GA/TC-dinucleotide (–5077 to –5068). The DNA affinity purification and sequencing (DAP-seq; O’Malley et al., 2016) identified amplicon “b” showing DAP-seq binding signals by BPC4 (Supplementary Figure 8E), suggesting the amplicon includes bona fide BPC target sequences. Our results indicated that BPC3 negatively regulated CCA1 via direct promoter targeting. A GAGA-motif can be identified at the 5′-UTR of GI, which was also targeted by BPC4 in public DAP-seq data (Supplementary Figure 8F). The results of our ChIP-qPCR assays also showed that BPC3 directly targeted a region harboring the GAGA-motif located at 5′-UTR of GI but not a 4-kb upstream region (Figure 6F and Supplementary Figure 8D). Collectively, CCA1 and GI were targeted by BPC3.
The Induction of BPC3 Overexpression Affects a Subset of BPCs
Even though the phases and amplitudes of CCA1 and GI were delayed and compromised in bpc1,2,4,6 and under BPC3-HA overexpression (Figures 4, 6), the expression profiles of PRR9 and TOC1 were repressed by BPC3-HA or BPC4-HA induction without significantly delaying expression peaks (Figures 7A–D and Supplementary Figures 9A–D). The induction of BPC3-HA overexpression under a wild-type background did not fully replicate clock defects shown in the bpc1,2,4,6 quadruple mutant. Therefore, the ectopic expression of BPC3 was not sufficient to alter the clock oscillation, and simultaneously lacking BPC1, BPC2, BPC4, and BPC6 was also required.
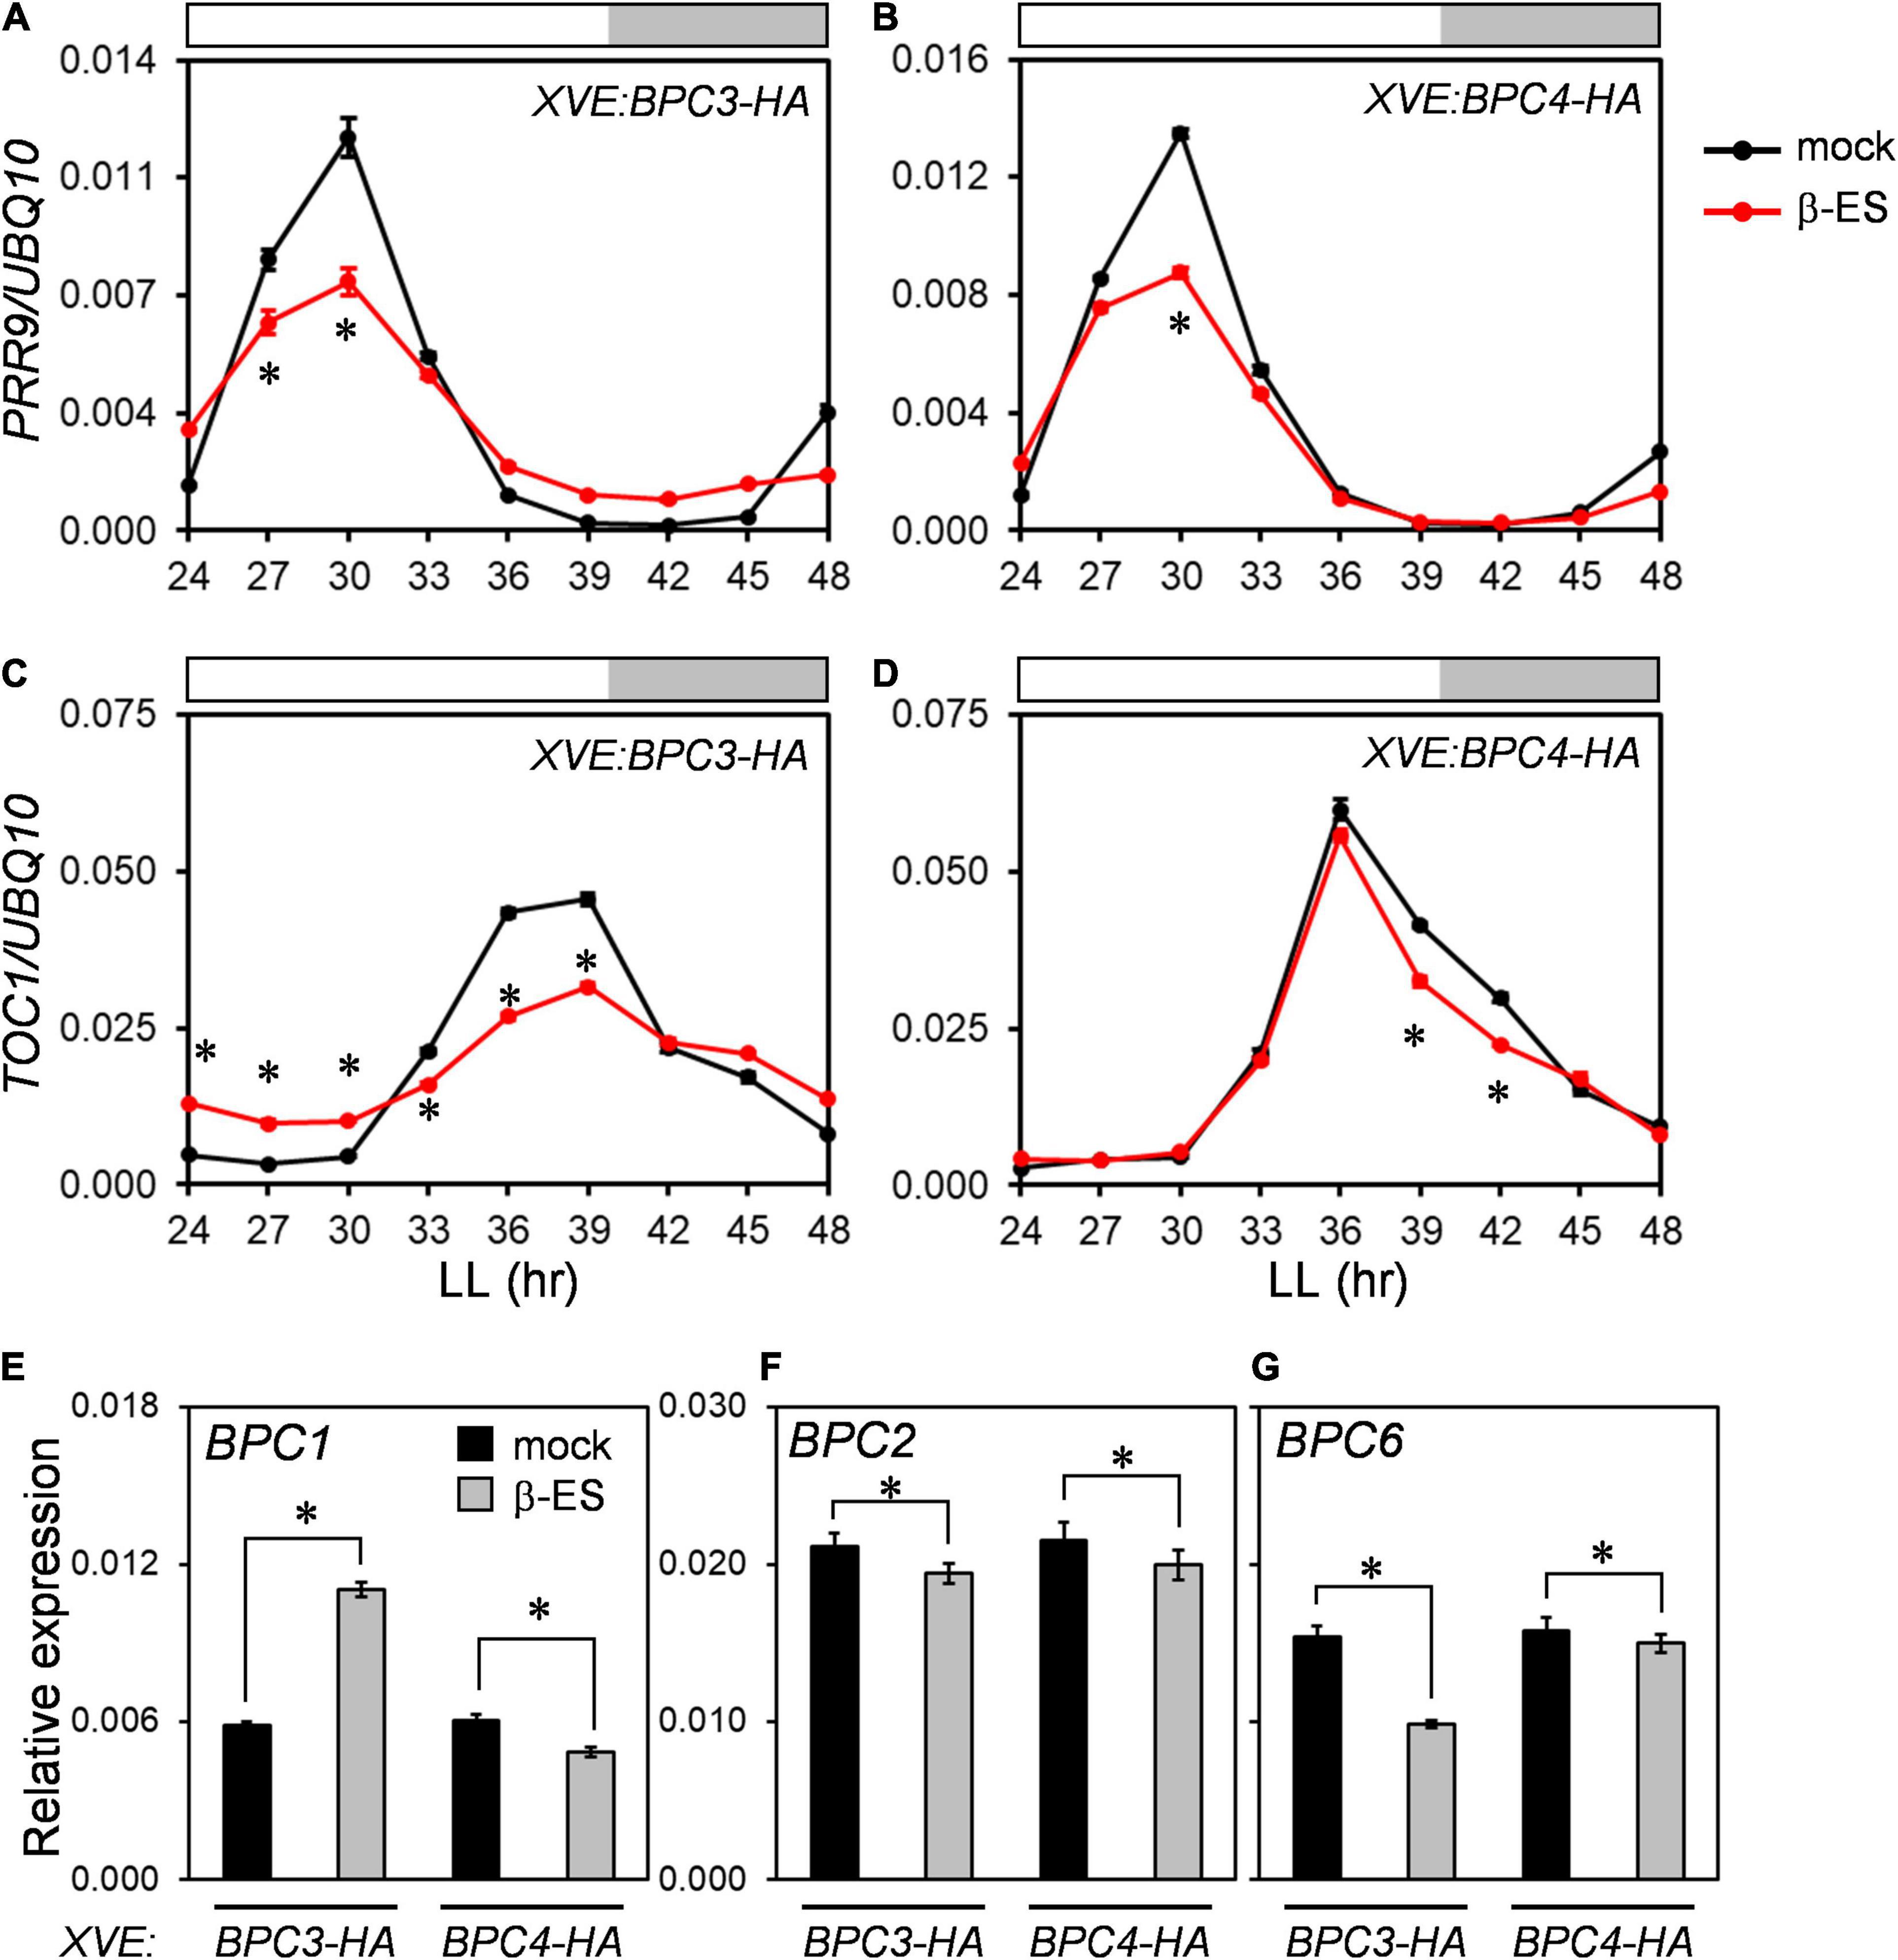
Figure 7. BPCs negatively regulated circadian clock components. (A–D) qRT-PCR analyses for expression profiles of PRR9 (A,B) and TOC1 (C,D) under the induction of BPC3-HA (A,C) and BPC4-HA (B,D) transgenic lines as described in Figures 6A–D. (E–G) Expression levels of BPC1 (E), BPC2 (F), and BPC6 (G) were profiled under BPC3-HA or BPC4-HA induction. Asterisks indicate the transcript levels were significantly changed by the β-ES treatment (Student’s t-test; *P < 0.05). Data are mean ± S.E. (n = 27, data collected as described in Figure 3; an independent biological replicate and corresponding individual time points are presented in Supplementary Figure 9).
As the endogenous BPC4 was repressed under the BPC3-HA induction (Figure 3E and Supplementary Figures 5G,H), we further analyzed transcript levels of BPC1, BPC2, and BPC6 under the BPC3-HA induction to assess if other BPC members were affected. Contradictory with the BPC4 repression by BPC3-HA, the transcript level of BPC1 was nearly two-fold upregulated by the BPC3-HA induction (Figure 7E and Supplementary Figure 9E). BPC2 was moderated, and BPC6 was inhibited by BPC3-HA, respectively (Figures 7F–G and Supplementary Figures 9F–G). Again, BPC4-HA induction slightly inhibited the expression of BPC1, BPC2, and BPC6 (Figures 7E–G and Supplementary Figures 9E–G). BPC4-HA can be a mild repressor of BPC1, BPC2, and BPC6. These findings indicated that BPC3 could regulate a subset of BPCs and supported that BPC members, including BPC3, co-regulated the circadian clock.
The public DAP-seq data revealed that CCA1 and GI are potential targets of BPC binding (Supplementary Figures 8E,F). We next examined if CCA1 and GI were also targeted by BPC1, which was upregulated by the BPC3-HA induction. We conducted ChIP-qPCR assays within the BPC1-EYFP-HA transgenic lines. ChIP-qPCR demonstrated a clear association of BPC1 with the upstream region (–645 to –506 bp) of CCA1 and the 5′-UTR of GI (Supplementary Figure 9H), which implied the bona fide regulation of the circadian clock by multiple BPCs. Therefore, the BPC3-HA induction has interfered with the network constituted by BPCs in clock regulation.
BPC3 Overexpression Causes the Disorder of Leaf Development
The leaf morphology of the bpc1,2,4,6 mutant is shrunken and curled (Monfared et al., 2011). This suggests that the ectopic BPC3 overexpression during the vegetative phase would impede leaf development. We induced BPC3-EYFP-HA overexpression in transgenic plants by spreading 17-β-estradiol onto tissues aboveground of transgenic lines at the stage of 14-day-old. After 7 days of BPC3-EYFP-HA induction, the size of 17-β-estradiol-treated plants was decreased, and the blades of juvenile leaves were heavily curled (Figure 8A). This suggested that the ectopic BPC3 expression hampered the edge formation under leaf expansion and decreased the rosette expansion.
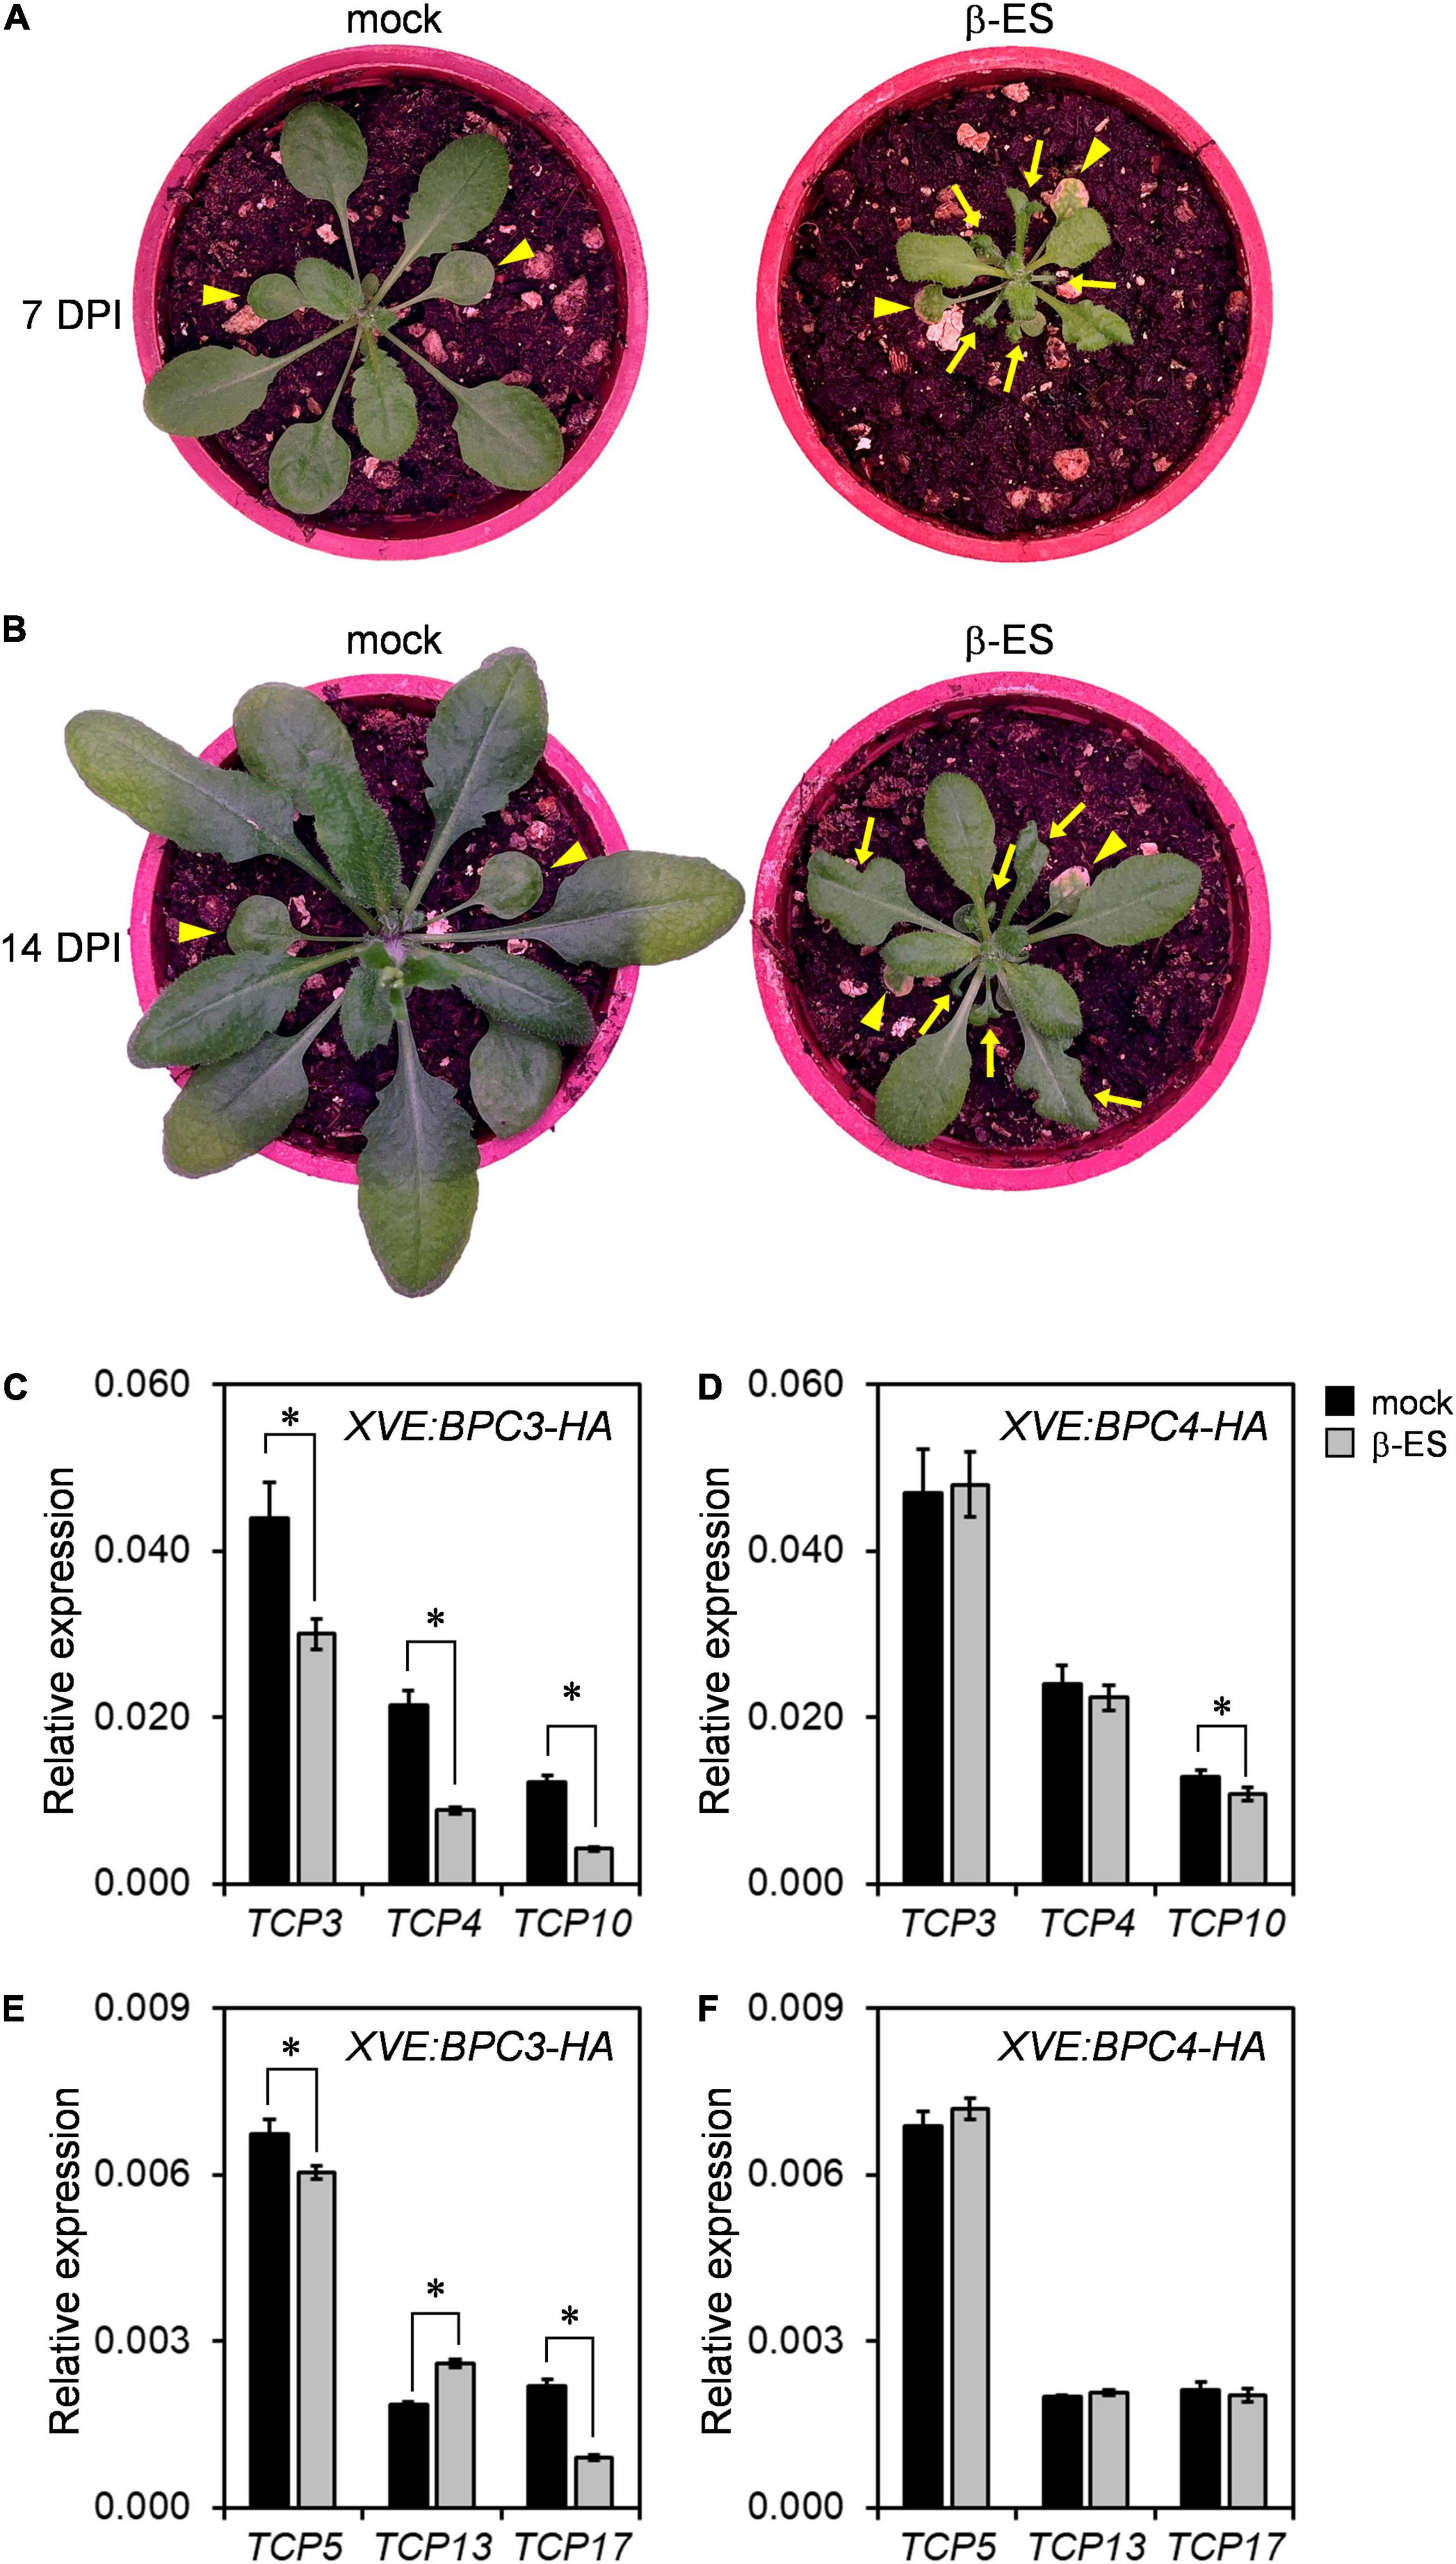
Figure 8. The ectopic expression of BPC3 impedes leaf development and growth. (A,B) Plants of 14-day-old XVE:BPC3-EYFP-HA were imaged on the 7th (A) and 14th days (B) post induction (DPI) by 0 or 50 μmM β-estradiol (β-ES). Arrowheads indicate the first two true leaves. Arrows indicate the impeded growth and edge formation of younger leaves of the transgenic plants. (C,D) Expressions of TCP3, TCP4, and TCP10 were analyzed by qRT-PCR under the induction of XVE:BPC3-HA (C) and XVE:BPC4-HA (D). (E,F) The expressions of TPC5, TCP13, and TCP17 were analyzed under indicated inductions. The expressions of the indicated TCPs were relative to that of UBQ10. Data are mean ± S.E. (n = 27, data collected as described in Figure 3; an independent biological replicate is presented in Supplementary Figures 10A–D, individual time points are shown in Supplementary Figure 11). Asterisks indicate expressions significantly changed by 50 μmM β-ES treatment (Student’s t-test; *P < 0.05).
While the effect of the inducer declined with time, leaf growth was gradually recovered (Figure 8B). The residue parts of growth-impeded and edge-curled leaves were enlarged, and later adult leaves with normal edge formation were generated after 14 days of the induction (Figure 8B). The alternation in leaf morphology by the induction of BPC3 overexpression or shown by bpc1,2,4,6 (Monfared et al., 2011) suggested that the repression of BPC3 by BPCs was crucial for sustaining leaf growth and development. TEOSINTE BRANCHED1-CYCLOIDEA-PCFs (TCPs), a family of transcription factors controlling leaf curvature (Nath et al., 2003; Koyama et al., 2017; Jiang et al., 2018), were further examined in the inducible XVE:BPC3-HA and XVE:BPC4-HA lines. TCP3, TCP4, and TCP10 are essential TCP members targeted by miR319 and required for leaf edge development (Koyama et al., 2017). Their transcript levels were significantly reduced under the induction of BPC3-HA (Figure 8C and Supplementary Figures 10A, 11) but marginally reduced (less than 25% reduction) by BPC4-HA (Figure 8D and Supplementary Figures 10B, 11). We also tested the expression of TCP5, TCP13, and TCP17, family members not targeted by miR319 (Koyama et al., 2017). TCP5 was moderated, TCP13 and TCP17 were, respectively, increased and repressed by the BPC3-HA (Figures 8E–F and Supplementary Figures 10C,D, 11) and moderated by the BPC4-HA in transgenic plants upon the inducer (Figures 8E–F and Supplementary Figures 10C,D, 11). This revealed that BPC3 was involved in leaf morphology control, mainly via the repression of TCP3/4/10/17.
It was noticed that the first two leaves were precociously yellowing under BPC3-EYFP-HA induction (Figure 8A), likely the leaf senescence was triggered. This implied that BPC3 was involved in the leaf senescence. We examined the expression of BIFUNCTIONAL NUCLEASE 1 (BFN1), the senescence-associated nuclease I gene (Peìrez-Amador et al., 2000). The BPC3-HA induction indeed enhanced the expression of BFN1, which was slightly repressed by the BPC4-HA induction (Supplementary Figures 10E, 11). This supports that the yellowing leaf can be due to precocious senescence. However, this could contrast with the repression of TCPs by BPC3-HA induction (Figure 8 and Supplementary Figures 10A–D), since TCPs play roles in stimulating leaf senescence (Koyama et al., 2017). This implied that the induction of BPC3-HA might trigger the leaf senescence pathway via an independent path of TCPs examined in this study.
Discussion
Our study discloses the action roles of BPC3, a hidden repressor repressed by other BPCs, in harming multiple vegetative developmental processes (Figure 9). BPC family members are plant-specific transcription factors involved in numerous developmental processes, usually directly bound to GAGA motifs. BPCs regulate transcription via PRC1/2 complex-dependent pathways (Hecker et al., 2015; Wu et al., 2020) or by cooperating with PRCs and MADS-domain factors simultaneously to synergistically repress the target STK (Simonini et al., 2012; Petrella et al., 2020). The mechanism that BPCs regulate downstream genes is also applicable to tuning BPC expression. The transcript level of BPC3 is increased in bpc4, bpc1,2, bpc1,2,3, bpc1,2,4,6 (Figure 2 and Supplementary Figure 1; Monfared et al., 2011) and bpc1,2,3,4,6 mutants (Monfared et al., 2011; Shanks et al., 2018), suggesting that other BPCs and BPC3 itself have functioned on the repression of BPC3. Our BPC3 induction tests also revealed that BPC3 is a repressor of BPC3 (Figure 3D and Supplementary Figures 5E,F), unraveling a feedback loop in which BPC3 auto represses its transcription with other BPCs (Figure 9). BPC3 is not the only family member regulated by BPCs. BPC1, BPC2, BPC4, and BPC6 are targeted by BPC6 (Shanks et al., 2018), of which transcription level is decreased under the induction of BPC3 overexpression (Figure 7G and Supplementary Figure 9G). In addition to the repression, we discover that BPC3 is also positively involved in the BPC1 regulation (Figure 7E and Supplementary Figure 9E), which might be potentially upregulated by BPC6 (Shanks et al., 2018). Collectively, BPC family members, including BPC3, are involved in constituting a BPC-repressive network for transcription (Figure 9).
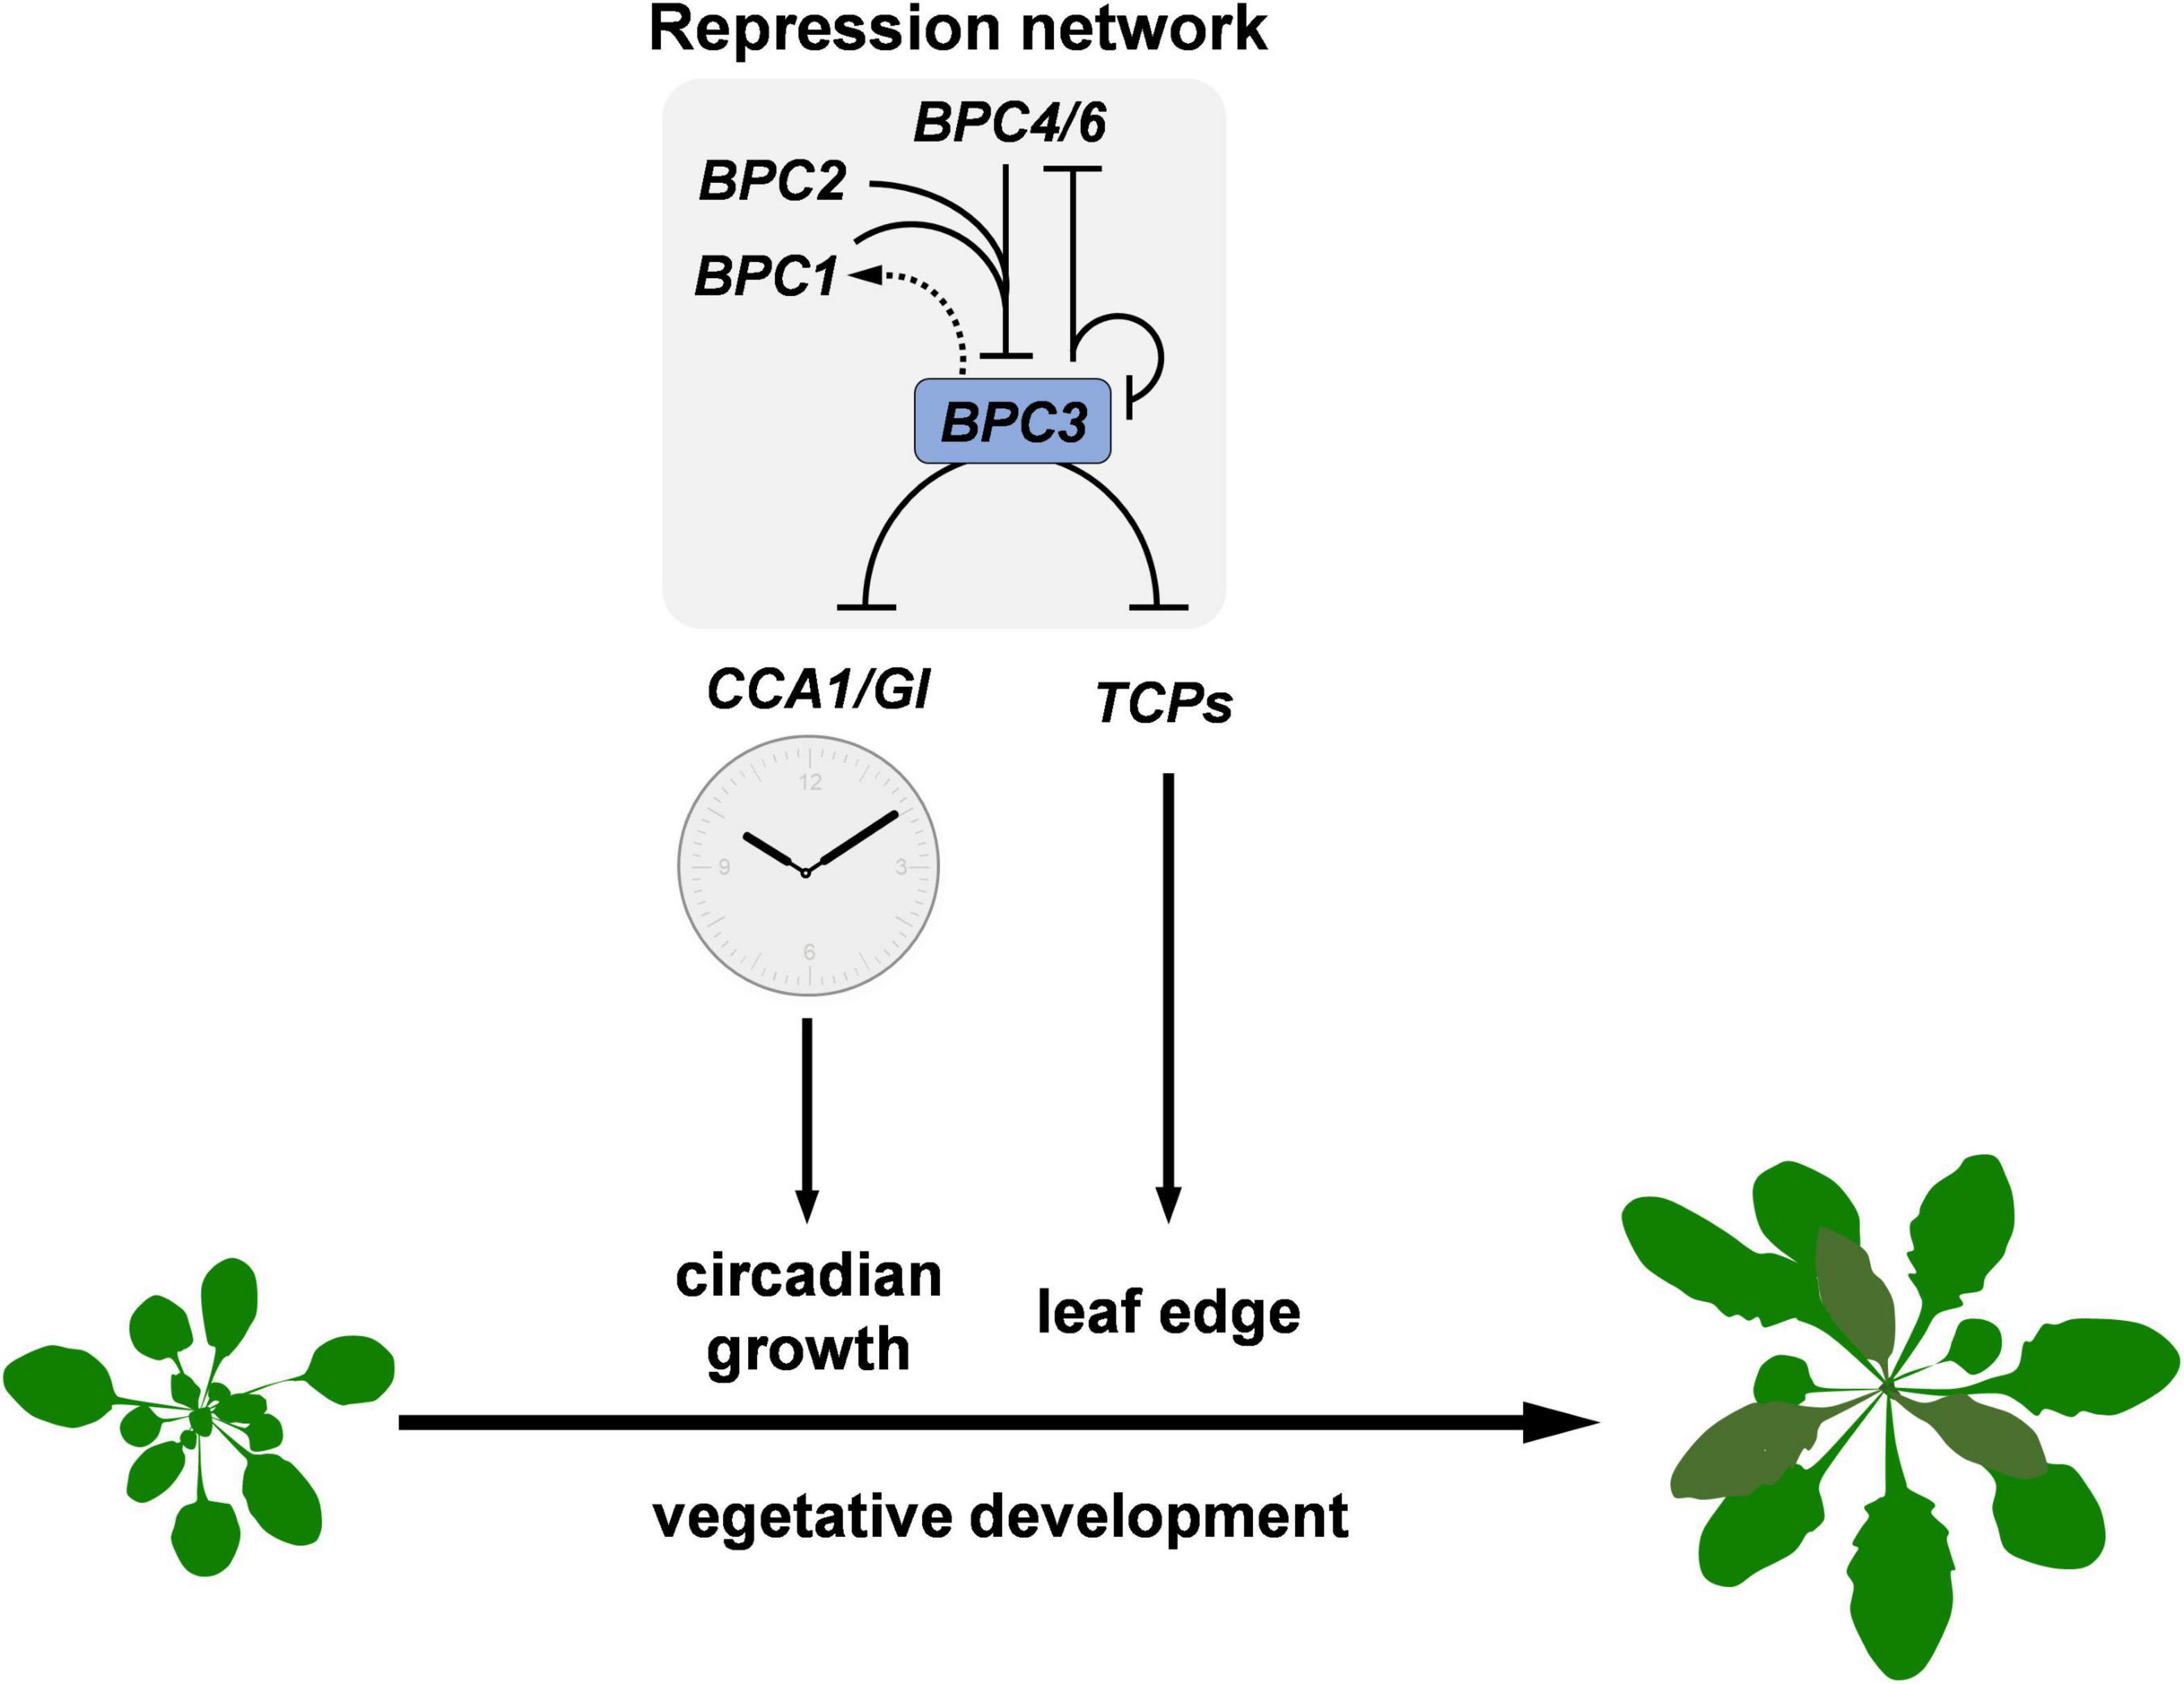
Figure 9. Diagram depicting the repression machinery constituted by BPC members in Arabidopsis vegetative development. Family members BPC1, BPC2, BPC3, BPC4, and BPC6 additively formed a repression network to limit BPC3 expression during the vegetative development. The concurrent mutations on BPC1, BPC2, BPC4, and BPC6 cause the relief of repression on BPC3. The ectopic BPC3 represses multiple clock genes including CCA1 and GI, resulting in the retardation of circadian growth. Simultaneously, BPC3 impedes the formation of leaf edge via repressing a subset of TCPs essential for leaf development. The reciprocal regulations between BPC members are marked with black lines with arrows (positive) or blunt ends (negative) according to the genetic study by Monfared et al. (2011) and BPC3/4 functional assays in this study. BPC3 may activate BPC1 via an indirect mechanism marked as a dashed arrow.
Upon the defects in higher-order mutants composed of concurrent mutations of BPC3 and other BPCs, BPC3 and other BPCs are proved redundantly functioning on meristem size maintenance and root cytokinin responses (Simonini and Kater, 2014; Shanks et al., 2018). However, the transcript level of BPC3 is immensely lower than that of other BPCs in seedlings across the vegetative phase and is only increased if one or multiple BPCs are compromised (Monfared et al., 2011; Mu et al., 2017; Shanks et al., 2018). Consequently, the function of BPC3 could be redundant or might merely moderate developmental processes with other BPCs during the vegetative phase. However, the double and higher-order bpc mutants harbored wild-type BPC3 also show multiple developmental defects (Figure 1; Monfared et al., 2011; Hecker et al., 2015; Wu et al., 2020). Given that developmental defects shown by bpc1,2 and bpc1,2,4,6 are partially rescued, respectively, in the triple mutant bpc1,2,3 (Figure 1) and quintuple mutant bpc1,2,3,4,6 (Monfared et al., 2011), one crucial function of BPCs for the development can be antagonizing BPC3. This study revealed that masking BPC3 activity by the BPC-repressive network is vital for vegetative growth. The induction of BPC3 overexpression causes phenotypes resembling the defected traits shown by bpc1,2,4,6. Once the BPC3 overexpression (Figure 3 and Supplementary Figure 5) or bpc mutation (Figure 2 and Supplementary Figure 1) interferes with the repression of BPC3, the essential genes of the circadian clock and leaf edge formation are concurrently repressed (Figures 4–8 and Supplementary Figures 6, 7, 9–11). The circadian growth and leaf development, later on, are impeded due to the defects of the controlling molecular mechanisms (Figure 8 and Supplementary Figures 10, 11).
All the circadian clock genes that we examined are phase-delayed plausibly because the genes are interlocked in a complex network of the circadian system (Figure 4 and Supplementary Figure 6). We found that the BPC-repressive network functions on the circadian clock by directly targeting CCA1 and GI, at least via BPC1 and BPC3 (Figures 6, 7). Moreover, BPCs might also cooperate with circadian clock components. The CCA1 promoter region targeted in our BPC3- and BPC1-associated ChIP-qPCR assays encompassing a GAGA cis-element “AAGGAGGAAGAAG” (Figures 6E,F and Supplementary Figure 9H), which is concurrently targeted by the direct repressor TOC1 of CCA1 (Gendron et al., 2012; Huang et al., 2012; Pokhilko et al., 2012). Given that the induction of TOC1 would upregulate a subset of genes sharing the sequence pattern “AGARRGARRRAGADR” possessing the putative GAGA motifs at the 500-bp promoter region (Gendron et al., 2012). It is likely TOC1 and BPCs co-regulate a group of targets.
The induction of BPC4 did not repress the expression of CCA1 and GI as BPC3 did (Figure 6 and Supplementary Figure 7), suggesting that BPC3 and BPC4 have different capabilities for downstream gene regulation. The other regulations conducted by BPC3 and BPC4 on BPCs and TCPs are also differential. Most BPCs and TCPs repressed by BPC3 were merely moderated by BPC4 (Figures 3, 7, 8 and Supplementary Figures 5, 9–11). However, the weak repression by BPC4 could be because the downstream genes we examined are not preferential targets of BPC4. The overexpression of BPC4 constitutively represses the transcript level of ABI4 in Arabidopsis roots during the early stage of seedling growth (Mu et al., 2017). Potentially, different preferences for target regulations among BPC members are broadly exerted in other tissues at different developmental stages.
Our ChIP-qPCR results demonstrate that BPC1 and BPC3 bind to the GAGA targets of BPC4 identified in the public DAP-seq database (Supplementary Figures 8E,F). This suggests that BPC domains at the C-terminus of BPC members possess a DNA binding generally for the GAGA motif recognition (Santi et al., 2003; Monfared et al., 2011; Theune et al., 2019). It has been shown that a functional motif required for the dimerization and interaction with LHP1 of the PRC1 components is shared by the subclass members with BPC4 but not by members with BPC1 and BPC3 (Wanke et al., 2011; Hecker et al., 2015; Theune et al., 2019). Conceivably, variations of target regulations can be contributed to by the different consensus motifs arranged in the N-terminus outside the conserved BPC domains of BPC3 and BPC4 (Theune et al., 2019). Whether N-terminus motifs determine the target selection or modulate the repressive capacities of different class BPCs is of great interest and demands future studies.
Although BPC3 plays a minor role or function only under conditions that remain unidentified during vegetative development, BPC3 can interfere with multiple processes that are concurrently regulated by other BPCs. We uncover that BPC3 is a hidden transcriptional repressor which has no assessable function for regulating plant development; nonetheless, the overdose of BPC3 simultaneously represses a subset of developmental genes. Otherwise, BPC4, one of the mainly expressed BPCs in Arabidopsis vegetative tissues, is a relatively modest repressor. BPC4 represses BPC3 and tunes the developmental genes by collaborating with other BPCs in an additive way. We conclude that keeping the low profile of BPC3 expression is a crucial function of BPCs. Our study sheds light on adverse transcriptional impacts limited by the BPC-repressive network of plant development.
Accession Numbers
Gene information from this article are found in Arabidopsis Genome Initiative data library with locus identifiers: BPC1 (At2g01930), BPC2 (At1g14685), BPC3 (At1g68120), BPC4 (At2g21240), BPC6 (At5g42520), BFN1 (At1g11190), CCA1 (At2g46830), ELF4 (At2g40080), PRR9 (At2g46790), PRR7 (At5g02810), PRR5 (At5g24470), PRR3 (At5g60100), TOC1 (At5g61380), GI (At1g22770), TCP3 (At1g53230), TCP4 (At3g15030), TCP5 (At5g60970), TCP10 (At2g31070), TCP13 (At3g02150), TCP17 (At5g08070), UBQ10 (At4g05320).
Data Availability Statement
The original contributions presented in the study are included in the article/Supplementary Material, further inquiries can be directed to the corresponding author.
Author Contributions
Y-CL, P-TT, X-XH, and H-LT designed the research, analyzed the data, performed the research, and wrote the article. All authors contributed to the article and approved the submitted version.
Funding
This research was supported by grants from the Ministry of Science and Technology, Taiwan, to H-LT (107-2628-B-002-003 and 108-2628-B-002-001).
Conflict of Interest
The authors declare that the research was conducted in the absence of any commercial or financial relationships that could be construed as a potential conflict of interest.
Publisher’s Note
All claims expressed in this article are solely those of the authors and do not necessarily represent those of their affiliated organizations, or those of the publisher, the editors and the reviewers. Any product that may be evaluated in this article, or claim that may be made by its manufacturer, is not guaranteed or endorsed by the publisher.
Acknowledgments
We thank Hsin-Hung Lin, Ying-Chung Jimmy Lin, Hieng-Ming Ting, and members of Tsai’s laboratory for helpful discussion. We also thank Yi-Chun Lin for the seed maintenance of bpc mutants, Yu-Hsin Kao and Yu-Chun Kao for assisting ChIP-qPCR assays. We also like to thank technical support from Technology Commons, College of Life Science, National Taiwan University.
Supplementary Material
The Supplementary Material for this article can be found online at: https://www.frontiersin.org/articles/10.3389/fpls.2022.919946/full#supplementary-material
References
Alabadi, D., Oyama, T., Yanovsky, M. J., Harmon, F. G., Mas, P., and Kay, S. A. (2001). Reciprocal regulation between TOC1 and LHY/CCA1 within the Arabidopsis circadian clock. Science 293, 880–883. doi: 10.1126/science.1061320
Chang, S., Puryear, J., and Cairney, J. (1993). A simple and efficient method for isolating RNA from pine trees. Plant Mol. Biol. Rep. 11, 113–116. doi: 10.1385/MB:19:2:201
Dowson-Day, M. J., and Millar, A. J. (1999). Circadian dysfunction causes aberrant hypocotyl elongation patterns in Arabidopsis. Plant J. 17, 63–71. doi: 10.1046/j.1365-313x.1999.00353.x
Engelmann, W., and Johnsson, A. (1998). “Rhythms in organ movement,” in Biological Rhythms and Photoperiodism in Plants, eds P. J. Lumsden and A. J. Millar (Oxford: BIOS Scientific Publishers), 35–50.
Fowler S., Lee K., Onouchi H., Samach A., Richardson K., Morris B., et al. (1999). GIGANTEA: a circadian clock-controlled gene that regulates photoperiodic flowering in Arabidopsis and encodes a protein with several possible membrane-spanning domains. EMBO J. 18, 4679–4688. doi: 10.1093/emboj/18.17.4679
Gendron, J. M., Pruneda-Paz, J. L., Doherty, C. J., Gross, A. M., Kang, S. E., and Kay, S. A. (2012). Arabidopsis circadian clock protein, TOC1, is a DNA-binding transcription factor. Proc. Natl. Acad. Sci. U. S. A. 109, 3167–3172. doi: 10.1073/pnas.1200355109
Harmer, S. L., Hogenesch, J. B., Straume, M., Chang, H. S., Han, B., Zhu, T., et al. (2000). Orchestrated transcription of key pathways in Arabidopsis by the circadian clock. Science 290, 2110–2113. doi: 10.1126/science.290.5499.2110
Hecker, A., Brand, L. H., Peter, S., Simoncello, N., Kilian, J., Harter, K., et al. (2015). The Arabidopsis GAGA-Binding Factor BASIC PENTACYSTEINE6 Recruits the POLYCOMB-REPRESSIVE COMPLEX1 Component LIKE HETEROCHROMATIN PROTEIN1 to GAGA DNA Motifs. Plant Physiol. 168, 1013–1024. doi: 10.1104/pp.15.00409
Huang, W., Perez-Garcia, P., Pokhilko, A., Millar, A. J., Antoshechkin, I., Riechmann, J. L., et al. (2012). Mapping the core of the Arabidopsis circadian clock defines the network structure of the oscillator. Science 336, 75–79. doi: 10.1126/science.1219075
Jiang, W., Li, Z., Yao, X., Zheng, B., Shen, W.-H., and Dong, A. (2018). jaw-1D: a gain-of-function mutation responsive to paramutation-like induction of epigenetic silencing. J. Exp. Bot. 70, 459–468. doi: 10.1093/jxb/ery365
Jouve, L., Greppin, H., and Agosti, R. D. (1998). Arabidopsis thaliana floral stem elongation: evidence for an endogenous circadian rhythm. Plant Physiol. Biochem. 36, 469–472.
Kooiker, M., Airoldi, C. A., Losa, A., Manzotti, P. S., Finzi, L., Kater, M. M., et al. (2005). BASIC PENTACYSTEINE1, a GA binding protein that induces conformational changes in the regulatory region of the homeotic Arabidopsis gene SEEDSTICK. Plant Cell 17, 722–729. doi: 10.1105/tpc.104.030130
Koyama, T., Mitsuda, N., Seki, M., Shinozaki, K., and Ohme-Takagi, M. (2010). TCP Transcription Factors Regulate the Activities of ASYMMETRIC LEAVES1 and miR164, as Well as the Auxin Response, during Differentiation of Leaves inArabidopsis. Plant Cell 22, 3574–3588. doi: 10.1105/tpc.110.075598
Koyama, T., Sato, F., and Ohme-Takagi, M. (2017). Roles of miR319 and TCP Transcription Factors in Leaf Development. Plant Physiol. 175, 874–885. doi: 10.1104/pp.17.00732
Lu, S. X., Knowles, S. M., Andronis, C., Ong, M. S., and Tobin, E. M. (2009). CIRCADIAN CLOCK ASSOCIATED1 and LATE ELONGATED HYPOCOTYL Function Synergistically in the Circadian Clock of Arabidopsis. Plant Physiol. 150, 834–843. doi: 10.1104/pp.108.133272
Meister, R. J., Williams, L. A., Monfared, M. M., Gallagher, T. L., Kraft, E. A., Nelson, C. G., et al. (2004). Definition and interactions of a positive regulatory element of the Arabidopsis INNER NO OUTER promoter. Plant J. 37, 426–438. doi: 10.1046/j.1365-313x.2003.01971.x
Monfared, M. M., Simon, M. K., Meister, R. J., Roig-Villanova, I., Kooiker, M., Colombo, L., et al. (2011). Overlapping and antagonistic activities of BASIC PENTACYSTEINE genes affect a range of developmental processes in Arabidopsis. Plant J. 66, 1020–1031. doi: 10.1111/j.1365-313X.2011.04562.x
Mu, Y., Zou, M., Sun, X., He, B., Xu, X., Liu, Y., et al. (2017). BASIC PENTACYSTEINE Proteins Repress ABSCISIC ACID INSENSITIVE4 Expression via Direct Recruitment of the Polycomb-Repressive Complex 2 in Arabidopsis Root Development. Plant Cell Physiol. 58, 607–621. doi: 10.1093/pcp/pcx006
Murashige, T., and Skoog, F. (1962). A Revised Medium for Rapid Growth and Bio Assays with Tobacco Tissue Cultures. Physiol. Plant. 15, 473–497.
Nakamichi, N., Kiba, T., Henriques, R., Mizuno, T., Chua, N. H., and Sakakibara, H. (2010). PSEUDO-RESPONSE REGULATORS 9, 7, and 5 are transcriptional repressors in the Arabidopsis circadian clock. Plant Cell 22, 594–605. doi: 10.1105/tpc.109.072892
Nakamichi, N., Kita, M., Ito, S., Yamashino, T., and Mizuno, T. (2005). PSEUDO-RESPONSE REGULATORS, PRR9, PRR7 and PRR5, together play essential roles close to the circadian clock of Arabidopsis thaliana. Plant Cell Physiol. 46, 686–698. doi: 10.1093/pcp/pci086
Nath, U., Crawford, B. C. W., Carpenter, R., and Coen, E. (2003). Genetic Control of Surface Curvature. Science 299, 1404–1407. doi: 10.1126/science.1079354
O’Malley, R. C., Huang, S. C., Song, L., Lewsey, M. G., Bartlett, A., Nery, J. R., et al. (2016). Cistrome and Epicistrome Features Shape the Regulatory DNA Landscape. Cell 166:1598.
Palatnik, J. F., Allen, E., Wu, X., Schommer, C., Schwab, R., Carrington, J. C., et al. (2003). Control of leaf morphogenesis by microRNAs. Nature 425, 257–263. doi: 10.1038/nature01958
Petrella, R., Caselli, F., Roig-Villanova, I., Vignati, V., Chiara, M., Ezquer, I., et al. (2020). BPC transcription factors and a Polycomb Group protein confine the expression of the ovule identity gene SEEDSTICK in Arabidopsis. Plant J. 102, 582–599. doi: 10.1111/tpj.14673
Peìrez-Amador, M. A., Abler, M. L., De Rocher, E. J., Thompson, D. M., Van Hoof, A., Lebrasseur, N. D., et al. (2000). Identification of BFN1, a Bifunctional Nuclease Induced during Leaf and Stem Senescence in Arabidopsis. Plant Physiol. 122, 169–180. doi: 10.1104/pp.122.1.169
Pokhilko, A., Fernandez, A. P., Edwards, K. D., Southern, M. M., Halliday, K. J., and Millar, A. J. (2012). The clock gene circuit in Arabidopsis includes a repressilator with additional feedback loops. Mol. Syst. Biol. 8:574. doi: 10.1038/msb.2012.6
Pokhilko, A., Hodge, S. K., Stratford, K., Knox, K., Edwards, K. D., Thomson, A. W., et al. (2010). Data assimilation constrains new connections and components in a complex, eukaryotic circadian clock model. Mol. Syst. Biol. 6:416. doi: 10.1038/msb.2010.69
Pruneda-Paz, J. L., Breton, G., Para, A., and Kay, S. A. (2009). A functional genomics approach reveals CHE as a component of the Arabidopsis circadian clock. Science 323, 1481–1485. doi: 10.1126/science.1167206
Sangwan, I., and O’Brian, M. R. (2002). Identification of a soybean protein that interacts with GAGA element dinucleotide repeat DNA. Plant Physiol. 129, 1788–1794. doi: 10.1104/pp.002618
Santi, L., Wang, Y., Stile, M. R., Berendzen, K., Wanke, D., Roig, C., et al. (2003). The GA octodinucleotide repeat binding factor BBR participates in the transcriptional regulation of the homeobox gene Bkn3. Plant J. 34, 813–826. doi: 10.1046/j.1365-313x.2003.01767.x
Shanks, C. M., Hecker, A., Cheng, C. Y., Brand, L., Collani, S., Schmid, M., et al. (2018). Role of BASIC PENTACYSTEINE transcription factors in a subset of cytokinin signaling responses. Plant J. 95, 458–473. doi: 10.1111/tpj.13962
Shim, J. S., Kubota, A., and Imaizumi, T. (2017). Circadian Clock and Photoperiodic Flowering in Arabidopsis: CONSTANS Is a Hub for Signal Integration. Plant Physiol. 173, 5–15. doi: 10.1104/pp.16.01327
Simonini, S., and Kater, M. M. (2014). Class I BASIC PENTACYSTEINE factors regulate HOMEOBOX genes involved in meristem size maintenance. J. Exp. Bot. 65, 1455–1465. doi: 10.1093/jxb/eru003
Simonini, S., Roig-Villanova, I., Gregis, V., Colombo, B., Colombo, L., and Kater, M. M. (2012). Basic pentacysteine proteins mediate MADS domain complex binding to the DNA for tissue-specific expression of target genes in Arabidopsis. Plant Cell 24, 4163–4172. doi: 10.1105/tpc.112.103952
Theune, M. L., Bloss, U., Brand, L. H., Ladwig, F., and Wanke, D. (2019). Phylogenetic Analyses and GAGA-Motif Binding Studies of BBR/BPC Proteins Lend to Clues in GAGA-Motif Recognition and a Regulatory Role in Brassinosteroid Signaling. Front. Plant Sci. 10:466. doi: 10.3389/fpls.2019.00466
Wang, Y., Wu, J. F., Nakamichi, N., Sakakibara, H., Nam, H. G., and Wu, S. H. (2011). LIGHT-REGULATED WD1 and PSEUDO-RESPONSE REGULATOR9 form a positive feedback regulatory loop in the Arabidopsis circadian clock. Plant Cell 23, 486–498. doi: 10.1105/tpc.110.081661
Wanke, D., Hohenstatt, M. L., Dynowski, M., Bloss, U., Hecker, A., Elgass, K., et al. (2011). Alanine Zipper-Like Coiled-Coil Domains Are Necessary for Homotypic Dimerization of Plant GAGA-Factors in the Nucleus and Nucleolus. PLoS One 6:e16070. doi: 10.1371/journal.pone.0016070
Winter, D., Vinegar, B., Nahal, H., Ammar, R., Wilson, G. V., and Provart, N. J. (2007). An “Electronic Fluorescent Pictograph” Browser for Exploring and Analyzing Large-Scale Biological Data Sets. PLoS One 2:e718. doi: 10.1371/journal.pone.0000718
Wu, J., Mohamed, D., Dowhanik, S., Petrella, R., Gregis, V., Li, J., et al. (2020). Spatiotemporal Restriction of FUSCA3 Expression by Class I BPCs Promotes Ovule Development and Coordinates Embryo and Endosperm Growth. Plant Cell 32, 1886–1904. doi: 10.1105/tpc.19.00764
Zielinski, T., Moore, A. M., Troup, E., Halliday, K. J., and Millar, A. J. (2014). Strengths and Limitations of Period Estimation Methods for Circadian Data. PLoS One 9:e96462. doi: 10.1371/journal.pone.0096462
Keywords: Arabidopsis thaliana, BPC transcription factor, TCP transcription factor, circadian clock, leaf development
Citation: Lee Y-C, Tsai P-T, Huang X-X and Tsai H-L (2022) Family Members Additively Repress the Ectopic Expression of BASIC PENTACYSTEINE3 to Prevent Disorders in Arabidopsis Circadian Vegetative Development. Front. Plant Sci. 13:919946. doi: 10.3389/fpls.2022.919946
Received: 14 April 2022; Accepted: 29 April 2022;
Published: 26 May 2022.
Edited by:
Jian Wu, China Agricultural University, ChinaReviewed by:
Rosanna Petrella, University of Milan, ItalyDiana Mihaela Buzas, University of Tsukuba, Japan
Copyright © 2022 Lee, Tsai, Huang and Tsai. This is an open-access article distributed under the terms of the Creative Commons Attribution License (CC BY). The use, distribution or reproduction in other forums is permitted, provided the original author(s) and the copyright owner(s) are credited and that the original publication in this journal is cited, in accordance with accepted academic practice. No use, distribution or reproduction is permitted which does not comply with these terms.
*Correspondence: Huang-Lung Tsai, aHVhbmdsdW5ndHNhaUBudHUuZWR1LnR3