
94% of researchers rate our articles as excellent or good
Learn more about the work of our research integrity team to safeguard the quality of each article we publish.
Find out more
ORIGINAL RESEARCH article
Front. Plant Sci., 10 May 2022
Sec. Plant Nutrition
Volume 13 - 2022 | https://doi.org/10.3389/fpls.2022.905537
This article is part of the Research TopicFactors affecting the efficacy of foliar fertilizers and the uptake of atmospheric aerosols, Volume IIView all 9 articles
 Congfei Zhu1†
 Handong Luo1,2†
 Laicong Luo1
 Kunying Wang1
 Yi Liao1
 Shun Zhang1
 Shenshen Huang1
 Xiaomin Guo1
 Ling Zhang1*
Atmospheric nitrous oxide (N2O) increase contributes substantially to global climate change due to its large global warming potential. Soil N2O emissions have been widely studied, but plants have so far been ignored, even though they are known as an important source of N2O. The specific objectives of this study are to (1) reveal the effects of nitrogen and biochar addition on plant functional traits and N2O emission of Cinnamomum camphora seedlings; (2) find out the possible leaf traits affecting plant N2O emissions. The effects of nitrogen and biochar on plant functional traits and N2O emissions from plants using C. camphora seedlings were investigated. Plant N2O emissions, growth, each organ biomass, each organ nutrient allocation, gas exchange parameters, and chlorophyll fluorescence parameters of C. camphora seedlings were measured. Further investigation of the relationships between plant N2O emission and leaf traits was performed by simple linear regression analysis, principal component analysis (PCA), and structural equation model (SEM). It was found that nitrogen addition profoundly increased cumulative plant N2O emissions (+109.25%), which contributed substantially to the atmosphere’s N2O budget in forest ecosystems. Plant N2O emissions had a strong correlation to leaf traits (leaf TN, Pn, Gs, Ci, Tr, WUEL, α, ETRmax, Ik, Fv/Fm, Y(II), and SPAD). Structural equation modelling revealed that leaf TN, leaf TP, Pn, Ci, Tr, WUEL, α, ETRmax, and Ik were key traits regulating the effects of plants on N2O emissions. These results provide a direction for understanding the mechanism of N2O emission from plants and provide a theoretical basis for formulating corresponding emission reduction schemes.
Nitrous oxide (N2O) is a potent greenhouse gas with a sustained-flux global warming potentials (SGWPs) 270 times greater than that of carbon dioxide (CO2) over a 100-year scale (Neubauer and Megonigal, 2015). N2O is also the dominant ozone depleting substance (Ravishankara et al., 2009; Wu et al., 2021).
Soils are considered the major source of N2O in forest ecosystems (Chapuis-Lardy et al., 2007). So far, the N2O emission between forest and atmosphere is only based on the calculated N2O exchange between soil and atmosphere (ButterbachBahl et al., 1997). However, plants have been shown to be involved in N2O emissions from soil–plant systems (Chen et al., 1999; Muller, 2003).
Soil microorganisms and plants are two possible sources of N2O emissions from plants. One idea is that N2O emitted by plants is produced by soil microbes. Plants can transport N2O produced by soil to stems and leaves and emit it into the atmosphere (Rusch and Rennenberg, 1998; Pihlatie et al., 2005; Machacova et al., 2013; Diaz-Pines et al., 2016). Another view is that plants produce and emit nitrous oxide, which produce N2O during N assimilation processes (Smart and Bloom, 2001). However, the exact mechanism of N2O production in plants remains unclear (Goshima et al., 1999; Lenhart et al., 2019).
Methods such as isotopic studies can provide more support for distinguishing the source of nitrous oxide. Based on stable isotope measurement research methods, studies have shown that the dual isotopocule fingerprint of N2O released by plants is different from that of all known microbial or chemical processes, indicating that N2O released by plants is produced in plant cells (Lenhart et al., 2019). The findings in field conditions challenge the idea that plants may transport N2O produced by soil microbes. The site preference (SP) results of soil and plant N2O emissions showed that plant cells N2O release contributed to total N2O emissions under field conditions (Timilsina et al., 2022). Therefore, attention should be paid to the plant N2O emissions in forest ecosystems. Understanding the contribution of plants to total N2O emissions is also crucial to accurately estimating the global N2O budget and identifying possible mitigation options.
China produces about 20 million dead pigs every year, and this number is still rising every year (He et al., 2018). However, there is a lack of research concerning biochar made by dead animals. Pyrolysis of pig carcasses into biochar is an efficient and environmentally friendly option for waste disposal (Yang et al., 2017), while its effects on plant N2O emissions and plant functional traits are unclear.
Cinnamomum camphora (L.) Presl is a broad-leaved evergreen tree species with important economic value (Chen et al., 2017), whose leaves can be used to extract spices and essential oils (Babu et al., 2003). The intensive N input and leaf-harvesting practice potentially make C. camphora plantation soils hot-spots for N2O emissions (Zheng et al., 2020), while N2O emissions from C. camphora plants have not been studied.
Plant photosynthesis is the driving force behind maintaining plant life and biochemical reactions (Hu et al., 2021). The various steps of the photosynthesis process are closely coupled, and changes in any step will affect PSII and cause fluorescence changes. Chlorophyll fluorescence is an effective probe for photosynthesis (Govindjee, and Papageorgiou, 2004). Meanwhile, chlorophyll fluorescence has been found to be an important indicator of photosynthetic energy conversion in chloroplast PSII (Mareckova et al., 2019). Nitrogen (N) and phosphorus (P) are essential nutrients for carbon assimilation in photosynthesis, and the nitrogen and phosphorus content in leaves are closely related to photosynthesis (Mo et al., 2019). Lenhart et al. (2019) established a relationship between N2O emission rates and CO2 respiration rates, and found that the process of plant-derived emissions may also be related to plant photosynthesis. The release of N2O in plants is related to the light and dark reactions of photosynthesis, and the photosynthetic rate and stomatal conductance have a certain relationship with the release of N2O in plants (Yang et al., 2005). Studies have shown that plant N2O emissions are closely related to their physiological activities. Tree physiological activities include photosynthesis, CO2 assimilation, and transpiration. N2O transport in transpiration is a mechanism of N2O emission in plants. In addition, N2O is also produced in plant tissues during nitrate assimilation, which is closely related to photosynthesis (Machacova et al., 2019). As mentioned above, existing studies have greatly advanced our understanding of the correlation between N content, P content and physiological activity in leaves. However, specific studies on the relationship between plant N2O emissions and these leaf traits under nitrogen and biochar addition are still lacking.
In this study, we used the closed box method and C. camphora seedlings to monitor the changes in plant N2O emissions as affected by N and biochar addition. In addition, we also investigated the deep relationship between plant N2O emissions and the functional traits of C. camphora seedlings. The objectives of this study were to:
(1) Study nitrogen and dead pig-derived biochar effects on plant N2O emissions of C. camphora; (2) explore plant traits and physiological parameters that influence plant N2O emissions.
This study was conducted in Jiangxi Agricultural University, Jiangxi, China (28°46′05″N, 115°50′22″E) from November 2017 (seeds collection) to November 2018 (seedling harvest). According to the Chinese classification system of Quaternary Red Clay, the soil in the pot experiment is classified as typical red soil. Seeds of C. camphora were planted in January 2018. After seeds germinated in early April, C. camphora seedlings were transplanted into a plastic pot filled with 2 kg soil passed through a 2 mm sieve. At the end of July 2018 (growth period for C. camphora), seedlings of the same size for experimentation were selected. The growth period of C. camphora in the experiment was consistent with that in this area. In this pot experiment, eight treatments with four replicates were carried out.
A full factorial randomized design with four N (N0, 0 mg N kg–1 dry soil; N1, 100 mg N kg–1 dry soil; N2, 200 mg N kg–1 dry soil; and N3, 300 mg N kg–1 dry soil) and two pig carcass biochar levels (BC0, control; and BC1, 1% pig biochar, w/w) (Chen et al., 2020) was employed. Nitrogen addition was performed by spraying the same volume of urea [CO(NH2)2] solution (1 g N L–1, 2 g N L–1 and 3 g N L–1) and was applied twice on August 2 and September 1, 2018. The biochar was derived from pig carcasses (Huzhou Industrial and Medical Waste Treatment Center, Zhejiang, China) and was ground to pass through a 2 mm sieve before application. Biochar was dissolved in water and applied to the soil of C. camphora seedlings on 2 August 2018. Both soil and biochar characteristics are shown in Supplementary Table 1. See Table 1 for a list of measured C. camphora plant traits with their abbreviations and units.
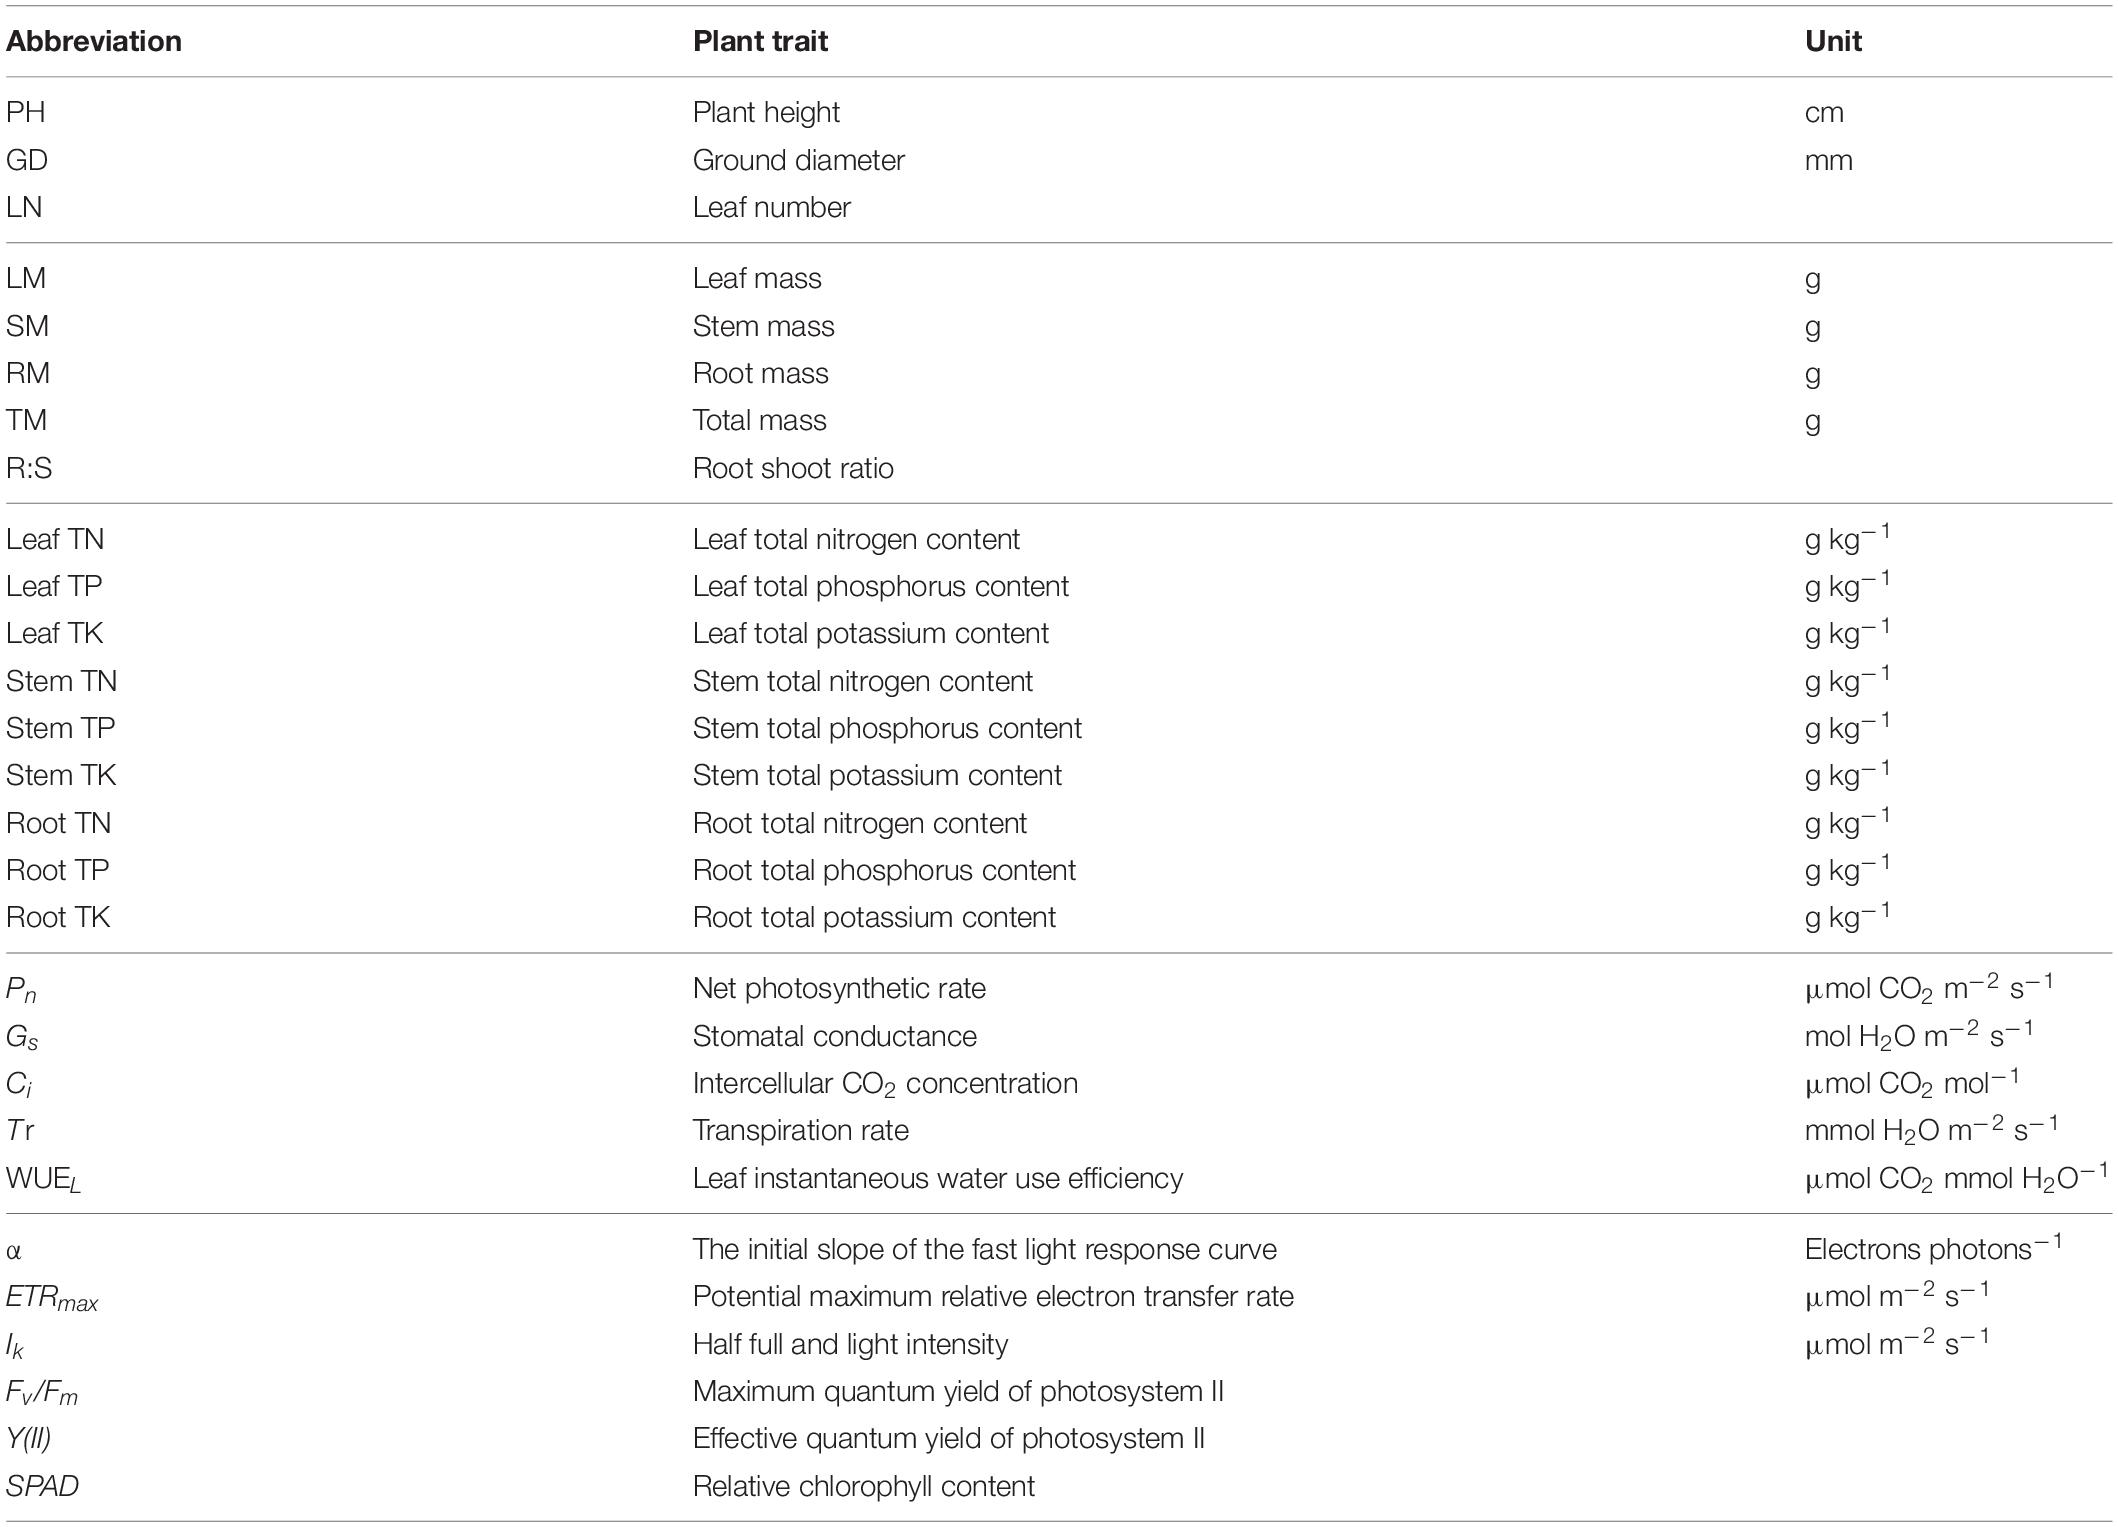
Table 1. List of Cinnamomum camphora plant traits measured, their abbreviations and units.
Plant N2O fluxes were measured by using a closed transparent chamber (diameter × height = 17 cm × 80 cm) (Figure 1). The sampling chamber was a cylinder made of PVC tube. On the top of the cylinder, there was a small hole, into which a thermometer with a rubber plug was placed. Then they inserted a rubber hose in the middle of the barrel, which was connected by a three-way valve on the outside of the hose (Figure 1). Aluminum foam was used to cover the outer surface to reduce temperature change during sampling. Before gas collection, distilled water was injected into the collar groove with a syringe for airtight sealing (Figure 1). Overall, this experiment consisted of 32 pots with four replicates and 14 times measurements of plant N2O emissions (4N × 2 biochar × 4 replicates × 14 times). When plant N2O emissions were measured, soil was wrapped by plastic bag (Figure 1). During the gas collection, the chamber was sealed to ensure it was airtight. A 60 ml syringe was used to collect gas samples at 0, 10, 20, and 30 min after the chambers were closed. Gas samples were immediately transferred into a 100 mL aluminum foil gas bag. Gas samples were collected between 9:00 and 11:00 (China Standard Time). The collected gas samples were immediately taken back to the laboratory for concentration determination. N2O concentrations were determined within 24 h after sampling using a gas chromatograph (Agilent 7890B, Santa Clara, CA, United States) equipped with an electron capture detector (ECD). Because most of the plant N2O emissions are emitted by leaves (Li and Chen, 1993), the plant N2O emissions of C. camphora were calculated based on leaf area. After each gas collection, leaf area was measured by a hand-held laser blade area meter (CID, CI-203, America). The leaf area was measured 14 times. The plant N2O emissions were shown as μg m–2 leaves h–1 (Pihlatie et al., 2005). Plant nitrous oxide fluxes (F, μg m–2 leaves h–1) were calculated by the following equation (Bowatte et al., 2014):
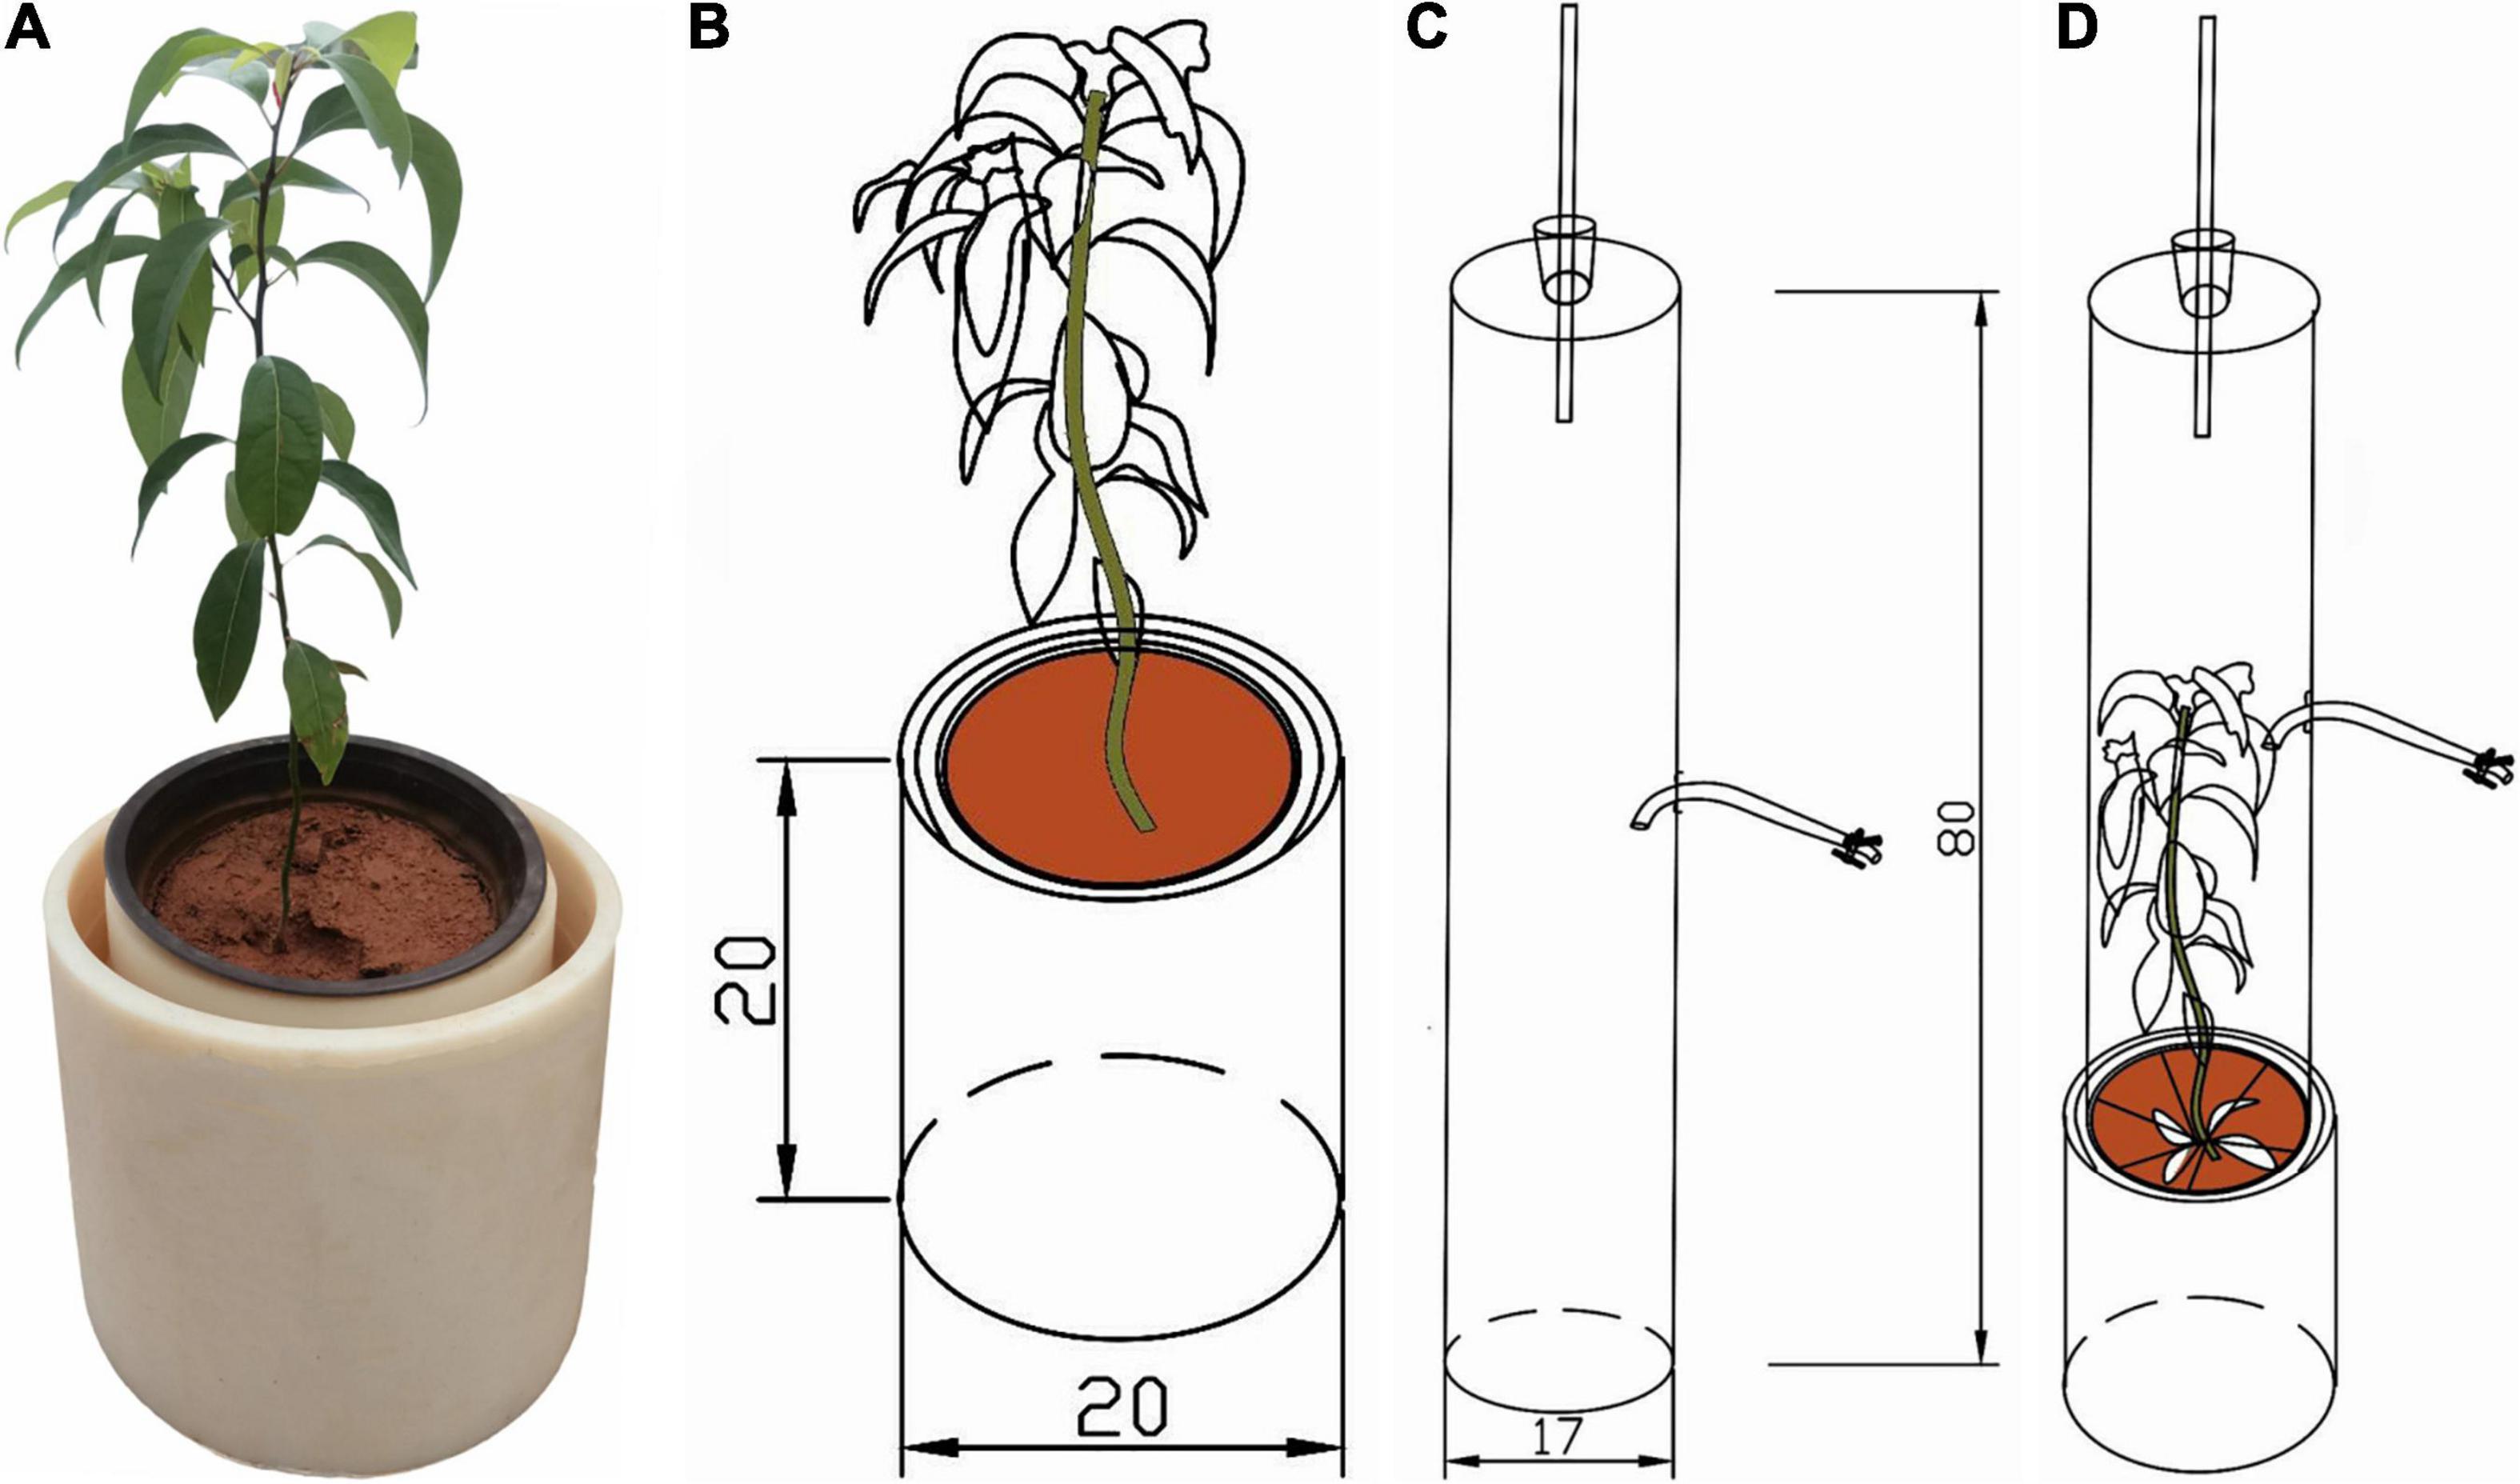
Figure 1. Schematic of the chamber designed to measure plant N2O emissions from Cinnamomum camphora. (A) Plant + collar groove test diagram, (B) plant + collar groove schematic diagram, (C) sampling chamber, (D) closed transparent assembled chamber.
where P is the standard atmospheric pressure (Pa); V and S are the cylindrical chamber volume (m3) and seeding leaf area (m2); Δc/Δt means the rate of N2O (ppb) concentration change with time based on linear regressions; R indicates the universal gas constant; T is the absolute air temperature (K) when the gas sample was aspirated.
Cumulative plant N2O emissions (E, μg m–2) were calculated by Abalos et al. (2018):
where E is the cumulative plant N2O emissions (μg m–2 leaves); F and i are the plant N2O emission rates (μg m–2 leaves h–1) and i th gas collection, respectively; (ti+1−ti) refers to the interval time of two gas collection; n is the total number of gas collection times. Fluxes of N2O were measured 14 times from 22 July 2018 to 17 November 2018 at days 1, 11, 13, 16, 19, 35, 43, 46, 49, 57, 74, 88, 106, 119. During the experiment, C. camphora seedlings were regularly irrigated with equal amounts of distilled water. During the gas collection periods, C. camphora seedlings were irrigated 3 days in advance.
Before harvesting, the gas exchange parameters, chlorophyll fluorescence parameters, and relative chlorophyll content of seedlings were measured. In this pot experiment, 32 pots were carried out for measurement. The net photosynthetic rate Pn (μmol CO2 m–2 s–1), stomatal conductance Gs (mol H2O m–2 s–1), intercellular CO2 concentration Ci (μmol CO2 mol–1) and transpiration rate Tr (mmol H2O m–2 s–1) of the fourth fully expanded leaf were measured by a LI-6400XT photosynthesis system (LI-COR, Lincoln, NE, United States) between 8:30 and 11:30 a.m. on a sunny day. For each C. camphora seedling, three fully expanded leaves were selected for the photosynthetic measurement. The parameters were set as follows: the measured light was 1,000 μmol m–2 s–1, the CO2 concentration in the leaf chamber was 400 μmol mol–1, the temperature in the leaf chamber was 25°C, and the air flow rate was 500 ml min–1 (Gong et al., 2022). Leaf instantaneous water use efficiency WUEL (μmol CO2 mmol H2O–1) was calculated as follows: WUEL = Pn/Tr (Fang et al., 2018).
For each C. camphora seedling, three representative leaves were selected for the chlorophyll fluorescence measurement. Chlorophyll fluorescence parameters of representative leaves were measured by a Pulse-Amplitude-Modulation (PAM) fluorometer (PAM 2500, Walz GmbH, Nuremberg, Germany). The minimum (F0) and maximum (Fm) fluorescence were recorded after sufficient dark adaptation (at least 30 min) of the sample with a dark adaptation clip. The leaves were given saturated pulsed light (2,000 μmol m–2 s–1) for 3 s and actinic light (300 μmol m–2 s–1) for 10 min. The chlorophyll fluorescence peak was recorded as Fm′, and before the saturation pulse was turned off, the recorded fluorescence value was F. The maximum quantum yield of photosystem II, Fv/Fm = (Fm −F0)/Fm. The effective quantum yield of photosystem II, Y(II) = ΔF/Fm′ = (Fm′-F)/Fm′ (Kitajima and Butler, 1975; Genty et al., 1989). At night, after the samples had passed sufficient dark adaptation, the actinic light with light intensities of 2, 6, 31, 101, 141, 271, 474, 785, 1,160, and 1,663 μmol m–2 s–1 was turned on in turn. The irradiation time of actinic light for each intensity was 10 s. Using the Pam Win-3 software, the fast light response curve was fitted with the formula (Eilers and Peeters, 1988). α, initial slope of fast light curve (electrons photons–1); ETRmax, potential maximum relative electron transfer rate (μmol m–2 s–1); Ik, half full and light intensity (μmol m–2 s–1) (Ralph and Gademann, 2005). The SPAD-502 Plus (Konicaminolta, Japan) was used to determine the relative chlorophyll content (SPAD). For each C. camphora seedling, four fully expanded leaves were selected for measurement.
At the end of the study, whole plant seedlings were harvested in November 2018. In this pot experiment, 32 C. camphora seedlings were harvested. All seedlings were gently processed by removing soil. Then seedling height, ground diameter, leaf number, and leaf area were measured and recorded. The leaves, stems, and roots of seedlings were cleaned with pure water and dried to a constant weight, which was weighed separately. The aboveground mass (leaf mass+stem mass), underground mass (root mass), total mass (underground mass+aboveground mass) and root-shoot ratio (R: S = underground mass: aboveground mass) could be obtained by calculation (Zhang et al., 2013; Deng et al., 2019). After the above data were recorded, the roots, stems and leaves of seedlings were crushed to pass through 0.149 mm sieve for determination of N, P, and K. The total phosphorus content was determined by molybdenum blue colorimetry, the total nitrogen content was determined by indophenol blue colorimetry after removing part of the digestion liquid and adjusting to neutral pH, and the total potassium in the digestion liquid was determined by flame photometry (Chen et al., 2022).
Analysis of variance (ANOVA) was used to examine the dependence of plant N2O emission rate and leaf area as affected by N and biochar and their interactions as fixed effects and sampling time as random effects (Xu et al., 2020). Two-way ANOVA was used to examine the dependence of cumulative plant N2O emissions and plant trait parameters on N, biochar, and their interactions. Tukey post-hoc tests were used to examine differences among means with significant results. Pearson correlation analysis to explore the linear relationship between leaf traits and plant N2O emissions (Chen et al., 2015). Origin 2021 was used to conduct principal component analysis (PCA) to analyze leaf traits and determine the main functional traits of N2O emission in plants (Li et al., 2022). AMOS 26.0 (IBM Corp, Armonk, NY, United States) was employed to perform structural equation modelling (SEM) to detect the influences among the variables. The model was constructed using our hypotheses about plant functional traits affecting plant N2O emissions. The quality of the SEM model was assessed by using the chi-square goodness-of-fit statistic χ2/df, Akaike’s information criterion (AIC), the Bayesian information criteria (BIC), the root mean square error of approximation value (RMSEA), the comparative fit index (CFI), and the standardized root mean square residual (SRMR) (Grace, 2006). We used JMP 9.0 (Cary, NC, United States) for data analysis.
Plant height, ground diameter, and leaf number differed significantly among different levels of N and between two different levels of biochar addition (P < 0.01; Table 2). The same was true for leaf mass, stem mass, root mass, and total mass. These differences could be ascribed to the absorption and utilization of different nutrients by C. camphora. Plant height, ground diameter, leaf number, and each organ mass showed an increasing trend with the addition of N supplemental level regardless of adding biochar or not. However, root shoot ratio had no significant difference among different levels of N and between two different levels of biochar addition (Supplementary Figure 1).
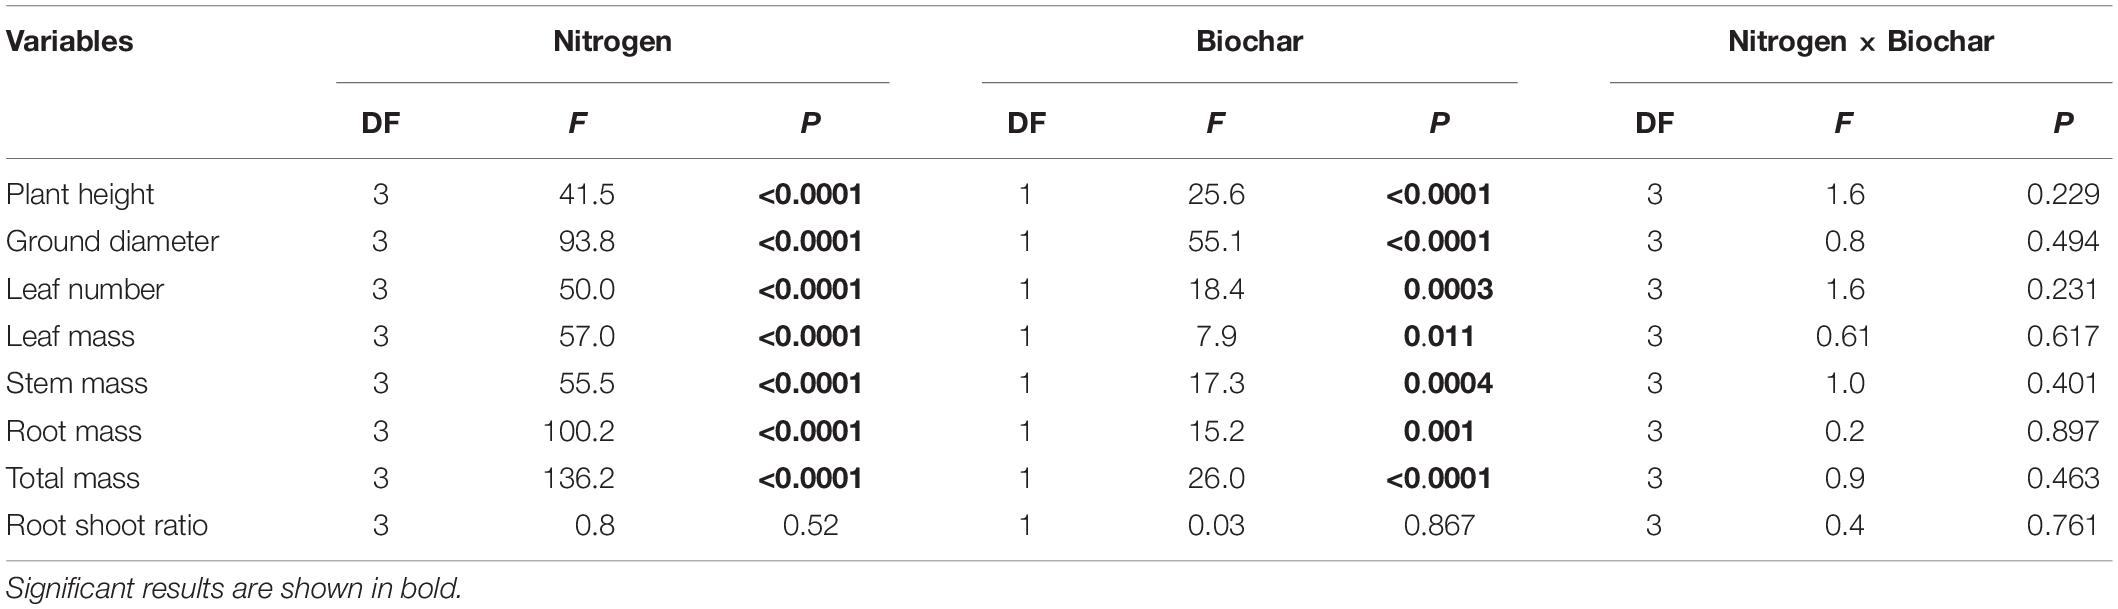
Table 2. Dependence of plant growth and biomass on N (0, 100, 200, and 300 mg N kg–1 dry soil) and biochar addition (control and biochar addition) and their interactions in two-way ANOVAs.
Leaf TN, stem TN, and root TN differed significantly between levels of N addition (P < 0.0001; Table 3). Leaf, stem and root TN content of all treatments ranged from 11.73 g kg–1 to 17.70 g kg–1,7.84 g kg–1 to 14.84 g kg–1, and 9.76 g kg–1 to 14.85 g kg–1 (Supplementary Figure 2). Leaf TP, TK, stem TP, TK, root TP, and TK differed significantly between levels of biochar addition (P < 0.01; Table 3). Compared with control, biochar increased TP content in leaves and roots (+20.63 and +14.62%), respectively (P < 0.05; Supplementary Figure 2). Biochar increased TK content in leaves, stems, and roots (+19.78, 32.44, 33.00%), respectively (P < 0.05; Supplementary Figure 2).
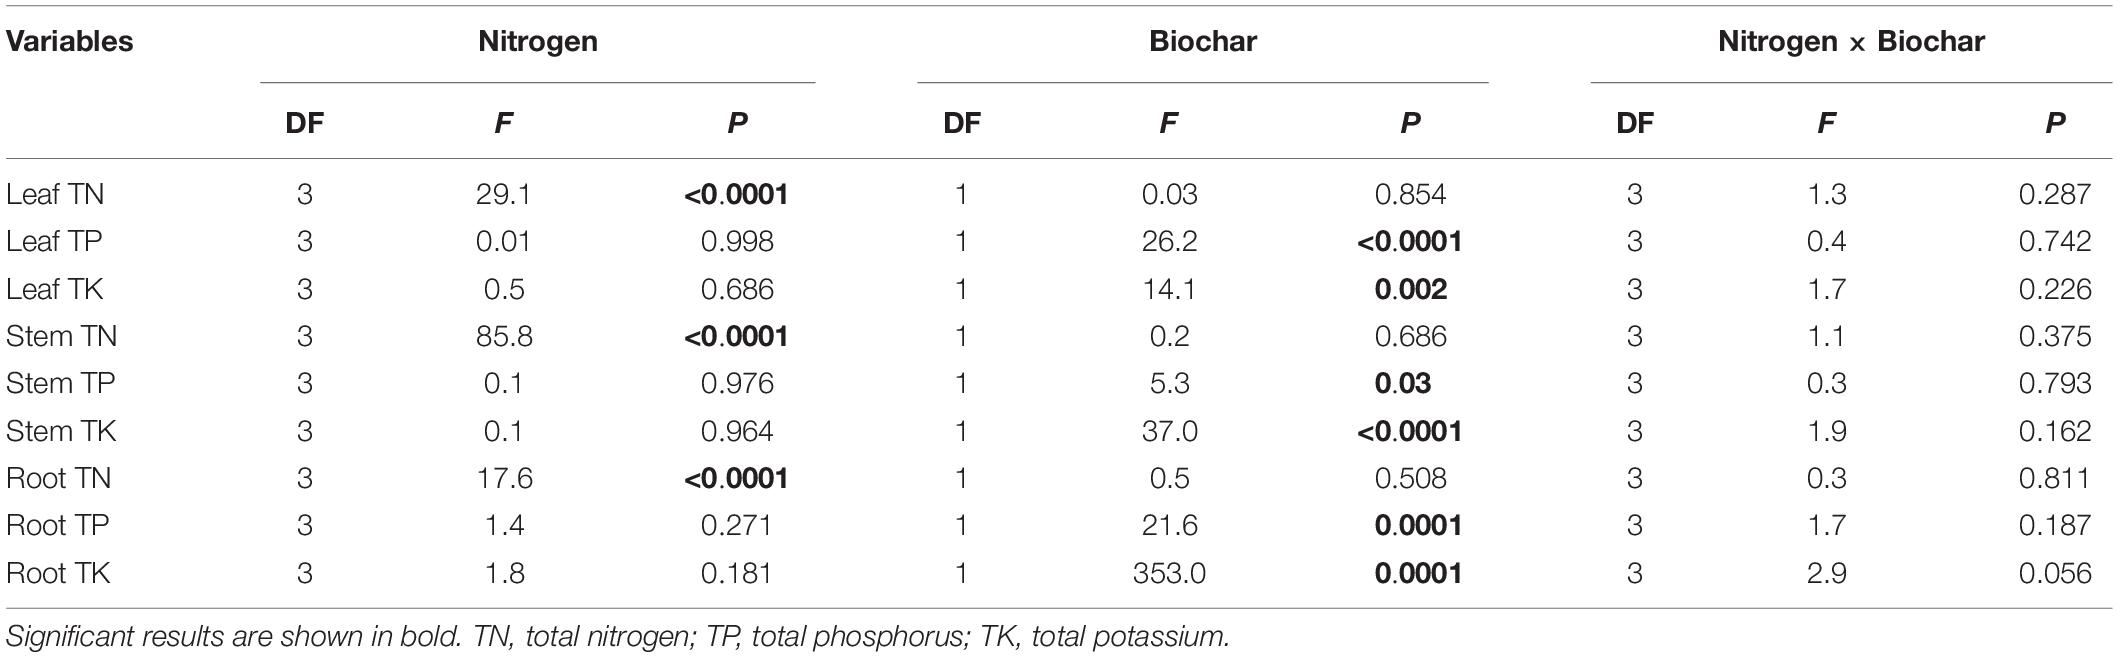
Table 3. Dependence of TN, TP, and TK in leaf, stem and root on N (0,100,200 and 300 mg N kg–1 dry soil) and biochar addition (control and biochar addition) and their interactions in two-way ANOVAs.
Gas exchange parameters and chlorophyll fluorescence parameters had significant responses to nitrogen addition. At the same time, biochar affects most physiological indicators (P < 0.01; Table 4). The mean values of Pn, Gs, Tr, and WUEL became larger as N addition increased (Supplementary Figure 3). Nitrogen and biochar had significant interaction on Pn and Tr (P < 0.001; Table 4 and Supplementary Figure 3). For all nitrogen and biochar levels, the maximum mean values of Pn and Tr were 7.82 μmol CO2 m–2 s–1 and 1.99 mmol H2O m–2 s–1 as compared to control (Supplementary Figure 3). α, ETRmax, Ik, Fv/Fm, Y(II), and SPAD differed significantly among different levels in N and between two different levels in biochar addition (P < 0.05; Table 4 and Supplementary Figure 4). The maximum mean values of α, ETRmax, Ik, Fv/Fm, Y(II), and SPAD are 0.18 electrons photons–1, 35.08 μmol m–2 s–1, 199.90 μmol m–2 s–1, 0.84, 0.36, and 42.73 (Supplementary Figure 4).
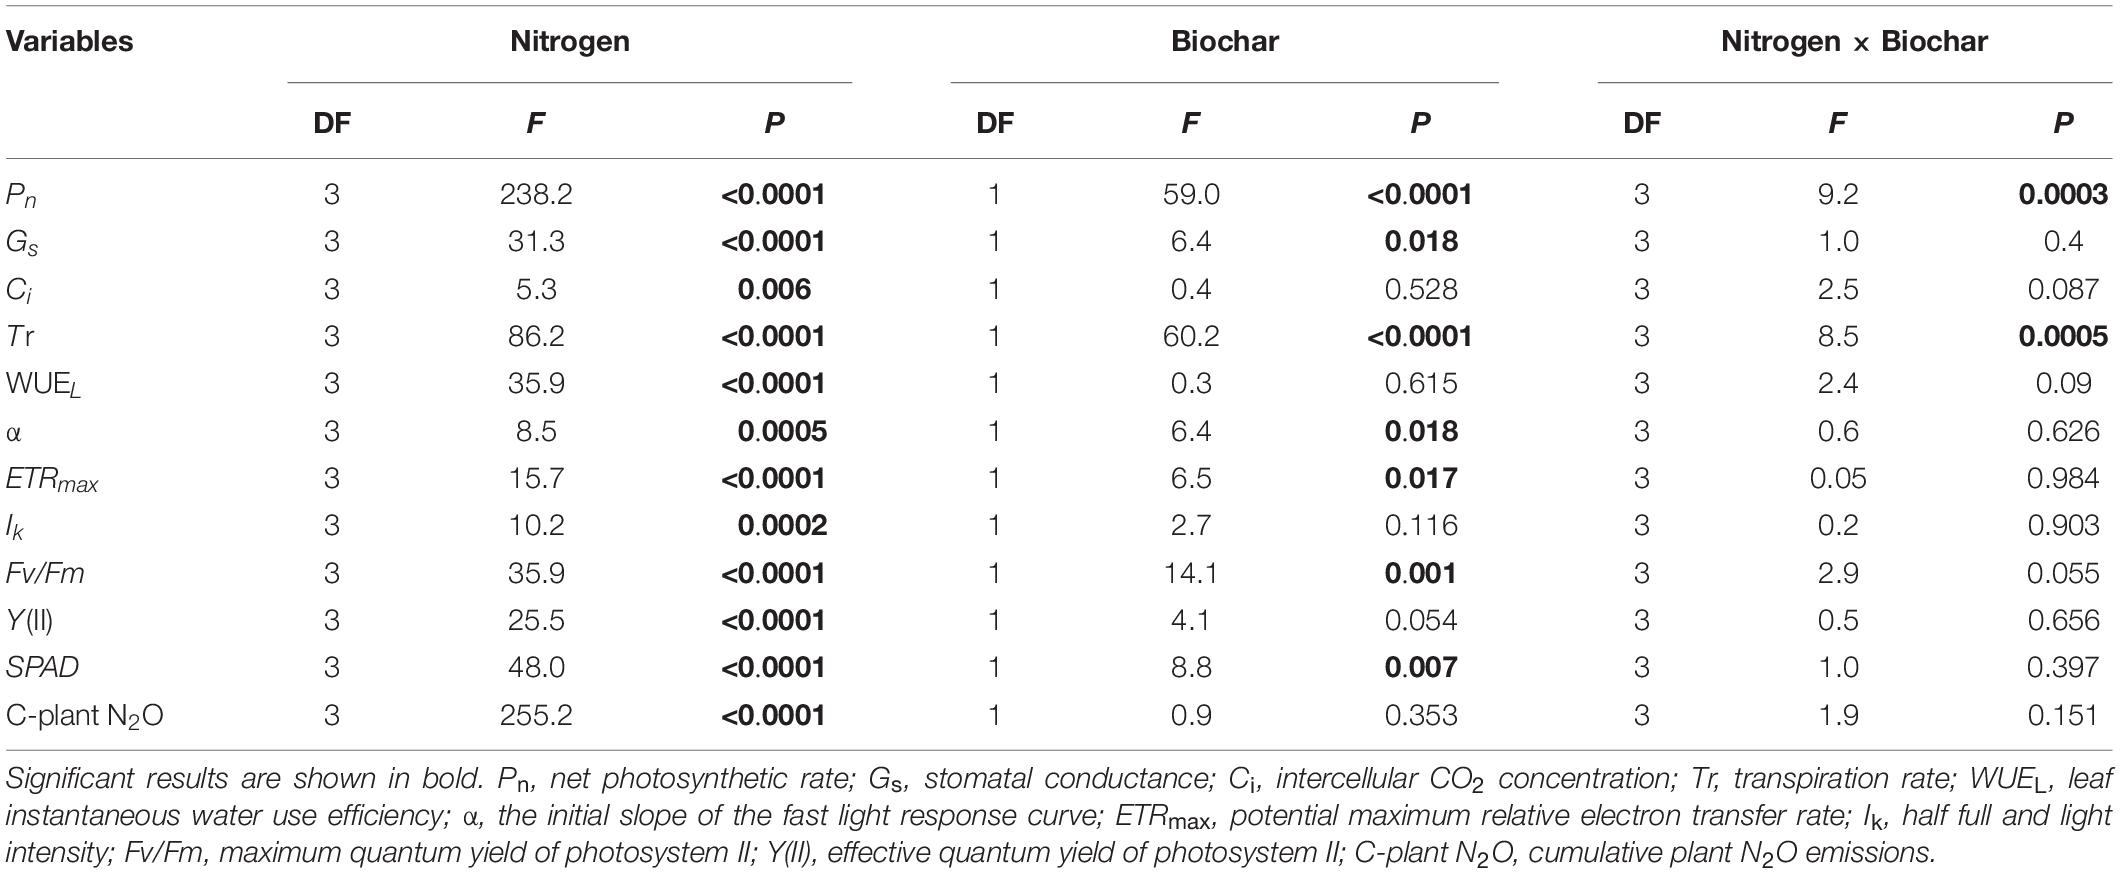
Table 4. Dependence of plant physiological parameters and plant N2O emissions on N (0, 100, 200, and 300 mg N kg–1 dry soil) and biochar addition (control and biochar addition) and their interactions in two-way ANOVAs.
Plant N2O emissions were significantly affected by N addition and increased with N addition levels (Table 4 and Figure 2). No significant differences in cumulative plant N2O emissions were recorded between biochar and control conditions (Figure 2). In addition, the leaf area of C. camphora seedlings was also increased by N and biochar during the study based on the dynamics (Supplementary Figure 5). Plant N2O emission rates were significantly affected by N addition and increased with N addition levels (Supplementary Figure 6). However, the plant N2O emission rates had no significant difference between the two different levels of biochar addition (Supplementary Figure 6). Plant N2O emissions were positively correlated with leaf mass (Figure 3, R2 = 0.74, P < 0.0001), leaf TN (R2 = 0.69, P < 0.0001), total mass (R2 = 0.80, P < 0.0001), leaf area (R2 = 0.76, P < 0.0001), Pn (R2 = 0.75, P < 0.0001), Gs (R2 = 0.63, P < 0.0001), Tr (R2 = 0.61, P < 0.0001), WUEL (R2 = 0.67, P < 0.0001), α (R2 = 0.34, P = 0.0005), ETRmax (R2 = 0.49, P < 0.0001), Ik (R2 = 0.44, P < 0.0001), Fv/Fm (R2 = 0.59, P < 0.0001), Y(II) (R2 = 0.61, P < 0.0001), and SPAD (Figure 3, R2 = 0.74, P < 0.0001). However, it was negatively correlated with Ci (Figure 3, R2 = 0.28, P = 0.0018).
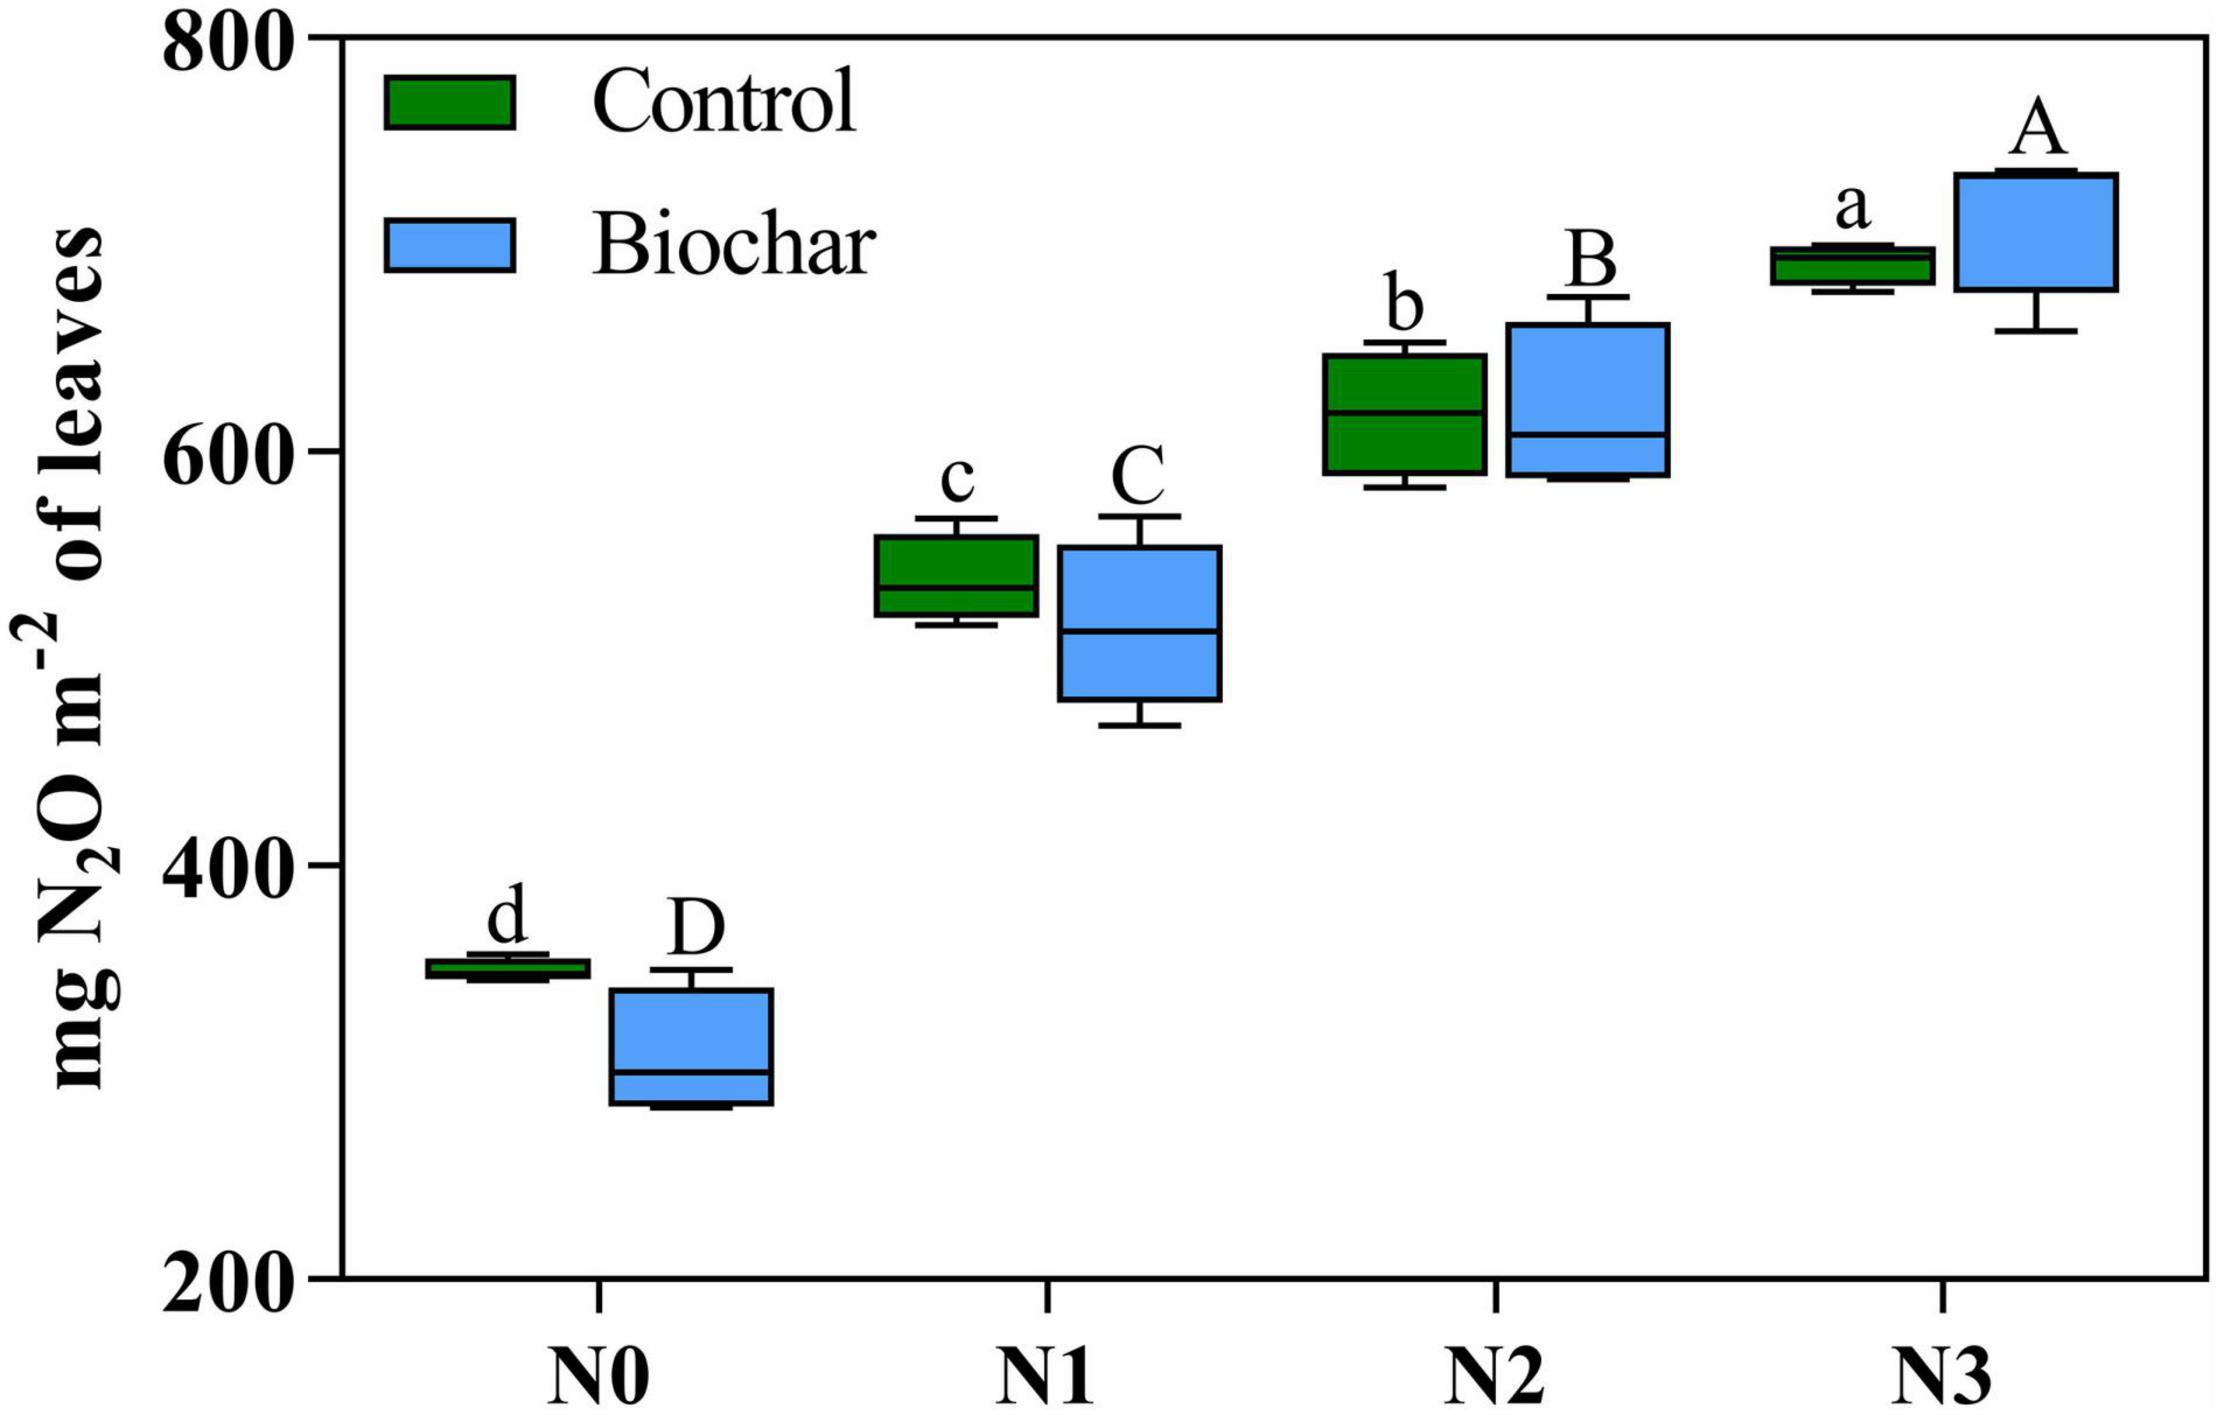
Figure 2. Cumulative plant N2O emissions in biochar and control conditions at different nitrogen levels. Significant differences between nitrogen additions are indicated by a small letter (control, BC0), or a capital letter (biochar, BC1). There is no difference between biochar and control conditions. Tukey post-hoc tests were used to determine significance among levels of nitrogen.
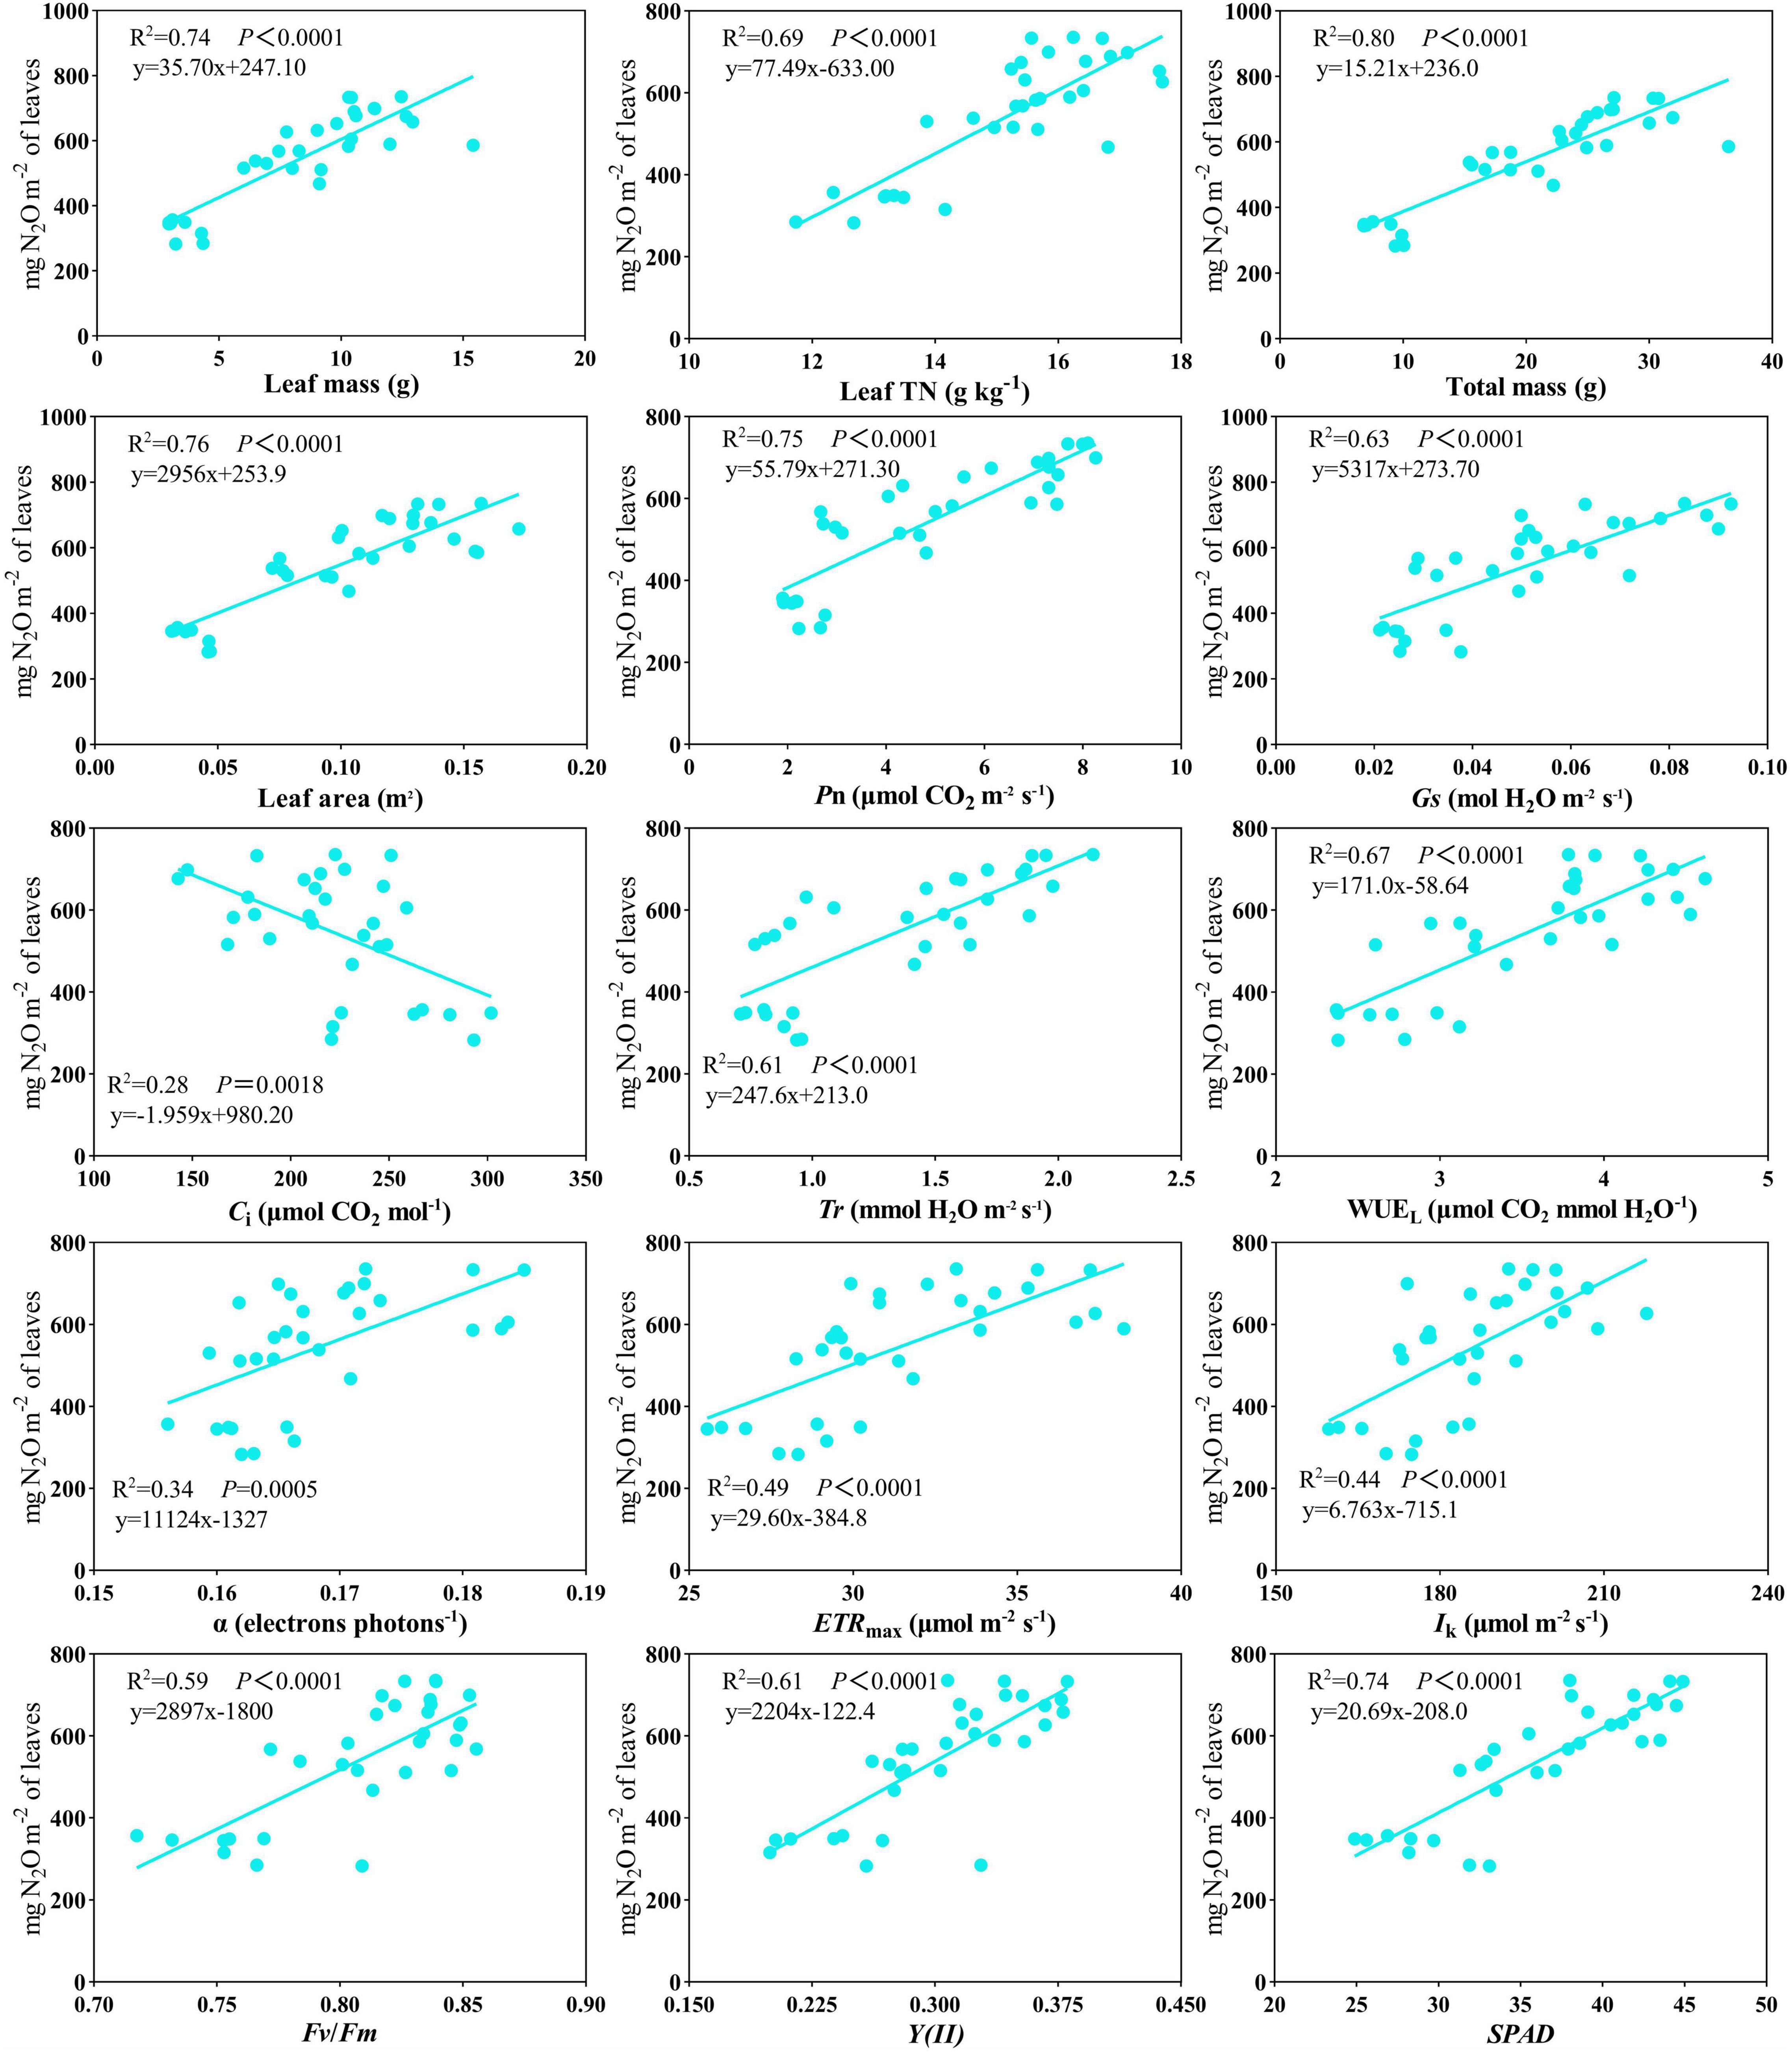
Figure 3. Scatterplot of the relationship of plant N2O emissions versus leaf mass, leaf TN, total mass, leaf area, Pn, Gs, Ci, Tr, WUEL, α, ETRmax, Ik, Fv/Fm, Y(II), and SPAD. Lines indicate significant relations.
To further clarify the relationship between leaf traits and plant N2O emissions, a principal component analysis (PCA) was performed using leaf area, leaf biomass, leaf TN, leaf TP, and physiological indicators (Figure 4). PC1 and PC2 accounted for 68.10 and 9.30% of the investigated variation, respectively. Leaf area, LM, leaf TN, Pn, Gs, Tr, WUEL, α, ETRmax, Ik, Fv/Fm, Y(II), and SPAD were more influenced by PC1, while leaf TP and Ci were more influenced by PC2. At the same time, each treatment has a good degree of differentiation.
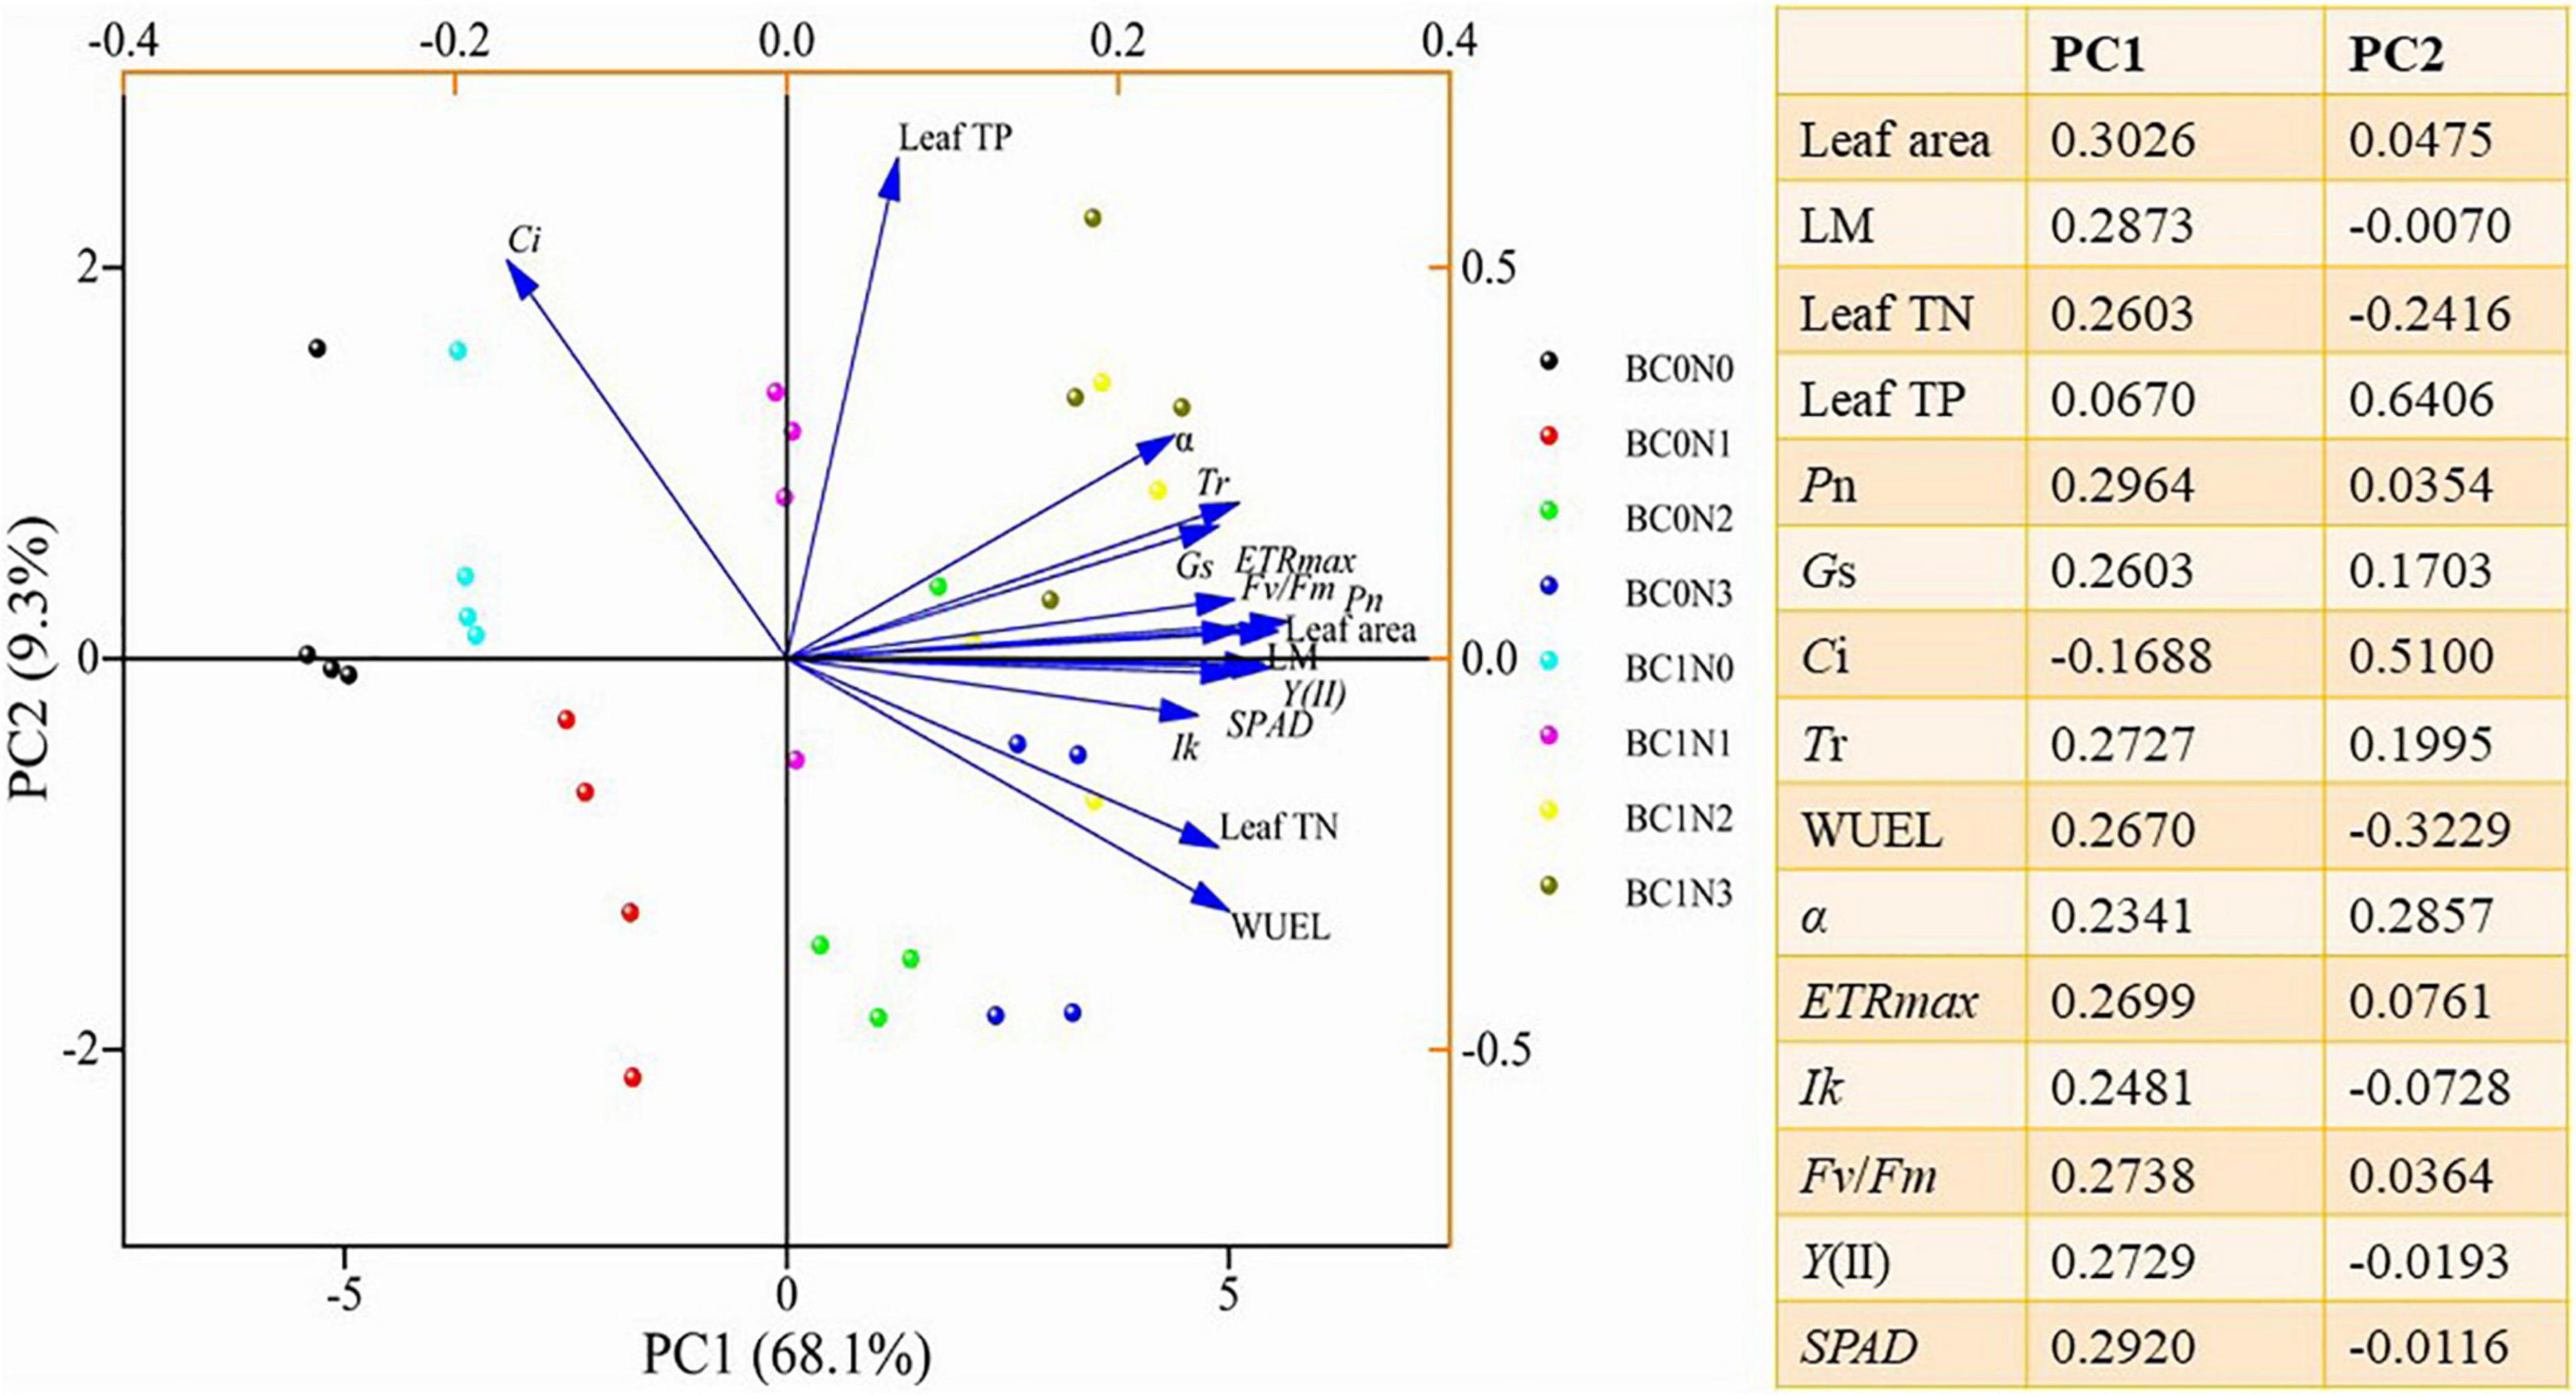
Figure 4. Principal component analysis (PCA) plots of plant functional traits under biochar and control conditions (BC0, control; BC1, biochar addition) at different nitrogen (0 mg N kg–1 dry soil, N0; 100 mg N kg–1 dry soil, N1; 200 mg N kg–1 dry soil, N2; 300 mg N kg–1 dry soil, N3) levels.
The results are exhibited in Figure 5. As for the model fit indices, which are shown in the lower right, all indices indicate that our hypothesized model was acceptable [χ2/df = 7.586 (P < 0.001), AIC = 636.604; BIC = 708.425; CFI = 0.461; RMSEA = 0.461; SRMR = 0.244]. Additionally, the modification indices were low, indicating that our model could not be further improved by adding omitted relationships.
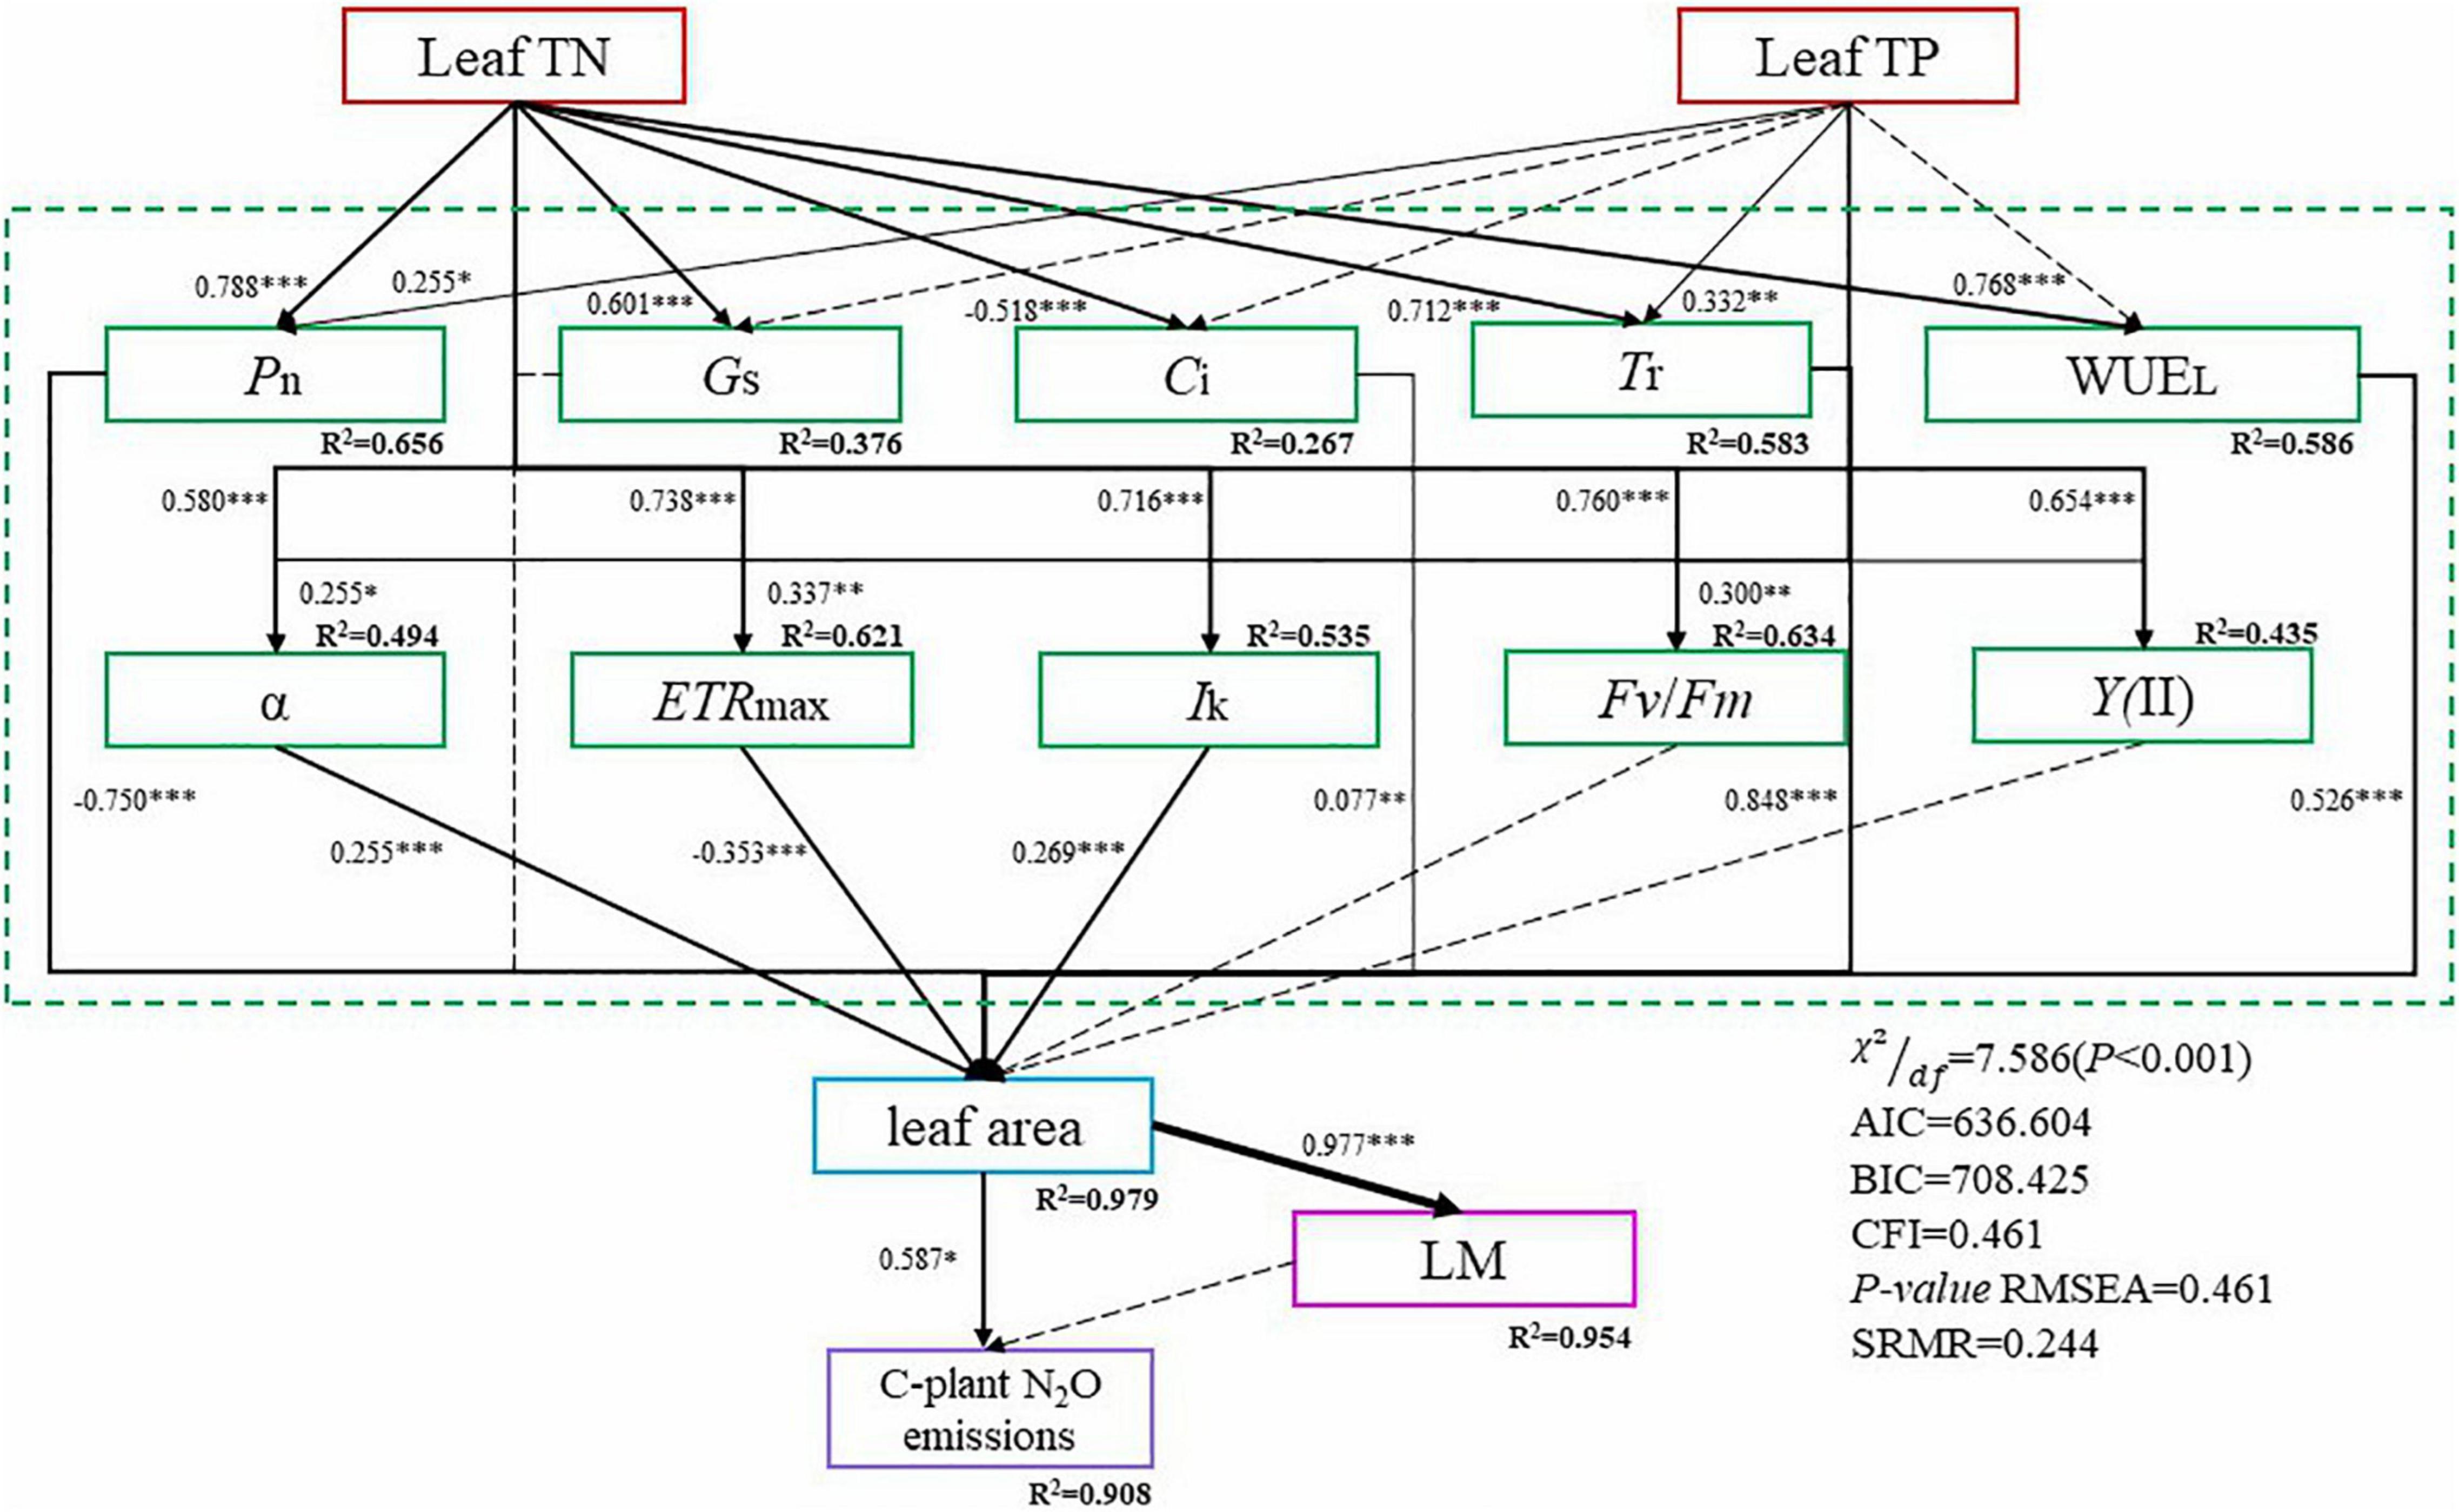
Figure 5. Structural equation models (SEM) were used to evaluate the effects of leaf traits on plant N2O emissions. Dashed lines represent non-significant relationships, solid lines represent significant relationships (*P < 0.05; **P < 0.01; ***P < 0.001). Numbers next to the arrows represent the (positive or negative) standardized path coefficients. R2 values represent the amount of variance interpreted by the model for the response variables.
The results revealed that leaf traits do affect plant N2O emissions in a direct or indirect way. As a multi-staged path model, we could read from the graph that leaf TN significantly affected Pn, Gs, Ci, Tr, WUEL, α, ETRmax, Ik, Fv/Fm, Y(II). Among them, Leaf TN would significantly increase the Pn, Gs, Tr, WUEL, α, ETRmax, Ik, Fv/Fm, Y(II), while significantly decreasing the Ci. For Leaf TP, it has a significant influence on Pn, Tr, α, ETRmax, and Fv/Fm. Leaf TP would significantly increase the above indicators. Pn, Ci, Tr, WUEL, α, ETRmax, and Ik all had a significant impact on leaf area. Pn and ETRmax would significantly decrease the leaf area, while the rest would significantly increase the leaf area. Leaf area influences leaf mass and cumulative plant N2O emissions significantly and positively, while leaf mass doesn’t have a significant influence on cumulative plant N2O emissions. The relationship between the remaining variables was not significant, but improved the model fitting.
Nitrogen is an essential macronutrient and plays an important role in plant growth and development (Galloway et al., 2002). Biochar has positive effects on plant growth (Dong et al., 2015; Purakayastha et al., 2019). Plant biomass was increased by animal carcass-derived biochar addition (Chen et al., 2020). These results support that N and biochar addition significantly increased the growth indexes (plant height, ground diameter, leaf number, biomass, etc.) of C. camphora seedlings (Supplementary Figure 1). In this study, both nitrogen and biochar increased leaf mass, stem mass, and root mass (Supplementary Figure 1), indicating that nitrogen and biochar’s effects on root-shoot ratio might have been offset by their effects on aboveground biomass and underground biomass. Recent studies have shown that net photosynthesis rate (Pn) and transpiration rate (Tr) increased by 19 and 40% in the biochar treatments, respectively, compared to control (Zulfiqar et al., 2021). Biochar significantly increased net photosynthetic rate, transpiration rate, stomatal conductance, and water use efficiency during the plant growth period, relative to control (Wang et al., 2021). Chlorophyll fluorescence parameters can effectively reflect the absorption, utilization, and transformation of light energy. Fv/Fm stands for the maximum quantum yield of PSII, which can reflect the potential maximum light energy conversion efficiency of plants. Y(II) represents the actual photosynthetic quantum yield of PSII, which can reflect the current actual light energy conversion efficiency of photosynthetic organs (Baker, 2008). Research has shown that biochar has great potential in improving chlorophyll fluorescence (Wang et al., 2021). That’s probably because biochar has the effect of increasing the chlorophyll content of leaves (Feng et al., 2021), which can ensure the synthesis of various enzymes and electron transporters in the process of carbon assimilation in photosynthesis, thereby improving the function of leaf photosynthesis (Hou et al., 2021).
Plant N2O emissions were affected by N but not by biochar addition (Figure 2). With the increase of N addition levels, plant N2O emissions increased consistently (Figure 2). Since leaves have been proved to be the main place emitting N2O, factors influencing leaf area might also impact plant N2O emissions. In this study, both biochar and N increased leaf area (Supplementary Figure 5). Biochar had no effect on plant N2O emissions (Table 4, Figure 2, and Supplementary Figure 6), indicating biochar’s effects on plant N2O emissions might have been offset by its effects on N2O production and leaf area. Indeed, plant N2O emissions may be a phenomenon emitting N2O that was produced by plants or emitting soil originated N2O to atmosphere (Chang et al., 1998). Even though it was not studied here, plant production of N2O by C. camphora seedlings could be possible since a 15N isotopic labelling study revealed that N2O released from wheat leaves originated from NO3– assimilation by wheat plants instead of microorganisms in the rhizosphere (Smart and Bloom, 2001). Plant-mediated N2O emissions have been reported in agricultural, wetland, and forest plants (Pihlatie et al., 2005). N2O produced in soil could also be transported to atmosphere by transpiration streams of plants (Pihlatie et al., 2005). In our study, biochar mitigated soil N2O emissions while increasing leaf area (unpublished data). Therefore, N2O produced in the soil and emitted by plants could not be the important source of N2O emissions by C. camphora seedlings. However, N could increase plant N2O emissions by providing more N substrate readily available for plant, increasing NO3– and NO2– assimilation by plant roots and leaves, respectively, which will directly enhance plant N2O emissions (Smart and Bloom, 2001; Pihlatie et al., 2005). The cumulative N2O emissions of plants increase with the increase of nitrogen levels (Figure 2). Leaf nitrogen content is directly proportional to the N2O emission of plants (Figure 3). The rate of N2O release by plants is related to the utilization of nitrogen by plants, which may be due to the release of nitrogen absorbed by plants, especially NO3–. After being reduced to NO2– by nitrate reductase (NR), part of it is further reduced to N2O and released. NR is a substrate inducible enzyme. When nitrogen is added to the soil, plants grow well, have high NR activity, and produce more N2O. With the increase in nitrogen levels, plants grow fast and produce a large amount of N2O (Li and Chen, 1993). Soybean and maize seedlings can release N2O by themselves, and the N2O release is related to the amount of nitrogen and phosphorus application. The direct emission of N2O by plants may be a physiological defence of plants to avoid excessive accumulation of NO3– under the restriction of other growth factors, which will lead to a decline in the nitrogen use efficiency of plants (Chen et al., 1995).
Our results provide powerful data for understanding the N2O emission patterns of seedlings during their growing period (Supplementary Figure 6). Importantly, we found a close relationship between leaf traits and plant N2O emissions (Figures 3–5). Our continuous emission measurement method is an effective improvement over the traditional indoor study because it overcomes the influence of the device during seedling growth and better reflects the temporal variation of N2O emission flux (Supplementary Figure 6). Therefore, our method is suitable for measuring plant N2O emissions during seedling growth and can be used to explore deeper association analysis.
Leaf photosynthetic capacity is related to leaf N concentration (Figures 4, 5). N-rich compounds [ribulose-1,5-bisphosphate carboxylase/oxygenase (Rubisco)] play an important role in the biochemical fixation of carbon dioxide (Field and Mooney, 1986). The formation of N2O in plants is a complex physiological process, including photosynthesis, nitrogen assimilation, and transpiration (Hu et al., 2021). Leaf TN, Tr, α, ETRmax, Ik, Fv/Fm, Y(II), and SPAD were all positively correlated with plant N2O emissions (Figure 3). The relationship between stomatal conductance, leaf nitrogen content, and nitrogen oxide emission rate can explain the variation of plant capacity to release atmospheric nitrogen oxides (Teklemariam and Sparks, 2006). A correlation between transpiration rates and nitrogen emissions was found in nitrogen compounds released by plants (Stutte et al., 1979). Studies have shown that transpiration rate and other physiological processes affect the transport and emission of N2O in plants (Chang et al., 1998; Pihlatie et al., 2005; Borah and Baruah, 2016). The above research results are similar to our results. Leaf nitrogen content, stomatal conductance, and transpiration rate are significantly positively correlated with plant N2O emission (Figure 3). Nitrite assimilation in chloroplasts can produce intermediates that react to produce N2O. At the same time, there is a negative correlation between N2O emission and NO2 assimilation (Dean and Harper, 1986; Hakata et al., 2003). Many scholars have discussed the possible sites, mechanisms, and enzymes involved in N2O production in plant cells. The mitochondria of plants have a protective mechanism to increase NO scavenging. NADH might act as an electron donor to reduce cytochrome c oxidase (CcO), leading to the conversion of NO to N2O (de Oliveira et al., 2008; Gupta et al., 2016; Timilsina et al., 2020). The phenomenon that photosynthesis is closely related to plant N2O emission does not only appear in forest ecosystems. In aquatic ecosystems, algae contribute significantly to N2O emissions. The green microalga Chlamydomonas reinhardtii reduces NO into N2O using photosynthetic electron transport and is catalyzed by flavodiiron proteins. The above research provides a new mechanistic understanding of N2O production by eukaryotic phototrophs (Burlacot et al., 2020).
Structural equation modelling revealed the process of leaf traits affecting plant N2O emissions (Figure 5). Nitrogen and phosphorus in leaves are essential nutrients for carbon assimilation in photosynthesis, which can affect the plant’s photosynthesis (Mo et al., 2019). Photosynthesis is closely related to chlorophyll fluorescence (Mareckova et al., 2019). Leaf area was affected by photosynthesis, and plant N2O emission was closely related to leaf area (Figure 5). The formation of plant N2O emission is a complex physiological process closely linked with various steps, and the enzymes and pathways involved need to be further studied.
In conclusion, our study indicates that nitrogen and animal carcass-derived biochar addition affect the functional traits of C. camphora seedlings. Nitrogen addition substantially increases plant N2O emissions. All seedling biomass was consistently increased by biochar addition, indicating pig carcass biochar will potentially benefit the leaf-harvesting C. camphora industry. However, while seedling leaf area was increased by biochar, plant N2O emissions were not influenced by biochar. As an important source of atmospheric N2O, plant N2O emissions deserve more attention. Plant N2O emission may be closely related to leaf TN, leaf TP, Pn, Ci, Tr, WUEL, α, ETRmax, and Ik. Future studies on the mechanisms underlining N and biochar’s effects on plant N2O emissions should be conducted, especially in plantations with intensive N fertilization practices.
The original contributions presented in the study are included in the article/Supplementary Material, further inquiries can be directed to the corresponding author.
CZ, HL, and LZ conceived and designed the study. LL, KW, YL, SZ, and SH collected the samples and performed the physiological measurements. XG commented on the manuscript. CZ and HL wrote the manuscript. LZ supervised the whole work. All authors contributed to the article and approved the submitted version.
This study was supported by the National Natural Science Foundation of China (31770749) and the Jiangxi Double Thousand Plan Science and Technology Innovation High-end Talent Project.
The authors declare that the research was conducted in the absence of any commercial or financial relationships that could be construed as a potential conflict of interest.
All claims expressed in this article are solely those of the authors and do not necessarily represent those of their affiliated organizations, or those of the publisher, the editors and the reviewers. Any product that may be evaluated in this article, or claim that may be made by its manufacturer, is not guaranteed or endorsed by the publisher.
We thank Junhuo Cai and Mingyin Yao for their help in providing study space and materials and Weixun Feng, Ting Zhu, and Xue Liu for their assistance in the laboratory work.
The Supplementary Material for this article can be found online at: https://www.frontiersin.org/articles/10.3389/fpls.2022.905537/full#supplementary-material
Supplementary Figure 1 | Plant height, ground diameter, leaf number, leaf mass, stem mass, root mass, total mass, and root shoot ratio in biochar and control conditions at different nitrogen levels. Significant differences between nitrogen additions are indicated by a small letter (control, BC0), or a capital letter (biochar, BC1). Tukey post-hoc tests were used to determine the significance of the levels of nitrogen. Differences between biochar and control conditions within the same nitrogen levels are indicated with a star, *P < 0.05; **P < 0.01; ***P < 0.001.
Supplementary Figure 2 | Leaf TN, TP, TK, stem TN, TP, TK, root TN, TP, TK, in biochar and control conditions at different nitrogen levels. Significant differences between nitrogen additions are indicated by a small letter (control, BC0), or a capital letter (biochar, BC1). Tukey post-hoc tests were used to determine the significance of the levels of nitrogen. Differences between biochar and control conditions within the same nitrogen levels are indicated with a star, *P < 0.05; **P < 0.01.
Supplementary Figure 3 | Photosynthetic gas exchange parameters of Pn, Gs, Ci, Tr, and WUEL in biochar and control conditions at different nitrogen levels. Significant differences between nitrogen additions are indicated by a small letter (control, BC0), or a capital letter (biochar, BC1). Tukey post-hoc tests were used to determine the significance of the levels of nitrogen. Differences between biochar and control conditions within the same nitrogen levels are indicated with a star, *P < 0.05; **P < 0.01; ***P < 0.001.
Supplementary Figure 4 | Chlorophyll fluorescence kinetic parameters of α, ETRmax, Ik, Fv/Fm, and Y(II) in biochar and control conditions at different nitrogen levels. Significant differences between nitrogen additions are indicated by a small letter (control, BC0), or a capital letter (biochar, BC1). Tukey post-hoc tests were used to determine the significance of the levels of nitrogen. Differences between biochar and control conditions within the same nitrogen levels are indicated with a star, *P < 0.05; **P < 0.01.
Supplementary Figure 5 | Dynamics of leaf area (10–2 m2) as affected by nitrogen (control, Con; 100 mg N kg–1 dry soil, N1; 200 mg N kg–1 dry soil, N2; 300 mg N kg–1 dry soil, N3), biochar (control, BC0; biochar addition, BC1) addition over the study. Results of ANOVA with time as random effects are shown. NS, not significant; ****P < 0.0001.
Supplementary Figure 6 | Dynamics of plant N2O emission rates as affected by nitrogen (control, Con; 100 mg N kg–1 dry soil, N1; 200 mg N kg–1 dry soil, N2; 300 mg N kg–1 dry soil, N3) or biochar addition (control, BC0; biochar addition, BC1) over the study. Results of ANOVA with time as random effects are shown. NS, not significant; ****P < 0.0001.
Abalos, D., van Groenigen, J. W., and De Deyn, G. B. (2018). What plant functional traits can reduce nitrous oxide emissions from intensively managed grasslands? Glob. Change Biol. 24, E248–E258. doi: 10.1111/gcb.13827
Babu, K. N., Sajina, A., Minoo, D., John, C. Z., Mini, P. M., Tushar, K. V., et al. (2003). Micropropagation of camphor tree (Cinnamomum camphora). Plant Cell Tissue Organ Cult. 74, 179–183. doi: 10.1023/A:1023988110064
Baker, N. R. (2008). Chlorophyll fluorescence: a probe of photosynthesis in vivo. Annu. Rev. Plant Biol. 59, 89–113. doi: 10.1146/annurev.arplant.59.032607.092759
Borah, L., and Baruah, K. K. (2016). Nitrous oxide emission and mitigation from wheat agriculture: association of physiological and anatomical characteristics of wheat genotypes. Environ. Sci. Pollut. Res. Int. 23, 709–721. doi: 10.1007/s11356-015-5299-4
Bowatte, S., Newton, P. C. D., Theobald, P., Brock, S., Hunt, C., Lieffering, M., et al. (2014). Emissions of nitrous oxide from the leaves of grasses. Plant Soil 374, 275–283. doi: 10.1007/s11104-013-1879-6
Burlacot, A., Richaud, P., Gosset, A., Li-Beisson, Y., and Peltier, G. (2020). Algal photosynthesis converts nitric oxide into nitrous oxide. Proc. Natl. Acad. Sci. U.S.A. 117, 2704–2709. doi: 10.1073/pnas.1915276117
ButterbachBahl, K., Gasche, R., Breuer, L., and Papen, H. (1997). Fluxes of NO and N2O from temperate forest soils: impact of forest type, N deposition and of liming on the NO and N2O emissions. Nutr. Cycling Agroecosyst. 48, 79–90. doi: 10.1023/A:1009785521107
Chang, C., Janzen, H. H., Cho, C. M., and Nakonechny, E. M. (1998). Nitrous oxide emission through plants. Soil Sci. Soc. Am. J. 62, 35–38. doi: 10.2136/sssaj1998.03615995006200010005x
Chapuis-Lardy, L., Wrage, N., Metay, A., Chotte, J. L., and Bernoux, M. (2007). Soils, a sink for N2O? A Rev. Global Change Biol. 13, 1–17. doi: 10.1111/j.1365-2486.2006.01280.x
Chen, C. H., Zheng, Y. J., Liu, S. A., Zhong, Y. D., Wu, Y. F., Li, J., et al. (2017). The complete chloroplast genome of Cinnamomum camphora and its comparison with related Lauraceae species. PeerJ 5:e3820. doi: 10.7717/peerj.3820
Chen, H. B., Yang, X., Wang, H. L., Sarkar, B., Shaheen, S. M., Gielen, G., et al. (2020). Animal carcass- and wood-derived biochars improved nutrient bioavailability, enzyme activity, and plant growth in metal-phthalic acid ester co-contaminated soils: a trial for reclamation and improvement of degraded soils. J. Environ. Manage. 261:110246. doi: 10.1016/j.jenvman.2020.110246
Chen, J., Wang, C., Wu, F. H., Wang, W. H., Liu, T. W., Chen, J., et al. (2015). Variation of nitric oxide emission potential in plants: a possible link to leaf N content and net photosynthetic activity. J. Plant Ecol. 8, 313–320. doi: 10.1093/jpe/rtu015
Chen, Q., Wang, Y. P., Zhang, Z. J., Liu, X. M., Li, C., and Ma, F. W. (2022). Arginine increases tolerance to nitrogen deficiency in Malus hupehensis via alterations in photosynthetic capacity and amino acids metabolism. Front. Plant Sci. 12:772086. doi: 10.3389/fpls.2021.772086
Chen, X., Boeckx, P., Shen, S., and Van Cleemput, O. (1999). Emission of N2O from rye grass (Lolium perenne L.). Biol. Fertil. Soils 28, 393–396. doi: 10.1007/s003740050510
Chen, X., Shen, S. M., Zhang, L., Wu, J., and Wang, X. Q. (1995). A preliminary research on the effect of nitrogen and phosphorus supply on N2O emission by crops. Chin. J. Appl. Ecol. 6, 104–105.
de Oliveira, H. C., Wulff, A., Saviani, E. E., and Salgado, I. (2008). Nitric oxide degradation by potato tuber mitochondria: evidence for the involvement of external NAD(P)H dehydrogenases. BBA Bio. 1777, 470–476. doi: 10.1016/j.bbabio.2008.02.006
Dean, J. V., and Harper, J. E. (1986). Nitric-oxide and nitrous-oxide production by soybean and winged bean during the invivo nitrate reductase assay. Plant Physiol. 82, 718–723. doi: 10.1104/pp.82.3.718
Deng, B. L., Liu, X. S., Zheng, L. Y., Liu, Q., Guo, X. M., and Zhang, L. (2019). Effects of nitrogen deposition and UV-B radiation on seedling performance of chinese tallow tree (Triadica sebifera): a photosynthesis perspective. Front. Ecol. Manage. 433, 453–458. doi: 10.1016/j.foreco.2018.11.038
Diaz-Pines, E., Heras, P., Gasche, R., Rubio, A., Rennenberg, H., Butterbach-Bahl, K., et al. (2016). Nitrous oxide emissions from stems of ash (Fraxinus angustifolia Vahl) and European beech (Fagus sylvatica L.). Plant Soil 398, 35–45. doi: 10.1007/s11104-015-2629-8
Dong, D., Feng, Q. B., McGrouther, K., Yang, M., Wang, H. L., and Wu, W. X. (2015). Effects of biochar amendment on rice growth and nitrogen retention in a waterlogged paddy field. J. Soils Sediments 15, 153–162. doi: 10.1007/s11368-014-0984-3
Eilers, P. H. C., and Peeters, J. C. H. (1988). A model for the relationship between light-intensity and the rate of photosynthesis in phytoplankton. Ecol. Modell. 42, 199–215. doi: 10.1016/0304-3800(88)90057-9
Fang, X. M., Li, Y. S., Nie, J., Wang, C., Huang, K. H., Zhang, Y. K., et al. (2018). Effects of nitrogen fertilizer and planting density on the leaf photosynthetic characteristics, agronomic traits and grain yield in common buckwheat (Fagopyrum esculentum M.). Field Crops Res. 219, 160–168. doi: 10.1016/j.fcr.2018.02.001
Feng, W. Y., Yang, F., Cen, R., Liu, J., Qu, Z. Y., Miao, Q. F., et al. (2021). Effects of straw biochar application on soil temperature, available nitrogen and growth of corn. J. Environ. Manage. 277:111331. doi: 10.1016/j.jenvman.2020.111331
Field, C. B., and Mooney, H. A. (1986). “The photosynthesis-nitrogen relationship in wild plants,” in On the Economy of Plant Form and Function, ed. T. Givnish (Cambridge: Cambridge University Press), 25e55.
Galloway, J. N., Cowling, E. B., Seitzinger, S. P., and Socolow, R. H. (2002). Reactive nitrogen: too much of a good thing? Ambio 31, 60–63. doi: 10.1579/0044-7447-31.2.60
Genty, B., Briantais, J. M., and Baker, N. R. (1989). The relationship between the quantum yield of photosynthetic electron-transport and quenching of chlorophyll fluorescence. Biochim. Biophys. Acta 990, 87–92. doi: 10.1016/S0304-4165(89)80016-9
Gong, X. W., Liu, C. J., Dang, K., Wang, H. L., Du, W. L., Qi, H., et al. (2022). Mung bean (Vigna radiata L.) source leaf adaptation to shading stress affects not only photosynthetic physiology metabolism but also control of key gene expression. Front. Plant. Sci. 13:753264. doi: 10.3389/fpls.2022.753264
Goshima, N., Mukai, T., Suemori, M., Takahashi, M., Caboche, M., and Morikawa, H. (1999). Emission of nitrous oxide (N2O) from transgenic tobacco expressing antisense NiR mRNA. Plant J. 19, 75–80. doi: 10.1046/j.1365-313X.1999.00494.x
Govindjee Papageorgiou, G. C. (2004). Chlorophyll a Fluorescence: A Signature of Photosynthesis. Dordrecht:Springer Publishers.
Grace, J. B. (2006). Structural Equation Modeling and Natural Systems. Cambridge, UK: Cambridge University Press.
Gupta, A. K., Kumari, A., Mishra, S., Wany, A., and Gupta, K. J. (2016). “The functional role of nitric oxide in plant mitochondrial metabolism,” in Nitric Oxide and Signaling Plants, ed. D. Wendehenne 145–163. doi: 10.1016/bs.abr.2015.10.007
Hakata, M., Takahashi, M., Zumft, W., Sakamoto, A., and Morikawa, H. (2003). Conversion of the nitrate nitrogen and nitrogen dioxide to nitrous oxides in plants. Acta Biotechnol. 23, 249–257. doi: 10.1002/abio.200390032
He, L. Z., Fan, S. L., Muller, K., Wang, H. L., Che, L., Xu, S., et al. (2018). Comparative analysis biochar and compost-induced degradation of di-(2-ethylhexyl) phthalate in soils. Sci. Total Environ. 625, 987–993. doi: 10.1016/j.scitotenv.2018.01.002
Hou, W. H., Zhang, Y. X., Wang, H. J., Zhang, Q. X., Hou, M. L., Cong, B. M., et al. (2021). Effects of nitrogen application level on leaf photosynthetic characteristics and chlorophyll fluorescence characteristics of Leymus chinensis. Acta Agrestia Sinica 29, 531–536.
Hu, H., Yuan, D., Zeng, J., Yao, J., He, X., Qin, S., et al. (2021). Advances in plant nitrous oxide (N2O) emissions. Chin. J. Eco Agric. 29, 345–354.
Kitajima, M., and Butler, W. L. (1975). Quenching of chlorophyll fluorescence and primary photochemistry in chloroplasts by dibromothymoquinone. Biochim. Biophys. Acta 376, 105–115. doi: 10.1016/0005-2728(75)90209-1
Lenhart, K., Behrendt, T., Greiner, S., Steinkamp, J., Well, R., Giesemann, A., et al. (2019). Nitrous oxide effluxes from plants as a potentially important source to the atmosphere. New Phytol. 221, 1398–1408. doi: 10.1111/nph.15455
Li, N., and Chen, G. X. (1993). N2O emission by plants and influence of fertilization. Chin. J. Appl. Ecol. 4, 295–298.
Li, X. G., Cao, Y. N., Xiao, J., Salam, M. M. A., and Chen, G. C. (2022). Bamboo biochar greater enhanced Cd/Zn accumulation in Salix psammophila under non-flooded soil compared with flooded. Biochar 4:139. doi: 10.1007/s42773-022-00139-0
Machacova, K., Papen, H., Kreuzwieser, J., and Rennenberg, H. (2013). Inundation strongly stimulates nitrous oxide emissions from stems of the upland tree Fagus sylvatica and the riparian tree Alnus glutinosa. Plant Soil 364, 287–301. doi: 10.1007/s11104-012-1359-4
Machacova, K., Vainio, E., Urban, O., and Pihlatie, M. (2019). Seasonal dynamics of stem N2O exchange follow the physiological activity of boreal trees. Nat. Commun. 10:4989. doi: 10.1038/s41467-019-12976-y
Mareckova, M., Bartak, M., and Hajek, J. (2019). Temperature effects on photosynthetic performance of Antarctic lichen Dermatocarpon polyphyllizum: a chlorophyll fluorescence study. Polar Biol. 42, 685–701. doi: 10.1007/s00300-019-02464-w
Mo, Q. F., Li, Z. A., Sayer, E. J., Lambers, H., Li, Y. W., Zou, B., et al. (2019). Foliar phosphorus fractions reveal how tropical plants maintain photosynthetic rates despite low soil phosphorus availability. Funct. Ecol. 33, 503–513. doi: 10.1111/1365-2435.13252
Muller, C. (2003). Plants affect the in situ N2O emissions of a temperate grassland ecosystem. J. Plant Nutr. Soil Sci. 166, 771–773. doi: 10.1002/jpln.200321201
Neubauer, S. C., and Megonigal, J. P. (2015). Moving beyond global warming potentials to quantify the climatic role of ecosystems. Ecosystems 18, 1000–1013. doi: 10.1007/s10021-015-9879-4
Pihlatie, M., Ambus, P., Rinne, J., Pilegaard, K., and Vesala, T. (2005). Plant-mediated nitrous oxide emissions from beech (Fagus sylvatica) leaves. New Phytol. 168, 93–98. doi: 10.1111/j.1469-8137.2005.01542.x
Purakayastha, T. J., Bera, T., Bhaduri, D., Sarkar, B., Mandal, S., Wade, P., et al. (2019). A review on biochar modulated soil condition improvements and nutrient dynamics concerning crop yields: pathways to climate change mitigation and global food security. Chemosphere 227, 345–365. doi: 10.1016/j.chemosphere.2019.03.170
Ralph, P. J., and Gademann, R. (2005). Rapid light curves: a powerful tool to assess photosynthetic activity. Aquat. Bot. 82, 222–237. doi: 10.1016/j.aquabot.2005.02.006
Ravishankara, A. R., Daniel, J. S., and Portmann, R. W. (2009). Nitrous oxide (N2O): the dominant ozone-depleting substance emitted in the 21st century. Science 326, 123–125. doi: 10.1126/science.1176985
Rusch, H., and Rennenberg, H. (1998). Black alder (Alnus glutinosa (L.) gaertn.) trees mediate methane and nitrous oxide emission from the soil to the atmosphere. Plant Soil 201, 1–7. doi: 10.1023/A:1004331521059
Smart, D. R., and Bloom, A. J. (2001). Wheat leaves emit nitrous oxide during nitrate assimilation. Proc. Natl. Acad. Sci. U.S.A. 98, 7875–7878. doi: 10.1073/pnas.131572798
Stutte, C. A., Weiland, R. T., and Blem, A. R. (1979). Gaseous nitrogen loss from soybean foliage. Agron. J. 71, 95–97. doi: 10.2134/agronj1979.00021962007100010024x
Teklemariam, T. A., and Sparks, J. P. (2006). Leaf fluxes of NO and NO2 in four herbaceous plant species: the role of ascorbic acid. Atmos. Environ. 40, 2235–2244. doi: 10.1016/j.atmosenv.2005.12.010
Timilsina, A., Oenema, O., Luo, J. F., Wang, Y. Y., Dong, W. X., Pandey, B., et al. (2022). Plants are a natural source of nitrous oxide even in field conditions as explained by 15N site preference. Sci. Total Environ. 805:150262. doi: 10.1016/j.scitotenv.2021.150262
Timilsina, A., Zhang, C., Pandey, B., Bizimana, F., Dong, W. X., and Hu, C. S. (2020). Potential pathway of nitrous oxide formation in plants. Front. Plant Sci. 11:1177. doi: 10.3389/fpls.2020.01177
Wang, S. J., Zheng, J. L., Wang, Y. J., Yang, Q. F., Chen, T. T., Chen, Y. L., et al. (2021). Photosynthesis, chlorophyll fluorescence, and yield of peanut in response to biochar application. Front. Plant Sci. 12:650432. doi: 10.3389/fpls.2021.650432
Wu, Y. P., Liu, J., Shaaban, M., and Hu, R. G. (2021). Dynamics of soil N2O emissions and functional gene abundance in response to biochar application in the presence of earthworms. Environ. Pollut. 268:115670. doi: 10.1016/j.envpol.2020.115670
Xu, X. T., He, C., Yuan, X., Zhang, Q., Wang, S. L., Wang, B. H., et al. (2020). Rice straw biochar mitigated more N2O emissions from fertilized paddy soil with higher water content than that derived from ex situ biowaste. Environ. Pollut. 263:114477. doi: 10.1016/j.envpol.2020.114477
Yang, X., Lu, K. P., McGrouther, K., Che, L., Hu, G. T., Wang, Q. Y., et al. (2017). Bioavailability of Cd and Zn in soils treated with biochars derived from tobacco stalk and dead pigs. J. Soils Sediments 17, 751–762. doi: 10.1007/s11368-015-1326-9
Yang, Y., Chen, G. X., Li, Y. Y., Cui, Z. H., and Zhang, L. J. (2005). N2O emission from soybean in relation to light density and photosynthesis. J. Shenyang Agric. Univ. 36, 282–285.
Zhang, L., Zhang, Y. J., Wang, H., Zou, J. W., and Siemann, E. (2013). Chinese tallow trees (Triadica sebifera) from the invasive range outperform those from the native range with an active soil community or phosphorus fertilization. PLoS One 8:e74233–e74233. doi: 10.1371/journal.pone.0074233
Zheng, X., Liu, Q., Zheng, L. Y., Wang, S. L., Huang, L. J., Jiang, J., et al. (2020). Litter removal enhances soil N2O emissions: implications for management of leaf-harvesting Cinnamomum camphora plantations. Front. Ecol. Manage. 466:118121. doi: 10.1016/j.foreco.2020.118121
Zulfiqar, F., Chen, J. J., Younis, A., Abideen, Z., Naveed, M., Koyro, H. W., et al. (2021). Biochar, compost, and biochar-compost blend applications modulate growth, photosynthesis, osmolytes, and antioxidant system of medicinal plant alpinia zerumbet. Front. Plant Sci. 12:61. doi: 10.3389/fpls.2021.707061
Keywords: nitrogen addition, leaf traits, plant N2O emissions, photosynthesis, structural equation model
Citation: Zhu C, Luo H, Luo L, Wang K, Liao Y, Zhang S, Huang S, Guo X and Zhang L (2022) Nitrogen and Biochar Addition Affected Plant Traits and Nitrous Oxide Emission From Cinnamomum camphora. Front. Plant Sci. 13:905537. doi: 10.3389/fpls.2022.905537
Received: 27 March 2022; Accepted: 14 April 2022;
Published: 10 May 2022.
Edited by:
Yanbo Hu, Northeast Forestry University, ChinaReviewed by:
Xiyang Zhao, Jilin Agricultural University, ChinaCopyright © 2022 Zhu, Luo, Luo, Wang, Liao, Zhang, Huang, Guo and Zhang. This is an open-access article distributed under the terms of the Creative Commons Attribution License (CC BY). The use, distribution or reproduction in other forums is permitted, provided the original author(s) and the copyright owner(s) are credited and that the original publication in this journal is cited, in accordance with accepted academic practice. No use, distribution or reproduction is permitted which does not comply with these terms.
*Correspondence: Ling Zhang, bGluZ3poYW5nMDlAMTI2LmNvbQ==
†These authors have contributed equally to this work
Disclaimer: All claims expressed in this article are solely those of the authors and do not necessarily represent those of their affiliated organizations, or those of the publisher, the editors and the reviewers. Any product that may be evaluated in this article or claim that may be made by its manufacturer is not guaranteed or endorsed by the publisher.
Research integrity at Frontiers
Learn more about the work of our research integrity team to safeguard the quality of each article we publish.