 Xueqian Jiang1
 Tianhui Yang2
 Fan Zhang1Xijiang Yang1
 Changfu Yang1Fei He1
 Ruicai Long1Ting Gao2
 Yiwei Jiang3
 Qingchuan Yang1
 Zhen Wang1*
 Junmei Kang1*
- 1Institute of Animal Science, Chinese Academy of Agricultural Sciences, Beijing, China
- 2Institute of Animal Science, Ningxia Academy of Agricultural and Forestry Sciences, Yinchuan, China
- 3Department of Agronomy, Purdue University, West Lafayette, IN, United States
Alfalfa (Medicago sativa L.) is a perennial forage crop known as the “Queen of Forages.” To dissect the genetic mechanism of flowering time (FT) in alfalfa, high−density linkage maps were constructed for both parents of an F1 mapping population derived from a cross between Cangzhou (P1) and ZhongmuNO.1 (P2), consisting of 150 progenies. The FT showed a transgressive segregation pattern in the mapping population. A total of 13,773 single-nucleotide polymorphism markers was obtained by using restriction-site associated DNA sequencing and distributed on 64 linkage groups, with a total length of 3,780.49 and 4,113.45 cM and an average marker interval of 0.58 and 0.59 cM for P1 and P2 parent, respectively. Quantitative trait loci (QTL) analyses were performed using the least square means of each year as well as the best linear unbiased prediction values across 4 years. Sixteen QTLs for FT were detected for P1 and 22 QTLs for P2, accounting for 1.40–16.04% of FT variation. RNA-Seq analysis at three flowering stages identified 5,039, 7,058, and 7,996 genes that were differentially expressed between two parents, respectively. Based on QTL mapping, DEGs analysis, and functional annotation, seven candidate genes associated with flowering time were finally detected. This study discovered QTLs and candidate genes for alfalfa FT, making it a useful resource for breeding studies on this essential crop.
Introduction
Alfalfa (Medicago sativa L.) is an important forage species with high yields, quality, and adaptability. This species has a wide distribution all over the world (Radovic et al., 2009). China is one of the largest producers of alfalfa with a long history of its cultivation and utilization for livestock. However, the increasing demands for livestock production pose a challenge for the alfalfa industry (Bai et al., 2018), mainly due to a lack of alfalfa cultivars with a wide range of adaptation. This obstacle has been severely limiting the expansion of alfalfa cultivation and production in China. Until 2017, approximately 71% of the alfalfa was grown in the four provinces of northwestern China (Xinjiang, Inner Mongolia, Gansu, and Shaanxi). Therefore, it is crucial to develop alfalfa cultivars with improved yield and adaptability to meet the growing needs of alfalfa production.
Flowering time (FT), a major fitness component, is a key trait for the seasonal and geographical adaptation of flowering plants (Kooyers, 2015). FT is a signal that allows plants to change from vegetative growth to reproductive growth (Srikanth and Schmid, 2011), which plays an important role in alfalfa biomass yield. Premature flowering often leads to a shorter vegetative growth stage that results in reduced biomass yield, whereas delaying the flowering could increase plant yield and biomass of perennial crops, including alfalfa. Given the importance of FT, it has been suggested that the development of the novel varieties with modified FT may result in higher biomass production due to a better adaptation of plants to local environments and climate conditions (Schiffers et al., 2013).
Flowering time is a complex quantitative trait determined by genotype, environment, and the interactions of genotype and environment (Koornneef et al., 1998; Upadhyaya et al., 2015). Previous research showed that shifting FT-related genes enables plants to gain a wider adaptability (Diaz et al., 2012; Weller et al., 2019; Lu et al., 2020). For instance, Tof11 and Tof12 delayed FT under long photoperiods and improved plant adaptation to higher latitudes during soybean domestication (Lu et al., 2020). In addition, the mechanism of flowering time has been well studied in model plants like Arabidopsis and in crop species such as rice (Oryza sativa L.) (Hori et al., 2016; Kinoshita and Richter, 2020). Numerous candidate genes have been identified and their intricate regulatory networks are being deciphered, including FLOWERING LOCUS T T (FT), CONSTANS (CO), and FLOWERING LOCUS C (FLC)/mads affecting FLOWERING (MAF) (Song et al., 2013; Kinoshita and Richter, 2020). FT-like genes are involved in photoperiod sensing, and homologues of FT have also been identified to control flowering time in several legume species. For example, five homologues of FT were characterized in Medicago truncatula, two of which were flowering inductors (Hecht et al., 2011; Laurie et al., 2011). Five homologues were detected in alfalfa, but only MsFTa1 was found to be a flowering inducer (Lorenzo et al., 2020). Nevertheless, no functional homologues of CO were identified in Medicago truncatula (Wong et al., 2014), suggesting that the CO-like genes were not conserved in legumes, including alfalfa.
Recently, RNA-sequencing (RNA-seq) has been widely applied in various species due to the rapid advancement of the technology and decreased price. However, through RNA-seq, a large quantity of differentially expressed genes (DEGs) are usually identified. Therefore, the strategy of QTL mapping combined with RNA-seq is considered to be a promising method to rapidly identify potential candidate genes. For example, integration of RNA-seq and QTLs mapping have been carried out to identify candidate genes associated with cadmium tolerance in barley (Hordeum vulgare) (Derakhshani et al., 2020), genes for pod number variation in rapeseed (Brassica napus L.) (Ye et al., 2017), and high-temperature stress-responsive genes in tomato (Solanum lycopersicum L.) (Wen et al., 2019).
As alfalfa is a long-day plant, its flowering is affected by both photoperiod and temperature (Major et al., 1991; Lorenzo et al., 2020). Although some FT-related QTLs have been investigated in alfalfa (Adhikari et al., 2019; Zhang et al., 2020), the genetic basis of flowering time remains largely unexplored. In previous studies, due to the lack of an alfalfa reference genome, it was difficult to construct high−density linkage maps and compare QTLs in different mapping populations. All of these studies were made feasible by the availability of a high-quality, chromosome-level alfalfa genome (Chen H. et al., 2020). RAD-seq is an economical and useful method of generating SNP markers across the whole genome (Huang et al., 2017; Lee et al., 2019). Therefore, the objectives of this study were to construct linkage maps using genome-wide SNP markers based on RAD-seq, detect the QTLs related to FT, and identify candidate genes by integrating the QTLs and RNA-seq.
Materials and Methods
Plant Materials and Phenotyping
An F1 population consisting of 150 progenies was developed by crossing a tetraploid early flowering and low forage yield alfalfa landrace (Cangzhou, CF000735, paternal parent, P1) with a late flowering and high forage yield cultivar (Zhongmu NO.1, CF0032020, maternal parent, P2). The seeds of the F1 population were planted and the clones of progenies and two parents were initially propagated in a greenhouse in 2012 in the Chinese Academy of Agricultural Sciences Research Station in Langfang, Hebei Province (39.59°N, 116.59°E). In 2013, the cloned plants were transferred to the field in Langfang, Hebei Province (Zhang et al., 2019), and propagated again in 2016 to ensure genetic uniformity of all plant materials. The field experiment was a randomized complete block design with three replications, where one clone for each progeny and parents was planted in per replication.
In this study, FT was defined as the date of the first flower appeared in individual plants. It was recorded daily from the date when the first flower appeared in a plant until all plants flowered. We collected FT data across 4 years from 2017 to 2020. FT dates were expressed as photothermal units (PTU) using the method described by Grabowski et al. (2017). The PTU was estimated using the following formula;
where dPTU = daily PTU; minT = the minimum recorded temperature; maxT = the maximum recorded temperature; dayL = the number of hours between sunrise and sunset. PTU starts accumulating after 5 consecutive days with (minT + maxT) > 10°C. The information of minT and maxT was obtained from the climatological station,1 and dayL data was collected from the website.2
We estimated the PTU values using the least-squares mean (LS mean), performing for each year separately with PROC GLM (v. 9.4; SAS Institute, Cary, NC, United States). The best linear unbiased prediction (BLUP) values were calculated using the “lme4” package in R (Bates et al., 2014). The R package lme4 was also used to estimate the broad-sense heritability (H2) according to the following formula:
where H2 = broad-sense heritability; σ2g = genotypic variance; σ2r = block variance; σ2ε = residual error variance; r, the numbers of blocks. The LS means of each year along with BLUP values were used as the phenotype data for QTL analysis.
DNA Extraction and Sequencing
The information on DNA isolation and RAD library construction has been described in detail in our previous study (Zhang et al., 2019). Briefly, young leaf tissues from the parents and F1 progenies were collected and frozen in liquid nitrogen. DNA was extracted using the CWBIO Plant Genomic DNA Kit (CoWin Biosciences, Beijing, China) according to the manufacturer’s protocol. DNA concentrations were measured using a NanoDrop 2000 spectrophotometer (Thermo Fisher Scientific, Waltham, MA, United States). RAD library preparation and sequencing were performed at ORI-GENE (Beijing, China), using a Hi-seq X Ten (Illumina). The RAD sequences were deposited in the NCBI Sequence Read Archive (PRJNA503672).
Reference-Based Single-Nucleotide Polymorphism Calling and Genetic Linkage Maps Construction
Sequencing data was filtered using trimmomatic software with default parameters (Bolger et al., 2014). Paired-end sequencing reads were mapped to the alfalfa reference genome (Chen H. et al., 2020) with BWA-MEM (Li, 2013). Samtools was used to translate SAM files to BAM files and then to sort BAM files using default parameters (Li et al., 2009). GATK4.0 was used to mark duplicate reads and detect single-nucleotide polymorphism (SNP) (McKenna et al., 2010). Furthermore, SNP data was filtered using Vcftools (Danecek et al., 2011) with the missing rate less than 50%, minor allele frequency greater than 0.05 and mean read depth greater than 5. Single-dose allele (SDA) markers with a ratio of less than 2:1 and missing data rates of ≤ 20% were retained for constructing genetic linkage maps (Li et al., 2014). The regression method of JoinMap 4.03 was used to order the markers within the chromosomes (Stam, 1993). Kosambi map function was used to translate recombination frequency into map distances.
Quantitative Trait Loci Analysis for Flowering Time
Combining the phenotypic data and the genetic linkage maps, QTLs for FT were identified in the F1 population using the Inclusive Composite Interval Mapping with an additive effect (ICIM-ADD) in the QTL IciMapping software4 (Meng et al., 2015). The mapping parameter of each step for ICIM-ADD was set at 1.0 cM, and the LOD threshold was set at 3.0. When the genetic locations of the QTLs (at a 99% significance level) overlapped in different years, they were defined as a single QTL. The QTLs detected for each parental map were drawn on linkage maps using MapChart 2.3 (Voorrips, 2002). QTLs were named as: qFT + linkage group no., or named as qFT + linkage group no. + an ordered number designating one of multiple QTLs in a single linkage group. For example, qFT4.1-2 indicates the second QTL in the Chr4.1 linkage group.
RNA-Sequencing Analysis
The flower samples were collected at three flowering stages (budding stage, BS; initial flowering stage, IFS and full flowering stage, FFS) from two parental alfalfa plants and immediately frozen in liquid nitrogen and stored at −80°C. Altogether, 12 flower samples were collected for all two replicates. Total RNA was isolated using the TRIZOL reagent (Invitrogen, CA, United States) according to the manufacturer’s protocol. High-quality total RNA samples were sent to the Novogene (Beijing, China) and sequenced with an Illumina HiSeq 2000 platform. The obtained RNA-Seq data were submitted to the Sequence Read Archive of the National Center for Biotechnology Information (NCBI) with the accession number PRJNA817856.5
Estimation of RNA-Seq data quality was performed by FastQC v0.11.9,6 and low-quality sequences were filtered by fastp v0.12.4 (Chen et al., 2018). All filtered clean reads were mapped to the XJDY reference genome using hisat2 v4.8.2 (Kim et al., 2019), and the alignments were sorted using SAMTools (Li et al., 2009). Read counts for each sample were generated using featureCounts v2.0.1 (Liao et al., 2014). DEGs with an adjusted p-value ≤ 0.0001 and expression level of |log2 fold change| ≥ 3 was performed with the R package DESeq2 (Love et al., 2014).
Comparison With Previously Reported Quantitative Trait Loci and Potential Candidate Gene Identification
The sequences of flanking markers for each previously reported QTL were used for local blast (E-value of 1e–5) against the alfalfa reference genome (cultivar XinJiangDaYe) (Chen H. et al., 2020), which was downloaded online.7 TBtools software (Chen C. et al., 2020) was used to complete the following analysis. First, we identified the physical positions based on the flanking marker sequences of the QTLs with the function of –BLAST–BLAST GUI Wrapper–Several Sequences to a Big File. Then we extracted genes on the alfalfa genome based on the overlapped physical positions in different genetic backgrounds (function: –Sequence Toolkit–GFF3/GTF Manipulate–GXF Regoin Overlap). DEGs within QTL intervals were annotated based on BLSAT search in NCBI,8 Ensembl,9 and eggNOG-mapper.10
Quantitative Real-Time PCR
The RNA-seq data were validated using quantitative real-time PCR (qRT-PCR). On a 7500 Real-Time PCR System (Applied Biosystems, CA, United States), qRT-PCR was implemented in triplicate for each sample of two parents at three flowering stages using the SYBR Premix Ex Taq (Takara, Japan). The relative gene expression level was calculated by the 2–ΔΔCt method.
Results
Phenotypic Data Analysis
Phenotypic data of the F1 population and parents were collected in Langfang, Hebei Province for four consecutive years from 2017 to 2020. Our previous work showed that P1 and P2 differed in yield and leaf size (He et al., 2019; Zhang et al., 2019). In addition, FT appeared to differ considerably (Table 1), suggesting that these two parents represent substantial variations among alfalfa varieties. Phenotypic variations in FT among the F1 population ranged from 11.28 to 16.00% (Table 1), and transgressive segregation indicated the FT trait was quantitatively inherited. The frequency distribution of FT revealed a nearly normal distribution for FT trait in all 4 years (Figure 1). In our previous study, the same mapping population was used to identify QTLs associated with biomass yield (Zhang et al., 2019). A weak negative correlation was observed between FT and yield in the mapping population with correlation coefficients ranging from −0.05 to −0.47 (Figure 2), indicating that the genotypes with earlier flowering time (shorter vegetative growth time) tended to have lower yields. The result was similar to that of a previous study on alfalfa (Adhikari et al., 2019). The H2 of FT ranged from 0.68 to 0.78 (Table 1). The relatively high heritability suggested that genotypic variance accounted for a high proportion of total phenotype variance for FT in this mapping population.
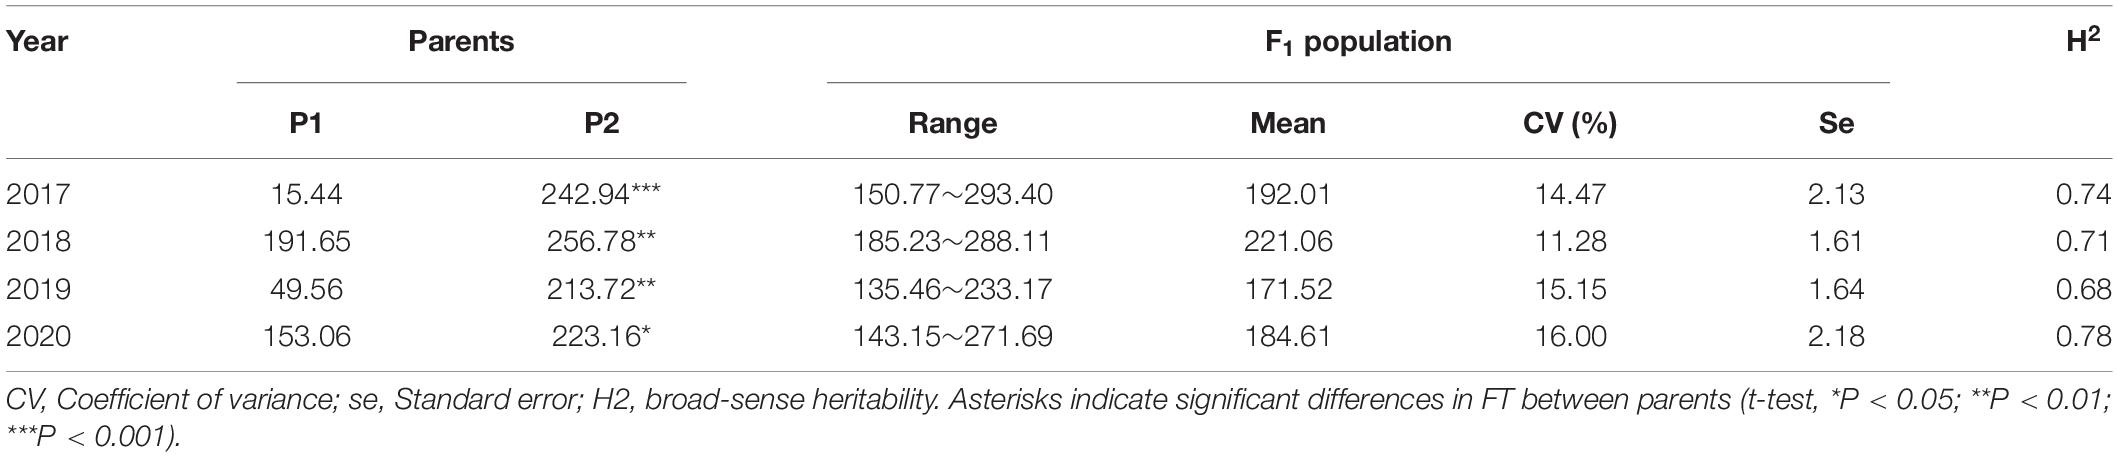
Table 1. Statistical analysis of LS means of photothermal units values in parents and F1 population across 4 years.
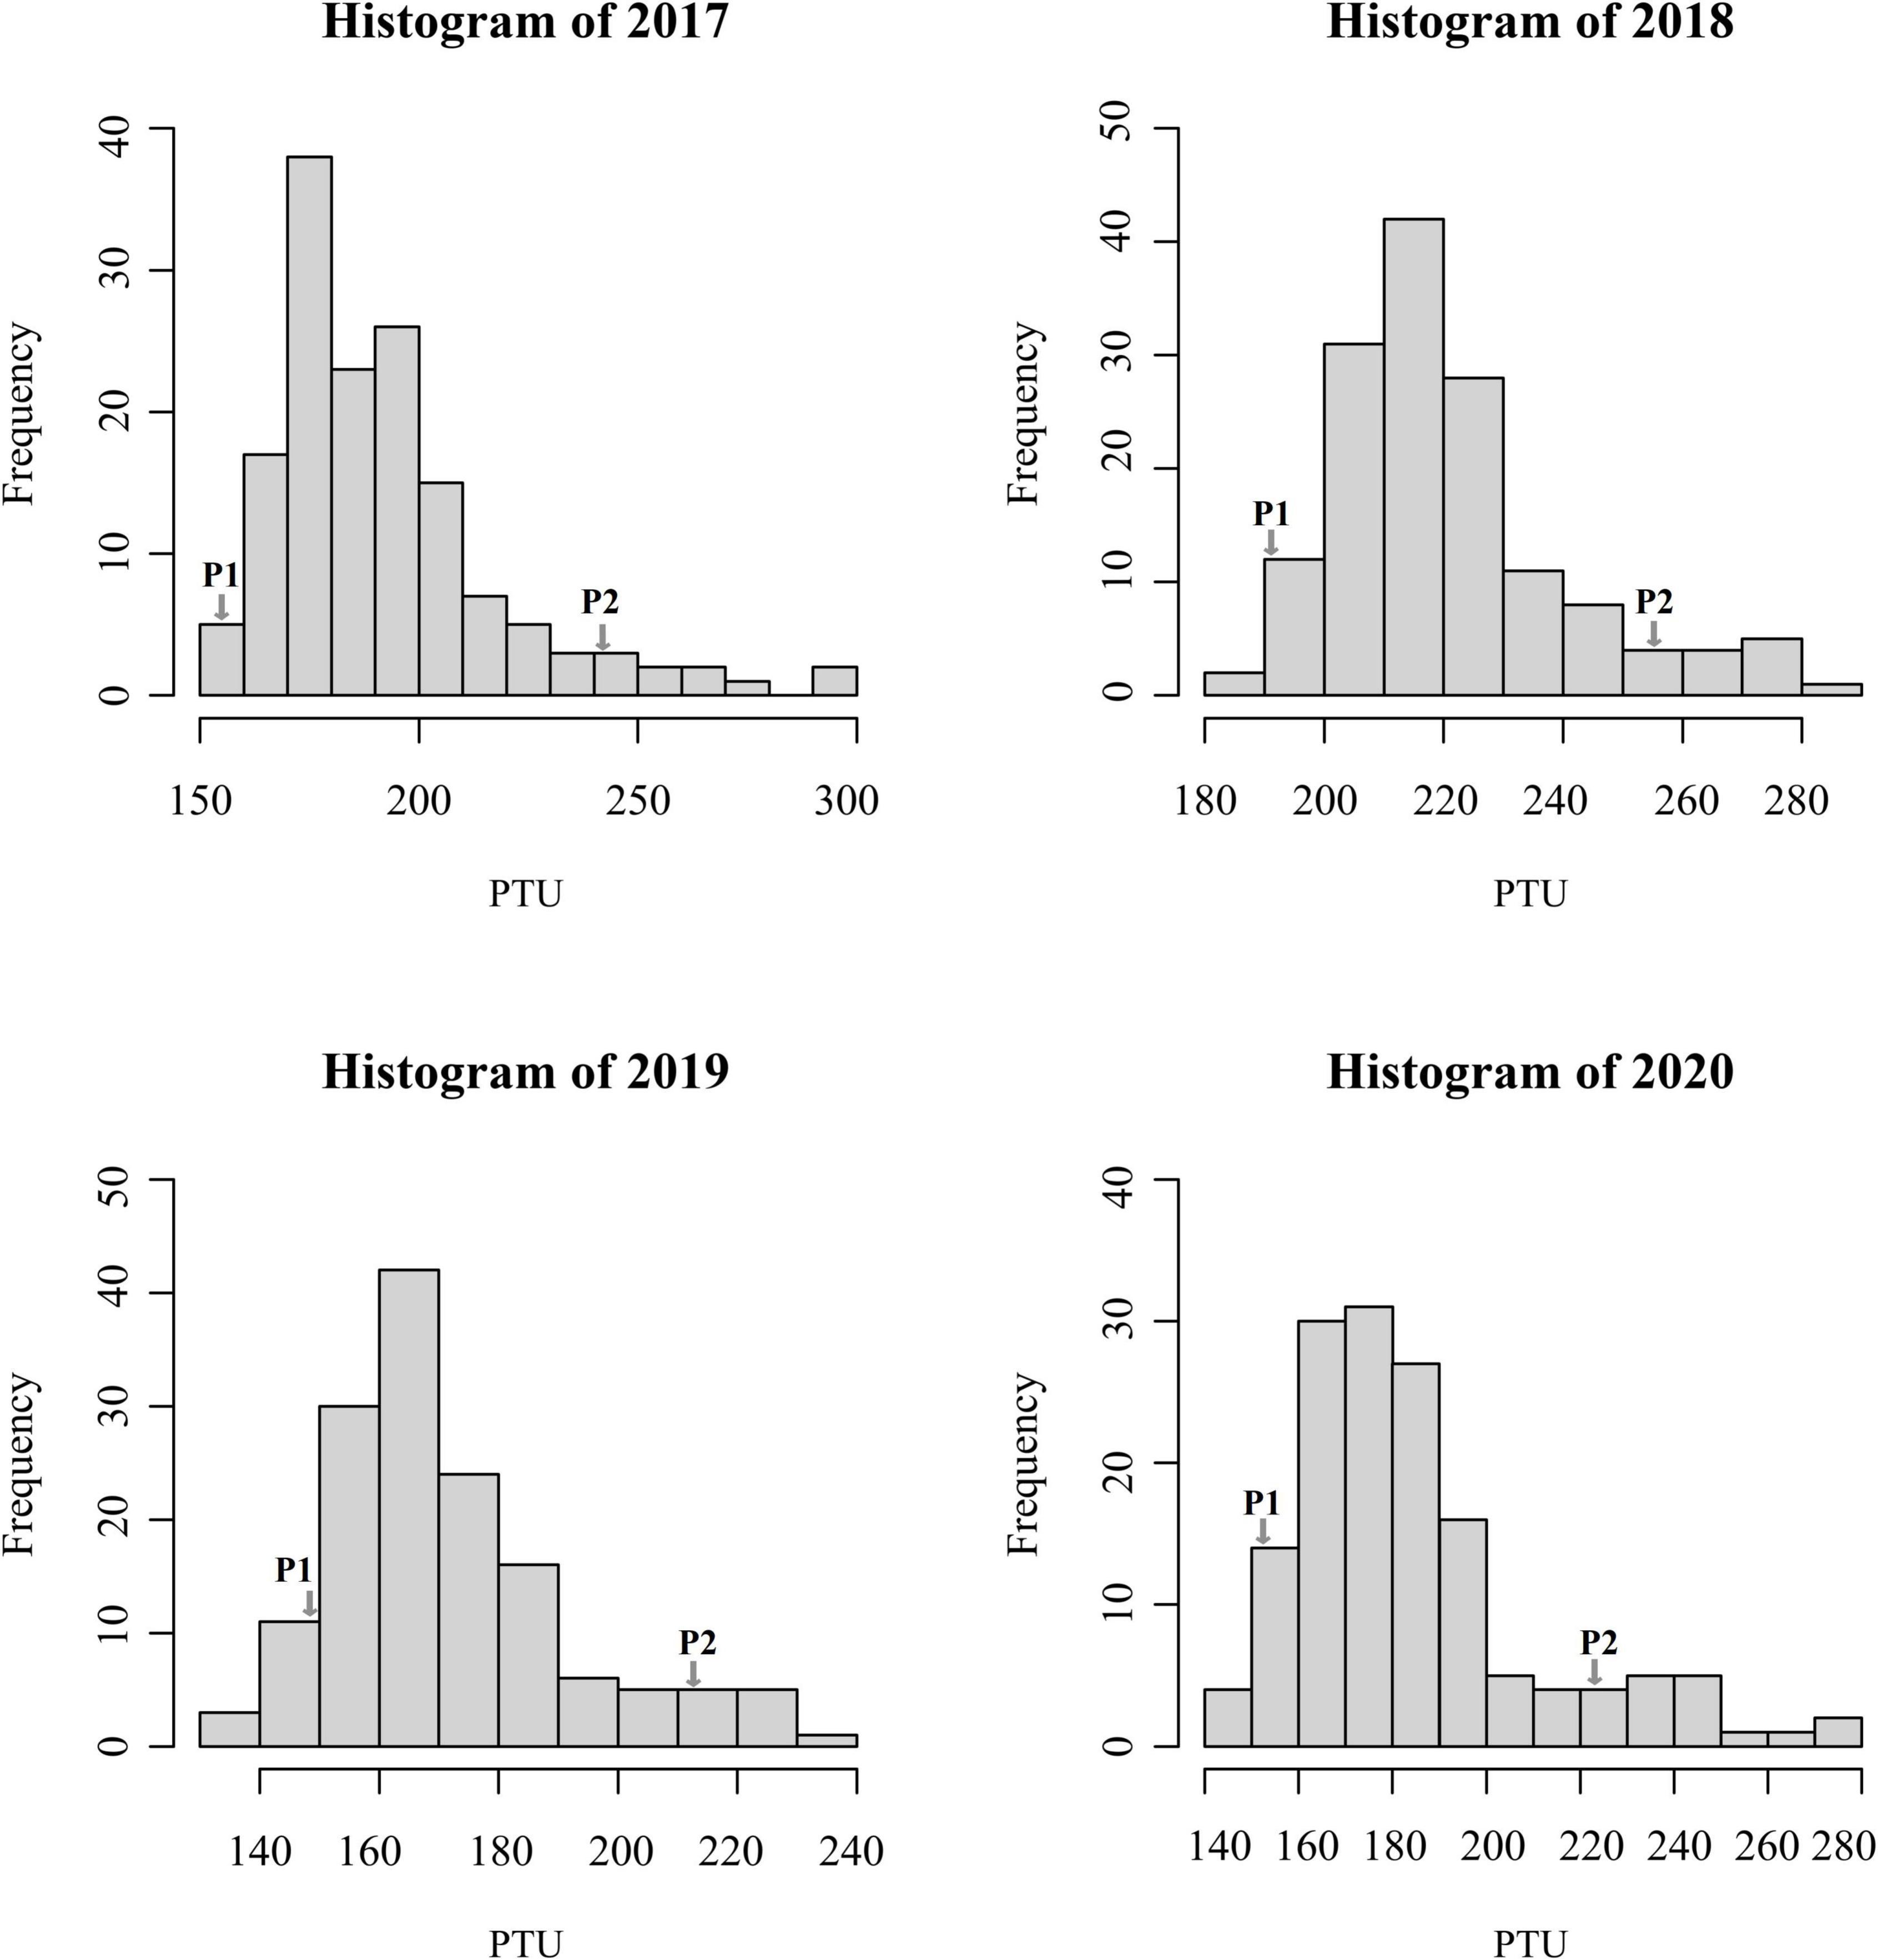
Figure 1. Frequency distributions of photothermal unit values in the F1 population at Langfang, Hebei Province from the year 2017 to 2020.
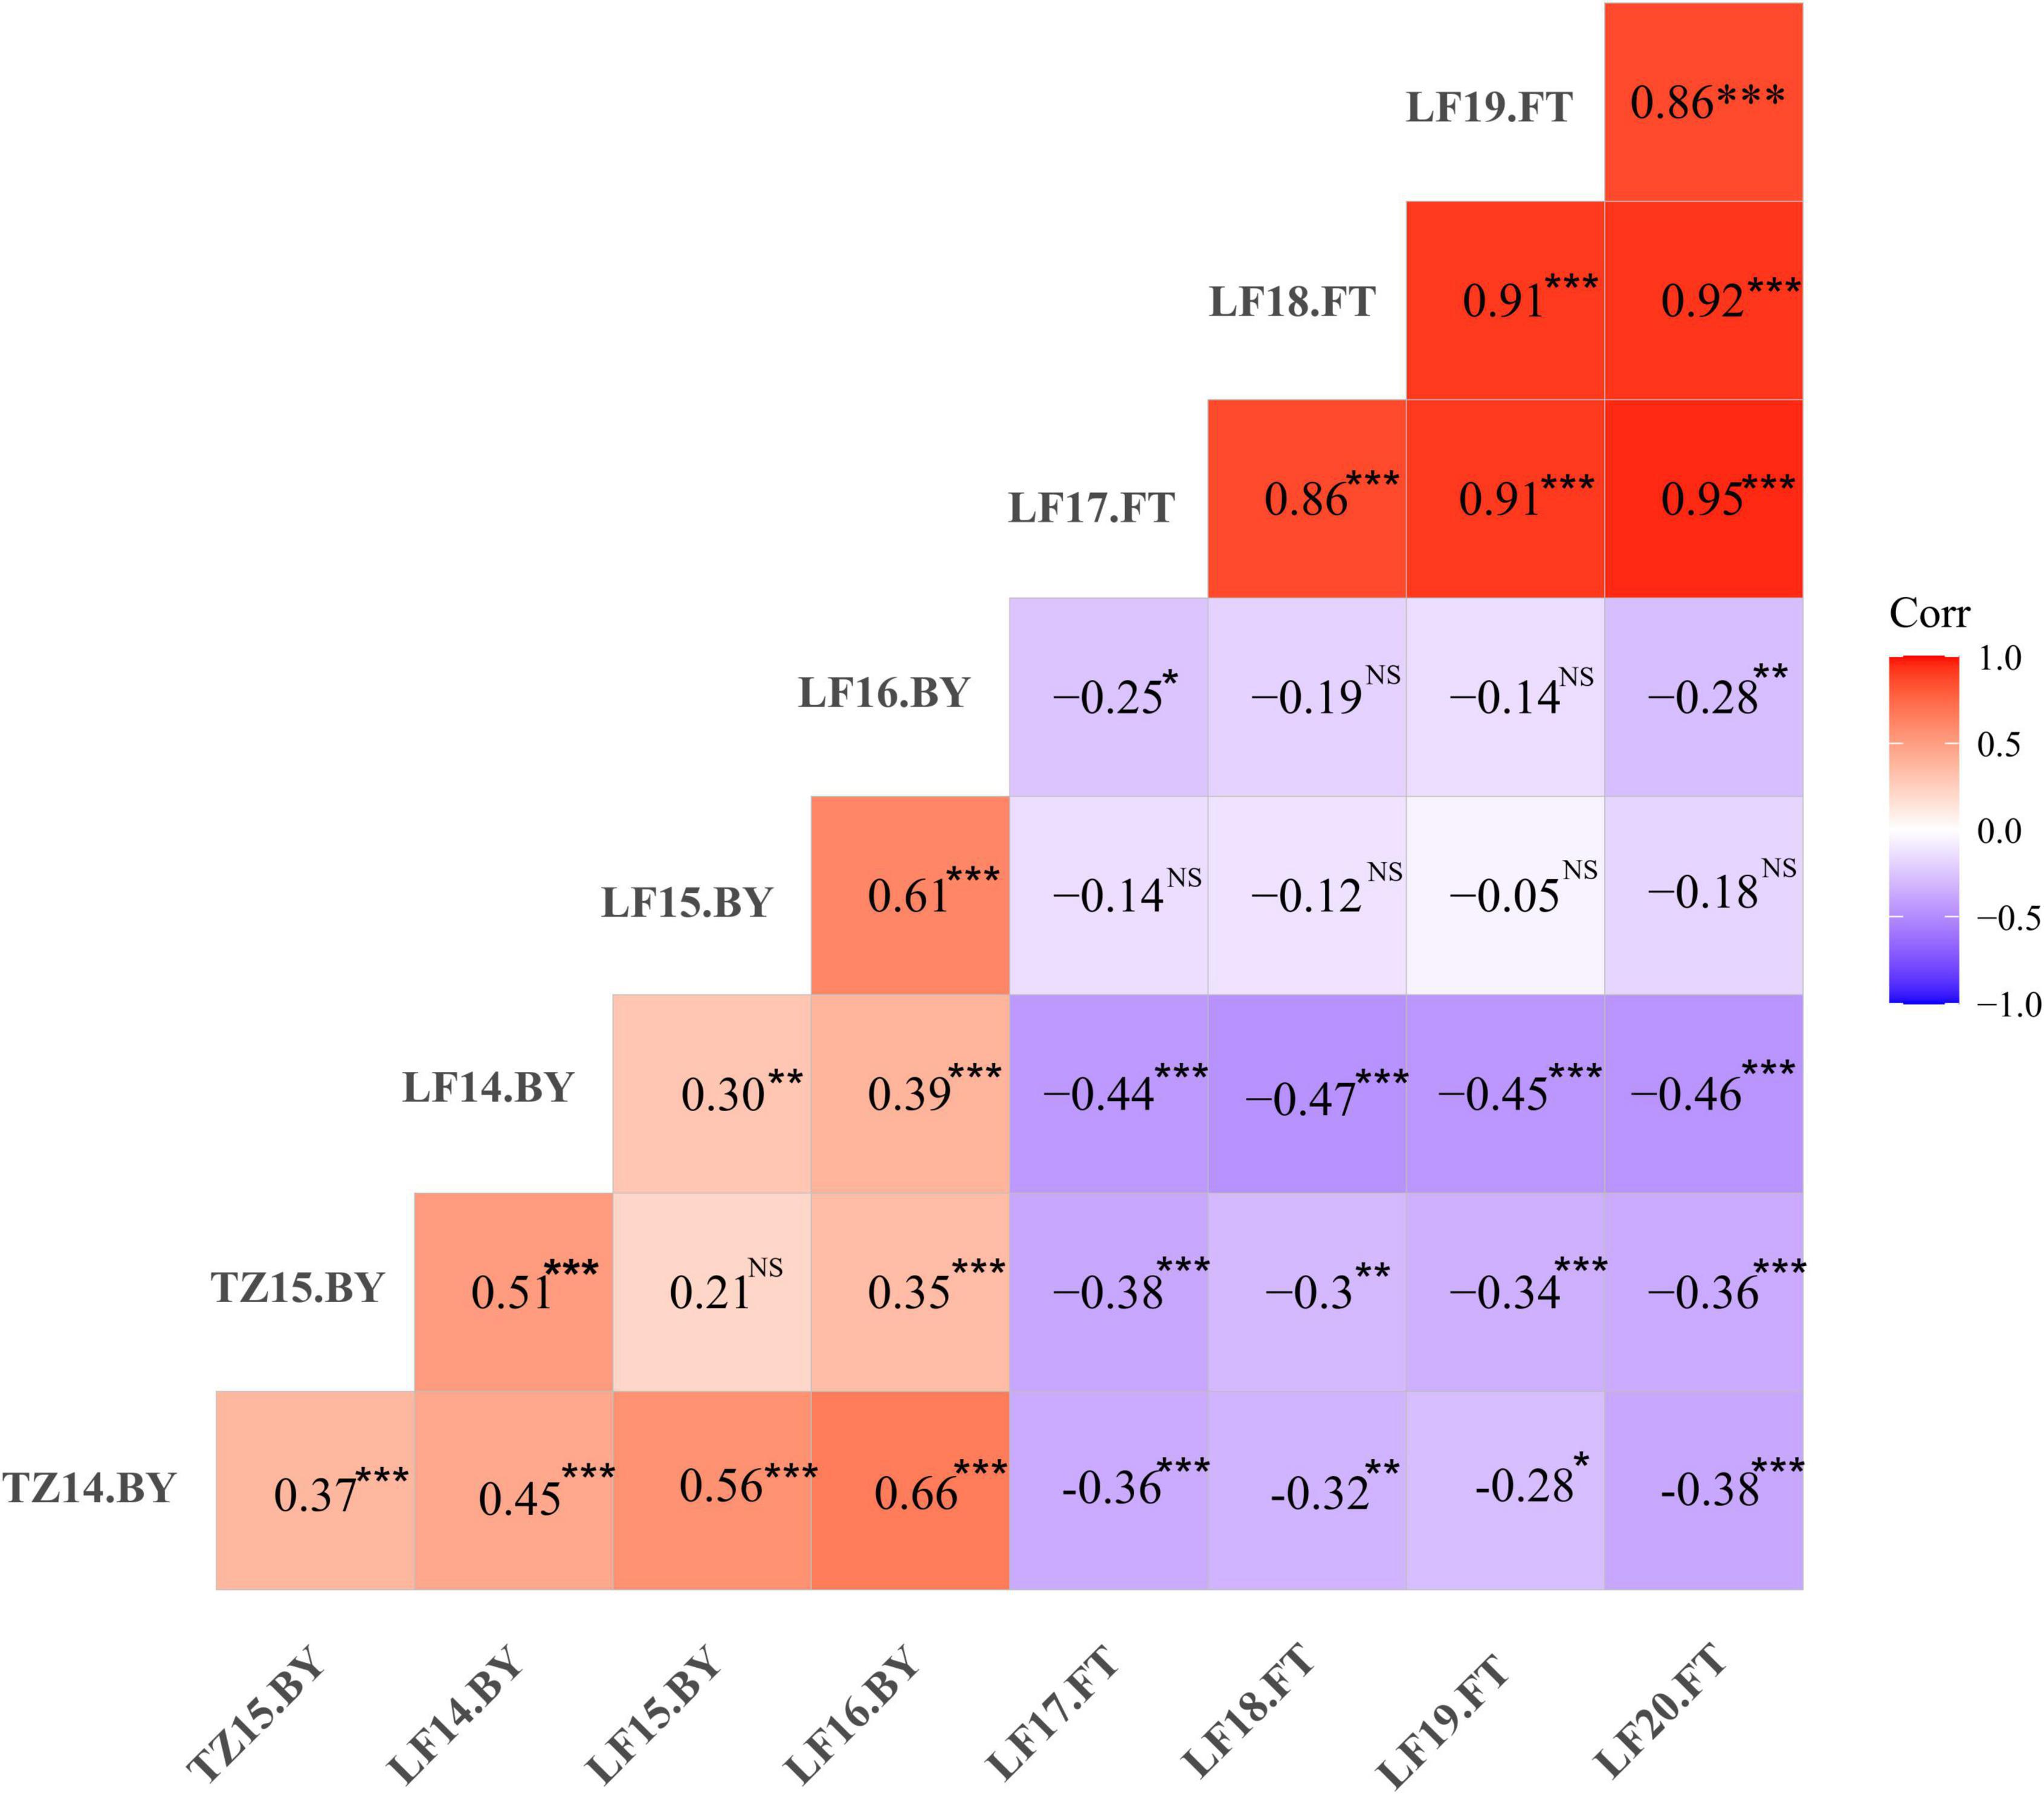
Figure 2. Phenotypic correlations of flowering time (FT) and biomass yield (BY) among different environments in the F1 population. Red and blue colors represent positive and negative correlations (r) between traits, respectively. TZ; Tongzhou; LF, Langfang, e.g., TZ14.BY indicates biomass yield data collected at Tongzhou in 2014. *P < 0.05, **P < 0.01, ***P < 0.001, NS, non-significant. The results of yield were published in our previous study Zhang et al. (2019).
Genetic Linkage Map Construction
Each F1 progeny was subjected to RAD-seq to detect genome-wide SNPs. A total of 161,169 raw SNPs were detected by aligning the sequences to the XinJiangDaYe reference genome (Chen H. et al., 2020). SNPs were filtered with mean read depth < 5, missing rate > 20%, heterozygosity ≥ 2:1. After filtering, 7,252 and 7,404 high-quality SDA markers were obtained for P1 and P2 parents, respectively; which were then used to construct high-density linkage maps. The total genetic lengths were 3780.49 cM for P1 and 4113.45 cM for P2 maps (Supplementary Table 1). The P1 linkage maps consisted of 6,844 SDA markers with an average genetic distance of 0.58 cM and a map length from 84.30 (chr3.3) to 145.22 cM (chr6.3) (Supplementary Tables 1–3 and Figure 3). In P1, the lowest marker density was 0.85 on chr2.2 and the highest was 0.31 on chr6.2 (Supplementary Table 1 and Figure 3). The P2 linkage maps contained 6,929 SDA markers with an average genetic distance of 0.59 cM, and a map length from 88.19 (chr7.2) to 160.14 cM (chr5.3) (Supplementary Table 1 and Figure 3). Among the 32 linkage groups of P2, the lowest marker density was 0.89 on chr2.3 and the highest was 0.36 on chr6.2 (Supplementary Table 1 and Figure 3).
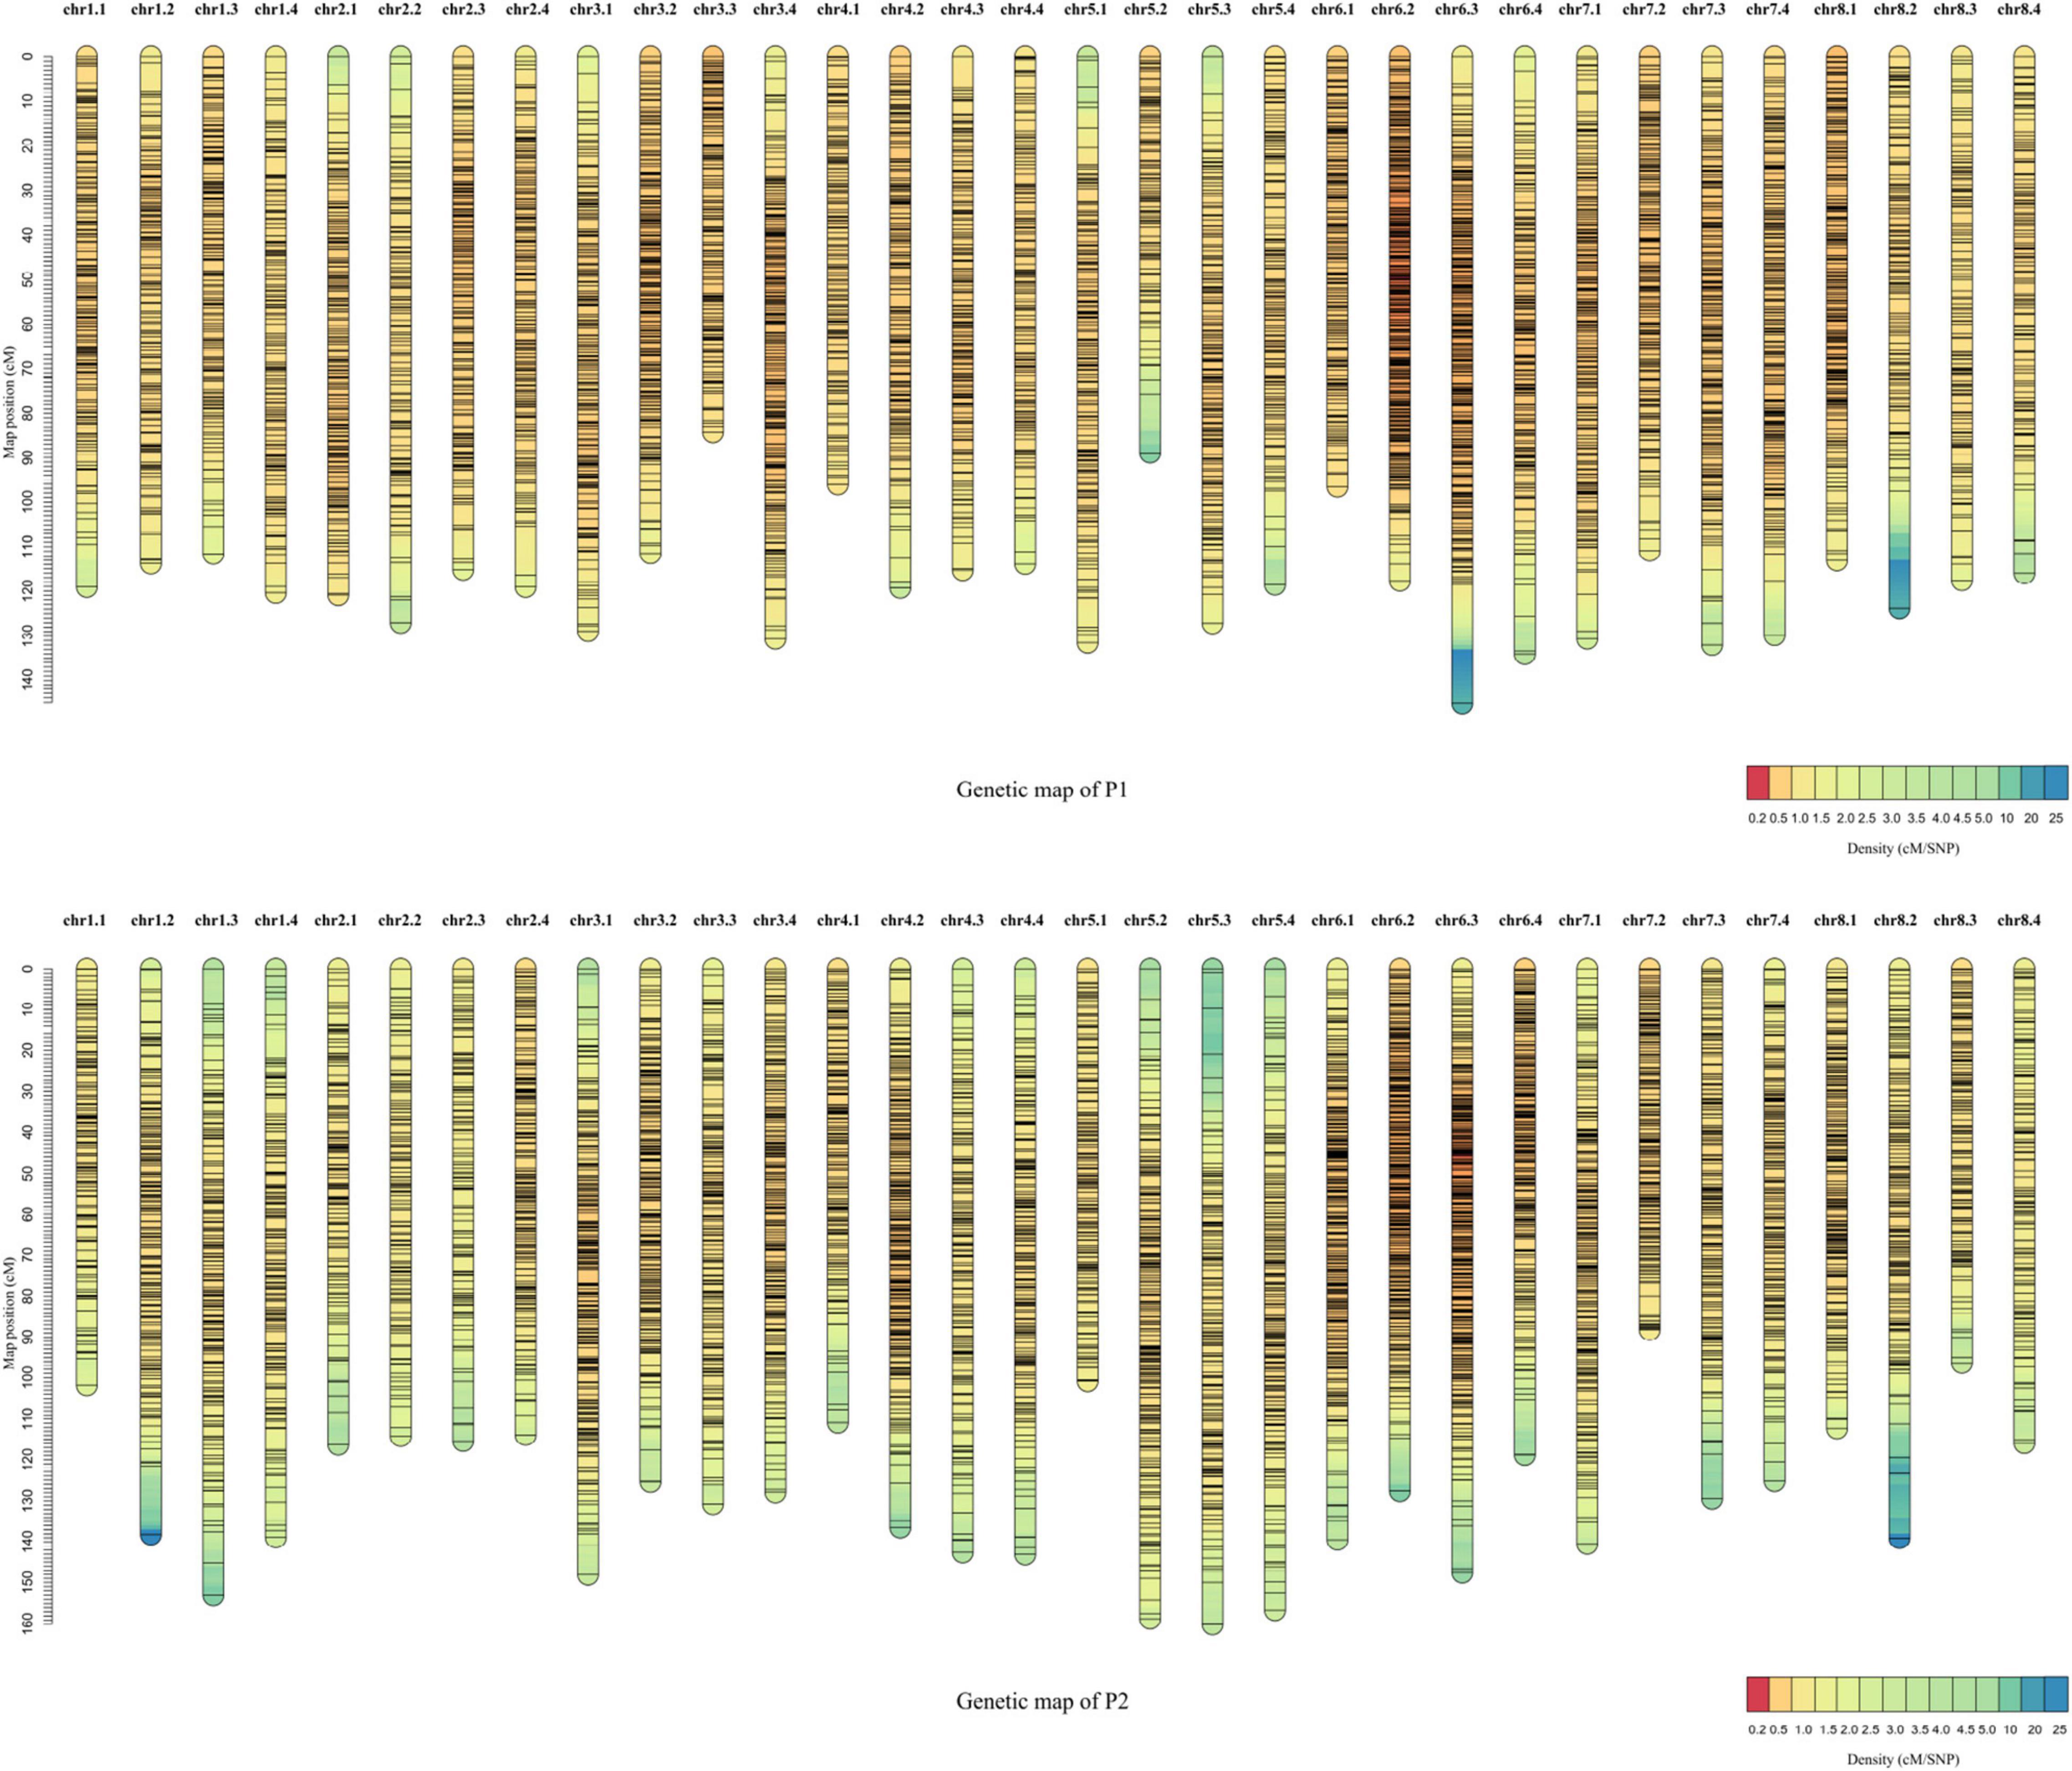
Figure 3. Genetic linkage maps for the F1 population. Distribution of 6,844 and 6,929 single-dose allele (SDA) markers in the parent (P1) and parent (P2) genetic maps, respectively. X-axis is the chromosome number and Y-axis describes the CentiMorgan distance. Detailed information on the maps is listed in Supplementary Table 1.
Quantitative Trait Loci Mapping for Flowering Time
Using the ICIM-ADD mapping method, the LS means of each year and BLUP values across 4 years were used for QTL mapping. A total of 16 QTLs for FT were detected for P1 (Table 2 and Supplementary Figure 1). The percentage of phenotypic variance explained (PVE) by each QTL was from 4.13 to 16.04%, with the highest PVE observed on qFT7.4-3. Twenty-two QTLs for FT were detected for P2 parent with PVE values ranging from 1.40 to 13.78% and the highest PVE was observed on qFT2.3-2 (Table 2 and Supplementary Figure 2).
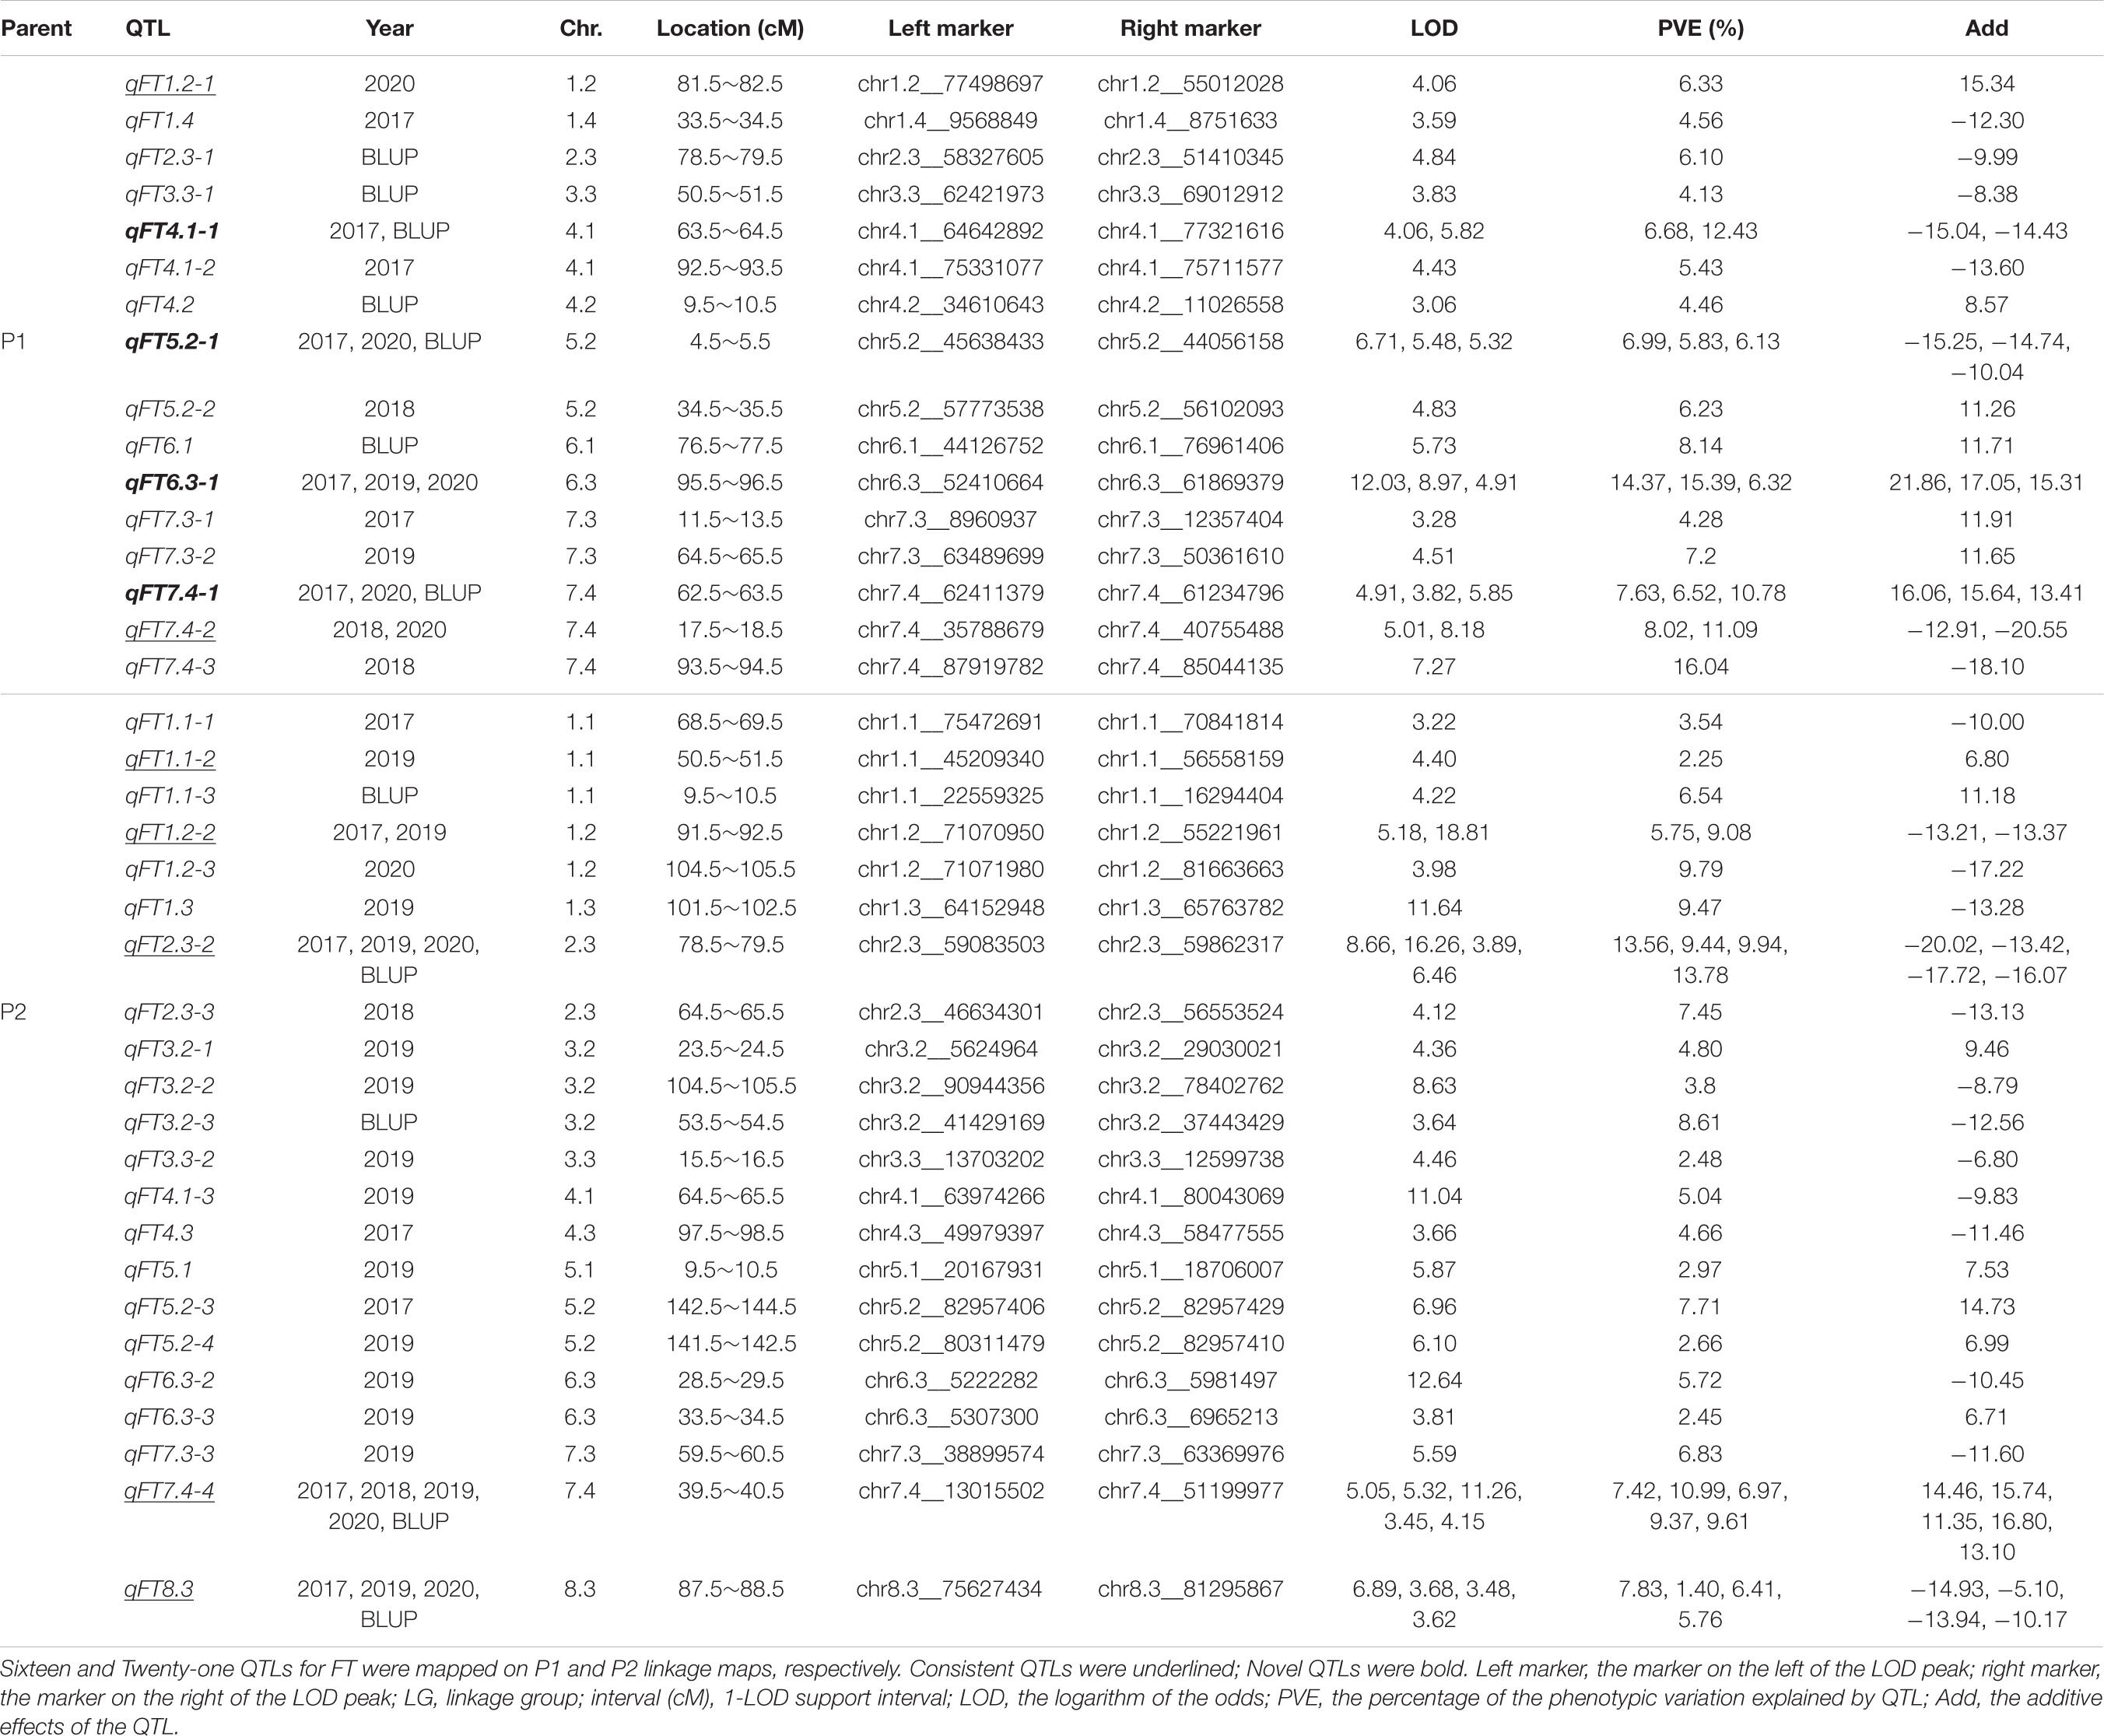
Table 2. QTLs detected for least-square means (LS means) and the best linear unbiased prediction (BLUP) values of flowering time (FT) using ICIM-ADD in the F1 population.
Five QTLs (qFT4.1-1, qFT5.2-1, qFT6.3-1, qFT7.4-1, and qFT7.4-2) in P1 parent and four QTLs (qFT1.2-2, qFT2.3-2, qFT7.4-4, and qFT8.3) in P2 parent were independently co-detected in multi-environments (Table 2). In P1, qFT6.3-1 was identified in three grown environments (2017, 2019, and 2020) on chr6.3 at a position of 95.5–96.5 cM with an average PVE value of 12.03% (Table 2). Three QTLs (qFT7.4-1, qFT7.4-2, and qFT7.4-4) were identified on chr7.4 across multiple environments. Of them, qFT7.4-4 on P2 was detected in all 4 years and BLUP values with an average LOD value of 5.85 and a PVE value of 8.87 (Table 2).
Novel Environment-Stable Quantitative Trait Locis Controlling Flowering Time
Four intervals were novel signals as they were detected in more than one environment and did not overlap with previously known FT-related QTLs. All of them were identified in the P1 parent, including qFT4.1-1, qFT5.2-1, qFT6.3-1, and qFT7.4-1 (Table 2). The average PVE value of these four loci were 9.56, 6.32, 12.03, and 8.31%. Among them, qFT6.3-1 was identified in three environments (2017, 2019, and 2020) with the highest average PVE value of 12.03% and an average LOD value of 8.64.
Consistent Quantitative Trait Locis Controlling Flowering Time
Four novel QTLs for FT such as qFT4.1-1, qFT5.2-1, qFT6.3-1, and qFT7.4-1 were detected in this study, enriching our current knowledge of genetic control of FT in alfalfa. We also detected seven QTLs that overlapped with known QTLs. These QTLs, two from P1 and five from P2, may be considered as consistent QTLs (Table 2). Specifically, qFT1.1-2 located at 45.2–68.9 Mb on chr1.1 was in the same region as qflower-5 and Tof-d1 (Adhikari et al., 2019; Zhang et al., 2020), while qFT1.2-1 and qFT1.2-2 fell into a known region of 55.0–77.5 Mb with qflower-20, Tof-d6, Tof-d10, and Tof-d2 on chr1.2 (Adhikari et al., 2019; Zhang et al., 2020). On chr2.3, qFT2.3-2 was overlapped with qflower-6 (Zhang et al., 2020). The physical position of qFT7.4-4 was relatively large (13.0 ∼ 51.2 Mb), and overlapped with qFT7.4-2, Tof-d5, Tof-d4, and Tof-n6 (Adhikari et al., 2019). qFT8.3 was located at 66.9–82.1 Mb on chr8.3, overlapped with qflower-28 (Zhang et al., 2020). The results demonstrated that these QTLs could be robust signals for genetic control of FT in alfalfa. Other QTLs were detected in only one environment with a lower LOD value, suggesting that these QTLs may be environment-specific.
Integration of Differentially Expressed Genes With Quantitative Trait Locis
A larger number of significant DEGs were found at three flowering stages between two parents (P2 vs. P1). At BS, between P1 and P2, 3,329 and 1,710 DEGs were up- and downregulated, respectively (Figure 4A). At IFS, between P1 and P2, 5,075 and 1,983 DEGs were up- and down-regulated, respectively (Figure 4A). Between P1 and P2 at FFS, a total of 5,691 and 2,305 DEGs were up- and down-regulated, respectively (Figure 4A). These DEGs in three alfalfa flowering stages were then categorized into the biological process (BP), cellular component (CC), and molecular function (MF) categories using GO enrichment analysis (Supplementary Table 5). Specifically, in the BP terms, DEGs were mainly enriched in “cell morphogenesis involved in differentiation,” “pollen tube growth,” “developmental growth involved in morphogenesis,” “anther morphogenesis,” and “stamen morphogenesis.” Also, these DEGs had a role in “response to low light intensity stimulus,” “regulation of vernalization response,” and “response to blue light” among others (Supplementary Table 5 and Figure 5). The results suggested that these DEGs may play a role in the regulation of floral organ development and flowering time.
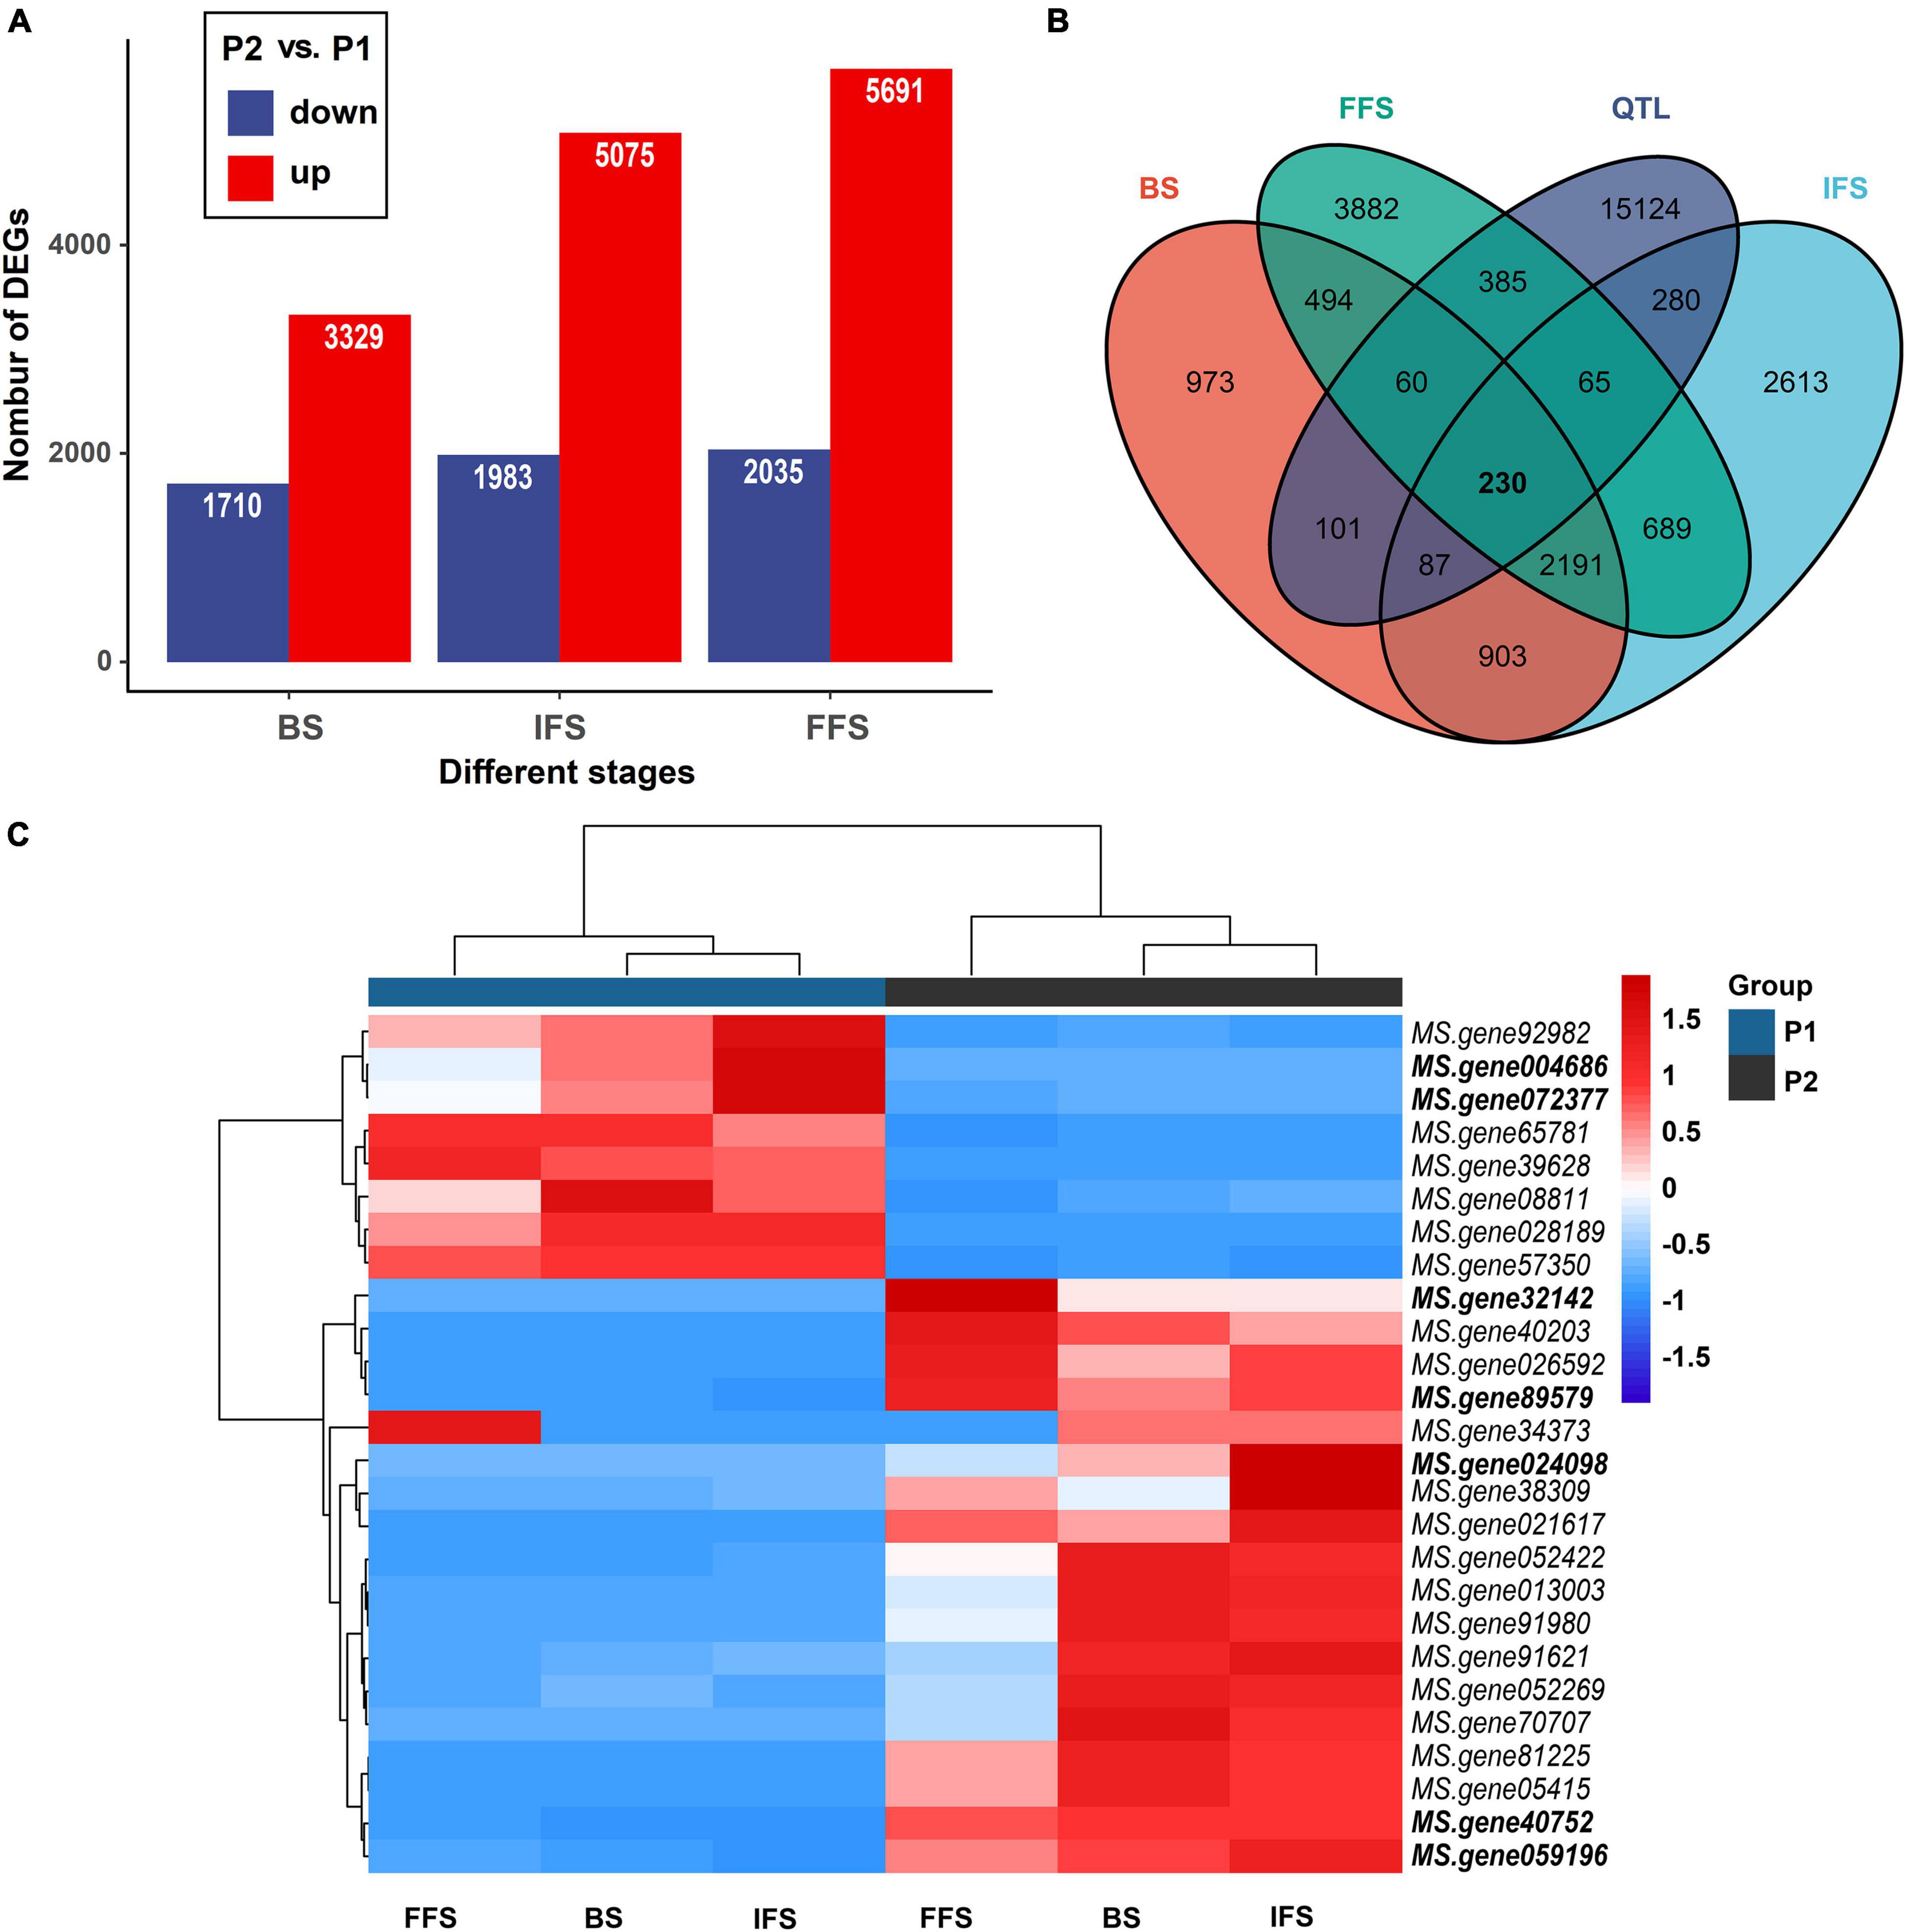
Figure 4. Differentially expressed genes (DEGs) within QTL intervals. (A) Number of downregulated genes (blue) and upregulated genes (red) between two parents at three flowering stages. BS, budding stage, IFS, initial flowering stage and FFS, full flowering stage. (B) The number of DEGs within QTL intervals. (C) Heatmap clustering the DEGs associated with flowering time by their expression abundance. DEGs within the consistent QTL intervals or new environment-stable QTLs were bold.
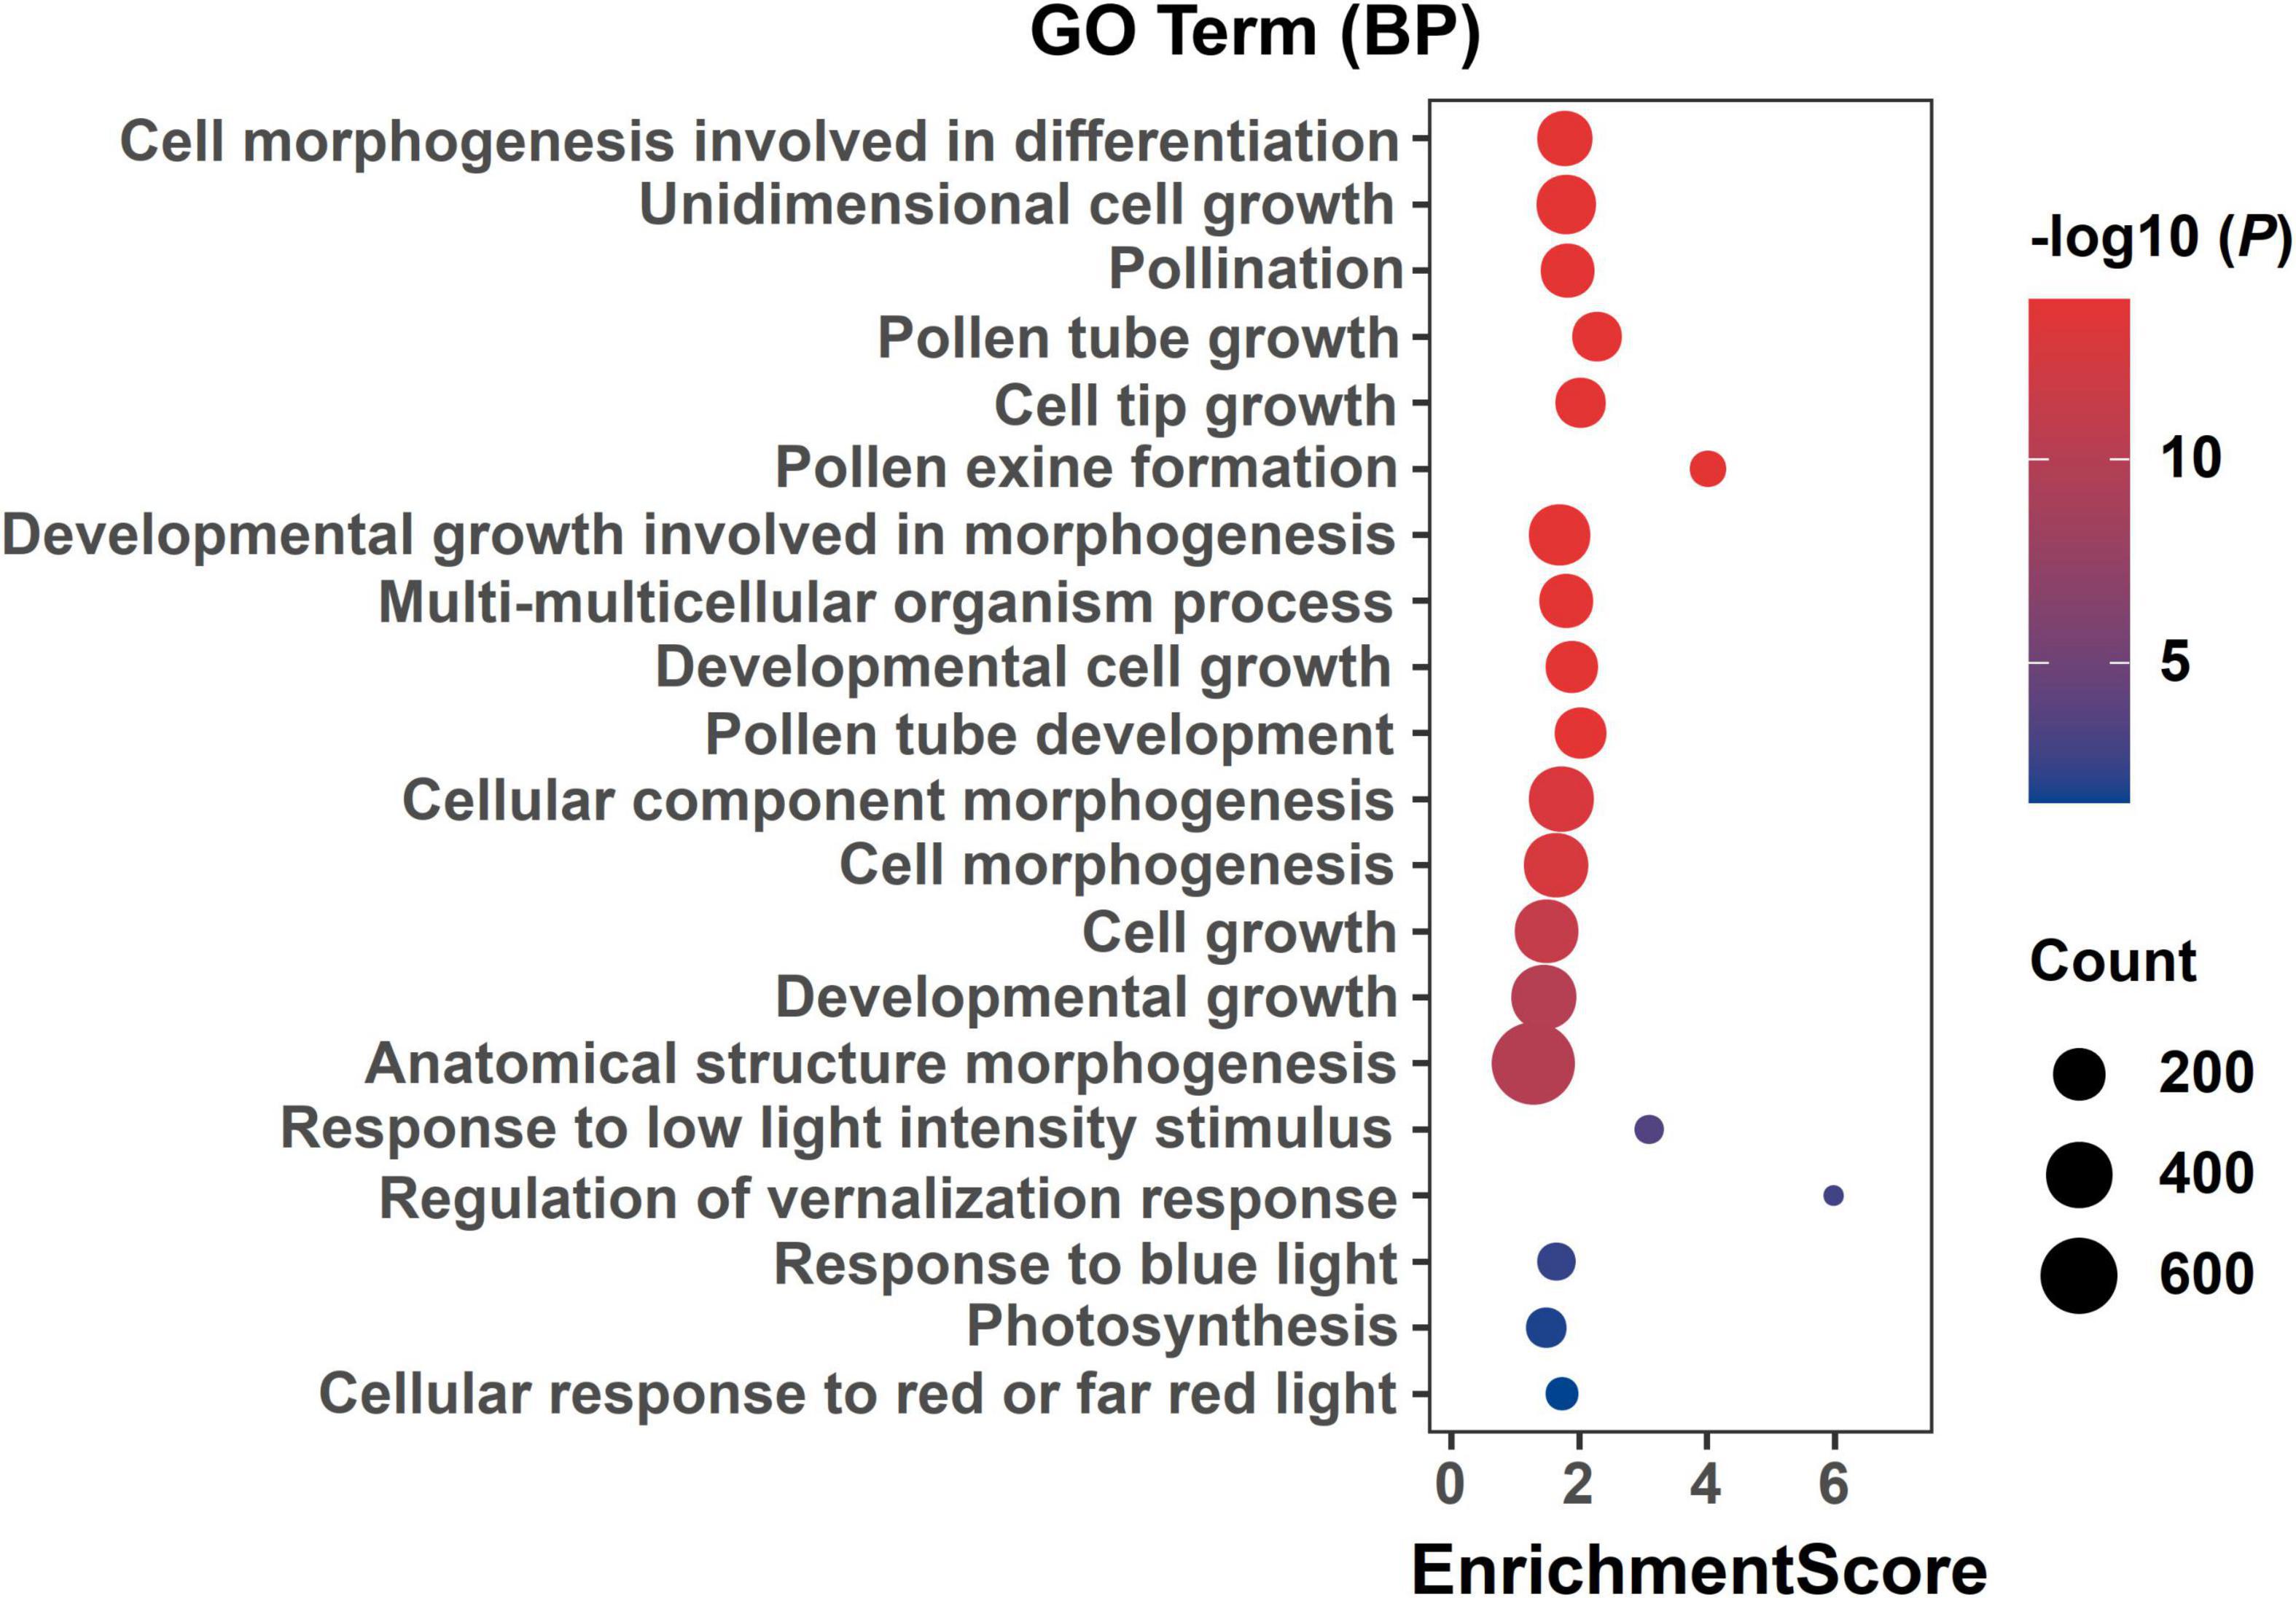
Figure 5. GO enrichment of DEGs in three alfalfa flowering stages. The ordinate represents different GO terms (biological progress) and the abscissa represents enrichment Score. Circle size represents the gene number while circle color represents the value of −log10 (P). The P-value was corrected by Benjamini and Hochberg (BH) method.
A comparison of the results from QTL mapping and RNA-seq analysis was employed to reveal candidate genes regulating the FT of alfalfa. A total of 230 common DEGs at three flowering stages were found in the QTL intervals (Supplementary Table 6 and Figure 4B). Of which, 26 DEGs were annotated as candidate genes associated with flowering time in plants (Figure 4C). Interestingly, seven candidates were co-localized within consistent QTLs or novel environment-stable QTLs. Among them, six DEGs resided in three consistent QTL regions of qFT1.1-2 (MS.gene89579 and MS.gene004686), qFT1.2-1 and qFT1.2-2 (MS.gene32142 and MS.gene40752), qFT7.4-2 and qFT7.4-4 (MS.gene072377 and MS.gene024098). The last one, MS.gene059196, was found in a novel environment-stable QTL region of qFT4.1-1. The relative gene expression levels of the seven candidates were validated by qRT-PCR. The results showed that RNA-seq and qRT-PCR results were highly consistent and the seven candidate genes were differently expressed in two parents at three flowering stages (Figure 6).
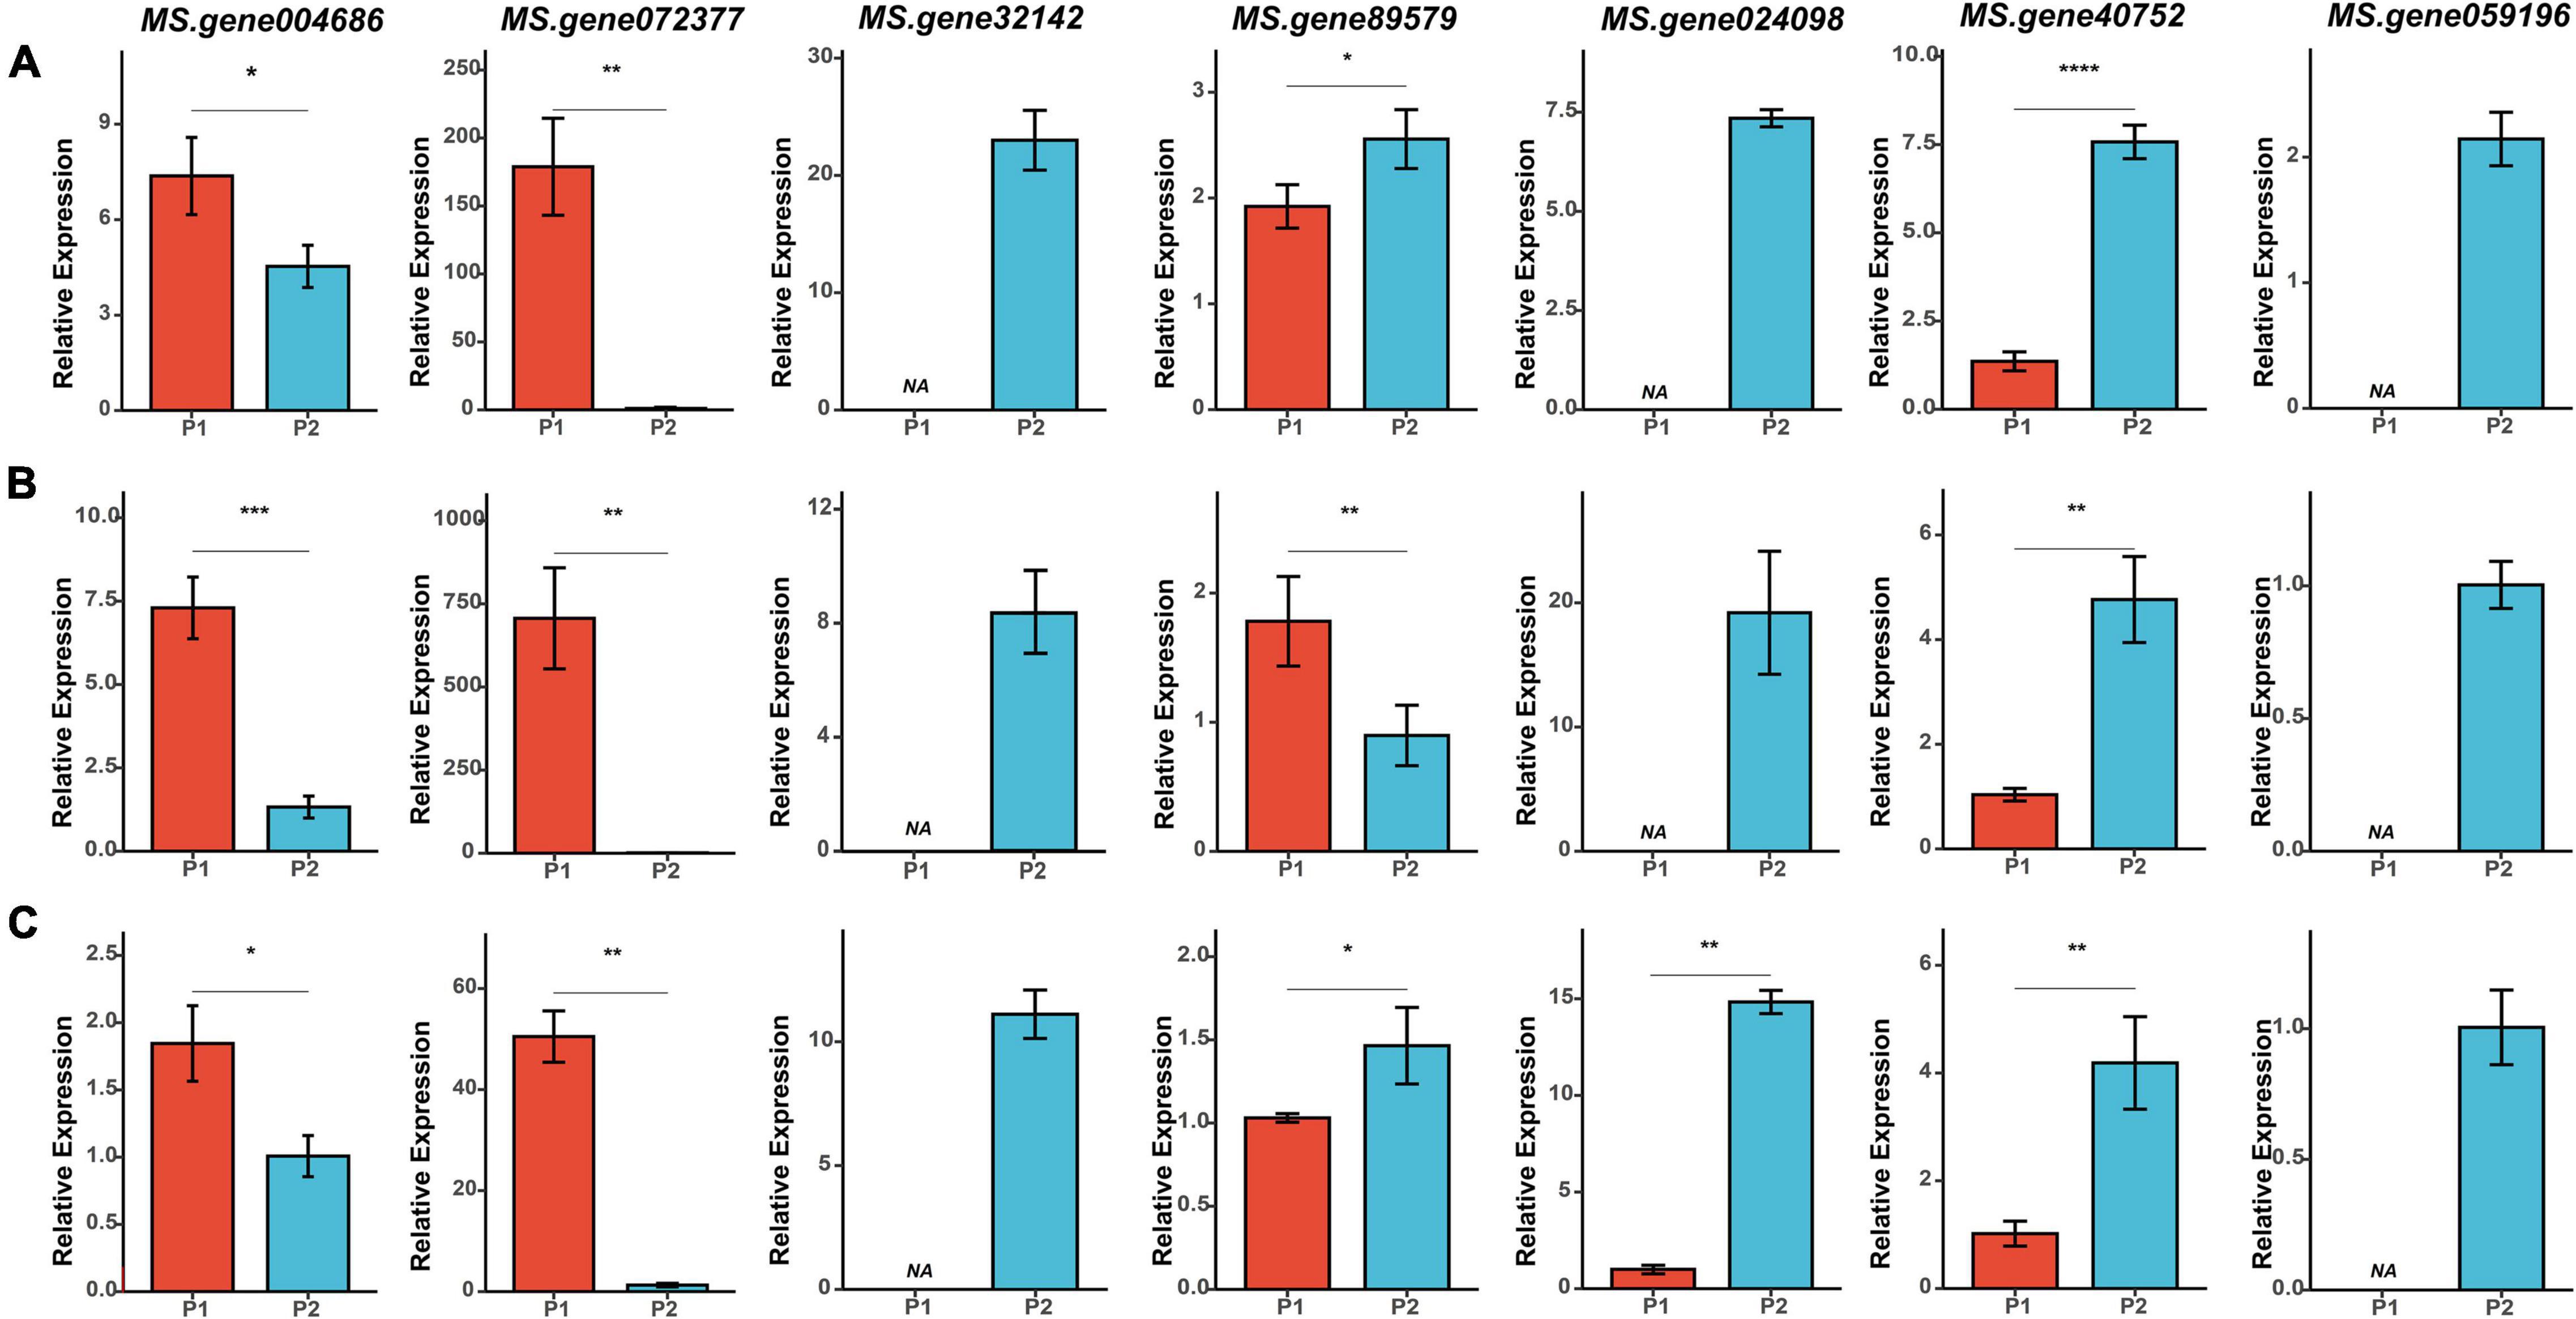
Figure 6. qRT-PCR analysis of the seven candidate genes at three flowering stages in two parents. (A–C) Relative expression of the seven candidate genes at BS (budding stage), IFS (initial flowering stage), and FFS (full flowering stage), respectively. Asterisk symbols indicate significant differences between two parents (t-test, *p < 0.05; **p < 0.01; ***p < 0.001, ****P < 0.0001).
Discussion
Large phenotypic variations of FT were observed in the F1 mapping population. The range of FT was comparable to a previous study identified in alfalfa population (Zhang et al., 2020). Alfalfa genotypes with late flowering showed an enhanced biomass yield (Adhikari et al., 2019). Our results also demonstrated that biomass yield was negatively correlated with FT in the F1 mapping population. Large phenotypic variations and the high heritability of FT provide an important basis for analyzing QTL mapping in alfalfa.
Although FT-related QTLs have been reported in previous studies (Adhikari et al., 2019; Zhang et al., 2020), there were some limitations due to the mapping population and the lack of a reference genome. For example, FT-related QTLs were identified in a pseudo-testcross F1 population derived from cultivars 3010 and CW 1010, but the two parents did not show significant differences in FT traits. Moreover, the flowering date was recorded as the day of the year (e.g., January 1st = 1) and was only recorded every 3 days (Adhikari et al., 2019). In addition, the genetic linkage maps were previously constructed by SNP markers generated through genotype−by−sequencing, not RAD-seq (Adhikari et al., 2019; Zhang et al., 2020). This could result in some differences in marker density and quality for creating genetic linkage maps. In this study, the two parental materials greatly varied for FT, and genome-wide SDA markers were detected with XinJiangDaYe reference genome. Therefore, our results on the constructed genetic maps and identified QTLs would add additional values to a better understanding of the genetic control of FT in alfalfa.
High-Density Genetic Linkage Maps
The creation of a high-density and quality linkage map is an important prerequisite for QTL mapping and map-based cloning of genes. Alfalfa is autotetraploid and highly heterozygous, which has impeded the construction of a high-density linkage map (Li et al., 2014). An early study reported that a tetraploid alfalfa linkage map had seven linkage groups with 443 cM because of low marker density (Brouwer and Osborn, 1999). Powerful new sequencing techniques can generate a large number of SNP markers for linkage map construction (Andolfatto et al., 2011; Yang et al., 2012). Li et al. (2014) first used SDA markers to construct high-density linkage maps for two alfalfa parents to identify QTLs associated with important agronomic traits. Their genetic maps with 64 linkage groups contained 3,591 SDA markers, with an average density of one marker per 1.5 and 1.0 cM for the maternal and paternal parents, respectively (Li et al., 2014). However, the deficiency of genomic information has been the major limitation for genetic map construction. The first available alfalfa genome sequence makes it possible to construct high-density genetic maps (Chen H. et al., 2020). In this study, the maps contained 13,773 SDA markers on 64 linkage groups across both parents, with an average marker distance of 0.58 and 0.59 cM for the P1 and P2 maps, respectively. These maps will be useful for future QTL mapping studies and the application of marker-assisted selection (MAS).
Population size and quality of linkage map greatly influence the power of QTL detection. Adhikari et al. (2019) performed QTL mapping for the flowering time by using a population of 181 F1 progenies in four environments. The heritability of flowering phenotypes in three of these environments (0.69, 0.74, and 0.75) was similar to our study, while only three QTLs individually co-localized in two environments. In a population of 392 F1 progenies, Zhang et al. (2020) identified three environment-stable QTLs, with one found in three environments and two found in two environments. In this study, we identified eight environment-stable QTLs, suggesting that our population size was big enough for QTL identification. Moreover, the high-density linkage map constructed in this study had an increased power of QTL detection compared with maps developed in previous studies (Adhikari et al., 2019; Zhang et al., 2020). Nonetheless, in our study, a major limitation remains due to the only use of SDA markers. Many polymorphic SNP markers not classified as SDA were not used for the genetic map construction, resulting in the loss of genetic information and the reduced power of QTL detection (Li et al., 2014). As a result, despite the high heritability of flowering time, only one environment-stable QTL was discovered across all four environments in our study.
Analysis of Candidate Genes for Flowering Time
Previous studies into FT mainly focused on QTL mapping in alfalfa (in genomics level) (Adhikari et al., 2019; Zhang et al., 2020). Although integration of QTL mapping and RNA-seq has been applied to identify candidate genes in rice, maize (Zea mays L.), wheat (Triticum aestivum L.), and other crops (Kuang et al., 2020; Lei et al., 2020; Han et al., 2022), but such approaches have not been used for discovering alfalfa FT genes. In this study, flower samples at three flowering stages from two parents of the F1 mapping population were characterized using the RNA-seq technology, and the identified DEGs were combined with QTLs to narrow the candidates. Finally, based on DEG annotations within QTL intervals, seven potential genes associated with flowering time were detected.
Two candidates, MS.gene89579 and MS.gene004686, located within qFT1.1-2. MS.gene89579, was annotated as a casein kinase I-like protein, which was previously reported to function in regulating flowering time through gibberellin signaling (Hori et al., 2013; Kang et al., 2020). Another one, MS.gene004686, was annotated as a basic helix-loop-helix (BHLH) transcription factor. Its homologous gene in Arabidopsis has been reported to control flowering time in response to blue light (Liu et al., 2013). In the interval of qFT1.2-1 and qFT1.2-2, two candidates (MS.gene32142 and MS.gene40752) associated with flowering time were annotated. MS.gene32142 homolog was ethylene receptor ETR2, which can delay flowering and cause starch accumulation in stems (Wuriyanghan et al., 2009). MS.gene40752 homolog was glycogen synthase kinase 3, which played an important role in preventing precocious flowering through phosphorylating CO (Chen Y. et al., 2020). In the physical interval of two consistent QTLs (qFT7.4-2 and qFT7.4-4), MS.gene072377 and MS.gene024098 were identified as candidate genes. MS.gene072377, annotated as leucine-rich repeat protein FLOR 1, promoted flowering transition in long days (Torti et al., 2012). MS.gene024098 was a member of UDP-glucosyltransferase family, and its homologous gene can regulate flowering time via flowering locus C (Wang et al., 2012). In the physical interval of qFT4.1-1, MS.gene059196 was annotated as a pleiotropic regulatory locus. Its mutants (prl1) caused an early flowering phenotype in Arabidopsis (Weihmann et al., 2012).
In plants, the FLOWERING LOCUS T (FT) family of genes is known to be associated with photoperiod sensing, which is involved in the initiation of flowering. By functional annotation, two homologues of FT, MS.gene51911 and MS.gene87044, were identified in a consistent QTL interval (qFT7.4-2 and qFT7.4-4). They were annotated as FTc and FTb, respectively. Interestingly, MsFTb1 could partially complement the phenotype of late flowering mutants (ft-10), while MsFTc had no effect on the flowering time in alfalfa (Lorenzo et al., 2020). The above-mentioned genes in the QTL region were not among the DEGs detected by RNA-Seq analysis, potentially due to the specific expression of FT genes in leaves (Huang et al., 2005).
Conclusion
Plant flowering is regulated by genetic and environmental signals. The work presented here revealed the genetic mechanisms controlling flowering time in the alfalfa F1 population through QTL mapping. High-density genetic maps were created and 38 QTLs for FT were detected, including seven consistent QTLs and four novel environment-stable QTLs. Seven candidate genes involved in flowering regulation were annotated by QTL mapping and DEGs analysis. The functions of these candidate genes could be further verified in alfalfa. The loci generated by the current QTL mapping study are valuable resources for enhancing breeding programs aimed at improving flowering time and yield in alfalfa.
Data Availability Statement
The datasets presented in this study can be found in online repositories. The names of the repository/repositories and accession number(s) can be found below: https://www.ncbi.nlm.nih.gov/bioproject/PRJNA817856.
Author Contributions
QY, JK, and ZW conceived, designed the experiments, and developed the mapping population. XJ, FH, XY, and CY collected phenotypic data. XJ, FZ, TY, and TG performed data analysis. XJ and ZW wrote the manuscript. YJ and JK revised and finalized the manuscript. All authors read and approved the final manuscript.
Funding
This work was supported by the National Natural Science Foundation of China (32071868), the earmarked fund for the China Agriculture Research System (CARS-35-04), the Key Research Project of Ningxia Province for Alfalfa Breeding Program (2019NYY203), and the Agricultural Science and Technology Innovation Program (ASTIP-IAS14).
Conflict of Interest
The authors declare that the research was conducted in the absence of any commercial or financial relationships that could be construed as a potential conflict of interest.
Publisher’s Note
All claims expressed in this article are solely those of the authors and do not necessarily represent those of their affiliated organizations, or those of the publisher, the editors and the reviewers. Any product that may be evaluated in this article, or claim that may be made by its manufacturer, is not guaranteed or endorsed by the publisher.
Supplementary Material
The Supplementary Material for this article can be found online at: https://www.frontiersin.org/articles/10.3389/fpls.2022.899681/full#supplementary-material
Supplementary Figure 1 | Distribution of QTLs for flowering time (FT) using LS means of each environment and BLUP values in P1 parent.
Supplementary Figure 2 | Distribution of QTLs for flowering time (FT) detected using LS means of each environment and BLUP values in P2 parent.
Supplementary Table 5 | GO enrichment analysis of the DEGs.
Footnotes
- ^ http://tianqi.2345.com/wea_history/60198.htm
- ^ https://richurimo.51240.com/beijing__richurimo/
- ^ www.kyazma.nl
- ^ www.isbreeding.net
- ^ https://www.ncbi.nlm.nih.gov/bioproject/PRJNA817856
- ^ https://www.bioinformatics.babraham.ac.uk/projects/fastqc/
- ^ https://figshare.com/projects/whole_genome_sequencing_and_assembly_of_Medicago_sativa/66380
- ^ https://www.ncbi.nlm.nih.gov/
- ^ https://ensembl.gramene.org/
- ^ http://eggnog-mapper.embl.de/
References
Adhikari, L., Makaju, S. O., and Missaoui, A. M. (2019). QTL mapping of flowering time and biomass yield in tetraploid alfalfa (Medicago sativa L.). BMC Plant Biol. 19:359.
Andolfatto, P., Davison, D., Erezyilmaz, D., Hu, T. T., Mast, J., Sunayama-Morita, T., et al. (2011). Multiplexed shotgun genotyping for rapid and efficient genetic mapping. Genome Res. 21, 610–617. doi: 10.1101/gr.115402.110
Bai, Z., Ma, W., Ma, L., Velthof, G. L., Wei, Z., Havlík, P., et al. (2018). China’s livestock transition: Driving forces, impacts, and consequences. Sci. Adv. 4:eaar8534. doi: 10.1126/sciadv.aar8534
Bates, D., Mächler, M., Bolker, B., and Walker, S. (2014). Fitting linear mixed-effects models using lme4. arXiv 1406, 133–199. doi: 10.1007/0-387-22747-4_4
Bolger, A. M., Marc, L., and Bjoern, U. (2014). Trimmomatic: a flexible trimmer for Illumina sequence data. Bioinformatics 30, 2114–2120. doi: 10.1093/bioinformatics/btu170
Brouwer, D. J., and Osborn, T. C. (1999). A molecular marker linkage map of tetraploid alfalfa (Medicago sativa L.). Theor. Appl. Genet. 99, 1194–1200. doi: 10.1007/s001220051324
Chen, C., Chen, H., Zhang, Y., Thomas, H. R., Frank, M. H., He, Y., et al. (2020). TBtools: an integrative toolkit developed for interactive analyses of big biological data. Mol. Plant 13, 1194–1202. doi: 10.1016/j.molp.2020.06.009
Chen, H., Zeng, Y., Yang, Y., Huang, L., Tang, B., Zhang, H., et al. (2020). Allele-aware chromosome-level genome assembly and efficient transgene-free genome editing for the autotetraploid cultivated alfalfa. Nat. Commun. 11:2494. doi: 10.1038/s41467-020-16338-x
Chen, S., Zhou, Y., Chen, Y., and Gu, J. (2018). fastp: an ultra-fast all-in-one FASTQ preprocessor. Bioinformatics 34, i884–i890. doi: 10.1093/bioinformatics/bty560
Chen, Y., Song, S., Gan, Y., Jiang, L., Yu, H., and Shen, L. (2020). SHAGGY-like kinase 12 regulates flowering through mediating CONSTANS stability in Arabidopsis. Sci. Adv. 6:eaaw0413. doi: 10.1126/sciadv.aaw0413
Danecek, P., Auton, A., Abecasis, G., Albers, C. A., Banks, E., Depristo, M. A., et al. (2011). The variant call format and VCFtools. Bioinformatics 27, 2156–2158. doi: 10.1093/bioinformatics/btr330
Derakhshani, B., Jafary, H., Maleki Zanjani, B., Hasanpur, K., Mishina, K., Tanaka, T., et al. (2020). Combined QTL mapping and RNA-Seq profiling reveals candidate genes associated with cadmium tolerance in barley. PLoS One 15:e0230820. doi: 10.1371/journal.pone.0230820
Diaz, A., Zikhali, M., Turner, A. S., Isaac, P., and Laurie, D. A. (2012). Copy number variation affecting the Photoperiod-B1 and Vernalization-A1 genes is associated with altered flowering time in wheat (Triticum aestivum). PLoS One 7:e33234. doi: 10.1371/journal.pone.0033234
Grabowski, P. P., Evans, J., Daum, C., Deshpande, S., Barry, K. W., Kennedy, M., et al. (2017). Genome-wide associations with flowering time in switchgrass using exome-capture sequencing data. New Phytol. 213, 154–169. doi: 10.1111/nph.14101
Han, Q., Zhu, Q., Shen, Y., Lee, M., Lübberstedt, T., and Zhao, G. (2022). QTL mapping low-temperature germination ability in the maize IBM Syn10 DH Population. Plants 11:214. doi: 10.3390/plants11020214
He, F., Kang, J., Zhang, F., Long, R., Yu, L.-X., Wang, Z., et al. (2019). Genetic mapping of leaf-related traits in autotetraploid alfalfa (Medicago sativa L.). Mol. Breed. 39:147.
Hecht, V., Laurie, R. E., VanderSchoor, J. K., Ridge, S., Knowles, C. L., Liew, L. C., et al. (2011). The Pea GIGAS Gene is a flowering locus t homolog necessary for graft-transmissible specification of flowering but not for responsiveness to photoperiod. Plant Cell 23, 147–161. doi: 10.1105/tpc.110.081042
Hori, K., Matsubara, K., and Yano, M. (2016). Genetic control of flowering time in rice: integration of Mendelian genetics and genomics. Theor. Appl. Genet. 129, 2241–2252. doi: 10.1007/s00122-016-2773-4
Hori, K., Ogiso-Tanaka, E., Matsubara, K., Yamanouchi, U., Ebana, K., and Yano, M. (2013). Hd16, a gene for casein kinase I, is involved in the control of rice flowering time by modulating the day-length response. Plant J. 76, 36–46. doi: 10.1111/tpj.12268
Huang, L., Yang, Y., Zhang, F., and Cao, J. (2017). A genome-wide SNP-based genetic map and QTL mapping for agronomic traits in Chinese cabbage. Sci. Rep. 7:46305. doi: 10.1038/srep46305
Huang, T., Böhlenius, H., Eriksson, S., Parcy, F., and Nilsson, O. J. S. (2005). The mRNA of the Arabidopsis gene FT moves from leaf to shoot apex and induces flowering. Science 309, 1694–1696. doi: 10.1126/science.1117768
Kang, J., Cui, H., Jia, S., Liu, W., Yu, R., Wu, Z., et al. (2020). Arabidopsis thaliana MLK3, a plant-specific casein kinase 1, negatively regulates flowering and phosphorylates histone H3 in Vitro. Genes 11:345. doi: 10.3390/genes11030345
Kim, D., Paggi, J. M., Park, C., Bennett, C., and Salzberg, S. L. (2019). Graph-based genome alignment and genotyping with HISAT2 and HISAT-genotype. Nat. Biotechnol. 37, 907–915. doi: 10.1038/s41587-019-0201-4
Kinoshita, A., and Richter, R. (2020). Genetic and molecular basis of floral induction in Arabidopsis thaliana. J. Exp. Bot. 71, 2490–2504. doi: 10.1093/jxb/eraa057
Koornneef, M., Alonso-Blanco, C., Peeters, A. J., and Soppe, W. (1998). Genetic Control of Flowering Time in Arabidopsis. Annu. Rev. Plant Physiol. Plant Mol. Biol. 49, 345–370.
Kooyers, N. J. (2015). The evolution of drought escape and avoidance in natural herbaceous populations. Plant Sci. 234, 155–162. doi: 10.1016/j.plantsci.2015.02.012
Kuang, C. H., Zhao, X. F., Yang, K., Zhang, Z. P., Ding, L., Pu, Z. E., et al. (2020). Mapping and characterization of major QTL for spike traits in common wheat. Physiol. Mol. Biol. Plants 26, 1295–1307. doi: 10.1007/s12298-020-00823-0
Laurie, R. E., Diwadkar, P., Jaudal, M., Zhang, L., Hecht, V. R., Wen, J., et al. (2011). The Medicago FLOWERING LOCUS T Homolog, MtFTa1, Is aKey RegulatorofFlowering Time. Plant Physiol. 156, 2207–2224. doi: 10.1104/pp.111.180182
Lee, B.-Y., Kim, M.-S., Choi, B.-S., Nagano, A. J., Wu, R. S. S., Takehana, Y., et al. (2019). Construction of High-Resolution RAD-Seq based linkage map, anchoring reference genome, and QTL mapping of the sex chromosome in the marine medaka oryzias melastigma. G3 9, 3537–3545. doi: 10.1534/g3.119.400708
Lei, L., Zheng, H., Bi, Y., Yang, L., Liu, H., Wang, J., et al. (2020). Identification of a major qtl and candidate gene analysis of salt tolerance at the bud burst stage in rice (Oryza sativa L.) using QTL-Seq and RNA-Seq. Rice 13, 1–14. doi: 10.1186/s12284-020-00416-1
Li, H. (2013). Aligning sequence reads, clone sequences and assembly contigs with BWA-MEM. arXiv 1303:3997.
Li, H., Handsaker, B., Wysoker, A., Fennell, T., Ruan, J., Homer, N., et al. (2009). The sequence alignment/map format and SAMtools. Bioinformatics 25, 2078–2079. doi: 10.1093/bioinformatics/btp352
Li, X., Wei, Y., Acharya, A., Jiang, Q., Kang, J., and Brummer, E. C. (2014). A Saturated Genetic linkage map of autotetraploid alfalfa (Medicago sativa L.) developed using genotyping-by-sequencing is highly syntenous with the medicago truncatula genome. G3 Genesgenet. 4, 1971–1979. doi: 10.1534/g3.114.012245
Liao, Y., Smyth, G. K., and Shi, W. (2014). featureCounts: an efficient general purpose program for assigning sequence reads to genomic features. Bioinformatics 30, 923–930. doi: 10.1093/bioinformatics/btt656
Liu, Y., Li, X., Li, K., Liu, H., Lin, C., and Quail, P. H. (2013). Multiple bHLH proteins form heterodimers to mediate CRY2-dependent regulation of flowering-time in arabidopsis. PLoS Genet. 9:e1003861. doi: 10.1371/journal.pgen.1003861
Lorenzo, C. D., Garcia-Gagliardi, P., Antonietti, M. S., Sanchez-Lamas, M., Mancini, E., Dezar, C. A., et al. (2020). Improvement of alfalfa forage quality and management through the down-regulation of MsFTa1. Plant Biotechnol. J. 18, 944–954. doi: 10.1111/pbi.13258
Love, M. I., Huber, W., and Anders, S. (2014). Moderated estimation of fold change and dispersion for RNA-seq data with DESeq2. Genome Biol. 15, 1–21. doi: 10.1186/s13059-014-0550-8
Lu, S., Dong, L., Fang, C., Liu, S., Kong, L., Cheng, Q., et al. (2020). Stepwise selection on homeologous PRR genes controlling flowering and maturity during soybean domestication. Nat. Genet. 52, 428–436. doi: 10.1038/s41588-020-0604-7
Major, D. J., Hanna, M. R., and Beasley, B. W. (1991). Photoperiod response characteristics of alfalfa (Medicago sativa L.) cultivars. Can. J. Plant Sci. 71, 87–93. doi: 10.4141/cjps91-010
McKenna, A., Hanna, M., Banks, E., Sivachenko, A., Cibulskis, K., Kernytsky, A., et al. (2010). The Genome Analysis Toolkit: a MapReduce framework for analyzing next-generation DNA sequencing data. Genome Res. 20, 1297–1303. doi: 10.1101/gr.107524.110
Meng, L., Li, H., Zhang, L., and Wang, J. (2015). QTL IciMapping: Integrated software for genetic linkage map construction and quantitative trait locus mapping in biparental populations. Crop J. 3, 269–283. doi: 10.1016/j.cj.2015.01.001
Radovic, J., Sokolovic, D., and Markovic. (2009). Alfalfa-most important perennial forage legume in animal husbandry. Biotechnol. Anim. Husb. 25, 465–475. doi: 10.2298/bah0906465r
Schiffers, K., Bourne, E. C., Lavergne, S., Thuiller, W., and Travis, J. M. (2013). Limited evolutionary rescue of locally adapted populations facing climate change. Philos. Trans. R. Soc. Lond. B. Biol. Sci. 368:20120083. doi: 10.1098/rstb.2012.0083
Song, Y. H., Ito, S., and Imaizumi, T. (2013). Flowering time regulation: photoperiod- and temperature-sensing in leaves. Trends Plant Sci. 18, 575–583. doi: 10.1016/j.tplants.2013.05.003
Srikanth, A., and Schmid, M. (2011). Regulation of flowering time: all roads lead to Rome. Cell. Mol. Life Sci. 68, 2013–2037. doi: 10.1007/s00018-011-0673-y
Stam, P. (1993). Construction of integrated genetic linkage maps by means of a new computer package: join Map. Plant J. 3, 739–744. doi: 10.1111/j.1365-313x.1993.00739.x
Torti, S., Fornara, F., Vincent, C., Andrés, F., Nordström, K., Göbel, U., et al. (2012). Analysis of the Arabidopsis shoot meristem transcriptome during floral transition identifies distinct regulatory patterns and a leucine-rich repeat protein that promotes flowering. Plant Cell 24, 444–462. doi: 10.1105/tpc.111.092791
Upadhyaya, H. D., Bajaj, D., Das, S., Saxena, M. S., Badoni, S., Kumar, V., et al. (2015). A genome-scale integrated approach aids in genetic dissection of complex flowering time trait in chickpea. Plant Mol. Biol. 89, 403–420. doi: 10.1007/s11103-015-0377-z
Voorrips, R. E. (2002). MapChart: software for the graphical presentation of linkage maps and QTLs. J. Hered. 93, 77–78. doi: 10.1093/jhered/93.1.77
Wang, B., Jin, S. H., Hu, H. Q., Sun, Y. G., Wang, Y. W., Han, P., et al. (2012). UGT87A2, an Arabidopsis glycosyltransferase, regulates flowering time via FLOWERING LOCUS C. New Phytol. 194, 666–675. doi: 10.1111/j.1469-8137.2012.04107.x
Weihmann, T., Palma, K., Nitta, Y., and Li, X. (2012). Pleiotropic regulatory locus 2 exhibits unequal genetic redundancy with its homolog PRL1. Plant Cell Physiol. 53, 1617–1626. doi: 10.1093/pcp/pcs103
Weller, J. L., Vander Schoor, J. K., Perez-Wright, E. C., Hecht, V., Gonzalez, A. M., Capel, C., et al. (2019). Parallel origins of photoperiod adaptation following dual domestications of common bean. J. Exp. Bot. 70, 1209–1219. doi: 10.1093/jxb/ery455
Wen, J., Jiang, F., Weng, Y., Sun, M., Shi, X., Zhou, Y., et al. (2019). Identification of heat-tolerance QTLs and high-temperature stress-responsive genes through conventional QTL mapping. QTL-seq and RNA-seq in tomato. BMC Plant Biol. 19:398. doi: 10.1186/s12870-019-2008-3
Wong, A., Hecht, V. F., Picard, K., Diwadkar, P., Laurie, R. E., Wen, J., et al. (2014). Isolation and functional analysis of CONSTANS-LIKE genes suggests that a central role for CONSTANS in flowering time control is not evolutionarily conserved in Medicago truncatula. Front. Plant Sci. 5:486. doi: 10.3389/fpls.2014.00486
Wuriyanghan, H., Zhang, B., Cao, W. H., Ma, B., Lei, G., Liu, Y. F., et al. (2009). The ethylene receptor ETR2 delays floral transition and affects starch accumulation in rice. Plant Cell 21, 1473–1494. doi: 10.1105/tpc.108.065391
Yang, H., Tao, Y., Zheng, Z., Li, C., Sweetingham, M. W., and Howieson, J. G. (2012). Application of next-generation sequencing for rapid marker development in molecular plant breeding: a case study on anthracnose disease resistance in Lupinus angustifolius L. BMC Genom. 13:318. doi: 10.1186/1471-2164-13-318
Ye, J., Yang, Y., Chen, B., Shi, J., Luo, M., Zhan, J., et al. (2017). An integrated analysis of QTL mapping and RNA sequencing provides further insights and promising candidates for pod number variation in rapeseed (Brassica napus L.). BMC Genom. 18:71. doi: 10.1186/s12864-016-3402-y
Zhang, F., Kang, J., Long, R., Yu, L. X., Sun, Y., Wang, Z., et al. (2020). Construction of high-density genetic linkage map and mapping quantitative trait loci (QTL) for flowering time in autotetraploid alfalfa (Medicago sativa L.) using genotyping by sequencing. Plant Genome 13:45. doi: 10.1002/tpg2.20045
Keywords: alfalfa, flowering time, genetic map, QTL, RAD-seq, RNA-seq
Citation: Jiang X, Yang T, Zhang F, Yang X, Yang C, He F, Long R, Gao T, Jiang Y, Yang Q, Wang Z and Kang J (2022) RAD-Seq-Based High-Density Linkage Maps Construction and Quantitative Trait Loci Mapping of Flowering Time Trait in Alfalfa (Medicago sativa L.). Front. Plant Sci. 13:899681. doi: 10.3389/fpls.2022.899681
Received: 19 March 2022; Accepted: 25 April 2022;
Published: 26 May 2022.
Edited by:
Jiyu Zhang, Lanzhou University, ChinaReviewed by:
Muhammet s̨akiroǧlu, Adana Alparslan Turkes Science and Technology University, TurkeyZefeng Yang, Yangzhou University, China
Copyright © 2022 Jiang, Yang, Zhang, Yang, Yang, He, Long, Gao, Jiang, Yang, Wang and Kang. This is an open-access article distributed under the terms of the Creative Commons Attribution License (CC BY). The use, distribution or reproduction in other forums is permitted, provided the original author(s) and the copyright owner(s) are credited and that the original publication in this journal is cited, in accordance with accepted academic practice. No use, distribution or reproduction is permitted which does not comply with these terms.
*Correspondence: Zhen Wang, d2FuZ3poZW5AY2Fhcy5jbg==; Junmei Kang, a2FuZ2p1bm1laUBjYWFzLmNu