 Nicola D'Ascenzo1,2*
 Qingguo Xie1,2,3*
 Emanuele Antonecchia1,2
 Mariachiara Ciardiello2
 Giancarlo Pagnani4
 Michele Pisante4
- 1School of Life Science and Technology, Huazhong University of Science and Technology, Wuhan, China
- 2Department of Medical Physics and Engineering, Istituto Neurologico Mediterraneo, Istituto di Ricovero e Cura a Carattere Scientifico, Pozzilli, Italy
- 3Department of Electronic Engineering and Information Science, University of Science and Technology of China, Hefei, China
- 4Faculty of Bioscience and Technology for Food, Agriculture and Environment, University of Teramo, Teramo, Italy
Time activity curve (TAC) signal processing in plant positron emission tomography (PET) is a frontier nuclear science technique to bring out the quantitative fluid dynamic (FD) flow parameters of the plant vascular system and generate knowledge on crops and their sustainable management, facing the accelerating global climate change. The sparse space-time sampling of the TAC signal impairs the extraction of the FD variables, which can be determined only as averaged values with existing techniques. A data-driven approach based on a reliable FD model has never been formulated. A novel sparse data assimilation digital signal processing method is proposed, with the unique capability of a direct computation of the dynamic evolution of noise correlations between estimated and measured variables, by taking into explicit account the numerical diffusion due to the sparse sampling. The sequential time-stepping procedure estimates the spatial profile of the velocity, the diffusion coefficient and the compartmental exchange rates along the plant stem from the TAC signals. To illustrate the performance of the method, we report an example of the measurement of transport mechanisms in zucchini sprouts.
1. Introduction
The extraction of quantitative plant transport parameters from the sparse time activity curve (TAC) signals measured with positron emission tomography (PET) techniques represents one of the frontiers of plant digital imaging (Hubeau and Steppe, 2015; Galieni et al., 2021; Mincke et al., 2021a; Antonecchia et al., 2022), with a strong impact in early stress assessment (Tsukamoto et al., 2008; Yoshihara et al., 2014; Partelová et al., 2017), yield improvement (Yamazaki et al., 2015; Hubeau et al., 2019b; Mincke et al., 2020a), sustainable agriculture (Karve et al., 2015; Kuritaa et al., 2020) and climate change studies (Hubeau et al., 2019a).
The plant PET imaging technique is schematically illustrated in Figures 1A–F (Galieni et al., 2021). A ligand, generally H2O, CO2, or 2-Deoxyglucose (2-DG), is introduced in the plant and is transported in the vascular system (Figure 1A). It is labeled with a β+ emitter. Two collinear 511 keV γ rays emerge from the annihilation point of the β+ within the plant tissue, are detected in an array of sensors (Figure 1B), and provide tomographic information, which is used to reproduce a time-dependent 3-dimensional map of the ligand displacement in the vascular system (Figures 1C,D).
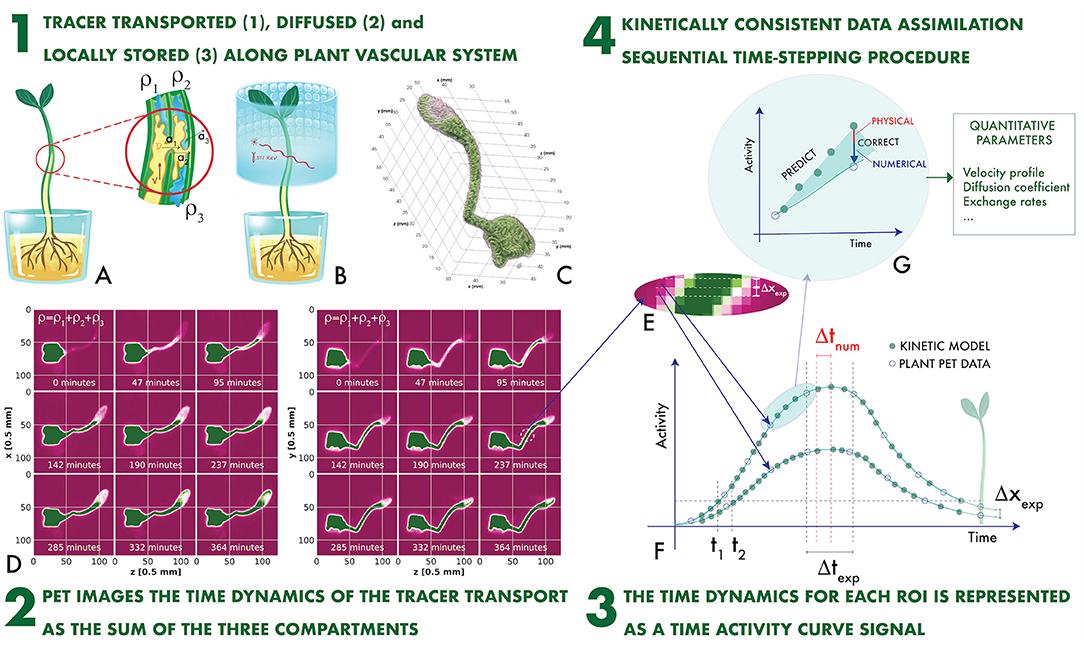
Figure 1. The plant PET imaging technique (A–F) and the novel proposed concept of Kinetically Consistent Data Assimilation KC-DA digital signal processing for quantitative plant PET imaging (F,G): the tracer transported, diffused and locally stored along the plant vascular system (1) generates time-changing 3-dimensional maps (2). The change in time of the measured activity at a given region of interest along the stem defines the Time Activity Curve (TAC) signal (3), which is modeled with a time stepping prediction-correction algorithm based on a set of novel fluid dynamic equations for the data-driven extraction of physically-driven kinetic parameters (4).
PET data are extremely sparse in space and time. Intensity maps are sampled with a voxel size Δxexp ranging between 0.25 and 1 mm (Kuritaa et al., 2020; Antonecchia et al., 2022). As the minimal spatial resolution of a PET system is approximately 0.54 mm (FWHM) with a 18F label in water (Moses, 2011), it is impossible to identify the microscopic capillaries composing the xylem and the phloem. Therefore, voxels are grouped in larger regions of interest (ROI). For instance, a typical ROI structure along the stem of a plant is illustrated in Figure 1E (Mincke et al., 2021a). ROIs with a minimal thickness of one voxel are displaced adjacent to each other. The total activity measured in the i-th ROI along the stem direction x at the time tJ is the TAC signal. It is sampled with a typical time step Δtexp of few minutes (Figure 1F).
The time behavior of TAC signals is governed by fluid dynamics (FD) processes (Figure 1A). The measured TAC signal is the sum of tracer fractions either transported through the xylem with a velocity and a diffusion coefficient , or diffused through surrounding parenchyma with a rate a1, or locally assimilated and stored with a rate a2, or diffused through the atmosphere with an efflux rate a3 (Mincke et al., 2020b).
However, the task of computing the complete fluid state from the TAC signal is affected by the sparse nature of the space-time sampling. A simple threshold-based approach illustrates the problem. The apoplastic velocity is responsible of the rising signal front. The average speed uexp between two adjacent ROIs is uexp = Δxexp/(t2 − t1), where t1 and t2 are the times at which the TAC crosses a certain threshold (Figure 1F). The maximal measurable average speed is limited by the sparse sampling, as , with a consequent bias in the determination of the other unknown variables.
To mitigate this intrinsic limitation of TAC signals, data-driven model-free techniques consider only physical parameters with already known validity ranges (Keutgen et al., 2002, 2005; Minchin and Thorpe, 2003; Matsuhashi et al., 2010; Ferrieri et al., 2012) and compartmental modeling estimates only quantities averaged in space and time (Bühler et al., 2011; Hubeau et al., 2018; Mincke et al., 2021a). These approaches cannot be extended to a complete estimation of the FD processes occurring inside the plant vascular system, which remain largely unexplored (Jensen et al., 2012).
Sequential extended Kalman Filter (EKF) data assimilation (DA), based on Bayesian interference, may seem an ideal time-stepping technique for TAC signal processing (Kalman, 1960; Suzuki et al., 2010; Suzuki, 2012; Kato et al., 2015; Suzuki and Yamamoto, 2015; Wang et al., 2017). However, EKF requires a linear implementation of the dynamic model for the prediction of the state at time J+1 based on the state XJ at time J:
Moreover, the physical and numerical errors are modeled with a covariance matrix P and an error covariance matrix Q (Wang et al., 2017). The predicted covariance matrix at time J+1 is evolved from the value PJ at time J with the linearized relationship:
Conventional CFD methods cannot be adapted easily to the form of Equations (1) and (2) as they are based on a finite volume discretization combining central schemes and Riemann solvers for the viscous and inviscid flows, respectively (Issa, 1986; Meldi and Poux, 2017; Qu et al., 2019). Approximated solutions based either on structural similarities between solvers and DA approaches, such as reduced order Kalman filtering (Suzuki, 2012), or on statistical ensemble determination of P have been proposed (Evensen, 2009).
In this paper a novel procedure is proposed consisting of assimilating the sparsely sampled TAC signal with computational fluid dynamics (CFD) data simulated at a fine time sampling Δtsim. A first high resolution predictor stage integrates the FD model forwards in time and, when the experimental data are available, a second correction stage adjusts the model parameters before continuing to the next cycle (Figure 1G). A key aspect of this study is the adoption of a novel set of quasi gas dynamic (QGD) equations for plant PET TAC signals, which can be reduced directly in the form of Equation (1). On this basis a prediction-correction sequential time stepping data assimilation procedure has been developed with the unique feature of a direct computation of the time evolution of the covariance matrix as in Equation (2) without statistical approximations. With respect to existing digital signal processing approaches to plant PET TAC signals, the novel kinetically consistent data assimilation (KC-DA) procedure estimates the complete FD state profile along the vascular system of the plant, controlling explicitly the interplay between physical FD-related mechanisms and computational numerical errors caused by the sparsity of the signal (Figure 1G). It is the first time that Kalman filtering is used in combination with kinetically consistent algorithms for data-driven modeling in plant science. The validity of KC-DA is experimentally demonstrated with an example of zucchini sprouts measurement.
2. Materials and Methods
2.1. The Kinetically Consistent Data Assimilation Procedure
The transported fluid in the xylem along the 1-dimensional vessel direction x was represented by using the time-dependent (t) distribution function f(x, ξ, t) in the phase-space defined by the local position x and velocity ξ of the fluid molecules. The macroscopic fluid density and velocity were calculated as the zero-th and first order moments of f(x, ξ, t) with respect to the molecular velocity ξ (Chapman and Cowling, 1990). The pressure p(x, t) was assumed here to be proportional to the transported tracer density as p(x, t) = kρρ1(x, t), with kρ proportionality constant. The time evolution of the distribution function was described by the Boltzmann kinetic transport equation (Boltzmann, 1995):
Equation (3) was solved between equilibrium states, by using a computational time interval Δt proportional to the intrinsic relaxation time τ. Under this approximation, Equation (3) was reformulated in discrete form for the time variable as:
where the collision integral vanishes, because the transport was effectively computed only at the equilibrium states. The balance equation was obtained by approximating (Equation 4) with a second-order Taylor expansion:
The zero-th order momentum of Equation (5) expressed an equation for ρ1(x, t) (Chetverushkin, 2015; Chetverushkin et al., 2017), which was coupled with the dynamic equations regulating the contributions of ρ2(x, t) and ρ3(x, t) (Mincke et al., 2021a), defining the system of QGD equations for plant PET TAC signals:
The terms in the left side of Equation (6) defines the apoplastic flow. The first term in the right side of Equation (6) represents the transcellular roots, with a macroscopic diffusion coefficient . A remarkable feature of this model is, that the second but last term of Equation (6) introduces explicitly the numerical viscosity caused by the sparse sampling Δxexp of the TAC signal, with τ(x) = ατΔxexp/u(x), where ατ is a tunable parameter. The coefficients ai in Equations (7) and (8) represent the exchange rates between the different processes. Temperature, humidity and illumination are usually controlled in plant imaging experiments. The model was restricted to observations performed within few hours and along segments of the stem, which never exceded approximately 10 cm. Therefore, the velocity u(x) was considered constant in time and the diffusion coefficient constant both in space and time. By using a time-explicit and central spatial numerical discretization scheme, with N spatial steps of variable size Δxexp, i and time steps of variable length , the system of Equations (6–8) was expressed in the form of Equation (1), with F a (4N + 4) × (4N + 4) array defined in Table 1 and border conditions ρi, 0 = ρi, 1, ρi, N − 1 = ρi, N, ui, 0 = ui, 1, ui, N − 1 = ui, N. While the TAC spatial sampling Δxexp, i is not interpolated, is generally smaller than the TAC time sampling . Therefore, was decomposed in a series of finer . The indices J and j refer to experimental and simulated time sampling, respectively.
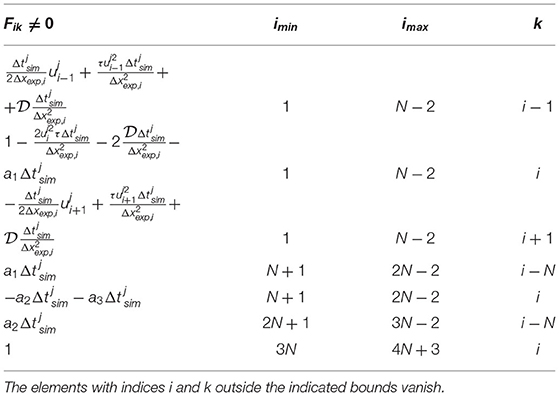
Table 1. The evolution matrix F.
The complete FD state was a (4N + 4)-dimensional array:
The TAC signal at the time J and at the ROI i was expressed as the sum of the transported, diffused and assimilated tracer fractions , with Hi, k = δi, k+δi+N, k+δi+2N, k.
The uncorrelated uncertainties related to the experimental measurement was modeled as the diagonal N×N matrix . The theoretical uncertainty of the estimation of the density affects the error of the estimated velocity, diffusion coefficient and exchange rates. Following this assumption, we approximated the time-dependent (4N+4) × (4N+4) process noise variance as Q = VTVT, where and V is the (4N+4) × (N+4)-dimensional Jacobian defined in Table 2.
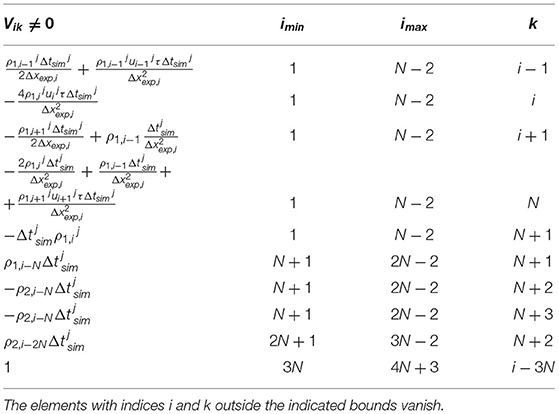
Table 2. The Jacobian matrix V.
The novel KC-DA procedure was based on the minimization of the time-dependent covariance of the physical system Pi,kJ, which was initialized as a diagonal matrix, with an initial guess of the theoretical errors of the state variables. The initial value of was defined from the corresponding measurement ρ0, while and vanished. The KC-DA procedure, as shown in Table 3, resulted in a predictor-corrector approach. A predictor step estimates the expected value of the TAC and a corrector step adapts the prediction to the measurement:
a. Predictor step The predicted values of the state variables and of the covariance matrix are calculated with Equations (1) and (2). is adjusted adaptively as , where α is the Courant parameter.
b. Corrector step If data are available at the time J+1, then X and P are updated as Wang et al. (2017):
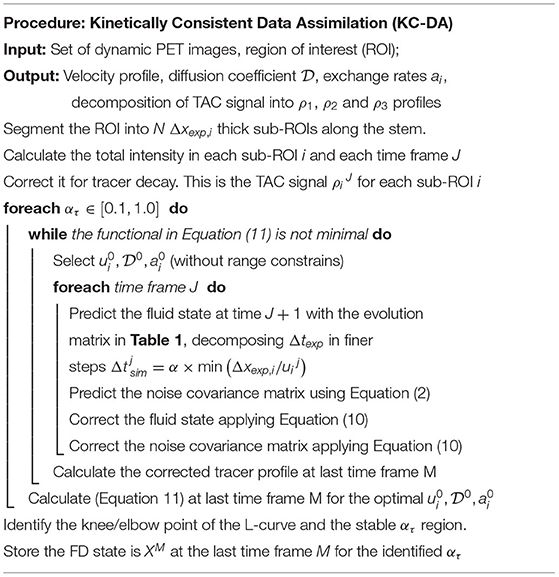
Table 3. A schematic description of the implementation of the KC-DA procedure.
The value of ui, and ai were obtained from the state vector Xj at the last time step M. Initial settings may cause a bias in the convergence of the filter. Therefore, an optimization discrepancy functional for has been added:
A sequential least squares programming minimization algorithm for Equation (11) in the KC-DA procedure was used.
2.2. Simulated Data
The validation of the KC-DA method was first performed by using simulated data. A realistic spatial profile of ρ1 extracted from an existing dataset was set as initial condition, with ρ2 and ρ3 initially vanishing. The parameters of the model variated within given ranges. The velocity profile was set constant in the range v0∈(0.05, 0.15). The other fluid dynamic parameters were set in the ranges D0∈(0.043, 0.093), a0∈(0.0031, 0.0081), a1∈(0.0026, 0.0076). The time evolution of the profile was simulated by using the predictor function in Equation (1) at equally spaced (15 min) time steps in the range (0, 340) min. The KC-DA algorithm was applied to estimate the fluid dynamic parameters from the simulated profiles and the difference between the estimated and the true parameters was measured.
2.3. Plant Experiments
The KC-DA algorithm was tested on PET TAC signals of sprouts of zucchini (Cucurbita pepo L., var. Genovese, Four Sementi, Piacenza, Italy). A group of 20 plants was selected, grown in the same controlled environment, 10 days after sowing. The roots of all plants were immersed in a 80 μCi solution of 2-[18F]-FDG diluted in 1 cc water and a 340 min long dynamic scan (RAYCAN E180;Liang et al., 2020) was performed with Δtexp = 15 min. The length of the stem, weight and final activity were on average 6 cm, 0.72 g and 2 μCi, respectively. A 35 mm long ROI with Δxexp = 0.5 mm was selected. α = 0.4 and an initial 5% estimate of the experimental, measurement and model errors were set. The rate a3 was assumed to vanish, as it refers to gaseous tracers transpiration (Mincke et al., 2020b).
3. Results
3.1. Numerical Verification of KC-DA
The estimation error of the model parameters is shown in Figure 2. The KC-DA algorithm applied to simulated data was able to retrieve the model parameters with a relative error on average lower than 5% (FWHM) and with an average relative bias of –0.1, –0.1, 0.2, and 2.3% for the velocity, viscosity coefficient and exchange rates a1 and a2, respectively.
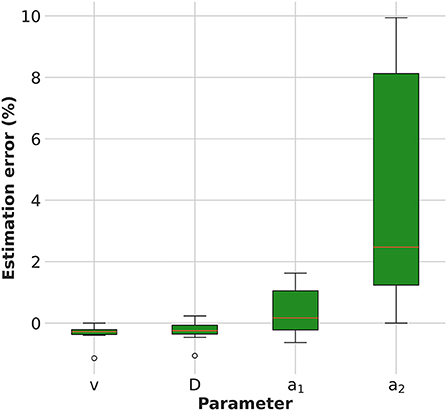
Figure 2. Numerical verification of the KC-DA algorithm: estimation error of the model parameters.
3.2. Convergence and Physical Significance of the KC-DA
The results of the plant experiments are further reported following and clarifying each logic step of the nested structure of the KC-DA procedure summarized in Table 3. The internal foreach-loop represents the sequential time-stepping data assimilation approach to parameter estimation. As shown in Figure 3A, after an initial increase, the L2 discrepancy between model prediction and data reaches a maximal value at t = 70 min and decreases further until t = 200 min, indicating an increasing match between the estimated parametric set up and the TAC signal. The action of the data-driven learning mechanism occurring in the internal foreach-loop is visible in Figure 3B, where the TAC signal at three equally spaced ROIs is shown. The model prediction matched the TAC signal with increasing precision after t = 70 min.
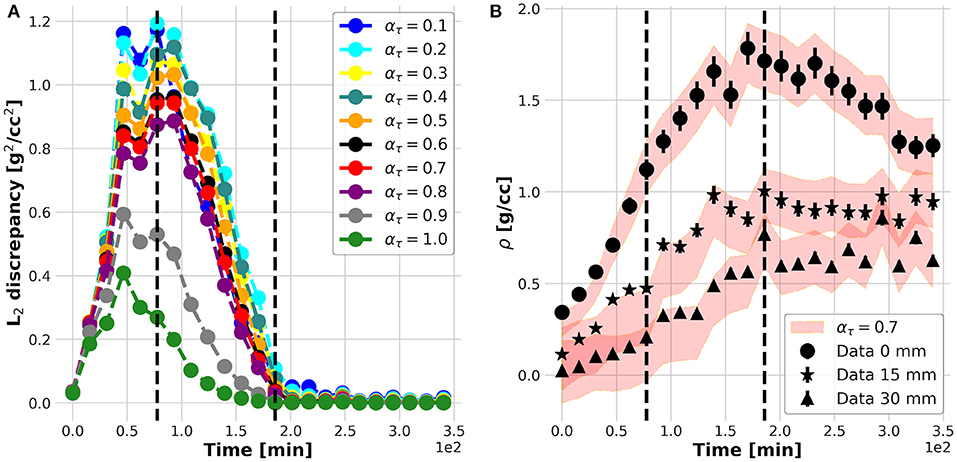
Figure 3. L2 discrepancy between model prediction (filled red band) and data (markers) for different ατ (A); measured (filled dots) and predicted (red bands) time profiles at three equally spaced positions along the plant stem (B).
The internal while-loop searches for the optimal parametric set up for the initialization of the KC-DA procedure. The 2-dimensional profiles of the discrepancy functional in Equation (11) verified that the algorithm converged to a well-identified minimum for the initial set of parameters (Figures 4A,B).
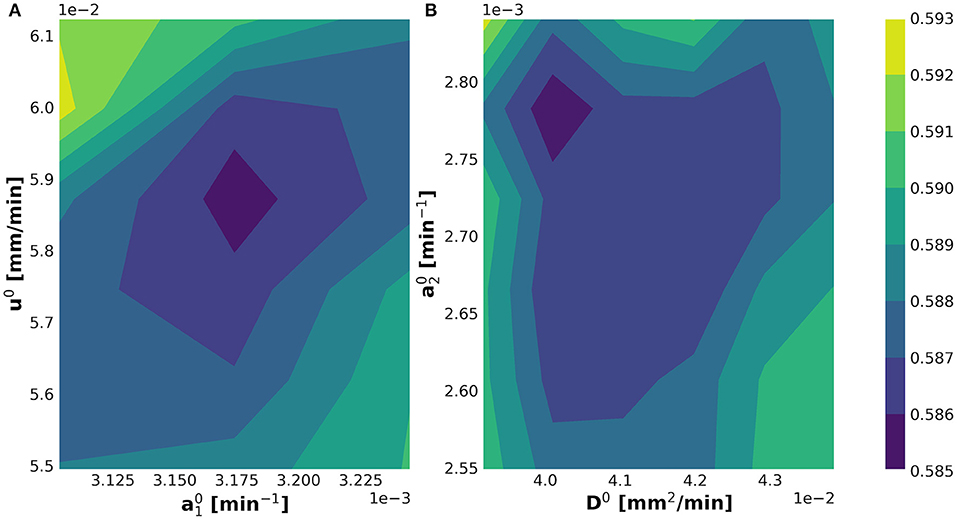
Figure 4. Determination of the minimum of the optimization discrepancy functional in Equation (11) shown in the (A) and (B) planes.
However, the convergence of the while-loop is guaranteed for any ατ. Therefore, the scope of the external foreach-loop of the KC-DA procedure is to identify the physically-significant choice of ατ. The L2 discrepancy between model prediction and data decreases on average with ατ (Figure 3A). This trend generated the typical L-shaped relationship between L2 discrepancy and estimated parameters (Figures 5A–C). A unique feature of the KC-DA procedure is the explicit calculation of the physical and numerical viscosity components, which accounts for the effect of the physical diffusion and of the spatial sparsity of the TAC signal, respectively. The dependence of these two components over ατ is particularly explicative of the physical mechanism of the external foreach-loop of the KC-DA procedure. As visible in Figure 5D, the progressive descent of the and a1 L-curves for ατ ≤ 0.5 (Figures 5A,B) corresponded to the decreasing strength of the physical dissipation. At approximately ατ = 0.7, all the L-curves stabilize after the knee/elbow point and the physical dissipation increased again reaching a maximal value. For ατ ≥ 0.7 the L-curves had a very slow decrease, but the physical dissipation diminished abruptly and became illogically comparable to the numerical dissipation. The L-curve for a2 followed an opposite trend with respect to a1 and , but confirmed the stability after the knee/elbow point (Figure 5C). The value of the predicted fluid parameters exhibited also a dependence on ατ, reaching a short plateau at ατ ≈ 0.6−0.7 (Figures 5E–H). This stable region after the knee/elbow point is the proper choice for ατ.

Figure 5. The L-shaped functional dependence between L2 discrepancy and estimated parameters at different ατ (A–C), impacts the strength of the physical and numerical dissipative components of the KC-DA procedure (D). The knee/elbow point of the L2 discrepancy at ατ = 0.7 (red dotted line) identifies the best estimation of the parameters, which corresponds to a plateau region (E–H).
The physical meaning of this external foreach-loop of the KC-DA procedure is better explained looking at the spatial profiles of ρ1, ρ2, ρ3, and ρ estimated at ατ = 0.1 (Figure 6A) and ατ = 0.7 (Figure 6B). Although in both cases the predicted ρ was found in excellent agreement with the data, at ατ = 0.1 the xylem transport component ρ1 was dominant, while at ατ = 0.7 the parenchyma diffusion ρ2 and the local assimilation ρ3 played a major contribution. As the FD state was predicted at t = 340 min, it was reasonable to expect that most of the transport flow already almost vanished and the fluid diffusion in the apoplastic spaces and subsequent local storage were the dominant processes, therefore supporting the findings at ατ = 0.7. The apoplastic velocity profile of the transported ρ1 in the two cases was almost equivalent (Figure 6C). It could be concluded that the region right after the knee/elbow point of the L-curve computed in the external foreach-loop identified the data assimilation model which learned and predicted the correct physical behavior of the plant dynamic flow.
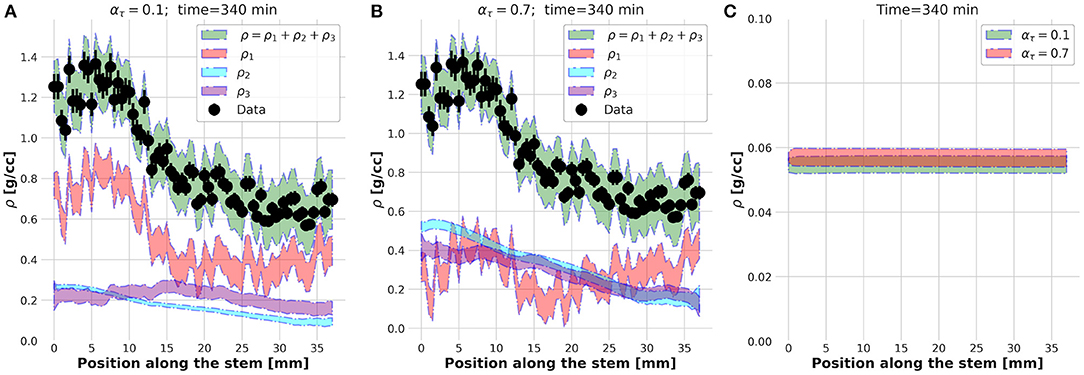
Figure 6. Estimated spatial profiles of the ρ1, ρ2, and ρ3 components of the tracer density ρ at time t = 340 s for ατ = 0.1 (A) and ατ = 0.7 (B). Velocity profile at t = 340 s (C).
The estimated parameters were mm2/min, a1 = (0.0031±0.0002)min−1, a2 = (0.0026±0.0001)min−1, and < u > (0.058±0.02)mm/min, where the errors include the variation (FWHM) across the entire dataset.
4. Discussion
The findings presented above approach the problem of a quantitative interpretation of the dynamic plant PET data from a physical and computational point of view. The key advance of KC-DA with respect to the state of the art is the possibility of the extraction of a continuous profile of the FD variables along the plant stem based on a realistic dynamic physical model, as shown in Figure 6. The relevance of novel mathematical modeling based on biophysical mechanisms has been recently emphasized (Tredenick and Farquhar, 2021) and models which describe the mechanistic properties of water movement in the different parts of plants became fundamental for the interpretation of measurements using nuclear science approaches, such as PET. Although these models are based on fluid dynamics and are extended with compartmental modeling for exchange rates between different functional compartments in plant tissues (Bühler et al., 2011; Mincke et al., 2021b), they are able to extract only an averaged quantities along small sections of the stem. Similarly, model-free techniques such as input-output approaches (Matsuhashi et al., 2010) can calculate only the mean speed of tracer transport and the proportion of tracer moved between specified image positions by means of transfer function analysis. For instance, it has been observed with these techniques that local variations of the average transport speed of water between 0.7 and 1.8 cm/min occurs at different parts of the stem of Sorghum (Keutgen et al., 2005). It is interesting to note that, from the difference of tracer arrival times at three equally spaced points along the stem of a soybean plant, it has been estimated that water transport occurs with an approximate constant speed of 4 mm/s in a total length of 30 mm (Ohya et al., 2008). These two apparently contradictory results are well representative of the need of a precise estimation of the continuous profiles along longer segments of the stem, as proposed in this paper (Figure 6), which will support agronomists in the estimation of such interesting and still unexplored quantitative feature of the plant, which are otherwise not directly accessible with other experimental techniques.
From a mathematical point of view, KC-DA approaches the problem of a reliable estimation of the correlation matrix between the parameters. While typical approaches include either a sensitivity analysis or a Monte Carlo based error estimation (Bühler et al., 2011; Mincke et al., 2021b), KC-DA has the distinctive feature of a direct computation of the correlation matrix P as in Equation (2), which takes also into account the numerical errors due to the discretization of the computational mesh used in the predictor and to the intrinsic voxel size of the measured PET data (Figure 5D). The results in Figure 2 show that the method exhibits a good numerical stability and precision.
A limit of KC-DA is that the convergence improves with time as shown in Figure 3A, and the initial frames of the tracer dynamic cannot be estimated with precision. This feature has a direct effect on the estimated parameters. While the viscosity coefficient and the exchange rates are found in an expected range (Bühler et al., 2011; Mincke et al., 2020b), the velocity profile appears almost constant and with an average value low in comparison with the above mentioned results. As observed in Figures 6A,B, this occurs as, while apoplastic flow dominates at the initial stages of the tracer immersion, at later times the diffusive flow is dominant. Such effect suggests that the dynamic model in Equation (8) could be extended by including a time-dependent velocity, allowing therefore to precisely capture the tracer dynamics at early stages. The next step of this study will be to demonstrate the validity of the KC-DA approach with more conservation equations and ligands used in plant science, toward an increasingly complex modeling of plant PET TAC signals.
5. Conclusions
A key feature of KC-DA is the ability of calculating the continuous profile of kinetic variables associated to the FD flow in plant transport. This makes KC-DA particularly suited to the quantification of plant vascular flow. KC-DA has an explicit computational implementation thanks to the analytical form of the evolution and noise correlation matrices. The direct calculation of the numerical dissipative terms plays a pivotal role in the stabilization of the time stepping procedure and helps the stability of the estimation of the transport parameters in the plant vascular system.
Data Availability Statement
The raw data supporting the conclusions of this article will be made available by the authors, without undue reservation.
Author Contributions
ND'A ideated the data-driven kinetically consistent approach and wrote the analysis code. ND'A and MP analyzed the data and wrote the manuscript. EA, MC, GP, and MP designed the possible experiments and applications to agronomy. ND'A, MP, and QX supervised the research focus and designed the scientific background. All authors contributed to the article and approved the submitted version.
Conflict of Interest
The authors declare that the research was conducted in the absence of any commercial or financial relationships that could be construed as a potential conflict of interest.
Publisher's Note
All claims expressed in this article are solely those of the authors and do not necessarily represent those of their affiliated organizations, or those of the publisher, the editors and the reviewers. Any product that may be evaluated in this article, or claim that may be made by its manufacturer, is not guaranteed or endorsed by the publisher.
Acknowledgments
We acknowledge the support of the Horizon 2020 Research and Innovation Staff Exchange (RISE) Call: H2020-MSCA-RISE-2020 (101008114).
References
Antonecchia, E., Bäcker, M., Cafolla, D., Ciardiello, M., Kühl, C., Pagnani, G., et al. (2022). Design study of a novel positron emission tomography system for plant imaging. Front. Plant Sci. 12, 736221. doi: 10.3389/fpls.2021.736221
Bühler, J., Huber, G., Schmid, F., and Blumler, P. (2011). Analytical model for long-distance tracer-transport in plants. J. Theor. Biol. 270, 70–79. doi: 10.1016/j.jtbi.2010.11.005
Chapman, S., and Cowling, T. G. (1990). The Mathematical Theory of Non-Uniform Gases. Cambridge: Cambridge University Press.
Chetverushkin, B.. (2015). Kinetic models for solving continuum mechanics problems on supercomputers. Math. Models Comput. Simul. 7, 531–539. doi: 10.1134/S2070048215060034
Chetverushkin, B., D'Ascenzo, N., Saveliev, A., and Saveliev, V. (2017). Novel kinetically consistent algorithm for magneto gas dynamics. Appl. Math. Lett. 75, 81. doi: 10.1016/j.aml.2017.04.015
Evensen, G.. (2009). The ensemble kalman filter for combined state and parameters estimation-monte carlo techniques for data assimilation in large systems. IEEE Control Syst. Mag. 29, 83–104. doi: 10.1109/MCS.2009.932223
Ferrieri, A. P., Appel, H., Ferrieri, R. A., and Schultz, J. C. (2012). Novel application of 2-[18f]fluoro-2-deoxy-d-glucose to study plant defenses. Nucl. Med. Biol. 39, 1152–1160. doi: 10.1016/j.nucmedbio.2012.06.005
Galieni, A., D'Ascenzo, N., Stagnari, F., Pagnani, G., Xie, Q., and Pisante, M. (2021). Past and future of plant stress detection: an overview from remote sensing to positron emission tomography. Front. Plant Sci. 11, 609155. doi: 10.3389/fpls.2020.609155
Hubeau, M., Mincke, J., Vanhove, C., Courtyn, J., Vandenberghe, S., and Steppe, K. (2019a). Plant-PET to investigate phloem vulnerability to drought in Populus tremula under changing climate regimes. Tree Physiol. 39, 211–221.
Hubeau, M., Minke, J., Vanhove, C., Courtyn, J., Vanderberghe, S., and Steppe, K. (2018). Plant-pet to investigate phloem vulnerability to drought in populus tremula under changing climate regimes. Tree Physiol. 39, 211–221. doi: 10.1093/treephys/tpy131
Hubeau, M., and Steppe, K. (2015). Plant-pet scans: In vivo mapping of xylem and phloem functioning. Cell Trends Plant Sci. 20, 676–685. doi: 10.1016/j.tplants.2015.07.008
Hubeau, M., Thorpe, M. R., Mincke, J., Bloemen, J., Bauweraerts, I., Minchin, P. E. H., et al. (2019b). High-resolution in vivo imaging of xylem-transported co2 in leaves based on real-time 11c-tracing. Front. For. Glob. Change 2, 25. doi: 10.3389/ffgc.2019.00025
Issa, R. I.. (1986). Solution of the implicitly discretized fluid flow equations by operator-splitting. J. Comput. Phys. 62, 40–65. doi: 10.1016/0021-9991(86)90099-9
Jensen, K., Mullendore, D., Holbrook, N., Bohr, T., Knoblauch, M., and Bruus, H. (2012). Modeling the hydrodynamics of phloem sieve plates. Front. Plant. Sci. 3, 151. doi: 10.3389/fpls.2012.00151
Kalman, R.. (1960). A new approach to linear filtering and prediction problems. J. Basic Eng. 82, 35–45. doi: 10.1115/1.3662552
Karve, A. A., Alexoff, D., Kim, D., Schueller, M. J., Ferrieri, R. A., and Babst, B. A. (2015). In vivo quantitative imaging of photoassimilate transport dynamics and allocation in large plants using a commercial positron emission tomography (pet) scanner. BMC Plant Biol. 15, 273. doi: 10.1186/s12870-015-0658-3
Kato, H., Yoshizawa, A., Ueno, G., and Obayashi, S. (2015). A data assimilation methodology for reconstructing turbulent flows around aircraft. J. Comput. Phys. 283, 559–581. doi: 10.1016/j.jcp.2014.12.013
Keutgen, A. J., Keutgen, N., Matsuhashi, S., Mizuniwa, C., Ito, T., Fujimura, T., et al. (2005). Input-output analysis of in vivo photoassimilate translocation using positron-emitting tracer imaging system (petis) data. J. Exp. Bot. 56, 1419–1425. doi: 10.1093/jxb/eri143
Keutgen, N., Matsuhashi, S., Mizuniwa, C., Ito, T., Fujimura, T., Ishioka, N., et al. (2002). Transfer function analysis of positron-emitting tracer imaging system (petis) data. Appl. Radiat. Isotopes 57, 225–233. doi: 10.1016/S0969-8043(02)00077-5
Kuritaa, K., Miyoshia, Y., Nagaoa, Y., Yamaguchia, M., Suzuia, N., Yina, Y., et al. (2020). Fruit pet: 3-d imaging of carbon distribution in fruit using openpet. Nuclear Instruments Methods Phys. Res. A 954, 161843. doi: 10.1016/j.nima.2019.01.069
Liang, X., Li, J., Antonecchia, E., Ling, Y., Li, Z., Xiao, W., et al. (2020). Nema-2008 and in-vivo animal and plant imaging performance of the large fov preclinical digital pet/ct system discoverist 180. IEEE Trans. Rad. Plasma Med. Sci. 4, 622–629. doi: 10.1109/TRPMS.2020.2983221
Matsuhashi, S., Fujimaki, S., Kawachi, N., Sakamoto, K., Ishioka, N. S., and Kume, T. (2010). Quantitative modeling of photoassimilate flow in an intact plant using the positron emitting tracer imaging system (petis). Soil Sci. Plant Nutr. 51, 417–423. doi: 10.1111/j.1747-0765.2005.tb00047.x
Meldi, M., and Poux, A. (2017). A reduced order model based on kalman filtering for sequential data assimilation of turbulent flows. J. Comput. Phys. 347, 207–234. doi: 10.1016/j.jcp.2017.06.042
Minchin, E. H., and Thorpe, R. (2003). Using the short-lived isotope 11c in mechanistic studies of photosynthate transport. Func. Plant Biolog. 30, 831–841. doi: 10.1071/FP03008
Mincke, J., Courtyn, J., Vanhove, C., Vandenberghe, S., and Steppe, K. (2020a). Studying in vivo dynamics of xylem-transported 11co2. using positron emission tomography. Tree Physiol. 40, 1058–1070. doi: 10.1093/treephys/tpaa048
Mincke, J., Courtyn, J., Vanhove, C., Vandenberghe, S., and Steppe, K. (2020b). Studying in vivo dynamics of xylem-transported 11co2. using positron emission tomography. Tree Physiol. 40, 1058–1070.
Mincke, J., Courtyn, J., Vanhove, C., Vandenberghe, S., and Steppe, K. (2021a). Guide to plant-pet imaging using 11co2. Front. Plants Sci. 12, 602550. doi: 10.3389/fpls.2021.602550
Mincke, J., Courtyn, J., Vanhove, C., Vandenberghe, S., and Steppe, K. (2021b). Guide to plant-pet imaging using 11co2.. Front. Plant Sci. 12, 997.
Moses, W.. (2011). Fundamental limits of spatial resolution in pet. Nucl. Instrum. Meth. Phys. Res. A 648, S236-S240. doi: 10.1016/j.nima.2010.11.092
Ohya, T., Tanoi, K., Hamada, Y., Okabe, H., Rai, H., Hojo, J., et al. (2008). An analysis of long-distance water transport in the soybean stem using H215O. Plant Cell Physiol. 49, 718–29. doi: 10.1093/pcp/pcn047
Partelová, D., Kuglerová, K., Konotop, Y., Horník, M., Lesný, J., Gubišová, M., et al. (2017). Imaging of photoassimilates transport in plant tissues by positron emission tomography. Nova Biotechnol. Chim. 16, 32–41. doi: 10.1515/nbec-2017-0005
Qu, F., Sun, D., Bai, J., and Yan, C. (2019). A genuinely two-dimensional riemann solver for compressible flows in curvilinear coordinates. J. Comput. Phys. 386, 47–63. doi: 10.1016/j.jcp.2019.02.030
Suzuki, T.. (2012). Reduced-order kalman-filtered hybrid simulation combining particle tracking velocimetry and direct numerical simulation. J. Fluid Mech. 709, 249–288. doi: 10.1017/jfm.2012.334
Suzuki, T., Ji, H., and Yamamoto, F. (2010). Instability waves in a low-reynolds-number planar jet investigated with hybrid simulation combining particle tracking velocimetry and direct numerical simulation. J. Fluid Mech. 655, 344–379. doi: 10.1017/S0022112010000893
Suzuki, T., and Yamamoto, F. (2015). Hierarchy of hybrid unsteady-flow simulations integrating time-resolved PTV with DNS and their data-assimilation capabilities. Fluid Dyn. Res. 47, 051407. doi: 10.1088/0169-5983/47/5/051407
Tredenick, E., and Farquhar, G. (2021). Dynamics of moisture diffusion and adsorption in plant cuticles including the role of cellulose. Nat. Commun. 12, 5042. doi: 10.1038/s41467-021-25225-y
Tsukamoto, T., Nakanishi, H., Uchida, H., Watanabe, S., Matsuhashi, S., Mori, S., et al. (2008). 52Fe TRANSLOC|Ation in barley as monitored by a positron-emitting tracer imaging system (PETIS): evidence for the direct translocation of fe from roots to young leaves via phloem. Plant Cell Physiol. 50, 48–57. doi: 10.1093/pcp/pcn192
Wang, Y., Fang, H., Zhou, L., and Wada, T. (2017). Revisiting the state-of-charge estimation for lithium-ion batteries: a methodical investigation of the extended kalman filter approach. IEEE Control Syst. Mag. 37, 73–96. doi: 10.1109/MCS.2017.2696761
Yamazaki, H., Suzui, N., Yin, Y.-G., Kawachi, N., Ishii, S., Shimada, H., et al. (2015). Live-imaging evaluation of the efficacy of elevated CO2 concentration in a closed cultivation system for the improvement of bioproduction in tomato fruits. Plant Biotechnol. 32, 31–37. doi: 10.5511/plantbiotechnology.14.1210a
Keywords: data-driven digital signal processing for plant imaging, data assimilation algorithms, kinetic modeling, dynamic plant positron emission tomography, functional plant imaging, portable imaging device, plant physiology
Citation: D'Ascenzo N, Xie Q, Antonecchia E, Ciardiello M, Pagnani G and Pisante M (2022) Kinetically Consistent Data Assimilation for Plant PET Sparse Time Activity Curve Signals. Front. Plant Sci. 13:882382. doi: 10.3389/fpls.2022.882382
Received: 04 March 2022; Accepted: 10 June 2022;
Published: 22 July 2022.
Edited by:
Jiachen Yang, Tianjin University, ChinaReviewed by:
Miroslava Rakocevic, State University of the North Fluminense Darcy Ribeiro, BrazilLiangju Wang, China Agricultural University, China
Copyright © 2022 D'Ascenzo, Xie, Antonecchia, Ciardiello, Pagnani and Pisante. This is an open-access article distributed under the terms of the Creative Commons Attribution License (CC BY). The use, distribution or reproduction in other forums is permitted, provided the original author(s) and the copyright owner(s) are credited and that the original publication in this journal is cited, in accordance with accepted academic practice. No use, distribution or reproduction is permitted which does not comply with these terms.
*Correspondence: Nicola D'Ascenzo, bmRhc2NAaHVzdC5lZHUuY24=; Qingguo Xie, cWd4aWVAdXN0Yy5lZHUuY24=