 Hafiz Muhammad Rizwan1†‡
 Fang Shaozhong2‡
 Xiaoting Li1Muhammad Bilal Arshad3
 Ahmed Fathy Yousef1,4Yang Chenglong2Meng Shi1Mohammed Y. M. Jaber5
 Muhammad Anwar6Shuai-Ya Hu7Qiang Yang1Kaiwei Sun1Mohamed A. A. Ahmed8Zheng Min9Ralf Oelmüller1,10Lin Zhimin2*Faxing Chen1*
- 1College of Horticulture, Fujian Agriculture and Forestry University, Fuzhou, China
- 2Institute of Biotechnology, Fujian Academy of Agricultural Sciences, Fuzhou, China
- 3Department of Plant Breeding and Genetics, College of Agriculture, University of Sargodha, Sargodha, Pakistan
- 4Department of Horticulture, College of Agriculture, University of Al-Azhar, Assiut, Egypt
- 5Department of Plant Production and Protection, Faculty of Agriculture and Veterinary Medicine, An-Najah National University, Nablus, Palestine
- 6Guangdong Technology Research Center for Marine Algal Bioengineering, Guangdong Key Laboratory of Plant Epigenetics, College of Life Sciences and Oceanography, Shenzhen University, Shenzhen, China
- 7College of Horticulture, Academy for Advanced Interdisciplinary Studies, Nanjing Agriculture University, Nanjing, China
- 8Plant Production Department (Horticulture-Medicinal and Aromatic Plants), Faculty of Agriculture (Saba Basha), Alexandria University, Alexandria, Egypt
- 9Department of Horticulture, Fujian Agricultural Vocational College, Fuzhou, China
- 10Matthias Schleiden Institute, Plant Physiology, Friedrich-Schiller-University Jena, Jena, Germany
Plant and fruit surfaces are covered with cuticle wax and provide a protective barrier against biotic and abiotic stresses. Cuticle wax consists of very-long-chain fatty acids (VLCFAs) and their derivatives. β-Ketoacyl-CoA synthase (KCS) is a key enzyme in the synthesis of VLCFAs and provides a precursor for the synthesis of cuticle wax, but the KCS gene family was yet to be reported in the passion fruit (Passiflora edulis). In this study, thirty-two KCS genes were identified in the passion fruit genome and phylogenetically grouped as KCS1-like, FAE1-like, FDH-like, and CER6-like. Furthermore, thirty-one PeKCS genes were positioned on seven chromosomes, while one PeKCS was localized to the unassembled genomic scaffold. The cis-element analysis provides insight into the possible role of PeKCS genes in phytohormones and stress responses. Syntenic analysis revealed that gene duplication played a crucial role in the expansion of the PeKCS gene family and underwent a strong purifying selection. All PeKCS proteins shared similar 3D structures, and a protein–protein interaction network was predicted with known Arabidopsis proteins. There were twenty putative ped-miRNAs which were also predicted that belong to nine families targeting thirteen PeKCS genes. Gene ontology (GO) and Kyoto Encyclopedia of Genes and Genomes (KEGG) annotation results were highly associated with fatty acid synthase and elongase activity, lipid metabolism, stress responses, and plant-pathogen interaction. The highly enriched transcription factors (TFs) including ERF, MYB, Dof, C2H2, TCP, LBD, NAC, and bHLH were predicted in PeKCS genes. qRT-PCR expression analysis revealed that most PeKCS genes were highly upregulated in leaves including PeKCS2, PeKCS4, PeKCS8, PeKCS13, and PeKCS9 but not in stem and roots tissues under drought stress conditions compared with controls. Notably, most PeKCS genes were upregulated at 9th dpi under Fusarium kyushuense biotic stress condition compared to controls. This study provides a basis for further understanding the functions of KCS genes, improving wax and VLCFA biosynthesis, and improvement of passion fruit resistance.
Introduction
Plant growth and development are significantly affected by a variety of biotic and abiotic stresses including drought, salinity, high or low temperature, fungal, bacterial, and viral pathogens. These stress conditions directly affect the crop yield and cause huge economic losses (Raza et al., 2021; Sharif et al., 2021). To adapt and resist these stress conditions, most plants are covered with a hydrophobic protective layer commonly known as cuticle wax and is the first barrier between the environment and plants (Trivedi et al., 2019). Plant cuticle plays an important role in controlling non-stomatal water loss, regulating transpiration, and prevent from mechanical damages caused by fungal, bacterial, insects, ultraviolet (UV) light, and other environmental biotic and abiotic stresses (Lewandowska et al., 2020; Arya et al., 2021; Raza et al., 2022). The structure and composition of cuticle waxes vary between different tissues and between different plants. Different factors affect the biosynthesis and composition of cuticle wax including water, light, temperature, and genotype (Xue et al., 2017). The biosynthesis and transport pathways of cuticle wax are complicated and required the participation of different organelles and enzymes to complete (Fernández et al., 2016; Skalicky et al., 2021). Cuticle waxes are composed of very-long-chain fatty acids (VLCFAs) and their derivatives, such as alkanes, ketones, primary and secondary alcohols, aldehydes, esters, and triterpenes (Zhang et al., 2020). VLCFAs are long-chain fatty acids between C16 and C34 carbons and are the major constituents of sphingolipids, phospholipids, glycerophospholipids, sterol esters, triacylglycerols, and wax esters (Beaudoin et al., 2009). In Arabidopsis, sphingolipids containing VLCFAs describe as a secretory pathway for polar plasma membrane protein (Markham et al., 2011).
Biosynthesis of VLCFAs is accomplished in two pathways, including prokaryotic and eukaryotic pathways, involving the de novo synthesis of C16 and C18 fatty acids in plastids by fatty acid synthase (FAS) complex (prokaryotic pathway) and elongation of fatty acids from C16 andC18 chains to C26-C34 chains (eukaryotic pathway) via fatty acid elongase (FAE) complex in the endoplasmic reticulum (ER) (Bach and Faure, 2010; Xue et al., 2017). Elongation of fatty acids consists of four consecutive reactions in ER including condensation, reduction, dehydration, and secondary reduction and catalyzed by four major enzymes such as β-ketoacyl-CoA synthetase (KCS), trans-2,3-enoyl CoA reductase (ECR), 3-hydroxacyl-CoA dehydratase (HCD) and 3-ketoacyl-CoA reductase (KCR) (De Bigault Du Granrut and Cacas, 2016; Kogure et al., 2022). Each of these enzymes utilizes the product of the previous enzyme as a substrate in a cycle starting from the condensation of malonyl-CoA to long-chain acyl-CoA (De Bigault Du Granrut and Cacas, 2016).
β-Ketoacyl-CoA synthase is the key enzyme with distinct substrate specificity that catalyzes the fatty acid elongation and is involved in the synthesis of waxy component precursors during VLCFAs biosynthesis (Wang X. et al., 2017; Yang H. et al., 2021). The first member of KCS was identified and functionally characterized in Arabidopsis by James et al. (1995), who found KCS contributions in the production and storage of VLFACs in developing seeds and finally named as FAE1/KCS18. Later on, 21 members of the KCS gene family were identified and divided into four subfamilies including KCS1-like, FDH-like, FAEl-like, and CER6 according to the homology of amino acid sequences (Joubès et al., 2008). The KCS proteins have two conserved domains including FAE1/Type III polyketide synthase-like protein domain (FAE1_CUT1_RppA) and 3-Oxoacyl-[acyl-carrier-protein (ACP)] synthase III C-terminal domain (ACP_syn_III_C) (Dai et al., 2021).
Several studies have been reported on the functional characterization of KCS genes in plants. It has been reported that five KCS genes including KCS1, KCS2, CUT1-CER6/KCS6, KCS9, and KCS20 mainly involved in VLCFAs biosynthesis, precursors of cuticular wax and suberin (Lee and Suh, 2013). Beaudoin et al. (2009) reported the involvement of KCS1 in VLCFAs synthesis, seed triacylglycerols (TAGs), root glycerolipids, and sphingolipids. Todd et al. (1999) reported the involvement of KCS1 synthase in decarbonylation and acyl-reduction wax synthesis pathways. Overexpression of KCS2 and KCS20 increased the wax content in Arabidopsis (Lee et al., 2009). KCS9 was found to be related to tetracosanoic acid as a precursor of epidermal waxes, suberin, sphingolipids, and phospholipids (Kim et al., 2013). KCS16 was found to be involved in wax biosynthesis and leaf trichomes in Arabidopsis (Hegebarth et al., 2017). Yang H. et al. (2021) also reported the involvement of CsKCS2 and CsKCS11 in fruit cuticular wax biosynthesis, at the ripening stage in Citrinae species. KCS also involved in the cuticular wax synthesis of leaf rice (Oryza sativa) (Wang X. et al., 2017). In sunflower (Helianthus annuus), HaKCS1 and HaKCS2 were expressed in seeds and involved in the elongation of fatty acids from C18 to C20–C24 respectively (González-Mellado et al., 2019). Recently Wang et al. (2022) also reported the involvement of CsKCS20 in VLCFAs elongation and cuticular wax biosynthesis.
Previous studies also reported the role of KCS in environmental stress responses including salt, drought, and biotic stresses. In Arabidopsis, AtKCS2 and AtKCS20 mutants showed higher expression patterns under osmotic stress conditions (Lee et al., 2009). Serra et al. (2009) found that silencing of StKCS6 in potato (Solanum tuberosum) reduced the suberine chain length. Ectopic overexpression of apple (Malus domestica) MdKCS2 increased the wax contents and resistance to drought conditions in Arabidopsis plants (Lian et al., 2021). Yang Z. et al. (2020) reported that ectopic overexpression of grape (Vitis vinifera) VvKCS in Arabidopsis enhanced the tolerance to salt stress at germination and seedling stages. Overexpression of AhKCS1 in groundnut (Arachis hypogaea) (Lokesh et al., 2019) increased the cuticular waxes and reduced membrane damage under drought stress conditions. Overexpression of BnKCS1-1/BnKCS1-2 in rapeseed (Brassica napus) exhibited increased wax concentration and tolerance to drought under drought conditions (Wang Y. et al., 2020). However, Todd et al. (1999) reported that AtKCS1 mutants were less resistant to low humidity conditions at the young stage. Ectopic overexpression of navel orange (Citrus sinensis) CsKCS6 in Arabidopsis plants increased the tolerance to drought and salt stress conditions (Guo et al., 2020). Weidenbach et al. (2015) found that the growth rate of barley (Hordeum vulgare) HvKCS6 mutants was improved underwater limitation conditions. Overexpression of HvKCS1 in barley improved the leaf waxes and resistance to barley powdery mildew fungus (Li et al., 2018). In cotton (Gossypium hirsutum), GhKCS13 mutants regulated the cold response by modulating the lipids and oxylipin biosynthesis (Wang Q. et al., 2020).
Transcription factors (TFs) are sequence-specific DNA binding proteins that help recruit the transcriptional machinery to gene promoters, that play an important role in the regulatory network of plant growth and development under normal and stress conditions (Samad et al., 2017). Different TFs have been reported to be involved in the regulation of VLCFAs and wax biosynthesis, including basic leucine zipper (bZIP), myeloblastosis (MYB), wax inducer (WIN), apetala2/ethylene response factor (AP2/ERF), NAC [no apical meristem (NAM), Arabidopsis transcription activation factor (ATAF1/2), and cup-shaped cotyledon (CUC2)], and PUCHI (Ois Roudier et al., 2010; Oshima et al., 2013; Trinh et al., 2019; Guyomarc’h et al., 2021; Han et al., 2022). In addition, the miRNAs (micro-RNAs) are non-coding single-stranded RNAs (approximately 21–30 nucleotides) and play an important role in numerous cellular mechanisms as well as in stress resistance through translational inhibition and/or cleavage of target mRNAs during or after transcription (Zhang et al., 2006; Ohtani, 2017). It has been reported that miRNAs were found to be involved in cuticular wax biosynthesis in Arabidopsis such as trans-acting small interfering RNA (tasiRNA) was involved in CER3 silencing during stem wax production (Lam et al., 2015). Wang Z. et al. (2017) and Su et al. (2021b) conducted a genome-scale study in Brassica napus and discovered several miRNAs targeting the fatty acid and lipid metabolism enzymes that could regulate the fatty acid synthesis, lipid transport, and metabolism. Later on, Liu et al. (2019) proposed that the bna-miR165a-5p (Brassica napus miRNA) might be involved in the wax biosynthesis process by regulating the putative target BnaA06g40560D gene. Recently, Paul et al. (2020) also identified several miRNAs in passion fruit (Passiflora edulis) and predicted their involvement in different molecular and biological process, however, the specific mechanism of all the miRNAs are not clear in passion fruit and need further studies. Genes can be further classified according to their function using Gene Ontology (GO) terms such as biological processes (GO-BP), cellular component (GO-CC), and molecular function (GO-MF). The functional classification of genes can be achieved in species using advanced GO terms (Ashburner et al., 2000; Roncaglia et al., 2013). To understand the biological functions of the gene at the genome level, the Kyoto Encyclopedia of Genes and Genomes (KEGG) is a bioinformatics resource that provides functional information in network pathways (Kanehisa and Goto, 2000; Masoudi-Nejad et al., 2007).
Genome-wide identification of gene families facilitates the study of gene functions by providing a foundation for further functional analysis. Due to the availability of large-scale plant genome sequencing and widespread use of bioinformatics techniques, the KCS gene family has been identified in different plant species with diverse members including 21 KCS genes identified in Arabidopsis (Arabidopsis thaliana) (Joubès et al., 2008); 28 in maize (Zea mays) (Campbell et al., 2019); 30 in peanut (Arachis hypogea) (Huai et al., 2020); 58 in rapeseed (Brassica napus) (Xue et al., 2020); eight in grape (Vitis vinifera) (Guo et al., 2016); 58 in cotton (Gossypium hirsutum), 31 in G. arboreum and 33 in G. raimondii (Xiao et al., 2016); 33 in barley (Hordeum vulgare) (Tong et al., 2021); 96 KCS genes were identified in six Citrinae species including13 in Atalantia buxifolia, 16 in Citrus ichangensis, 21 in C. medica, 14 in C. grandis, 16 in C. sinensis and 16 in C. clementina (Yang H. et al., 2021) respectively. Whereas, the KCS gene family has not been identified in passion fruit (Passiflora edulis). Passion fruit is a perennial evergreen climbing vine and is usually cultivated throughout tropical and subtropical areas of the world. Passion fruit is an economically important fruit plant that is demanded its fresh juice, rich in aroma and distinctive nutritional values (Rizwan et al., 2021). Recently, the passion fruit genome has been sequenced and published (Ma et al., 2021), a comprehensive genome-wide study for the first time to determine the KCS gene family in passion fruit was conducted. Moreover, their in silico prediction of TFs, subcellular localization, evolutionary relationship via phylogenic and syntenic analysis, conserved motifs, gene structures, cis-regulatory-elements, prediction of putative miRNA, GO and KEGG annotation have been characterized. The gene expression profiles of several KCS genes in different passion fruit tissues under drought stress and Fusarium kyushuense fungal stress conditions were analyzed to gain insight into passion fruit KCS genes. Our findings will facilitate further functional analysis of KCS genes in terms of wax and VLCFA biosynthesis to facilitate genetic improvement of passion fruit against biotic and abiotic stresses.
Materials and Methods
Identification of β-Ketoacyl-CoA Synthase Genes in Passion Fruit
To identify and characterize the KCS genes in the passion fruit (Passiflora edulis) genome, passion fruit proteins, CDS, gff3, genome files were downloaded from the passion fruit genome1 (Ma et al., 2021). We performed two methods, which are Basic Local Alignment Search Tool for proteinsT (BLASTp) and Hidden Markov Models (HMMER) search tool, to identify the KCS genes in the passion fruit genome. All known KCS family protein sequences of Arabidopsis thaliana (AtKCS) (Joubès et al., 2008) were downloaded from The Arabidopsis Information Resource (TAIR) database2, M. domestica (Apple) MdKCS (Lian et al., 2020) from apple genome3, and A. hypogaea (Peanut) AhKCS (Huai et al., 2020) from peanut genome4. The BLASTp was performed in the passion fruit genome based on protein homology alignments with default mode using the known KCS protein sequences via the TBTools software package version 1.0986858 (Chen C. et al., 2018). The KCS domains were downloaded from the Pfam database5 [PF08392 (FAE1/Type III polyketide synthase-like protein) and PF08541 (3-Oxoacyl-[acyl-carrier protein (ACP)] synthase III C terminal)]. hese domains were used for HMMER in passion fruit genome via TBTools with default mode. The results of the two methods were merged and further analyzed by Web CD-Search Tool6 and SMART7 to confirm the domains in passion fruit KCS protein.
Physiochemical Properties, Alignment, and Phylogenetic Analyses of PeKCS Genes
The PeKCS genes’ physical and chemical properties include molecular weight (M.W), amino acid (A.A) length, coding sequence (CDS) length, isoelectric point (pl), instability index (II), aliphatic index (Ai), number of an exon, and intron (E/I) were evaluated by using the ExPASY-Prot8. The online CELLO version 0.2.59 program was used to predict the subcellular localization of PeKCS genes. The phylogenetic analyses were performed by aligning the full-length KCS protein sequences of P. edulis (PeKCS), A. thaliana (AtKCS), M. domestica (MdKCS), and A. hypogaea (AhKCS) by Molecular Evolutionary Genetics Analyses (MEGA) software version 10.1.810. The aligned sequences were subjected to neighbor-joining (NJ) tree construction using the MEGA software with 1,000 bootstrap replicates and all other parameters were set to default. The online web tool iTOL11 was used to visualize the phylogenetic tree and divided it into four main groups and eight subgroups according to AtKCS (Joubès et al., 2008). The PeKCS genes distribution and mapping on all 9 assembled and 1 unassembled scaffold passion fruit chromosomes were investigated by using the passion fruit genomic and annotation files via Tbtools software (Chen C. et al., 2018). Moreover, the online Sequence Identity and Similarity (SIAS)12 tool was used to perform a pairwise sequences identity between passion fruit KCS genes.
PeKCS Gene Structures and Motifs Analyses
The PeKCS genes structural organizations and chromosome locations were retrieved from passion fruit genomic files. The conserved motifs of PeKCS protein sequences were predicted by using the Multiple Expectation Maximization for Motif Elicitation (MEME) online tools13 and the numbers of motifs were set to 10 motifs. The PeKCS gene structures and conserved motifs from the passion fruit were visualized by TBTools software.
Cis-Regulatory Element Analysis of PeKCS Genes
To predict the putative cis-regulatory elements in promoter regions of PeKCS genes, the upstream 2,000 bp sequences of all the PeKCS genes were extracted from the genomic DNA sequences. Moreover, the promoter sequence of each gene was subjected to the PlantCARE database14 and the cis-regulatory elements figure was drawn by using TBTools software (Chen C. et al., 2018). Additionally, the numbers, functions, and sequences of putative cis-regulatory elements of PeKCS genes were summarized and highlighted into plant growth and development, phytohormones responses, and stress-responsive categories.
Synteny Analysis and Ka/Ks Values Calculation for PeKCS Genes
The tandem and segmental or whole-genome duplication (WGD) duplication provides a new understanding of family genes development and genome progression. The homologous PeKCS genes with only one intervening gene on the same passion fruit chromosome were considered to be tandem duplicated, while homologs on other chromosomes were considered to be segmental duplications. PeKCS duplicated genes were identified and visualized on their physical location on the chromosomes in the passion fruit genome. Gene duplication, synteny analysis, and Ka (non-synonymous)/Ks (synonymous) values calculation of PeKCS genes were performed in TBTools. The syntenic relationships of KCS genes between P. edulis, A. thaliana, and M. domestica were performed using the MCScanX toolkit, and KCS relationships between the target species were visualized by the Advance Circos package in the TBTools software (Chen C. et al., 2018). Furthermore, the multiple collinearity analysis of KCS genes in P. edulis, A. thaliana, M. domestica, and A. hypogaea whole genomes were also performed by Multiple synteny Plot packages in TBTools software. The Ka), Ks nucleotide substitution rates, and the Ka/Ks ratios of duplicated PeKCS genes were annotated using TBTools and divergence time (T, MYA; million years ago) was calculated by the following formula; T = Ks/2x (x = 6.38 × 10⁻⁹) (Ma et al., 2021).
Protein–Protein Network Interaction, Secondary Structure, and 3D Modeling of PeKCS
The online tool STRING version 1115 was used to predict and construct the protein–protein interaction network of PeKCS proteins based on Arabidopsis homologous proteins. The STRING tool parameters were set as follows; network type-full STRING network; the meaning of network edges-evidence; the minimum required interaction score was set to medium confidence parameter (0.4) and max number of interaction display was no more than 10. The PeKCS proteins’ secondary structures were predicted by SOPMA SECONDARY STRUCTURE PREDICTION METHOD16. Three-dimensional modeling (3D) of PeKCS protein was performed using the Phyre2 online tool17 with default settings.
Prediction of Putative Micro-RNAs Targeting PeKCS Genes, Gene Ontology and Kyoto Encyclopedia of Genes and Genomes Annotation Analysis
To predict putative miRNA target sites in the PeKCS genes, at first, the mature sequences of passion fruit miRNAs were downloaded from published data (Paul et al., 2020). Moreover, the PeKCS CDS sequences were submitted to the online psRNATarget Server18 with default parameters for prediction of potential miRNAs in PeKCS genes. The interaction network between the predicted miRNAs and PeKCS target genes was constructed and visualized by Cytoscape software version 3.919 (Kohl et al., 2011). Furthermore, the GO and KEGG annotation analyses were performed by submitting PeKCS protein sequences to the online database eggNOG20 and their enrichment analysis were performed in TBTools software (Chen C. et al., 2018).
Transcription Factor Regulatory Network Analysis
The TFs’ prediction and regulatory network analysis were performed according to Zheng et al. (2020) with slight modifications. The 1000 bp nucleotide sequences from upstream regions of PeKCS genes were extracted and were submitted to the Plant Transcriptional Regulatory Map (PTRM)21 with p-value ≤ 1e–6 (Tian et al., 2020) for the prediction of TFs. Cytoscape version 3.9 software (Kohl et al., 2011) was used to construct and visualized the TF regulatory network.
Expression Analyses of PeKCS Genes in Various Tissues
The passion fruit RNA-Seq raw reads were downloaded from National Center for Biotechnology Information (NCBI) Sequence Read Archive (SRA) database22 with the following accession numbers (SRP150688) and (PRJNA634206). The peel samples were from yellow (P. edulis. Flavicarpa cv Huangjin) and purple (P. edulis. Sims cv Tainong) passion fruit cultivars at the ripening stage, while pulp samples were from both cultivars at different fruit developmental stages. The root samples were from purple passion fruit Pingtan-1 cold-tolerant cultivar under two cultivation areas as limestone (L) and sandy dolomite (D) rocky desertification areas. The leave samples were from yellow Huangjinguo (HJG) cold-sensitive and purple Tainong-1 cold-tolerant cultivars under normal temperature (NT) and chilling stress (CS) conditions. The RNA-Seq raw reads were quality controlled and filtered by fastp package (Chen S. et al., 2018) and mapped to the passion fruit reference genome (Ma et al., 2021) with HISAT2 package (Kim and Langmead, 2015) in Ubuntu wsl v 20.04.323. The sequence alignment map (SAM) files were transformed to binary alignment map (BAM) and sorted with Samtools packages (Li et al., 2009). Fragments per kilobase million (FPKM) values were calculated using the limma and edgeR (Law et al., 2016). Due to large differences in FPKM values among different tissues of passion fruit, the FPKM values were transformed to log2. Heatmaps were constructed using TB-Tools software (Chen C. et al., 2018) to visualize the expression profiles of PeKCS genes in different tissues.
Plant Material Under Drought and Fungal Stress Conditions
The KCS genes play an important role in VLCFA biosynthesis and plant resistance to biotic and abiotic stresses. The PeKCS genes expression profiles were studied by applying the drought stress (abiotic) and Fusarium kyushuense fungal pathogen (biotic) stressed conditions compared to controls of yellow and purple passion fruit cultivars. To prepare drought-stressed and normal condition samples for PeKCS genes expression analysis, seeds of two commercial passion fruit cultivars yellow (P. edulis. Flavicarpa cv Huangjin) and purple (P. edulis. Sims cv Tainong) were planted in plastic pots filled with peat moss and soil (2:1 ratio). Greenhouse conditions were set as follows; temperature 25 ± 2°C, photoperiod (16-h), and 75% relative humidity. One-month-old passion fruit plants were subjected to dehydration for 10 days and rewatered to study the qRT-PCR (Quantitative real-time polymerase chain reaction) expression profile of PeKCS selected genes under drought conditions. Leaves, root, and stem samples of both cultivars with three biological replicates were collected and quickly frozen in liquid nitrogen and were stored at −80°C for further uses. The samples from normally watered plants were taken as controls. In order to prepare the fungal stress samples, fruits of both passion fruit cultivars were collected from a commercial orchard located in Fujian province, China (23°48035.200 N and 117°07008.100 E). Fruits were surface sterilized and infected with the F. kyushuense pathogenic fungus following the protocol mentioned in our previous publication (Rizwan et al., 2021). Peels from infected areas were collected after the 9th and 12th days post-inoculation (dpi), while uninfected fruit at 9th and 12th days were used controls.
RNA Extraction and Quantitative Real-Time Polymerase Chain Reaction Analysis
RNA was extracted from frozen samples using the Tiangen mini-RNA extraction kit (Tiangen, China) according to the manufacturer’s instructions, and RNA was quantified with a Thermo Scientific NanoDrop 2000 UV-Vis Spectrophotometer (Thermo Scientific, United States). One μg of total RNA was used to synthesize the complementary DNA (cDNA) by Takara PrimeScript™ RT Kit with gDNA eraser (TAKARA, China) and cDNAs were diluted to 5x with deionized distilled water. qRT-PCR was performed on a LightCycler® 96 (Roche Applied Science, Penzberg, Germany) in 20 μL reaction mix consisting of 10 μL TB Green master mix solution (TAKARA), 1 μL of each forward and reverse primer (100 μM), 1 μL of cDNA and 7 μL of ddH2O. Using Pe60s (Munhoz et al., 2015), As an internal reference gene, the qRT-PCR reactions were performed with the conditions as; preincubation at 95°C for 30 s, followed by 45 cycles at 95°C for 10 s, and 60°C for 30 s. Three biological replicates were used for each reaction and the relative gene expression levels were calculated using the 2–ΔΔCT method (Schmittgen and Livak, 2008). The primer used in this study has been provided in Supplementary Table 1.
Subcellular Localization of PeKCS2 Gene
The sub-cellular localization of PeKCS genes was hypothetically predicted by CELLO v.2.5 and for the validation, the transient expression assay was performed in onion epidermal cells by selecting a PeKCS2 candidate gene. To construct a vector for transient expression assays, the pCAMBIA1302 vector with cauliflower mosaic virus 35S (CaMV35S) promoter and green fluorescent protein (GFP) marker in the upstream region of the multiple cloning site (MCS) was used. The PeKCS full-length coding DNA sequences (CDS) without stop codon was amplified by PCR using the following primers: 5′-ACGGGGGACTCTTGACCATGGATGGATAGAGAAA GAGA TCTTTTGTCCACG-3′ (NcoI) and 5′-TCTCCTTTACTAGTC AGATCTCAGAGTCGCA GGAGGATATCTGT-3′ (BglII) (underlined are the restriction sites), and cloned into the pMD 19-T vector (Cat# 6013, TAKARA, Shiga, Japan) following the manufactures instructions. The positive clones were confirmed by sequencing (Sangon Biotech Co., Ltd, Shanghai, China), the gene fragment was digested with NcoI and BglII restriction enzymes and ligated into the NcoI-BglII digested pCAMBIA1302 vector using ClonExpress II One Step Cloning Kit (Cat# C112, Vazyme Biotech Co., Ltd., Nanjing, China) and then transferred to Agrobacterium tumefaciens EHA105 strain for the following infection. The resulting plasmids were named CaMV35S-PeKCS2-GFP and empty vector CaMV35S-GFP as control. These vectors were successfully transformed into onion epidermal cells by agroinfiltration method and GFP expressions were examined by laser scanning confocal microscopy (Olympus, Tokyo, Japan; FV1200) after 24–72 h of agroinfiltration (Xu et al., 2014).
Statistical Analysis
One-way ANOVA was performed for statistical analyses and Figures were generated by GraphPad Prism version 8.0.124. The comparisons between treated and controlled samples were performed using Student’s t-test and were considered statistically significant if p < 0.05.
Results
Identification and Physiochemical Properties of β-Ketoacyl-CoA Synthase Genes in Passion Fruit
In this study, after removing redundant, repetitive, and unrecognized sequences from BLASTp and HMMR results, finally, thirty-two KCS genes in the passion fruit genome by computational tools were identified. Passion fruit KCS genes were named from PeKCS1 to PeKCS32 according to their chromosomal positions. Except for chromosomes numbers five and nine, all PeKCS genes were unevenly distributed on seven of the nine passion fruit chromosomes and PeKCS32 was localized on an unassembled chromosome region. The largest number of PeKCS genes (14 genes) appeared on chromosome number one, followed by chromosome number four (5 genes), chromosome 2 (3 genes), chromosomes number three, seven, and eight (2 genes each), There is only one PeKCS gene on chromosome number six. PeKCS32 was found in the scaffold chromosome region, while no PeKCS gene was found on chromosomes 5 and 9 (Figure 1A and Table 1). Details of all 32 PeKCS genes can be found in Table 1 and the protein sequences have been provided in Supplementary Table 2. CD and SMART search tools for domains verification was used and found that PeKCS proteins contained two domains such as ACP_syn_III_C ((PF08541) 3-Oxoacyl-[acyl-carrier protein (ACP)] synthase III C terminal domain) and FAE1_CUT1_RppA ((PF08392) FAE1/Type III polyketide synthase-like protein domain) (Figure 1B).
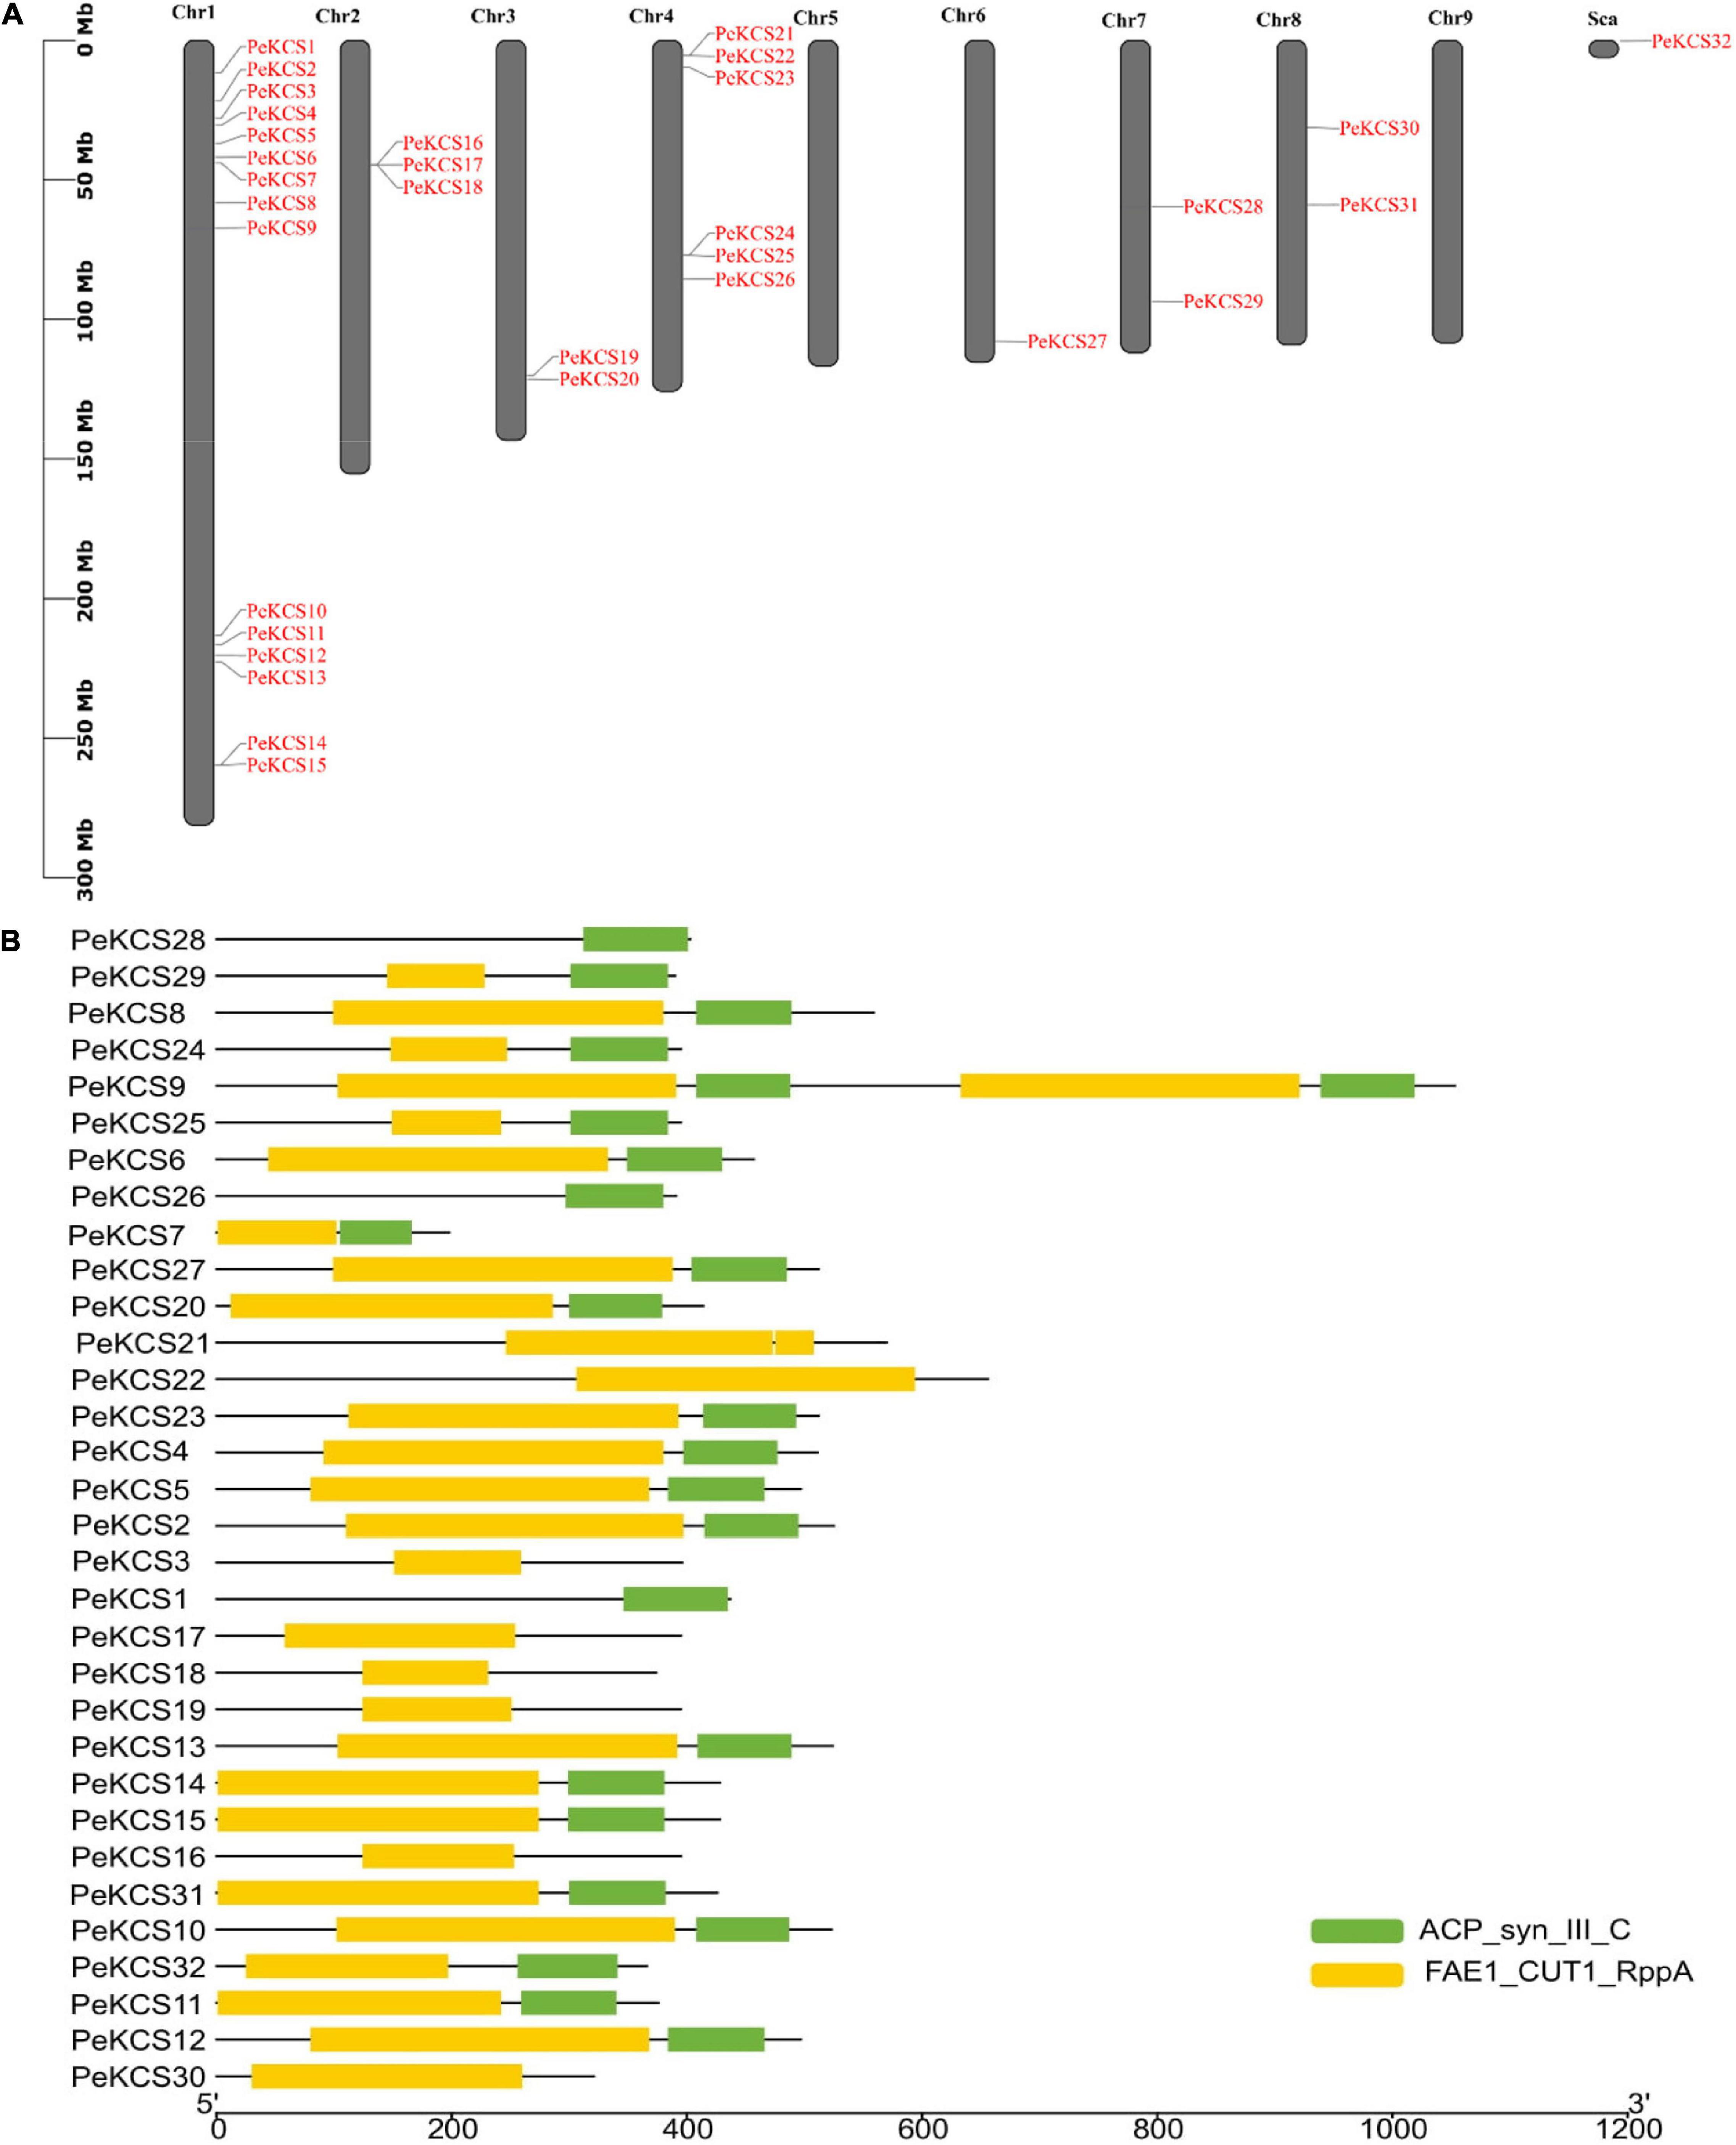
Figure 1. Chromosome location and conserved domains of PeKCS in passion fruit. (A) Chromosomal location of PeKCS genes, the scale represents the 300 MB chromosomal distance and the PeKCS genes are represented in red color. (B) The two conserved domains of PeKCS genes in passion fruit named as FAE1_CUT1_RppA: FAE1 (PF08392); ACP_syn_III_C (PF08541) (readers are referred to the Web version of this article for the understanding of the references to color in this figure legend). Sca-scaffold chromosome.
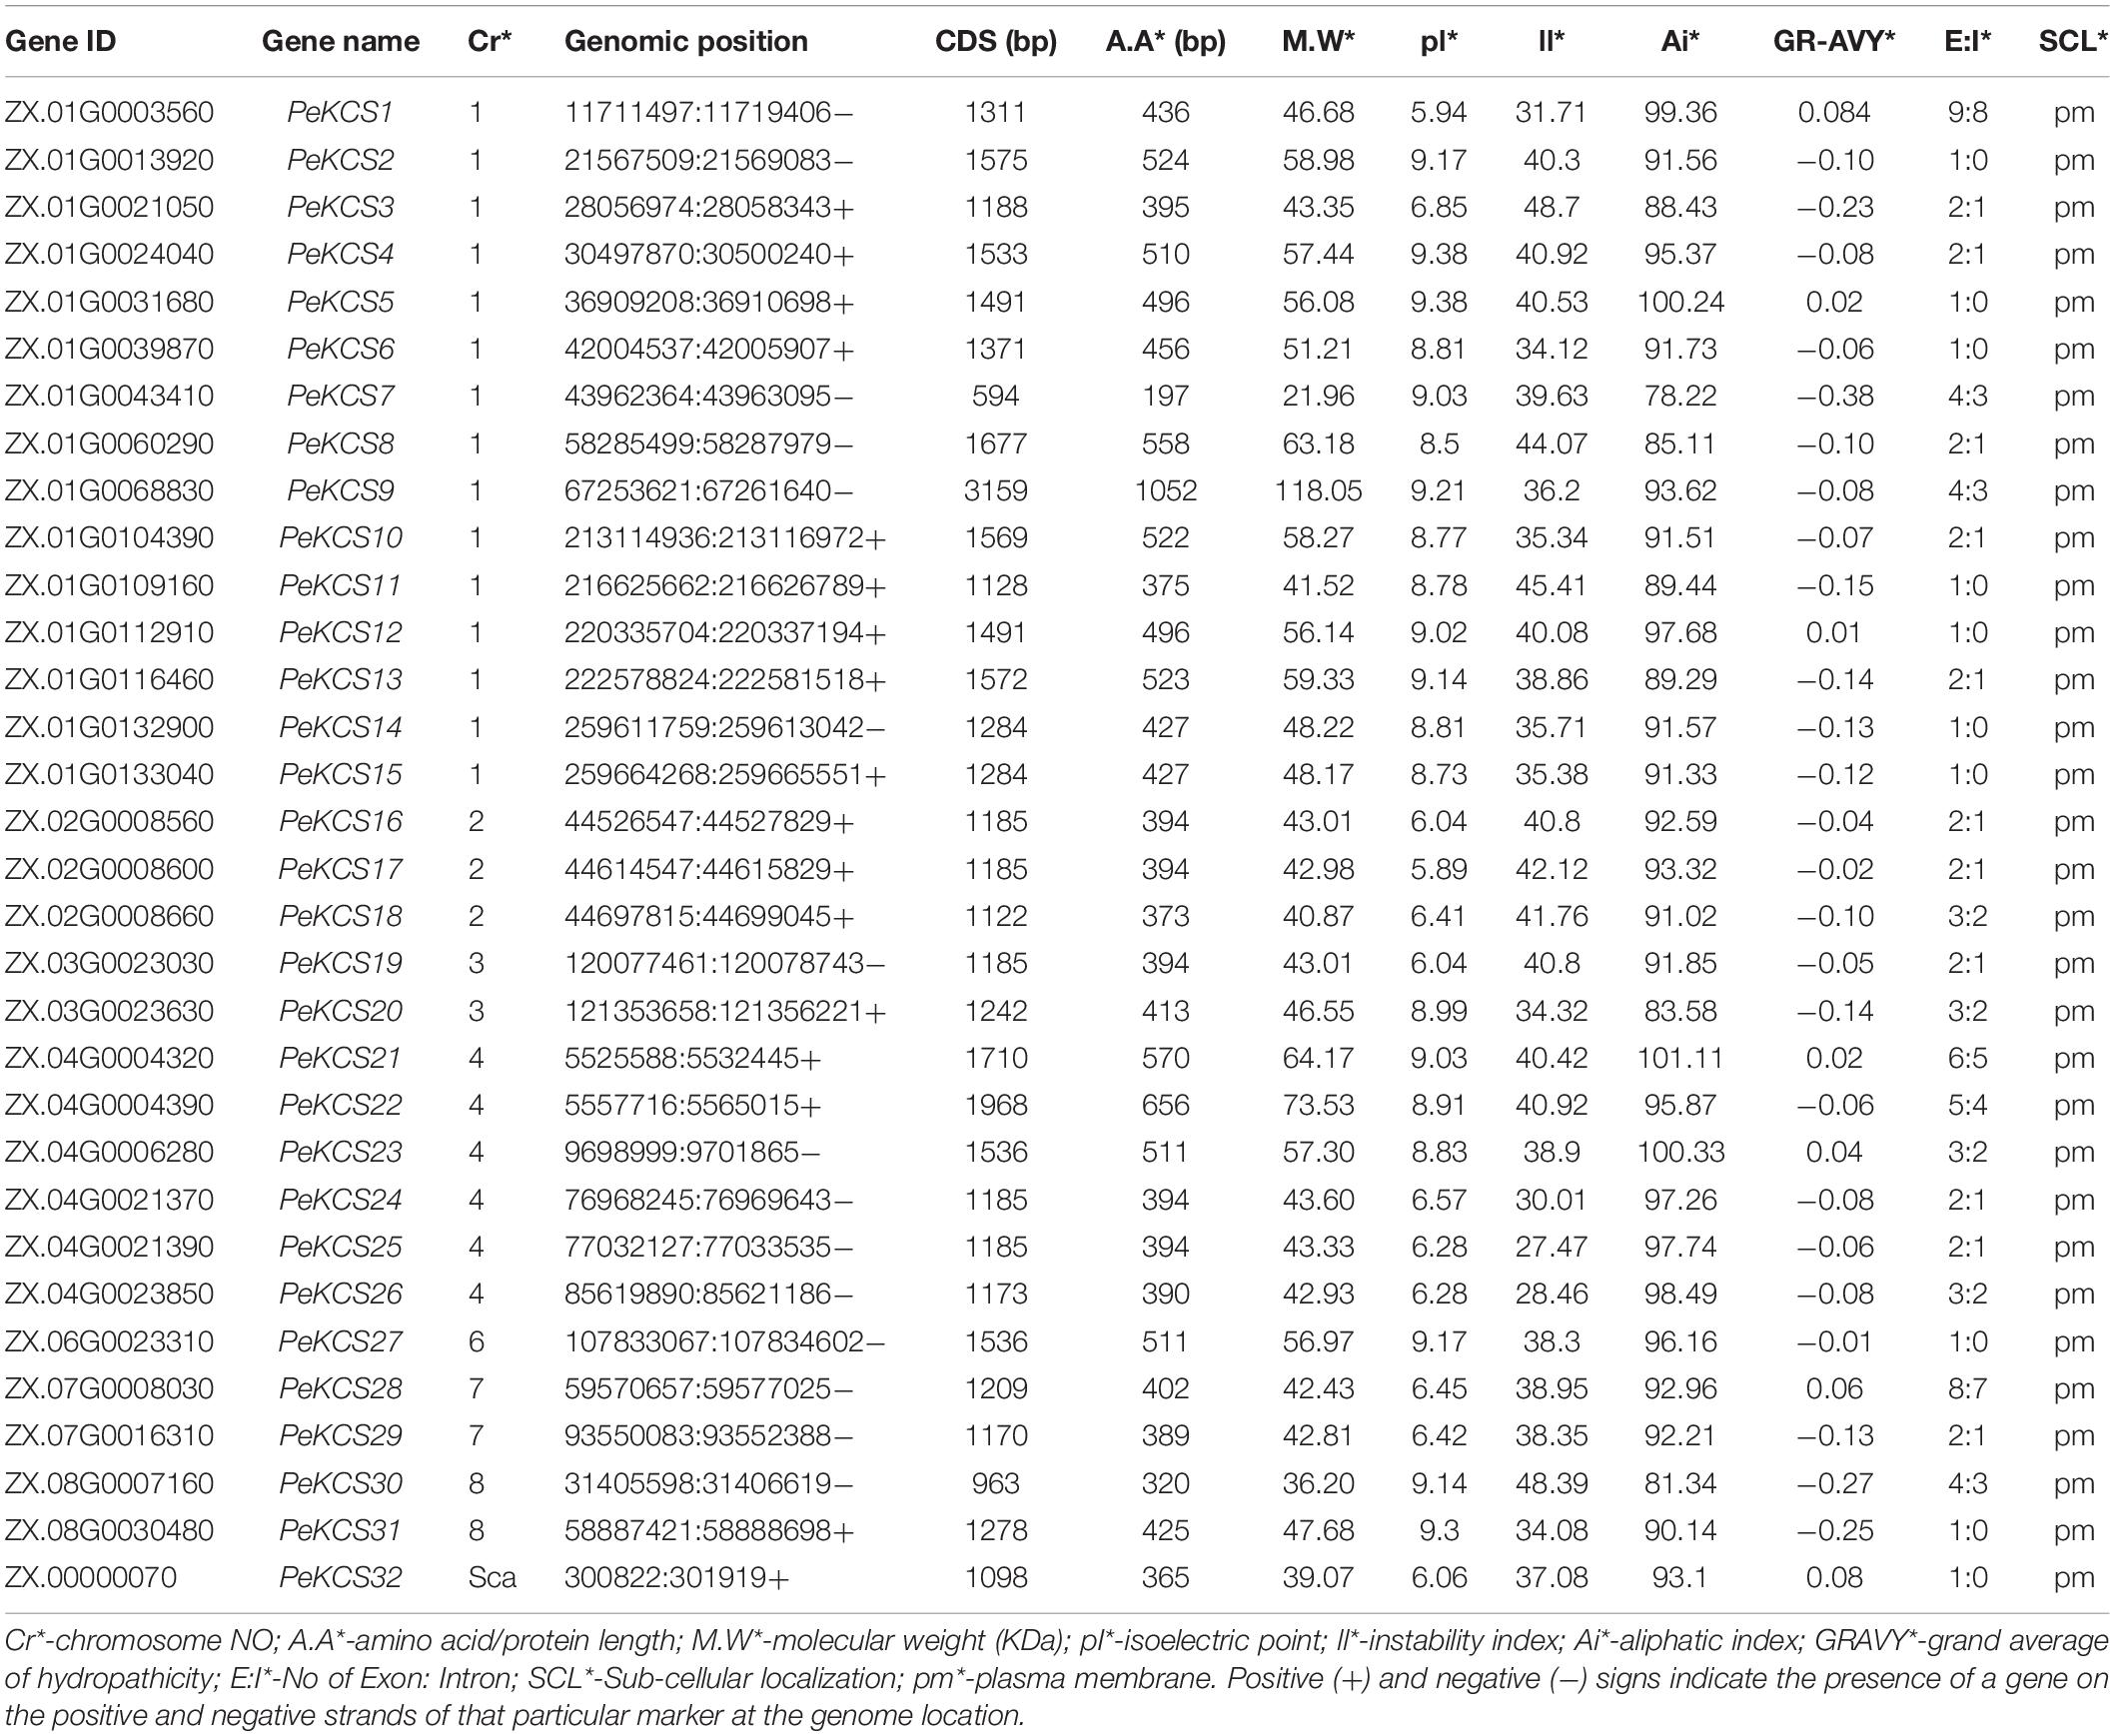
Table 1. Physiochemical properties of PeKCS genes.
Most of the PeKCS proteins contained both proteins 68% (22 genes), 19% (6 genes) contained only FAE1_CUT1_RppA domains and 9% (3 genes) contained only ACP_syn_III_C domain respectively (Figure 1B). Furthermore, the results of physiochemical properties showed that PeKCS genes varied in their properties such as; the protein length varied from 197 bp (PeKCS7) to 1052 bp (PeKCS9), the CDS length ranged from594 bp (PeKCS7) to 3159 bp (PeKCS9), as well as the protein molecular weight (M.W), ranged from 21.96 KDa (PeKCS7) to 118.05 KDa (PeKCS9). The isoelectric point (pI) of PeKCS proteins also varied ranged from 5.89 (PeKCS17) to 9.38 (PeKCS4 and PeKCS5), protein instability index (II) varied from 27.47 (PeKCS25) to 48.7 (PeKCS2) and aliphatic index (Ai) ranged from 81.34 (PeKCS30) to 101.11 (PeKCS11). The grand average of hydropathicity (GRAVY) ranged from −0.38 (PeCS7) to 0.08 (PeKCS1). PeKCS protein also varied in number of exons ranged from 1 (PeKCS2, PeKCS5, PeKCS6, PeKCS10, PeKCS11, PeKCS14, PeKCS15, PeKCS27, PeKCS31, and PeKCS32) to 9 (PeKCS1). The proteins subcellular localization prediction showed that all the PeKCS proteins were associated with the plasma membrane (Table 1).
Multiple-Sequence Alignment and Phylogenetic Analysis of β-Ketoacyl-CoA Synthase Genes
Multiple sequence alignment and evolutionary tree analyses of identified passion fruit KCS genes were performed. The multiple sequences analysis between AtKCS and PeKCS genes exhibited two conserved domains FAE1_CUT1_RppA (Supplementary Figure 1, presented in red box) domain and the ACP_syn_III_C domain (Supplementary Figure 1, presented in the blue box). Both sequences were highly identical and conserved in both regions, indicating the importance of these domains for KCS gene functions (Supplementary Figure 1). Furthermore, the N-terminal deletion of the FAE1_CUT1_RppA domain in PeKCS7 was precise compared to other PeKCS genes, suggesting that PeKCS7 may have a unique function (Supplementary Figure 1). One hundred and eleven KCS protein sequences from A. thaliana (AtKCS), P. edulis (PeKCS), M. domestica (MdKCS), and A. hypogaea (AhKCS) species were used to assess the evolutionary relationship and unrooted phylogenetic tree (All the KCS protein sequences used in the phylogenetic tree have been provided in Supplementary Table 2. The KCS protein sequences were aligned and a neighbor-joining tree was constructed using MEGA software.
The phylogenetic tree was divided into four main groups (FAE-like, FDH-like, KCS1-like, andCER6-like) and eight subgroups including FAE-like (α), FAE-like (β), CER6-like (γ), KCS1-like (δ), KCS1-like (ζ), FDH-like (ε), FDH-like (η), and FDH-like (θ) (Figure 2) according to AtKCS (Joubès et al., 2008). Phylogenetic analysis showed that FDH-like (θ) subgroup consisted of 35 KCS genes (17 PeKCS, 3 AtKCS, 11 MdKCS, and 4 AhKCS) followed by KCS1-like (ζ) 26 genes (6 PeKCS, 3 AtKCS, 5 MdKCS, and 12 AhKCS), FAE-like (α) consists of 15 genes (4 PeKCS, 3 AtKCS, 4 MdKCS, and 4 AhKCS), KCS1-like (δ) consists of 10 genes (1 PeKCS, 3 AtKCS, 2 MdKCS, and 4 AhKCS), FDH-like (ε) consists of 9 genes (1 PeKCS, 2 AtKCS, 2 MdKCS, and 4 AhKCS), FDH-like (η) consists of 6 genes (1 PeKCS, 2 AtKCS, and 3 MdKCS), CER6-like (γ) consists of 6 genes (2 PeKCS, 2 AtKCS, and 2 MdKCS), and FAE-like (β) composed of only 3 Arabidopsis KCS genes (Figure 2). FDH-like (θ) was found to be the largest subgroup consisting of 35 KCS genes followed by KCS1-like (ζ) 26 genes and FAE-like (β) was the smallest subgroup containing only 3 Arabidopsis KCS genes. The number of KCS genes was similar in FDH-like (η) and CER6-like (γ). There were also differences in the uneven distribution of PeKCS genes between different subgroups, for example, the largest number of PeKCS genes (17 genes) was found in the FDH-like (θ) subgroup, followed by the KCS1-like (ζ) subgroup (6 genes), and only 1 PeKCS gene was found in the KCS1-like (δ), FDH-like (n), FDH-like (ε) subgroups and no any PeKCS gene was aligned in the FAE-like (β) subgroup (Figure 2). The results revealed that P. edulis KCS proteins shared greater homology with M. domestica (MdKCS) and A. thaliana (AtKCS) compared to A. hypogaea (AhKCS) (Figure 2). Furthermore, the pair-wise identity between PeKCS genes was performed to better understand the evolution and the result showed that the similarity varied from 22.71% (PeKCS1/PeKCS13) to 99.84% (PeKCS16/PeKCS17 and PeKCS17/PeKCS19) respectively (Supplementary Table 3). PeKCS17 showed the highest similarity of 99.84% with PeKCS16 and PeKCS19 genes. Pairwise similarity results were contrasted with phylogenetic tree results, where PeKCS16, PeKCS17, and PeKCS19 genes were grouped in the same FDH-like (θ) subgroup (Figure 2 and Supplementary Table 3).
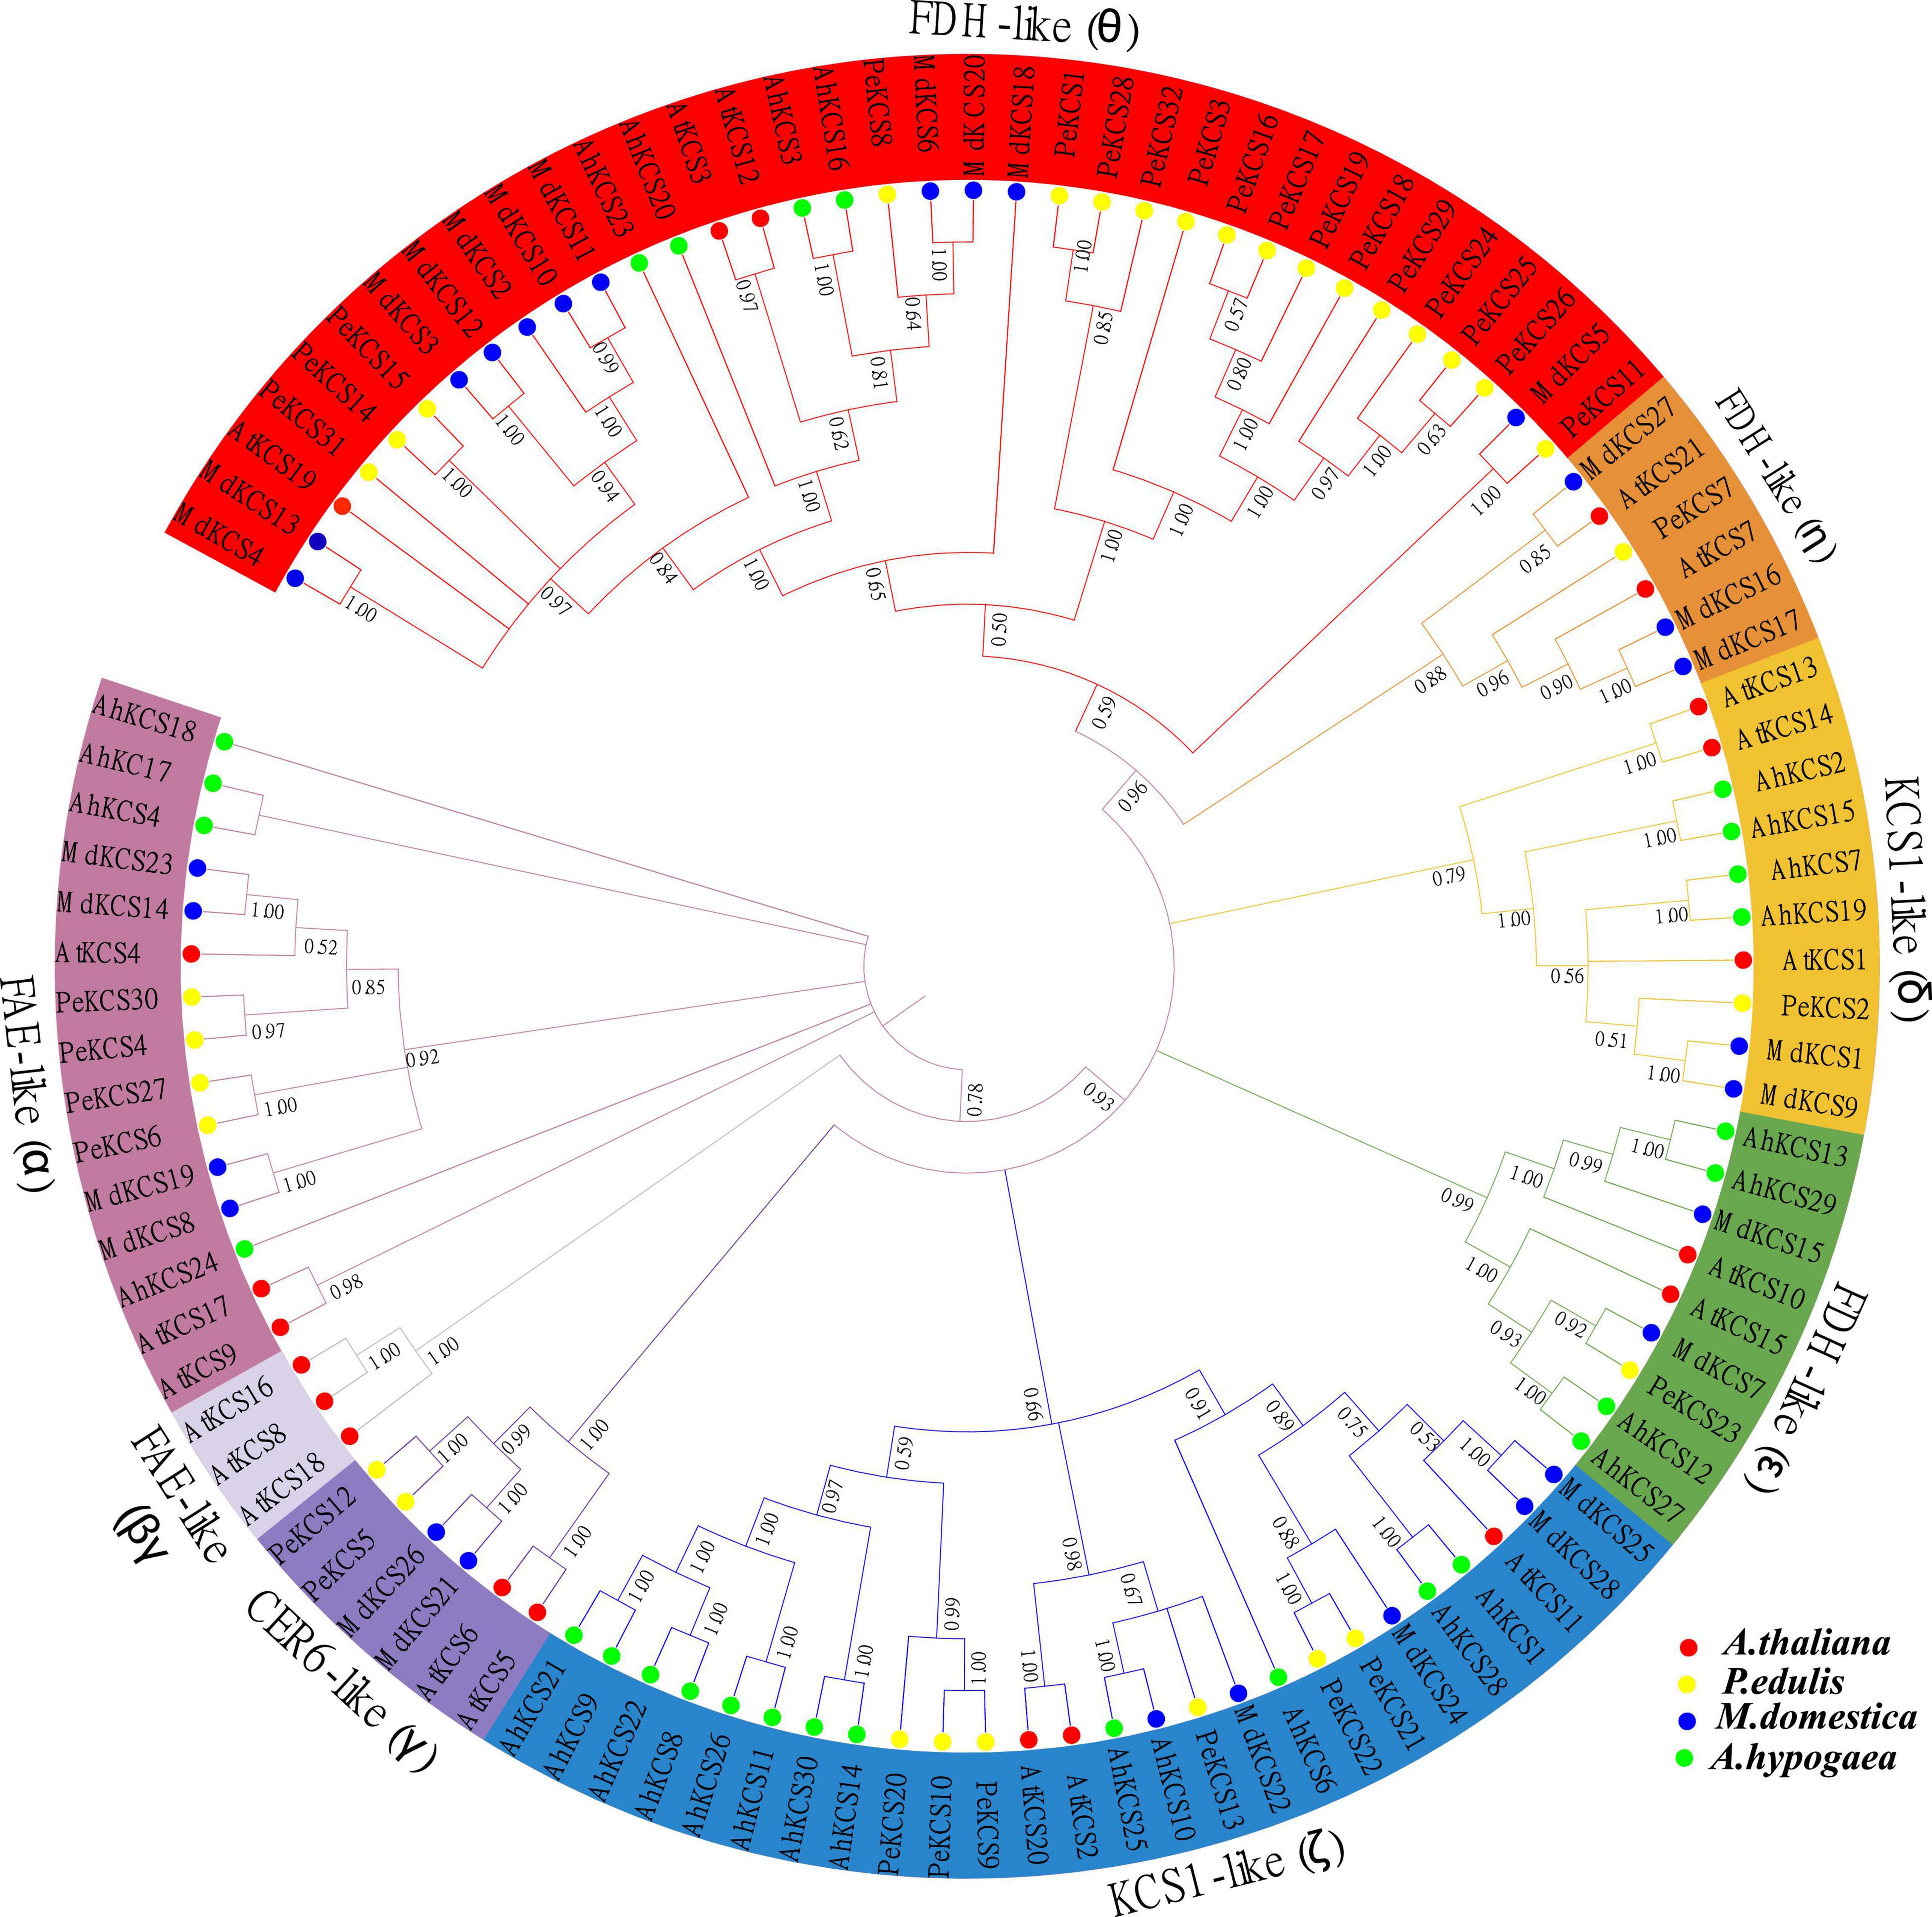
Figure 2. An unrooted neighbor-joining (NJ) phylogenetic tree based on the amino acid sequences alignment among A. thaliana, P. edulis, M. domestica, and A. hypogaea KCS sequences with 1000 bootstraps. All the KCS members were divided into 8 groups and presented in different colors. The protein sequences of AtKCS, PeKCS, MdKCS, and AhKCS are represented by red, yellow, blue, and green color circles respectively.
Gene Structure and Motifs Analyses of PeKCS Genes
The relationship between 32 PeKCS genes was investigated through the construction of a phylogenetic tree using the neighbor-joining (NJ) method and grouped from I-V11 (Figure 3A). The protein sequences of all PeKCS genes have been provided in Supplementary Table 2. According to the results, group VII was the largest group with 17 PeKCS genes followed by group 4 with 6 genes. The smallest groups were III, V, and VI with only one PeKCS gene (Figure 3A). To further understand the development and functions of PeKCS family genes, the conserved motifs and exon-intron configuration of PeKCS gene structure were analyzed (Figures 3B,C). Moreover, the conserved motifs among 32 PeKCS genes were predicted using the online MEME tool. The conserved motifs among PeKCS proteins vary ranged from 1 (PeKCS28) to 16 (PeKCS9) and overall, 10 conserved motifs were recognized in all PeKCS proteins (Supplementary Table 4). Most of the PeKCS genes (12 genes) have 8 motifs followed by 4 motifs (9 genes) and PeKCS28 have only one motif. PeKCS9 contained a maximum of 16 motifs. The motif distribution among group I-VII was also similar such as groups I, II, III, and V contained 8 conserved motifs except for PeKCS30. Furthermore, the 9 members of group VII contained 4 conserved motifs (Figures 3A,B). Genomic structural analysis of exons in 32 PeKCS genes revealed that the number of exons identified in PeKCS varied from 1 to 9 (Figure 3C). Most PeKCS genes (11 genes) consist of 2 exons and 1 exon (10 genes). In addition, PeKCS1 contains up to 9 exons (Figure 3C). Group II has only 1 exon and no intron, group 1, III, IV, and V have 1 to 4 introns, group VI have 3 introns and group VII contained 1 to 9 introns except PeKCS11, PeKCS14, PeKCS15, and PeKCS32 genes have no introns (Figure 3C). Overall, groups I, II, III, and V showed similar exon-intron patterns whereas groups IV and VII had different exon-intron association patterns (Figure 2C). These results suggest that PeKCS genes within a group have remarkably similar gene structures consistent with their phylogenetic relationships (Figure 3). In conclusion, after analyzing the composition of conserved motifs, gene structure, phylogenetic relationships, and group classification, the results indicated that PeKCS genes have highly conserved amino acids and genes within a group may have the same functions.
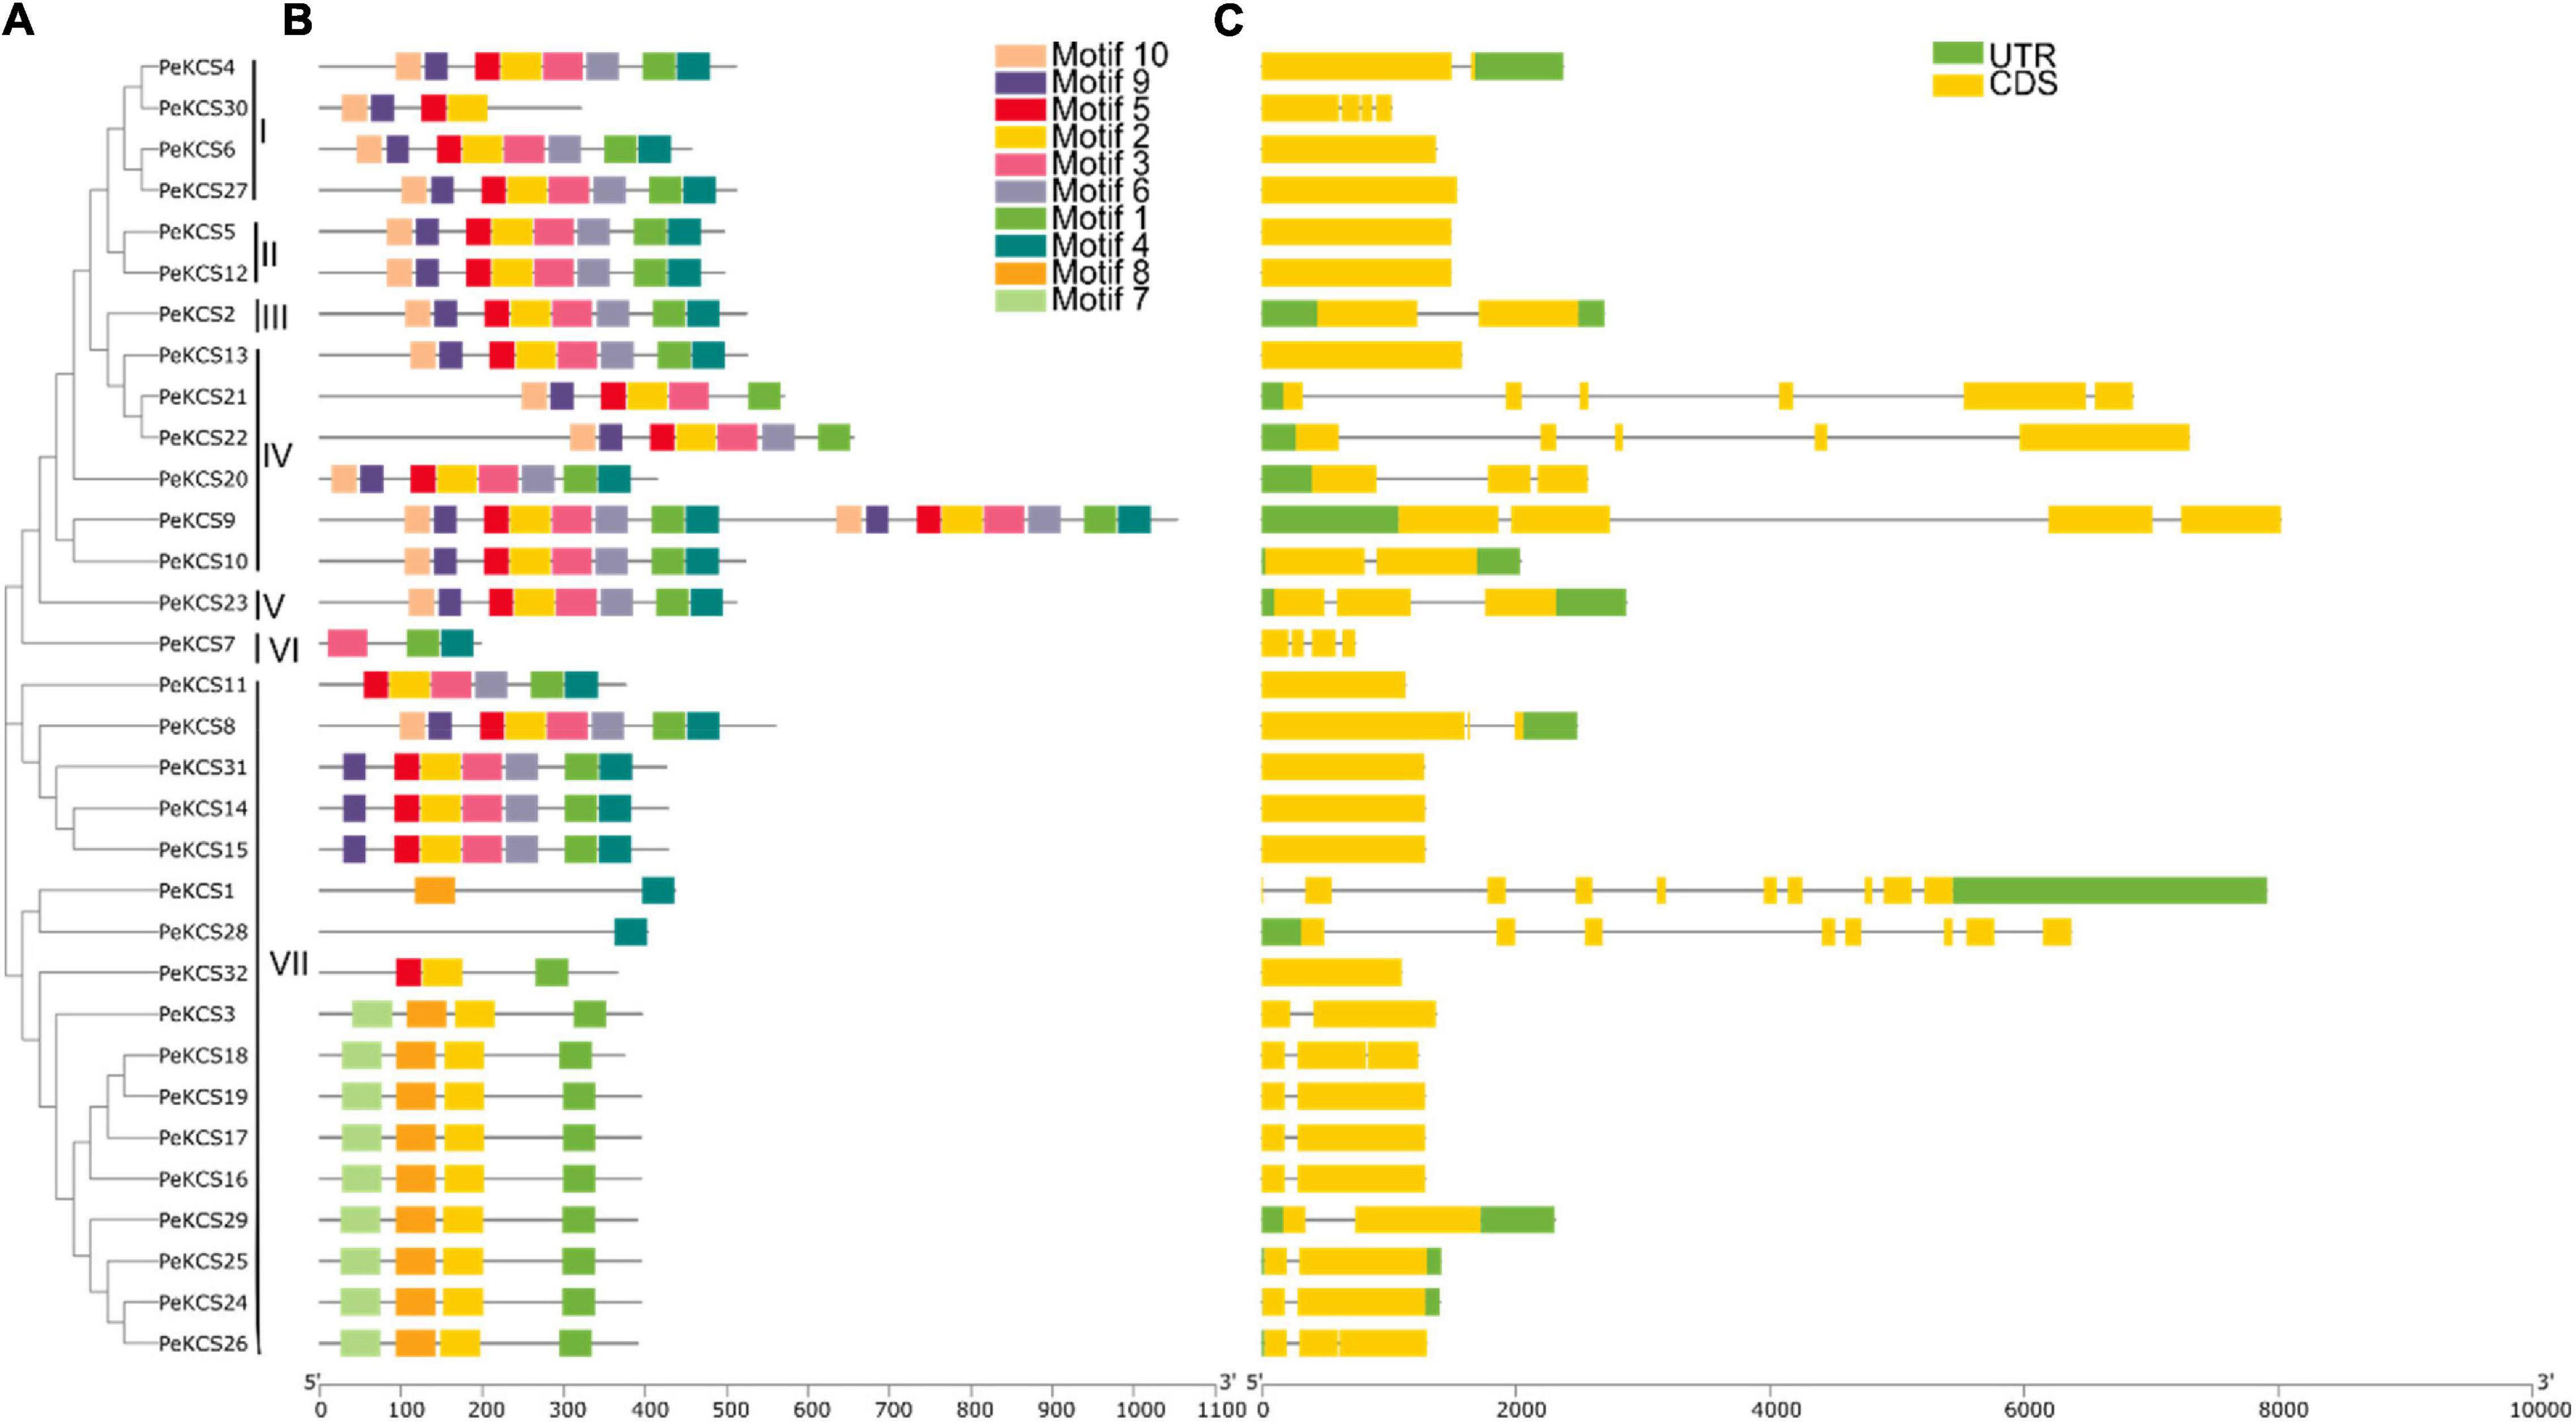
Figure 3. The unrooted phylogenetic tree, conserved motifs and gene structure of PeKCS genes. (A) The neighbor-joining tree on the left comprised of 32 KCS proteins from passion fruit. (B) Conserved motifs were represented via boxes and different colors represents different motifs. (C) PeKCS genes structures, yellow color indicates the exons, the green color shows the untranslated 5′ and 3′-regions, and gray color indicates the introns.
Cis-Regulatory Element Analysis of PeKCS Genes
The cis-regulatory element analysis of the PeKCS genes from the 2000 bp upstream promoter region was conducted to better understand the role of PeKCS genes in biotic and abiotic responses (Figure 4 and Supplementary Table 5). Mainly four different categories of cis-regulatory elements were found in the PeKCS promoter regions including plant growth and development (8 different types of cis-elements), phytohormones (10 different types of cis-elements), light (15 different types of cis-elements), and stress (7 different types of cis-elements) responsiveness (Figure 4.1). Overall, a total of 969 cis-elements belonging to different categories were identified in 32 PeKCS genes, and when comparing between four different categories, the phytohormone-responsive category had the highest number of cis-elements at 40% (391/969), followed by light-responsive 37% (351/969), stress-responsive 15% (147/969) and the lowest number of cis-elements found in the plant growth and development response category 8.3% (80/969) (Figure 4.2). Furthermore, all the 32 PeKCS genes contained the phytohormone, light, and stress-responsive cis-elements, whereas only 25 PeKCS contained metabolism (plant growth and development) responsive cis-elements (Figure 4.2A).
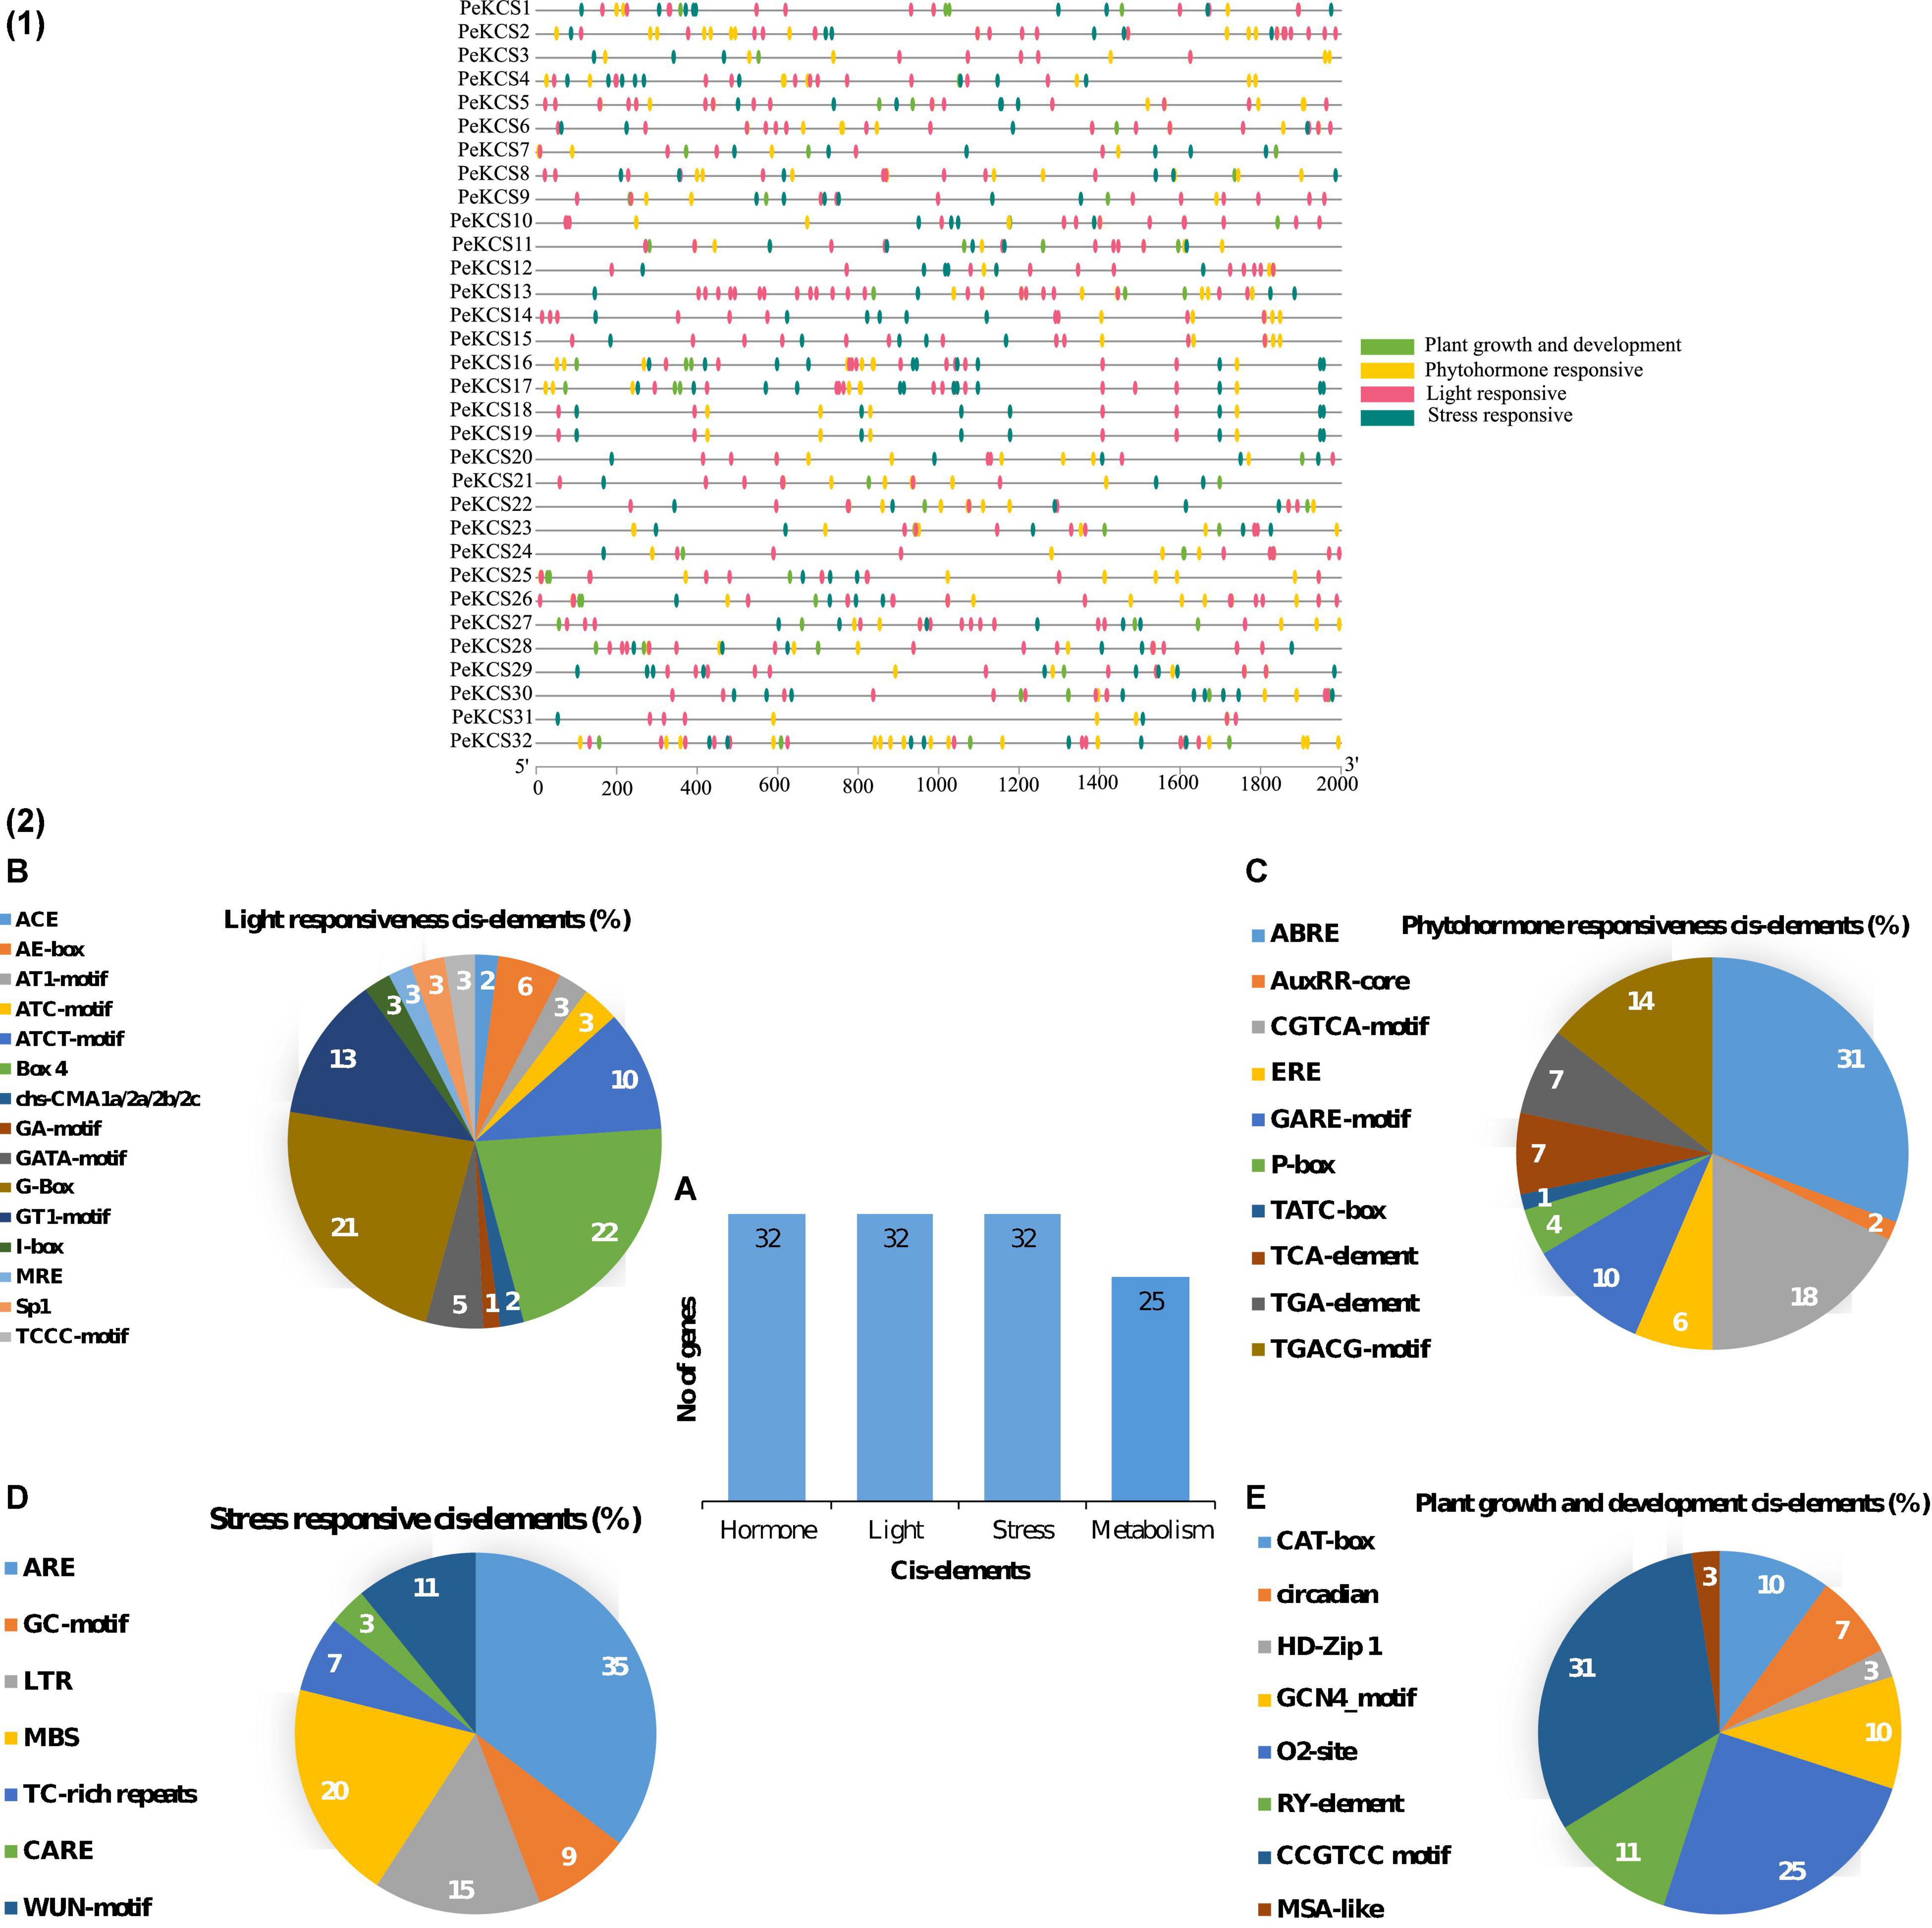
Figure 4. The cis-regulatory element analysis in PeKCS genes (1,2). (A) The sum number of PeKCS genes involved in four categories of cis-elements and the percentage (%) ratio of the numerous cis-elements from each category is presented in pie charts; (B) plant growth and development responsive (C) phytohormones-responsive, (D) light-responsive, and (E) stress-responsive. Different colors indicate different cis-acting elements and their ratio present in PeKCS genes.
The main four categories were further divided into subcategories based on different cis-elements. Light responsiveness category comprised of the 3-AF1 binding site, ACE, AE-box, AT1-motif, ATC-motif, ATCT-motif, TCT-motif, Box 4, chs-CMA1a/2a/2b/2c, GA-motif, GATA-motif, G-Box, GT1-motif, I-box, LAMP-element, MRE, Sp1, and TCCC-motif cis-elements (Figure 4.2 and Supplementary Table 5). The highest light-responsive cis-elements consisted of Box-4 22% followed by G-Box 21%, while the GA-motif consisted of only 1% cis-elements (Figure 4.2B). The phytohormone responsive category further includes ABRE (abscisic acid-responsive), AuxRR-core (auxin-responsive), ERE (ethylene-responsive), GARE-motif, P-box, TATC-box (gibberellin responsive); TCA-element (salicylic acid-responsive); TGA-element and TGACG-motif (MeJA responsive) cis-elements. The highest number of cis-elements from the phytohormones category was ABRE 31% followed by CGTCA-motif 18%, while the AuxRR-core consisted of only 1% cis-elements (Figure 4.2C and Supplementary Table 5).
The stress response category further included ARE, GC-motif, LTR, MBS, TC-rich repeats, CARE, and WUN-motif cis-element. ARE accounted for the highest number 35% followed by MBS with 19%, and CARE with only 3% (Figure 4.2D and Supplementary Table 5). The plant growth and development category further include subcategories of meristem, metabolism, seed related, and circadian. Meristem associated cis-elements included CAT-box (10%) and GCN4-motifs (10%). Metabolism-related cis-elements included O2-sit (25%), seed and circadian-related cis-element included RY-element (11%), and only 3% of MSA-like cis-elements were found (Figure 4.2E and Supplementary Table 5). The information on developmental, light, stress, and hormone-related cis-elements suggested that the transcriptional profiling of PeKCS genes may vary in developmental, hormonal, and stressful contexts and require further investigation. Details on the cis-regulatory elements in the passion fruit KCS genes have been provided in Supplementary Table 5.
Synteny Analysis of PeKCS Genes
Synteny analysis was performed to further understand the evolution and expansion mechanism of the PeKCS gene family in the passion fruit genome and the genomes of other species. PeKCS gene duplications were assessed based on a tandem or segmental duplications. The results of gene duplication analysis indicate that there were 8 PeKCS gene pairs (Figure 5A and Supplementary Table 6), of which 3 gene pairs were segmentally duplicated on chromosomes 1, 2, 3, 6, and 8, whereas 5 gene pairs were tandem duplicated on chromosomes 1 and 4 in passion fruit genome. The duplicated genes belonged to different chromosomes, and chromosome 1 was found to have half of the duplicated genes (8 genes) (Figure 5A and Supplementary Table 6). These results suggest that gene duplication may play an important role in the development of the PeKCS gene family and the passion fruit genome. In addition, the Ka/Ks ratios were calculated in duplicated genes to assess the evolutionary rates and selection pressures (Supplementary Table 6). In general, a Ka/Ks ratio greater than 1 indicates that the gene was positively selected, a ratio less than 1 indicates a purifying selection, and a ratio equal to 1 indicates neutral selection. Details of the Ka, Ks values, and Ka/Ks ratios of the duplicated PeKCS gene pairs are provided in Supplementary Table 6. Overall, all duplicated PeKCS gene pairs showed a Ka/Ks ratio of less than 1, indicating that these genes had gone through purifying selection. Additionally, the divergence time between duplicated genes was measured as a substitution rate of 6.38 × 10⁻⁹ substitutions per site per year (Ma et al., 2021). The results of the divergence indicated that the duplication process between the tandem and segmental PeKCS genes was estimated to be between 0.30 and 27.64 million years ago (Supplementary Table 6). It can be concluded that the evolutionary mechanism of the PeKCS gene showed maintenance during the domestication of passion fruit.
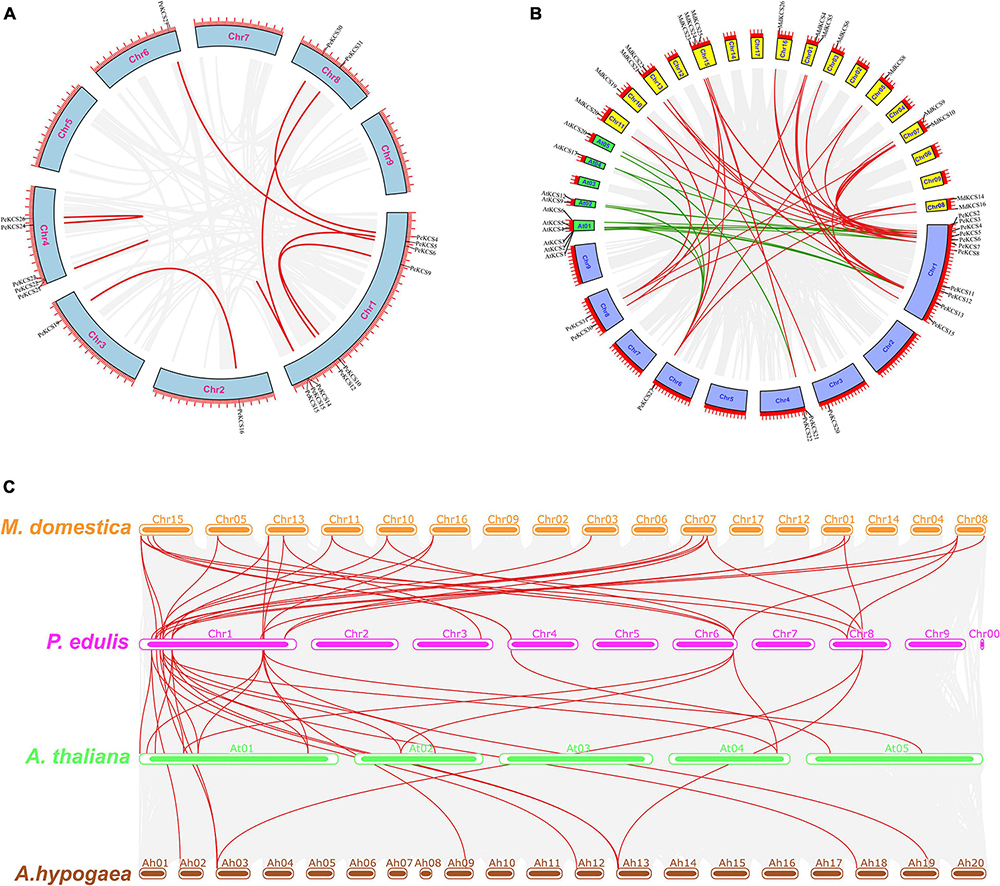
Figure 5. Circos illustrations of the PeKCS genes duplication and multiple collinearity analysis of KCS genes between P. edulis, A. thaliana, M. domestica, and A. hypogaea species. (A) Gene duplication of KCS genes in P. edulis. The background gray lines show all the syntenic blocks in the passion fruit genome, and the red lines show the segmental or tandem duplication link regions among PeKCS genes. The approximately location of PeKCS genes are labeled with a short gray line outside with gene names. (B) Orthologous of P. edulis KCS genes with A. thaliana (AtKCS) and M. domestica (MdKCS) species. Chromosomes of P. edulis are represented with Chr1–Chr9, A. thaliana with At01-At05 and M. domestica with Chr01–Chr17. The background gray lines show all the syntenic blocks genomes of different species, green lines represented the syntenic relationship among P. edulis and A. thaliana KCS genes, red lines represented the syntenic relationship among P. edulis and M. domestica KCS genes, (C) Multiple collinearity analysis of KCS genes between P. edulis, A. thaliana, M. domestica, and A. hypogaea species. The red lines represent the P. edulis KCS genes orthologous in A. thaliana, M. domestica, and A. hypogaea species, the gray lines in the background represent the collinear blocks within P. edulis and other species genomes.
Comprehensive synteny analyses of KCS genes between P. edulis, A. thaliana, and M. domestica species were performed and 45 KCS gene pairs were identified within these three species. Among the 32 P. edulis KCS genes, 15 PeKCS genes were paired with 26 KCS genes in A. thaliana (10 AtKCS) and M. domestica (16 MdKCS) (Figure 5B and Supplementary Table 7). Among species, 15 KCS gene pairs were found between P. edulis (8 PeKCS) and A. thaliana (10 AtKCS) species (Supplementary Table 7). On the other hand, 30 KCS gene pairs were found between P. edulis (15 PeKCS) and M. domestica (16 MdKCS) species (Supplementary Table 7 and Figure 5B). Taken together, the P. edulis and M. domestica KCS genes showed a high degree of synteny compared with A. thaliana, suggesting that they may have originated from the same ancestors and performed the same functions, which required further study.
Multicollinearity analysis was performed to reveal robust orthologs of KCS genes between P. edulis A. thaliana, M. domestica, and A. hypogaea species (Figure 5C and Supplementary Table 8). The results showed that multiple collinear gene pairs between the four species were inferred as genetic copies with lineage-specific expansion. In general, 58 P. edulis KCS genes showed syntenic association with 31 M. domestica genes, 16 A. thaliana genes, and 11 A. hypogaea genes. Overall, the maximum collinear genes were found between P. edulis and M. domestica followed by P. edulis and A. thaliana, while the fewest were found between P. edulis and A. hypogaea species. P. edulis chromosome 1 shared the maximum collinear genes among M. domestica and A. thaliana (Figure 5C and Supplementary Table 8), suggesting that the KCS genes are conserved and may have the same ancestors besides with duplication or loss of KCS genes. Furthermore, many homologs from A. thaliana, M. domestica, and A. hypogaea species maintained a syntenic association with the P. edulis KCS gene family suggesting that, in addition to segmental duplications, the whole-genome duplications also play an important role in the evolution of the PeKCS gene family.
Protein–Protein Interaction, Secondary Structure, and 3D Modeling of PeKCS
The protein–protein interaction network analysis of PeKCS proteins based on known Arabidopsis proteins was conducted. PeKCS portions having higher homologous similarity with Arabidopsis proteins were selected as STRING proteins. Among all, 31 PeKCS proteins were associated with known Arabidopsis proteins (Figure 6A and Supplementary Table 9). PeKCS proteins belonging to different groups may have diverse functions in Arabidopsis. PeKCS1 and PeKCS28 were homologous with AtKASIII protein and have a strong interaction among AtKASI, AtEMB3147, AT2G04540, and AtBCCP2 proteins. PeKCS2 showed homology with AtKCS1 protein and interacts with AtFAB1/KASI and AtKCS6 proteins. PeKCS5, PeKCS11, and PeKCS12 were homologous with AtKCS6 and showed an interaction with AtKCS6 and AtKCS10 proteins. PeKCS23 shows homology with AtKCS10 and interacts with AtBCCP2 and AtKCS6 proteins. PeKCS8 was homologous with AtKCS12 and interacts with AtBCCP2 protein. PeKCS3 was homologous with AtLAP6 and interacts with AtFLS1 and AtF3H proteins. PeKCS9, PeKCS20, PeKCS21, and PeKCS22 were homologous with AtKCS11 and have a strong interaction with AtKASI protein. PeKCS16, PeKCS17, PeKCS18, PeKCS19, PeKCS24, PeKCS25, PeKCS26, and PeKCS29 were homologous with AtTTP4 and have an interaction among AtFLS1 and AtTT5 proteins. The PeKCS proteins that have strong interaction with Arabidopsis proteins might have similar functions as in Arabidopsis. The higher the interaction coefficient, the thicker the line between proteins and vice versa (Figure 6A and Supplementary Table 9).
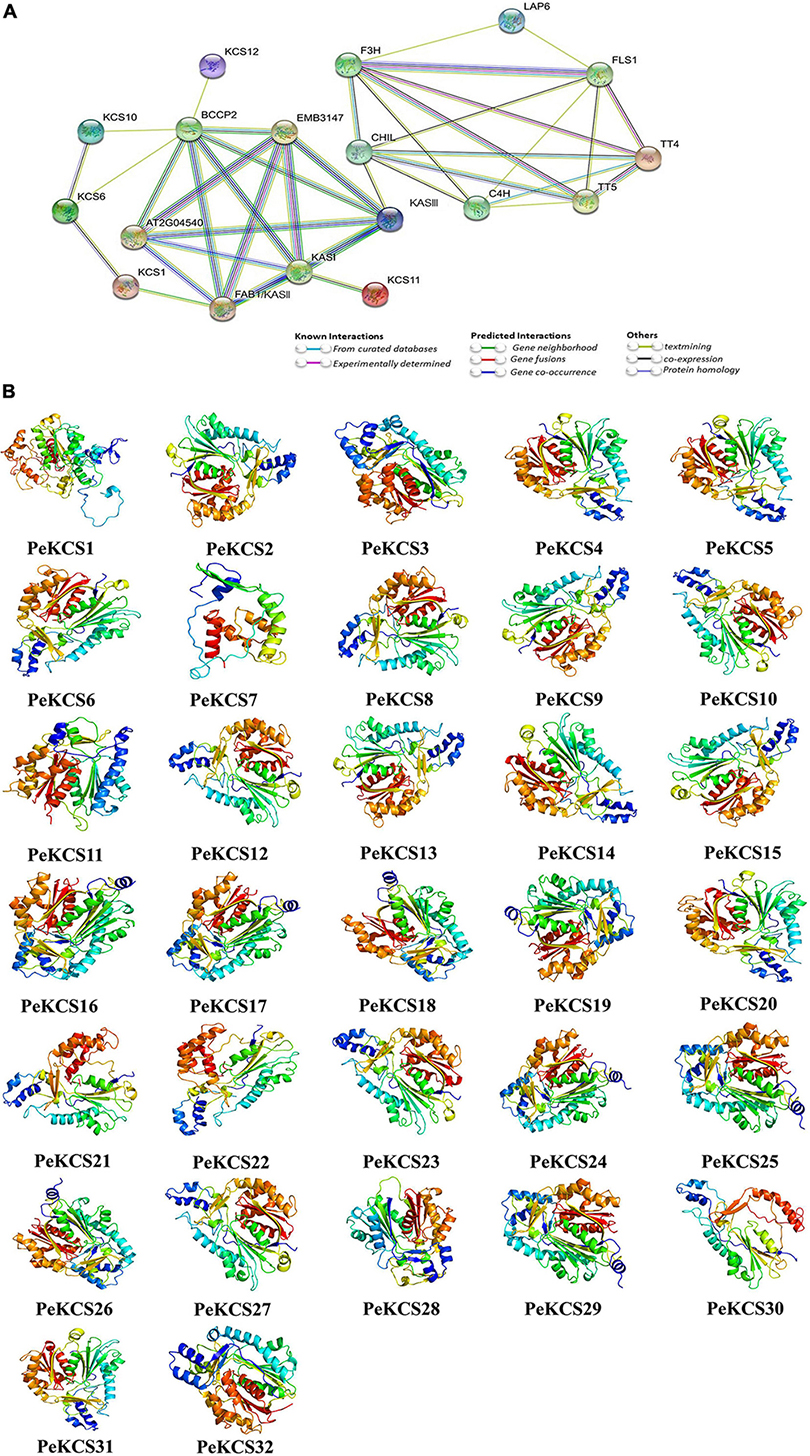
Figure 6. Protein–protein interaction and predicted 3D models of PeKCS proteins. (A) The network was constructed using online STRING software. The proteins are displayed at network nodes with 3D structure of the proteins within nodes and the lines colors indicate different data sources. The higher the interaction coefficient, the thicker the network lines between proteins and vice versa. (B) 3D models were constructed using the online Phyre2 server with default mode.
The protein secondary structure generally consists of alpha helices, extended strands, beta turns, and random coils. The PeKCS protein secondary structure analysis was performed and found that in all PeKCS proteins, the alpha helix accounted for the largest percentage of secondary structures 49.6% (PeKCS5) followed by random coils 41.96% (PeKCS1) and extended strands 22.89% (PeKCS28), whereas the beta turns accounts only for 9.2% (PeKCS28). PeKCS28 showed the highest percentage in extended strands and beta turns might have a specific function that needs further studies (Supplementary Table 10). Additionally, the 3D models of all the PeKCS proteins were predicted by using the Phyre2 server with default mode (Figure 6B). The following templates were used for the predicted PeKCS protein models including nineteen PeKCS (PeKCS2, PeKCS4, PeKCS5, PeKCS6, PeKCS7, PeKCS8, PeKCS9, PeKCS10, PeKCS12, PeKCS13, PeKCS14, PeKCS15, PeKCS20, PeKCS21, PeKCS22, PeKCS23, PeKCS27, PeKCS30, and PeKCS31) protein models were predicted with c3vs9F template. Eight PeKCS (PeKCS16, PeKCS17, PeKCS18, PeKCS19, PeKCS24, PeKCS25, PeKCS26, and PeKCS29) protein models were predicted with c1cmlA template. Template c1u0mA in PeKCS32 model, template c2d3mA in PeKCS3 model, template c3gwaA in PeKCS28 model, template c3tsyA in PeKCS11 model and template c4b3yB in PeKCS1 respectively. All PeKCS proteins showed a flexible structure due to the presence of coils (Figure 6B). Our finding suggested that PeKCS genes from individual genomes may be ancestrally similar with each other or initially differ maybe stabilized during long-term domestication, leading to changes in protein structure and functions.
Prediction of Potential Micro-RNAs Targeting PeKCS Genes
MicroRNAs are a class of small non-coding regulatory RNAs that control gene expression by directing target mRNA cleavage or translational repression (Sunkar and Zhu, 2004). Over the past few decades, various studies have been reported that miRNAs induce the regulation of stress, plant development, and single transduction (Witkos et al., 2011). Therefore, to better understand the regulatory mechanism of miRNA involved in the regulation of PeKCS genes, the identification of putative miRNA in PeKCS genes was performed by using the mature sequences of known passion fruit miRNAs as described in the material section. Details of the putative miRNA targeting sites and the PeKCS genes have been provided in Supplementary Table 11. Twenty putative ped-miRNAs belonging to 9 different families were identified, targeting the 13 PeKCS genes (Figure 7 and Supplementary Table 11). The results show that one member of the ped-miR157 family targeted one gene (PeKCS5); one member of the ped-miR162 family targeted one gene (PeKCS9); one member of ped-miR164 family targeted one gene (PeKCS5); two members of the ped-miR166 family targeted four genes (PeKCS2, PeKCS24, PeKCS25, and PeKCS26); one member of ped-miR171 family targeted one gene (PeKCS4); two members of ped-miR319 family targeted two genes (PeKCS5 and PeKCS10); one member of ped-miR397 family targeted one gene (PeKCS8); one member of ped-miR398 family targeted one gene (PeKCS23) and two members of ped-miR399 family targeted three genes (PeKCS12, PeKCS26, and PeKCS27) (Figure 7 and Supplementary Table 11). Taken together, the results indicated that PeKCS5 was most targeted by four putative ped-miRNAs (ped-miR157a-5p, ped-miR164b-5, ped-miR319b, and ped-miR319l) belonging to four distant families, whereas the ped-miR166 family that targeted up to four PeKCS genes (PeKCS2, PeKCS24, PeKCS5, and PeKCS26) (Figure 7A and Supplementary Table 11). Network and schematic diagram of putative miRNA targeting sites of PeKCS genes shown in Figures 7A,B.
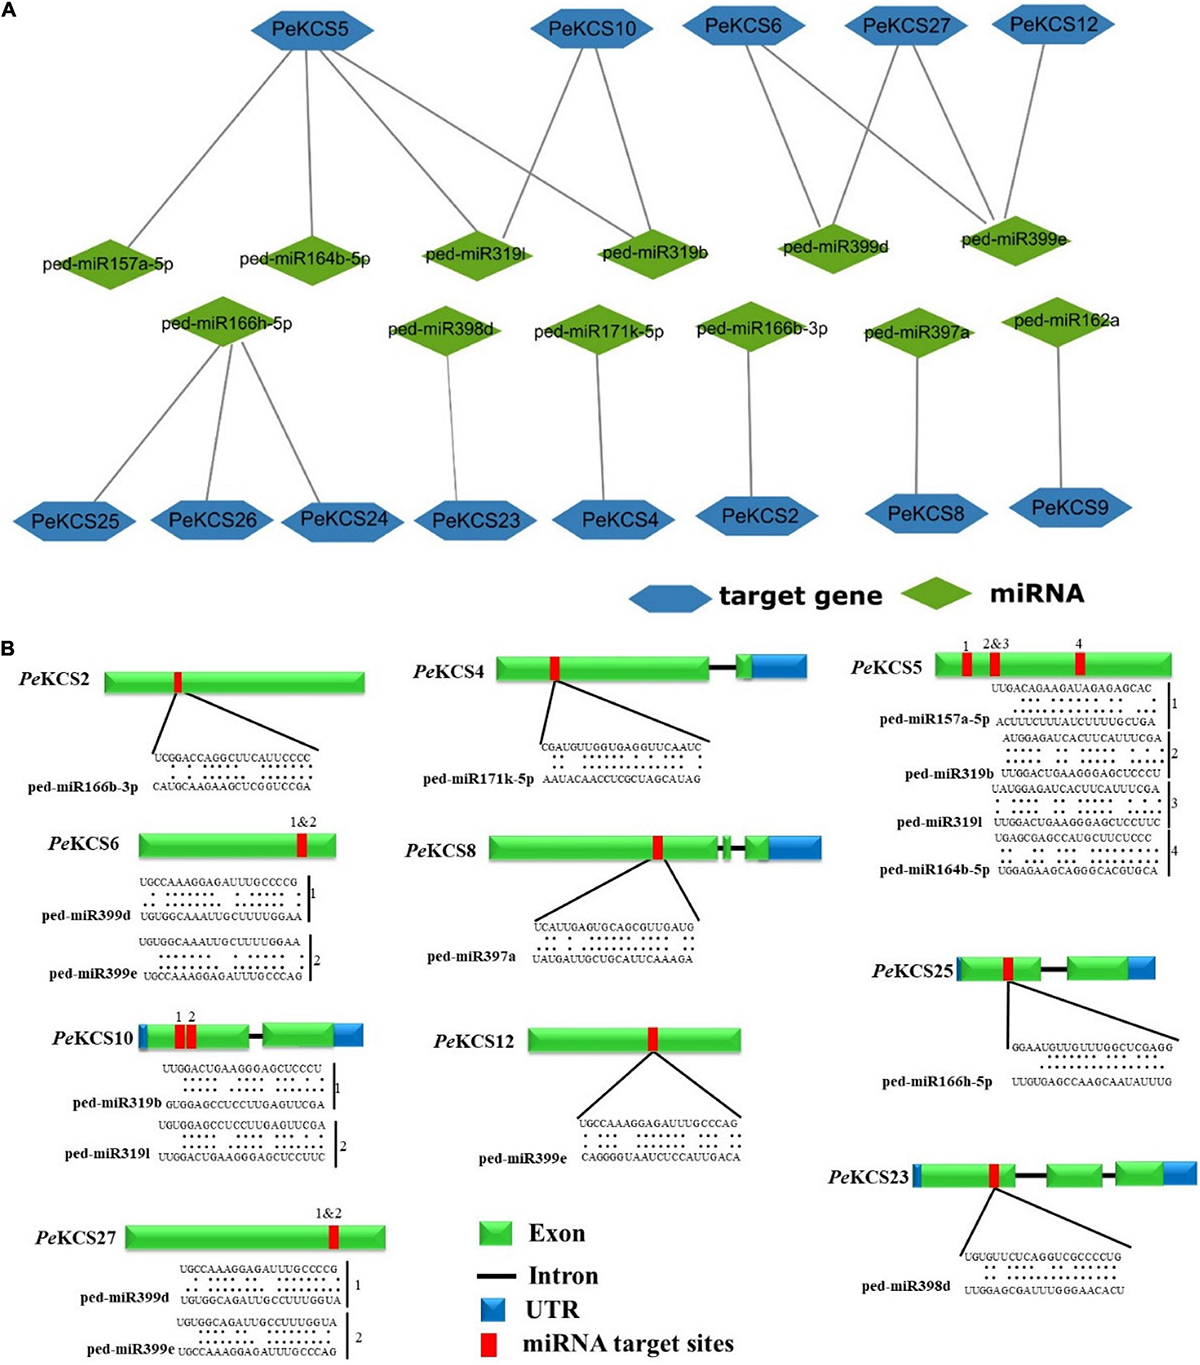
Figure 7. Predicted miRNAs targeting PeKCS genes. (A) Network illustration of predicted miRNA targeted PeKCS genes. Green ellipse shapes represent the predicted miRNAs and bluish hexagon shapes represent targeted PeKCS genes. (B) The schematic diagram indicates the PeKCS targeted by miRNAs and the putative miRNAs sites are indicated by red color, upper sequences are from the gene region and lower sequences are from the miRNAs (Supplementary Table 8 for detailed information of all the predicted miRNAs and targeted PeKCS genes).
Prediction of Transcription Factor Regulatory Network of PeKCS Genes
The potential TFs in the upstream region of (1000bp) of PeKCS genes were predicted and constructed the TF regulatory networks (Figure 8). The results showed that, overall, 1701 TFs were identified in 32 PeKCS genes belonging to 38 different TF families including ERF, AP2, GRAS, ARF, MYB, Dof, C2H2, TCP, LBD, bHLH, MIKC_MADS, BBR-BPC, and NAC (Figure 8 and Supplementary Table 12). The most abundant TF families were ERF (719 members), MYB (138 members), Dof (102 members), C2H2 (91 members), TCP (75 members), LBD (64 members), and bHLH (61 members) (Supplementary Table 12). Whereas the least abundant TF families were also identified contained only 1 member including WOX, EIL SRS, HSF, BES1, and S1Fa-like (Supplementary Table 12). All 32 PeKCS genes were predicted to be targeted by numerous TFs belonging to different families, for example, PeKCS32 was the most targeted with 547 TFs followed by PeKCS30 with 113, PeKCS24 with 76, PeKCS2 with 72, and PeKCS27 with 64 TFs. Whereas PeKCS10 and PeKCS22 were minimally targeted genes with only 10 and 9 TFs respectively (Figure 8 and Supplementary Table 12).
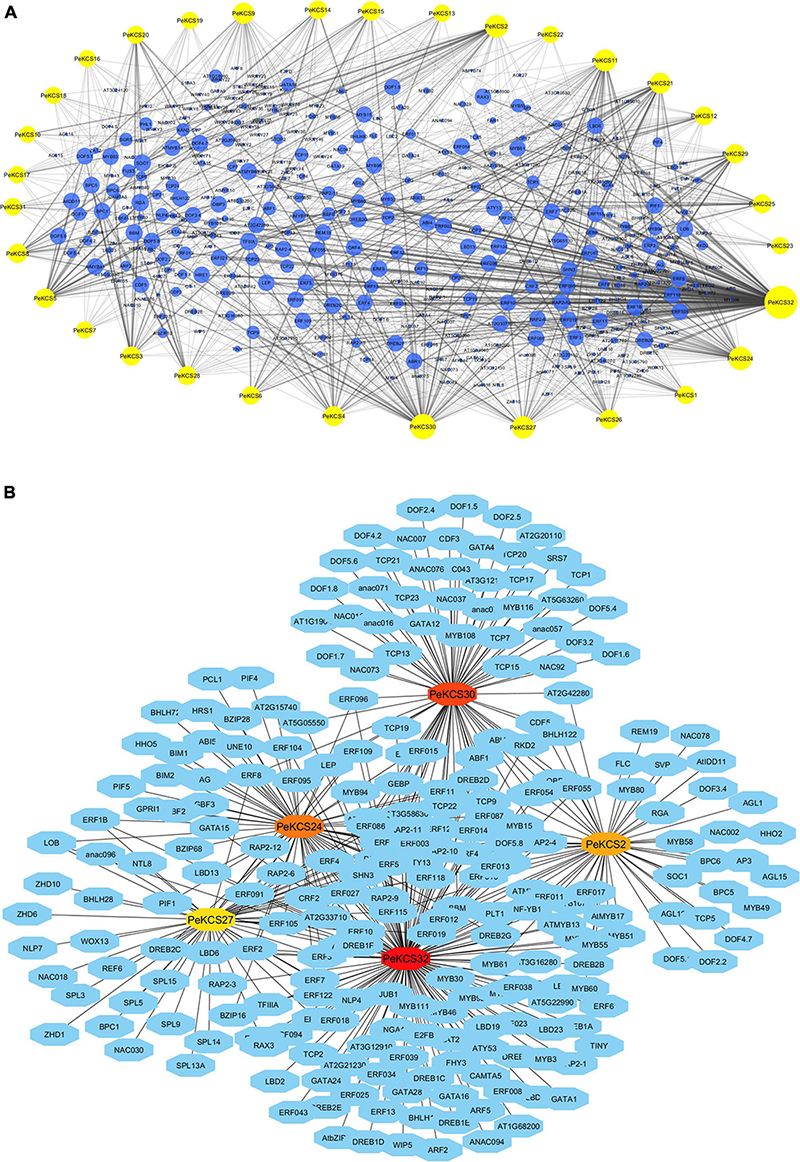
Figure 8. The putative transcription factor regulatory network analysis of PeKCS genes. (A) Bluish circular nodes represent transcription factors; yellow octagonal nodes represent PeKCS genes and node size represents the degree of interaction between nodes based on degree value. (B) The top 5 highly enriched and targeted PeKCS genes are shown, darker the color shows highly enriched. Transcriptional factors were predicted by PTRM online program and regulatory network was constructed using the Cytoscape 3.9 software.
Furthermore, a regulatory network of TFs for the top five PeKCS genes was constructed based on their degree of interaction, and the results showed that PeKCS32 was highly targeted, followed by PeKCS30, PeKCS24, PeKCS2, and PeKCS27 (Figure 8B and Supplementary Table 12). PeKCS genes were targeted with numerous members of different TF families such as PeKCS32 was enriched in ERF (412), LBD (40), and MYB (27) family members, PeKCS30 was enriched in ERF (38), TCP (20), and NAC (16) family members. PeKCS2 has enriched ERF (17), MYB (14), and MIKC_MADS (13) family members (Figure 8B and Supplementary Table 12). Overall, the ERF family was found to be dominant in all TF families. The TFs regulatory network of all the 32 PeKCS genes are shown in Figure 8A, and the networks of the top five highly enriched PeKCS genes are shown in Figure 8B, respectively and more details can be found in Supplementary Table 12. The different fatty acids and defense-related TFs belonging to different families were identified in the present study including ERF, AP2, bHLH, WRKY, and MYB. TFs involved in plant growth and development including TCP, bHLH, BBR-BPC, WRKY, LBD, and AP2 were also found in PeKCS genes. In addition, phytohormone-related TFs were also identified, including ERF and ARF. Interestingly, ERF, MYB, and AP2 TFs were shown to be universally distributed in most of the PeKCS genes (Figure 8 and Supplementary Table 12).
Gene Ontology and Kyoto Encyclopedia of Genes and Genomes Enrichment Analysis of PeKCS Genes
Gene ontology and KEGG annotation analysis of the PeKCS gene was performed to further understand the possible roles of PeKCS genes in molecular function (MF), cellular component (CC), and biological process (BP) at the molecular levels. The details of annotation results and numerous significantly enriched terms for MF, CC, and BP have been provided in Supplementary Tables 13a,b. Seventeen terms were identified in 32 PeKCS genes belonging to GO-MF class, among which four terms were highly enriched including fatty acid synthase activity (GO:0004312), fatty acid elongase activity (GO:0009922), and acyltransferase activity (GO:0016746, GO:001674747) (Figure 9A and Supplementary Table 13). The GO enrichment analysis showed that GO-CC class exhibited thirty-one terms in 32 PeKCS genes, and seven terms were highly enriched including endoplasmic reticulum (GO:0005783), endomembrane system (GO:0012505), obsolete cytoplasmic part (GO:0044444), membrane-bounded organelle (GO:0043227), and organelle membrane (GO:0031090) (Figure 9A and Supplementary Table 13).
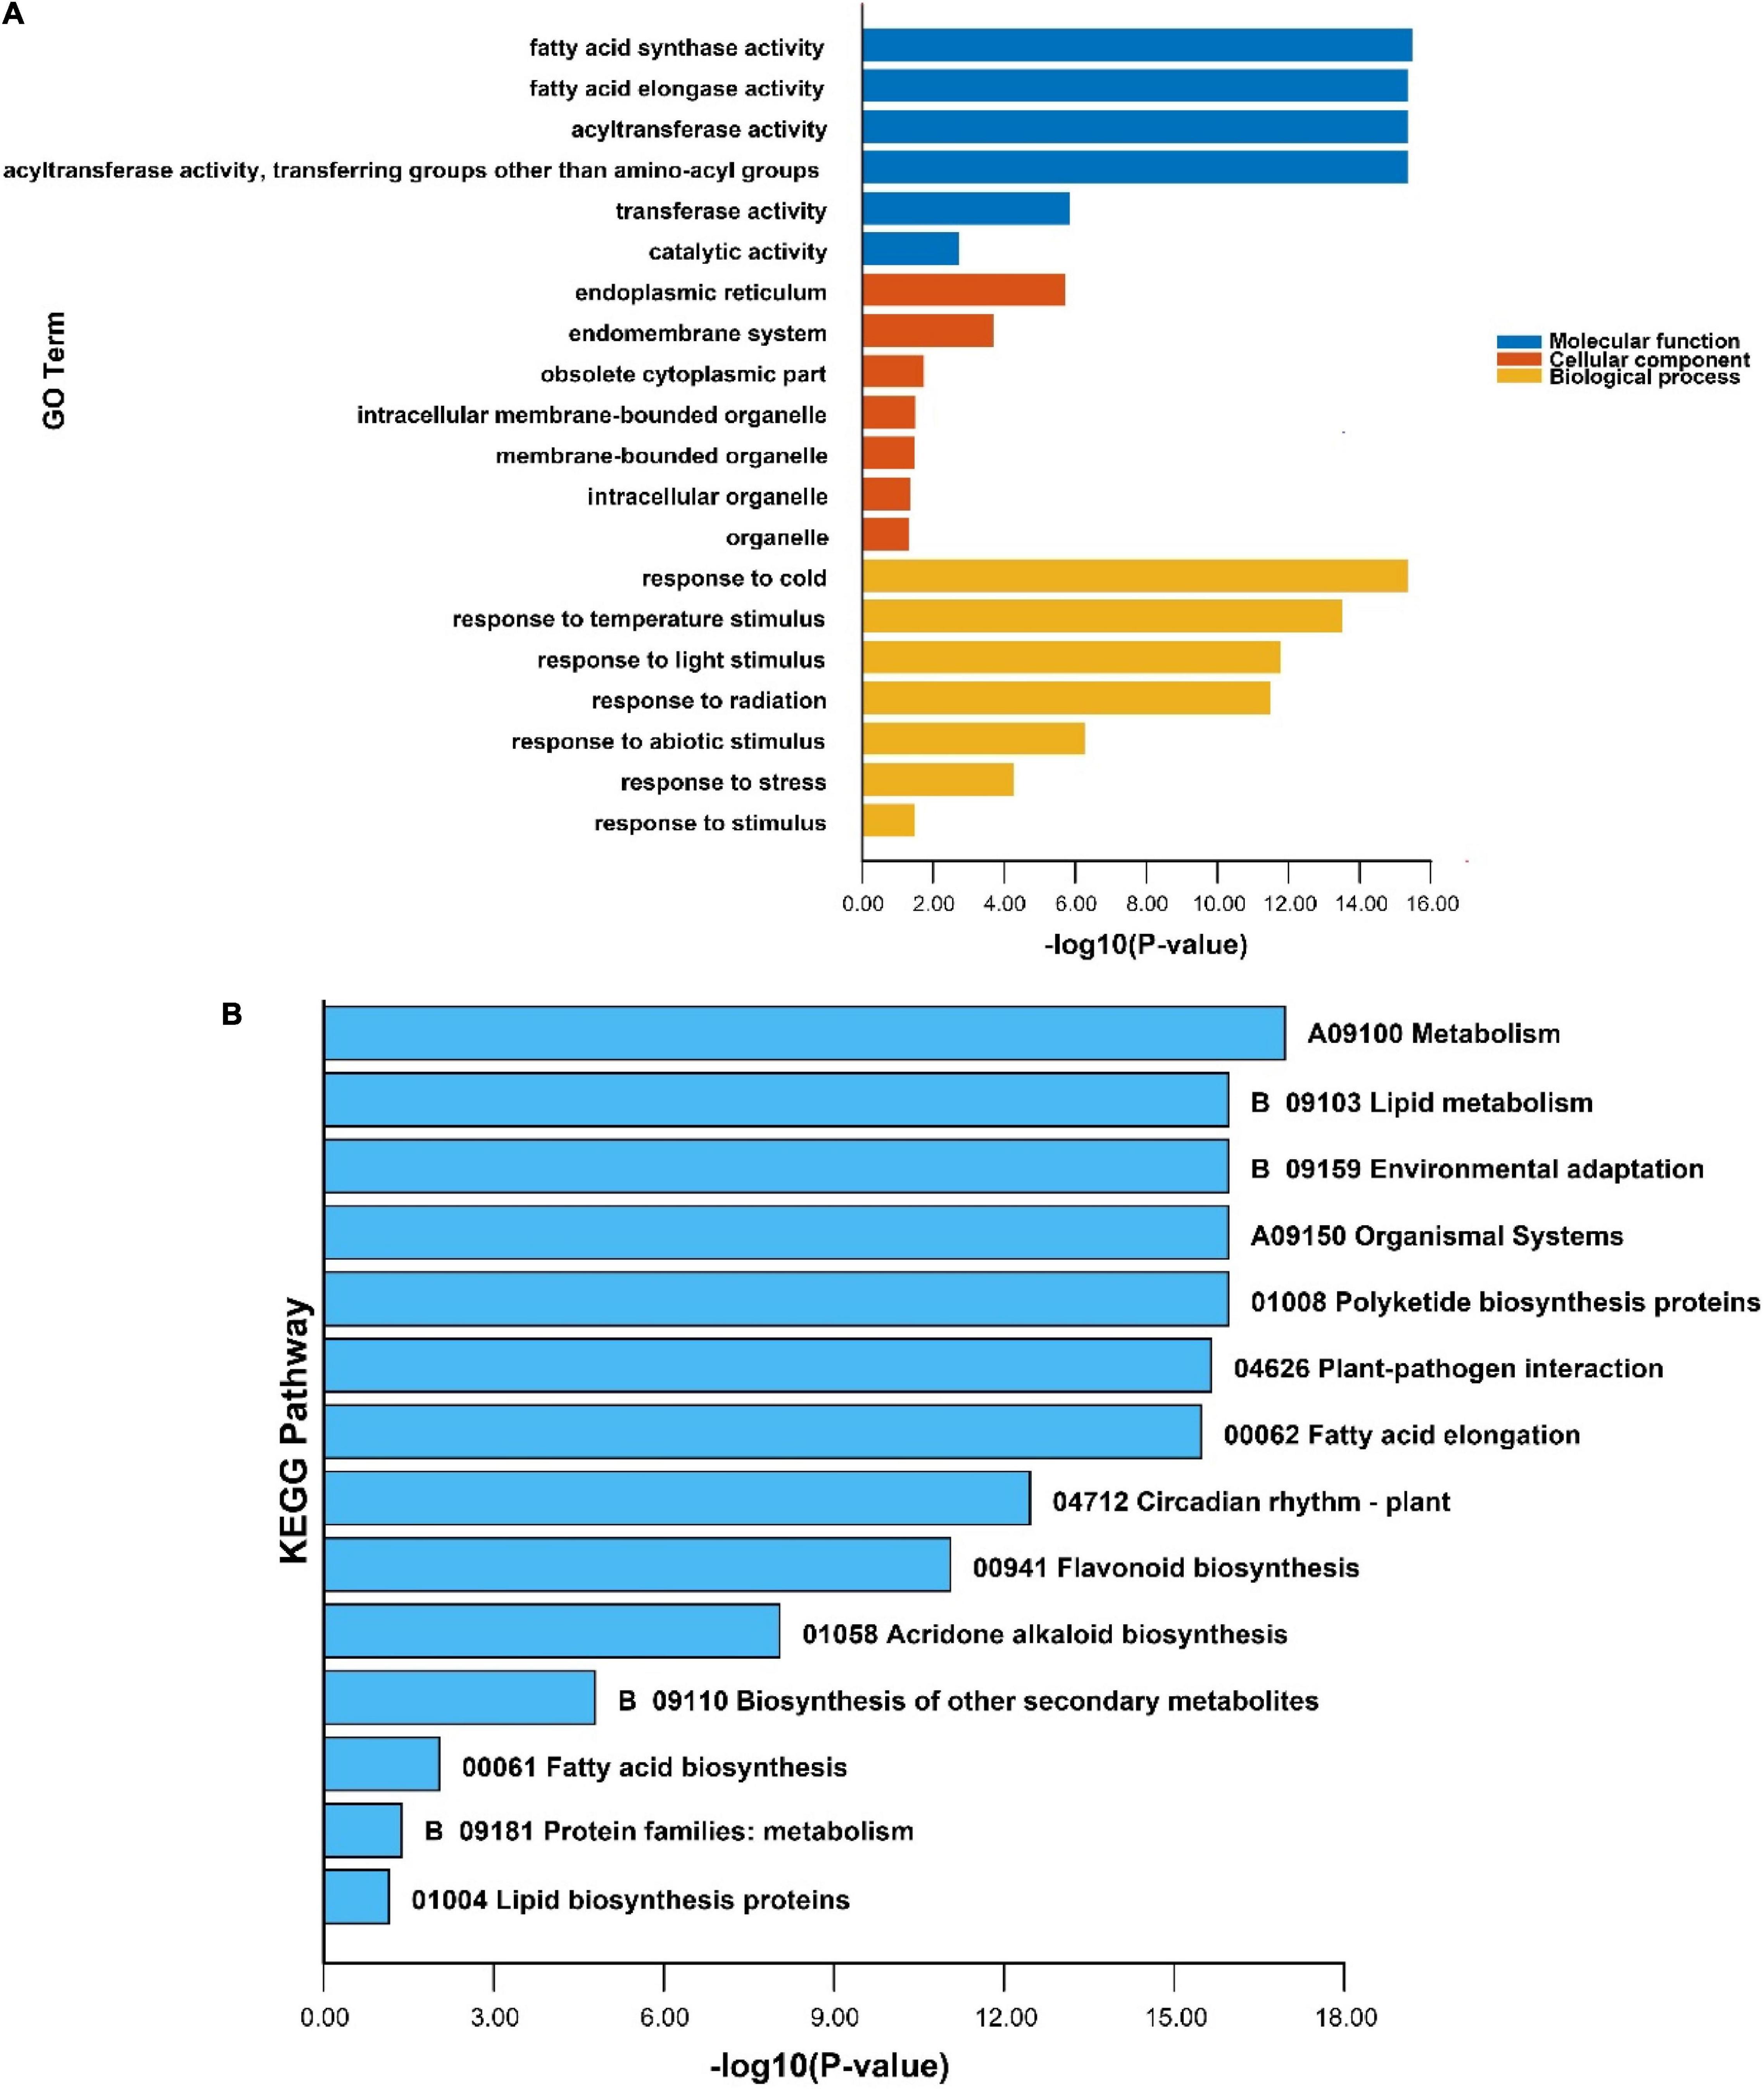
Figure 9. GO and KEGG enrichment analysis of PeKCS genes. (A) The highly enriched GO terms in PeKCS genes. (B) The highly enriched KEGG pathways in PeKCS genes. Details about GO annotation, enrichment and terms of MF, CC, BP, and KEGG pathways can be found in Supplementary Tables 11, 13a,b.
For instance, the maximum number of sixty-seven terms were identified in GO-BP class and six terms were highly enriched including response to cold (GO:0009409), response to temperature stimulus (GO:0009266), response to light stimulus (GO:0009416), response to radiation (GO:0009314), response to abiotic stimulus (GO:0009628) and response to stress (GO:0006950) (Figure 9A and Supplementary Table 13). Taken together, the enrichment and annotation results revelated that biological class terms were highly enriched followed by the cellular class in PeKCS genes. In addition, KEGG pathway enrichment analysis revealed that 15 pathways were predicted to be involved in different functions among the 32 PeKCS genes. Among the predicted KEGG pathways, the highly enriched pathways are presented in Figure 9B, including metabolism (A09100), lipid metabolism (B09103), environmental adaptation (B09159), organismal systems (A09150), polyketide biosynthesis proteins (01008), plant-pathogen interaction (04626), fatty acid elongation (00062) and circadian rhythm (04712) respectively (Figure 9B and Supplementary Table 4). In conclusion, the GO and KEGG enrichment analysis suggests that PeKCS genes may play important roles in different biological, molecular, and cellular processes including metabolism, fatty acid biosynthesis, and responses to different biotic and abiotic stresses.
Subcellular Localization of PeKCS2 Gene
The subcellular localization of all 32 PeKCS genes was hypothetically predicted using the online CELLO version 2.5 program. All 32 PeKCS genes were expected to localize to the plasma membrane (Table 1). To validate the hypothesized predicted results, PeKCS2 was used to perform a transient expression assay in onion epidermal cells. The CaMV35S-PeKCS2-GFP fusion construct was transformed into onion epidermal cells by the agroinfiltration method for transient expression assays (Xu et al., 2014). GFP expression was observed and results showed that GFP signals were highly expressed in the plasma membrane (Figures 10d–f). However, the empty vector CaMV35S-GFP was used as a control and the results showed that the GFP was dispersed throughout the cell (Figures 10a–c). The PeKCS2 subcellular localization results were consistent with the hypothesized predictions.
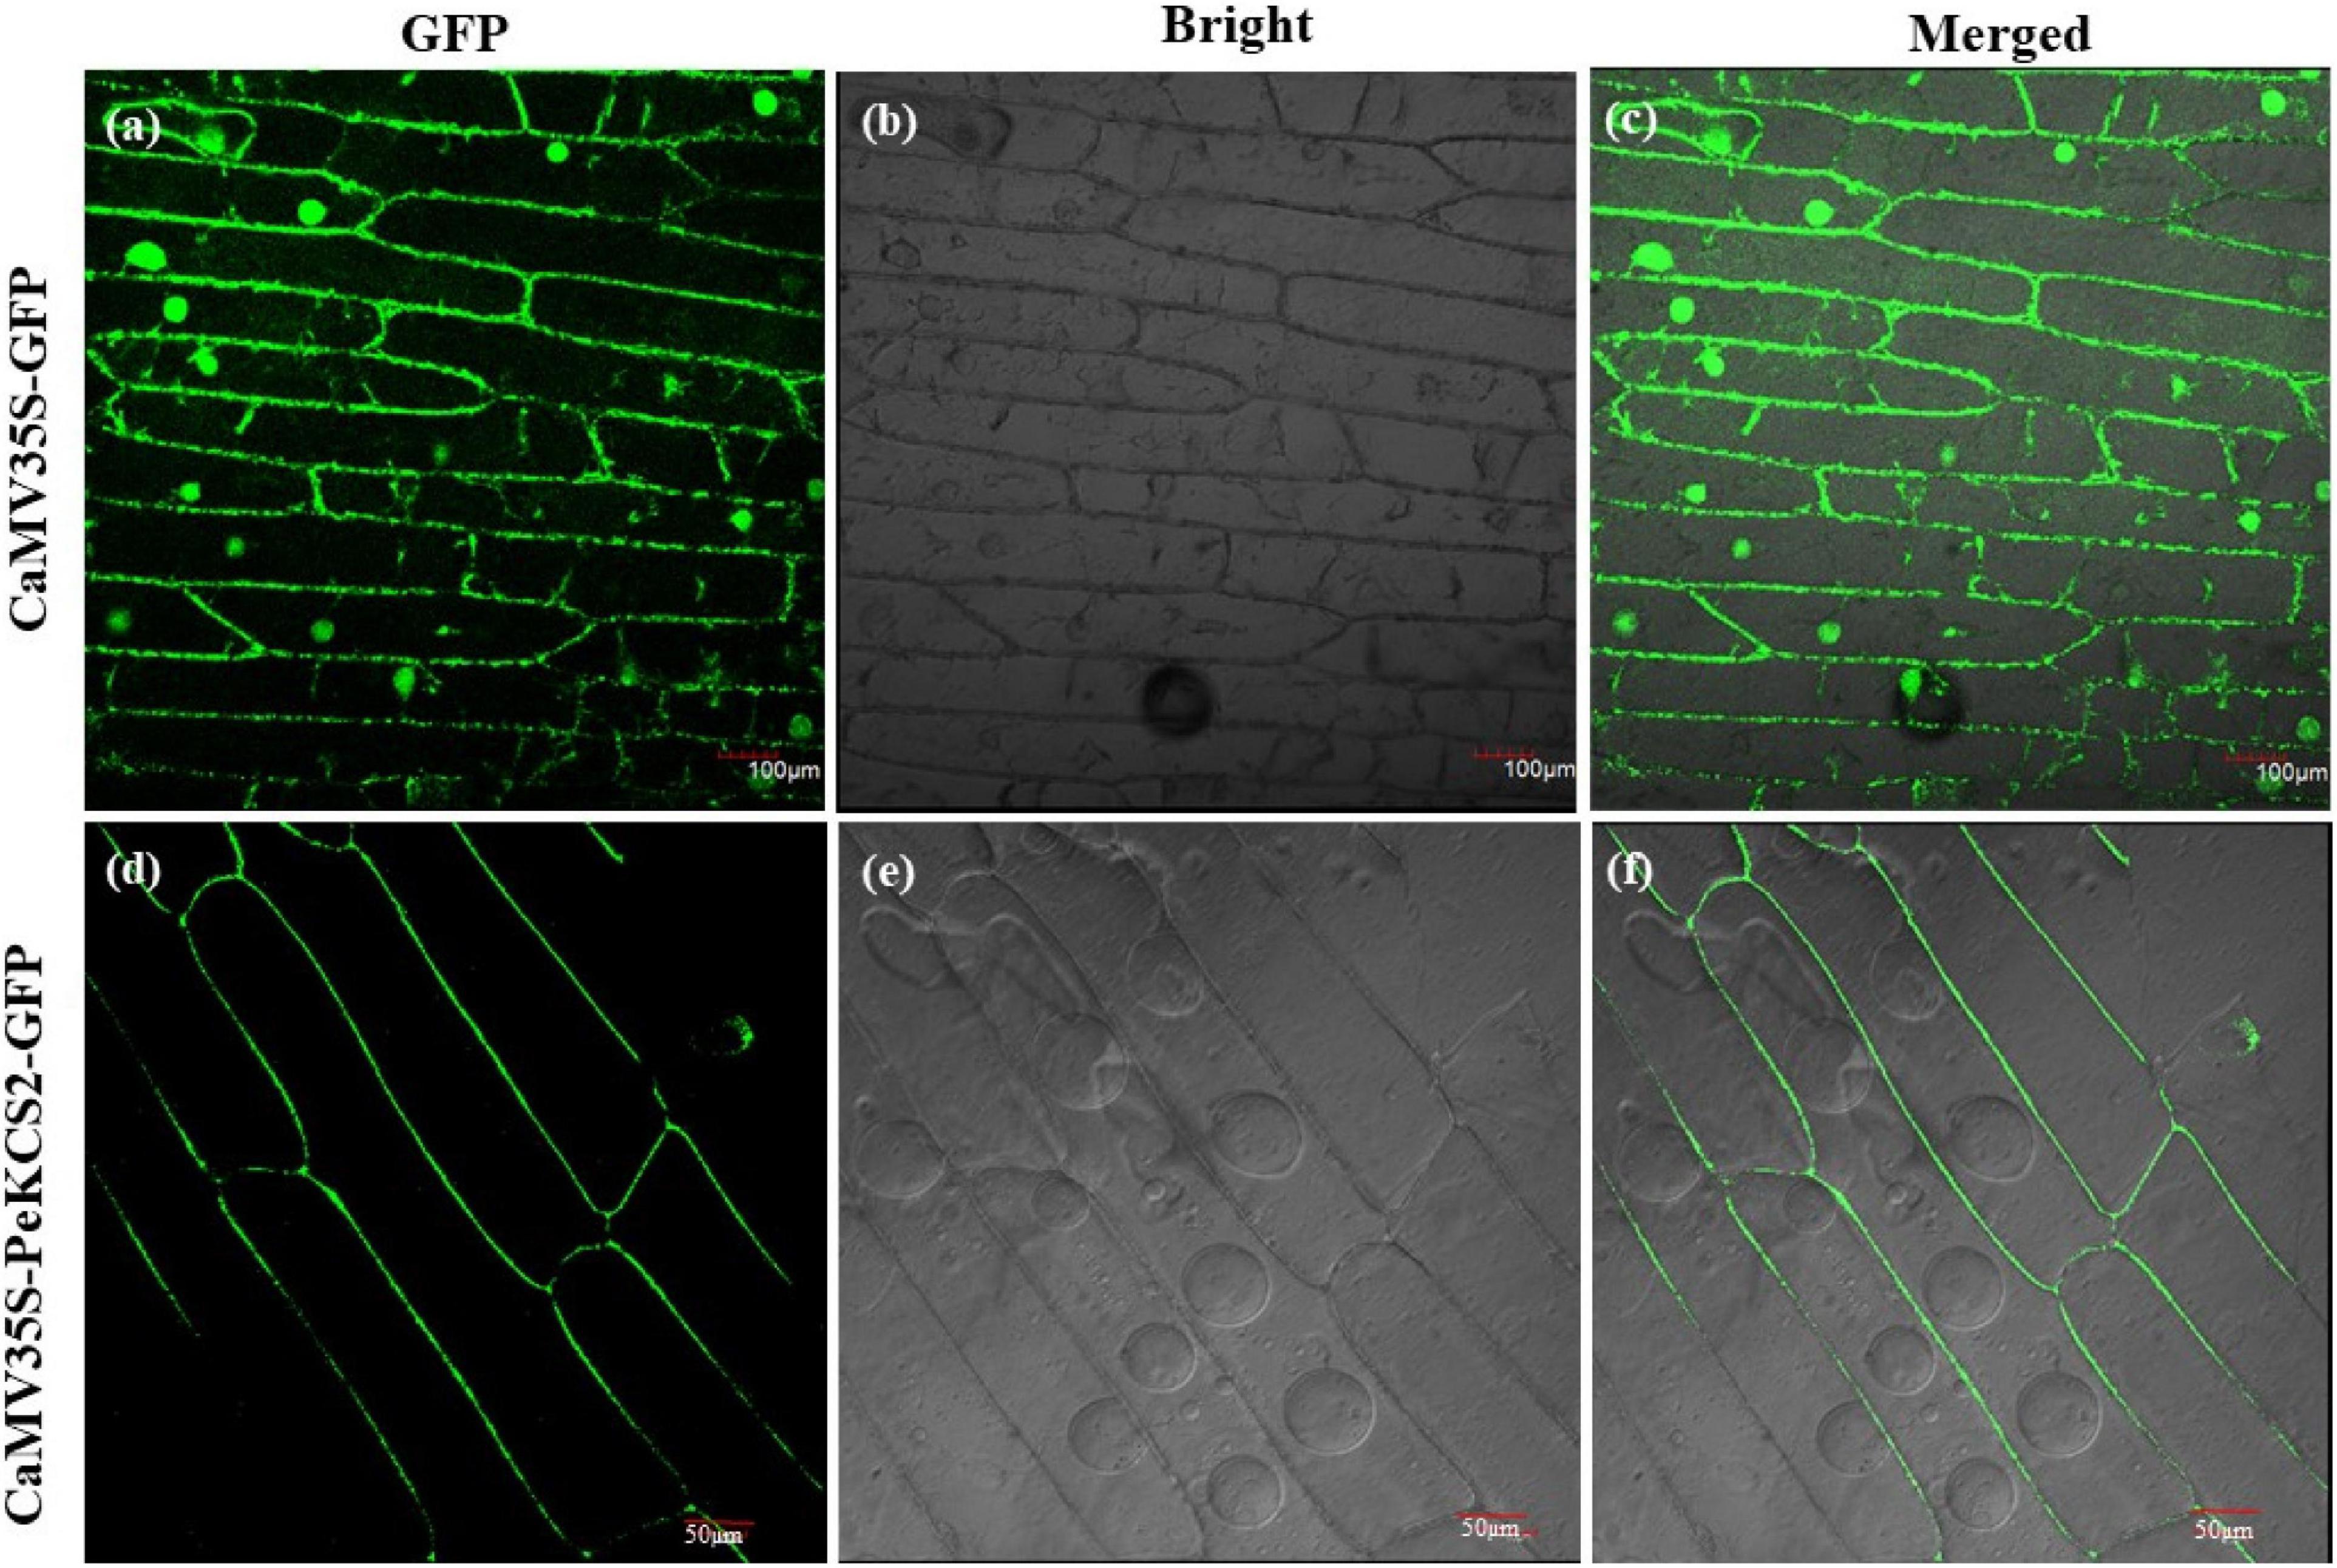
Figure 10. Subcellular localization of GFP-fused PeKCS2 protein based on transient expression in onion epidermal cells. (a–c) Onion cells transformed with CaMV35S–GFP as control (scale bar = 100 μm). (d–f) Onion cells transformed with CaMV35S-PeKCS2-GFP (scale bar = 50 μm). (b,e) Onion epidermal cells under bright light. (a–d) GFP signal under dark field. (c,f) represent merged of (a,b), and (d,e), respectively. The transiently expressed in inner epidermis of onion was observed by laser scanning confocal microscopy (Olympus, Japan) after 24 h.
Expression Profiles of PeKCS Genes at Different Fruit Developmental Stages
The expression profiles of all 32 PeKCS genes in the pulp tissue of yellow and purple cultivars at different fruit development stages (fruitlet stage, green stage, veraison stage, and ripening stage) based on FPKM values were evaluated. The FPKM expression values have been provided in Supplementary Table 15. The FPKM values were transformed to log2 and a circular heatmap was generated by Tbtools software (Figure 11A and Supplementary Table 15). The expression profiles of PeKCS genes varied at different fruit developmental stages among both cultivars. Overall, 30 of the 32 PeKCS genes were expressed during different fruit developmental stages in both cultivars except PeKCS31 and PeKCS32. In the yellow cultivar, out of the 30 PeKCS expressed genes, 28 (87%), 27 (84%), 24 (75%), and 22 (68%) genes were expressed at fruitlet, green, veraison, and ripening stages. In terms of expression patterns, 14 (50%) genes were highly expressed (FPKM > 10) at the fruitlet stage, 5 (18%) genes at the green stage, 8 (20%) genes at the veraison stage, and 10 (18%) genes at ripening stage. In the comparison of different developmental stages and genes, the expression pattern of PeKCS30 (FPKM = 356.7) was highest at the green stage, followed by PeKCS10 (FPKM = 324.52) at the fruitlet stage, PeKCS30 (FPKM = 233.51) at veraison, and PeKCS30 (FPKM = 96.12) at the ripening stage. Only one PeKCS13 gene expression was constantly increased during fruitlet (FPKM = 4.71) to ripening stage (FPKM = 23.68), while the expression patterns of five genes (PeKCS17, PeKCS19, PeKCS21, PeKCS22, and PeKCS28) decreased during fruitlet (FPKM = 69.22, 24.43, 13.16, 14.11, and 20.59) to ripening stages (FPKM = 2.77, 0.6, 3.72, 3.6, and 3.68) (Figure 11A and Supplementary Table 15). Interestingly, three genes had a constant high expression pattern in the four fruit development stages of yellow cultivar, including PeKCS1 (FPKM = 17–55.62), PeKCS10 (FPKM = 13.73–324.52), and PeKCS30 (FPKM = 96.12–356.70) (Figure 11A and Supplementary Table 15).
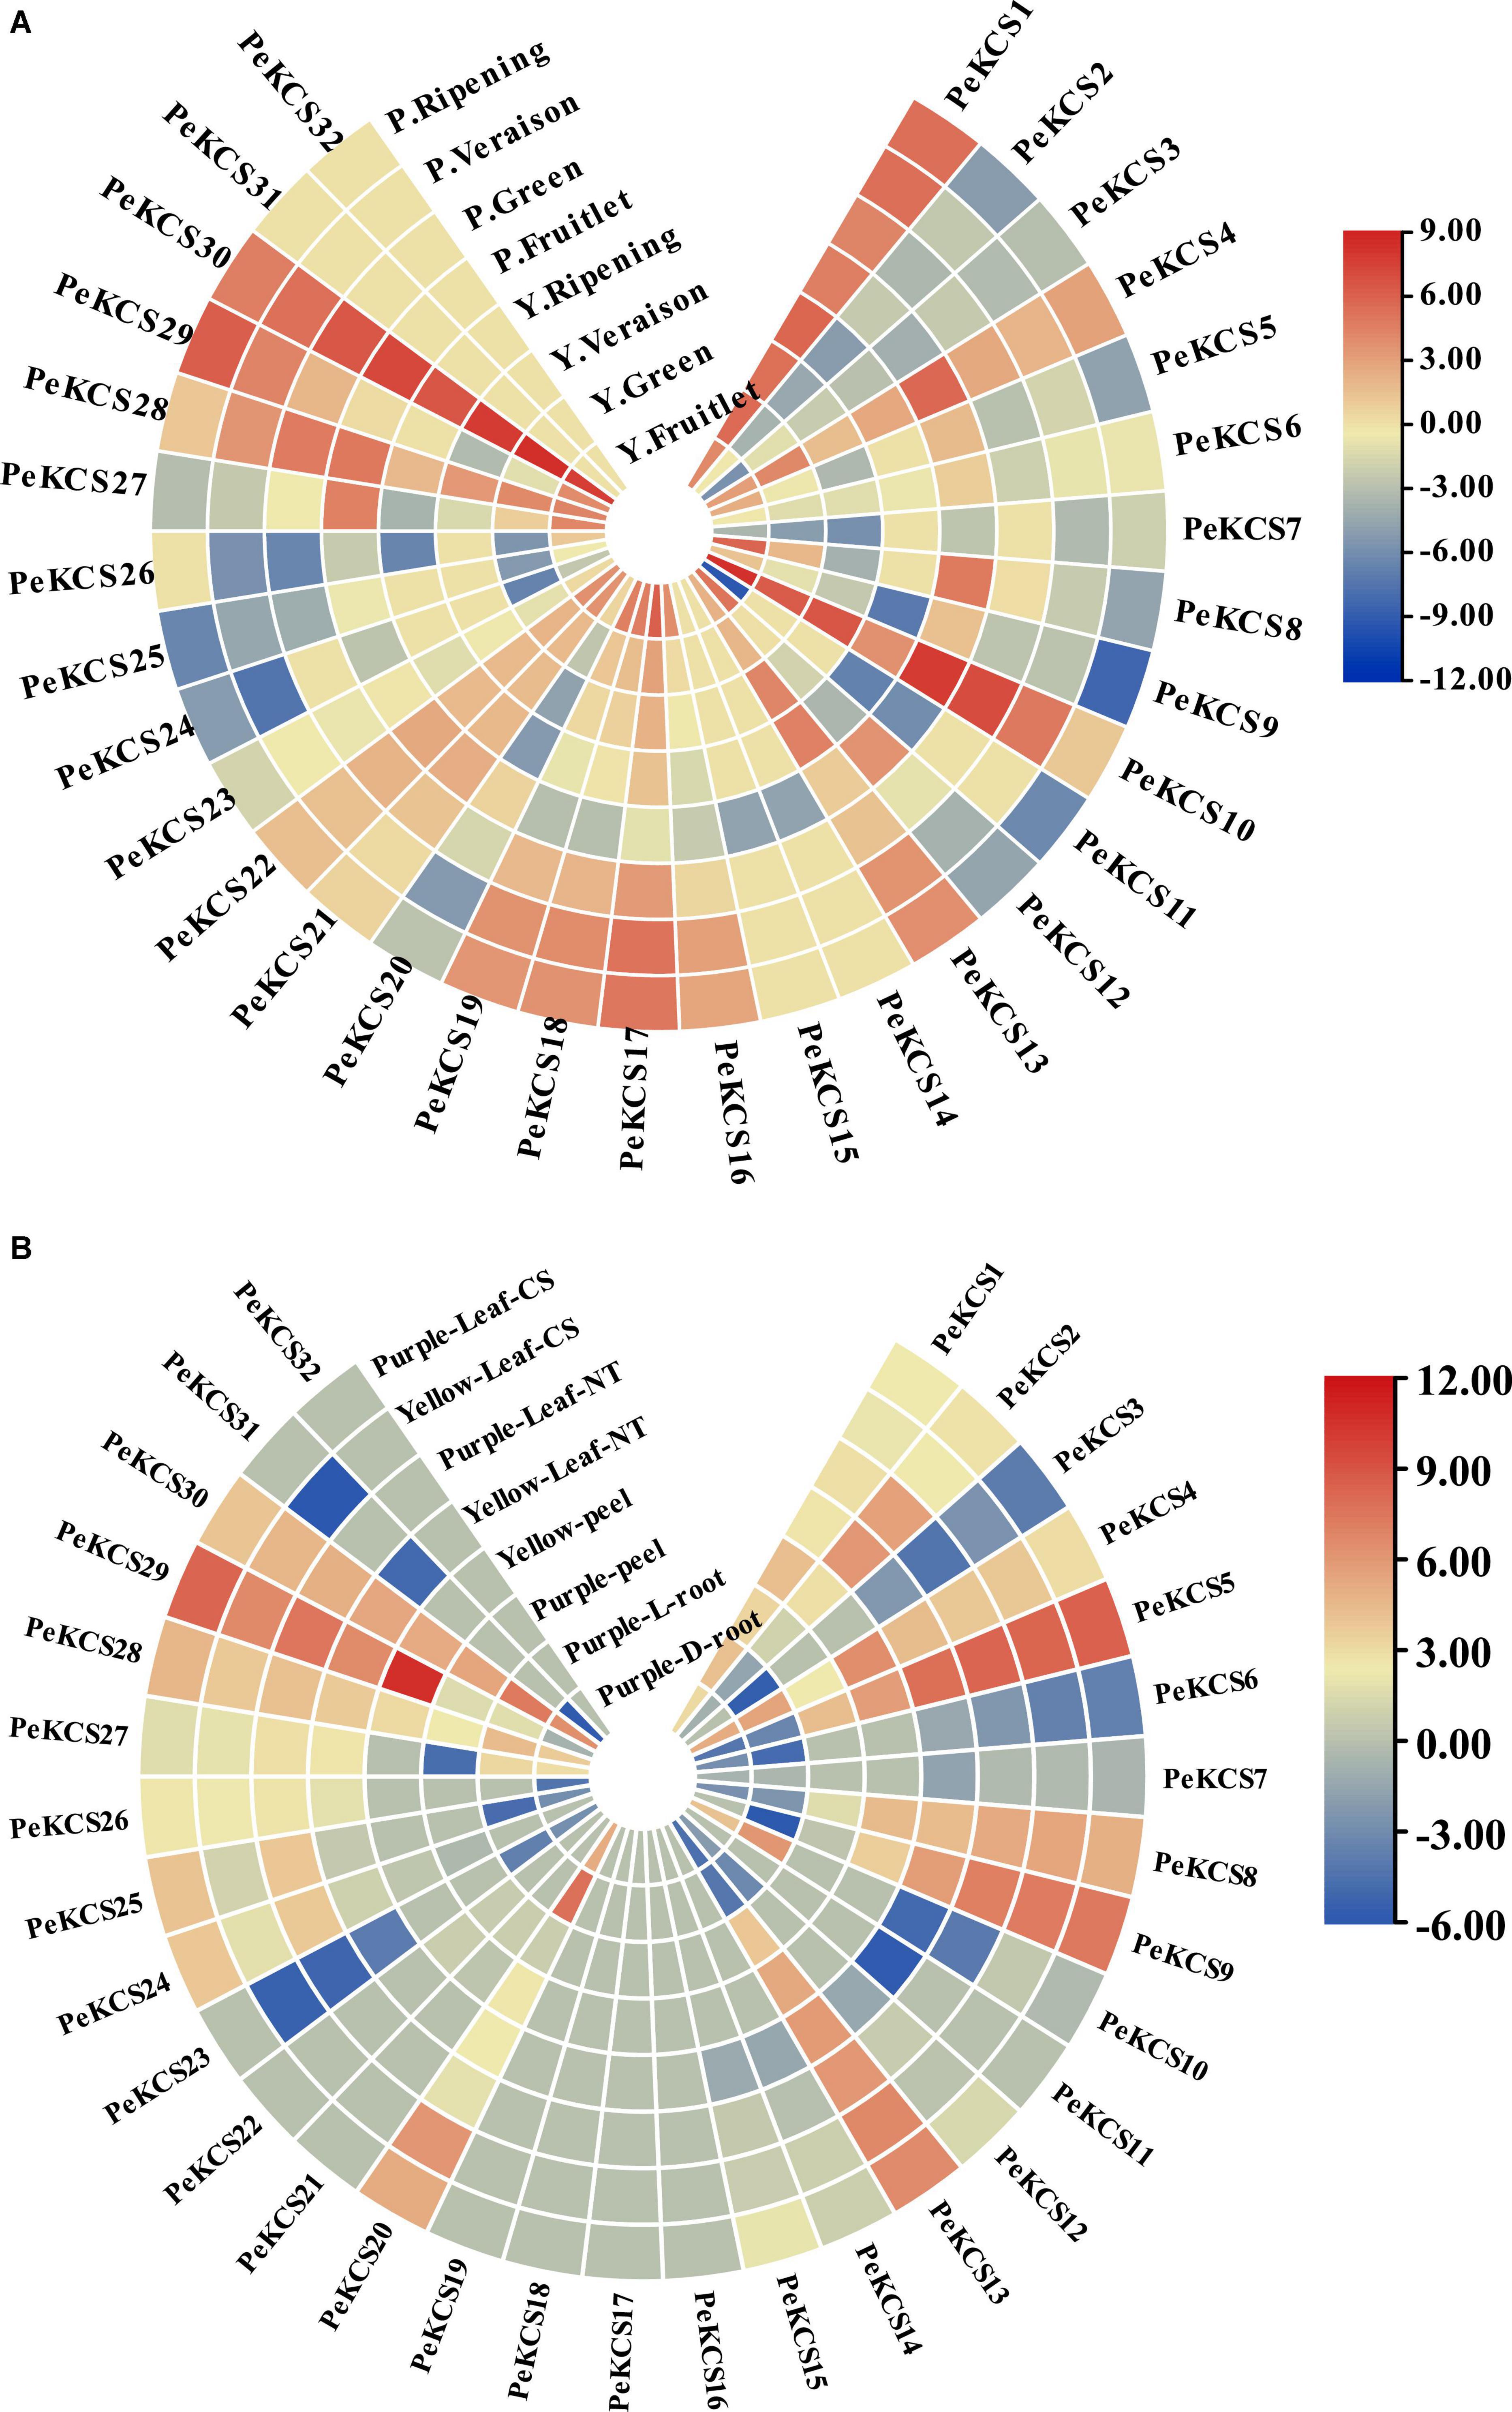
Figure 11. Circular heatmap showing the expression profiles of PeKCS genes in pulp, root, peel, and leave tissues of yellow and purple cultivar under different conditions. (A) PeKCS expressions in pulp of yellow and purple passion fruit cultivars at different developmental stages. (B) PeKCS genes expressions in root, peel, and leaves of yellow and purple passion fruit cultivars under different conditions. Y and L represents the yellow (Y) and purple (P) passion fruit cultivars. L and D represents the samples from limestone (L) and sandy dolomite (D) rocky desertification areas. The NT and CS indicate the normal temperature (NT) and chilling stress (CS) conditions. Fragments per kilobase per million (FPKM) values of PeKCS genes all tissues were transformed by log2 and heatmap was constructed by TBTools software (the red color shows the highest and the blue color shows lowest expression levels in expression bar).
In the purple cultivar, overall, 30 (93%) PeKCS genes were expressed at the fruitlet stage, 25 (78%) at the green stage, 27 (84%) at veraison and ripening stages. Among them, 8 (26%) genes were highly expressed (FPKM > 10) at fruitlet, 5 (20%) at the green, 9 (33%) at veraison, and 7 (26%) at ripening stages. PeKCS10 exhibited the highest expression pattern (FPKM = 231.18) at the fruitlet stage, followed by green stage (FPKM = 130.89), PeKCS29 (FPKM = 74.68) at the veraison stage, and PeKCS1 (FPKM = 43.24) at the ripening stage. The expression patterns of 6 genes (PeKCS13, PeKCS16, PeKCS17, PeKCS18, PeKCS19, and PeKCS19) showed an increased trend from small fruitlet (FPKM = 0.1–1.1) to ripening stage (FPKM = 7.0–74.68), while 3 genes (PeKCS10, PeKCS27, and PeKCS28) decreased expression pattern from fruitlet (FPKM = 23.07–231.18) to ripening stage (FPKM = 0.11–2.3). Remarkably, PeKCS1 had a constant high expression pattern in the four fruit development stages of the purple cultivar (FPKM = 25.96–42.53) (Figure 11A and Supplementary Table 15).
In the comparison of PeKCS genes between the tested stages, PeKCS1 and PeKCS30 showed similar higher expressions (FPKM > 10) (Figure 11A and Supplementary Table 15). In the yellow cultivar, the green stage exhibits to have the highest expressions (FPKM = 324.52), whereas in purple the fruitlet stage showed the highest expressions (FPKM = 231.18). Overall, the yellow cultivar had higher expression levels and maximum genes with higher expression patterns compared to the purple cultivar. In addition, the yellow cultivar had decreased an expression pattern (5 genes) from fruitlet to ripening, while purple had increased expression patterns (6 genes) from fruitlet to ripening stages. These findings suggest that PeKCS genes may have significant roles in fruit development and ripening stages in both cultivars and further research is still needed (Figure 11A and Supplementary Table 15).
Expression Pattern of PeKCS Genes in Different Passion Fruit Tissues
The expression profiles of PeKCS genes in the root, stem, and peel tissues of yellow and purple passion fruit cultivars under different conditions were evaluated in FPKM values, and have been provided in Supplementary Table 16. The expression profiles of PeKCS genes in root tissue of the purple, leaf, and peel tissues of yellow cultivars were evaluated in FPKM values and visualized in circular heatmaps by converting to log2 values (Figure 11B and Supplementary Table 16). The expression profiles of PeKCS genes varied in different tissues among both cultivars. Overall, out of 32 PeKCS genes, 19 (59%) PeKCS genes were expressed in purple L and D root tissues, and 15 (46%) PeKCS genes were expressed in yellow and purple peel tissues. In contrast, 23 (72%) PeKCS genes were expressed in purple leaf NT condition, 25 (78%) in yellow leaf NT, 22 (69%) in purple leaf CS, and 24 (75%) genes were expressed in yellow leaf CS conditions respectively (Figure 11B and Supplementary Table 16). Among the expressed PeKCS genes in roots, 6 (31%) and 5 (26%) genes were highly expressed (FPKM > 10) in L and D roots. Roots under the L condition had the highest expression (PeKCS20, FPKM = 213.63) compared to roots in the L condition (FPKM = 82.58, PeKCS30) (Figure 11B and Supplementary Table 16).
Among the genes expressed in the peel, 8 (53%) and 3 (20%) PeKCS genes showed high expressions (FPKM > 10) in purple and yellow peels. Whereas, the purple peel was highly expressed (PeKCS29, FPKM = 1692.94) compared to yellow peel (PeKCS30, FPKM = 41.97). Under two different conditions (NT and CS), the expression profiles of PeKCS genes varied in leaf tissue of both cultivars such as 11 (48%) genes were highly expressed (FPKM > 10) in purple leaf-NT condition, 9 (36%) genes in yellow leaf-NT, 10 (45%) genes in purple leaf-CS and 9 (37%) genes in yellow leaf-CS conditions. Comparing both cultivars under NT and CS conditions, purple leaves under CS had the highest expression (FPKM = 359.34, PeKCS5), followed by yellow CS leaves (FPKM = 306.76, PeKCS5), purple NT leaves (FPKM = 303.78, PeKCS5), and yellow NT leaves (FPKM = 226.04, PeKCS5) (Figure 11B and Supplementary Table 16). Taken together, purple had the higher expression in all the tested tissues, whereas, in comparison between tissues, the peel was found to have the highest expression (FPKM = 1692.94, PeKCS29) followed by leave tissues (FPKM = 359.34, PeKCS5) and root (FPKM = 213.63, PeKCS20) (Figure 11B and Supplementary Table 16). Five genes (PeKCS16, PeKCS17, PeKCS18, PeKCS19, and PeKCS32) were not expressed in all tissues (leave, peel and root) indicating that they might not involve in passion fruit growth and development. These results indicate that PeKCS genes have specific expression patterns in all tested tissues and genes with the highest expressions (PeKCS5, PeKCS29, and PeKCS30) might play an important role in specific functions, but further research is required. These genotype-based tissue expression patterns provide ideas for further study of the PeKCS gene family in passion fruit.
Expression Profiles of PeKCS Genes Under Drought Stress Condition
The functional characterization of KCS genes has not been studied in passion fruit. Gene expression profiles can provide a reflection of gene function. In the current study, the expression profiles of ten candidate PeKCS genes were evaluated by qRT-PCR under drought stress conditions (Figure 12). In general, the expression profiles of all candidate PeKCS genes showed different expression levels in the stem, leave and root tissues of yellow and purple cultivars under drought conditions. Overall, the results showed that the expression levels of most genes were increased under drought conditions in leave and root tissues compared to controls. The relative expression level of the PeKCS20 gene was highest with a more than 29-fold increase in yellow roots under drought conditions (Figure 12G). However, under drought conditions, the relative expression levels of PeKCS13 and PeKCS27 in yellow and purple leaves increased by more than 10 and 8-folds, respectively (Figures 12F,H). Whereas, relative expressions of PeKCS1 decreased in most tissues under drought conditions (Figure 12A). On the contrary, the relative expression levels of PeKCS4 and PeKCS8 increased by more than 4 and 3-folds in yellow leaves, and all other tissues decreased. Interestingly, PeKCS2 showed an increased relative expression in yellow and purple leaves more than 2.5 folds under drought (Figure 12B). Except for PeKCS9 and PeKCS20, the relative expression levels of most genes decreased in the stem tissue of the yellow cultivar. The relative expression of PeKCS28 was increased by more than 4 and 3-folds in yellow leaves and purple roots under drought conditions (Figure 12I). All the yellow tissues showed decreased relative expression levels in PeKCS29, while increased in purple tissues under drought conditions (Figure 12J). The leave tissue showed the highest expression consistent with the FPKM expression values (Figure 12 and Supplementary Table 16). Taken together, the results indicated that PeKCS genes responded to external drought stress conditions by increasing or decreasing their expression levels in different tissues of the two cultivars, which provided evidence for further functional studies.
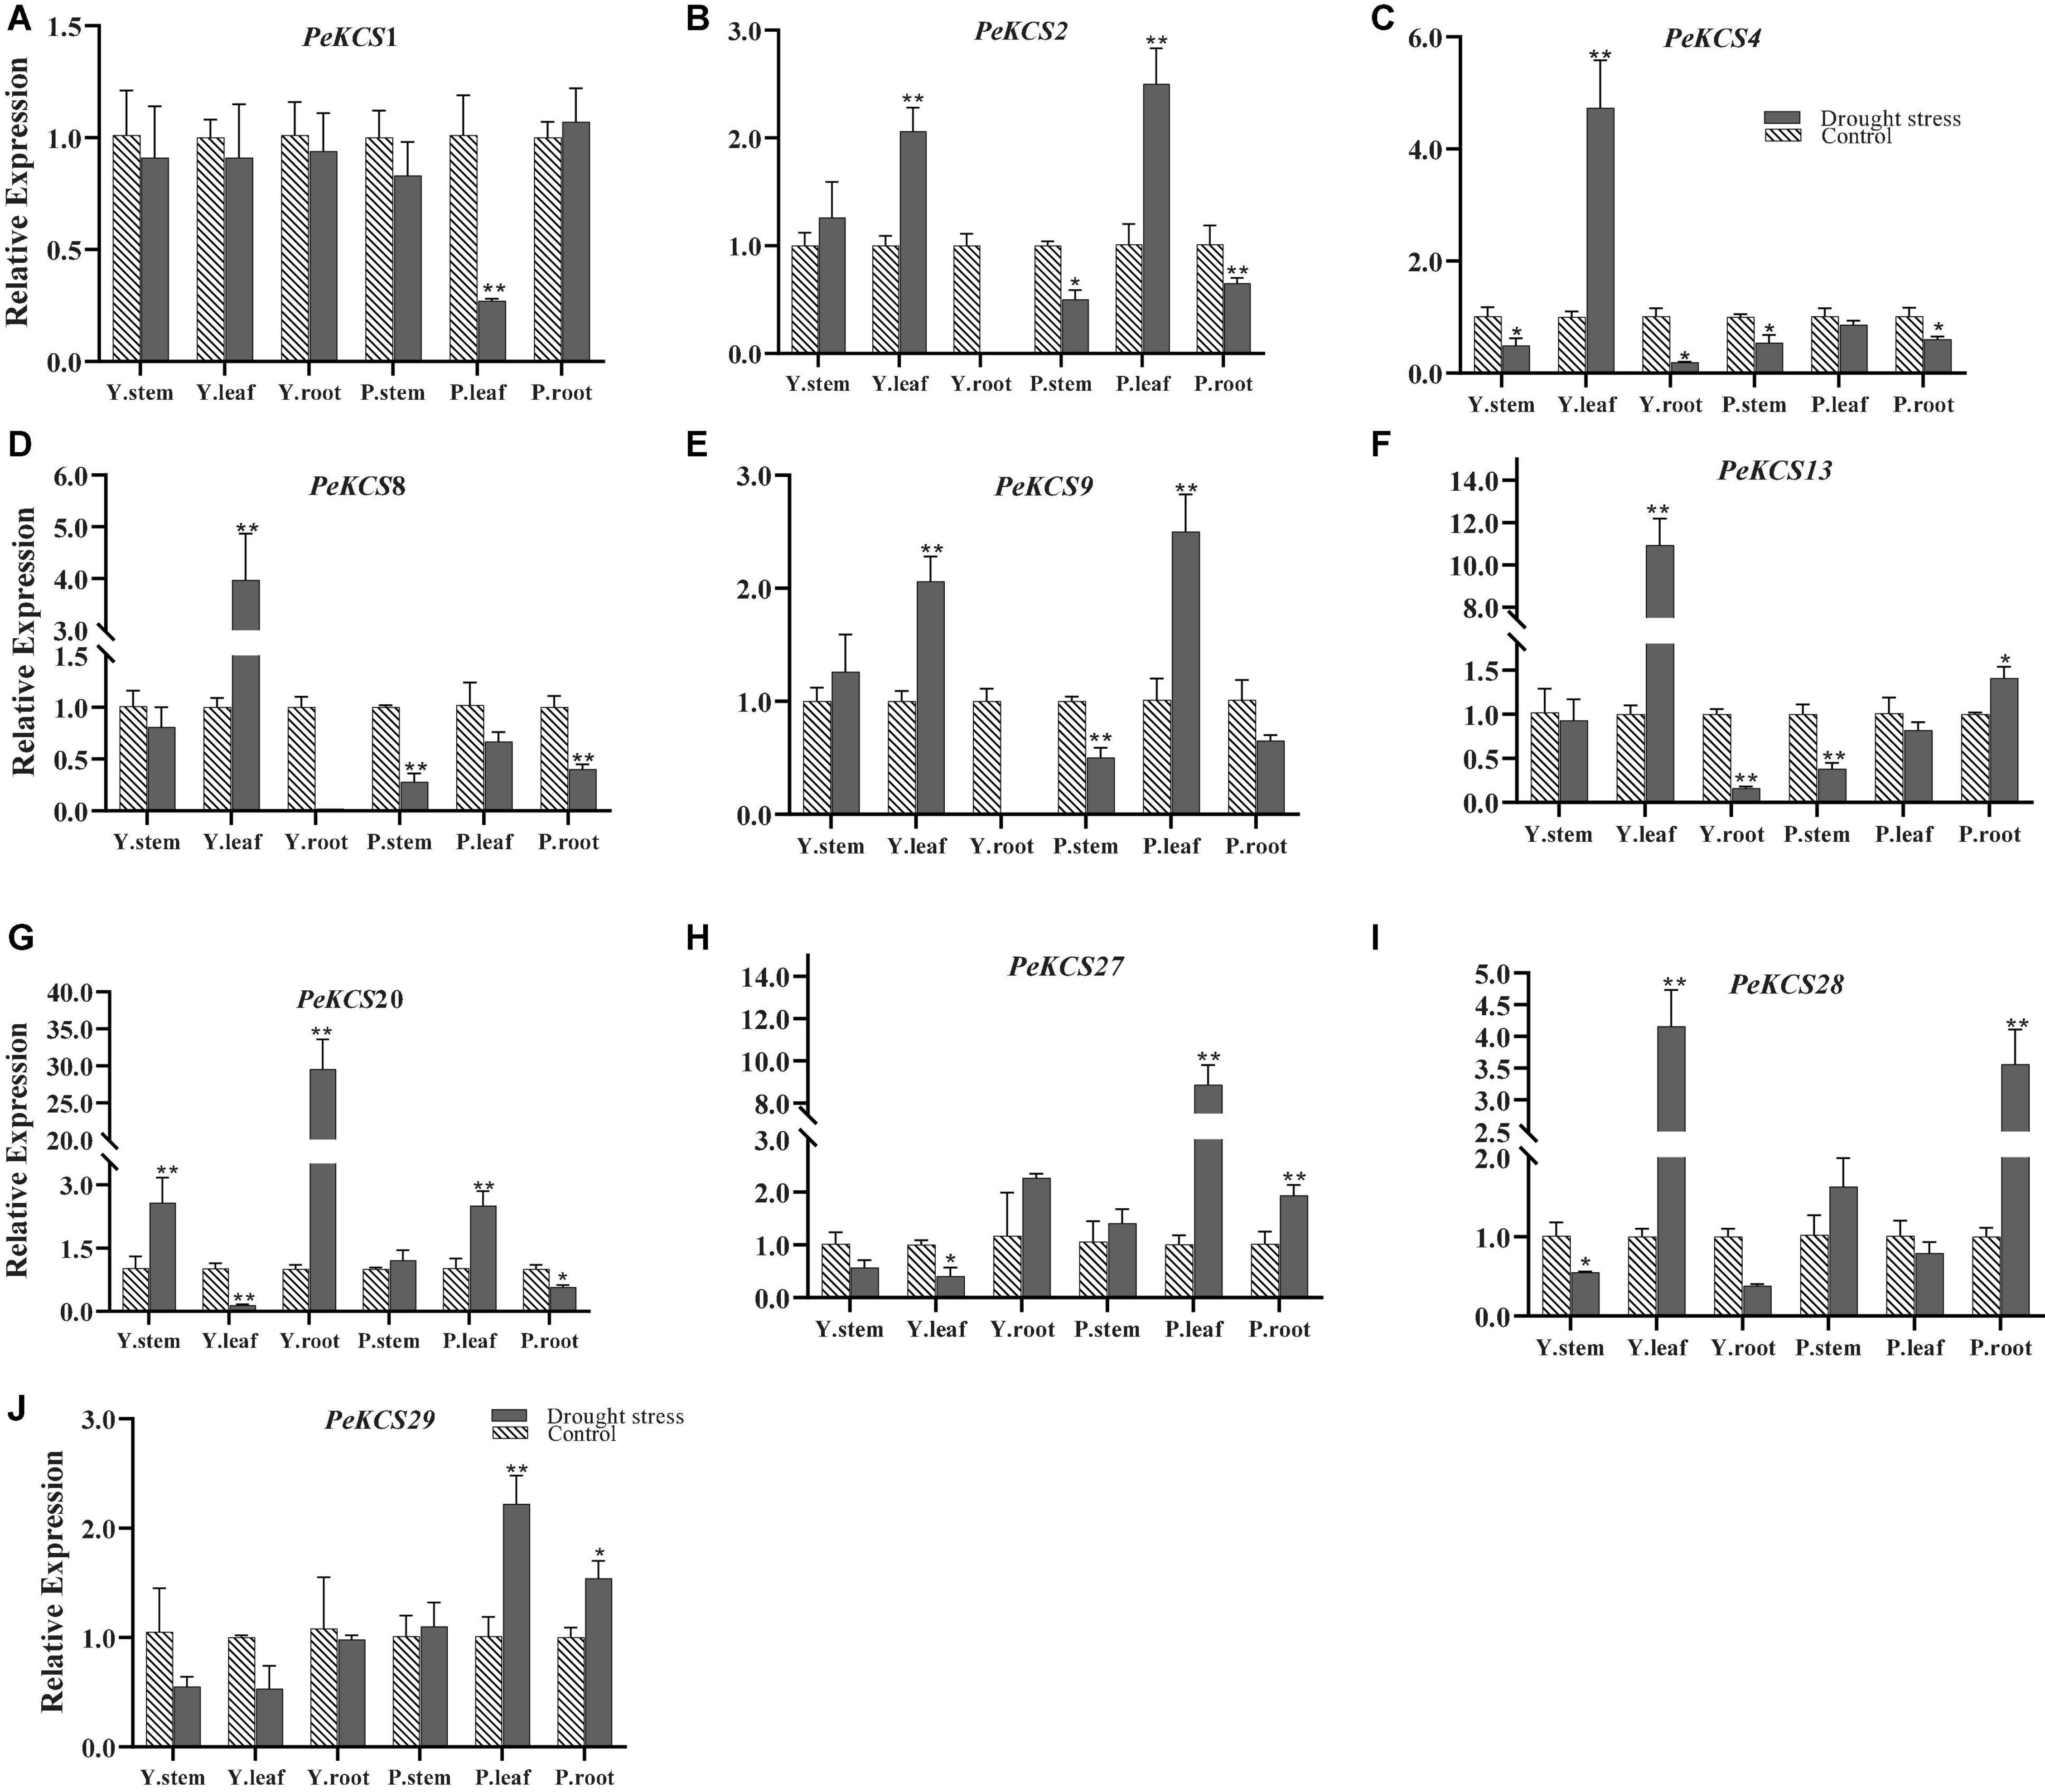
Figure 12. The relative expressions of PeKCS genes in stem, root and leave tissues of yellow and purple passion fruit plants under control and drought stress conditions. The relative gene expression levels were calculated using the 2– Δ Δ ct. Plants with regular watering were taken as control. Vertical bars represent means ± SD (n = 3). The * and ** shows significance at p ≤ 0.05 and p ≤ 0.01, respectively, among control and drought stress condition according to Students t-test. Y, yellow passion fruit; P, purple passion fruit.
Expression Profiles of PeKCS Genes F. kyushuense Fungal Biotic Stress Condition
The functional characterization of KCS genes against fungal pathogens has not been studied in passion fruit. To gain insight into the potential functional role of PeKCS genes at expression levels in passion fruit defense against fungal pathogens as biotic stress, in the current study, the expression profiles of ten candidate PeKCS genes were assessed by qRT-PCR under F. kyushuense fungal stress (biotic stress) condition in peel tissues of yellow and purple cultivars at 9th and 12th days post-inoculation (dpi) (Figure 13). Overall, all PeKCS genes were expressed and showed increased or decreased expression levels under biotic stress conditions in yellow and purple cultivars compared to controls (Figure 13).
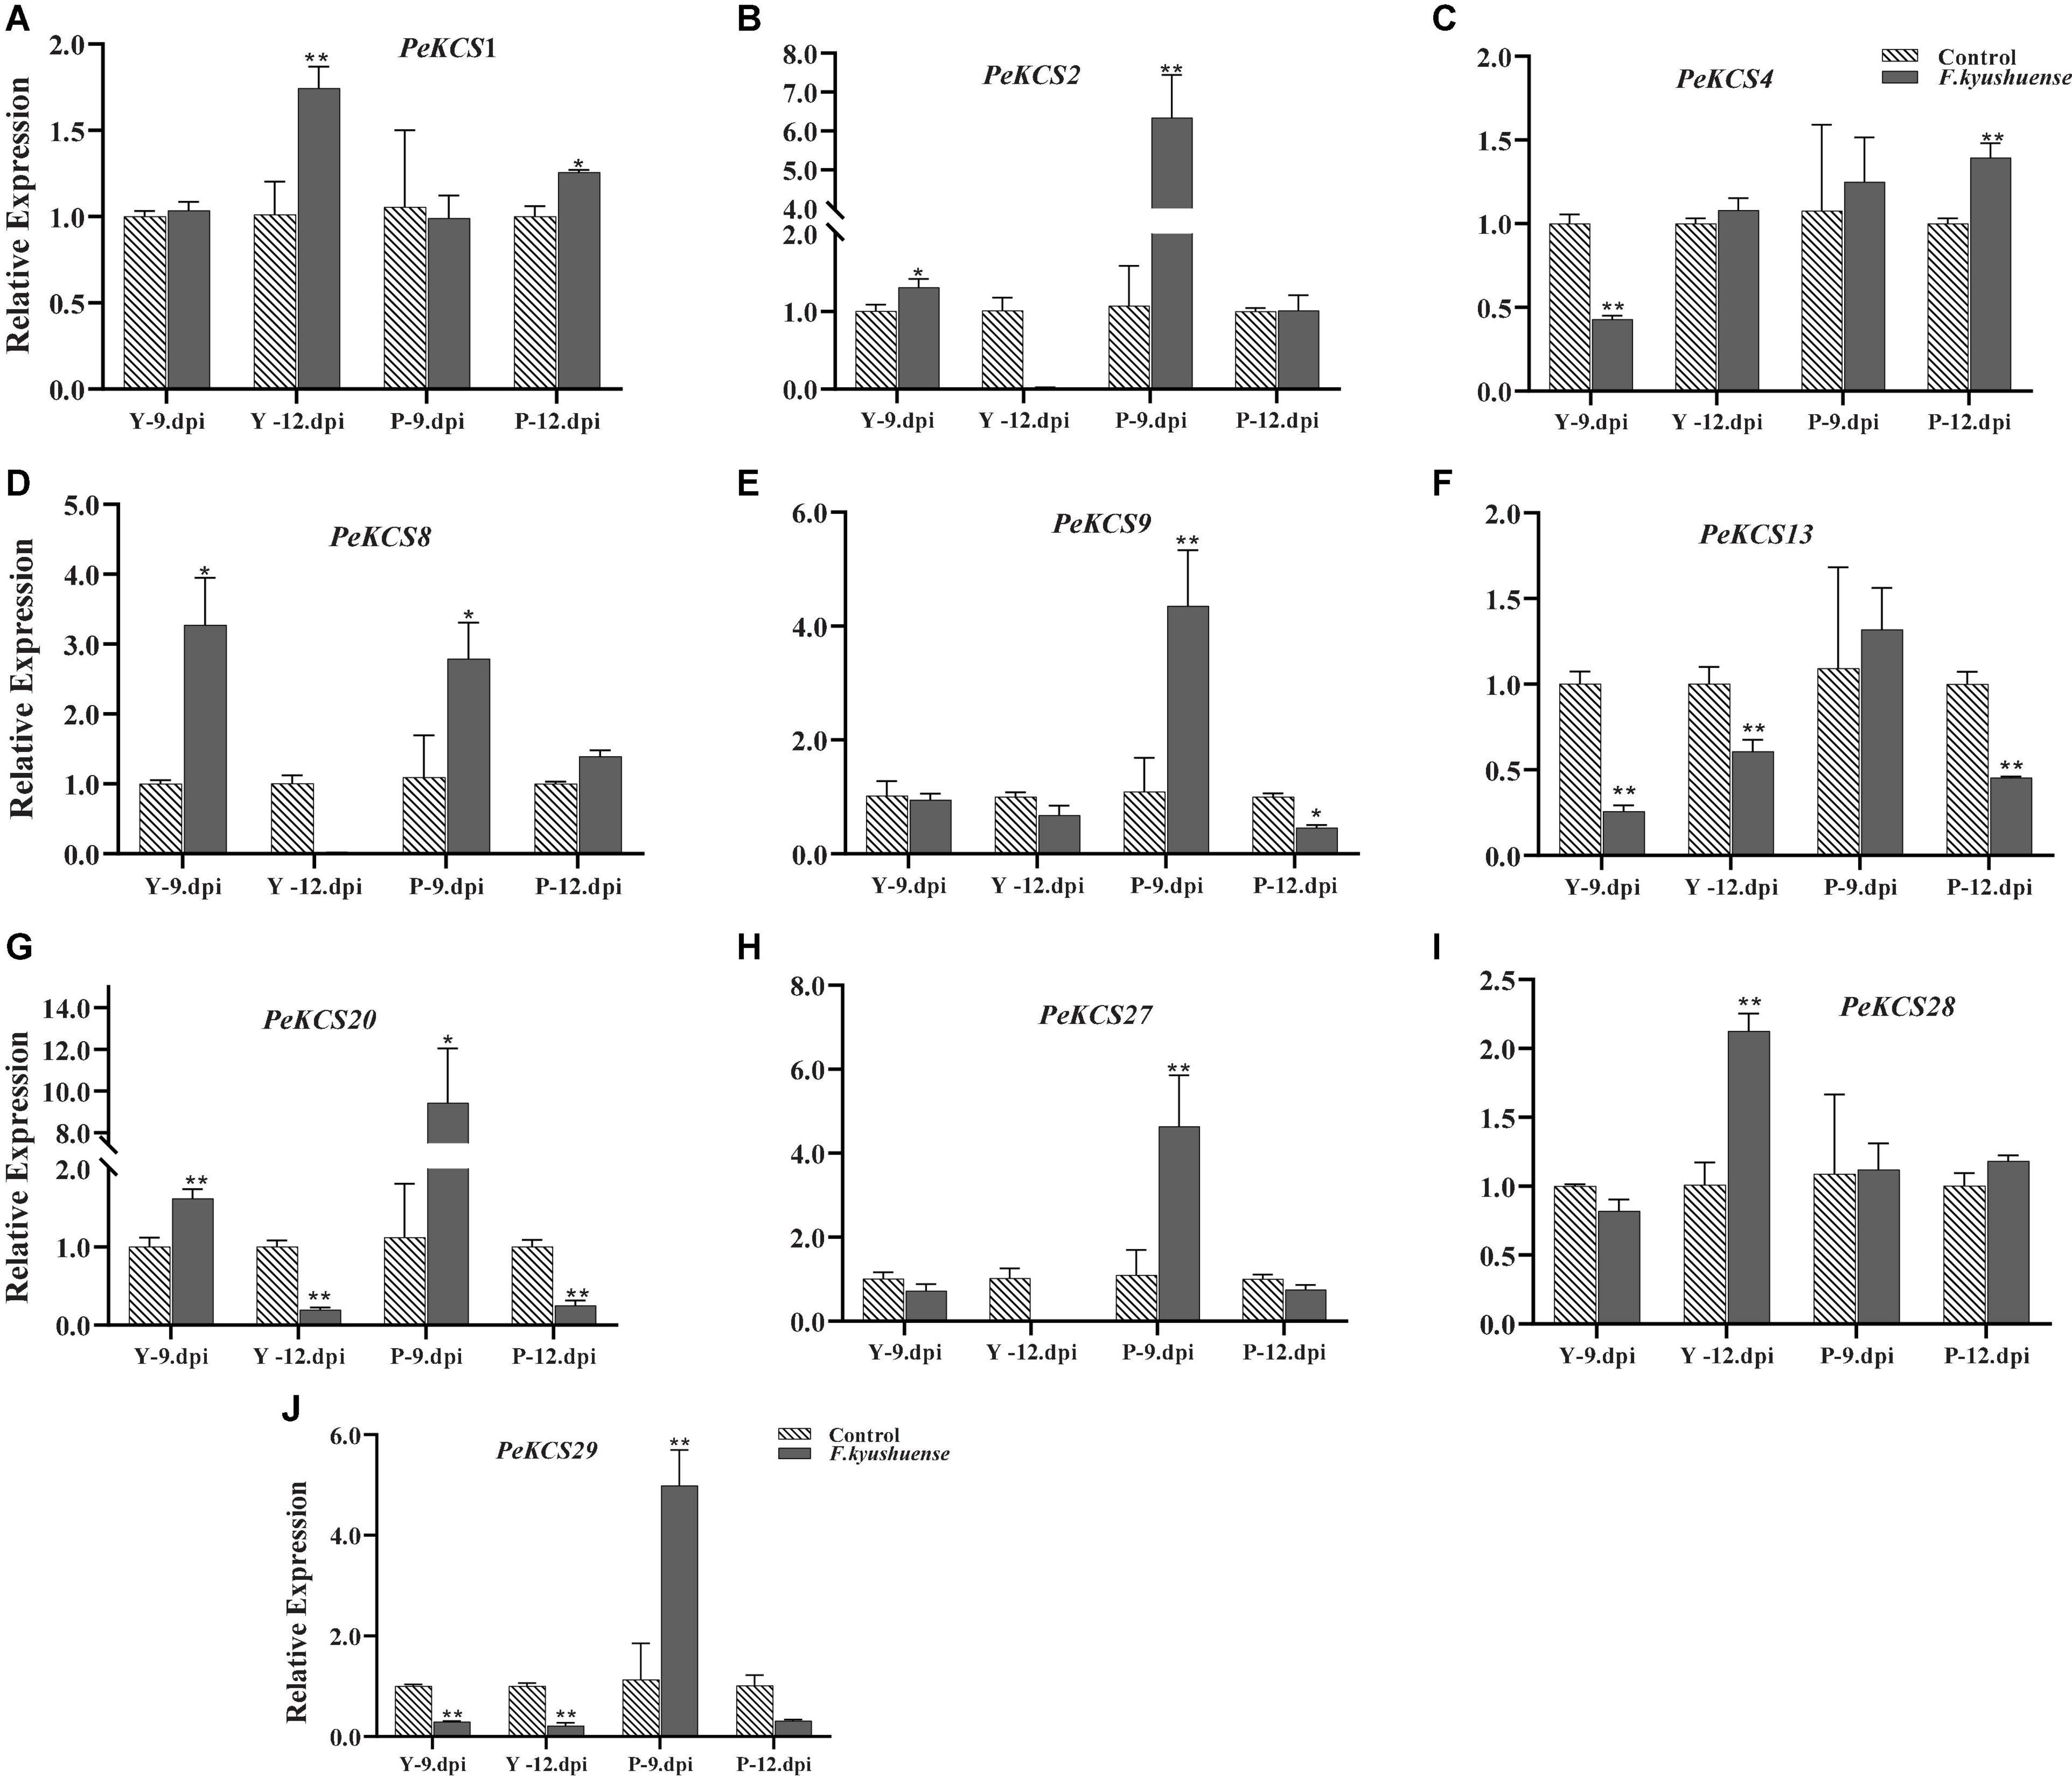
Figure 13. The relative expressions of PeKCS genes in peel tissues of yellow and purple passion fruit plants under F. kyushuense fungal biotic stress and control conditions. The relative gene expression levels were calculated using the 2– Δ Δ ct. Vertical bars represents means ± SD (n = 3). The * and ** shows significance at p ≤ 0.05 and p ≤ 0.01, respectively, among control and biotic stress conditions according to Students t-test. Y, yellow passion fruit; P, purple passion fruit; dpi, days post inoculation.
All the tested genes showed higher expression levels under biotic stress in purple 9th dpi (P-9.dpi) except PeKCS1 (Figure 13A) and PeKCS28 (Figure 13I) compared to yellow 9th dpi (Y-9.dpi) (Figure 13). Among them, PeKCS20 (Figure 13G) showed an increased expression level by more than 9-fold, followed by PeKCS2 more than 6-fold, PeKCS9, PeKCS27, and PeKCS29 more than 4-fold, PeKCS8 more than 2.5-fold, and PeKCS4 and PeKCS13 more than 1-fold at 9th dpi in purple cultivar (Figure 13). In yellow cultivar at 9th dpi, Only the expression levels of PeKCS8, PeKCS2, and PeKCS20 were found to be increased by 3-fold and more than 1-fold, while the expression level of all other genes decreased at Y-9.dpi (Figure 13). Interestingly, PeKCS1 and PeKCS28 expression levels were increased by 1.7- and 2.1-folds at 12th dpi in yellow cultivar (Figure 13). Overall, the results showed that PeKCS genes expression was increased under biotic stress conditions in purple at 9th dpi compared to controls (Figure 13). Taken together, the results showed that PeKCS genes have responded to fungal biotic stress by increasing or decreasing their expression levels at different time points of two cultivars providing evidence for further functional studies.
Validation of RNA-Seq Expression Data by Quantitative Real-Time Polymerase Chain Reaction
According to RNA-Seq FPKM expression data (Supplementary Tables 15, 16), the PeKCS1, PeKCS2, PeKCS4, PeKCS9, PeKCS10, PeKCS13, PeKCS20, PeKCS27, PeKCS28, and PeKCS29 have relative higher FPKM expressions in purple peels compared to yellow. The FPKM expression values were further validated by qRT-PCR analysis using PeKCS1, PeKCS2, PeKCS4, PeKCS8, PeKCS9, PeKCS13, PeKCS20, PeKCS27, PeKCS28, and PeKCS29 genes in yellow and purple passion fruit peel tissues (The primer details can be found in Supplementary Table 1). After normalization with Pe60s reference genes, all the tested PeKCS genes showed a trend line consistent with the RNA-Seq expression values (Figure 14). These results revealed that RNA-Seq expression values provided an appropriate expression result for all the tested tissues among both passion fruit cultivars.
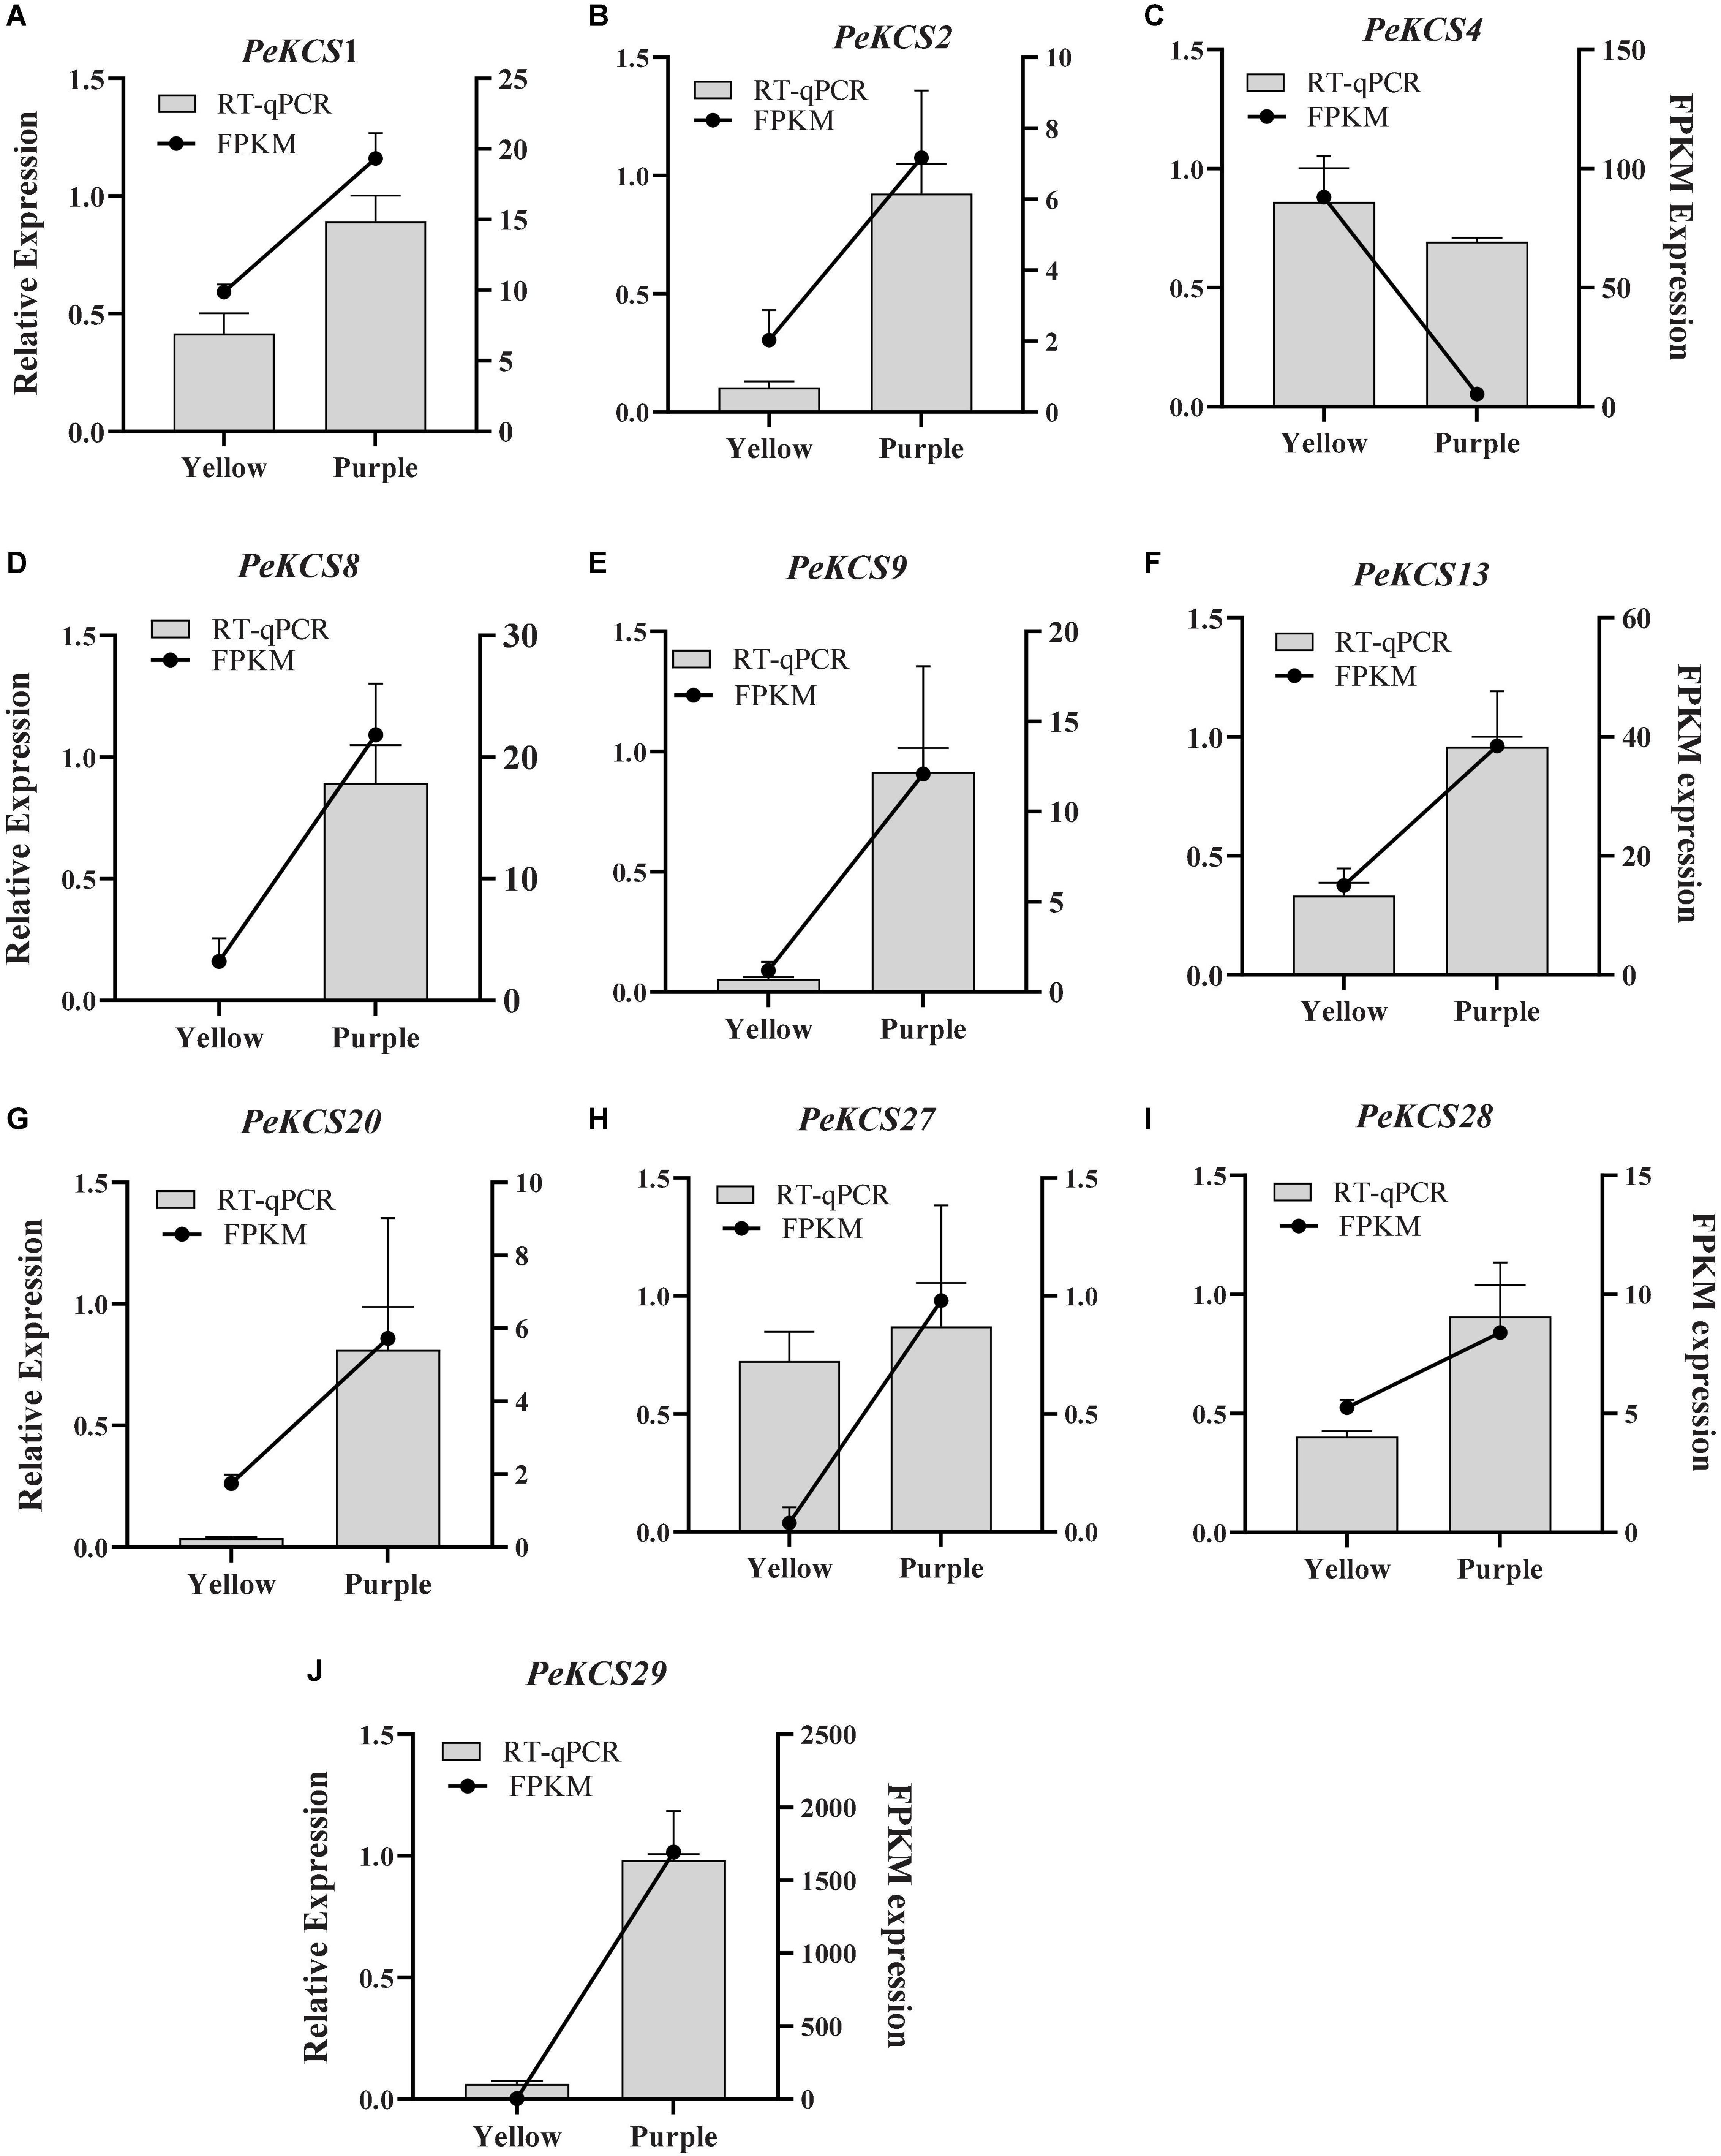
Figure 14. Validation of RNA-seq expression data by qRT-PCR. Histograms show the qPCR results of 10 PeKCS genes in peel tissues of yellow and purple cultivars at ripening stage. Black line charts show the FPKM values of PeKCS genes on and vertical gray bars show the qPCR results (2–ΔΔct) and represents mean ± SD. The left Y-axis represents the relative expression levels by qPCR and the right Y-axis indicates the FPKM values of RNA-seq data.
Discussion
The plant cuticle wax is the first barrier between the environment and plants to protect them from biotic and abiotic stresses (Trivedi et al., 2019). Plant cuticle consists of a combination of VLCFAs and their derivatives (Yeats and Rose, 2013). VLCFAs are fatty acids consisting of C16 to C40 carbons that play important roles in plant development and are essential for the synthesis of seed storage triacylglycerols, epicuticular waxes, and sphingolipids (Roudier et al., 2010). Elongation of C16 and C18 fatty acids to VLCFAs (C20 to C40) consists of four enzymes in the endoplasmic reticulum (ER) such as KCS, KCR, ECR, and HCD (Raffaele et al., 2009). Among them, KCS is known to be the key enzyme for VLCFAs biosynthesis (Wang X. et al., 2017; Yang H. et al., 2021). Due to the important roles of KCS in plant cuticle synthesis and other biological processes, the genome-wide identification of the KCS gene family has been reported in various plant species including Arabidopsis thaliana (Joubès et al., 2008), Zea mays (Campbell et al., 2019), Arachis hypogea (Huai et al., 2020), Brassica napus (Xue et al., 2020), Vitis vinifera (Guo et al., 2016), Gossypium hirsutum, G. arboreum, G. raimondii (Xiao et al., 2016), Hordeum vulgare (Tong et al., 2021), Atalantia buxifolia, Citrus ichangensis, C. medica, C. grandis, C. Sinensis, and C. clementina (Yang H. et al., 2021) ranging from 16 to 58 KCS members. In addition, the KCS family members have been functionally characterized in Arabidopsis (Lee et al., 2009; Kim et al., 2013; Hegebarth et al., 2017), C. sinensis (Yang H. et al., 2021; Wang et al., 2022), O. sativa (Wang X. et al., 2017), H. annuus (González-Mellado et al., 2019), S. tuberosum (Serra et al., 2009), M. domestica (Lian et al., 2021), V. vinifera (Yang Z. et al., 2020), and A. hypogaea (Lokesh et al., 2019). However, information about the KCS gene family in passion fruit was unknown and the availability of the passion fruit genome (Ma et al., 2021) made it possible to study on genomic levels. Therefore, identification and analyzing the physicochemical properties, structure, and function of the passion fruit KCS gene at the genome level could provide a theoretical basis for functional characterization to improve the stress resistance and genetic improvement of passion fruit.
In the current study, a total of 32 PeKCS genes were identified in the passion fruit genome by BLASTp and HMMER search basis (Table 1 and Figure 1A). The number of identified KCS genes in the passion fruit genome was relatively higher (32 PeKCS genes) compared with Arabidopsis (21 AtKCS genes) (Joubès et al., 2008), which may be due to large differences in genome size and a high number of repeated sequences. Our results are inconsistent with rapeseed (58 BnKCS genes) and barley (33 HvKCS) (Tong et al., 2021), in which they also identified a higher number of KCS genes (Xue et al., 2020) compared to AtKCS. The two domains (FAE1_CUT1_RppA and ACP_syn_III_C) were conserved in PeKCS proteins such as 22 PeKCS proteins have both domains, 6 PeKCS proteins have only FAE1_CUT1_RppA domain and 3 PeKCS proteins contained only ACP_syn_III_C domain (Figure 1B). Abbadi et al. (2000) also reported that the ACP_syn_III_C domain is important for initiating the fatty acid synthase chain reactions in plants and bacteria. KCS protein members with the FAE1_CUT1_RppA domain are described as 3-ketoacyl-CoA synthases and contain the active motifs involved in substrate binding and might be related to the substrate specificity of the KCS enzyme (Sagar et al., 2015). These reports support our results, that genes with ACP_syn_III_C and FAE1_CUT1_RppA domains identified in this study belong to the KCS gene family. Later on, multiple sequences alignment analysis between AtKCS and PeKCS genes was performed and found the two conserved domains regions indicating the importance of these domains to KCS gene functions (Supplementary Figure 1). Similar results were found by Lian et al. (2021) in M. domestica and Lokesh et al. (2019) in A. hypogaea.
The phylogenetic tree was constructed among KCS protein sequences of AtKCS, PeKCS, MdKCS, and AhKCS species (Figure 3) and exhibited into four subfamilies and eight clades including FAE-like (α), FAE-like (β), CER6-like (γ), KCS1-like (δ), KCS1-like (ζ), FDH-like (ε), FDH-like (η), and FDH-like (θ), which are consistent with previously published reports (Joubès et al., 2008; Lokesh et al., 2019; Lian et al., 2021). However, all the 32 PeKCS genes were grouped into seven clades and no PeKCS gene was found in FAE-like (β) clade (Figure 3). PeKCS genes in the KCS1-like (δ) clade were closely related to AtKCS1, which were involved in decarbonylation and acyl-reduction wax synthesis pathways (Todd et al., 1999). PeKCS genes in KCS1-like (ζ) clade were grouped with AtKCS2 and AtKCS20, which were involved in wax biosynthesis and tolerant to osmotic stress conditions (Lee et al., 2009). PeKCS genes in FAE-like (α) clade were grouped with AtKCS9 and AtKCS4, which were involved in VLCFAs, waxes, suberin, sphingolipids, and phospholipids (Kim et al., 2013, 2021). FAE-like (β) clade contained the AtKCS16, which were involved in the elongation of C34-C36 and C38 VLCFA required for wax biosynthesis and leaf trichomes in Arabidopsis (Hegebarth et al., 2017). PeKCS genes in FDH-like (ε) clade were grouped with AtKCS10, which were involved in organ development (Yang T. et al., 2021). These findings suggested that genes present in the same clade might perform similar functions (Liu et al., 2018).
Differences in protein functions can be described by predicting conserved motifs during the development of different gene families (Wong et al., 2015). Furthermore, the conserved motifs in PeKCS genes were evaluated and found a diverse motif pattern ranging from 1–16 motifs, whereas, 10 conserved motifs were recognized in all 32 PeKCS genes. The motif distribution contrasts with different groups of the evolutionary tree, suggesting that these conserved motifs may be functionally distinct (Figure 2B). Our results are similar to Lian et al. (2021) who also reported a different distribution of motifs and identified 15 conserved motifs in MdKCSs. The existence of exons and introns in gene structure (especially intron) provides an important source for determining gene family variation, function, and expressions (Xu et al., 2012). Additionally, the intron number and length negatively correlated with the expression level of corresponding genes (Eghbalnia et al., 2020; Su et al., 2021a). In the current study, a quite different number of introns among 32 PeKCS genes ranging from 0 to9 introns were identified and group II was found with having no introns, whereas groups 1, III, IV, and V have 1 to 4 introns, group VI has 3 introns and group VII contained 1 to 9 introns except PeKCS11. PeKCS14, PeKCS15 and PeKCS32 genes have no introns (Figure 2C). Similar results for exon/intron were also reported by Lian et al. (2021) and Tong et al. (2021), where different intron and exon patterns were found in the KCS genes. These findings suggest that the PeKCS gene ancestor may have undergone several rounds of intron loss and gain during development (Frugoli et al., 1998).
The cis-regulatory element analysis in PeKCS genes was performed and found numerous cis-elements that were involved in different plant developmental and stress responses. The cis-elements including ABRE, G-Box, Box 4, CGTCA-motif, TGACG-motif, GARE-motif, and ARE were abundant (Figure 4), indicating that KCS genes may play an important role in plant hormone response and stresses (Porto et al., 2014). PeKCS cis-element results were consistent with the qRT-PCR expression analysis, as genes containing the larger number of stress-related cis-elements were highly upregulated under stress conditions, including PeKSC2, PeKCS9, PeKCS13, and PeKCS28 genes were highly upregulated in drought stress condition (Figure 12), while PeKCS2, PeKCS8, PeKCS9, and PeKCS27 genes were highly upregulated under F. kyushuense fungal biotic stress condition (Figure 13) Kim et al. (2011) reported that the promoter ABRE sequence was involved in the expression of the DREB2A gene under osmotic stress conditions. Sibéril et al. (2001) proposed that G-BOX might involve in the transduction pathway that regulates the gene expression in the nucleus. These results suggest that genes containing the above-mentioned cis-elements might involve in different plant developmental and stress responses as reported earlier (Wingender et al., 1990; Wang et al., 2011; Liu et al., 2016; Xiong et al., 2020). Different species such as Arabidopsis, peanut, apple, grape, rapeseed, cotton, sunflower have different numbers of chromosomes and KCS genes, suggesting that they might have gone through lineage-specific genome duplication, which is a prominent feature of plant genomes that can lead to evolution and functional novelty from existing genes (Flagel and Wendel, 2009). Guo et al. (2016) reported that the WGD/segmental duplication plays a major role in the expansion of plant KCS genes. WGD/segmental and tandem duplications may lead to a sudden increase in the size of the genome and the entire gene sets by generating two gene copies (Van de Peer et al., 2009).
Synteny analysis was performed and calculated PeKCS genes divergence rate and found less than 1 Ka/Ks values, suggesting that PeKCS genes have gone through purifying selection and the duplication process among tandem and segmental PeKCS genes was estimated to be 0.30 to 27.64 mya (Supplementary Table 6), which is inconsistent with Xia et al. (2021), who reported that, the passion fruit experienced a two WGD between 12 mya and 65 mya. PeKCS gene duplication analysis showed 3 segmental and 5 tandems duplicated PeKCS genes within passion fruit genome (Figure 5A and Supplementary Table 6), correspondence with Arabidopsis KCS duplication by Joubès et al. (2008). Furthermore, comprehensive KCS gene duplication showed a higher number of KCS duplications were between PeKCS and MdKCS compared to AtKCS (Figure 5B and Supplementary Table 7). The multiple collinearity analysis between P. edulis A. thaliana, M. domestica, and A. hypogaea species (Figure 5C and Supplementary Table 8) also revealed the higher number of orthologous between P. edulis and M. domestica. Similar results were reported by Santos et al. (2014) that compared to the dicot genomes the number of repetitive elements between P. edulis and M.domestica genomes was 42.4%. These findings indicate that these orthologous might have the same ancestors and retain corresponding functions.
Protein–protein interaction networks for specific gene families provide evidence of the relationship between known family members (Piya et al., 2014). In the current study, 31 PeKCS proteins showed homology and interaction with known Arabidopsis proteins (Figure 6A and Supplementary Table 9). The results showed that PeKCS proteins had homology and interaction with AtKASI, AtLAP, AtKASIII, AtKCS, AtBCCP, AtTTP4. Our results are consistent with published reports suggesting that PeKCS have similar functions, such as Chen et al. (2009) revealed that BCCP (Biotin carboxyl carrier protein) was involved in the fatty acid biosynthesis pathway. Wu and Xue (2010) reported that KAS (β-Ketoacyl-acyl carrier protein synthase) catalyzes the elongation of de novo fatty acid synthesis and plays a role in chloroplast division and embryo development. Su et al. (2018) stated that KASII (Fatty acid biosynthesis I (FAB1)/3-oxoacyl-acyl-carrier-protein synthase II) catalyzes the fatty acid synthesis by conferring resistance to low temperatures by maintaining the integrity of chloroplast membranes. KCS is the key enzyme involved in VLCFA biosynthesis and cuticle wax biosynthesis pathways (Lee et al., 2009; Wang X. et al., 2017). Dobritsa et al. (2010) stated that LAP5/LAP6 (Less adhesive pollen) are multifunctional enzymes that might play role in pollen fatty acids and exine phenolic. Xuan et al. (2018) stated that TT4/TT5 (Transparent Testa) encodes chalcone synthase (CHS), a key enzyme involved in the biosynthesis of flavonoids and auxin transport. The proteins’ secondary structures are the physical arrangement of amino acid sequences and are highly conserved between homologous proteins. The amino acid order directly affects the protein folding, 3D structure, and functions (Ridout et al., 2010).
Protein secondary structure analysis revealed that the alpha helix accounts for the largest percentage of secondary structures 49.6%, followed by random coils 41.96%, and extended strands 22.89% (Supplementary Table 10). Similar results have been reported by Lian et al. (2020) in the apple KCS gene family. In addition, 3D models of all the PeKCS proteins showed similar structures among them (Figure 6B), indicating that the identified PeKCS proteins were conserved and consistent with the domains, motif, and gene structure analysis (Lian et al., 2020). Recently, different miRNAs have been identified in numerous species including Brassica napus (Su et al., 2021b; Wen et al., 2021), maize (Zea mays) (Aravind et al., 2017), in cowpea (Vigna unguiculata) (Barrera-Figueroa et al., 2011), soybean (Glycine max) (Song et al., 2011), Arachis hypogaea (Zhao et al., 2015) and passion fruit (Paul et al., 2020), and involved in different metabolism, development, and environmental stresses. In this study, twenty putative ped-miRNAs belonging to nine different families were identified and targeted the 13 PeKCS genes (Figure 7 and Supplementary Table 11). These miRNAs included ped-miR157, ped-miR162, ped-miR164, ped-miR166, ped-miR171, ped-miR319, ped-miR397, ped-miR398 and ped-miR399, respectively. Ped-miR166 family targeted up to four PeKCS genes and miR166 has been reported to be involved in drought stress in maize (Aravind et al., 2017), cowpea (Barrera-Figueroa et al., 2011); soybean (Glycine max) seed development (Song et al., 2011); peanut disease resistant (Zhao et al., 2015); plant growth, development and stress response in apple (Varkonyi-Gasic et al., 2010). miR171 has been reported to be involved in the development, metabolism, photosynthesis in grapevine (Vitis vinifera) (Han et al., 2014); coffee (Coffea Arabica) (Chaves et al., 2015); tea (Camellia sinensis) stress response (Zhang et al., 2014); passion fruit development and defense (Paul et al., 2020). miR399 involved in drought stress response in sugarcane (Saccharum officinarum) (Zanca et al., 2010); phosphate homeostasis, signaling, transport in apple (Pant et al., 2008) and sorghum (Sorghum bicolor) phosphate deficiency (Katiyar et al., 2012a). These findings suggest that these ped-miRNAs may play key roles in multiple developments and stress processes by altering the transcriptional level of KCS genes in passion fruit. The functions and expression levels of these predicted miRNAs and their target genes need to be further examined in the passion fruit.
Plant TFs have been reported to be involved in the regulation of fatty acids and wax biosynthesis under different conditions (Hao et al., 2017). The TFs in the promoter regions of 32 PeKCS genes were predicted and proposed a regulatory network interacting with PeKCS genes (Figure 8 and Supplementary Table 12). The most abundant TF families were ERF, MYB, Dof, C2H2, TCP, LBD, NAC, and bHLH (Supplementary Table 12). Go et al. (2014) reported that wax biosynthesis in Arabidopsis was negatively regulated under AP2/ERF-type TFs. Overexpression of AP2/ERF-type TFs increased the wax load and drought resistance in Arabidopsis and tobacco (Nicotiana tabacum) (Yang S. U. et al., 2020). MYB TFs regulate VLCFAs biosynthesis, plant development, metabolism, and response to stresses (Raffaele et al., 2008; Katiyar et al., 2012b; Ambawat et al., 2013). Zhang et al. (2019) stated that the MYB30 TF is involved in cuticular wax biosynthesis and resistance against pathogens. Wen et al. (2016) found that CsDof TF might play a role against biotic stresses in cucumber (Cucumis sativus). Rojas-Gracia et al. (2019) stated the SIDOF10 TF involved regulation of vascular tissue in tomatoes (Solanum lycopersicum). C2H2 TF regulates abiotic stress responses in plants (Han et al., 2020). TCP TFs regulate plant growth, development, and stress response (Li, 2015; Danisman, 2016). LBD TFs play role in anthocyanin and nitrogen metabolisms, pollen development, and pathogen response (Grimplet et al., 2017). NAC TF promoted cuticle wax biosynthesis in citrus (Yang H. et al., 2022). bHLH TF is involved in plant growth, metabolism, light signal transduction, cuticle development (Li et al., 2016; Sun et al., 2018). the qRT-PCR expression analysis was performed and found that the expression levels of PeKCS genes were positively or negatively regulated under stress conditions containing numerous TFs (Figures 12, 13). Our results are consistent with previous reports suggesting a role for PeKCS TFs in regulating of VLCFAs, wax biosynthesis, and plant stress responses, while wax regulation analysis requires further investigation.
Gene ontology and KEGG annotation results of PeKCS genes revealed that highly enriched GO terms were associated with fatty acid synthase and elongase activity, acyltransferase activity, endoplasmic reticulum, and response to stresses, while KEGG pathways included fatty acid elongation, lipid metabolism, and plant-pathogen interaction (Figure 9). Our GO results were consistent with qRT-PCR expression analysis, for example, PeKCS2, PeKCS9, and PeKCS13 (Figure 12) were highly upregulated under drought stress conditions compared to controls, and these genes contained stress-responsive GO-BP terms (Supplementary Tables 13a,b). It has been reported that KCS genes take part in different processes including fatty acid elongase Todd et al. (1999), pathogen interaction (Xue et al., 2020), and lipid metabolism in the endoplasmic reticulum (De Bigault Du Granrut and Cacas, 2016). KCS genes have been reported to play important roles in VLCFA and wax biosynthesis as well as biotic and abiotic stresses (Kim et al., 2013; Lee and Suh, 2013; Lokesh et al., 2019; Yang Z. et al., 2020; Lian et al., 2021). The expression profiles of KCS genes in different tissues have been described earlier in numerous plant species and exhibited a diverse expression pattern among them. For example, in C. sinensis, Cs8g17800 and Cs4g04880 exhibited higher expression levels in flowers. Cs7g13310 and Cs7g28170 showed higher expression levels in the leaf. Cs7g04850 was expressed in flower and embryo. Cs4g17260 and Cs6g02360 were mainly expressed in flavedo. Cs2g16470 was universally expressed in the fruit. The expression levels of Cs2g16470, Cs8g17800, Cs4g17260, Cs6g02360, and orange1.1t00556 genes steadily increased along with fruit ripening (Yang H. et al., 2021).
In apple, MdKCS6 showed higher expression in leaves whereas, MdKCS1 was highly expressed in the peel. Overall, the highest expression levels were found in most of the MdKCS genes in apple peels (Lian et al., 2020). In Arabidopsis KCS6 and KSC10 were highly expressed compared in roots, stems, flowers, and siliques. KCS19 was not expressed in leaves and stems (Joubès et al., 2008). In the current study, the following genes exhibited higher expression patterns throughout the fruit developmental stages including PeKCS1 (FPKM = 17–55.62), PeKCS10 (FPKM = 13.73–324.52), and PeKCS30 (FPKM = 96.12–356.7) (Figure 11A). PeKCS20 showed the highest expression (FPKM = 213.63) in L conditioned root. PeKCS 29, showed the highest expression (FPKM = 1692.94) in the peel. PeKCS5 showed the highest expression (FPKM = 359.34) under NT and CS leaves (FPKM = 306.76, PeKCS5) (Figure 11B). PeKCS31 and PeKCS32 were not expressed in all pulp tissues, whereas four genes (PeKCS16, PeKCS17, PeKCS18, and PeKCS19) were not expressed in leaves, peel, and root tissues, indicating that they might not involve in passion fruit growth and development. These diverse expression results indicate that PeKCS genes have specific expression patterns in all tested tissues and may play important roles in specific functions, but further research is required.
Consistent with the findings of other studies, KCS has been reported to be involved in regulating plant responses to drought and biotic stresses (Li et al., 2018; Lokesh et al., 2019; Guo et al., 2020; Wang Y. et al., 2020). The expression patterns of PeKCS genes under drought stress and F. kyushuense fungal biotic stress conditions (Figures 12, 13) were analyzed. Most of the genes were positively or negatively regulated under stress conditions. Among them, PeKCS20 was up-regulated (29-fold) in yellow roots, PeKCS27 and PeKCS13 were up-regulated (8 to10-fold) in yellow and purple leaves under drought conditions. PeKCS1 was down-regulated in all tissues (root, stem, and leaves), indicating that its expression was inhibited by drought conditions. Relative expressions of PeKCS4 and PeKCS8 were up-regulated (4 and 3-folds) in yellow leaves but down-regulated in roots and stems (Figure 12). The expression profiles of PeKCS genes under biotic stress conditions (F. kyushuense fungal stress) showed that all PeKCS genes were expressed at different expression levels and most of the PeKCS genes were upregulated under biotic stress in purple 9th dpi except PeKCS1 compared to yellow 9th dpi (Figure 13). PeKCS20 was upregulated up to 9 folds, PeKCS2 > 6 folds, PeKCS9, PeKCS27, and PeKCS29 > 4 folds, PeKCS8 > 2.5-fold, PeKCS4 and PeKCS13 > 1-fold at 9th.dpi in purple cultivar. Whereas in yellow cultivar, PeKCS8, PeKCS2 and PeKCS20 were upregulated > 1- 3folds at 9th dpi. Only two gens PeKCS1 and PeKCS28 were upregulated > 1–2 folds at 12th dpi in the yellow cultivar.
Similar results were found by Lian et al. (2020) in apple MdKCS genes, eight MdKCS genes showed fluctuated (down-up-down-regulation) trend under drought conditions. MdKCS12 and MdKCS24 showed upregulated expressions (5 to 10-folds) under drought conditions. MdKCS6 expression was downregulated most of the time under drought conditions. The expressions of KCS20 and KCS2/DAISY genes were upregulated in Arabidopsis stem under drought stress (Lee et al., 2009). HvKCS1 improved the barley leaf waxes and resistance to barley powdery mildew fungus (Li et al., 2018). Previous reports indicate that the accumulation of cuticular wax and VLCFAs increases under stress conditions (Seo et al., 2011; Budke and Goffinet, 2016; Wang Y. et al., 2020). Our expression results suggest that positive or negative regulations of PeKCS genes may be due to the increase or decrease of cuticle wax and VLCFAs under drought and fungal stress conditions, but further studies are required.
Conclusion
In this study, comprehensive analyses were performed and identified 32 PeKCS genes in the passion fruit genome. All identified PeKCS genes were subjected to physio-chemical features, evolutionary relationships, motifs, gene structures, cis-regulatory elements, protein–protein interaction, syntenic analysis, TFs regulatory network analysis, GO, KEGG annotation, and putative micro-RNAs prediction analysis. The KCS gene family was expanded and subjected to purification screening. The hypothetically predicted subcellular localization of PeKCS genes was validated by a transient expression assay of the PeKCS2 gene in the onion epidermis cell. Plant TFs families including ERF, MYB, and Dof were identified, and a regulatory network associated with the PeKCS genes was performed. FPKM-based gene expression profiles of PeKCS exhibited a diverse expression in the root, peel, leaves, and pulp tissues. The qRT-PCR based expressions suggested that most of the PeKCS genes were highly upregulated in leaves under drought and at 9th dpi under fungal (F. kyushuense) stresses conditions, specifically for genotype compared to controls. These findings provide a basis for future studies on the functions of KCS genes in passion fruit. Attempting to breed passion fruit cultivars susceptible to biotic or abiotic stress by overexpressing or inhibiting KCS gene expression in passion fruit tissues may provide new clues for the selection of passion fruit resistant cultivars. In future studies, we will further explore the role of PeKCS genes in VLCFA and cuticle wax biosynthesis on transcriptomics and metabolomic levels of passion fruit.
Data Availability Statement
The original contributions presented in the study are included in the article/Supplementary Material, further inquiries can be directed to the corresponding author/s.
Author Contributions
FC and HMR convinced the idea. HMR, FS, XL, AFY, MS, QY, YC, and KS performed the formal analysis and qRT-PCR. MB, HMR, and S-YH performed the bioinformatics analysis and wrote the manuscript. FC, RO, MYMJ, MA, MAAA, ZM, and LZ revised and edited the manuscript. All authors have read and agreed to the published version of the manuscript.
Funding
FC’s research project was funded by the Department of Science and Technology, Fujian Province, China (2020N0004 and 2020S0056) and the Engineering Research Center of Fujian Province University (G2-KF2006).
Conflict of Interest
The authors declare that the research was conducted in the absence of any commercial or financial relationships that could be construed as a potential conflict of interest.
Publisher’s Note
All claims expressed in this article are solely those of the authors and do not necessarily represent those of their affiliated organizations, or those of the publisher, the editors and the reviewers. Any product that may be evaluated in this article, or claim that may be made by its manufacturer, is not guaranteed or endorsed by the publisher.
Supplementary Material
The Supplementary Material for this article can be found online at: https://www.frontiersin.org/articles/10.3389/fpls.2022.872263/full#supplementary-material
Footnotes
- ^ https://ftp.cngb.org/pub/CNSA/data3/CNP0001287/CNS0275691/CNA0017758/
- ^ http://www.Arabidopsis.org
- ^ https://iris.angers.inra.fr/gddh13/the-apple-genome-downloads.html
- ^ https://www.peanutbase.org/download
- ^ http://pfam.xfam.org/
- ^ https://www.ncbi.nlm.nih.gov/Structure/bwrpsb/bwrpsb.cgi
- ^ http://smart.embl-heidelberg.de/
- ^ https://web.expasy.org/protparam/
- ^ http://cello.life.nctu.edu.tw
- ^ https://www.megasoftware.net/
- ^ https://itol.embl.de/login.cgi
- ^ http://imed.med.ucm.es/Tools/sias.html
- ^ http://meme-suite.org/index.html
- ^ http://bioinformatics.psb.ugent.be/webtools/plantcare/html/
- ^ https://string-db.org/cgi/input.pl
- ^ https://npsa-prabi.ibcp.fr/cgi-bin/npsa_automat.pl?page=npsa_sopma.html
- ^ http://www.sbg.bio.ic.ac.uk/phyre2/html/
- ^ https://www.zhaolab.org/psRNATarget/
- ^ https://cytoscape.org/download.html
- ^ http://eggnog-mapper.embl.de/
- ^ http://plantregmap.gao-lab.org/binding_site_prediction.php
- ^ http://www.ncbi.nlm.nih.gov/sra
- ^ https://ubuntu.com/wsl
- ^ https://www.graphpad.com/scientific-software/prism
References
Abbadi, A., Brummel, M., Schütt, B. S., Slabaugh, M. B., Schuch, R., and Spener, F. (2000). Reaction mechanism of recombinant 3-oxoacyl-(acyl-carrier-protein) synthase III from Cuphea wrightii embryo, a fatty acid synthase type II condensing enzyme. Biochem. J. 345, 153–160. doi: 10.1042/bj3450153
Ambawat, S., Sharma, P., Yadav, N. R., and Yadav, R. C. (2013). MYB transcription factor genes as regulators for plant responses: an overview. Physiol. Mol. Biol. Plants 19, 307–321. doi: 10.1007/s12298-013-0179-1
Aravind, J., Rinku, S., Pooja, B., Shikha, M., Kaliyugam, S., Mallikarjuna, M. G., et al. (2017). Identification, characterization, and functional validation of drought-responsive microRNAs in subtropical maize inbreds. Front. Plant Sci. 8:941. doi: 10.3389/fpls.2017.00941
Arya, G. C., Sarkar, S., Manasherova, E., Aharoni, A., and Cohen, H. (2021). The plant cuticle: an ancient guardian barrier set against longstanding rivals. Front. Plant Sci. 12:1264. doi: 10.3389/fpls.2021.663165
Ashburner, M., Ball, C. A., Blake, J. A., Botstein, D., Butler, H., Cherry, J. M., et al. (2000). Gene ontology: tool for the unification of biology. Nat. Genet. 25, 25–29.
Bach, L., and Faure, J.-D. (2010). Role of very-long-chain fatty acids in plant development, when chain length does matter. Comptes Rendus Biol. 333, 361–370. doi: 10.1016/j.crvi.2010.01.014
Barrera-Figueroa, B. E., Gao, L., Diop, N. N., Wu, Z., Ehlers, J. D., Roberts, P. A., et al. (2011). Identification and comparative analysis of drought-associated microRNAs in two cowpea genotypes. BMC Plant Biol. 11:127. doi: 10.1186/1471-2229-11-127
Beaudoin, F., Wu, X., Li, F., Haslam, R. P., Markham, J. E., Zheng, H., et al. (2009). Functional characterization of the Arabidopsis β-ketoacyl-coenzyme A reductase candidates of the fatty acid elongase. Plant Physiol. 150, 1174–1191. doi: 10.1104/pp.109.137497
Budke, J. M., and Goffinet, B. (2016). Comparative cuticle development reveals taller sporophytes are covered by thicker calyptra cuticles in mosses. Front. Plant Sci. 7:832. doi: 10.3389/fpls.2016.00832
Campbell, A. A., Stenback, K. E., Flyckt, K., Hoang, T., Perera, M. A. D., and Nikolau, B. J. (2019). A single-cell platform for reconstituting and characterizing fatty acid elongase component enzymes. PLoS One 14:e0213620. doi: 10.1371/journal.pone.0213620
Chaves, S., Fernandes-Brum, C., Silva, G., Ferrara-Barbosa, B., Paiva, L., Nogueira, F., et al. (2015). New insights on Coffea miRNAs: features and evolutionary conservation. Appl. Biochem. Biotechnol. 177, 879–908. doi: 10.1007/s12010-015-1785-x
Chen, C., Chen, H., He, Y., and Xia, R. (2018). TBtools, a toolkit for biologists integrating various biological data handling tools with a user-friendly interface. BioRxiv [Preprint]. doi: 10.1101/289660v2
Chen, M., Mooney, B. P., Hajduch, M., Joshi, T., Zhou, M., Xu, D., et al. (2009). System analysis of an Arabidopsis mutant altered in de novo fatty acid synthesis reveals diverse changes in seed composition and metabolism. Plant Physiol. 150, 27–41. doi: 10.1104/pp.108.134882
Chen, S., Zhou, Y., Chen, Y., and Gu, J. (2018). fastp: an ultra-fast all-in-one FASTQ preprocessor. Bioinformatics 34, i884–i890. doi: 10.1093/bioinformatics/bty560
Dai, H., Zhang, Y.-Y., Jin, P., Song, F.-P., Xu, W., Liu, A.-Z., et al. (2021). Identification of KCS gene family and functional analysis of FAE-like genes from Malania oleifera. Oil Crop Sci. 6, 35–40. doi: 10.1016/j.ocsci.2021.03.003
Danisman, S. (2016). TCP transcription factors at the interface between environmental challenges and the plant’s growth responses. Front. Plant Sci. 7:1930. doi: 10.3389/fpls.2016.01930
De Bigault Du Granrut, A., and Cacas, J.-L. (2016). How very-long-chain fatty acids could signal stressful conditions in plants? Front. Plant Sci. 7:1490. doi: 10.3389/fpls.2016.01490
Dobritsa, A. A., Lei, Z., Nishikawa, S.-I., Urbanczyk-Wochniak, E., Huhman, D. V., Preuss, D., et al. (2010). LAP5 and LAP6 encode anther-specific proteins with similarity to chalcone synthase essential for pollen exine development in Arabidopsis. Plant Physiol. 153, 937–955. doi: 10.1104/pp.110.157446
Eghbalnia, H. R., Wilfinger, W. W., Mackey, K., and Chomczynski, P. (2020). Coordinated analysis of exon and intron data reveals novel differential gene expression changes. Sci. Rep. 10, 1–13. doi: 10.1038/s41598-020-72482-w
Fernández, V., Guzmán-Delgado, P., Graça, J., Santos, S., and Gil, L. (2016). Cuticle structure in relation to chemical composition: re-assessing the prevailing model. Front. Plant Sci. 7:427. doi: 10.3389/fpls.2016.00427
Flagel, L. E., and Wendel, J. F. (2009). Gene duplication and evolutionary novelty in plants. New Phytol. 183, 557–564. doi: 10.1111/j.1469-8137.2009.02923.x
Frugoli, J. A., Mcpeek, M. A., Thomas, T. L., and Mcclung, C. R. (1998). Intron loss and gain during evolution of the catalase gene family in angiosperms. Genetics 149, 355–365. doi: 10.1093/genetics/149.1.355
Go, Y. S., Kim, H., Kim, H. J., and Suh, M. C. (2014). Arabidopsis cuticular wax biosynthesis is negatively regulated by the DEWAX gene encoding an AP2/ERF-type transcription factor. Plant Cell 26, 1666–1680. doi: 10.1105/tpc.114.123307
González-Mellado, D., Salas, J. J., Venegas-Calerón, M., Moreno-Pérez, A. J., Garcés, R., and Martínez-Force, E. (2019). Functional characterization and structural modelling of Helianthus annuus (sunflower) ketoacyl-CoA synthases and their role in seed oil composition. Planta 249, 1823–1836. doi: 10.1007/s00425-019-03126-1
Grimplet, J., Pimentel, D., Agudelo-Romero, P., Martinez-Zapater, J. M., and Fortes, A. M. (2017). The LATERAL ORGAN BOUNDARIES Domain gene family in grapevine: genome-wide characterization and expression analyses during developmental processes and stress responses. Sci. Rep. 7, 1–18. doi: 10.1038/s41598-017-16240-5
Guo, H.-S., Zhang, Y.-M., Sun, X.-Q., Li, M.-M., Hang, Y.-Y., and Xue, J.-Y. (2016). Evolution of the KCS gene family in plants: the history of gene duplication, sub/neofunctionalization and redundancy. Mol. Genet. Genom. 291, 739–752. doi: 10.1007/s00438-015-1142-3
Guo, W., Wu, Q., Yang, L., Hu, W., Liu, D., and Liu, Y. (2020). Ectopic expression of CsKCS6 from navel orange promotes the production of very-long-chain fatty acids (VLCFAs) and increases the abiotic stress tolerance of Arabidopsis thaliana. Front. Plant Sci. 11:564656. doi: 10.3389/fpls.2020.564656
Guyomarc’h, S., Boutté, Y., and Laplaze, L. (2021). AP2/ERF transcription factors orchestrate very long chain fatty acid biosynthesis during Arabidopsis lateral root development. Mol. Plant 14, 205–207. doi: 10.1016/j.molp.2021.01.004
Han, G., Lu, C., Guo, J., Qiao, Z., Sui, N., Qiu, N., et al. (2020). C2H2 zinc finger proteins: master regulators of abiotic stress responses in plants. Front. Plant Sci. 11:115.
Han, J., Fang, J., Wang, C., Yin, Y., Sun, X., Leng, X., et al. (2014). Grapevine microRNAs responsive to exogenous gibberellin. BMC Genomics 15:111. doi: 10.1186/1471-2164-15-111
Han, X., Wei, X., Lu, W., Wu, Q., Mao, L., and Luo, Z. (2022). Transcriptional regulation of KCS gene by bZIP29 and MYB70 transcription factors during ABA-stimulated wound suberization of kiwifruit (Actinidia deliciosa). BMC Plant Biol. 22:23. doi: 10.1186/s12870-021-03407-6
Hao, S., Ma, Y., Zhao, S., Ji, Q., Zhang, K., Yang, M., et al. (2017). McWRI1, a transcription factor of the AP2/SHEN family, regulates the biosynthesis of the cuticular waxes on the apple fruit surface under low temperature. PLoS One 12:e0186996. doi: 10.1371/journal.pone.0186996
Hegebarth, D., Buschhaus, C., Joubès, J., Thoraval, D., Bird, D., and Jetter, R. (2017). Arabidopsis ketoacyl-CoA synthase 16 (KCS16) forms C36/C38 acyl precursors for leaf trichome and pavement surface wax. Plant Cell Environ. 40, 1761–1776. doi: 10.1111/pce.12981
Huai, D., Xue, X., Li, Y., Wang, P., Li, J., Yan, L., et al. (2020). Genome-wide identification of peanut KCS genes reveals that AhKCS1 and AhKCS28 are involved in regulating VLCFA contents in seeds. Front. Plant Sci. 11:406. doi: 10.3389/fpls.2020.00406
James, D. W. Jr., Lim, E., Keller, J., Plooy, I., Ralston, E., and Dooner, H. K. (1995). Directed tagging of the Arabidopsis FATTY ACID ELONGATION1 (FAE1) gene with the maize transposon activator. Plant Cell 7, 309–319. doi: 10.1105/tpc.7.3.309
Joubès, J., Raffaele, S., Bourdenx, B., Garcia, C., Laroche-Traineau, J., Moreau, P., et al. (2008). The VLCFA elongase gene family in Arabidopsis thaliana: phylogenetic analysis, 3D modelling and expression profiling. Plant Mol. Biol. 67, 547–566. doi: 10.1007/s11103-008-9339-z
Kanehisa, M., and Goto, S. (2000). KEGG: kyoto encyclopedia of genes and genomes. Nucleic Acids Res. 28, 27–30.
Katiyar, A., Smita, S., Chinnusamy, V., Pandey, D. M., and Bansal, K. (2012a). Identification of miRNAs in sorghum by using bioinformatics approach. Plant Signal. Behav. 7, 246–259. doi: 10.4161/psb.18914
Katiyar, A., Smita, S., Lenka, S. K., Rajwanshi, R., Chinnusamy, V., and Bansal, K. C. (2012b). Genome-wide classification and expression analysis of MYB transcription factor families in rice and Arabidopsis. BMC Genom. 13:544. doi: 10.1186/1471-2164-13-544
Kim, D., and Langmead, B. (2015). Salzberg SLHISAT. A fast spliced aligner with low memory requirements. Nat. Methods 12, 357–360. doi: 10.1038/nmeth.3317
Kim, J., Jung, J. H., Lee, S. B., Go, Y. S., Kim, H. J., Cahoon, R., et al. (2013). Arabidopsis 3-ketoacyl-coenzyme a synthase9 is involved in the synthesis of tetracosanoic acids as precursors of cuticular waxes, suberins, sphingolipids, and phospholipids. Plant Physiol. 162, 567–580. doi: 10.1104/pp.112.210450
Kim, J., Lee, S. B., and Suh, M. C. (2021). Arabidopsis 3-ketoacyl-CoA synthase 4 is essential for root and pollen tube growth. J. Plant Biol. 64, 155–165. doi: 10.1007/s12374-020-09288-w
Kim, J.-S., Mizoi, J., Yoshida, T., Fujita, Y., Nakajima, J., Ohori, T., et al. (2011). An ABRE promoter sequence is involved in osmotic stress-responsive expression of the DREB2A gene, which encodes a transcription factor regulating drought-inducible genes in Arabidopsis. Plant Cell Physiol. 52, 2136–2146. doi: 10.1093/pcp/pcr143
Kogure, K., Watanabe, A., and Ito, Y. (2022). Interaction of ONION2 ketoacyl CoA synthase with ketoacyl CoA reductase of rice. Mol. Biol. Rep. 49, 1643–1647. doi: 10.1007/s11033-021-07060-y
Kohl, M., Wiese, S., and Warscheid, B. (2011). “Cytoscape: software for visualization and analysis of biological networks,” in Data Mining in Proteomics, eds M. Hamacher, M. Eisenacher, and C. Stephan (Cham: Springer), 291–303. doi: 10.1007/978-1-60761-987-1_18
Lam, P., Zhao, L., Eveleigh, N., Yu, Y., Chen, X., and Kunst, L. (2015). The exosome and trans-acting small interfering RNAs regulate cuticular wax biosynthesis during Arabidopsis inflorescence stem development. Plant Physiol. 167, 323–336. doi: 10.1104/pp.114.252825
Law, C. W., Alhamdoosh, M., Su, S., Dong, X., Tian, L., Smyth, G. K., et al. (2016). RNA-seq analysis is easy as 1-2-3 with limma, Glimma and edgeR. F1000Research 5:ISCBCommJ-1408. doi: 10.12688/f1000research.9005.3
Lee, S. B., Jung, S. J., Go, Y. S., Kim, H. U., Kim, J. K., Cho, H. J., et al. (2009). Two Arabidopsis 3-ketoacyl CoA synthase genes, KCS20 and KCS2/DAISY, are functionally redundant in cuticular wax and root suberin biosynthesis, but differentially controlled by osmotic stress. Plant J. 60, 462–475. doi: 10.1111/j.1365-313X.2009.03973.x
Lee, S. B., and Suh, M. C. (2013). Recent advances in cuticular wax biosynthesis and its regulation in Arabidopsis. Mol. Plant 6, 246–249. doi: 10.1093/mp/sss159
Lewandowska, M., Keyl, A., and Feussner, I. (2020). Wax biosynthesis in response to danger: its regulation upon abiotic and biotic stress. New Phytol. 227, 698–713. doi: 10.1111/nph.16571
Li, C., Haslam, T. M., Krüger, A., Schneider, L. M., Mishina, K., Samuels, L., et al. (2018). The β-ketoacyl-CoA synthase Hv KCS1, encoded by Cer-zh, plays a key role in synthesis of barley leaf wax and germination of barley powdery mildew. Plant Cell Physiol. 59, 811–827. doi: 10.1093/pcp/pcy020
Li, H., Handsaker, B., Wysoker, A., Fennell, T., Ruan, J., Homer, N., et al. (2009). The sequence alignment/map format and SAMtools. Bioinformatics 25, 2078–2079. doi: 10.1093/bioinformatics/btp352
Li, S. (2015). The Arabidopsis thaliana TCP transcription factors: a broadening horizon beyond development. Plant Signal Behav. 10:e1044192. doi: 10.1080/15592324.2015.1044192
Li, S., Wang, X., He, S., Li, J., Huang, Q., Imaizumi, T., et al. (2016). CFLAP1 and CFLAP2 are two bHLH transcription factors participating in synergistic regulation of AtCFL1-mediated cuticle development in Arabidopsis. PLoS Genet. 12:e1005744. doi: 10.1371/journal.pgen.1005744
Lian, X.-Y., Gao, H.-N., Jiang, H., Liu, C., and Li, Y.-Y. (2021). MdKCS2 increased plant drought resistance by regulating wax biosynthesis. Plant Cell Rep. 40, 2357–2368. doi: 10.1007/s00299-021-02776-4
Lian, X.-Y., Wang, X., Gao, H.-N., Jiang, H., Mao, K., You, C.-X., et al. (2020). Genome wide analysis and functional identification of MdKCS genes in apple. Plant Physiol. Biochem. 151, 299–312. doi: 10.1016/j.plaphy.2020.03.034
Liu, C., Wright, B., Allen-Vercoe, E., Gu, H., and Beiko, R. (2018). Phylogenetic clustering of genes reveals shared evolutionary trajectories and putative gene functions. Genome Biol. Evol. 10, 2255–2265. doi: 10.1093/gbe/evy178
Liu, L., Xu, W., Hu, X., Liu, H., and Lin, Y. (2016). W-box and G-box elements play important roles in early senescence of rice flag leaf. Sci. Rep. 6, 1–9. doi: 10.1038/srep20881
Liu, T., Tang, J., Chen, L., Zeng, J., Wen, J., Yi, B., et al. (2019). Differential expression of miRNAs and their targets in wax-deficient rapeseed. Sci. Rep. 9, 1–12. doi: 10.1038/s41598-019-48439-z
Lokesh, U., Venkatesh, B., Kiranmai, K., Nareshkumar, A., Amarnathareddy, V., Rao, G. L., et al. (2019). Overexpression of ß-Ketoacyl Co-A Synthase1 gene improves tolerance of drought susceptible groundnut (Arachis hypogaea L.) cultivar K-6 by increased leaf epicuticular wax accumulation. Front. Plant Sci. 9:1869. doi: 10.3389/fpls.2018.01869
Ma, D., Dong, S., Zhang, S., Wei, X., Xie, Q., Ding, Q., et al. (2021). Chromosome-level reference genome assembly provides insights into aroma biosynthesis in passion fruit (Passiflora edulis). Mol. Ecol. Resour. 21, 955–968. doi: 10.1111/1755-0998.13310
Markham, J. E., Molino, D., Gissot, L., Bellec, Y., Hématy, K., Marion, J., et al. (2011). Sphingolipids containing very-long-chain fatty acids define a secretory pathway for specific polar plasma membrane protein targeting in Arabidopsis. Plant Cell 23, 2362–2378. doi: 10.1105/tpc.110.080473
Masoudi-Nejad, A., Goto, S., Endo, T. R., and Kanehisa, M. (2007). “KEGG bioinformatics resource for plant genomics research,” in Plant Bioinformatics, ed. D. Edwards (Cham: Springer), 437–458. doi: 10.1007/978-1-59745-535-0_21
Munhoz, C., Santos, A., Arenhart, R., Santini, L., Monteiro-Vitorello, C., and Vieira, M. (2015). Analysis of plant gene expression during passion fruit–Xanthomonas axonopodis interaction implicates lipoxygenase 2 in host defence. Ann. Appl. Biol. 167, 135–155. doi: 10.1111/aab.12215
Ohtani, M. (2017). Transcriptional regulation of snRNAs and its significance for plant development. J. Plant Res. 130, 57–66. doi: 10.1007/s10265-016-0883-3
Ois Roudier, F., Gissot, L., De Ric Beaudoin, F., Haslam, R., Michaelson, L., Marion, J., et al. (2010). Very-long-chain fatty acids are involved in polar auxin transport and developmental patterning in Arabidopsis. Plant Cell 22, 364–375.
Oshima, Y., Shikata, M., Koyama, T., Ohtsubo, N., Mitsuda, N., and Ohme-Takagi, M. (2013). MIXTA-like transcription factors and WAX INDUCER1/SHINE1 coordinately regulate cuticle development in Arabidopsis and Torenia fournieri. Plant Cell 25, 1609–1624. doi: 10.1105/tpc.113.110783
Pant, B. D., Buhtz, A., Kehr, J., and Scheible, W. R. (2008). MicroRNA399 is a long-distance signal for the regulation of plant phosphate homeostasis. Plant J. 53, 731–738. doi: 10.1111/j.1365-313X.2007.03363.x
Paul, S., De La Fuente-Jiménez, J. L., Manriquez, C. G., and Sharma, A. (2020). Identification, characterization and expression analysis of passion fruit (Passiflora edulis) microRNAs. 3 Biotech 10, 1–9. doi: 10.1007/s13205-019-2000-5
Piya, S., Shrestha, S. K., Binder, B., Stewart, C. N. Jr., and Hewezi, T. (2014). Protein-protein interaction and gene co-expression maps of ARFs and Aux/IAAs in Arabidopsis. Front. Plant Sci. 5:744. doi: 10.3389/fpls.2014.00744
Porto, M., Pinheiro, M., Batista, V., Dos Santos Filho, R., Filho Pde, A., and de Lima, L. M. (2014). Plant promoters: an approach of structure and function. Mol. Biotechnol. 56, 38–49. doi: 10.1007/s12033-013-9713-1
Raffaele, S., Leger, A., and Roby, D. (2009). Very long chain fatty acid and lipid signaling in the response of plants to pathogens. Plant Signal. Behav. 4, 94–99. doi: 10.4161/psb.4.2.7580
Raffaele, S., Vailleau, F., Léger, A., Joubès, J., Miersch, O., Huard, C., et al. (2008). A MYB transcription factor regulates very-long-chain fatty acid biosynthesis for activation of the hypersensitive cell death response in Arabidopsis. Plant Cell 20, 752–767. doi: 10.1105/tpc.107.054858
Raza, A., Tabassum, J., Mubarik, M., Anwar, S., Zahra, N., Sharif, Y., et al. (2021). Hydrogen sulfide: an emerging component against abiotic stress in plants. Plant Biol. [Epub ahead of print]. doi: 10.1111/plb.13368
Raza, A., Tabassum, J., Zahid, Z., Charagh, S., Bashir, S., Barmukh, R., et al. (2022). Advances in “omics” approaches for improving toxic metals/metalloids tolerance in plants. Front. Plant Sci. 12:794373. doi: 10.3389/fpls.2021.794373
Ridout, K. E., Dixon, C. J., and Filatov, D. A. (2010). Positive selection differs between protein secondary structure elements in Drosophila. Genome Biol. Evol. 2, 166–179. doi: 10.1093/gbe/evq008
Rizwan, H. M., Zhimin, L., Harsonowati, W., Waheed, A., Qiang, Y., Yousef, A. F., et al. (2021). Identification of fungal pathogens to control postharvest passion fruit (Passiflora edulis) decays and multi-omics comparative pathway analysis reveals purple is more resistant to pathogens than a yellow cultivar. J. Fungi 7:879. doi: 10.3390/jof7100879
Rojas-Gracia, P., Roque, E., Medina, M., López-Martín, M. J., Cañas, L. A., Beltrán, J. P., et al. (2019). The DOF transcription factor SlDOF10 regulates vascular tissue formation during ovary development in tomato. Front. Plant Sci. 10:216. doi: 10.3389/fpls.2019.00216
Roncaglia, P., Martone, M. E., Hill, D. P., Berardini, T. Z., Foulger, R. E., Imam, F. T., et al. (2013). The Gene Ontology (GO) cellular component ontology: integration with SAO (Subcellular Anatomy Ontology) and other recent developments. J. Biomed. Semant. 4, 1–11. doi: 10.1186/2041-1480-4-20
Roudier, F., Gissot, L., Beaudoin, F., Haslam, R., Michaelson, L., Marion, J., et al. (2010). Very-long-chain fatty acids are involved in polar auxin transport and developmental patterning in Arabidopsis. Plant Cell 22, 364–375. doi: 10.1105/tpc.109.071209
Sagar, M., Pandey, N., Qamar, N., Singh, B., and Shukla, A. (2015). Domain analysis of 3 Keto Acyl-CoA synthase for structural variations in Vitis vinifera and Oryza brachyantha using comparative modelling. Interdiscip. Sci. Comput. Life Sci. 7, 7–20. doi: 10.1007/s12539-013-0017-8
Samad, A. F., Sajad, M., Nazaruddin, N., Fauzi, I. A., Murad, A., Zainal, Z., et al. (2017). MicroRNA and transcription factor: key players in plant regulatory network. Front. Plant Sci. 8:565. doi: 10.3389/fpls.2017.00565
Santos, A. A., Penha, H. A., Bellec, A., De Freitas Munhoz, C., Pedrosa-Harand, A., Bergès, H., et al. (2014). Begin at the beginning: a BAC-end view of the passion fruit (Passiflora) genome. BMC Genomics 15:816. doi: 10.1186/1471-2164-15-816
Schmittgen, T. D., and Livak, K. J. (2008). Analyzing real-time PCR data by the comparative CT method. Nat. Protoc. 3, 1101–1108. doi: 10.1038/nprot.2008.73
Seo, P. J., Lee, S. B., Suh, M. C., Park, M.-J., Go, Y. S., and Park, C.-M. (2011). The MYB96 transcription factor regulates cuticular wax biosynthesis under drought conditions in Arabidopsis. Plant Cell 23, 1138–1152. doi: 10.1105/tpc.111.083485
Serra, O., Soler, M., Hohn, C., Franke, R., Schreiber, L., Prat, S., et al. (2009). Silencing of StKCS6 in potato periderm leads to reduced chain lengths of suberin and wax compounds and increased peridermal transpiration. J. Exp. Bot. 60, 697–707. doi: 10.1093/jxb/ern314
Sharif, R., Raza, A., Chen, P., Li, Y., El-Ballat, E. M., Rauf, A., et al. (2021). HD-ZIP gene family: potential roles in improving plant growth and regulating stress-responsive mechanisms in plants. Genes 12:1256. doi: 10.3390/genes12081256
Sibéril, Y., Doireau, P., and Gantet, P. (2001). Plant bZIP G-box binding factors. Modular structure and activation mechanisms. Eur. J. Biochem. 268, 5655–5666. doi: 10.1046/j.0014-2956.2001.02552.x
Skalicky, M., Karademir, E., Rahim, J., Islam, M. S., Sytar, O., Ahmed, S., et al. (2021). Potential role of plant growth regulators in administering crucial processes against abiotic stresses. Front. Agron. 3:648694. doi: 10.3389/fagro.2021.648694
Song, Q.-X., Liu, Y.-F., Hu, X.-Y., Zhang, W.-K., Ma, B., Chen, S.-Y., et al. (2011). Identification of miRNAs and their target genes in developing soybean seeds by deep sequencing. BMC Plant Biol. 11:5. doi: 10.1186/1471-2229-11-5
Su, C., Chen, K., Ding, Q., Mou, Y., Yang, R., Zhao, M., et al. (2018). Proteomic analysis of the function of a novel cold-regulated multispanning transmembrane protein COR413-PM1 in Arabidopsis. Int. J. Mol. Sci. 19:2572. doi: 10.3390/ijms19092572
Su, W., Raza, A., Gao, A., Jia, Z., Zhang, Y., Hussain, M. A., et al. (2021a). Genome-wide analysis and expression profile of superoxide dismutase (SOD) gene family in rapeseed (Brassica napus L.) under different hormones and abiotic stress conditions. Antioxidants 10:1182. doi: 10.3390/antiox10081182
Su, W., Raza, A., Zeng, L., Gao, A., Lv, Y., Ding, X., et al. (2021b). Genome-wide analysis and expression patterns of lipid phospholipid phospholipase gene family in Brassica napus L. BMC Genomics 22:548. doi: 10.1186/s12864-021-07862-1
Sun, X., Wang, Y., and Sui, N. (2018). Transcriptional regulation of bHLH during plant response to stress. Biochem. Biophys. Res. Commun. 503, 397–401. doi: 10.1016/j.bbrc.2018.07.123
Sunkar, R., and Zhu, J.-K. (2004). Novel and stress-regulated microRNAs and other small RNAs from Arabidopsis. Plant Cell 16, 2001–2019. doi: 10.1105/tpc.104.022830
Tian, F., Yang, D.-C., Meng, Y.-Q., Jin, J., and Gao, G. (2020). PlantRegMap: charting functional regulatory maps in plants. Nucleic Acids Res. 48, D1104–D1113. doi: 10.1093/nar/gkz1020
Todd, J., Post-Beittenmiller, D., and Jaworski, J. G. (1999). KCS1 encodes a fatty acid elongase 3-ketoacyl-CoA synthase affecting wax biosynthesis in Arabidopsis thaliana. Plant J. 17, 119–130. doi: 10.1046/j.1365-313x.1999.00352.x
Tong, T., Fang, Y.-X., Zhang, Z., Zheng, J., Zhang, X., Li, J., et al. (2021). Genome-wide identification and expression pattern analysis of the KCS gene family in barley. Plant Growth Regul. 93, 89–103. doi: 10.1007/s10725-020-00668-3
Trinh, D.-C., Lavenus, J., Goh, T., Boutté, Y., Drogue, Q., Vaissayre, V., et al. (2019). PUCHI regulates very long chain fatty acid biosynthesis during lateral root and callus formation. Proc. Natl. Acad. Sci. U.S.A. 116, 14325–14330. doi: 10.1073/pnas.1906300116
Trivedi, P., Nguyen, N., Hykkerud, A. L., Häggman, H., Martinussen, I., Jaakola, L., et al. (2019). Developmental and environmental regulation of cuticular wax biosynthesis in fleshy fruits. Front. Plant Sci. 10:431. doi: 10.3389/fpls.2019.00431
Van de Peer, Y., Maere, S., and Meyer, A. (2009). The evolutionary significance of ancient genome duplications. Nat. Rev. Genet. 10, 725–732. doi: 10.1038/nrg2600
Varkonyi-Gasic, E., Gould, N., Sandanayaka, M., Sutherland, P., and Macdiarmid, R. M. (2010). Characterisation of microRNAs from apple (Malus domestica ‘Royal Gala’) vascular tissue and phloem sap. BMC Plant Biol. 10:159. doi: 10.1186/1471-2229-10-159
Wang, Q., Du, X., Zhou, Y., Xie, L., Bie, S., Tu, L., et al. (2020). The β-ketoacyl-CoA synthase KCS13 regulates the cold response in cotton by modulating lipid and oxylipin biosynthesis. J. Exp. Bot. 71, 5615–5630. doi: 10.1093/jxb/eraa254
Wang, Y., Jin, S., Xu, Y., Li, S., Zhang, S., Yuan, Z., et al. (2020). Overexpression of BnKCS1-1, BnKCS1-2, and BnCER1-2 promotes cuticular wax production and increases drought tolerance in Brassica napus. Crop J. 8, 26–37. doi: 10.1016/j.cj.2019.04.006
Wang, X., Guan, Y., Zhang, D., Dong, X., Tian, L., and Qu, L. Q. (2017). A β-ketoacyl-CoA synthase is involved in rice leaf cuticular wax synthesis and requires a CER2-LIKE protein as a cofactor. Plant Physiol. 173, 944–955. doi: 10.1104/pp.16.01527
Wang, Z., Qiao, Y., Zhang, J., Shi, W., and Zhang, J. (2017). Genome wide identification of microRNAs involved in fatty acid and lipid metabolism of Brassica napus by small RNA and degradome sequencing. Gene 619, 61–70. doi: 10.1016/j.gene.2017.03.040
Wang, Y., Liu, G.-J., Yan, X.-F., Wei, Z.-G., and Xu, Z.-R. (2011). MeJA-inducible expression of the heterologous JAZ2 promoter from Arabidopsis in Populus trichocarpa protoplasts. J. Plant Dis. Protect. 118, 69–74. doi: 10.1007/bf03356384
Wang, Y., Yang, X., Chen, Z., Zhang, J., Si, K., Xu, R., et al. (2022). Function and transcriptional regulation of CsKCS20 in the elongation of very-long-chain fatty acids and wax biosynthesis in Citrus sinensis flavedo. Hortic. Res. 9:uhab027. doi: 10.1093/hr/uhab027
Weidenbach, D., Jansen, M., Bodewein, T., Nagel, K. A., and Schaffrath, U. (2015). Shoot and root phenotyping of the barley mutant kcs6 (3-ketoacyl-CoA synthase6) depleted in epicuticular waxes under water limitation. Plant Signal. Behav. 10:e1003752. doi: 10.1080/15592324.2014.1003752
Wen, C.-L., Cheng, Q., Zhao, L., Mao, A., Yang, J., Yu, S., et al. (2016). Identification and characterisation of Dof transcription factors in the cucumber genome. Sci. Rep. 6, 1–11. doi: 10.1038/srep23072
Wen, Y., Raza, A., Chu, W., Zou, X., Cheng, H., Hu, Q., et al. (2021). Comprehensive in silico characterization and expression profiling of TCP gene family in rapeseed. Front. Genet. 12:794297. doi: 10.3389/fgene.2021.794297
Wingender, R., Röhrig, H., Höricke, C., and Schell, J. (1990). cis-regulatory elements involved in ultraviolet light regulation and plant defense. Plant Cell 2, 1019–1026. doi: 10.1105/tpc.2.10.1019
Witkos, M. T., Koscianska, E., and Krzyzosiak, W. J. (2011). Practical aspects of microRNA target prediction. Curr. Mol. Med. 11, 93–109. doi: 10.2174/156652411794859250
Wong, A., Gehring, C., and Irving, H. R. (2015). Conserved functional motifs and homology modeling to predict hidden moonlighting functional sites. Front. Bioeng. Biotechnol. 3:82. doi: 10.3389/fbioe.2015.00082
Wu, G.-Z., and Xue, H.-W. (2010). Arabidopsis β-ketoacyl-[acyl carrier protein] synthase I is crucial for fatty acid synthesis and plays a role in chloroplast division and embryo development. Plant Cell 22, 3726–3744. doi: 10.1105/tpc.110.075564
Xia, Z., Huang, D., Zhang, S., Wang, W., Ma, F., Wu, B., et al. (2021). Chromosome-scale genome assembly provides insights into the evolution and flavor synthesis of passion fruit (Passiflora edulis Sims). Hortic. Res. 8, 1–14. doi: 10.1038/s41438-020-00455-1
Xiao, G. H., Wang, K., Huang, G., and Zhu, Y. X. (2016). Genome-scale analysis of the cotton KCS gene family revealed a binary mode of action for gibberellin A regulated fiber growth. J. Integr. Plant Biol. 58, 577–589. doi: 10.1111/jipb.12429
Xiong, J., Liu, L., Ma, X., Li, F., Tang, C., Li, Z., et al. (2020). Characterization of PtAOS1 promoter and three novel interacting proteins responding to drought in Poncirus trifoliata. Int. J. Mol. Sci. 21:4705. doi: 10.3390/ijms21134705
Xu, G., Guo, C., Shan, H., and Kong, H. (2012). Divergence of duplicate genes in exon–intron structure. Proc. Natl. Acad. Sci. U.S.A. 109, 1187–1192. doi: 10.1073/pnas.1109047109
Xu, K., Huang, X., Wu, M., Wang, Y., Chang, Y., Liu, K., et al. (2014). A rapid, highly efficient and economical method of Agrobacterium-mediated in planta transient transformation in living onion epidermis. PLoS One 9:e83556. doi: 10.1371/journal.pone.0083556
Xuan, L., Zhang, C., Yan, T., Wu, D., Hussain, N., Li, Z., et al. (2018). TRANSPARENT TESTA 4-mediated flavonoids negatively affect embryonic fatty acid biosynthesis in Arabidopsis. Plant Cell Environ. 41, 2773–2790. doi: 10.1111/pce.13402
Xue, D., Zhang, X., Lu, X., Chen, G., and Chen, Z.-H. (2017). Molecular and evolutionary mechanisms of cuticular wax for plant drought tolerance. Front. Plant Sci. 8:621. doi: 10.3389/fpls.2017.00621
Xue, Y., Jiang, J., Yang, X., Jiang, H., Du, Y., Liu, X., et al. (2020). Genome-wide mining and comparative analysis of fatty acid elongase gene family in Brassica napus and its progenitors. Gene 747:144674. doi: 10.1016/j.gene.2020.144674
Yang, H., Mei, W., Wan, H., Xu, R., and Cheng, Y. (2021). Comprehensive analysis of KCS gene family in Citrinae reveals the involvement of CsKCS2 and CsKCS11 in fruit cuticular wax synthesis at ripening. Plant Sci. 310:110972. doi: 10.1016/j.plantsci.2021.110972
Yang, T., Li, Y., Liu, Y., He, L., Liu, A., Wen, J., et al. (2021). The 3-ketoacyl-CoA synthase WFL is involved in lateral organ development and cuticular wax synthesis in Medicago truncatula. Plant Mol. Biol. 105, 193–204. doi: 10.1007/s11103-020-01080-1
Yang, H., Zhu, Z., Zhang, M., Li, X., Xu, R., Zhu, F., et al. (2022). CitWRKY28 and CitNAC029 promote the synthesis of cuticular wax by activating CitKCS gene expression in citrus fruit. Plant Cell Rep. [Epub ahead of print]. doi: 10.1007/s00299-021-02826-x
Yang, S. U., Kim, H., Kim, R. J., Kim, J., and Suh, M. C. (2020). AP2/DREB transcription factor RAP2.4 activates cuticular wax biosynthesis in Arabidopsis leaves under drought. Front. Plant Sci. 11:895. doi: 10.3389/fpls.2020.00895
Yang, Z., Yang, X., Dong, S., Ge, Y., Zhang, X., Zhao, X., et al. (2020). Overexpression of β-ketoacyl-CoA synthase from Vitis vinifera L. Improves salt tolerance in Arabidopsis thaliana. Front. Plant Sci. 11:1687. doi: 10.3389/fpls.2020.564385
Yeats, T. H., and Rose, J. K. (2013). The formation and function of plant cuticles. Plant Physiol. 163, 5–20. doi: 10.1104/pp.113.222737
Zanca, A. S., Vicentini, R., Ortiz-Morea, F. A., Del Bem, L. E., Da Silva, M. J., Vincentz, M., et al. (2010). Identification and expression analysis of microRNAs and targets in the biofuel crop sugarcane. BMC Plant Biol. 10:260. doi: 10.1186/1471-2229-10-260
Zhang, B., Pan, X., Cobb, G. P., and Anderson, T. A. (2006). Plant microRNA: a small regulatory molecule with big impact. Dev. Biol. 289, 3–16. doi: 10.1016/j.ydbio.2005.10.036
Zhang, Y., Zhu, X., Chen, X., Song, C., Zou, Z., Wang, Y., et al. (2014). Identification and characterization of cold-responsive microRNAs in tea plant (Camellia sinensis) and their targets using high-throughput sequencing and degradome analysis. BMC Plant Biol. 14:271. doi: 10.1186/s12870-014-0271-x
Zhang, Y.-L., You, C.-X., Li, Y.-Y., and Hao, Y.-J. (2020). Advances in biosynthesis, regulation, and function of apple cuticular wax. Front. Plant Sci. 11:1165. doi: 10.3389/fpls.2020.01165
Zhang, Y.-L., Zhang, C.-L., Wang, G.-L., Wang, Y.-X., Qi, C.-H., Zhao, Q., et al. (2019). The R2R3 MYB transcription factor MdMYB30 modulates plant resistance against pathogens by regulating cuticular wax biosynthesis. BMC Plant Biol. 19:362. doi: 10.1186/s12870-019-1918-4
Zhao, C., Xia, H., Cao, T., Yang, Y., Zhao, S., Hou, L., et al. (2015). Small RNA and degradome deep sequencing reveals peanut microRNA roles in response to pathogen infection. Plant Mol. Biol. Rep. 33, 1013–1029. doi: 10.1007/s11105-014-0806-1
Keywords: very long chain fatty acids, wax biosynthesis, synteny, transcription factor, micro-RNA, gene anthology, stress conditions
Citation: Rizwan HM, Shaozhong F, Li X, Bilal Arshad M, Yousef AF, Chenglong Y, Shi M, Jaber MYM, Anwar M, Hu S-Y, Yang Q, Sun K, Ahmed MAA, Min Z, Oelmüller R, Zhimin L and Chen F (2022) Genome-Wide Identification and Expression Profiling of KCS Gene Family in Passion Fruit (Passiflora edulis) Under Fusarium kyushuense and Drought Stress Conditions. Front. Plant Sci. 13:872263. doi: 10.3389/fpls.2022.872263
Received: 09 February 2022; Accepted: 03 March 2022;
Published: 25 April 2022.
Edited by:
Mohammad Anwar Hossain, Bangladesh Agricultural University, BangladeshReviewed by:
Rahat Sharif, Yangzhou University, ChinaMohammad Irfan, Cornell University, United States
Copyright © 2022 Rizwan, Shaozhong, Li, Bilal Arshad, Yousef, Chenglong, Shi, Jaber, Anwar, Hu, Yang, Sun, Ahmed, Min, Oelmüller, Zhimin and Chen. This is an open-access article distributed under the terms of the Creative Commons Attribution License (CC BY). The use, distribution or reproduction in other forums is permitted, provided the original author(s) and the copyright owner(s) are credited and that the original publication in this journal is cited, in accordance with accepted academic practice. No use, distribution or reproduction is permitted which does not comply with these terms.
*Correspondence: Lin Zhimin, bGluemhpbWluQGZhYXMuY24=; Faxing Chen, ZnhjaGVuQGZhZnUuZWR1LmNu
†ORCID: Hafiz Muhammad Rizwan, orcid.org/0000-0001-9645-3378
‡These authors have contributed equally to this work