 Keke Liu
 Fang K. Du
94% of researchers rate our articles as excellent or good
Learn more about the work of our research integrity team to safeguard the quality of each article we publish.
Find out more
ORIGINAL RESEARCH article
Front. Plant Sci., 19 May 2022
Sec. Plant Bioinformatics
Volume 13 - 2022 | https://doi.org/10.3389/fpls.2022.858526
This article is part of the Research TopicForest Tree Conservation GenomicsView all 17 articles
The combination of population and landscape genetics can facilitate the understanding of conservation strategy under the changing climate. Here, we focused on the two most diverse and ecologically important evergreen oaks: Quercus aquifolioides and Quercus spinosa in Qinghai–Tibetan Plateau (QTP), which is considered as world’s biodiversity hotspot. We genotyped 1,657 individuals of 106 populations at 15 nuclear microsatellite loci throughout the species distribution range. Spatial patterns of genetic diversity were identified by mapping the allelic richness (AR) and locally common alleles (LCA) according to the circular neighborhood methodology. Migration routes from QTP were detected by historical gene flow estimation. The response pattern of genetic variation to environmental gradient was assessed by the genotype–environment association (GEA) analysis. The overall genetic structure showed a high level of intra-species genetic divergence of a strong west-east pattern. The West-to-East migration route indicated the complex demographic history of two oak species. We found evidence of isolation by the environment in Q. aqu-East and Q. spi-West lineage but not in Q. aqu-West and Q. spi-East lineage. Furthermore, priority for conservation should be given to populations that retain higher spatial genetic diversity or isolated at the edge of the distribution range. Our findings indicate that knowledge of spatial diversity and migration route can provide valuable information for the conservation of existing populations. This study provides an important guide for species conservation for two oak species by the integration of population and landscape genetic methods.
The Qinghai–Tibet Plateau (QTP) is the highest and largest plateau with its southern (Himalayas) and southeastern border (Hengduan Mountains, HDM) considered as world’s biodiversity hotspots (Myers et al., 2000; Zhang et al., 2002; Mulch and Chamberlain, 2006; Wen et al., 2014). This plateau harbors abundant species richness with more than 12,000 species of vascular plants, many of which are alpine endemics (Wu et al., 1995; Liu et al., 2000). However, due to anthropogenic habitat loss or fragmentation and climate change, the species diversity has decreased rapidly and led to a sharp decrease in the natural distribution of some species in this region (Xu et al., 2017; Song et al., 2018). Hence, facing the crisis of diversity decrease in the QTP, establishing biodiversity richness areas of conservation priorities is considered one of the most effective strategies for halting the loss of biodiversity (Myers et al., 2000; Geldmann et al., 2018).
Population genetics approach is a useful tool for biodiversity conservation by detecting population substructure, measuring genetic diversity, and identifying potential risks associated with demographic change and inbreeding (Frankham, 1995). One limitation of this approach is the inability to assess spatial patterns of genetic diversity of species across species distribution ranges (Petit et al., 1998). The development of molecular tools in combination with population genetics and geographic information system (GIS) provides opportunities to carry out spatial analyses of genetic diversity patterns (Degen and Scholz, 1998). For example, allelic richness (AR) and locally common alleles (LCA) between circular neighborhoods of sampled populations can be used to interpolate genetic parameters (Hanotte et al., 2002; Hoffmann et al., 2003; Van Zonneveld et al., 2012). Furthermore, recently appearing landscape genetics or genomics approaches integrating genetic variations and landscape characteristics provide novel insights into the molecular basis of local adaptation and conservation strategies (e.g., Manel et al., 2010; Sork et al., 2013; McKinney et al., 2017; Feng and Du, 2022). Therefore, a combination of population and landscape genetics or genomics is likely to provide the best understanding of the molecular imprint of local adaptation and further guide the conservation strategies.
In addition to local adaptation, migrating to new favorable locations is also a response pattern of plants to rapid climate changes, which is important for species conservation (Wulff, 1943; Ozenda, 1988; Donoghue et al., 2001; Donoghue and Smith, 2004). Studies have suggested that plants from the QTP might undergo specific migration patterns, that is, the out-of-QTP hypothesis (Wen et al., 2014, and references therein). Recent phylogenetic studies from various plants have provided evidence to support this hypothesis. For example, Gentiana L. diversified initially on the QTP, then dispersed to eastern China, Europe, and other areas (Favre et al., 2016). Similar patterns have been reported in Allium L. Li M. J. et al. (2021), Lagotis Gaertn. Li et al. (2014), Rhodiola L. Zhang et al. (2014), and Picea A. Dietrich Lockwood et al. (2013) (see summary in Table 1 and reference in Qiu et al., 2011; Liu et al., 2012).
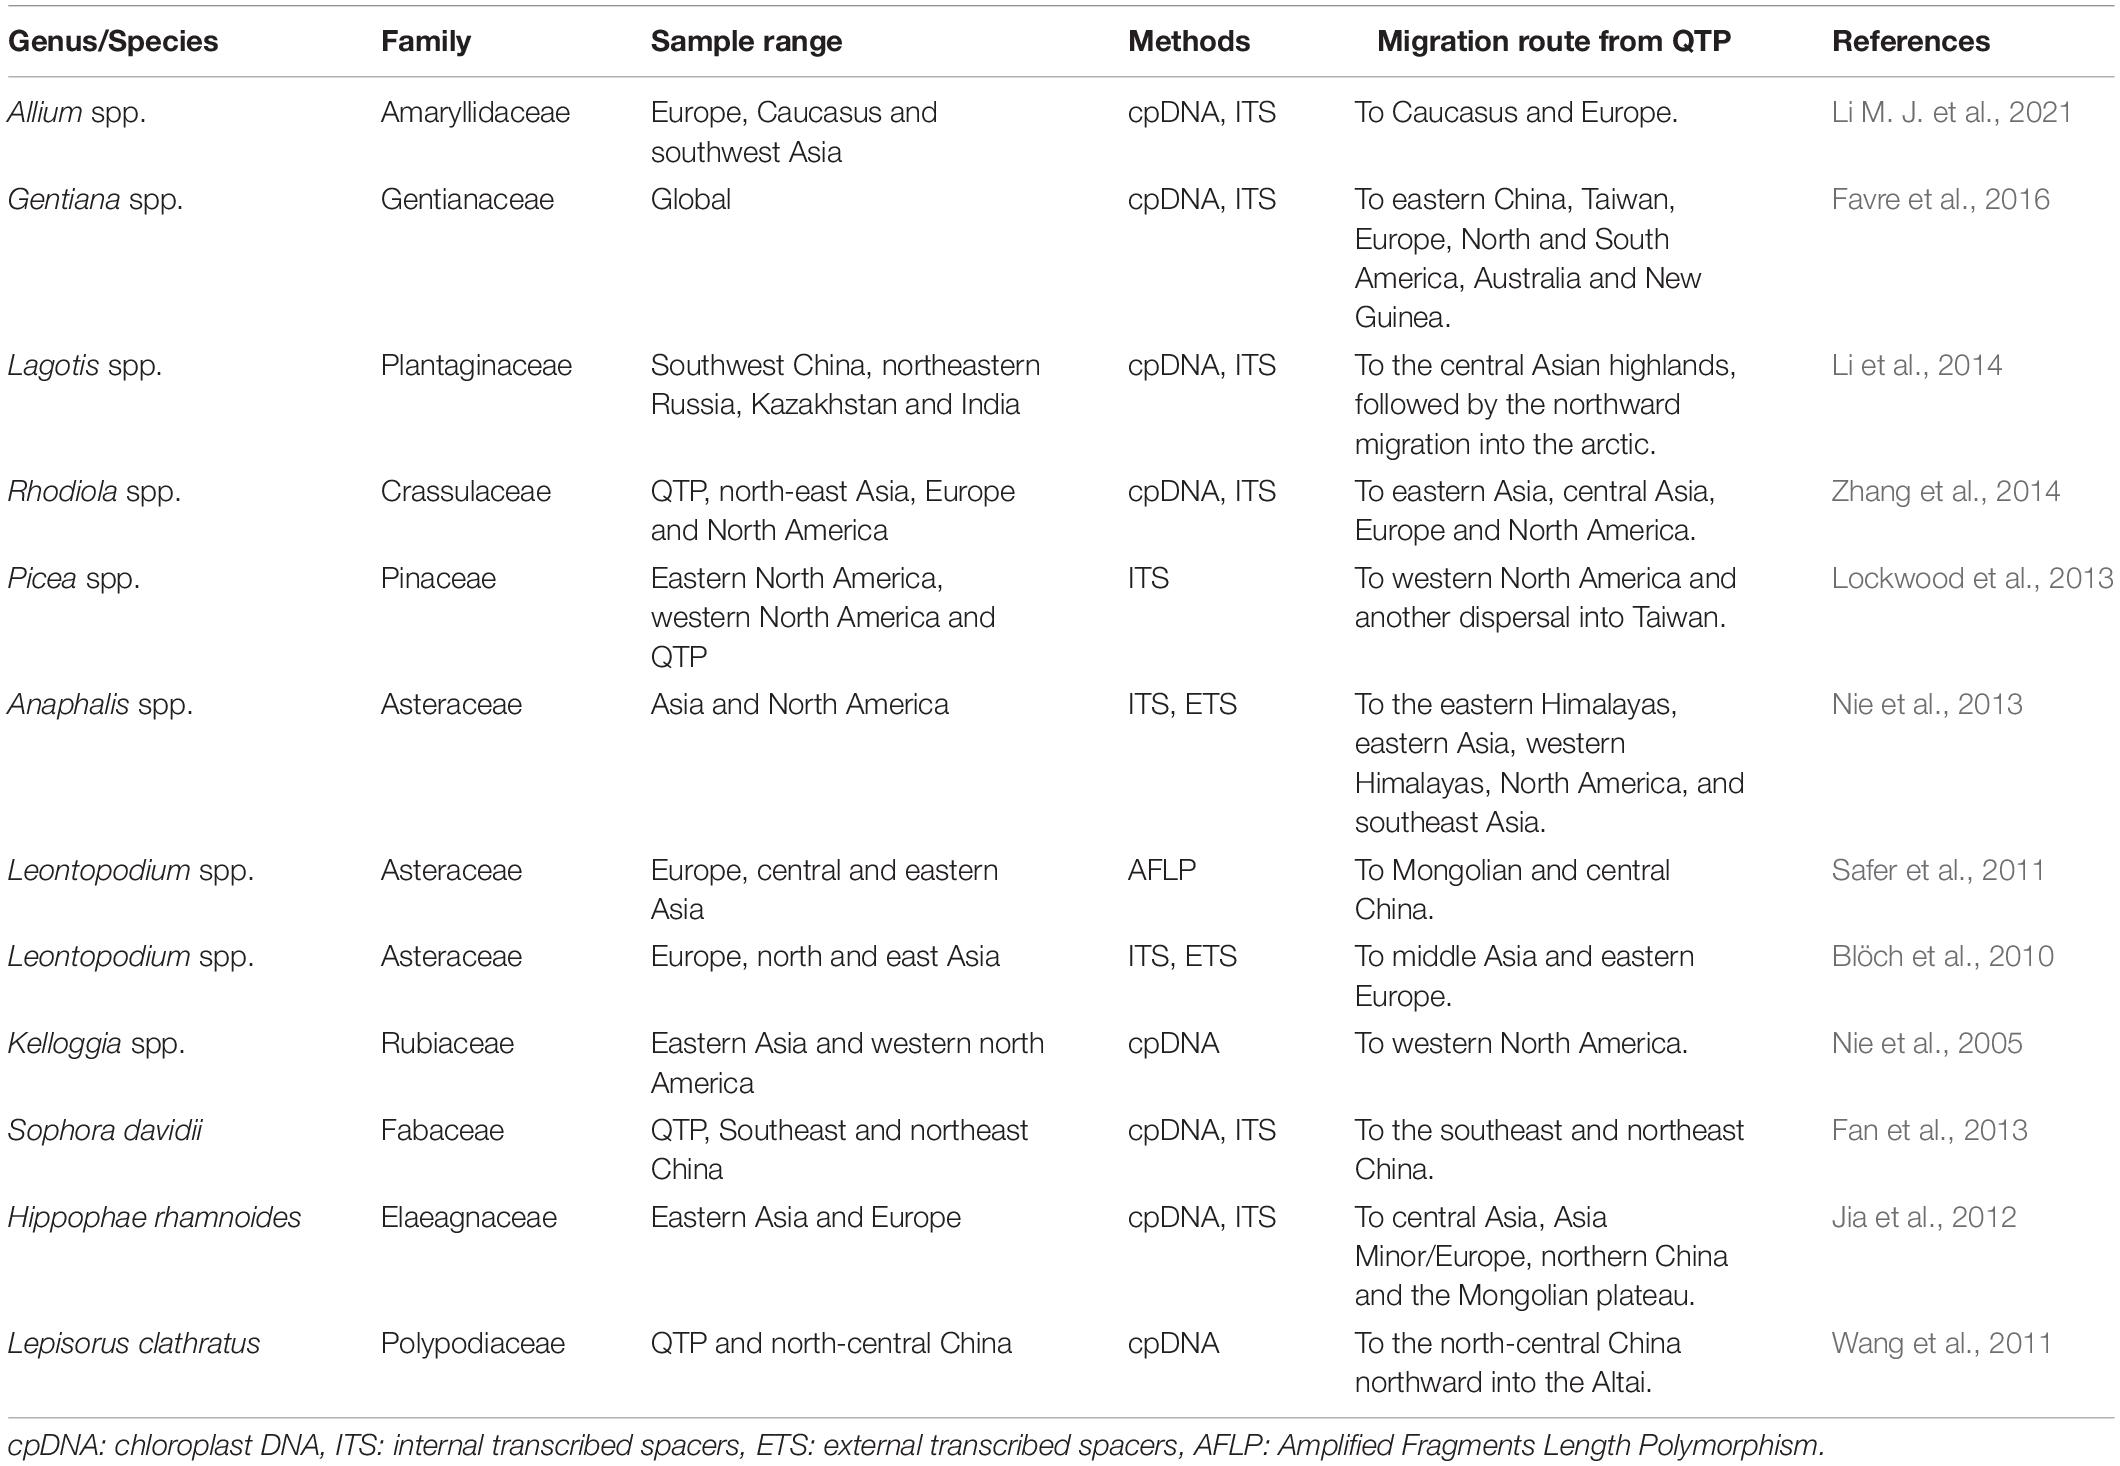
Table 1. Summary of plant studies on the out-of-QTP hypothesis.
Quercus L. is one of the most diverse and ecologically important tree genera in the QTP and adjacent areas (Huang et al., 1999; Denk et al., 2018). Among these oaks in QTP, two evergreen oak species, Quercus aquifolioides Rehd. et Wils. and Quercus spinosa David ex Franchet, belonging to a species complex of the genus Quercus of section Ilex, are the most widely distributed oak species across QTP, HDM, and Qinling Mountains (QM) (Huang et al., 1999). Similar to other oak species, the two species are characterized by monoecious, outcrossing features, wind pollination, and seed dispersal by animals and gravity (Huang et al., 1999; Du et al., 2017; Meng et al., 2017). They display different geographically intraspecific lineages: Q. spinosa was diverged into West and East lineages (Feng et al., 2016; Ju et al., 2019), while Q. aquifolioides was divided into Tibet and Hengduan Mountains–Western Sichuan Plateau (HDM-WSP) (Du et al., 2017). A recent study further suggested that climatic shift triggered a split of two oak species between the cold highlands and warm lowlands (Meng et al., 2017). In addition, studies using ecological niche models (ENMs) suggested that the two species are relatively stable (Feng et al., 2016; Du et al., 2017; Meng et al., 2017; Ju et al., 2019), but might endure contraction because of spatial constraints, such as land use/cover and human influence (Liao et al., 2021). All the above studies have yielded a substantial understanding of the evolutionary history, phylogeographic patterns, and potential distribution of Q. aquifolioides and Q. spinosa. However, there are few studies focusing on oak species conservation in this region, despite now they were increasingly threatened by climatic change and habitat fragments. Here, we genotyped 1,657 oak individuals from 106 populations collected across four major regions: QTP, HDM, QM, and warm lowlands in East China based on a dense range-wide sampling of the two species. We aimed to identify the priority areas of Q. aquifolioides and Q. spinosa for conservation by a combination of population and landscape genetic approaches by answering the following questions: (1) What is the spatial pattern of genetic diversity of two species? (2) What is the species migration route from QTP? and (3) How do the species respond to the environmental gradients?
We sampled leaf material from 996 individuals in 60 sites of Quercus aquifolioides and 661 individuals in 46 sites of Quercus spinosa throughout the species distribution range. The study sites were at least 30 km apart, and individuals were at least 100 m apart from each other to avoid sampling clone individuals. All leaf materials were rapidly dried in silica gel and stored for DNA isolation. The detailed information on sampling sites is depicted in Figure 1 and Supplementary Table 1.
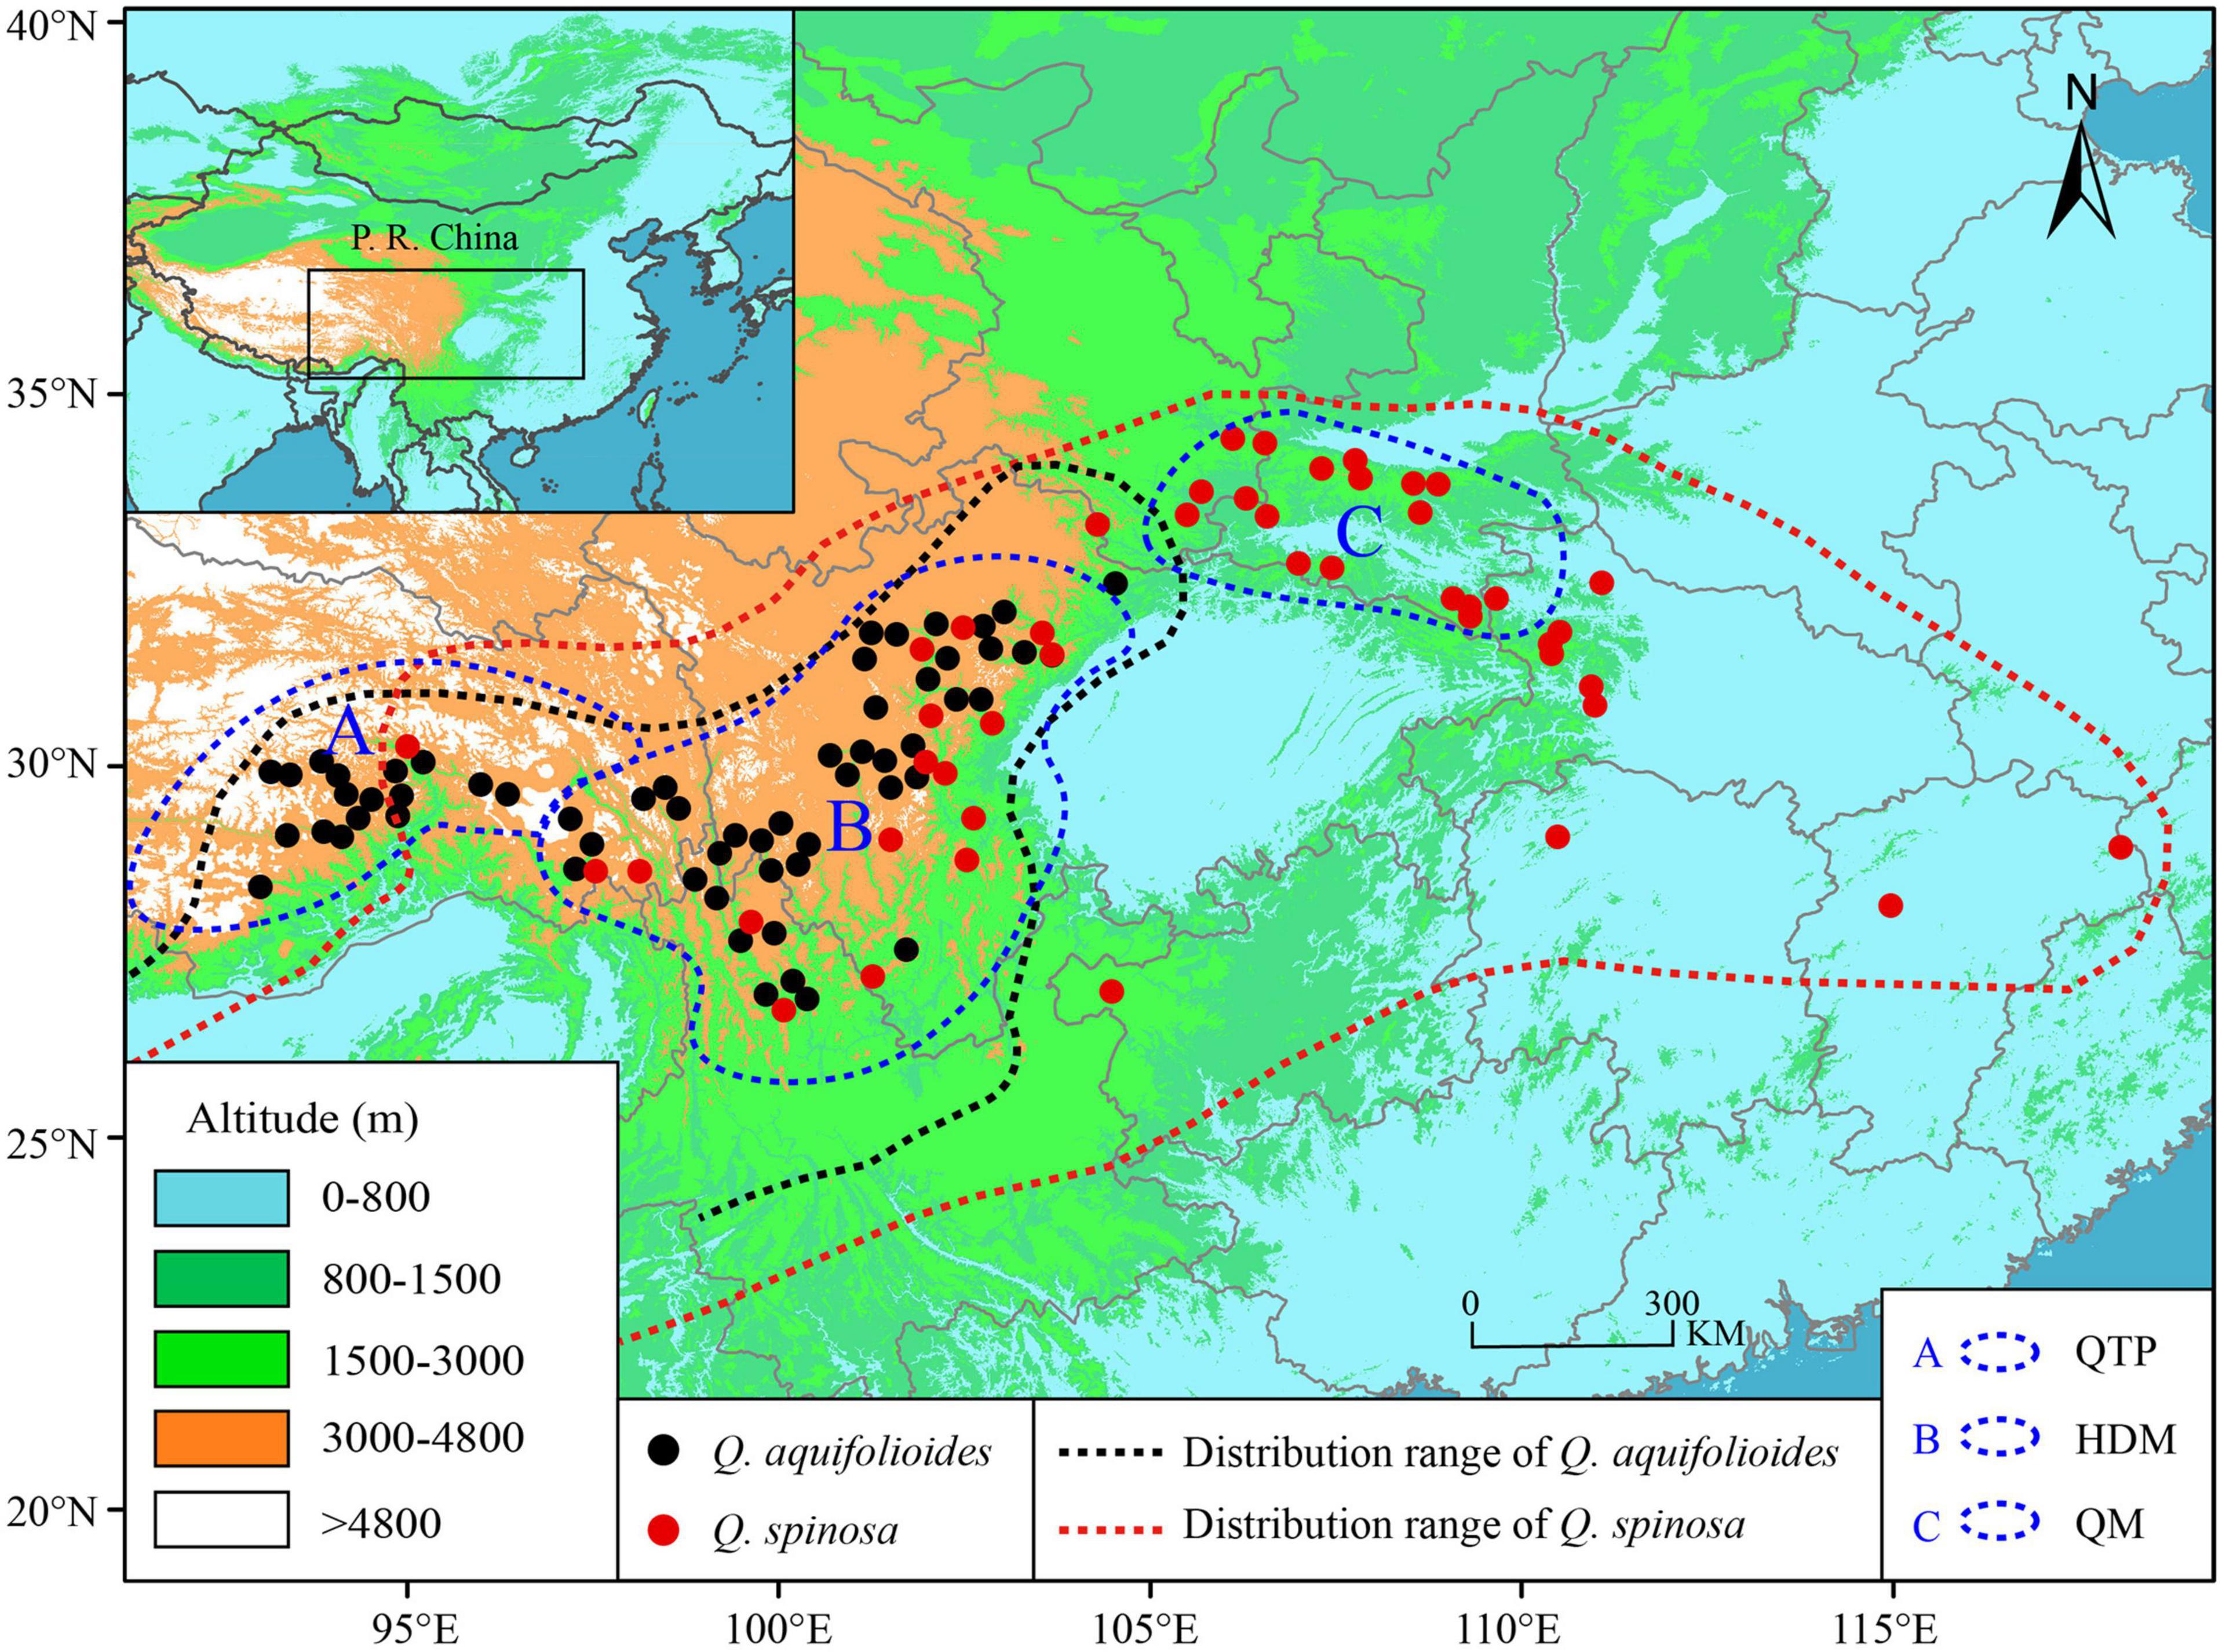
Figure 1. Geographic distribution and sampling sites of Q. aquifolioides and Q. spinosa. Black and red dashed lines indicate the geographic distribution of Q. aquifolioides and Q. spinosa, respectively. Three blue dashed lines represent defined research areas. The black rectangle on left top map represents the whole research area. QTP: Qinghai–Tibet Plateau, HDM: Hengduan Mountains, QM: Qinling Mountains.
Total genomic DNA was extracted from leaf samples for each individual using an improved cetyltrimethylammonium bromide (CTAB) method (Richards et al., 1994). We randomly selected one individual from each of six distant sites for pre-amplification experiments with 25 nuclear microsatellite (nSSR) loci developed for other oak species (Dow et al., 1995; Steinkellner et al., 1997; Kampfer et al., 1998; Ueno et al., 2008; Durand et al., 2010; Supplementary Table 2). We excluded loci harboring null alleles using MICRO-CHECKER 2.2.3 (Van Oosterhout et al., 2004). Departure from Hardy–Weinberg equilibrium (HWE) and linkage disequilibrium (LD) was evaluated using GenALEx 6 (Peakall and Smouse, 2006) and FDIST2 (Beaumont and Nichols, 1996). Finally, fifteen successfully amplified SSR loci were retained for subsequent analyses. The reaction procedures are modified from Du et al. (2017). The allele sizes were subsequently scored using GeneMarker v. 2.2 (Softgenetics, United States), and the genotypes were checked visually two times. A subset of the data, 959 individuals from 58 study sites of Q. aquifolioides at 15 nSSRs, were from Du et al. (2017) and Li Y. et al. (2021), and the additional data were first reported in this study.
We estimated genetic diversity indices including mean observed heterozygosity (HO), mean expected heterozygosity (HE), mean unbiased expected heterozygosity (uHE), mean effective population size (NE), and mean Shannon index (I) by GenAlEx 6 (Peakall and Smouse, 2006). The significance of genetic diversity was evaluated by t-test in SPSS 22 (SPSS Inc., Chicago, IL, United States) with a significance level of 0.05. In order to formulate optimal conservation strategies by revealing priority areas for conservation, we applied spatial analysis to improve the understanding of the geographic distribution of genetic diversity across the oak distribution range. We calculated and mapped the AR and LCA according to the circular neighborhood methodology described by Van Zonneveld et al. (2012). AR, also referred to mean number of alleles per locus, is a straightforward measure of genetic diversity based on molecular markers that aim at selecting populations for conservation (Frankel et al., 1995; Petit et al., 1998). LCA are alleles that occur in 25% or less of all grid cells and with a frequency of at least 5% in a grid cell per locus. Population with high LCA indicate the presence of genotypes adapted to specific environments; therefore, priority for conservation should be given to those populations (Frankel et al., 1995). After applying circular neighborhood to all samples, we calculated the AR and LCA for all 10-minute grid cells by GenAlEx 6 (Peakall and Smouse, 2006). AR was corrected by rarefaction to a minimum sample size of 10 re-sampled trees per cell with the HP-RARE software (Kalinowski, 2005).
We examined the genetic differentiation using hierarchical analysis of molecular variance (AMOVA, Excoffier et al., 1992) in Arlequin 3.5 (Excoffier and Lischer, 2010). The significance of fixation indices was tested using 10,000 permutations in Arlequin 3.5. We used a model-based clustering program implemented in STRUCTURE 2.3 (Pritchard et al., 2000) to infer the genetic clustering without consideration of sampling information. The program was run with the number of clusters (K) varied from 1 to 10 with 20 independent replicates conducted for each K-value, and the length of the burn-in period was set to 100,000 steps followed by the number of Markov chain Monte Carlo (MCMC) after burn-in of 100,000. We selected the optimal K-value by ΔK statistics performed in the web-based program STRUCTURE HARVESTER (Earl and Vonholdt, 2012). Graphic visualization of the STRUCTURE results was produced using DISTRUCT 1.1 (Rosenberg, 2004). We also conducted a principal component analysis (PCA) to visualize the genetic relatedness among individuals by calculating principal components (Novembre and Stephens, 2008) using “adegenet” R package (Jombart and Ahmed, 2011). The first two eigenvectors were plotted, and the discrete points reflect the real structure of populations. In addition, we conducted a principal coordinate analysis (PCoA, Gower, 1966) based on genetic covariance among populations in GenAlEx 6 (Peakall and Smouse, 2006) and plotted the first two eigenvectors to visualize genetic relatedness.
The historical gene flow of two oak species was assessed by Migrate-n 3.6 (Beerli and Felsenstein, 2001; Beerli, 2006) based on the Bayes factor value. First, we generated initial θ (4Neμ, four times effective population size multiplied by mutation rate per site per generation) and M (immigration rate divided by the mutation rate) to estimate the amount and direction of gene flow. A continuous Brownian motion model and the default genetic differentiation were used to generate initial theta and migration values. Then, we started three independent MCMC chains with 500,000 iterations, respectively. We sampled every 100 steps under a constant mutation model and discarded the first 10,000 records as burn-in. After checking the model convergence, we calculated the mode value and 95% posterior probability.
We obtained climatic variables of the current conditions (∼1970–2000) from WorldClim1, a database of high spatial resolution global weather and climate data (Fick and Hijmans, 2017). A total of 31 climatic variables, including the full suite of 19 mean annual bioclimatic variables and 12 average monthly climate data for precipitation, were downloaded. We excluded climatic variables that were highly correlated with the threshold values of 0.7 using a variance inflation factor (VIF) test in “usdm” R package (Naimi et al., 2014). After avoiding the high multicollinearity bias, four climatic variables, namely precipitation seasonality (bio15, coefficient of variation), mean temperature of the driest quarter (bio09), temperature annual range (bio07, between the minimum temperature of the coldest month and the maximum temperature of the warmest month), and precipitation during June (prec06), were finally remained for downstream analyses (Supplementary Table 1).
The linear relationships analysis can integrate environmental variables and spatial genetic structure into the analytical framework to assess the contributions of geography and environment in driving genetic differentiation (Feng and Du, 2022). The loading results of this analysis can be interpreted as the response proportion of environmental factors to genetic variation. In this study, we performed isolation-by-resistance (IBR) to illustrate the effects of the heterogeneous landscapes on the population genetic connectivity of two oak species in “ade4” R package (Dray and Dufour, 2007). We first predicted the potential distribution of two oak species based on the current ecological niche model (ENM) in MAXENT (Phillips and Dudik, 2008) and then transformed the environmental rasters into resistance surfaces. We generated the resistance distance based on circuit theory in CIRCUITSCAPE 4.0.5 (McRae, 2006; McRae et al., 2008) and “ResistanceGA” R package (Peterman, 2018). We performed Mantel tests of isolation by distance (IBD; Van Strien et al., 2015) and isolation by environment (IBE; Manthey and Moyle, 2015) to test the linear relationships between geographic or environmental distance and genetic distance using “ecodist” R package (Goslee and Urban, 2007). To distinguish the impact of IBD and IBE, a partial Mantel test was used to evaluate IBE/IBD by controlling the linear influence of geographic/environmental distance (Smouse et al., 1986). In addition, we performed multiple regression on distance matrices (MRM, Lichstein, 2007) to test the multivariate correlation between genetic distance matrix and climate distance using “ecodist” R package (Goslee and Urban, 2007). The significance for Mantel tests and MRM was evaluated by 10,000 permutation tests with the significance level set to 0.05.
We performed redundancy analyses (RDAs) to detect the multivariate relationship between genetic variation and climate variation (Van den Wollenberg, 1977; Legendre and Legendre, 1998) using “vegan” R package (Oksanen et al., 2017). A partial redundancy analysis (pRDAs, Legendre and Legendre, 1998, 2012) was performed to avoid the linear influence of geographic/climate variables when analyzing the climate/geographic variables. Statistical significance was evaluated from 999 permutations.
A limitation of the linear relationships analysis is the inability to fit the variation in the rate of compositional turnover along environmental gradients and the curvilinear relationship between genetic distance and environmental and geographic distance. Therefore, a non-linear relationship is essential for applying the associated turnover function to each mapped environmental variable (Fitzpatrick and Keller, 2015). In this study, we performed generalized dissimilarity modeling (GDM) to identify non-linear relationships between genetic distance matrix (response variable) and geographic/environmental distances (predictors) using “gdm” package (Ferrier, 2002; Ferrier et al., 2007). We also evaluated the variation in the rate of allelic compositional change along environmental gradients by fitting splines (Fitzpatrick and Keller, 2015). Genetic distances among individuals were calculated based on allele frequency, and geographic distance was based on Euclidean distance among coordinates. We assessed the variable significance by randomization tests and assessed uncertainty due to sampling error by simulating 1,000 bootstrap iterations (Ferrier et al., 2007; Fitzpatrick et al., 2013).
We found that the genetic diversity was higher in Q. aquifolioides than in Q. spinosa (HO: 0.59 vs. 0.41; HE: 0.58 vs. 0.49; uHE: 0.61 vs. 0.52; P < 0.01) (Supplementary Table 3). We also identified significantly higher genetic diversity in Q. aqu-East than Q. aqu-West lineage (HO: 0.60 vs. 0.53; HE: 0.61 vs. 0.52; uHE: 0.64 vs. 0.54; P < 0.01) and a slightly higher genetic diversity in Q. spi-East lineage than Q. spi-West lineage (HO: 0.42 vs. 0.41; HE: 0.51 vs. 0.47; uHE: 0.53 vs. 0.50; P < 0.01) (Supplementary Table 3).
We applied a circular neighborhood re-sampling technique to ensure sufficiently and more evenly distributed data points for spatial diversity analysis. A total dataset of 31,872 trees for Q. aquifolioides and 21,152 trees for Q. spinosa was used for further AR and LCA analyses (Supplementary Figure 1). Our results showed that the enriched regions of AR and LCA of two oak species were different (Figure 2). For Q. aquifolioides, the populations located at HDM (Q. aqu-East lineage) in southwest Sichuan province and northwest Yunnan province contained higher AR and LCA than QTP (Q. aqu-West lineage) (Figures 2a,c). The marginal population PW of Q. aquifolioides located at the easternmost end of the HDM with a lower AR than in other areas of the HDM (Figure 2a). For Q. spinosa, populations from QM (Q. spi-East lineage) revealed higher AR and LCA than HDM (Figures 2b,d).
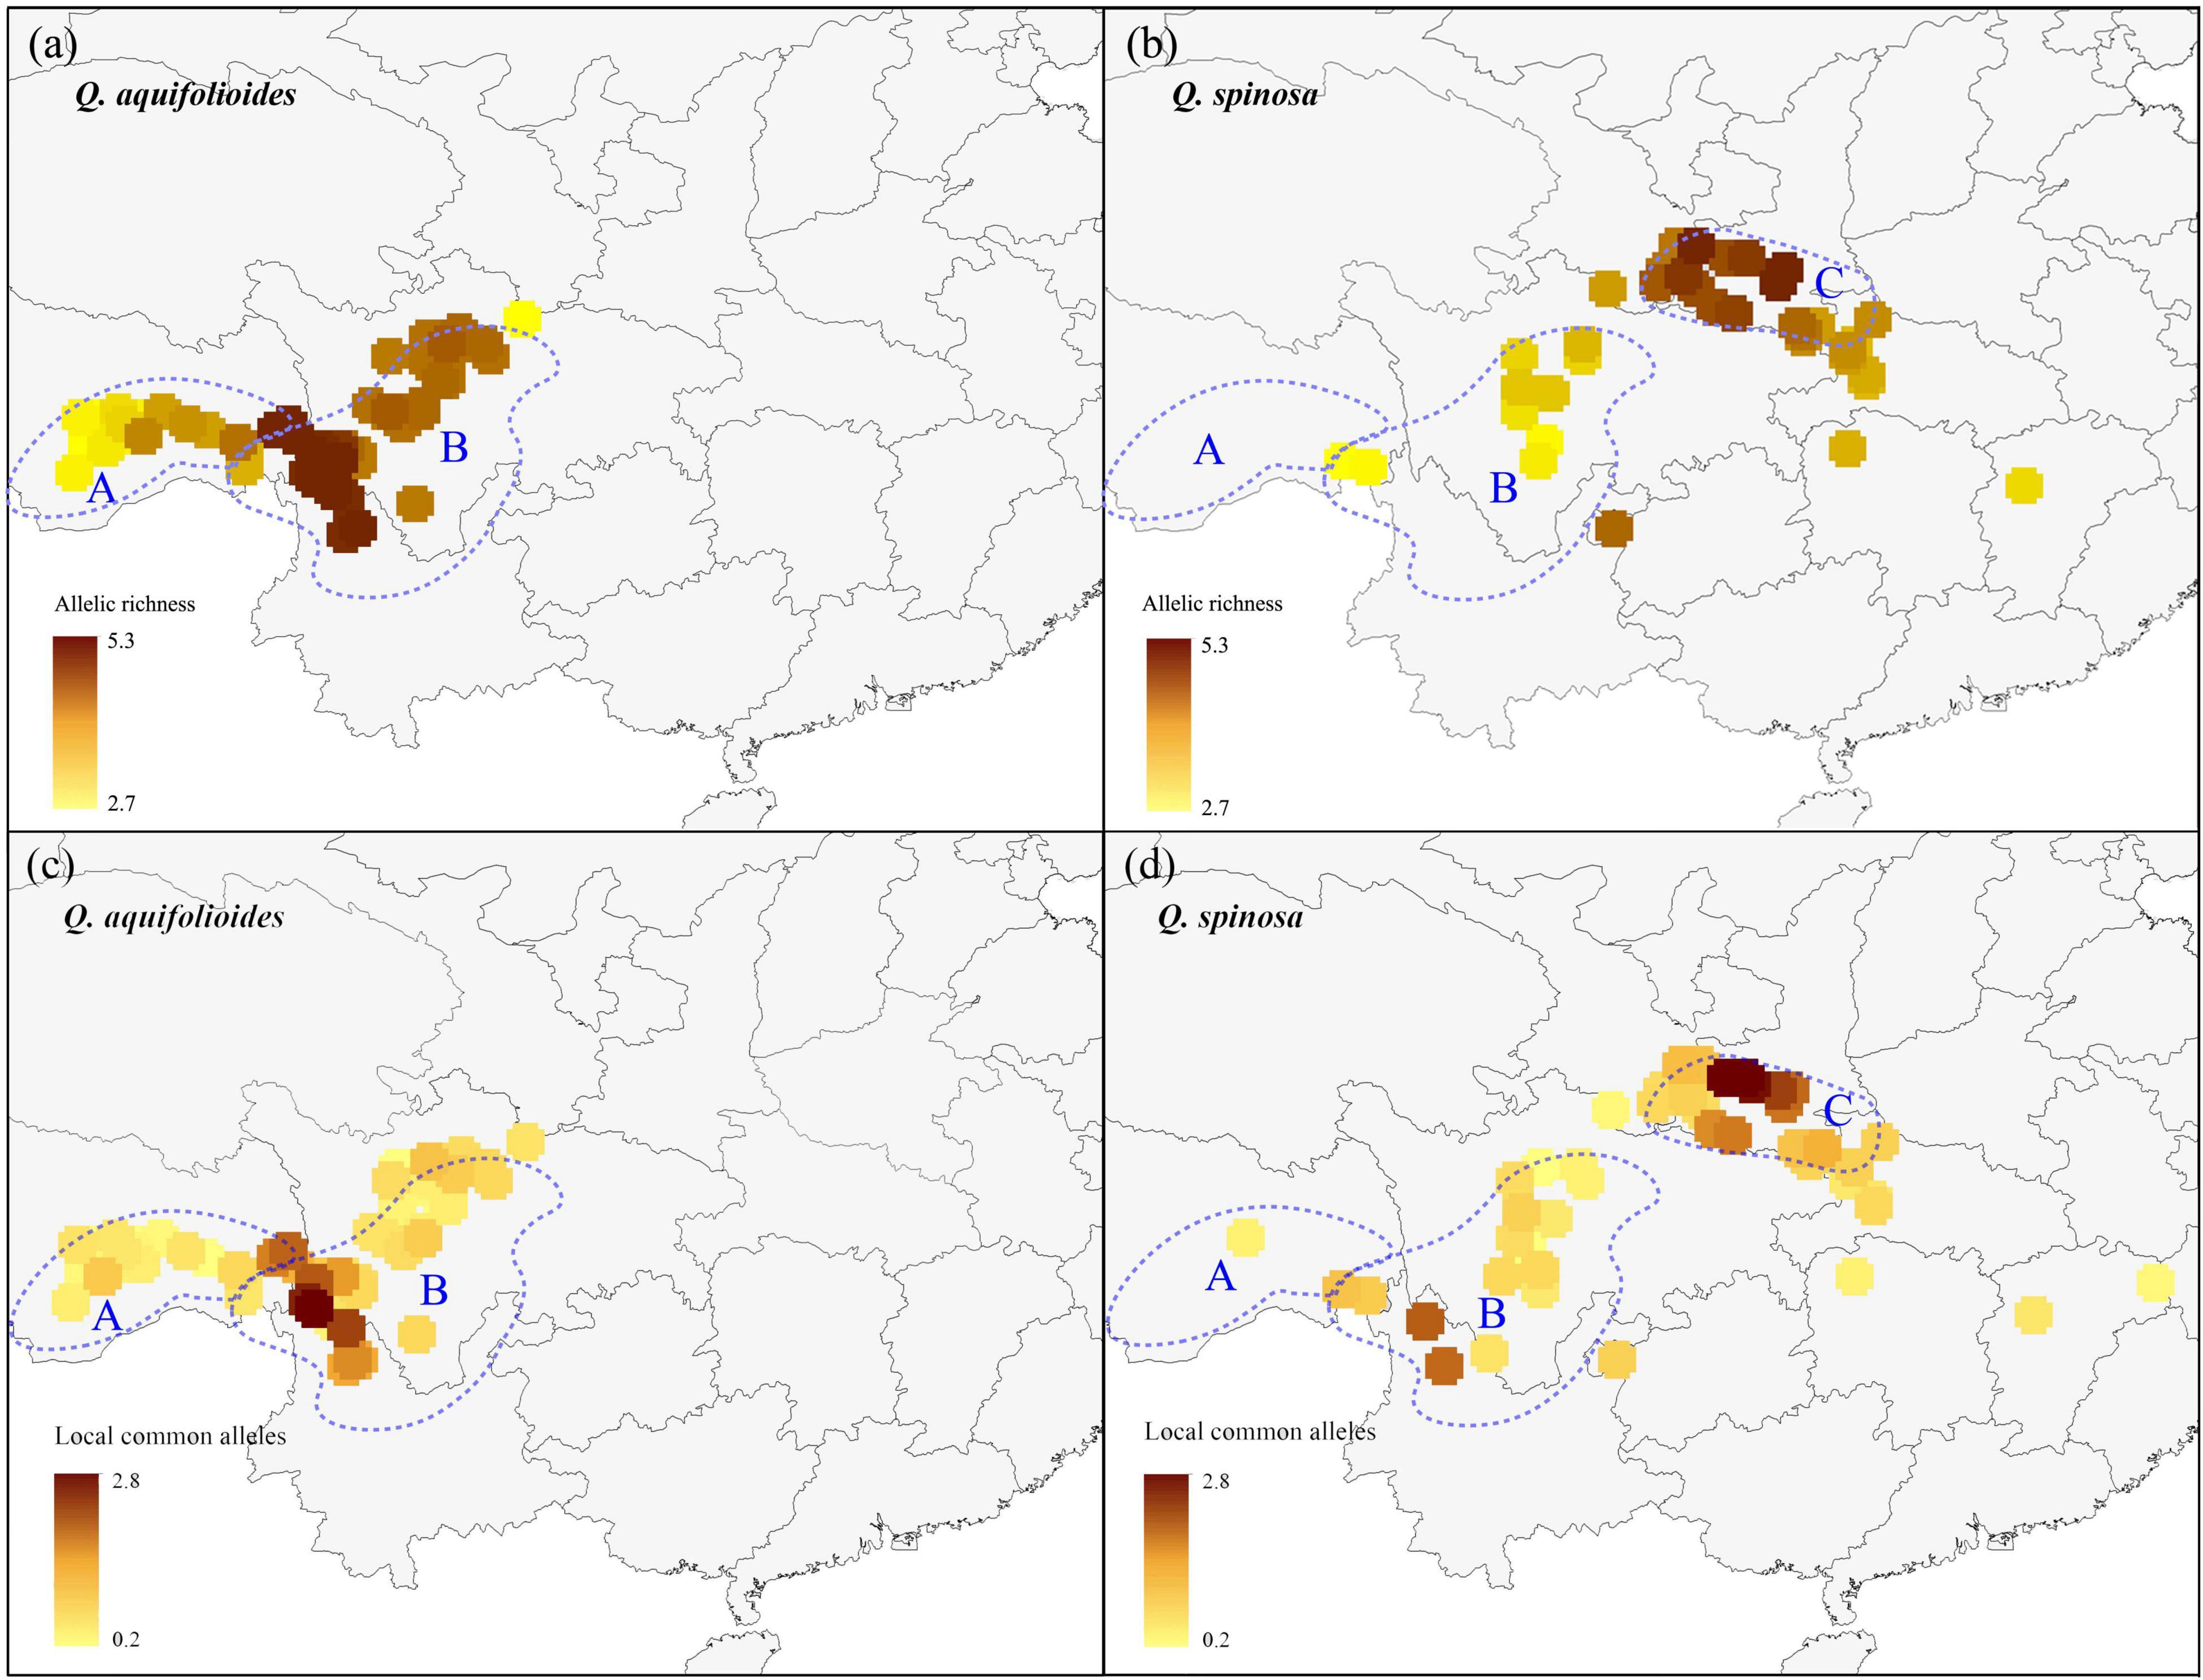
Figure 2. The allelic richness and locally common alleles map of Q. aquifolioides and Q. spinosa. The light blue dotted lines represent defined three research areas: (a) Qinghai–Tibet Plateau (QTP); (b) Hengduan Mountains (HDM); (c) Qinling Mountains (QM).
Bayesian clustering identified K = 2 as the optimal number of evolutionary clusters (Supplementary Figure 2), subdivided all individuals into two clusters, one corresponded to Q. aquifolioides and the other to Q. spinosa. When K = 3, Q. aquifolioides was maintained unchanged while Q. spinosa is further subdivided into two geographically related lineages: Q. spi-West (22 sites from HDM) and Q. spi-East lineage (24 sites from QM and lowlands in East China). When K = 4, Q. aquifolioides is divided into Q. aqu-West (17 sites from QTP) and Q. aqu-East lineage (43 sites from HDM) (Figure 3). The results of PCA and PCoA were largely consistent with the STRUCTURE analysis with clear separation in interspecific and intraspecific levels (Figure 4). AMOVA showed a high level of genetic differentiation between Q. aquifolioides and Q. spinosa, and most of the variation occurred within populations (FST = 0.35, 65.4%) (Table 2).
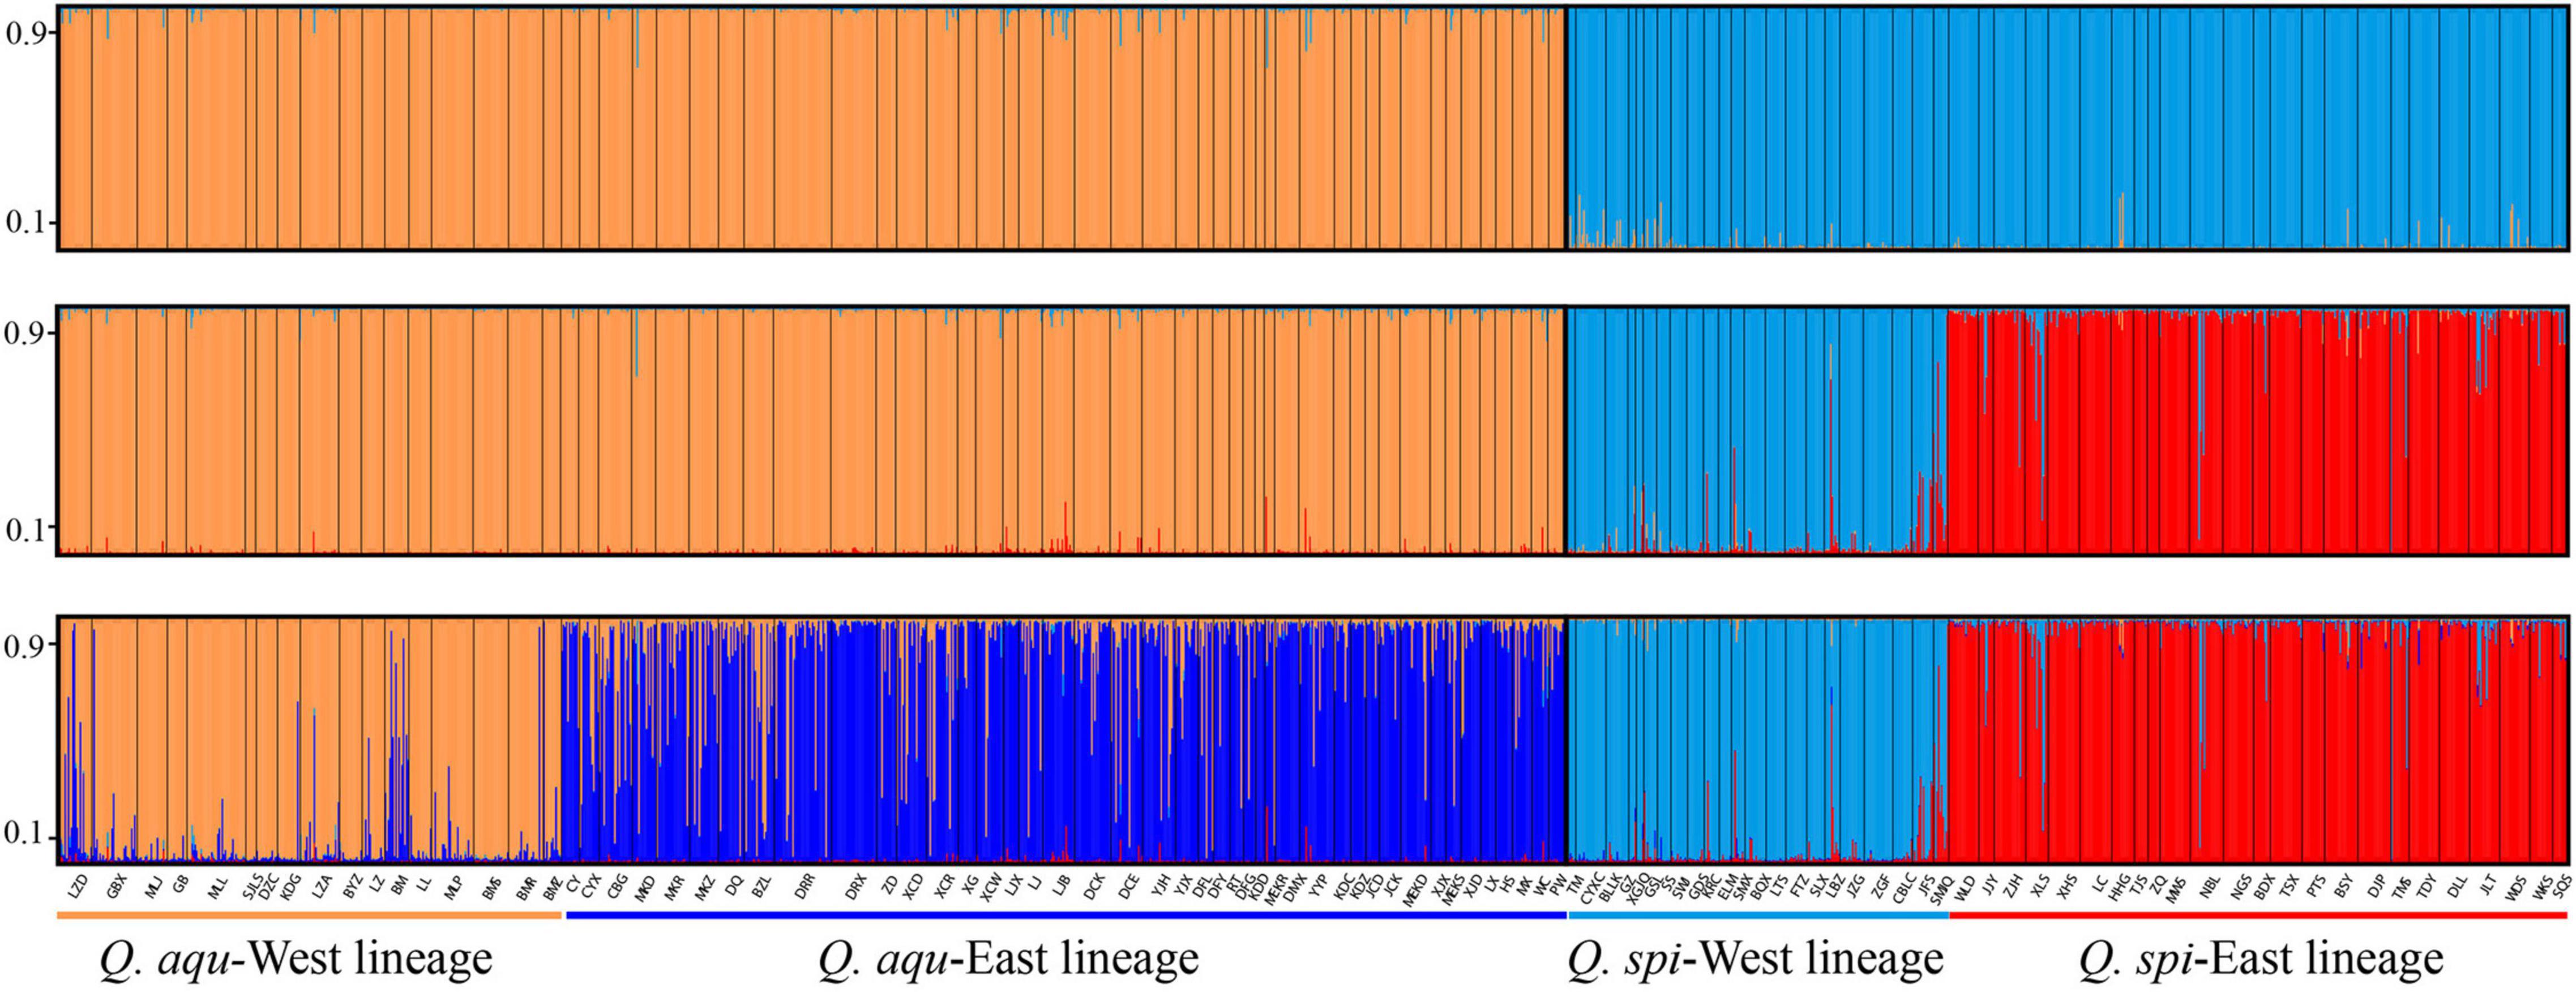
Figure 3. Individual assignment to two (top), three (middle), and four (below) genetic clusters by STRUCTURE of Q. aquifolioides and Q. spinosa. Each bar represents a single individual, with portions of the bar colored depending on the ancestry proportions estimated. The y-axis quantifies subgroup membership, and the x-axis shows the sample ID for each individual.
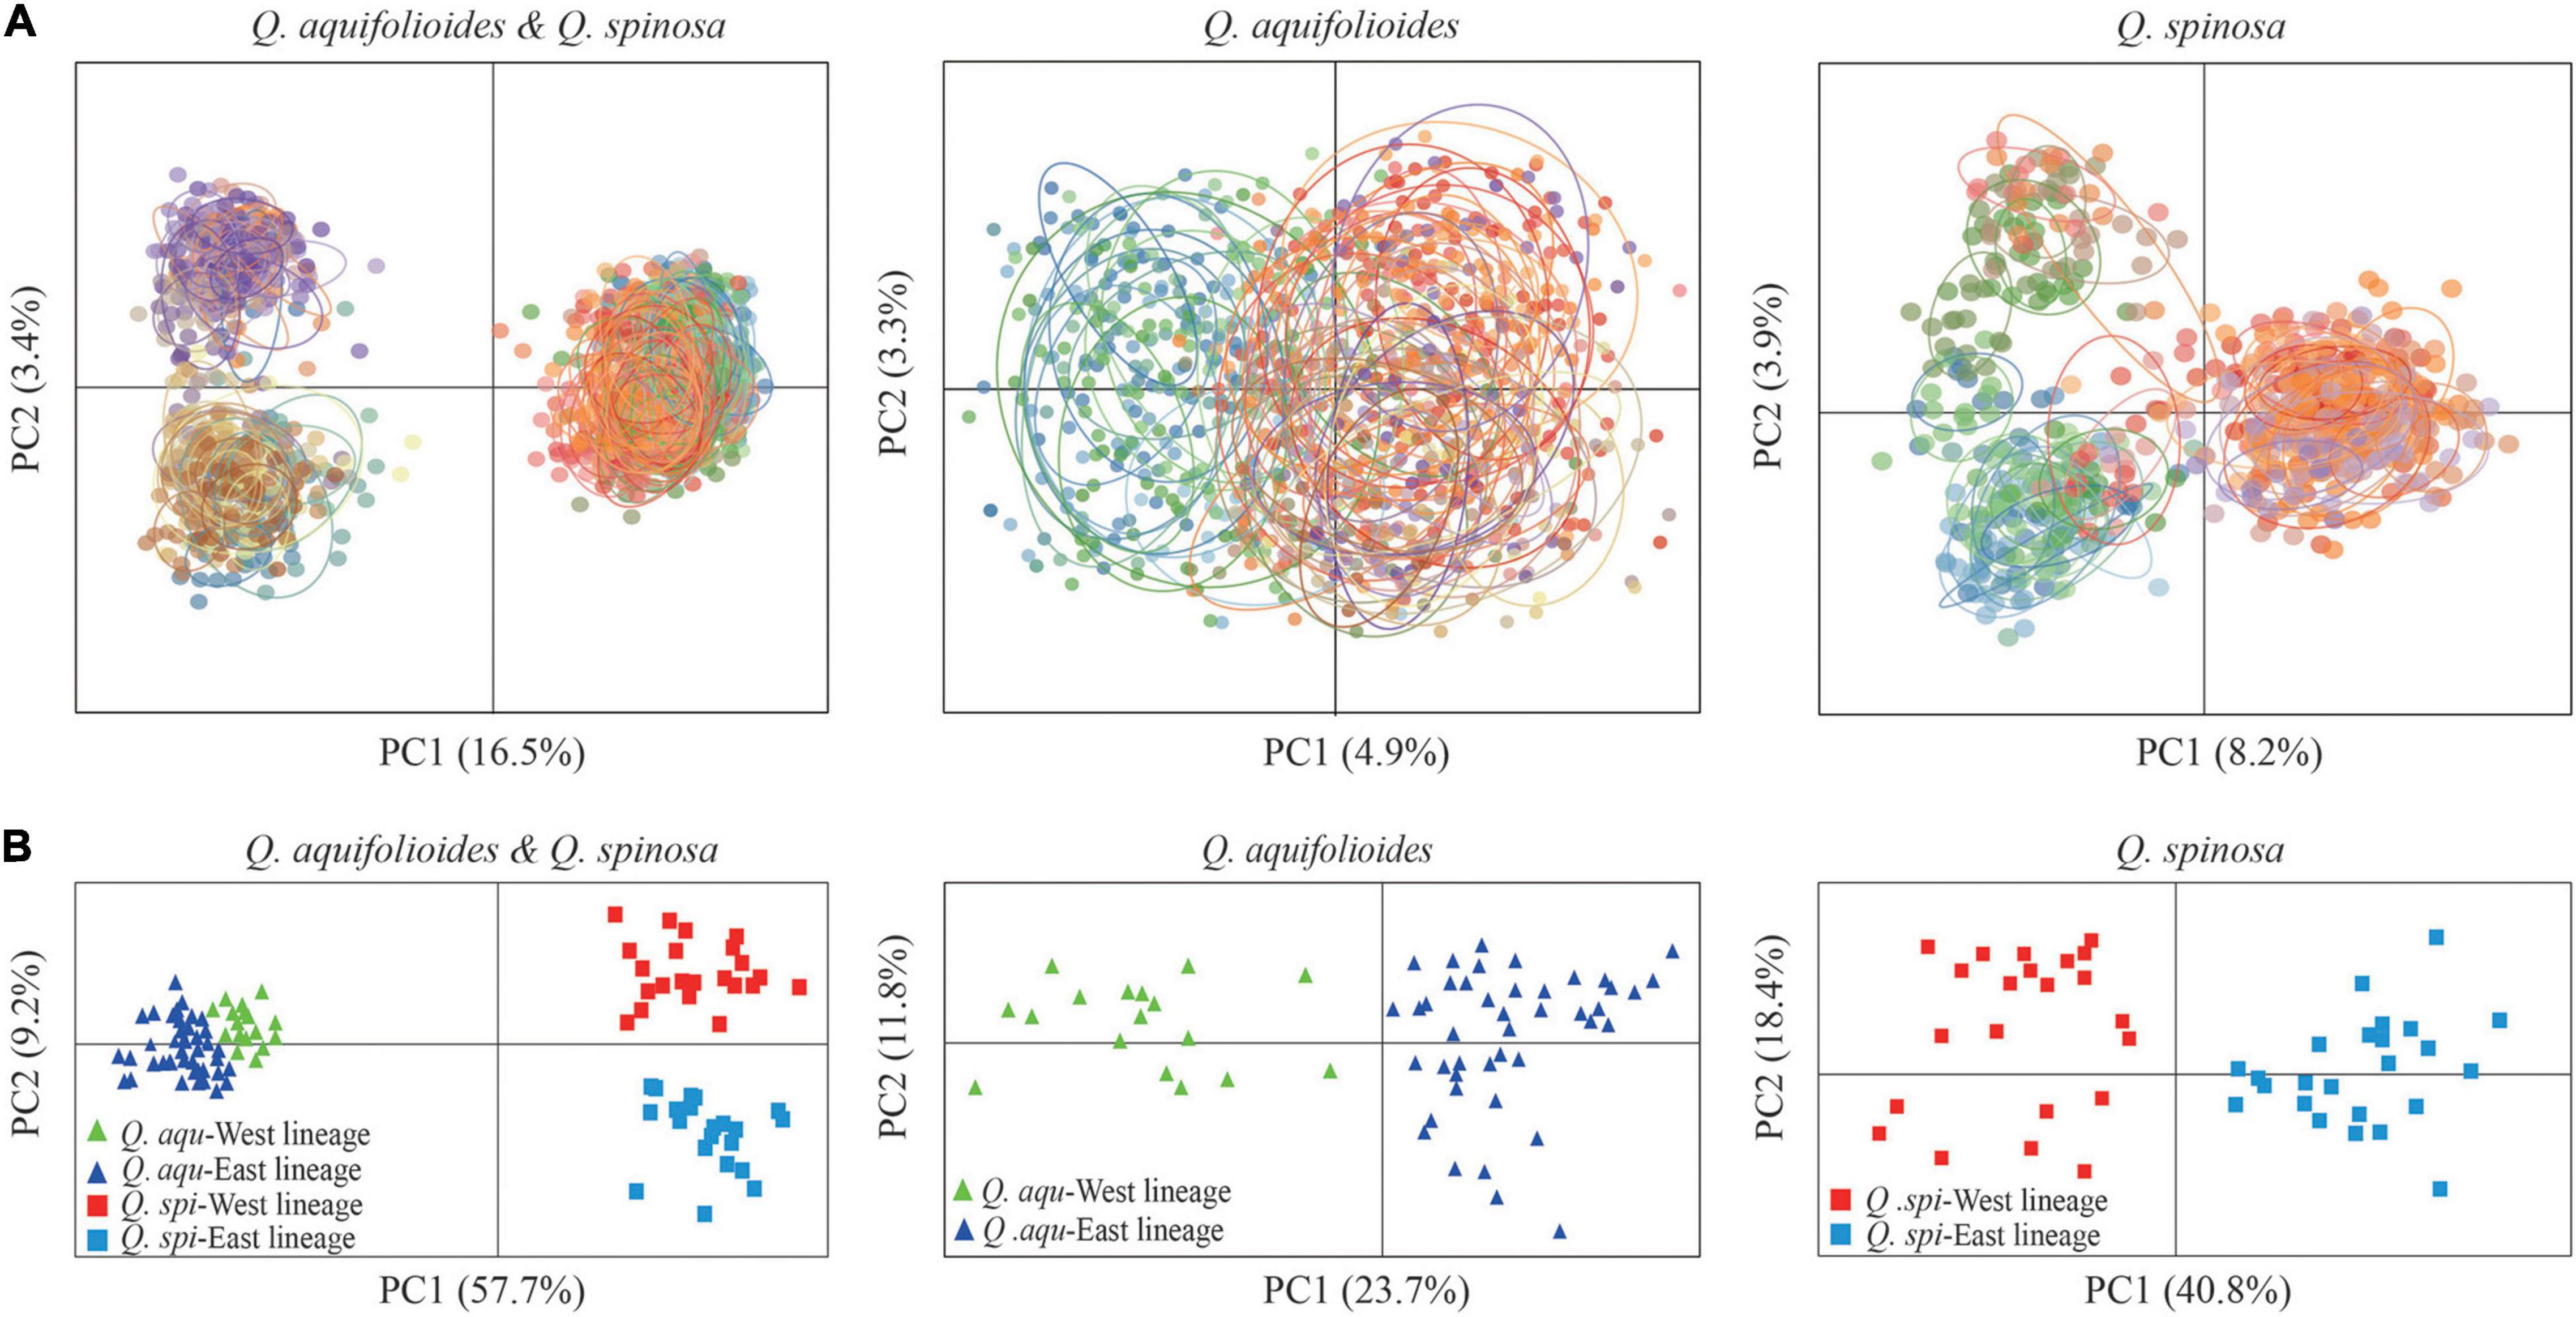
Figure 4. Genetic covariance of Q. aquifolioides and Q. spinosa. (A) Principal component analysis (PCA) plots based on genetic covariance among individuals. The first two principal components (PCs) are shown; (B) principal coordinate analysis (PCoA) plots of the first two components based on genetic covariance among populations.
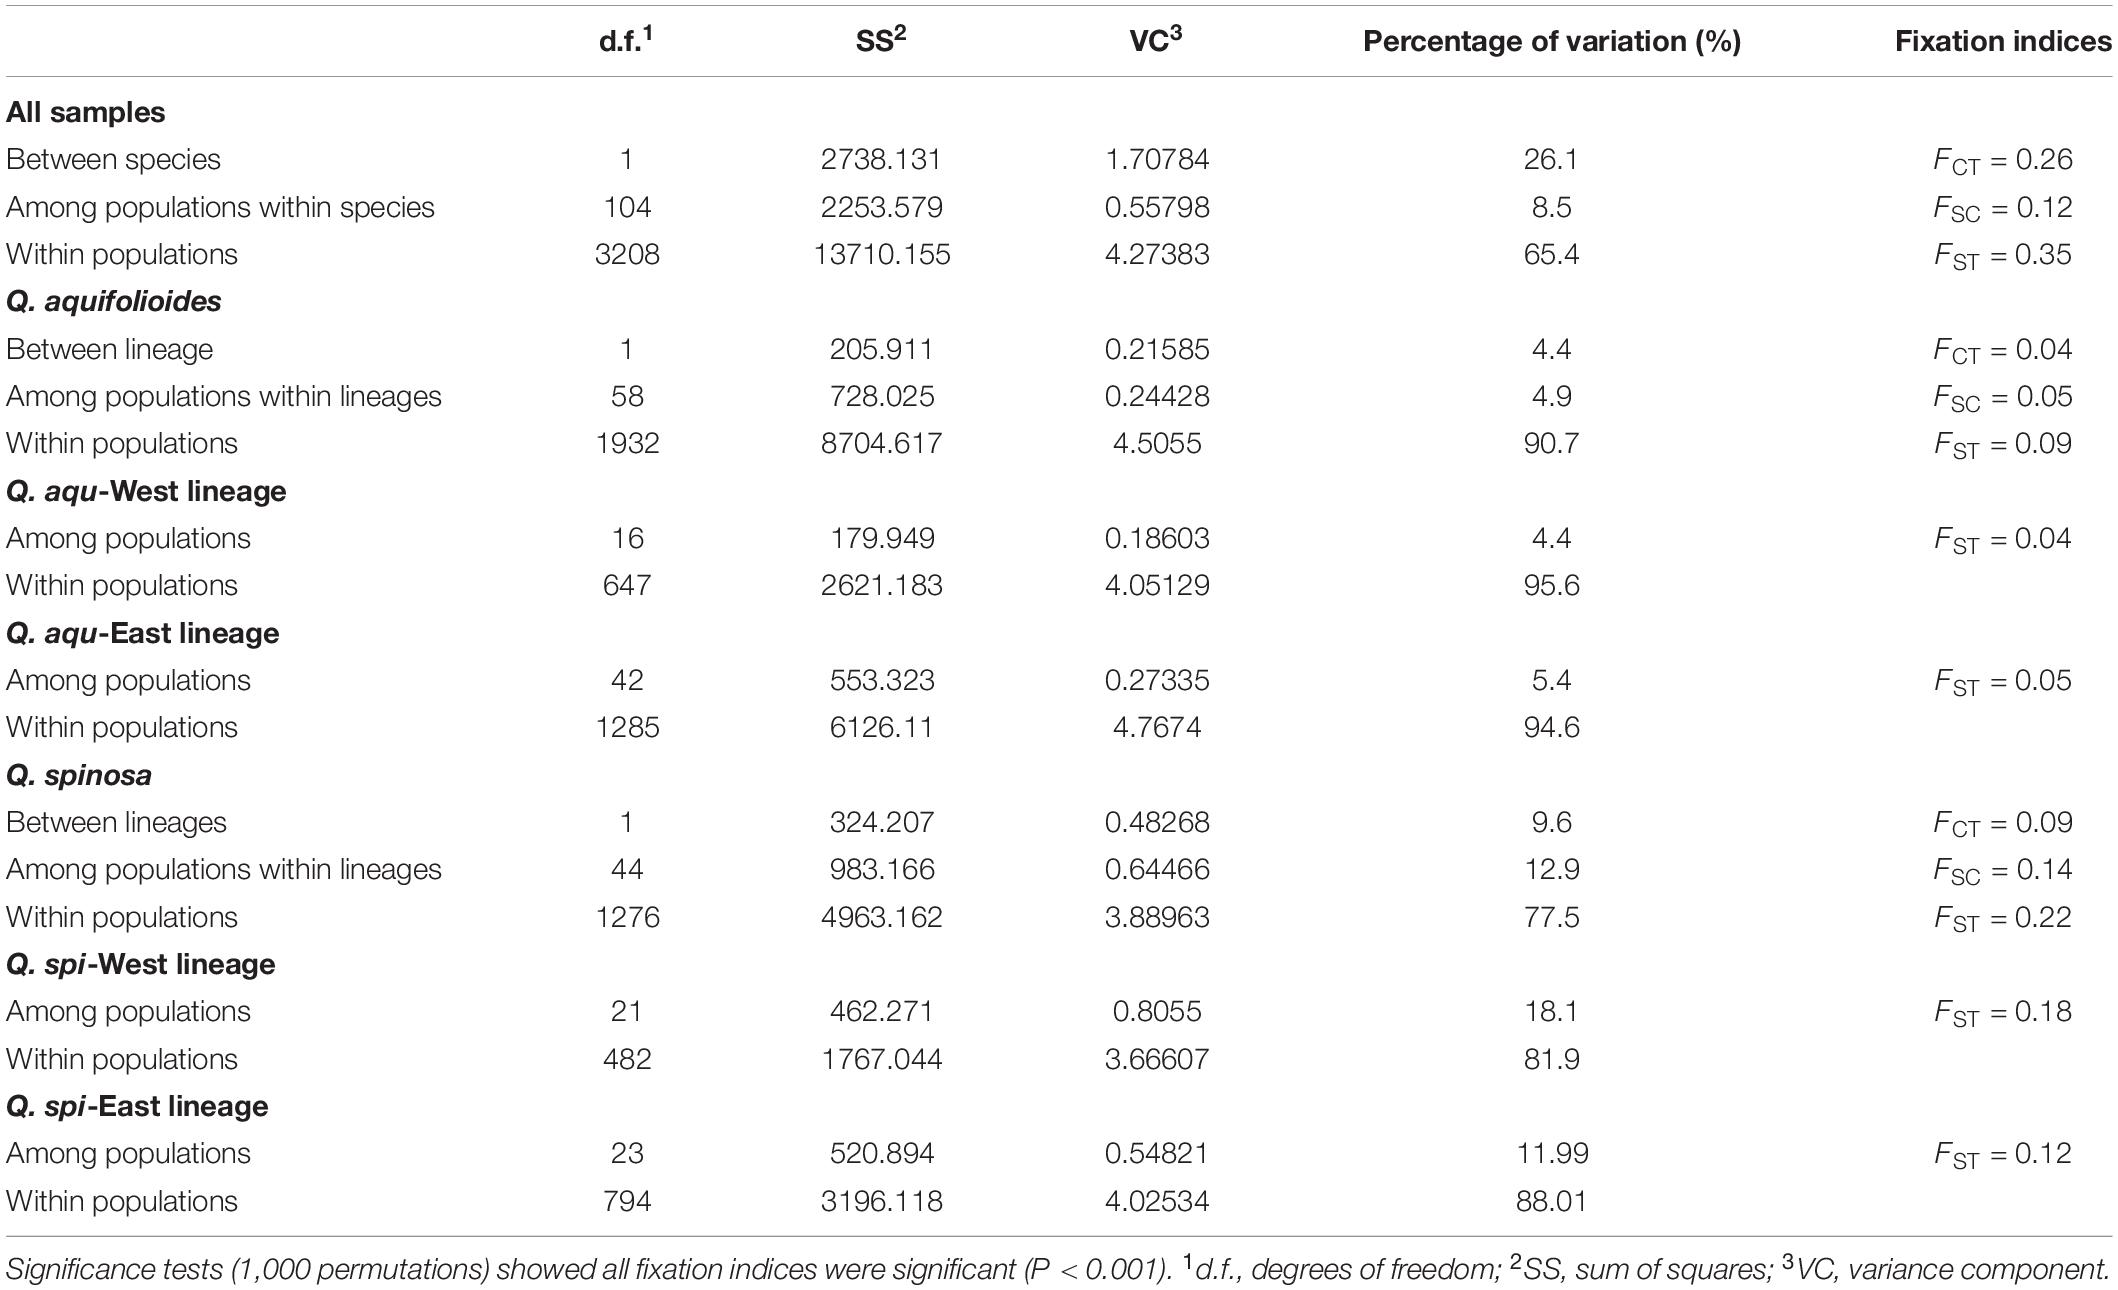
Table 2. Hierarchical analyses of molecular variance (AMOVA) of Q. aquifolioides and Q. spinosa populations.
The Migrate-n analysis generated θ and M values greater than zero, which revealed an asymmetric historical gene flow between two species, mainly from Q. aquifolioides to Q. spinosa (56.1 vs. 47.5) (Table 3). Moreover, we found gene movements occurred predominantly from Q. aqu-West into Q. aqu-East lineage (46.6 vs. 34.5) and from Q. spi-West into Q. spi-East lineage (65.6 vs. 43.0) (Table 3).
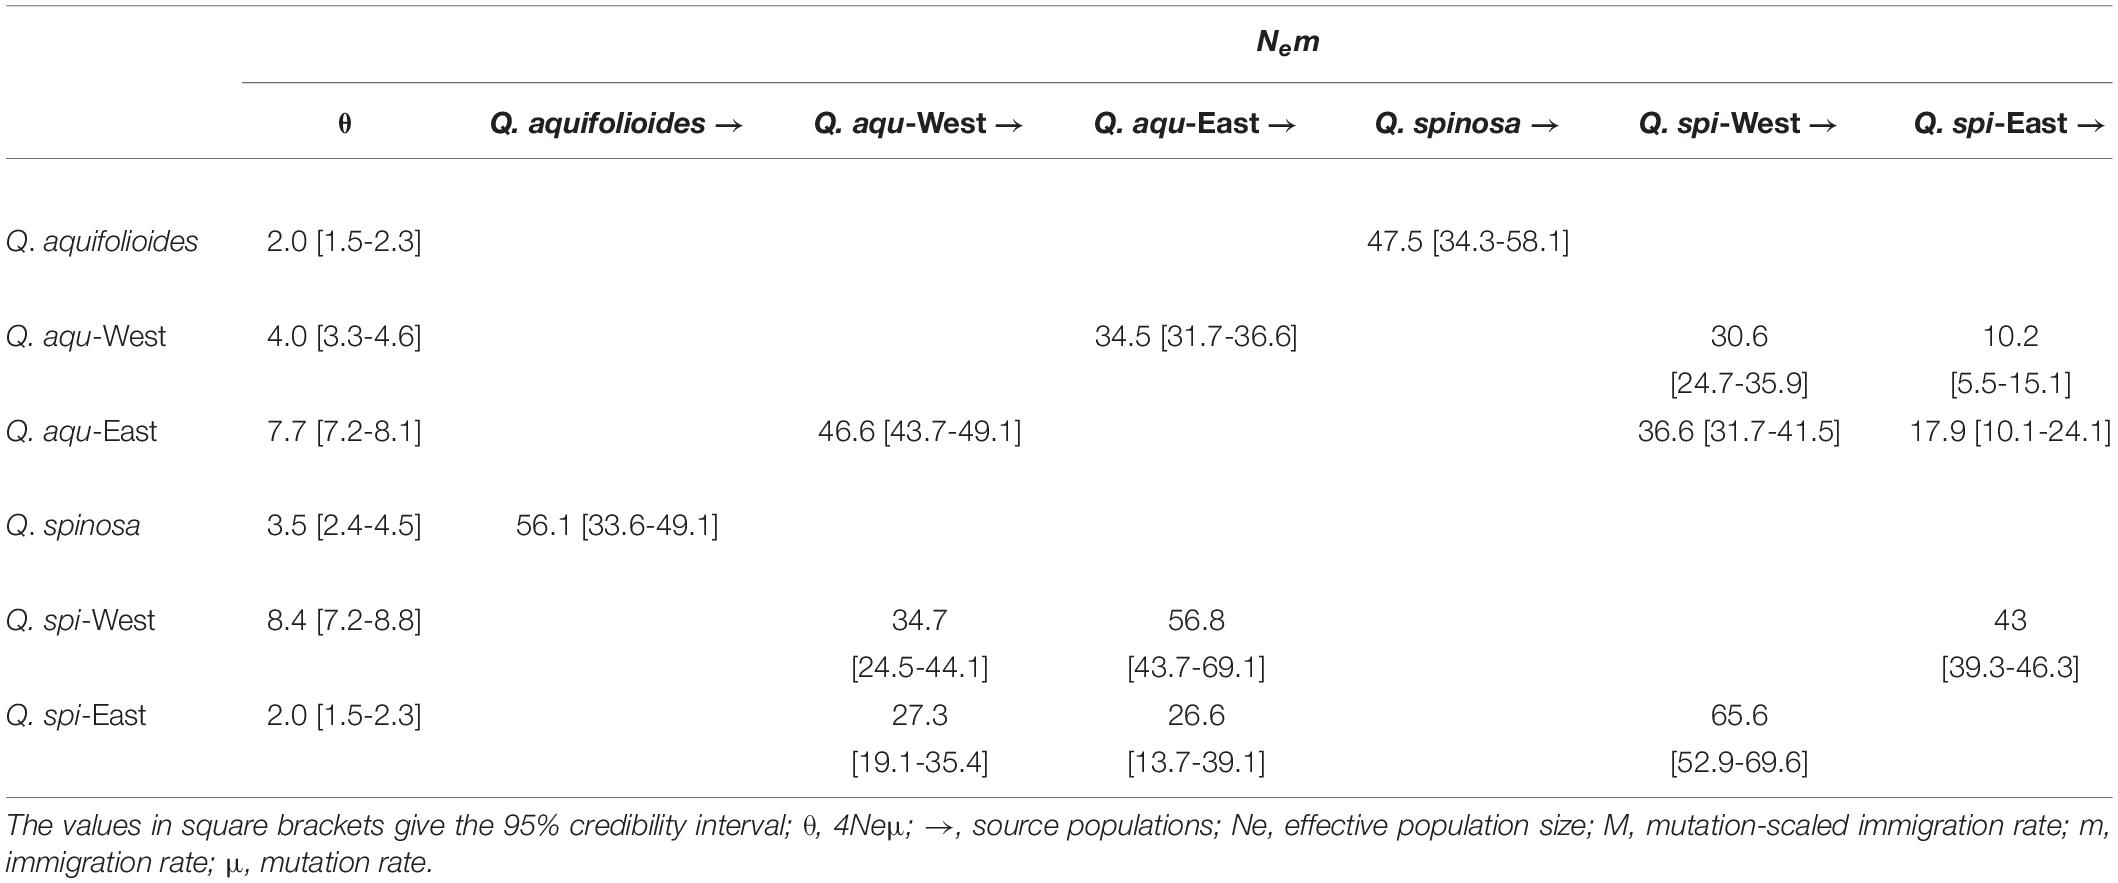
Table 3. Historical gene flow as estimated by Migrate-n among Q. aquifolioides and Q. spinosa based on SSR datasets.
Our analyses revealed highly significant correlations between pairwise genetic distances and resistance distance in Q. aquifolioides and Q. spinosa, but not in Q. aqu-West lineage (P = 0.745). The pattern of IBR in Q. spi-East was stronger than in Q. spi-West lineage (R2 = 0.65 vs. R2 = 0.42; Figure 5). In addition, we found significant patterns of IBD and IBE by Mantel and partial Mantel tests in Q. aquifolioides and Q. spinosa (Table 4 and Supplementary Figure 3). However, significant IBD was only detected in Q. aqu-West and Q. spi-East lineage; significant IBE was detected in Q. aqu-East and Q. spi-West lineage (Table 4 and Supplementary Figure 3). More specifically, genetic distance was significantly associated with annual range temperature (bio07) and seasonal precipitation (bio15) in Q. aquifolioides and Q. aqu-East lineage; bio15 and precipitation during June (prec06) in Q. spinosa and Q. spi-West lineage (Supplementary Table 4). These findings were consistent with optimal MRM models that yielded similar results (Supplementary Table 5).
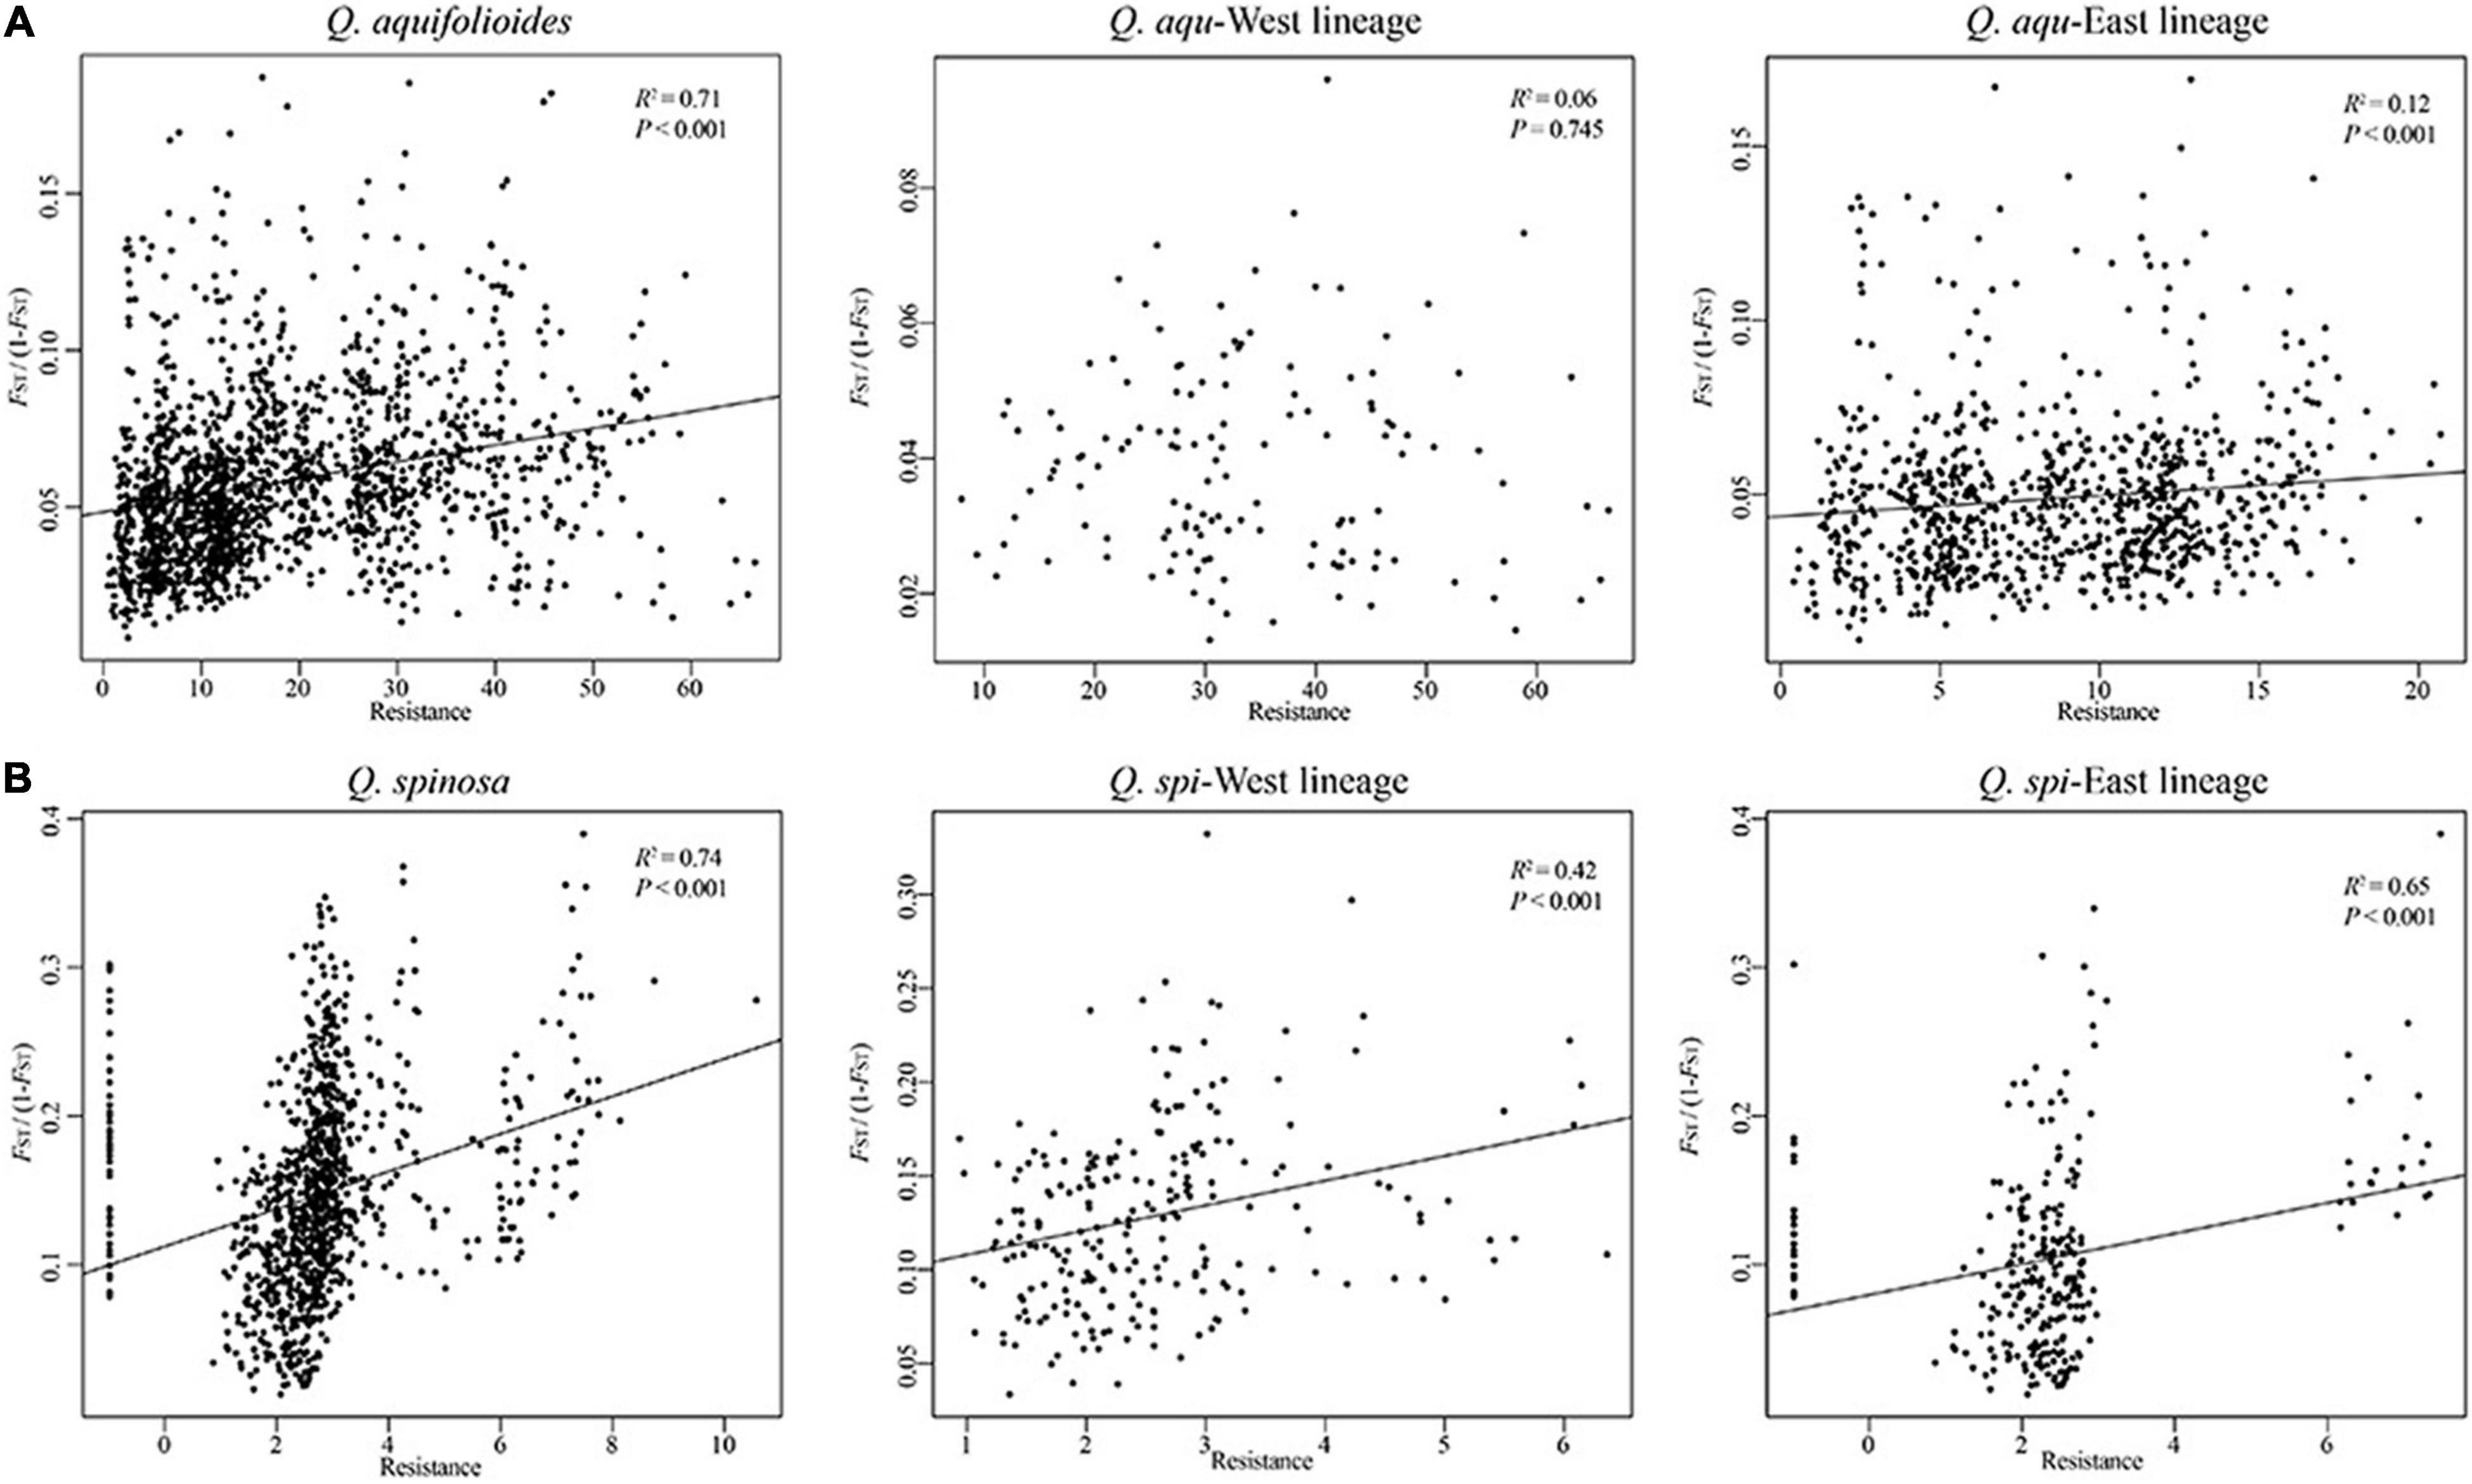
Figure 5. Relationship of genetic distance (FST/(1-FST)) and resistance distance based on climatic niche suitability of (A) Q. aquifolioides and (B) Q. spinosa.
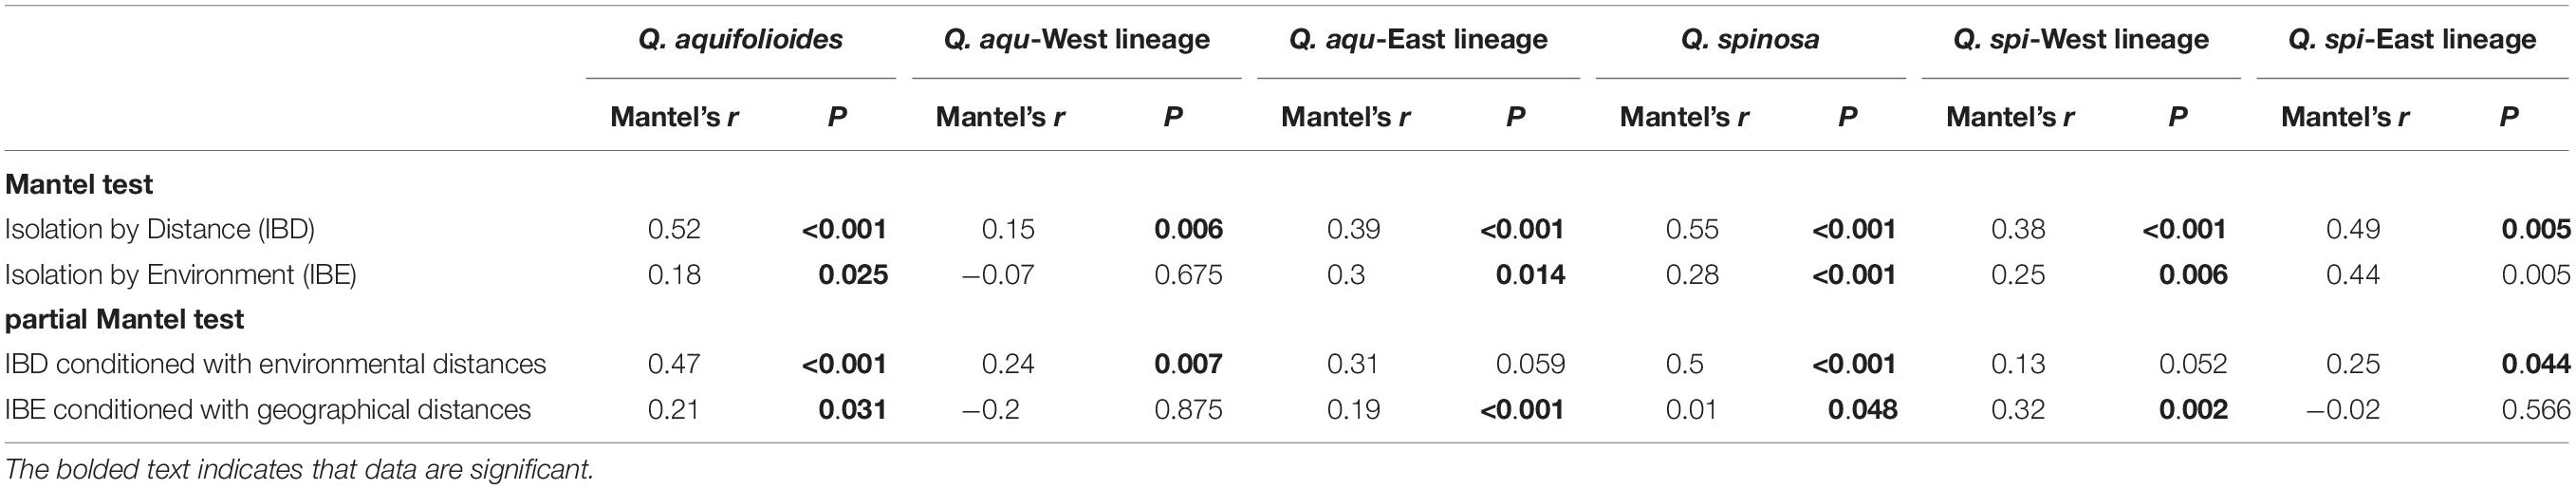
Table 4. Mantel tests and partial Mantel tests (conditioned with geographic or environmental distances) between pairwise genetic distance (FST/(1 - FST)) and geographic or environmental distances in different lineages and all populations of Q. aquifolioides and Q. spinosa.
The percentages of variance explained by RDA and pRDA were similar, and we thus report results for pRDA. Geography (4.0 and 5.2%) explained more genetic variance than climate variables (1.5 and 3.0%) in Q. aqu-West and Q. spi-East lineage, whereas climate variables (2.7 and 5.6%) explained more genetic variance than geography (1.4 and 5.1%) in Q. aqu-East and Q. spi-West lineage (Table 5). Partitioning of the total genetic variance revealed that bio07 and prec06 explained most genetic variance in Q. aqu-East lineage (44.5 and 23.5%), while in Q. spi-West lineage, prec06 and bio15 were the two most explanatory environmental variables (46.0% and 20.3%) (Table 5 and Supplementary Figure 4).
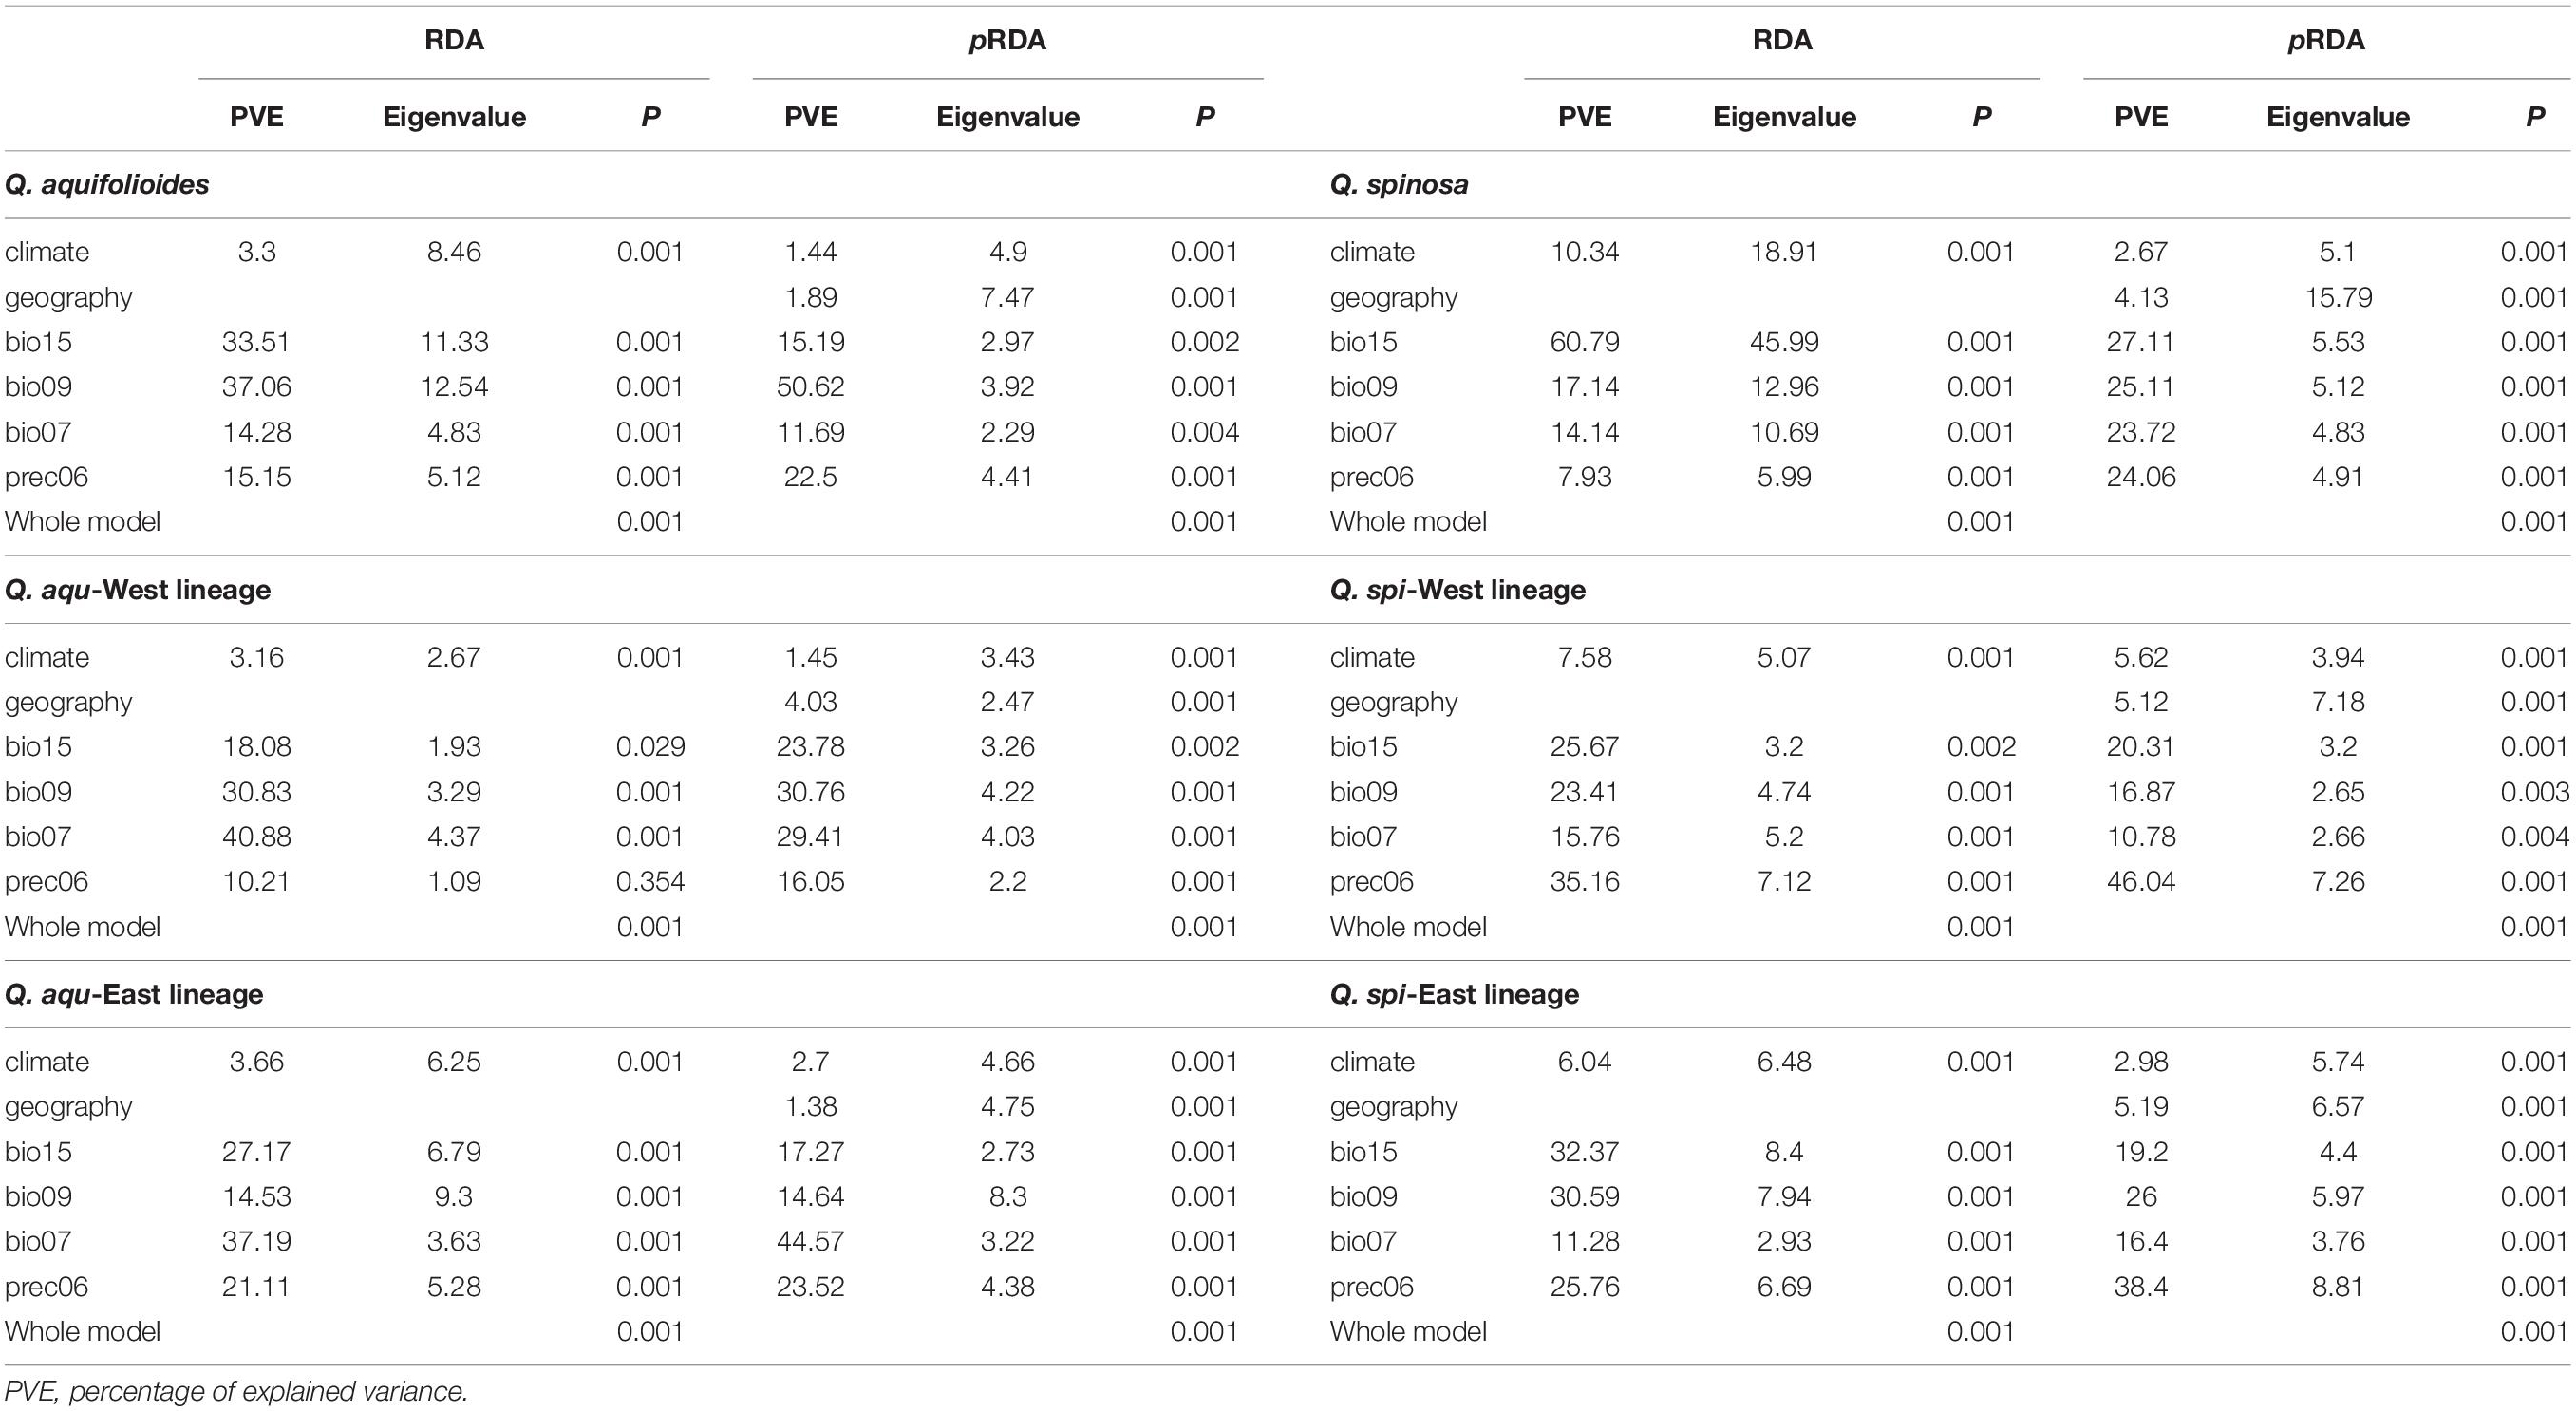
Table 5. Summary of the genetic variations associated with climate and geographic variables based on RDA and pRDA in Q. aquifolioides and Q. spinosa.
Generalized dissimilarity modeling analyses suggested that geography was the most important predictor among all variables considered in Q. aquifolioides, Q. aqu-West, Q. spinosa, and Q. spi-East lineage (59.3, 62.9, 53.4, and 8.8%) (Supplementary Table 6). However, there was almost no contribution of geography in Q. aqu-East and Q. spi-West lineage (2.8 and 7.2%), while bio15 was the most important environmental factor (36.2 and 30.8%) (Figure 6 and Supplementary Table 6). These results were consistent with I-spline analysis (Supplementary Figure 5).
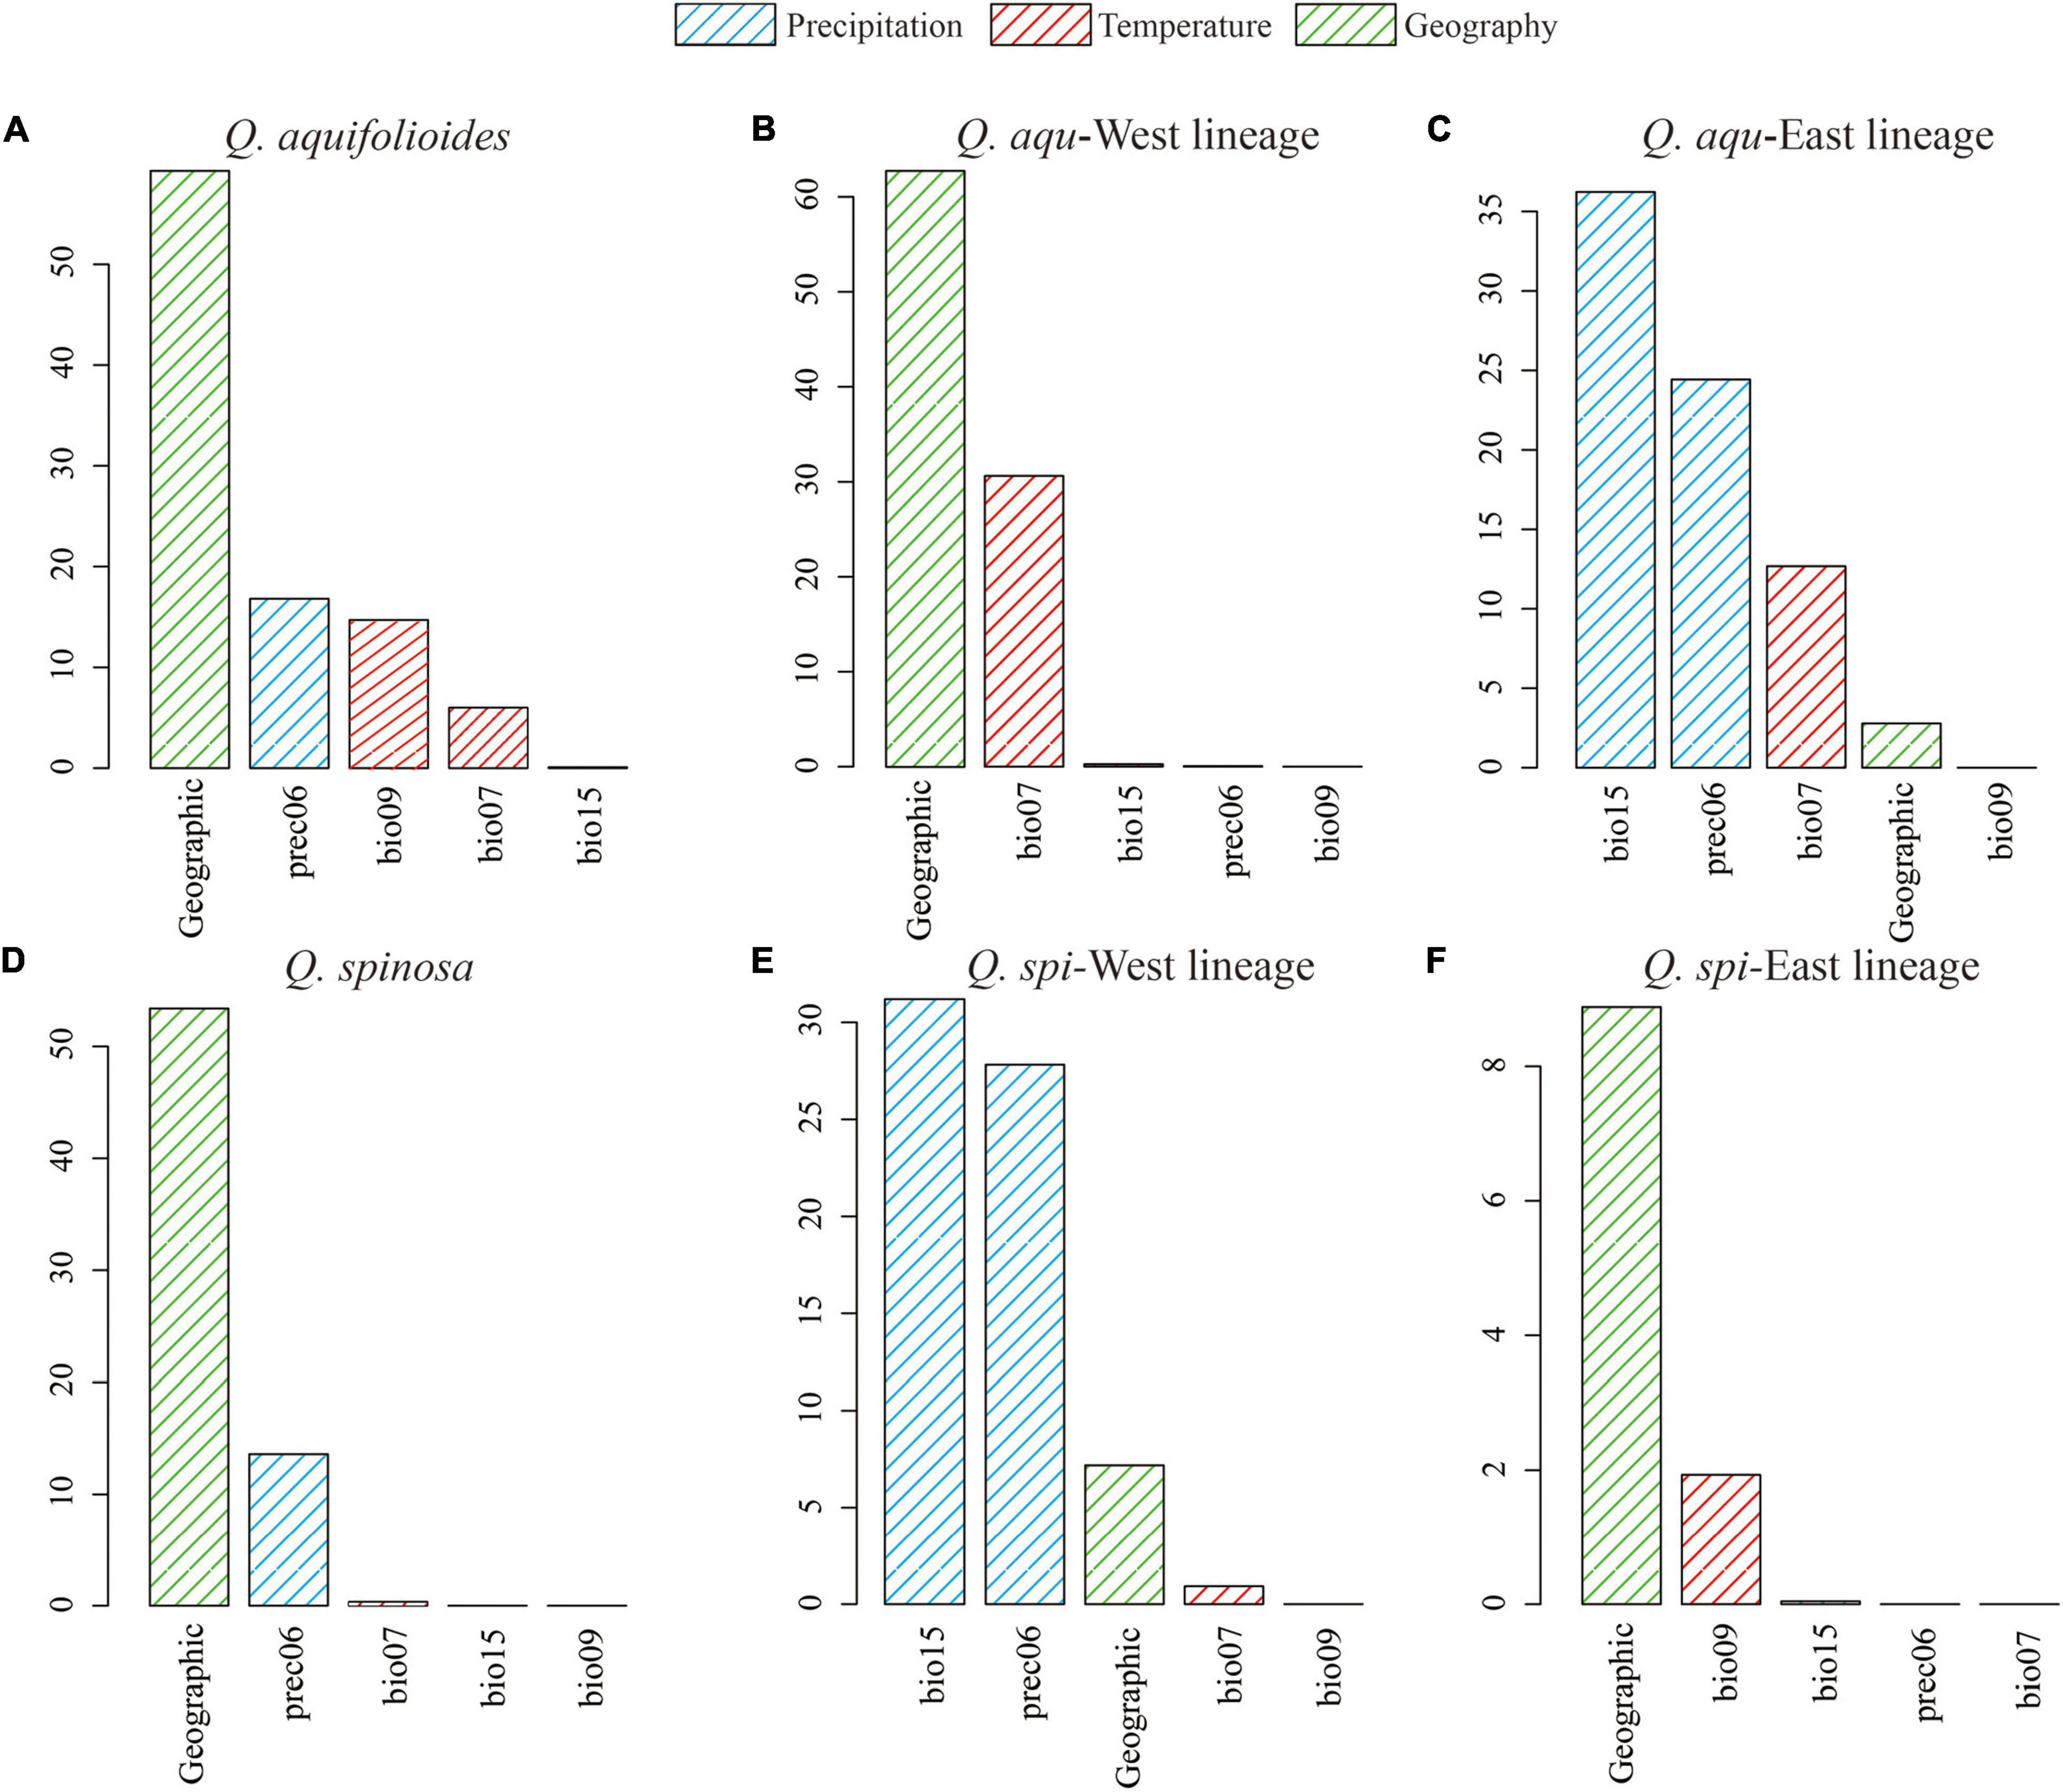
Figure 6. Variable importance of environmental variables based on analysis of generalized dissimilarity model (GDM) for (A) all populations of Q. aquifolioides, (B) Q. aqu-West lineage, (C) Q. aqu-East lineage, (D) all populations of Q. spinosa, (E) Q. spi-West lineage, and (F) Q. spi-East lineage.
Population and landscape genetic methods were used to identify priority areas for conservation throughout the species range of Q. aquifolioides and Q. spinosa. We found that the two evergreen oak species might originate from QTP and then dispersal into HDM and QM. In addition, the intraspecific genetic variation of different lineages of the two species showed different response patterns to environmental factors. Therefore, priority conservation areas were different for the two species: for Q. aquifolioides, a priority area for conservation should be at HDM, whereas for Q. spinosa, populations from QM should be considered in conservation.
Quercus aquifolioides and Quercus spinosa were assigned to two distinct genetic clusters (Figures 3, 4), and the direction of the interspecific and intraspecific gene flow was from west to east (Table 3). These results showed a strong West-to-East migration pattern and likely reflect long-term geographic isolation due to the orogenic history of QTP and adjacent regions (Qiu et al., 2011; Wen et al., 2014). In addition, the amount of historical gene flow was asymmetric, mainly from Q. aquifolioides to Q. spinosa at the interspecific level (56.1 vs. 47.5) and West lineages to East lineages at the intraspecific level (46.6 vs. 34.5 and 65.6 vs. 43.0) indicating the asymmetric introgression of the species (Currat et al., 2008; Du et al., 2011).
There are already several migration routes for the out-of-QTP hypothesis (Table 1), and all of the studies suggested that migration, orographic, and climate oscillations catalyzed intraspecific differentiation, diversification, and adaptation of species in this region (see the summary of Wen et al., 2014). It is suggested that orographic and climatic oscillations might result in lots of small fragmented habitats with different microclimates, which could influence the direction of natural selection, and might promote intraspecific high differentiation of species (Sobel et al., 2010). Our results represent a very typical case of a West-to-East migration pattern, which might be triggered by extensive uplifts of the QTP (see the summary of Favre et al., 2015). The QTP uplift events provided opportunities for the ancestral population in this region continually expanded to its eastward ranges and gradually triggered and facilitated speciation and diversifications of oak species (Zhou, 1992). Meanwhile, the West-to-East migration pattern indicated that migrating to new favorable locations might be a survival strategy of species to rapid climate changes as in Sophora davidii (Fan et al., 2013) and Gentiana (Favre et al., 2016).
Genotype–environment association (GEA) analysis, including mantel tests, redundancy analyses, and generalized dissimilarity modeling, integrates environmental variables and spatial genetic structure into the analytical framework to detect the adaptive variation (Feng and Du, 2022). GEA analysis is essential for understanding the mechanisms underlying the evolutionary responses to environments and was used to quantify patterns of interaction between genetic variation and climate conditions (Hansen et al., 2012). In addition, resistance analysis is important to understand how the species respond to different resistance distances (McRae, 2006). Based on this theory, we identified the landscape resistance matrix that was most highly correlated with pairwise genetic distances in Q. aquifolioides and Q. spinosa, especially in Q. aqu-East and Q. spi-East lineage (Figure 5), and this result may be related to increased habitat isolation in this area resulted from the disjunct distribution of the two oak species. However, the pairwise genetic distance was not correlated with resistance distance in Q. aqu-West lineage (Figure 5), indicating that populations from this lineage are low resistant to dispersal and might endure high genetic connectivity among populations. This result is confirmed with the lowest genetic differentiation in the Q. aqu-West lineage (Table 2).
The IBD and IBE results indicated the intraspecific lineages of oaks with different response patterns of genetic variation. We detected significant IBD patterns in Q. aqu-West and Q. spi-East lineage (Table 4 and Supplementary Figure 3, Supplementary Table 4). These results were consistent with GDM and RDA (Figure 6, Table 5 and Supplementary Figure 4, Supplementary Table 6), indicating that the genetic variation of Q. aqu-West and Q. spi-East lineage was mainly driven by selectively neutral evolutionary processes, not by strong selection pressure from the environment. The complex geological structure of mountains might form a natural geographic barrier for seeds or pollen dispersal, which can provide potential conditions for the formation and independent evolution of plants’ intraspecific lineages (Liu et al., 2013; Li et al., 2014).
By contrast, we detected significant IBE patterns in Q. aqu-East and Q. spi-West lineage (Table 4 and Supplementary Figure 5, Supplementary Tables 5, 6), where the extreme environmental conditions on the plateau might be regarded as a significant climatic barrier, rather than a geographic barrier. It also suggests that geographic isolation may cause interspecific and intraspecific differentiation; adaptation to local climate and environmental factors reinforces this differentiation and gradually forms this significant IBE pattern (Gao et al., 2021). Accordingly, GDM and RDA both suggesting temperature annual range (bio07) and precipitation during June (prec06) were the most significant environmental factor driving genetic variation in Q. aqu-East and Q. spi-West lineage (Figure 6, Table 5 and Supplementary Figure 4, Supplementary Table 6), respectively. The temperature may be the main driver of genetic variation for Q. aqu-East lineage, and it may influence the growth of plants in microhabitats by affecting the metabolic processes (Wahid et al., 2007). Precipitation might have a great impact on phenological and growth of oak from Q. spi-West lineage and then affect the ability to adapt to climate change.
A better understanding of the spatial distribution of genetic diversity is necessary for the formulation of effective and efficient conservation strategies (Petit et al., 1998). Priority for conservation should be given to populations that retain the highest AR and LCA because the likelihood to find interesting breeding materials is higher in the highest genetic diversity populations, which can indicate the presence of genotypes adapted to specific environments (Frankel et al., 1995; Tanksley and McCouch, 1997). We found that the priority conservation areas were different for the two species based on a large number of samples (1,657 individuals) across their distribution range (Figure 2). For Q. aquifolioides, a priority area for conservation should be the populations located at HDM (Q. aqu-East lineage), which contained the highest AR and LCA. In addition, the marginal population PW of Q. aquifolioides located at the easternmost end of the HDM with a lower AR and LCA than other areas. Risk of non-adaptedness (RONA) revealed that this marginal population might be at higher risk of extinction under future climate (Du et al., 2020). Therefore, populations isolated at the edge of the distribution range also should be considered in conservation activities to prevent the extinction of species in this area. For Q. spinosa, a priority area for conservation should be the populations located at QM (Q. spi-East lineage) with the highest genetic diversity. The second area of a higher diversity of Q. spinosa is located on the border zone between Sichuan and Yunnan province, probably related to the high species richness of this region. The higher AR and LCA in the Q. aqu-East and Q. spi-East lineage than in Q. aqu-West and Q. spi-West lineage suggested those populations received more immigrants and played an important role in evolution and diversification (López-Pujol et al., 2011; Favre et al., 2015), while the lower genetic diversity in Q. aqu-West and Q. spi-West lineage likely reflects population contraction or extinction–recolonization dynamics in this area (Qiu et al., 2011; Du et al., 2017; Meng et al., 2017).
The original contributions presented in the study are included in the article/Supplementary Material, further inquiries can be directed to the corresponding author/s.
FD designed the research. KL performed the experiments and the analyses. KL, MQ, and FD wrote the manuscript. All authors contributed to its revision.
This research was supported by a grant from the National Science Foundation of China (No. 42071060) and 111 Project (No. B20050) to FD.
The authors declare that the research was conducted in the absence of any commercial or financial relationships that could be construed as a potential conflict of interest.
All claims expressed in this article are solely those of the authors and do not necessarily represent those of their affiliated organizations, or those of the publisher, the editors and the reviewers. Any product that may be evaluated in this article, or claim that may be made by its manufacturer, is not guaranteed or endorsed by the publisher.
We thank Yang Xu, Yuyao Wang, and Tianrui Wang for leaf sampling and genotyping. We thank Han Xie for his help in spatial genetic diversity analysis. We thank Li Feng from Xi’an Jiaotong University and Wenting Wang from Northwest Minzu University for the guidance in resistance analysis. We thank Wei Qin for his comments on the manuscript.
The Supplementary Material for this article can be found online at: https://www.frontiersin.org/articles/10.3389/fpls.2022.858526/full#supplementary-material
Beaumont, M. A., and Nichols, R. A. (1996). Evaluating loci for use in the genetic analysis of population structure. Proc. R. Soc. B Biol. Sci. 263, 1619–1626. doi: 10.1098/rspb.1996.0237
Beerli, P. (2006). Comparison of Bayesian and maximum-likelihood inference of population genetic parameters. Bioinformatics 22, 341–345. doi: 10.1093/bioinformatics/bti803
Beerli, P., and Felsenstein, J. (2001). Maximum likelihood estimation of a migration matrix and effective population sizes in n subpopulations by using a coalescent approach. Proc. Natl. Acad. Sci. U.S.A. 98, 4563–4568. doi: 10.1073/pnas.081068098
Blöch, C., Dickoré, W. B., Samuel, R., and Stuessy, T. F. (2010). Molecular phylogeny of the edelweiss (Leontopodium, Asteraceae-Gnaphalieae). Edinb. J. Bot. 67, 235–264. doi: 10.1017/S0960428610000065
Currat, M., Ruedi, M., Petit, R. J., and Excoffier, L. (2008). The hidden side of invasion: massive introgression by local genes. Evolution 62, 1908–1920. doi: 10.1111/j.1558-5646.2008.00413.x
Degen, B., and Scholz, F. (1998). Spatial genetic differentiation among populations of European beech (Fagus sylvatica L.) in western Germany as identified by geostatistical analysis. For. Genet. 5, 191–199. doi: 10.1101/gad.9.21.2598
Denk, T., Grimm, G. W., Manos, P. S., Deng, M., and Hipp, A. L. (2018). “An updated infrageneric classification of the oaks: review of previous taxonomic schemes and synthesis of evolutionary patterns,” in Oaks Physiological Ecology. Exploring the Functional Diversity of Genus Quercus L, eds E. Gil-Pelegrín, J. Peguero-Pina, and D. Sancho-Knapik (Cham: Springer), 13–38.
Donoghue, M. J., Bell, C. D., and Li, J. H. (2001). Phylogenetic patterns in Northern hemisphere plant geography. Int. J. Plant Sci. 162, 41–52. doi: 10.1086/323278
Donoghue, M. J., and Smith, S. A. (2004). Patterns in the assembly of temperate forests around the Northern hemisphere. Philos. Trans. R. Soc. B Biol. Sci. 359, 1633–1644. doi: 10.1098/rstb.2004.1538
Dow, B. D., Ashley, M. V., and Howe, H. F. (1995). Characterization of highly variable (GA/CT) n microsatellites in the bur oak, Quercus macrocarpa. Theor. Appl. Genet. 91, 137–141. doi: 10.1007/BF00220870
Dray, S., and Dufour, A. (2007). The ade4 package: implementing the duality diagram for ecologists. J. Stat. Softw. 22, 1–20. doi: 10.18637/jss.v022.i04
Du, F. K., Hou, M., Wang, W., Mao, K. S., and Hampe, A. (2017). Phylogeography of Quercus aquifolioides provides novel insights into the Neogene history of a major global hotspot of plant diversity in south-west China. J. Biogeogr. 44, 294–307. doi: 10.1111/jbi.12836
Du, F. K., Peng, X. L., Liu, J. Q., Lascoux, M., Hu, F. S., and Petit, R. J. (2011). Direction and extent of organelle DNA introgression between two spruce species in the Qinghai-Tibetan Plateau. New Phytol. 192, 1024–1033. doi: 10.1111/j.1469-8137.2011.03853.x
Du, F. K., Wang, T. R., Wang, Y. Y., Ueno, S., and De Lafontaine, G. (2020). Contrasted patterns of local adaptation to climate change across the range of an evergreen oak, Quercus aquifolioides. Evol. Appl. 13, 2377–2391. doi: 10.1111/eva.13030
Durand, J., Bodénès, C., Chancerel, E., Frigerio, J.-M., Vendramin, G., Sebastiani, F., et al. (2010). A fast and cost-effective approach to develop and map EST-SSR markers: oak as a case study. BMC Genomics 11:570. doi: 10.1186/1471-2164-11-570
Earl, D. A., and Vonholdt, B. M. (2012). STRUCTURE HARVESTER: a website and program for visualizing STRUCTURE output and implementing the Evanno method. Conserv. Genet. Resour. 4, 359–361. doi: 10.1007/s12686-011-9548-7
Excoffier, L., and Lischer, H. E. L. (2010). Arlequin suite ver 3.5: a new series of programs to perform population genetics analyses under Linux and Windows. Mol. Ecol. Resour. 10, 564–567. doi: 10.1111/j.1755-0998.2010.02847.x
Excoffier, L., Smouse, P. E., and Quattro, J. M. (1992). Analysis of molecular variance inferred from metric distances among DNA haplotypes: application to human mitochondrial DNA restriction data. Genetics 131, 479–491. doi: 10.1093/genetics/131.2.479
Fan, D. M., Yue, J. P., Nie, Z. L., Li, Z. M., Comes, H. P., and Sun, H. (2013). Phylogeography of Sophora davidii (Leguminosae) across the ‘Tanaka-Kaiyong Line’, an important phytogeographic boundary in Southwest China. Mol. Ecol. 22, 4270–4288. doi: 10.1111/mec.12388
Favre, A., Michalak, I., Chen, C. H., Wang, J. C., Pringle, J. S., Matuszak, S., et al. (2016). Out-of-Tibet: the spatio-temporal evolution of Gentiana (Gentianaceae). J. Biogeogr. 43, 1967–1978. doi: 10.1111/jbi.12840
Favre, A., Paeckert, M., Pauls, S. U., Jaehnig, S. C., Uhl, D., Michalak, I., et al. (2015). The role of the uplift of the Qinghai-Tibetan plateau for the evolution of Tibetan biotas. Biol. Rev. 90, 236–253. doi: 10.1111/brv.12107
Feng, L., and Du, F. K. (2022). Landscape genomics in tree conservation under a changing environment. Front. Plant Sci. 13:822217. doi: 10.3389/fpls.2022.822217
Feng, L., Qian, Z. Q., Yang, J., Zhang, Y. P., Li, Z. H., and Zhao, G. F. (2016). Genetic structure and evolutionary history of three alpine sclerophyllous oaks in east Himalaya-Hengduan Mountains and adjacent regions. Front. Plant Sci. 7:1688. doi: 10.3389/fpls.2016.01688
Ferrier, S. (2002). Mapping spatial pattern in biodiversity for regional conservation planning: where to from here? Syst. Biol. 51, 331–363. doi: 10.1080/10635150252899806
Ferrier, S., Manion, G., Elith, J., and Richardson, K. (2007). Using generalized dissimilarity modelling to analyse and predict patterns of beta diversity in regional biodiversity assessment. Divers. Distrib. 13, 252–264. doi: 10.1111/j.1472-4642.2007.00341.x
Fick, S. E., and Hijmans, R. J. (2017). WorldClim 2: new 1-km spatial resolution climate surfaces for global land areas. Int. J. Climatol. 37, 4302–4315. doi: 10.1002/joc.5086
Fitzpatrick, M. C., and Keller, S. R. (2015). Ecological genomics meets community-level modelling of biodiversity: mapping the genomic landscape of current and future environmental adaptation. Ecol. Lett. 18, 1–16. doi: 10.1111/ele.12376
Fitzpatrick, M. C., Sanders, N. J., Normand, S., Svenning, J. C., Ferrier, S., Gove, A. D., et al. (2013). Environmental and historical imprints on beta diversity: insights from variation in rates of species turnover along gradients. Proc. R. Soc. B Biol. Sci. 280:20131201. doi: 10.1098/rspb.2013.1201
Frankel, O. H., Brown, A. H. D., and Burdon, J. (1995). “The genetic diversity of wild plants,” in The Conservation of Plant Biodiversity, 1st Edn, eds O. H. Frankel, A. H. D. Brown, and J. Burdon (Cambridge: Cambridge University Press), 10–38.
Frankham, R. (1995). Conservation genetics. Annu. Rev. Genet. 29, 305–327. doi: 10.1146/annurev.ge.29.120195.001513
Gao, Y., Yin, S., Chu, H., Zhang, Y., Wang, H., Chen, H., et al. (2021). Genome-Wide SNPs provide insights on the cryptic genetic structure and signatures of climate adaption in Amorphophallus albus Germplasms. Front. Plant Sci. 12:683422. doi: 10.3389/fpls.2021.683422
Geldmann, J., Coad, L., Barnes, M. D., Craigie, I. D., Woodley, S., Balmford, A., et al. (2018). A global analysis of management capacity and ecological outcomes in terrestrial protected areas. Conserv. Lett. 11:e12434. doi: 10.1111/conl.12434
Goslee, S. C., and Urban, D. L. (2007). The ecodist package for dissimilarity-based analysis of ecological data. J. Stat. Softw. 22, 1–19. doi: 10.18637/jss.v022.i07
Gower, J. C. (1966). Some distance properties of latent root and vector methods used in multivariate analysis. Biometrika 53, 325–338. doi: 10.1093/biomet/53.3-4.325
Hanotte, O., Bradley, D. G., Ochieng, J. W., Verjee, Y., Hill, E. W., and Gege, J. E. (2002). African pastoralism: genetic imprints of origins and migrations. Science 296, 336–339. doi: 10.1126/science.1069878
Hansen, M. M., Olivieri, I., Waller, D. M., and Nielsen, E. E. (2012). Monitoring adaptive genetic responses to environmental change. Mol. Ecol. 21, 1311–1329. doi: 10.1111/j.1365-294X.2011.05463.x
Hoffmann, M. H., Glaß, A. S., Tomiuk, J., Schmuths, H., Fritsch, R. M., and Bachmann, K. (2003). Analysis of molecular data of Arabidopsis thaliana (L.) Heynh. (Brassicaceae) with Geographical Information Systems (GIS). Mol. Ecol. 12, 1007–1019. doi: 10.1046/j.1365-294X.2003.01791.x
Huang, C. J., Zhang, Y. L., and Bartholomew, R. (1999). Fagaceae. Flora of China. Beijing: Science Press.
Jia, D. R., Abbott, R. J., Liu, T. L., Mao, K. S., Bartish, L. V., and Liu, J. Q. (2012). Out of the Qinghai-Tibet Plateau: evidence for the origin and dispersal of Eurasian temperate plants from a phylogeographic study of Hippophaë rhamnoides (Elaeagnaceae). New Phytol. 194, 1123–1133. doi: 10.1111/j.1469-8137.2012.04115.x
Jombart, T., and Ahmed, I. (2011). Adegenet 1.3-1: new tools for the analysis of genome-wide SNP data. Bioinformatics 27, 3070–3071. doi: 10.1093/bioinformatics/btr521
Ju, M. M., Feng, L., Yang, J., Yang, Y. C., Chen, X. D., and Zhao, G. F. (2019). Evaluating population genetic structure and demographic history of Quercus spinosa (Fagaceae) based on specific length amplified fragment sequencing. Front. Genet. 10:965. doi: 10.3389/fgene.2019.00965
Kalinowski, S. T. (2005). HP-RARE 1.0: a computer program for performing rarefaction on measures of allelic richness. Mol. Ecol. Notes 5, 187–189. doi: 10.1111/j.1471-8286.2004.00845.x
Kampfer, S., Lexer, C., Glossl, J., and Steinkellner, H. (1998). Brief report characterization of (GA) n microsatellite loci from Quercus robur. Hereditas 129, 183–186. doi: 10.1111/j.1601-5223.1998.00183.x
Li, G., Kim, C., Zha, H., Zhou, Z., Nie, Z., and Sun, H. (2014). Molecular phylogeny and biogeography of the arctic-alpine genus Lagotis (Plantaginaceae). Taxon 63, 103–115. doi: 10.12705/631.47
Li, M. J., Yu, H. X., Guo, X. L., and He, X. J. (2021). Out of the Qinghai-Tibetan Plateau and rapid radiation across Eurasia for Allium section Daghestanica (Amaryllidaceae). AoB Plants 13:plab017. doi: 10.1093/aobpla/plab017
Li, Y., Zhang, Y., Liao, P. C., Wang, T. R., Wang, X. Y., Ueno, S., et al. (2021). Genetic, geographic, and climatic factors jointly shape leaf morphology of an alpine oak, Quercus aquifolioides Rehder & EH Wilson. Ann. For. Sci. 78:64. doi: 10.1007/s13595-021-01077-w
Liao, Z., Nobis, M. P., Xiong, Q., Tian, X. L., Wu, X. G., Pan, K., et al. (2021). Potential distributions of seven sympatric sclerophyllous oak species in Southwest China depend on climatic, non-climatic, and independent spatial drivers. Ann. For. Sci. 78:5. doi: 10.1007/s13595-020-01012-5
Lichstein, J. W. (2007). Multiple regression on distance matrices: a multivariate spatial analysis tool. Plant Ecol. 188, 117–131. doi: 10.1007/s11258-006-9126-3
Liu, J., Möller, M., Provan, J., Gao, L. M., Poudel, R. C., and Li, D. Z. (2013). Geological and ecological factors drive cryptic speciation of yews in a biodiversity hotspot. New Phytol. 199, 1093–1108. doi: 10.1111/nph.12336
Liu, J. Q., Chen, Z. D., and Lu, A. M. (2000). The phylogenetic relationships of an endemic genus Sinadoxa in the Qinghai-Xizang Plateau: evidence from ITS sequence analysis. J. Integr. Plant Biol. 42, 656–658.
Liu, J. Q., Sun, Y. S., Ge, X. J., Gao, L. M., and Qiu, Y. X. (2012). Phylogeographic studies of plants in China: advances in the past and directions in the future. J. Syst. Evol. 50, 267–275. doi: 10.1111/j.1759-6831.2012.00214.x
Lockwood, J. D., Aleksic, J. M., Zou, J., Wang, J., Liu, J. Q., and Renner, S. M. (2013). A new phylogeny for the genus Picea from plastid, mitochondrial, and nuclear sequences. Mol. Phylogenet. Evol. 69, 717–727. doi: 10.1016/j.ympev.2013.07.004
López-Pujol, J., Zhang, F. M., Sun, H. Q., Ying, T. S., and Ge, S. (2011). Centres of plant endemism in China: places for survival or for speciation? J. Biogeogr. 38, 1267–1280. doi: 10.1111/j.1365-2699.2011.02504.x
Manel, S., Joost, S., Epperson, B. K., Holderegger, R., Storfer, A., Rosenberg, M. S., et al. (2010). Perspectives on the use of landscape genetics to detect genetic adaptive variation in the field. Mol. Ecol. 19, 3760–3772. doi: 10.1111/j.1365-294X.2010.04717.x
Manthey, J. D., and Moyle, R. G. (2015). Isolation by environment in white-breasted nuthatches (Sitta carolinensis) of the Madrean Archipelago sky islands: a landscape genomics approach. Mol. Ecol. 24, 3628–3638. doi: 10.1111/mec.13258
McKinney, G. J., Larson, W. A., Seeb, L. W., and Seeb, J. E. (2017). RADseq provides unprecedented insights into molecular ecology and evolutionary genetics: comment on Breaking RAD by Lowry, et al. (2016). Mol. Ecol. Resour. 17, 356–361. doi: 10.1111/1755-0998.12649
McRae, B. H. (2006). Isolation by resistance. Evolution 60, 1551–1561. doi: 10.1111/j.0014-3820.2006.tb00500.x
McRae, B. H., Dickson, B. G., Keitt, T. H., and Shah, V. B. (2008). Using circuit theory to model connectivity in ecology, evolution, and conservation. Ecology 89, 2712–2724. doi: 10.1890/07-1861.1
Meng, H. H., Su, T., Gao, X. Y., Li, J., Jiang, X. L., Sun, H., et al. (2017). Warm-cold colonization: response of oaks to uplift of the Himalaya-Hengduan Mountains. Mol. Ecol. 26, 3276–3294. doi: 10.1111/mec.14092
Mulch, A., and Chamberlain, C. (2006). The rise and growth of Tibet. Nature 439, 670–671. doi: 10.1038/439670a
Myers, N., Mittermeier, R. A., Mittermeier, C. G., Da Fonseca, G. A. B., and Kent, J. (2000). Biodiversity hotspots for conservation priorities. Nature 403, 853–858. doi: 10.1038/35002501
Naimi, B., Hamm, N. A. S., Groen, T. A., Skidmore, A. K., and Toxopeus, A. G. (2014). Where is positional uncertainty a problem for species distribution modelling? Ecography 37, 191–203. doi: 10.1111/j.1600-0587.2013.00205.x
Nie, Z. L., Funk, V., Sun, H., Deng, T., Meng, Y., and Wen, J. (2013). Molecular phylogeny of Anaphalis (Asteraceae, Gnaphalieae) with biogeographic implications in the Northern Hemisphere. J. Plant Res. 126, 17–32. doi: 10.1007/s10265-012-0506-6
Nie, Z. L., Wen, J., Sun, H., and Bartholomew, B. (2005). Monophyly of Kelloggia Torrey ex Benth. (Rubiaceae) and evolution of its intercontinental disjunction between western North America and eastern Asia. Am. J. Bot. 92, 642–652. doi: 10.3732/ajb.92.4.642
Novembre, J., and Stephens, M. (2008). Interpreting principal component analyses of spatial population genetic variation. Nat. Genet. 40, 646–649. doi: 10.1038/ng.139
Oksanen, J., Blanchet, F. G., Friendly, M., Kindt, R., Legendre, P., McGlinn, D., et al. (2017). Package ‘Vegan’. Community Ecology Package: Ordination Methods, Diversity Analysis and Other Functions for Community and Vegetation Ecologists. Version, 2. Nairobi: World Agroforestry.
Peakall, R., and Smouse, P. E. (2006). GenAlEx 6: genetic analysis in Excel. Population genetic software for teaching and research. Mol. Ecol. Notes 6, 288–295. doi: 10.1111/j.1471-8286.2005.01155.x
Peterman, W. E. (2018). ResistanceGA: an R package for the optimization of resistance surfaces using genetic algorithms. Methods Ecol. Evol. 9, 1638–1647. doi: 10.1111/2041-210X.12984
Petit, R. J., El Mousadik, A., and Pons, O. (1998). Identifying populations for conservation on the basis of genetic markers. Conserv. Biol. 12, 844–855. doi: 10.1111/j.1523-1739.1998.96489.x
Phillips, S. J., and Dudik, M. (2008). Modeling of species distributions with Maxent: new extensions and a comprehensive evaluation. Ecography 31, 161–175. doi: 10.1111/j.0906-7590.2008.5203.x
Pritchard, J. K., Stephens, M., and Donnelly, P. (2000). Inference of population structure using multilocus genotype data. Genetics 155, 945–959. doi: 10.1534/genetics.116.195164
Qiu, Y. X., Fu, C. X., and Comes, H. P. (2011). Plant molecular phylogeography in China and adjacent regions: tracing the genetic imprints of Quaternary climate and environmental change in the world’s most diverse temperate flora. Mol. Phylogenet. Evol. 59, 225–244. doi: 10.1016/j.ympev.2011.01.012
Richards, E., Reichardt, M., and Rogers, S. (1994). Preparation of genomic DNA from plant tissue. Curr. Protoc. Mol. Biol. 27, 2.3.1–2.3.7. doi: 10.1002/0471142727.mb0203s27
Rosenberg, N. A. (2004). Distruct: a program for the graphical display of population structure. Mol. Ecol. Notes 4, 137–138. doi: 10.1046/j.1471-8286.2003.00566.x
Safer, S., Tremetsberger, K., Guo, Y. P., Kohl, G., Samuel, M. R., Stuessy, T. F., et al. (2011). Phylogenetic relationships in the genus Leontopodium (Asteraceae: Gnaphalieae) based on AFLP data. Bot. J. Linn. Soc. 165, 364–377. doi: 10.1111/j.1095-8339.2011.01117.x
Smouse, P. E., Long, J. C., and Sokal, R. R. (1986). Multiple regression and correlation extensions of the Mantel test of matrix correspondence. Syst. Zool. 35, 627–632. doi: 10.2307/2413122
Sobel, J. M., Chen, G. F., Watt, L. R., and Schemske, D. W. (2010). The biology of speciation. Evolution 64, 295–315. doi: 10.1111/j.1558-5646.2009.00877.x
Song, Y., Jin, L., and Wang, H. (2018). Vegetation changes along the Qinghai-Tibet Plateau engineering corridor since 2 000 induced by climate change and human activities. Remote Sens 10:95. doi: 10.3390/rs10010095
Sork, V. L., Aitken, S. N., Dyer, R. J., Eckert, A. J., Legendre, P., and Neale, D. B. (2013). Putting the landscape into the genomics of trees: approaches for understanding local adaptation and population responses to changing climate. Tree Genet. Genomes 9, 901–911. doi: 10.1007/s11295-013-0596-x
Steinkellner, H., Fluch, S., Turetschek, E., Lexer, C., Streiff, R., Kremer, A., et al. (1997). Identification and characterization of (GA/CT) n-microsatellite loci from Quercus petraea. Plant Mol. Biol. 33, 1093–1096. doi: 10.1023/a:1005736722794
Tanksley, S. D., and McCouch, S. R. (1997). Seed banks and molecular maps: unlocking genetic potential from the wild. Science 227, 1063–1066. doi: 10.1126/science.277.5329.1063
Ueno, S., Taguchi, Y., and Tsumura, Y. (2008). Microsatellite markers derived from Quercus mongolica var. crispula (Fagaceae) inner bark expressed sequence tags. Genes Genet. Syst. 83, 179–187. doi: 10.1266/ggs.83.179
Van den Wollenberg, A. L. (1977). Redundancy analysis an alternative for canonical correlation analysis. Psychometrik 42, 207–219. doi: 10.1007/BF02294050
Van Oosterhout, C., Hutchinson, W. F., Wills, D. P. M., and Shipley, P. (2004). Micro-checker: software for identifying and correcting genotyping errors in microsatellite data. Mol. Ecol. Notes 4, 535–538. doi: 10.1111/j.1471-8286.2004.00684.x
Van Strien, M. J., Holderegger, R., and Van Heck, H. J. (2015). Isolation-by-distance in landscapes: considerations for landscape genetics. Heredity 114, 27–37. doi: 10.1038/hdy.2014.62
Van Zonneveld, M., Scheldeman, X., Escribano, P., Viruel, M. A., Van Damme, P., Garcia, W., et al. (2012). Mapping genetic diversity of cherimoya (Annona cherimola Mill.): application of spatial analysis for conservation and use of plant genetic resources. PLoS One 7:e29845. doi: 10.1371/journal.pone.0029845
Wahid, A., Gelani, S., Ashraf, M., and Foolad, M. R. (2007). Heat tolerance in plants: an overview. Environ. Exp. Bot. 61, 199–223. doi: 10.1016/j.envexpbot.2007.05.011
Wang, L., Wu, Z. Q., Bystriakova, N., Ansell, S. W., Xiang, Q. P., Heinrichs, J., et al. (2011). Phylogeography of the Sino-Himalayan fern Lepisorus clathratus on “the roof of the world”. PLoS One 6:e25896. doi: 10.1371/journal.pone.0025896
Wen, J., Zhang, J. Q., Nie, Z. L., Zhong, Y., and Sun, H. (2014). Evolutionary diversifications of plants on the Qinghai-Tibetan Plateau. Front. Genet. 5:4. doi: 10.3389/fgene.2014.00004
Wu, S. G., Yang, Y. P., and Fei, Y. (1995). On the flora of the alpine region in the Qinghai-Xizang (Tibet) plateau. Acta Bot. Yunnanica 17, 233–250.
Wulff, E. V. (1943). An Introduction to Historical Plant Geography. Waltham, MA: Chronica Botanica Company.
Xu, T. T., Wang, Q., Olson, M. S., Li, Z. H., Miao, N., and Mao, K. S. (2017). Allopatric divergence, demographic history, and conservation implications of an endangered conifer Cupressus chengiana in the eastern Qinghai-Tibet Plateau. Tree Genet. Genomes 13:100. doi: 10.1007/s11295-017-1183-3
Zhang, J. Q., Meng, S. Y., Allen, G. A., Wen, J., and Rao, G. Y. (2014). Rapid radiation and dispersal out of the Qinghai-Tibetan Plateau of an alpine plant lineage Rhodiola (Crassulaceae). Mol. Phylogenet. Evol. 77, 147–158. doi: 10.1016/j.ympev.2014.04.013
Zhang, Y. L., Li, B. Y., and Zheng, D. (2002). A discussion on the boundary and area of the Tibetan Plateau in China. Geogr. Res. 21, 1–8. doi: 10.3321/j.issn:1000-0585.2002.01.001
Keywords: species conservation, migration routes, genotype-environment association, Quercus aquifolioides, Quercus spinosa, Hengduan Mountains, Qinling Mountains
Citation: Liu K, Qi M and Du FK (2022) Population and Landscape Genetics Provide Insights Into Species Conservation of Two Evergreen Oaks in Qinghai–Tibet Plateau and Adjacent Regions. Front. Plant Sci. 13:858526. doi: 10.3389/fpls.2022.858526
Received: 20 January 2022; Accepted: 11 April 2022;
Published: 19 May 2022.
Edited by:
Alison G. Nazareno, Federal University of Minas Gerais, BrazilReviewed by:
Thaís C. S. Dal’Sasso, Universidade Federal de Viçosa, BrazilCopyright © 2022 Liu, Qi and Du. This is an open-access article distributed under the terms of the Creative Commons Attribution License (CC BY). The use, distribution or reproduction in other forums is permitted, provided the original author(s) and the copyright owner(s) are credited and that the original publication in this journal is cited, in accordance with accepted academic practice. No use, distribution or reproduction is permitted which does not comply with these terms.
*Correspondence: Fang K. Du, ZHVmYW5nMzI1QGJqZnUuZWR1LmNu, orcid.org/0000-0002-7377-5259
Disclaimer: All claims expressed in this article are solely those of the authors and do not necessarily represent those of their affiliated organizations, or those of the publisher, the editors and the reviewers. Any product that may be evaluated in this article or claim that may be made by its manufacturer is not guaranteed or endorsed by the publisher.
Research integrity at Frontiers
Learn more about the work of our research integrity team to safeguard the quality of each article we publish.