 Weixiong Long
 Lihua Luo
 Yonghui Li
 Hongwei Xie
94% of researchers rate our articles as excellent or good
Learn more about the work of our research integrity team to safeguard the quality of each article we publish.
Find out more
ORIGINAL RESEARCH article
Front. Plant Sci., 25 April 2022
Sec. Plant Breeding
Volume 13 - 2022 | https://doi.org/10.3389/fpls.2022.857435
This article is part of the Research TopicEnhancing Allele Mining for Crop Improvement amid the Emerging Challenge of Climate ChangeView all 8 articles
The landraces preserved by indigenous worldwide exhibited larger variation in the phenotypes and adaption to different environments, which suggests that they comprise rich resources and can be served as a gene pool for rice improvement. Despite extensive studies on cultivated rice, the variations and relationships between landraces and modern cultivated rice remain unclear. In this study, a total of 20 varieties that include 10 Oryza javanica collected from different countries worldwide and 10 Oryza indica from China were genotyped and yielded a sum of 99.9-Gb resequencing raw data. With the genomic sequence of the japonica cultivar Nipponbare as a reference, the following genetic features of single-nucleotide polymorphism (SNP) ranged from 861,177 to 1,044,617, insertion–deletion polymorphisms (InDels) ranged from 164,018 to 211,135, and structural variation (SV) ranged from 3,313 to 4,959 were identified in Oryza javanica. Variation between the two subspecies was also determined that 584,104 SNPs, 75,351 InDels, 104,606 SNPs, and 19,872 InDels specific to Oryza indica and Oryza javanica, respectively. Furthermore, Gene Ontology (GO) and KEGG of Oryza javanica-specific SNP-related genes revealed that they participated in DNA metabolic process, DNA replication, and DNA integration. The sequence variation and candidate grain shape-related gene TGW2 were identified through Fst and sweep selective analysis. Hap4 of TGW2 is performed better than others. The whole genome sequence data and genetic variation information illustrated in this study will serve as an important gene pool for molecular breeding and facilitate genetic analysis of Oryza javanica varieties.
The knowledge of the pattern of the variation in the rice species is a prerequisite for rice improvement as it helps breeders in choosing suitable breeding strategies for their breeding goals. Rice landraces were the lineages evolved via selective breeding by farmers in a time of long-term domestication (Pusadee et al., 2009). Wild relatives and landraces exhibited wide adaptation to various environments, which provides valuable and useful genetic resources for rice improvement (Sang and Ge, 2013; Dwivedi et al., 2016). Compared with modern cultivars, traditional rice landraces preserved by indigenous were under urgent need of protection and systematic evaluation to unveil new genes or QTLs for higher yield, higher resistance, and more friendly to environments (Ram et al., 2007; Pusadee et al., 2009; Hour et al., 2020). Hence, the investigation of the whole genome variation and allelic variation for grain shapes of these landraces was the paramount step for rice breeding programs.
Oryza sativa ssp. javanica is a large grain landrace that exhibited long and wide grains compared to O. sativa ssp. indica and O. sativa ssp. japonica (Eizenga et al., 2019). Some researchers proposed the hypothesis that O. sativa ssp. japonica derived from O. sativa ssp. javanica because of the larger standardized alleles and higher mutation rates showed by O. japonica (Garris et al., 2005). However, the previous studies for rice grain shapes concentrated on Indica (Fan et al., 2006; Weng et al., 2008; Li et al., 2011; Wang et al., 2012; Liu et al., 2017; Zhao et al., 2018), and the reports about genetic control of big grain in javanica have not been described, let alone the genetic differentiation of the subspecies. Earlier studies for O. sativa ssp. javanica mainly focused on the application of heterosis (Peng et al., 2008).
With the rapid development of sequencing technology, the high-quality rice reference genome and population resequencing provided an unparalleled convenience to explore the genome-wide variation exhibited among the landraces (Chen et al., 2021). The application of rice genomics could cost-effectively provide dense SNP markers and InDel markers (Davey et al., 2011). High-throughput genotyping based on SNP/InDel markers could provide exhaustive genetic information due to their abundance and uniform distribution throughout the genome. These markers could help with population structure analysis, genetic map construction, and gene mapped cloning (Long et al., 2020a). SNP markers had been widely used to characterize the rice population structure and identify the candidate gene/QTL for favor traits (Long et al., 2020b). InDel variation dispersed throughout the rice genome could develop InDel markers for identifying the varieties or species and function as SSR markers (Hu et al., 2020; Hechanova et al., 2021). Furthermore, genomic analysis of diverse genotypes such as wild relatives, landraces, cultivars, and modern rice was expected to provide new light on domestications, selection sweeps of specific genomic regions, and evolutions of grain shapes (Choi et al., 2020; Lin et al., 2020). Nowadays, long and wide grain javanica rice had evolved from their short, narrow grains progenitors such as Oryza rufipogon over thousand years of cultivation, domestication, and natural selection (Huang et al., 2012). The investigation of the complex grain shapes contributed by many genes remained interesting and challenging.
In this study, we aimed at understanding the genetic basis of big grains of O. sativa ssp. javanica by whole genome deep resequencing and comparative genomic analysis using 20 rice varieties that include 10 O. sativa ssp. indica and 10 O. sativa ssp. javanica with the reference genome of Nipponbare genome. We identified the whole genome SNP, InDel, and structure variation among the 20 rice accessions, and we also identified the common SNP and InDel variation between O. sativa ssp. indica and O. sativa ssp. javanica. Furthermore, private SNPs and InDels of javanica were identified, and the Gene Ontology (GO) analysis of the private InDels associated genes was conducted. Then, we performed selection sweeps of the two subpopulation. Additionally, the allelic variation of genes that controlled rice grain shapes, which also represented the selection sweep, was performed. The information described here can provide novel observations for rice breeding and genetic analysis.
A total of 20 rice varieties, which include 10 O. sativa javanica and 10 O. sativa indica, were used for analysis in this study. The germplasm of Oryza javanica varieties was obtained from the International Rice Research Institute (IRRI, Philippines), and the Oryza indica core pool was collected from Jiangxi Super Rice Research and Development Center (JSRRDC). The geographical distribution of the rice varieties is collected in Figure 1. The plants’ performance of selected Oryza javanica and Oryza indica is documented in Figure 1. All of the O. sativa were planted in Nanchang, China. Each variety was planted for 5 rows and each row for 10 plants. Each variety was transplanted with a spacing of 30 cm. The randomized complete block design was carried out in this study.
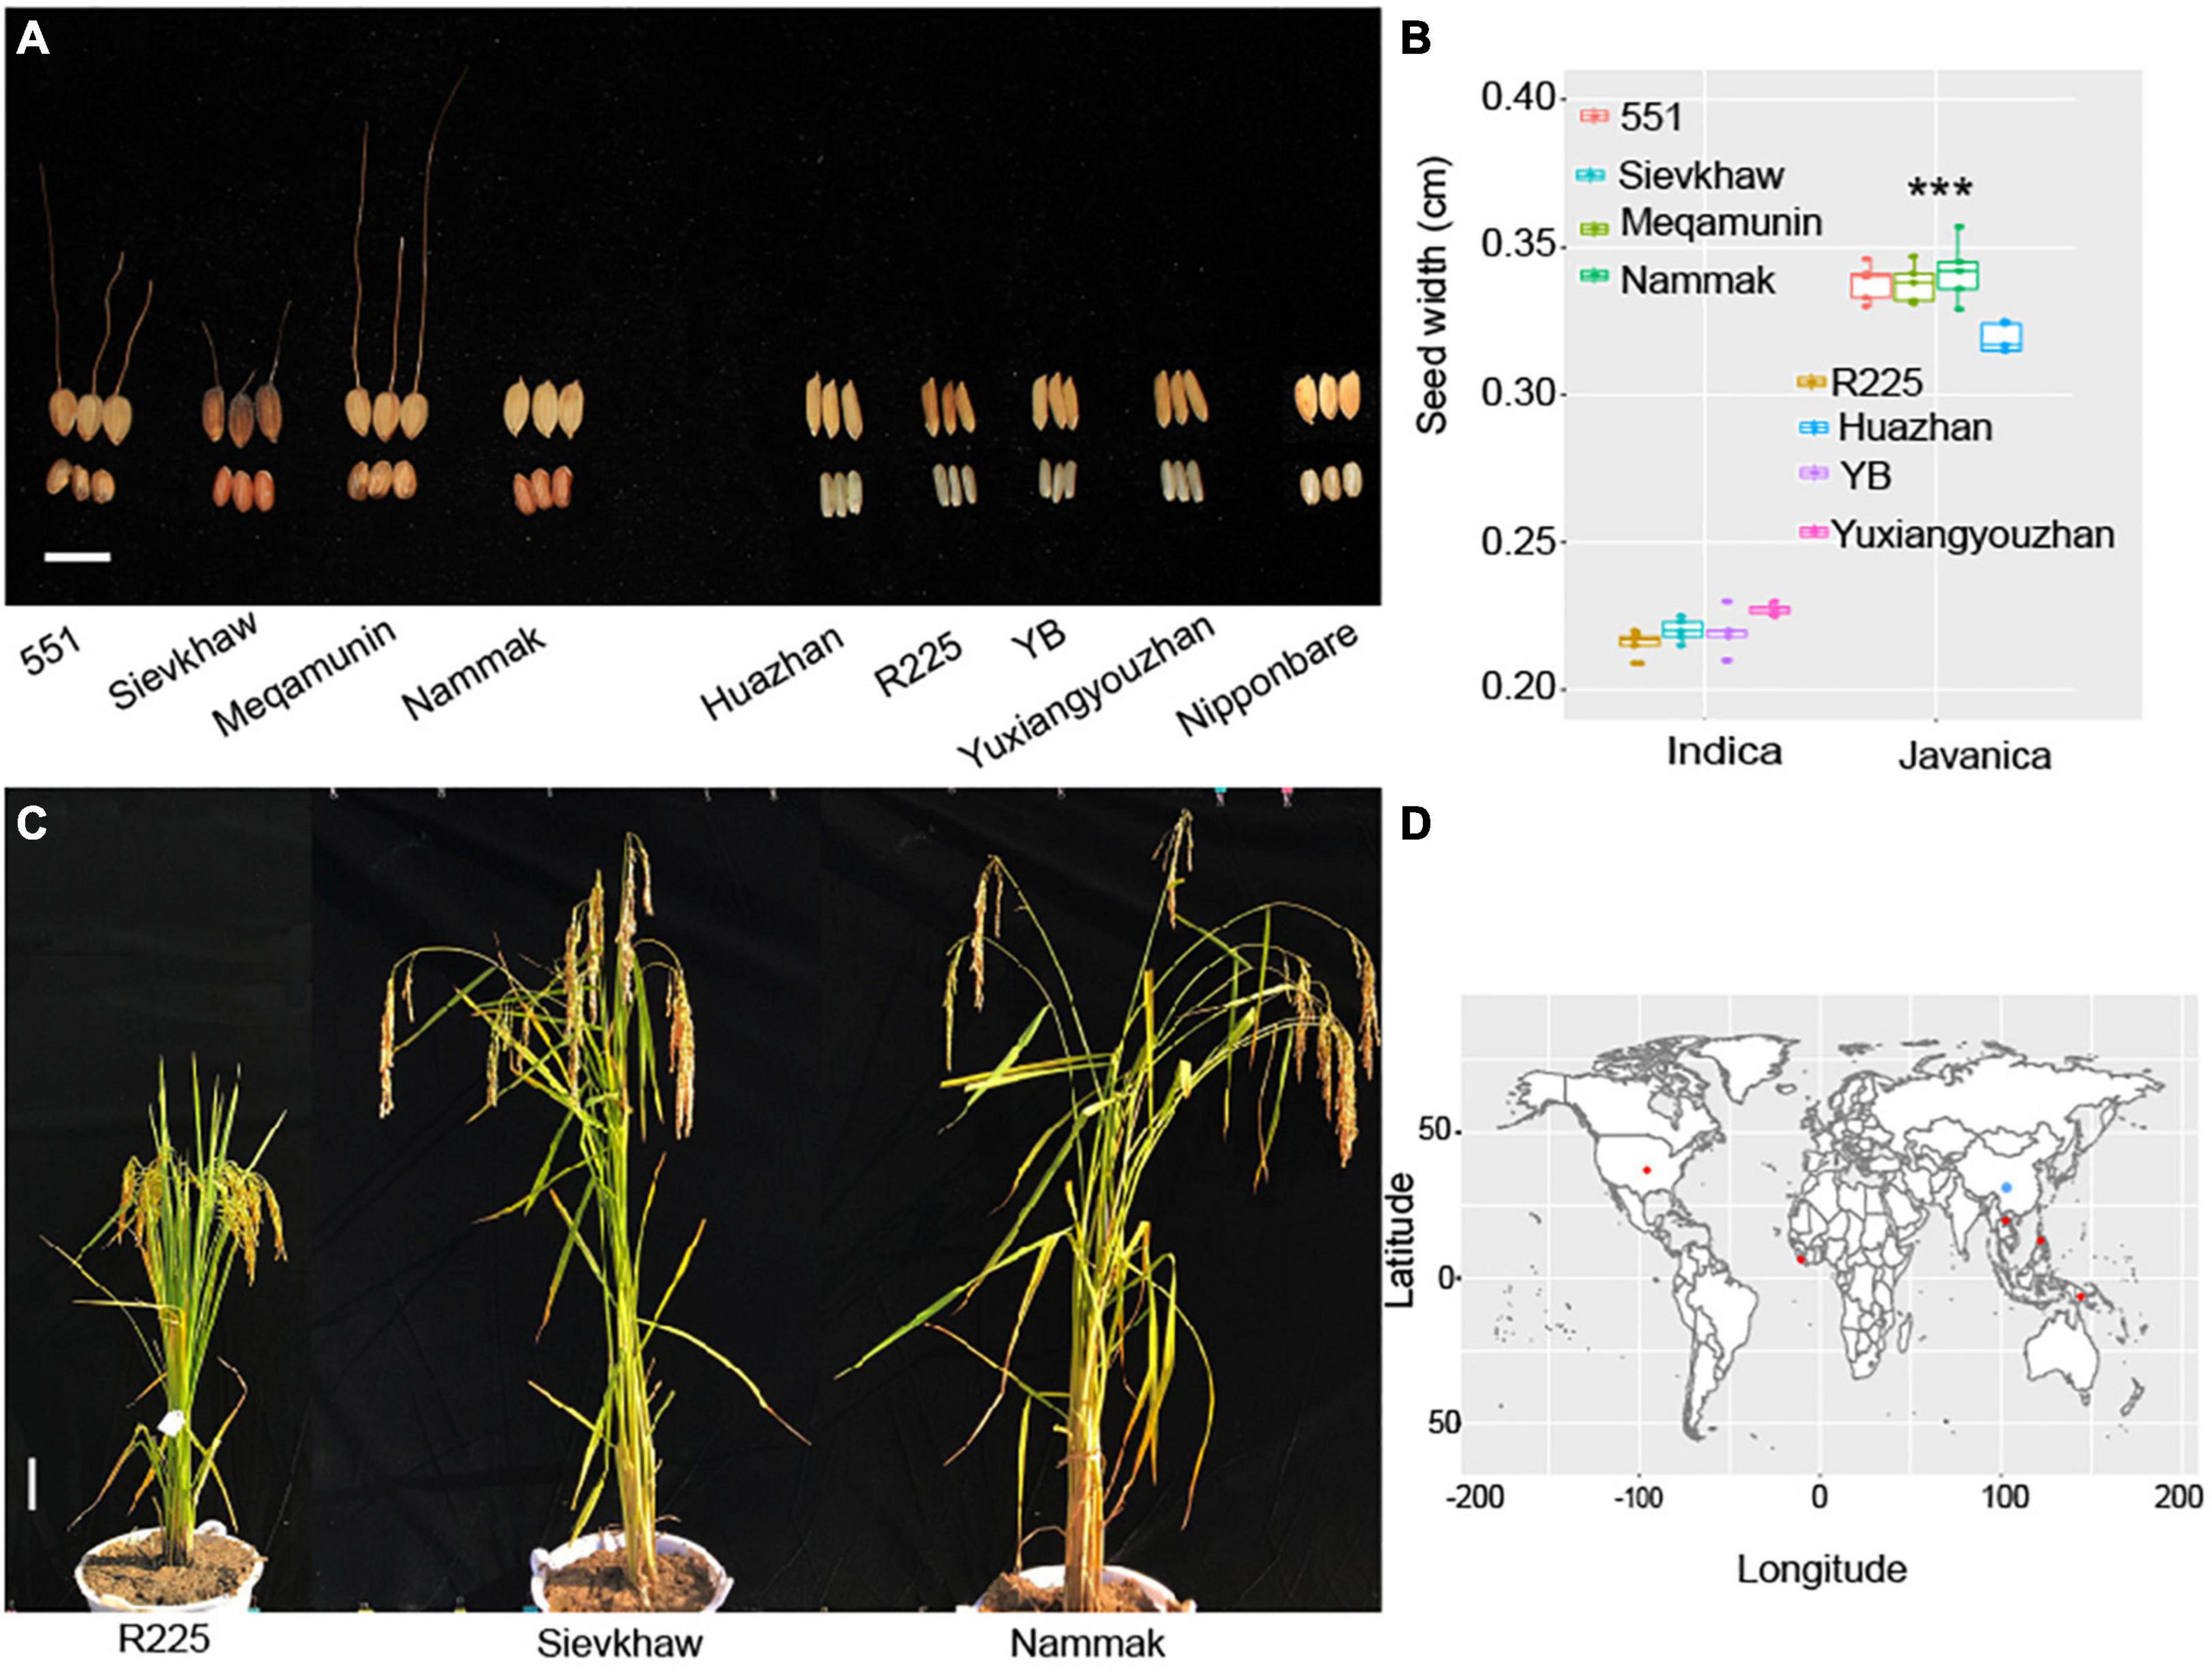
Figure 1. Phenotyping of the representative Oryza javanica and the source information. (A) Grain width of four Oryza javanica and four Oryza indica, Nipponbare was used as control. (B) Boxplot of the grain width of two subspecies. ***p < 0.001. (C) The plant performance of Super indica rice R225 and two javanica varieties. (D) The world distribution of the 20 sequenced rice accession. Red color indicates the javanica accessions, blue color shows the indica rice varieties.
For each rice accession, a single individual was used for whole genome resequencing. Genomic DNA was extracted from young leaves using a DNA Extraction Kit (Qiagen, Hilden, Germany), and sequencing libraries with an approximately 350-bp insert size were prepared. All samples were sequenced using the Illumina HiSeqTM 2500 by Biomarker Technologies (Beijing, China) according to the manufacturer’s instructions (Lv et al., 2020). In order to ensure the quality of information analysis, the raw reads were filtered based on the following criteria: (i) remove reads containing adapters, (ii) remove reads containing N > 5% (N represents base could not be determined), and (iii) remove reads where the q score (quality value) of over 50% bases of the read below 20. The clean reads were mapped to the reference genome of Nipponbare (Os-Nipponbare-Reference-IRGSP-1.0, MSU release 7) by using Burrows–Wheeler Alignment (BWA) software (v0.7.12) (Li and Durbin, 2009). The sequencing depth and coverage of each 100-kb window were calculated by SAMtools software (Li et al., 2009).
The alignment results were merged and converted into binary alignment map (BAM) files. Then, BAM out files were first sorted using Picard software, which was used to calculate the sequencing depth. For SNP and InDel variation identification, GATK (v3.8) software was used according to the following criteria (McKenna et al., 2010): the read depth is large than 10 and the quality score ≥50. Breakdancer was used to detect SVs that include insertions (Fan et al., 2014), larger deletions (>100 bp), inversion, intra-chromosomal rearrangements, and inter-chromosomal translocations based on mapped read pairs. The number of genomic variations in 100-kb sliding window size across the whole genome was calculated. The genomic distribution of SNPs, InDels, and SVs on each chromosome was visualized using Circos software (Krzywinski et al., 2009). The SnpEff tool was used to annotate the SNP and InDel and identify the large effect of variations (Cingolani et al., 2012).
To better identify the variation between the two subspecies, we intend to extract the shared SNPs/InDels variations to belong to O. sativa ssp. indica and O. sativa ssp. javanica, respectively. We divide the VCF file into two VCF files based on the subspecies samples. The private SNP/InDel variation is unique to one specific subspecies but not presented in the other subspecies were obtained using BCFtools (Danecek and McCarthy, 2017). To better understand the function of the private InDel-associated genes, we extracted the gene ID based on the location information from GFF file (Oryza_sativa.IRGSP-1.0.51.gff3) and performed gene ontology analysis. We also analyzed shared variation between Oryza indica and Oryza javanica.
GCTA software was used to conduct a PCA to estimate the number of subpopulations (Yang et al., 2011). Whole genome SNP was used to constructed neighbor-joining tree using SNPhylo software and visualized using the online web (Interactive Tree of Life, iTOL) (Lee et al., 2014). LD was calculated using PopLDdecay software (Zhang et al., 2019), the pairwise r2 was calculated for all the SNPs in a 50-kb window and averaged across the whole genome and 12 chromosomes separately.
To evaluate the genetic relationship of the two subspecies, pairwise genetic differentiation (Fst) for SNPs along with all chromosomes between indica and javanica was calculated using VCFtools v0.1.10 and represented pictorially using Circos with 100-kb fixed window (Danecek et al., 2011). Nucleotide diversity (Π) is often applied to measure the degree of variability in a population. The selective sweeps determined for javanica and indica rice were identified using reduction of diversity (ROD) and fixation index (Fst), and windows with the top 5% of maximum Fst and maximum and minimum ROD values were considered as selection regions (Wang et al., 2018). To identify the grain shape selection-related genes, we subjected the selective sweep regions and located within the previously mapped rice grain shapes QTL regions, and the overlapped regions were considered as the grain shape selection regions (Miao et al., 2020). To better understand the grain shape genes between the subspecies, we conducted the haplotype analysis of the selective grain shape genes.
The yield-related traits that include plant height, grain length, grain width, and panicle length of Oryza javanica show more than Oryza indica. The day to maturity of Oryza javanica exhibited longer than indica due to their photosensitivity. The average of four selected javanica rice’s width is 0.33 cm, which is almost 1.5-fold than that of O. sativa indica which selected as most cultivated in China (Figure 1).
A total of 99.94-GB raw data that include 396,571,548 paired-end reads of 250 bp were generated from the 20 rice varieties with approximately 13 × depth (Table 1). The percentage of Q30 Phred quality score ranged from 86.48 to 89.05% with an average of 87.83% (Table 1). A total of 99.78-GB raw data were obtained after filtered, and the filtered reads were used for further analysis. The GC content of Oryza indica and Oryza javanica was 43.15 and 42.33%, respectively. The average of 88.11% of Oryza indica and 92.97% of Oryza tropic japonica clean reads were mapped to the Nipponbare genome, which covers 82.31 and 89.20% of the reference genome. The reads depth of each rice landraces based on 100-kb window was ranged from 0 to 180 and presented in Supplementary Figure 1. The 20 resequencing data generated in this study were submitted to the National Genomic Data Center with the BioProject number PRJNA763248.
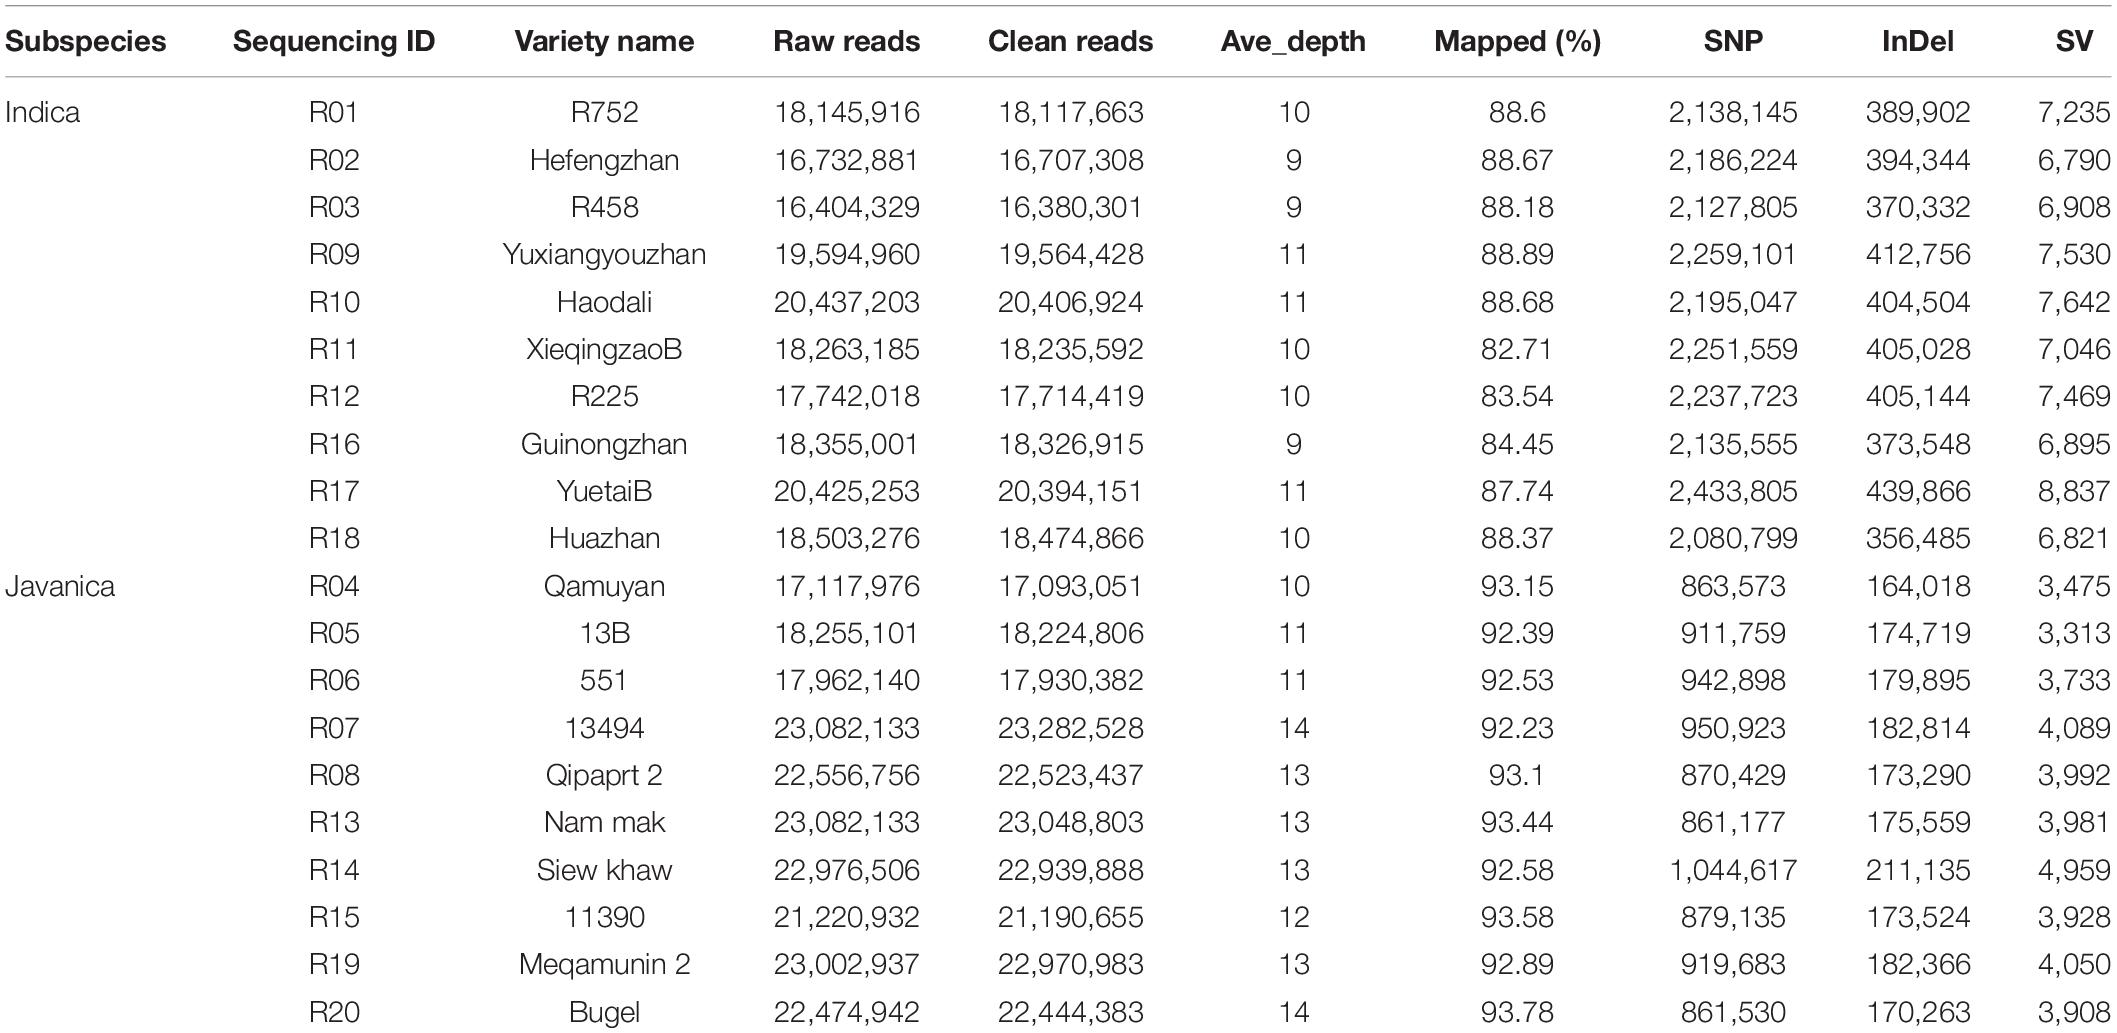
Table 1. The resequencing information of 20 rice varieties.
Single-nucleotide polymorphisms, InDels, and SVs in each Oryza javanica variety were identified based on the reference genome (Table 1). Overall, all the Oryza indica showed a similar pattern of DNA variations, which were 2–3 times higher compared with the SNPs of Oryza javanica. The average numbers of SNPs for Oryza indica and Oryza javanica were 2,204,576 and 910,613, respectively. The InDels number was significantly lower than the SNP number in both subspecies. The InDels number of Oryza indica ranged from 356,485 to 439,866, with an average of 395,190. A relatively low InDels number that ranges from 164,059 to 211,176 was obtained in Oryza javanica. The number of SVs was quite fewer than that of SNPs and InDels in both species. The total number of SVs in O. sativa indica ranged from 6,790 to 8,837, while that ranged from 3,313 to 4,959 in Oryza javanica. The detailed SV type and distribution information of all the 20 rice accessions are listed in Supplementary Table 1. The densities of SNPs, InDels, and SVs in both subspecies showed a similar profile. The distribution of SNPs, InDels, and SVs on all 12 chromosomes of each subspecies in comparison with the reference genome is presented in Figure 2.
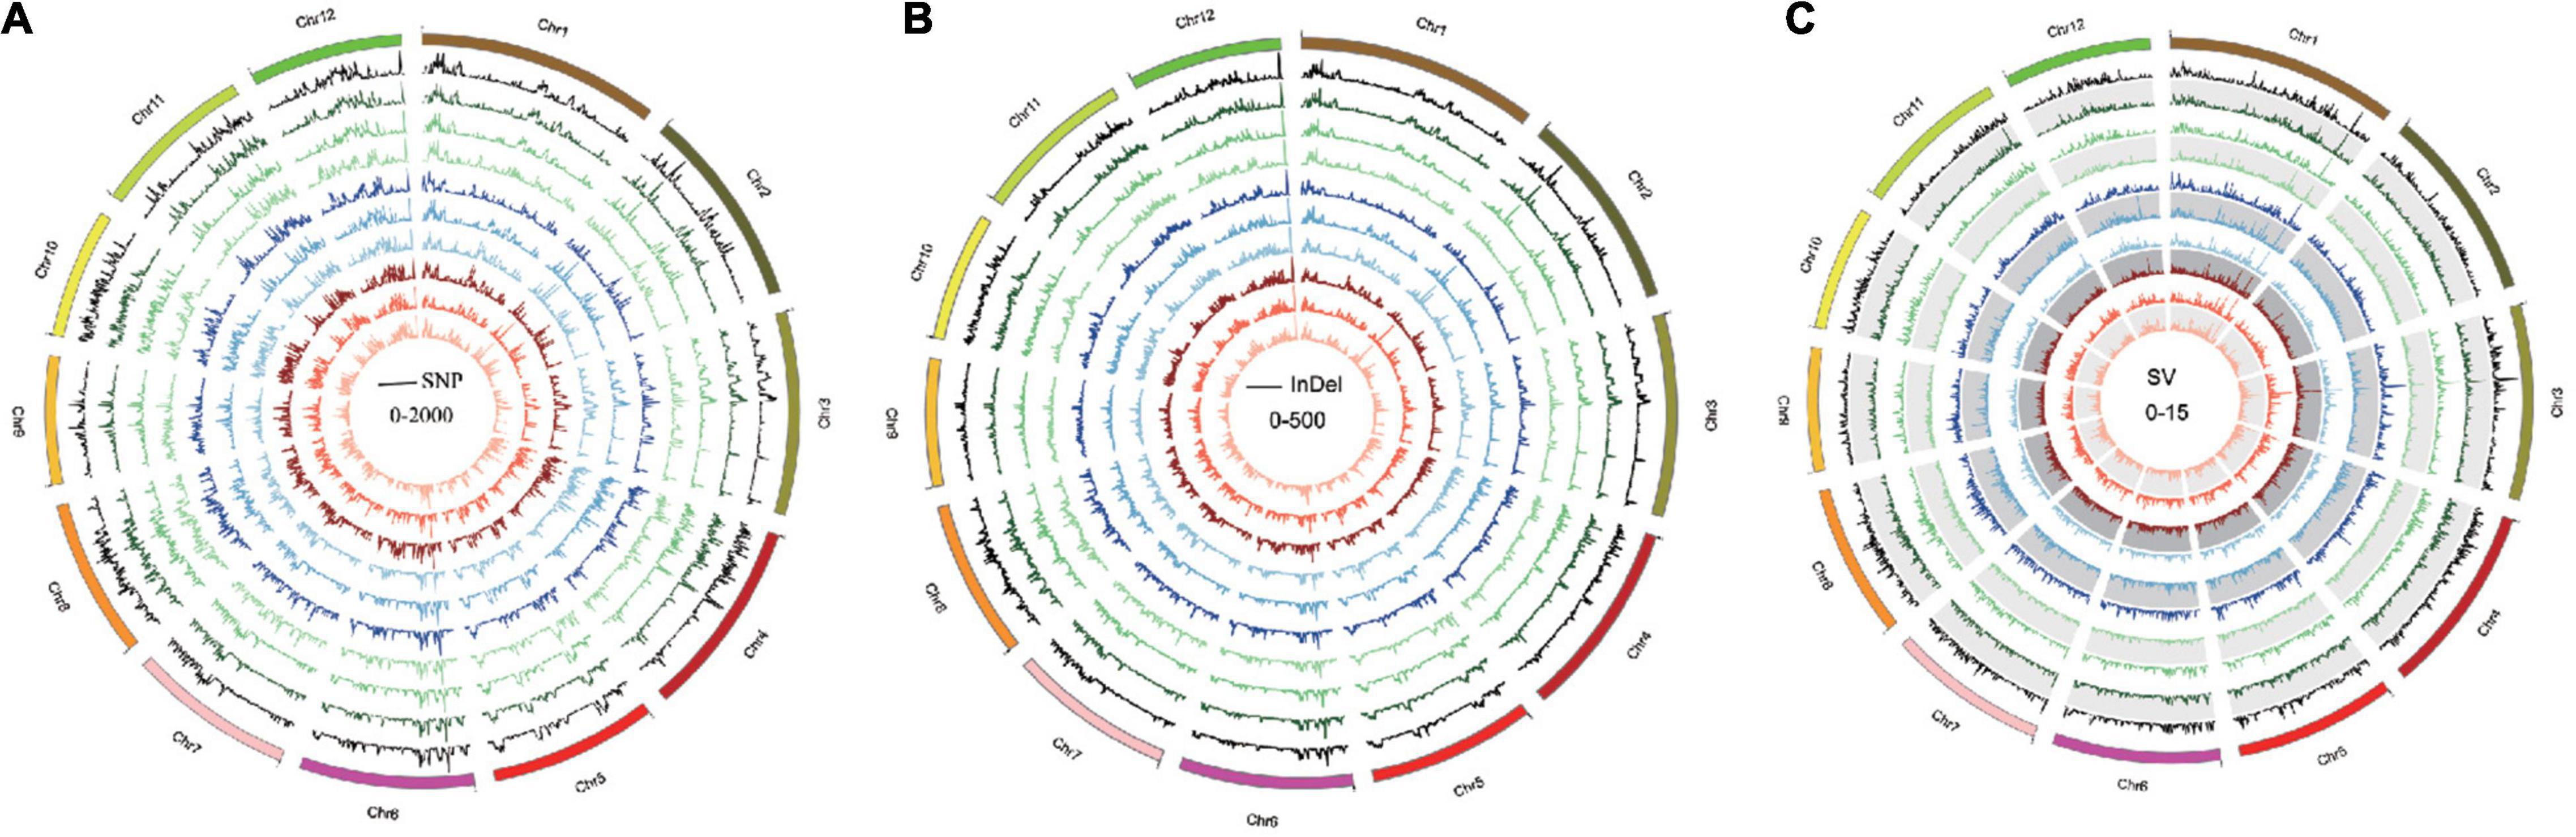
Figure 2. Genome-wide variation pattern of the 10 Oryza javanica. (A) The SNP variation distribution of 10 Oryza javanica among the genome. (B) The InDel variation of 10 Oryza javanica. (C). The SV pattern of 10 Oryza javanica was characterized with Nipponbare reference genome.
To understand the structure of the 20 rice accessions worldwide, PCA based on the whole genome SNP was conducted. The PCA results highly revealed that two main clusters correspond to two groups, indica and javanica. The phylogenetic tree was constructed using the maximum likelihood method clustered these varieties into two major groups, which are similar to the subpopulation identified by PCA (Figure 3). We examined LD decay in each subpopulation and all 20 rice accessions separately. As expected, the r2 value declined with the increasing physical distance between markers. LD extends to 300 kb for the indica group, which is a higher estimate than reported (McNally et al., 2009), while the LD is approximately 200 kb in javanica group. These results revealed that the utilization of these varieties had a slight advantage over that of other sets of japonica rice germplasm due to the few candidates in an LD block.
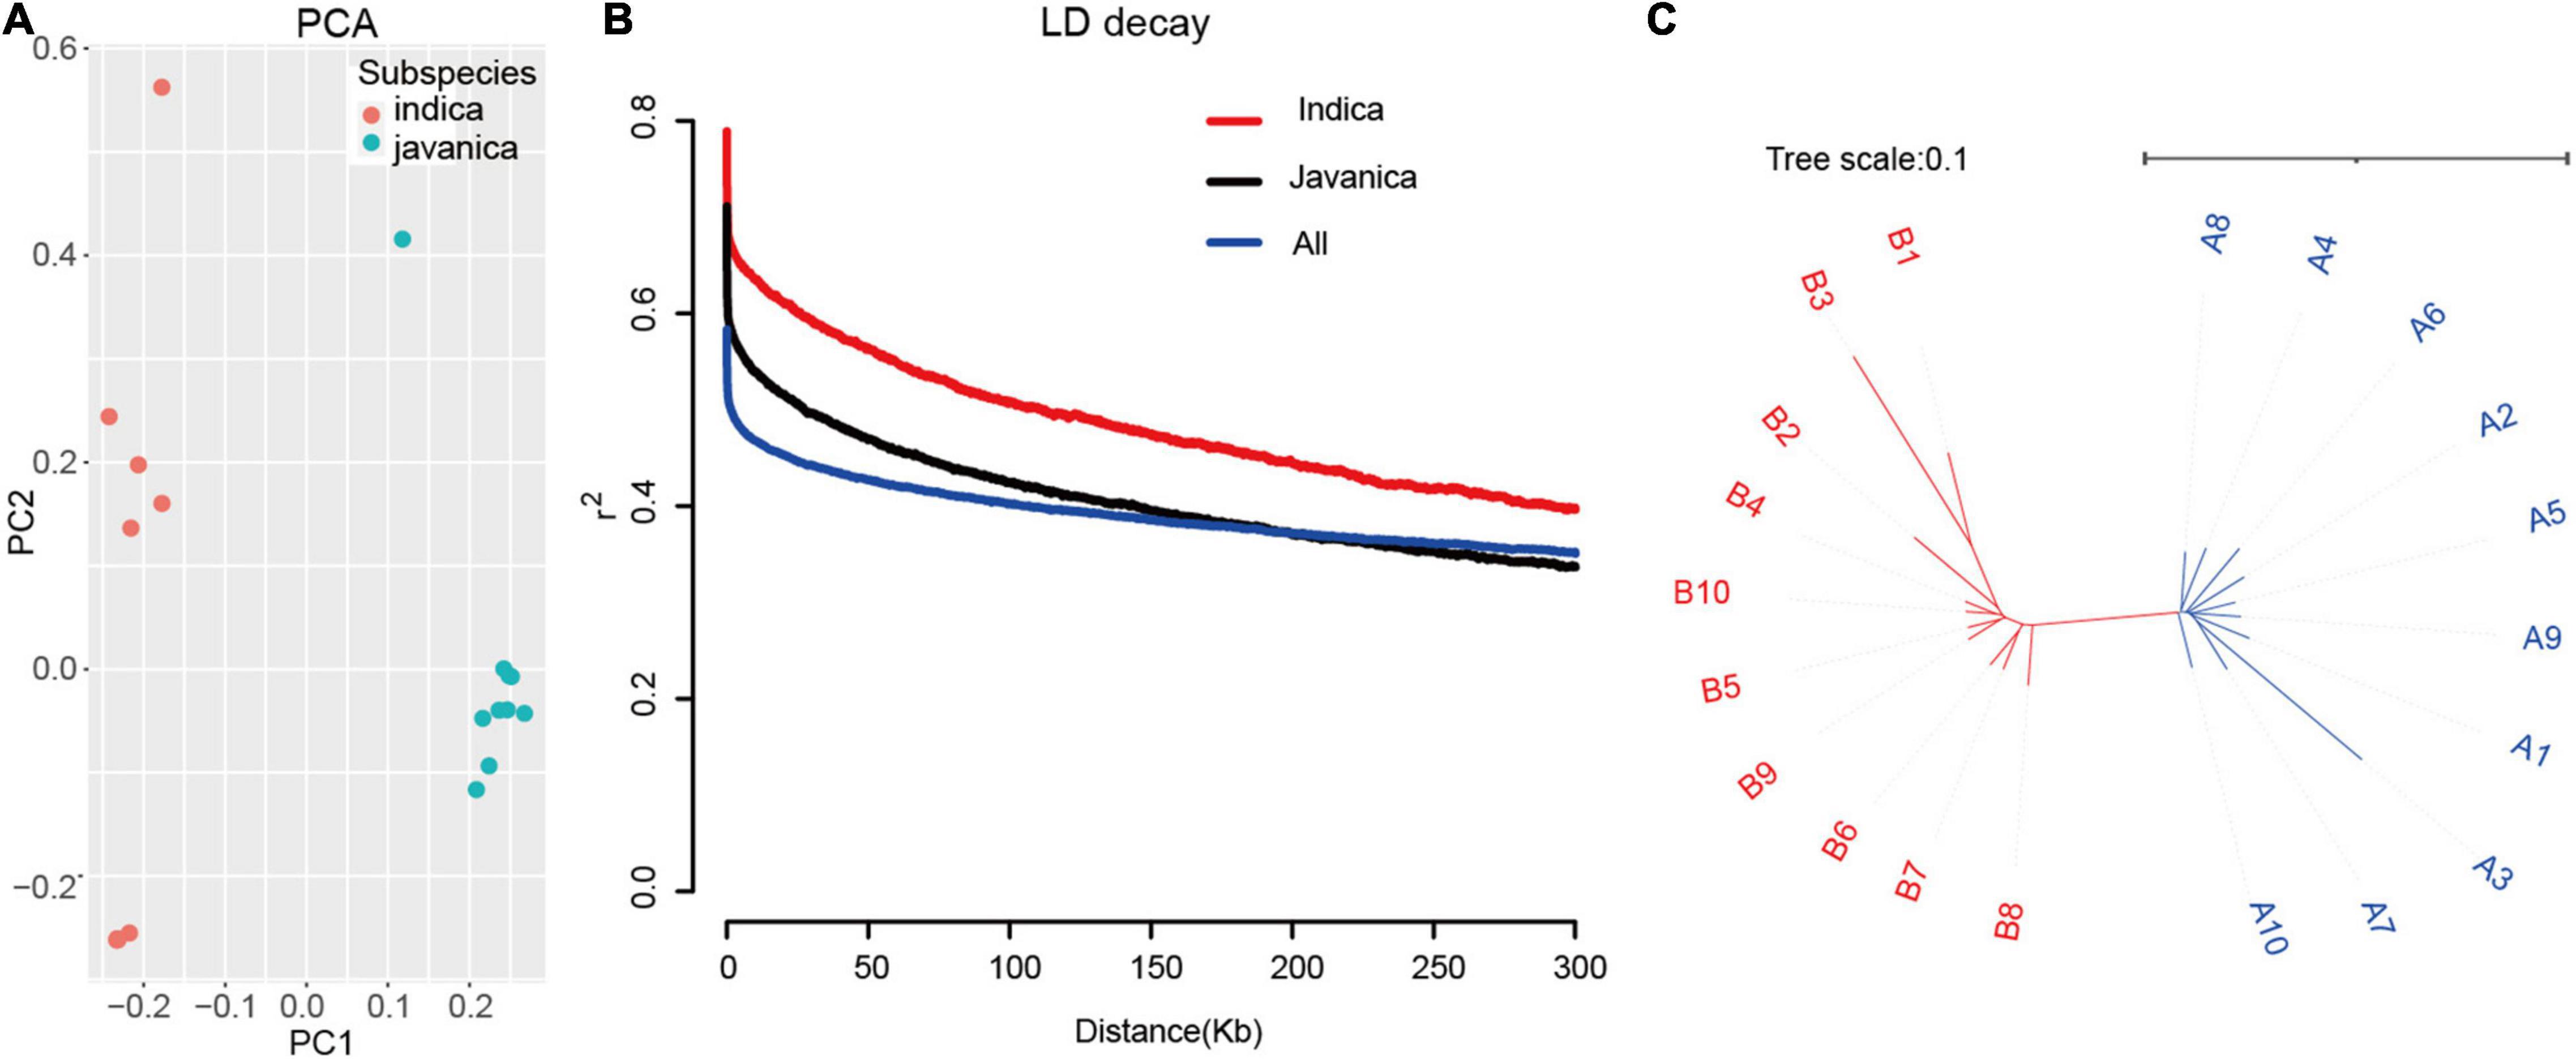
Figure 3. Population structure of the 20 rice varieties. (A) PCA of 20 rice accessions. Colors red and green indicate indica and javanica, respectively. (B) Decay of LD expressed as r2 as a function of inter-SNP distance for filtered MBML-intersect SNP, in the indica, javanica, and whole 20 population. (C) Unweighted neighbor-joining tree for genome-wide SNP, horizontal bar indicates distance by simple matching coefficient.
To better understand the variation pattern of the subpopulation, the indica and javanica variations were conducted, respectively. A total number of 649,857 and 170,370 common SNPs were identified in Oryza indica and Oryza javanica varieties, respectively. Among them, a total number of 584,104 and 104,518 private SNP belong to Oryza indica and javanica, respectively. The largest number of common SNPs is derived from the two subspecies both located on chromosome 1, while the lowest number of common SNPs was detected on chromosomes 9 and 5 for Oryza indica and Oryza javanica, respectively (Supplementary Tables 2, 3). A total number of 28,751 and 23,726 common and private InDels were found in javanica varieties, respectively. Unlike the variation pattern of SNP in javanica, the largest number for common and private InDels was both located on chromosome 6 and the lowest number for common and private InDels was characterized on chromosomes 9 and 10, respectively. In addition, bioinformatic analysis using the resequencing data of 20 varieties revealed that the common InDels number in Oryza indica is 7–40 times for 100-kb windows higher than that in Oryza javanica. The common InDels number located on the whole chromosome ranged from 5,429 to 13,706, which was identified in Oryza indica (Supplementary Tables 2, 3). The extracted common SNPs and InDels density were plotted using Circos program (Figure 4). The Venn diagram for shared SNPs and InDels variation of two subspecies is presented in Supplementary Figure 2.1
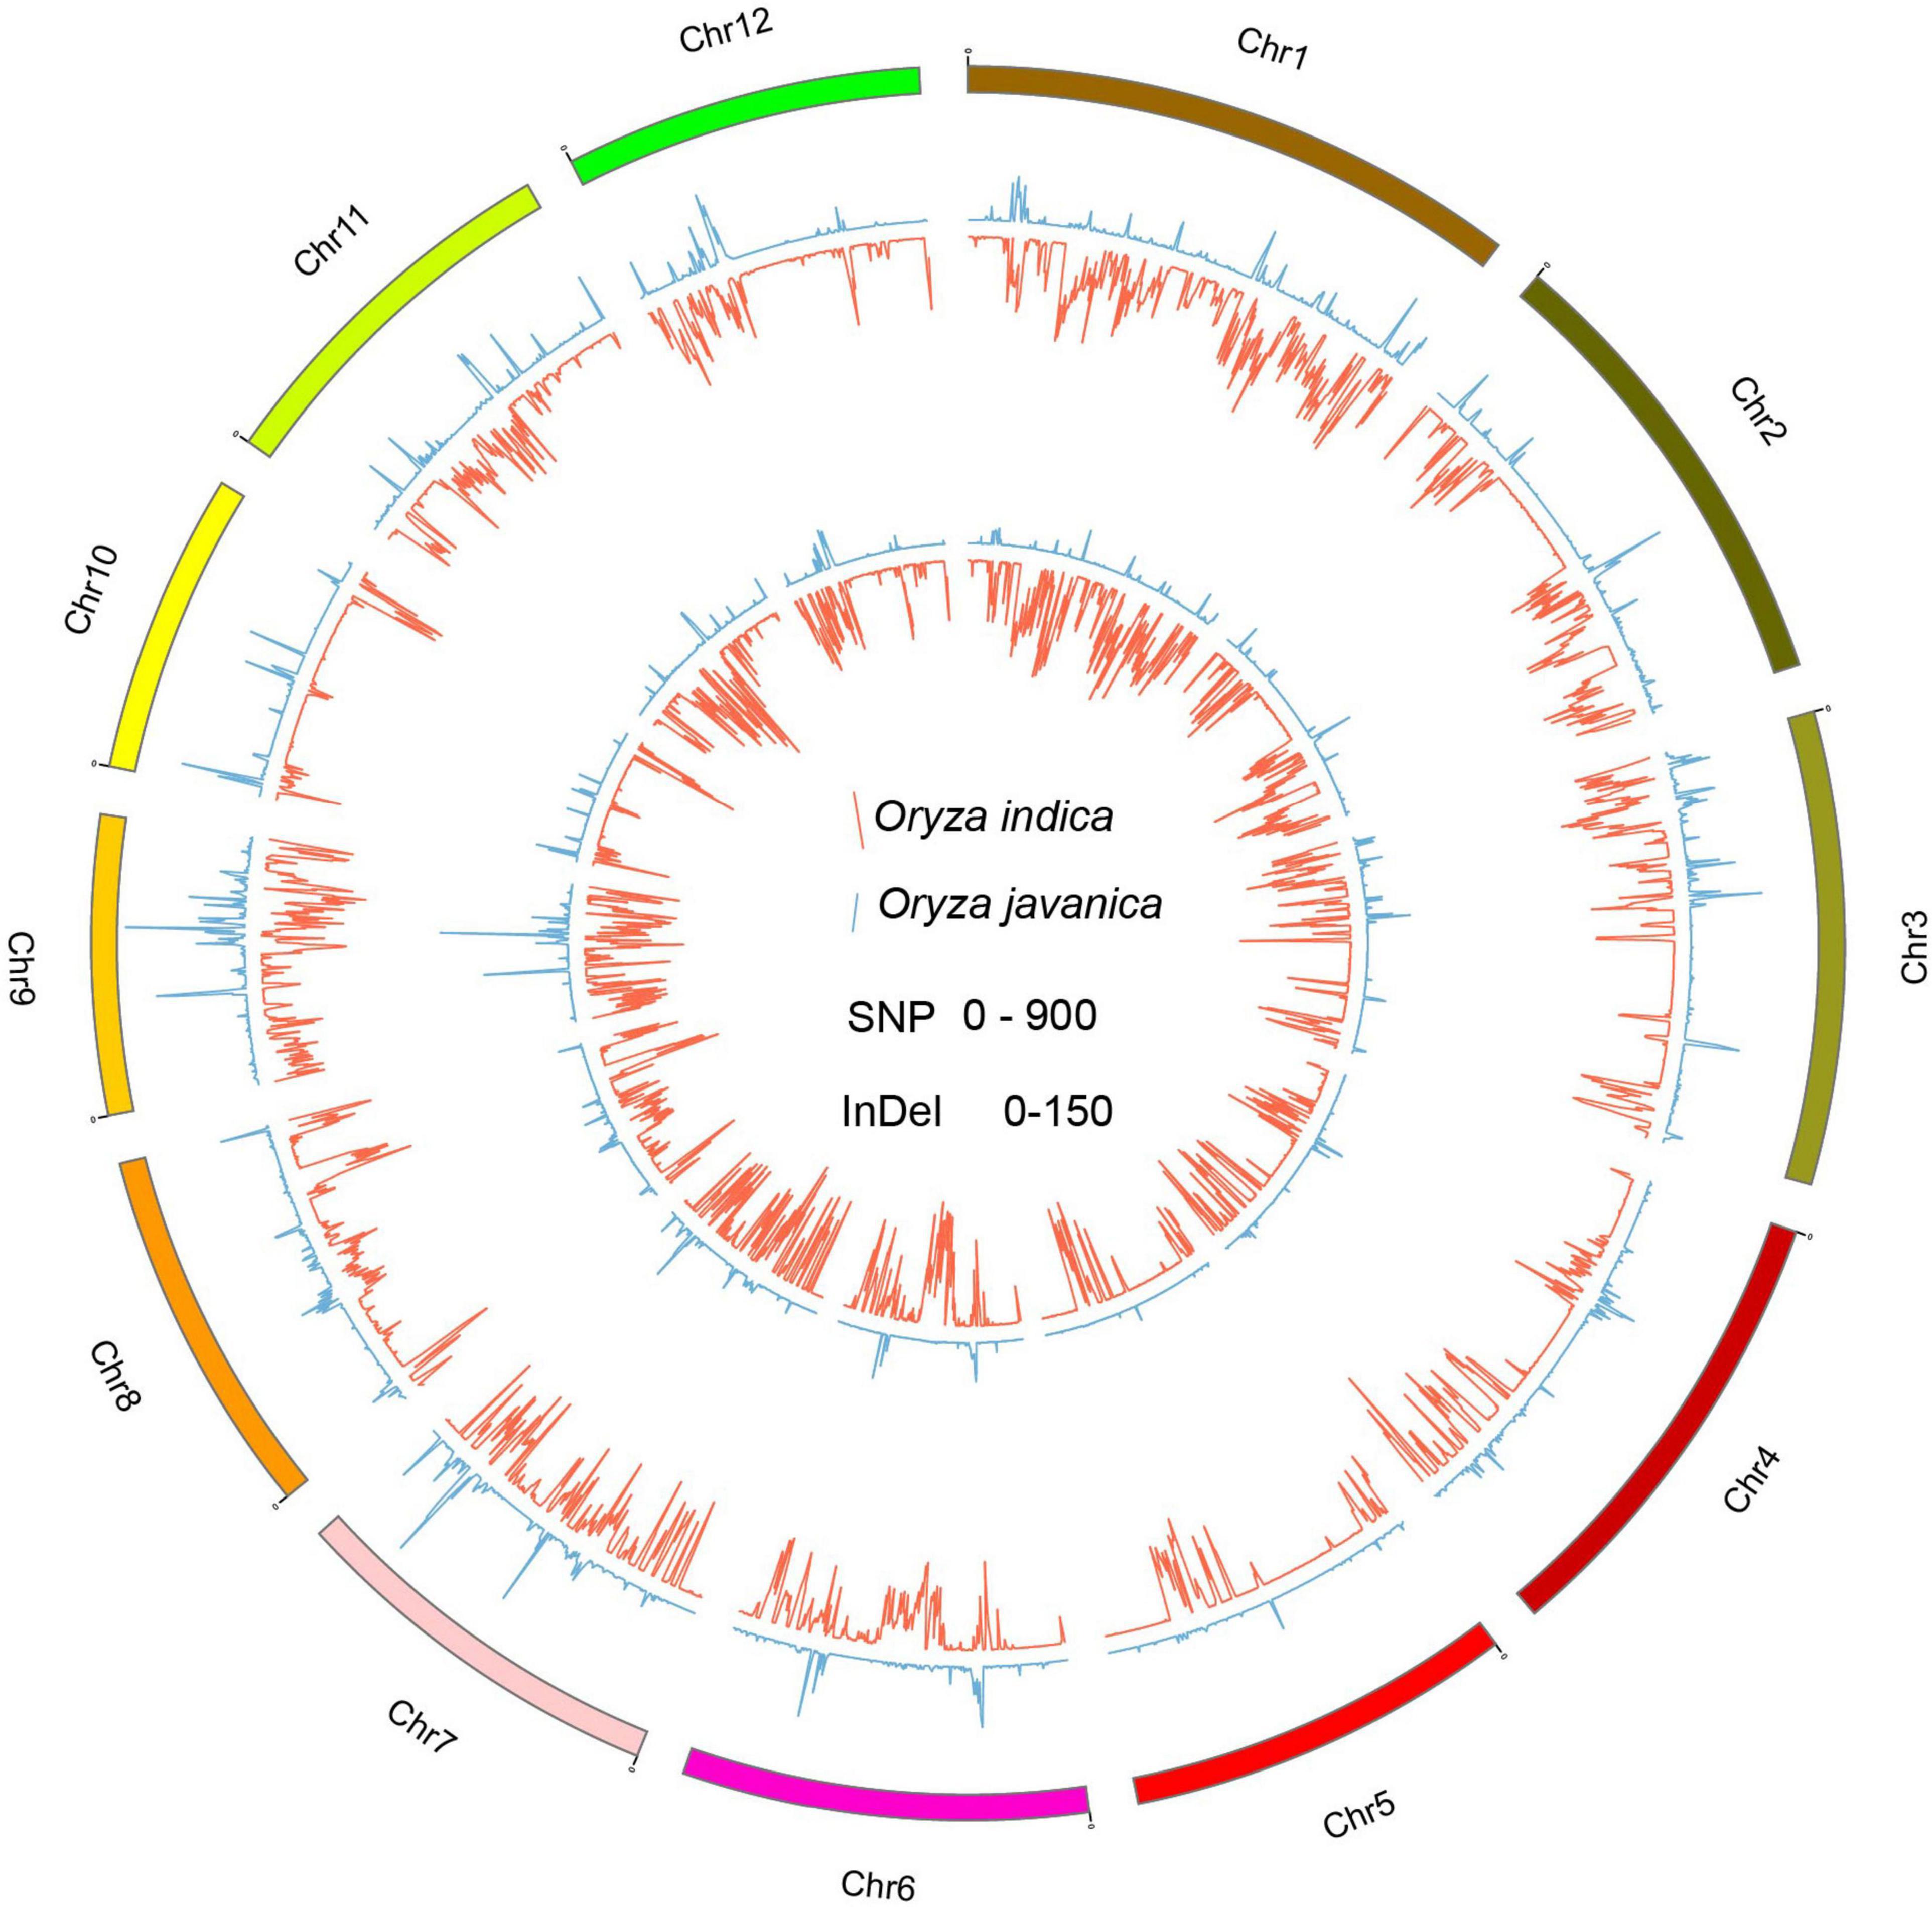
Figure 4. The genome-wide distribution of private variation between the two subspecies. The inside Circos indicates the private SNP variation pattern among the whole genome. The outside Circos shows the private InDel variation number distribution along the whole genome. Red indicates indica, and green means javanica.
In this study, we identified 104,518 SNPs that were specific to Oryza javanica and not present in any Oryza indica, which affects about 4,852 genes (Supplementary Table 4). To further investigate their putative functions affected in javanica varieties compared to the subspecies indica, GO and KEGG enrichment analyses were performed (Figure 5A and Supplementary Table 4). Genes involved in biological processes such as “DNA metabolic process,” “RNA-dependent DNA replication,” “DNA replication,” and “DNA integration” were significantly enriched. Analysis at the molecular function level illustrated that “DNA polymerase activity,” “RNA-directed DNA polymerase activity,” and “nucleotidyltransferase activity” were overrepresented. These specific SNPs might be, to some extent, responsible for the contrasting grain shapes between Oryza indica and Oryza javanica.
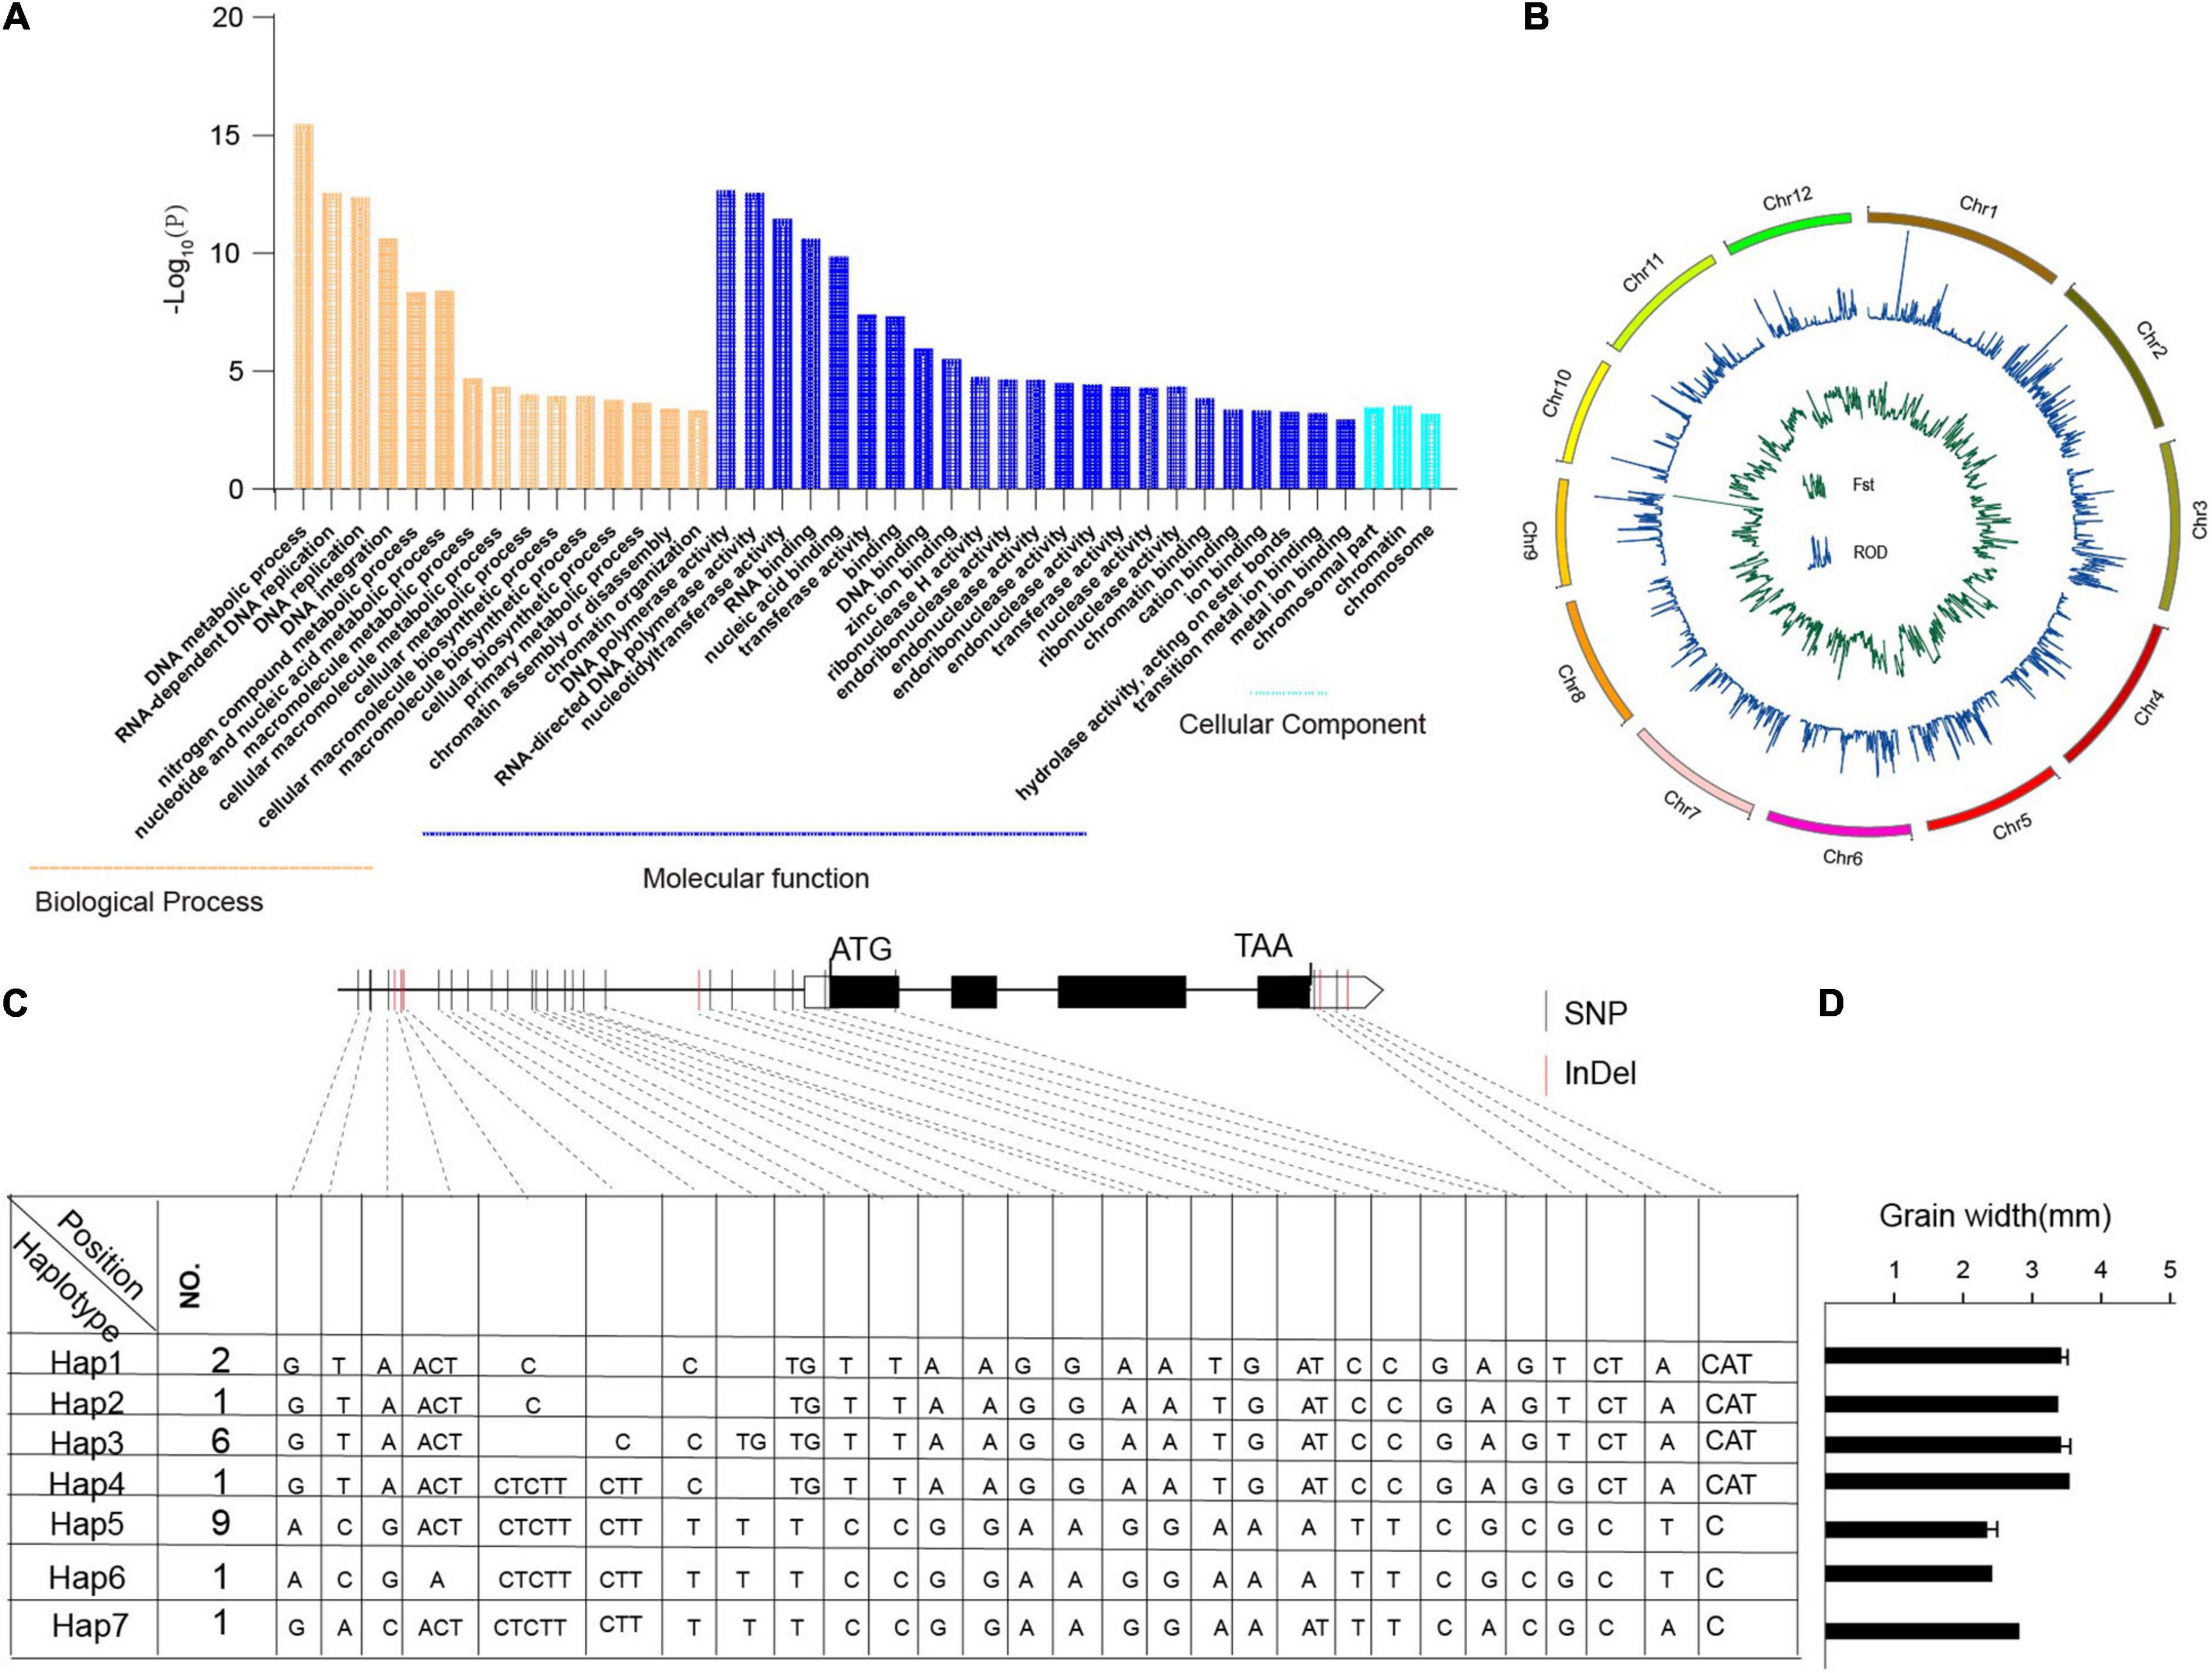
Figure 5. Gene Ontology (GO) analysis of javanica private genes and haplotype analysis of TGW2 in 20 rice accessions. (A) GO enrichment analysis of the javanica private variation-associated genes. (B). Selective sweep in the two subspecies. The green line indicates the reduction of diversity of two subspecies; the blue line shows fixation index of the two subspecies. (C). Sequence and allelic variation in TGW2 among 20 rice accessions. Sequence and allelic variations in TGW2 including promoters and coding sequence (CDS) from 10 Oryza javanica and 10 improved indica cultivars were analyzed. Hap1–Hap6 represents six different haplotypes of TGW2, and No. represents the number of rice accessions for each type. The position of start codon is considered as +1. In CDS region, the black box represents exons whereas the lines between boxes represent introns. Nucleotide polymorphisms are displayed at their corresponding positions. The black vertical line indicates SNPs while red vertical line stands for InDels. (D) The grain width of the sample which carried different haplotypes of TGW2. Hap7 was represented Nipponbare.
The assessment of genetic diversity within the total accessions revealed a higher level of genetic diversity within the admix group compared to the indica and javanica subspecies. When the indica and japonica accessions were analyzed separately, the javanica varieties showed a lower level of polymorphism than that of Oryza indica (Supplementary Figure 3). However, the genetic diversity of Oryza javanica was higher than Oryza indica in some regions, such as chromosomes 1, 4, and 10. Moreover, the highest value of pi (0.0077 at chromosome 2) in Oryza javanica is also larger than that of Oryza indica (0.0073 on chromosome 11), which indicated that there was a greater variation in genetic diversity at some regions in the javanica group.
To find the selection evidence of the grain size genes, we scanned each sweep region generated by the linkage disequilibrium of the selection target and its surrounding loci, which is expected to affect the genetic diversity. In order to identify the grain shapes related to selective sweep genes, genome-wide Fst and ROD were conducted in the two subpopulations (Figure 5B). Following the criteria of top 5% sites of Fst and top 2% or bottle 2% site of ROD in the whole genome might be the candidate regions involved in selection (Supplementary Tables 5, 6). The overlapped candidate region was treated as grain shape-related genes. Finally, three candidate grain shape-related genes were detected, which shows significant differences between haplotypes (Supplementary Table 7 and Figure 5C). Haplotype analyses of the TGW2 are presented in Figure 5D. Combining the phenotype of grain shape, the grain width score of Japonica is higher than that belong to Indica.
Oryza sativa independently domesticated rice that has been cultivated for more than 10,000 years, which is the predominant energy source for most people worldwide. The rice production should be doubled to meet the increased demand of population in 2050 according to FAO data (McClung, 2014). The successful application of heterosis in hybrid rice has dramatically improved rice productivity in the past years (Lin et al., 2020). However, indica rice is the predominant form of hybrid rice in China due to the high incompatibility of interspecies between indica and japonica (Huang et al., 2015). It is well known that heterosis of inter-subspecies is usually stronger than that of intra-subspecies, and the level of yield advantage ranked as indica/temperate japonica > indica/tropical japonica > temperate japonica/tropical japonica > indica/indica > japonica/japonica.
Genetic diversity is fundamentally important in the hybrid rice programs to breed heterotic rice hybrids because the accomplishment of heterosis is dependent on the genetic differences between parents (Zheng et al., 2020). Rice landraces are adapted to local environments and selected by the farmers for their better yield. Tropical japonica, also named javanica, were planted by indigenous in southeast and east Asia, Latin America, and Africa and represented by tall, large, and bold-grain bulu cultivars of Indonesia. However, these landraces are on the brink of extinction due to a lack of adequate attention. Characterization of these landraces for the desired trait can create new materials of big grain in rice.
Whole genome resequencing of the 10 Oryza javanica and 10 Oryza indica varieties and mapping with Nipponbare genome as a reference genome was conducted to discover genome-wide DNA variations. A total of 4,057,525 SNPs and 642,824 InDels were identified. When we analyzed the DNA polymorphism between indica and javanica, a total of 27,657 and 83,136 InDel are private to all javanica and indica, respectively, whereas a total of 539,268 and 853,249 SNPs are private to javanica and indica, respectively. A total number of 7,915 SNPs and 65,841 InDels shared by indica and javanica were detected.
Population structure of the 20 rice varieties results revealed that they distinctly belonging to two groups. The variation of Oryza javanica is shown a similar DNA sequence variation, which includes SNP, InDel, and SV. This study focused on genotyping by sequencing and genetic analysis of 10 rice landraces collected all over the world and 10 improved indica cultivar varieties that cultivated in China. GO was important bioinformatic tools which attempt to interpret the role of genes or proteins through the organization of controlled terms. Functional cataloging of the javanica private InDels-related genes using GO slim terms offered the facility to scrutiny the genome into categories describing cellular locations, biological process, and molecular functions. Among the private variation-associated genes, the most significantly detected GO term is rice DNA polymerase activity (GO:0034061), which plays important role in rice growth and development. DNA replication is a fundamental nuclear metabolic process.
Morphology and genetic background are quite different between modern improvement indica and landraces javanica through independent origins, long-term adaption to diverse environment, and selection for breeder’s preference. PCA results revealed that two subpopulations were obviously observed, which suggests the significant differentiation between the two subpopulations. Recently, Si et al. (2016) had identified a major quantitative trait locus, GLW7, encoding the plant-specific transcription factor OsSPL13, which is derived from Oryza javanica that can positively regulate cell size in the grain hull, which results in enhanced rice grain length and yield. Hence, the selective sweep gene related to grain shape between the two subpopulations drives our attention.
The overall present study deals with whole genome variations in javanica rice accessions by identifying total SNP and InDel polymorphisms, 10 javanica common SNP and InDel variation by comparing each javanica variety, and private SNP and InDel polymorphisms by comparing with indica rice accessions. The private InDel-associated genes participating in the cellular biosynthetic process and primary metabolic process were revealed by comparative analysis. The differentiation of indica and javanica rice associated with grain shape was identified in this study. This work had provided a groundbreaking work for utilizing the heterosis of inter-subspecies.
The datasets presented in this study can be found in online repositories. The names of the repository/repositories and accession number(s) can be found in the article/Supplementary Material.
WL, YL, and HX conceived the work and designed the experiments. LiL, LaL, and WX performed the phenotype collection. WL and HX analyzed the results. YC provided part of the fundings. All authors contributed to writing the manuscript and discussed the results.
This work was partly supported by the earmarked fund for China Agriculture Research System (CARS-01-09), Jiangxi Provincial Agricultural Science and Technology Innovation Project (JXXTCXBSJJ202114 and 2014CBS001), National Natural Science Foundation of China (31960400), and the Earmarked Fund for Jiangxi Agriculture Research System (JXARS-04).
The authors declare that the research was conducted in the absence of any commercial or financial relationships that could be construed as a potential conflict of interest.
All claims expressed in this article are solely those of the authors and do not necessarily represent those of their affiliated organizations, or those of the publisher, the editors and the reviewers. Any product that may be evaluated in this article, or claim that may be made by its manufacturer, is not guaranteed or endorsed by the publisher.
The Supplementary Material for this article can be found online at: https://www.frontiersin.org/articles/10.3389/fpls.2022.857435/full#supplementary-material
Chen, R., Deng, Y., Ding, Y., Guo, J., Qiu, J., Wang, B., et al. (2021). Rice functional genomics :decades’ efforts and roads ahead. Sci. China Life Sci. 65, 33–92. doi: 10.1007/s11427-02102024-0
Choi, J. Y., Lye, Z. N., Groen, S. C., Dai, X., Rughani, P., Zaaijer, S., et al. (2020). Nanopore sequencing-based genome assembly and evolutionary genomics of circum-basmati rice. Genome Biol. 21:21. doi: 10.1186/s13059-020-1938-2
Cingolani, P., Platts, A., Wang le, L., Coon, M., Nguyen, T., Wang, L., et al. (2012). A program for annotating and predicting the effects of single nucleotide polymorphisms, SnpEff: SNPs in the genome of Drosophila melanogaster strain w1118; iso-2; iso-3. Fly (Austin) 6, 80–92. doi: 10.4161/fly.19695
Danecek, P., and McCarthy, S. A. (2017). BCFtools/csq: haplotype-aware variant consequences. Bioinformatics 33, 2037–2039. doi: 10.1093/bioinformatics/btx100
Danecek, P., Auton, A., Abecasis, G., Albers, C. A., Banks, E., DePristo, M. A., et al. (2011). The variant call format and VCFtools. Bioinformatics 27, 2156–2158. doi: 10.1093/bioinformatics/btr330
Davey, J. W., Hohenlohe, P. A., Etter, P. D., Boone, J. Q., Catchen, J. M., and Blaxter, M. L. (2011). Genome-wide genetic marker discovery and genotyping using next-generation sequencing. Nat. Rev. Genet. 12, 499–510. doi: 10.1038/nrg3012
Dwivedi, S. L., Ceccarelli, S., Blair, M. W., Upadhyaya, H. D., Are, A. K., and Ortiz, R. (2016). Landrace germplasm for improving yield and abiotic stress adaptation. Trends Plant Sci. 21, 31–42. doi: 10.1016/j.tplants.2015.10.012
Eizenga, G. C., Jia, M. H., Jackson, A. K., Boykin, D. L., Ali, M. L., Shakiba, E., et al. (2019). Validation of yield component traits identified by genome-wide association mapping in a tropical japonica x tropical japonica rice biparental mapping population. Plant Genome 12, doi: 10.3835/plantgenome2018.04.0021
Fan, C., Xing, Y., Mao, H., Lu, T., Han, B., Xu, C., et al. (2006). GS3, a major QTL for grain length and weight and minor QTL for grain width and thickness in rice, encodes a putative transmembrane protein. Theor. Appl. Genet. 112, 1164–1171. doi: 10.1007/s00122-006-0218-1
Fan, X., Abbott, T. E., Larson, D., and Chen, K. (2014). BreakDancer: identification of genomic structural variation from paired-end read mapping. Curr. Protoc. Bioinformatics 45, 15.6.1–15.6.11. doi: 10.1002/0471250953.bi1506s45
Garris, A. J., Tai, T. H., Coburn, J., Kresovich, S., and McCouch, S. (2005). Genetic sructure and diversity in Oryza sativa L. Genetics 169, 1631–1638.
Hechanova, S. L., Bhattarai, K., Simon, E. V., Clave, G., Karunarathne, P., Ahn, E. K., et al. (2021). Development of a genome-wide InDel marker set for allele discrimination between rice (Oryza sativa) and the other seven AA-genome Oryza species. Sci. Rep. 11:8962. doi: 10.1038/s41598-021-88533-9
Hour, A. L., Hsieh, W. H., Chang, S. H., Wu, Y. P., Chin, H. S., and Lin, Y. R. (2020). Genetic diversity of landraces and improved varieties of rice (Oryza sativa L.) in taiwan. Rice (N.Y.) 13:82. doi: 10.1186/s12284-020-00445-w
Hu, W., Zhou, T., Wang, P., Wang, B., Song, J., Han, Z., et al. (2020). Development of whole-genome agarose-resolvable lindel markers in rice. Rice (N.Y.) 13:1. doi: 10.1186/s12284-019-0361-3
Huang, X., Kurata, N., Wei, X., Wang, Z. X., Wang, A., Zhao, Q., et al. (2012). A map of rice genome variation reveals the origin of cultivated rice. Nature 490, 497–501. doi: 10.1038/nature11532
Huang, X., Yang, S., Gong, J., Zhao, Y., Feng, Q., Gong, H., et al. (2015). Genomic analysis of hybrid rice varieties reveals numerous superior alleles that contribute to heterosis. Nat. Commun. 6:6258. doi: 10.1038/ncomms7258
Krzywinski, M., Schein, J., Birol, I., Connors, J., Gascoyne, R., Horsman, D., et al. (2009). Circos: an information aesthetic for comparative genomics. Genome Res. 19, 1639–1645. doi: 10.1101/gr.092759.109
Lee, T. H., Guo, H., Wang, X., Kim, C., and Paterson, A. H. (2014). SNPhylo: a pipeline to construct a phylogenetic tree from huge SNP data. BMC Genomics 15:162. doi: 10.1186/1471-2164-15-162
Li, H., and Durbin, R. (2009). Fast and accurate short read alignment with Burrows-Wheeler transform. Bioinformatics 25, 1754–1760. doi: 10.1093/bioinformatics/btp324
Li, H., Handsaker, B., Wysoker, A., Fennell, T., Ruan, J., Homer, N., et al. (2009). The sequence alignment/map format and SAMtools. Bioinformatics 25, 2078–2079. doi: 10.1093/bioinformatics/btp352
Li, Y., Fan, C., Xing, Y., Jiang, Y., Luo, L., Sun, L., et al. (2011). Natural variation in GS5 plays an important role in regulating grain size and yield in rice. Nat. Genet. 43, 1266–1269. doi: 10.1038/ng.977
Lin, Z., Qin, P., Zhang, X., Fu, C., Deng, H., Fu, X., et al. (2020). Divergent selection and genetic introgression shape the genome landscape of heterosis in hybrid rice. Proc. Natl. Acad. Sci. U.S.A. 117, 4623–4631. doi: 10.1073/pnas.1919086117
Liu, J., Chen, J., Zheng, X., Wu, F., Lin, Q., Heng, Y., et al. (2017). GW5 acts in the brassinosteroid signalling pathway to regulate grain width and weight in rice. Nat. Plants 3:17043. doi: 10.1038/nplants.2017.43
Long, W., Dan, D., Yuan, Z., Chen, Y., Jin, J., Yang, W., et al. (2020a). Deciphering the genetic basis of lodging resistance in wild rice Oryza longistaminata. Front. Plant Sci. 11:628. doi: 10.3389/fpls.2020.00628
Long, W., Yuan, Z., Fan, F., Dan, D., Pan, G., Sun, H., et al. (2020b). Genome-wide association analysis of resistance to rice false smut. Mol. Breed. 40, doi: 10.1007/s11032-020-01130-y
Lv, Q., Li, W., Sun, Z., Ouyang, N., Jing, X., He, Q., et al. (2020). Resequencing of 1,143 indica rice accessions reveals important genetic variations and different heterosis patterns. Nat. Commun. 11:4778. doi: 10.1038/s41467-020-18608-0
McClung, C. R. (2014). Plant science. Making hunger yield. Science 344, 699–700. doi: 10.1126/science.1254135
McKenna, A., Hanna, M., Banks, E., Sivachenko, A., Cibulskis, K., Kernytsky, A., et al. (2010). The genome analysis toolkit: a mapreduce framework for analyzing next-generation DNA sequencing data. Genome Res. 20, 1297–1303. doi: 10.1101/gr.107524.110
McNally, K. L., Childs, K. L., Bohnert, R., Davidson, R. M., Zhao, K., Ulat, V. J., et al. (2009). Genomewide SNP variation reveals relationships among landraces and modern varieties of rice. Proc. Natl. Acad. Sci. U.S.A. 30, 12273–12278. doi: 10.1073/pnas.0900992106
Miao, L., Yang, S., Zhang, K., He, J., Wu, C., Ren, Y., et al. (2020). Natural variation and selection in GmSWEET39 affect soybean seed oil content. New Phytol. 225, 1651–1666. doi: 10.1111/nph.16250
Peng, S., Khush, G. S., Virk, P., Tang, Q., and Zou, Y. (2008). Progress in ideotype breeding to increase rice yield potential. Field Crops Res. 108, 32–38. doi: 10.1016/j.fcr.2008.04.001
Pusadee, T., Jamjod, S., Chiang, Y. C., Rerkasem, B., and Schaal, B. A. (2009). Genetic structure and isolation by distance in a landrace of Thai rice. Proc. Natl. Acad. Sci. U.S.A. 106, 13880–13885. doi: 10.1073/pnas.0906720106
Ram, S. G., Thiruvengadam, V., and Vinod, K. K. (2007). Genetic diversity among cultivars, landraces and wild relatives of rice as revealed by microsatellite markers. J. Appl. Genet. 48, 337–345. doi: 10.1007/BF03195230
Sang, T., and Ge, S. (2013). Understanding rice domestication and implications for cultivar improvement. Curr. Opin. Plant. Biol. 16, 139–146. doi: 10.1016/j.pbi.2013.03.003
Si, L., Chen, J., Huang, X., Gong, H., Luo, J., Hou, Q., et al. (2016). OsSPL13 controls grain size in cultivated rice. Nat. Genet. 48, 447–456. doi: 10.1038/ng.3518
Wang, S., Wu, K., Yuan, Q., Liu, X., Liu, Z., Lin, X., et al. (2012). Control of grain size, shape and quality by OsSPL16 in rice. Nat. Genet. 44, 950–954. doi: 10.1038/ng.2327
Wang, W., Mauleon, R., Hu, Z., Chebotarov, D., Tai, S., Wu, Z., et al. (2018). Genomic variation in 3,010 diverse accessions of Asian cultivated rice. Nature 557, 43–49. doi: 10.1038/s41586-018-0063-9
Weng, J., Gu, S., Wan, X., Gao, H., Guo, T., Su, N., et al. (2008). Isolation and initial characterization of GW5, a major QTL associated with rice grain width and weight. Cell Res. 18, 1199–1209. doi: 10.1038/cr.2008.307
Yang, J., Lee, S. H., Goddard, M. E., and Visscher, P. M. (2011). GCTA: a tool for genome-wide complex trait analysis. Am. J. Hum. Genet. 88, 76–82. doi: 10.1016/j.ajhg.2010.11.011
Zhang, C., Dong, S. S., Xu, J. Y., He, W. M., and Yang, T. L. (2019). PopLDdecay: a fast and effective tool for linkage disequilibrium decay analysis based on variant call format files. Bioinformatics 35, 1786–1788. doi: 10.1093/bioinformatics/bty875
Zhao, D. S., Li, Q. F., Zhang, C. Q., Zhang, C., Yang, Q. Q., Pan, L. X., et al. (2018). GS9 acts as a transcriptional activator to regulate rice grain shape and appearance quality. Nat. Commun. 9:1240. doi: 10.1038/s41467-018-03616-y
Keywords: Oryza sativa javanica, SNPs/InDels, variant calling, specific variation, grain shapes
Citation: Long W, Luo L, Luo L, Xu W, Li Y, Cai Y and Xie H (2022) Whole Genome Resequencing of 20 Accessions of Rice Landraces Reveals Javanica Genomic Structure Variation and Allelic Genotypes of a Grain Weight Gene TGW2. Front. Plant Sci. 13:857435. doi: 10.3389/fpls.2022.857435
Received: 18 January 2022; Accepted: 01 March 2022;
Published: 25 April 2022.
Edited by:
Yongzhong Xing, Huazhong Agricultural University, ChinaReviewed by:
Longbiao Guo, China National Rice Research Institute (CAAS), ChinaCopyright © 2022 Long, Luo, Luo, Xu, Li, Cai and Xie. This is an open-access article distributed under the terms of the Creative Commons Attribution License (CC BY). The use, distribution or reproduction in other forums is permitted, provided the original author(s) and the copyright owner(s) are credited and that the original publication in this journal is cited, in accordance with accepted academic practice. No use, distribution or reproduction is permitted which does not comply with these terms.
*Correspondence: Hongwei Xie, eGh3MjA2QDE2My5jb20=
Disclaimer: All claims expressed in this article are solely those of the authors and do not necessarily represent those of their affiliated organizations, or those of the publisher, the editors and the reviewers. Any product that may be evaluated in this article or claim that may be made by its manufacturer is not guaranteed or endorsed by the publisher.
Research integrity at Frontiers
Learn more about the work of our research integrity team to safeguard the quality of each article we publish.