
94% of researchers rate our articles as excellent or good
Learn more about the work of our research integrity team to safeguard the quality of each article we publish.
Find out more
ORIGINAL RESEARCH article
Front. Plant Sci., 08 February 2022
Sec. Plant Nutrition
Volume 13 - 2022 | https://doi.org/10.3389/fpls.2022.835835
This article is part of the Research TopicInsights in Plant Nutrition: 2021View all 13 articles
 Takayuki Fujita1‡
 Marcel Pascal Beier1,2‡Mayumi Tabuchi-Kobayashi1Yoshitaka Hayatsu1Haruka Nakamura1Toshiko Umetsu-Ohashi1
 Kazuhiro Sasaki3†
 Keiki Ishiyama1Emiko Murozuka1Mikiko Kojima4
 Hitoshi Sakakibara4,5Yuki Sawa1
 Akio Miyao6Toshihiko Hayakawa1Tomoyuki Yamaya1,7
 Soichi Kojima1*
Ammonium is combined with glutamate to form glutamine. This reaction is catalyzed by glutamine synthetase (GS or GLN). Plants harbor several isoforms of cytosolic GS (GS1). Rice GS1;3 is highly expressed in seeds during grain filling and germination, suggesting a unique role in these processes. This study aimed to investigate the role of GS1;3 for rice growth and yield. Tos17 insertion lines for GS1;3 were isolated, and the nitrogen (N), amino acid, and ammonium contents of GS1;3 mutant grains were compared to wild-type grains. The spatiotemporal expression of GS1;3 and the growth and yield of rice plants were evaluated in hydroponic culture and the paddy field. Additionally, the stable isotope of N was used to trace the foliar N flux during grain filling. Results showed that the loss of GS1;3 retarded seed germination. Seeds of GS1;3 mutants accumulated glutamate but did not show a marked change in the level of phytohormones. The expression of GS1;3 was detected at the beginning of germination, with limited promoter activity in seeds. GS1;3 mutants showed a considerably decreased ripening ratio and decreased N efflux in the 12th leaf blade under N deficient conditions. The β-glucuronidase gene expression under control of the GS1;3 promoter was detected in the vascular tissue and aleurone cell layer of developing grains. These data suggest unique physiological roles of GS1;3 in the early stage of seed germination and grain filling under N deficient conditions in rice.
Nitrogen (N) is one of the most important macronutrients required for plant growth (Marschner, 1995). Plants absorb inorganic N from the soil in the forms of free N ions, nitrate, and ammonium (Marschner, 1995). Glutamine synthetase (GS or GLN) combines ammonium with glutamate in an ATP-dependent manner to form glutamine (Lea and Azevedo, 2007; Thomsen et al., 2014). Two types of GS enzymes are present in plants: cytosolic GS (GS1) and chloroplastic GS (GS2). Quantitative trait locus (QTL) analyses suggested the importance of GS1 for N use efficiency in crop plants (Obara et al., 2001; Gallais and Hirel, 2004; Habash et al., 2007; Gadaleta et al., 2014; Thomsen et al., 2014). Plants harbor several GS1 genes (Orsel et al., 2014), for example, the rice (Oryza sativa) genome encodes three GS1 enzymes (Tabuchi et al., 2005). Variable spatiotemporal distribution of GS1 expression and different enzymatic characteristics of GS1 isozymes suggests that each GS1 isozyme has a specific physiological function (Thomsen et al., 2014).
Some of the GS1 isoforms exhibit seed-specific expression. The contribution of these seed-specific GS1 isoforms toward the growth and productivity of crop plants remains unclear, although several lines of evidence indicate the importance of GS1 in cereal grains. For example, in rice, GS1;1 is expressed in the vascular tissue of ripening grains (Yabuki et al., 2017) and GS1;3 is highly expressed in both maturing and germinating grains (Tabuchi et al., 2005, 2007). In barley (Hordeum vulgare), all GS1 isoforms are detected in barley grains during the early milk stage (Goodall et al., 2013).
In Arabidopsis thaliana, the involvement of GS1 isozymes, Gln1;1 and Gln1;2, in the germination and production of seeds has been demonstrated using reverse genetics (Guan et al., 2015) though both Gln1 isoforms are not seed-specific (Lothier et al., 2011; Guan et al., 2015, 2016; Guan and Schjoerring, 2016; Konishi et al., 2017, 2018). Microarray analysis has shown that Arabidopsis GLN1;5 is highly expressed in ripening seeds (Schmid et al., 2005; Le et al., 2010). The expression of GLN1;5 is also observed in germinating seeds (Bassel et al., 2008). These data reveal a unique expression profile of GLN1;5 during the life cycle of Arabidopsis plants.
However, reverse genetics studies directly linking the seed-specific expression of GS1 genes with crop productivity are limited because of the unavailability of knockout mutants. Rice GS1;1 is ubiquitously expressed in whole plants and is essential for normal growth, as the loss of GS1;1 leads to severe growth retardation (Tabuchi et al., 2005; Kusano et al., 2011). In maize (Zea mays), Gln1-3 and Gln1-4 are expressed in leaves and are involved in grain production, which suggests their importance during N translocation to source organs (Martin et al., 2006). Rice GS1;2 is expressed mainly in roots and is thought to be responsible for primary ammonium assimilation in roots, as GS1;2 knockout mutants accumulate free ammonium in xylem sap under high ammonium supply (Funayama et al., 2013).
In this study, we investigated the role of GS1;3, a seed-specific isoform, during seed germination and grain filling in rice. Real-time PCR and promoter analyses revealed the temporal and spatial distribution of GS1;3 expression in rice. We also isolated and characterized GS1;3 knockout rice mutants. We measured the concentrations of amino acids and plant hormones in germinating seeds, tissue dry weight, and N flux in leaves using a stable isotope tracer during reproductive growth of GS1;3 knockout mutants. Our results suggest that rice GS1;3 functions in ammonium assimilation in the aleurone layer and the endosperm during storage protein biosynthesis and degradation, as well as it is likely involved in the energy provision for these processes. GS1;3 is therefore important for seed germination and spikelet filling, with a more pronounced function during nitrogen limitation.
All seeds used in this study derived from rice plants cv. Nipponbare, harvested on the 19th October 2010 in the Kashimadai Field of the Tohoku University in Japan. Before experimental use, seed dormancy was broken by incubation at 30°C for 7 days. Seeds were selected by water density (1.13 g ml−1), incubated at 60°C for 10 min, and sterilized by 70% ethanol for 30 s followed by 2% of sodium hypochlorite for 20 min and subsequent washing. The following steps were described in the respective protocols.
Filled spikelet, selected by saltwater with a density of 1.06 g ml−1, is the term used for seeds in the yield component analysis, while mature seeds, selected by saltwater with a density of 1.13 g ml−1 were used for physiological analysis.
Developing seeds are harvested before they reach full maturity. During the rice ripening stage, 5 sub-stages can be defined as heading, milky, dough, yellow ripe, and maturity stage. The specific sub-stages were therefore either dough or yellow ripe (before the seeds turn brown on the surface).
A seed was regarded as germinating when the radicle emerged from the husk.
The general life cycle of rice plants after seedling establishment can be divided into vegetative (until tiller reaches maximal height), the reproductive stage (until heading), and finally the ripening stage (until harvest).
The yield component analysis was done to determine which of the main determinants of yield, the panicle number, the weight of brown rice (dehusked filled spikelets), the spikelet number, and the ratio of filled spikelets compared to unfilled spikelets at harvest (not sinking in saltwater with a density of 1.06 g ml−1) is influenced in the mutants compared to the WT.
All definitions are based on Yoshida (1981).
Mature seeds of WT Nipponbare and GS1;3 mutants were germinated on a moistened filter paper in Petri dishes at 30°C for 2 days. The seeds were placed on nets floating on 8 l of water with a pH adjusted to 5.8 by HCl. Twenty three days after sowing (DAS), single seedlings were rolled in moltopren and fixed to holes in a sieve placed on a Wagner pot (1:5000). Each Wagner pot contained 4 seedlings.
The nutrient solution used from this point on was based on a previous description (Mae and Ohira, 1981), with slight modifications: 0.5 mM NH4Cl, 0.6 mM NaH2PO4, 0.3 mM K2SO4, 0.3 mM CaCl2, 0.6 mM MgCl2, 45 μM Fe-EDTA, 50 μM H3BO3, 9 μM MnSO4, 0.3 μM CuSO4, 0.7 μM ZnSO4, and 0.1 μM Na2MoO4. The nutrient solution was buffered at pH 5.5.
The strength of the nutrient solution was changed over time, and the solution was renewed every 4–6 days. One-quarter strength solution was used for 13 days (until 35 DAS), followed by half-strength solution for 11 days (until 46 DAS) and full-strength solution for 61 days (until 107 DAS). With the start of heading 107 DAS, the media was changed to one-quarter strength solution for 20 days (until 127 DAS) and to one-eighth strength solution for 5 days (until 132 DAS), followed by water until harvest.
Plants of WT Nipponbare and Tos17 insertion mutant lines of GS1;3 (gs1;3-1 and gs1;3-2) were grown in a paddy field in Kashimadai, Miyagi, Japan for measuring agronomical traits. Seeds were sown in cell trays, with one seed per cell, and grown in the greenhouse under natural light for 29 days. Seedlings were then transplanted in the paddy field. The paddy field was fertilized with 30 kg ha−1 of basal fertilizer containing 16% each of N (4.8 kg ha−1of N), P, and K (Coop Chemical Co., Tokyo, Japan) and additionally with 27 kg ha−1of N (5.7 kg ha−1of N) fertilizer in the form of ammonium sulfate (Ube Material Industries, Ube, Japan), before transplanting, resulting in a total N supply of 10.5 kg ha−1. At 153 days after germination, five plants were harvested at the soil surface and used for measuring the panicle number, shoot dry weight, and panicle dry weight. Grain and straw were dried in a greenhouse and then in a dry chamber.
Brown rice yield was determined by multiplication of (1) panicle number per individual plant, (2) spikelet number per panicle, (3) filled spikelet ratio, and (4) weight of brown rice. Panicle number was counted from five plants after harvest. The number of spikelets was determined by counting all spikelets after the separation from the panicle. Filled spikelets were determined as spikelets that sank in saltwater (density at 1.06 g ml−1) and unfilled spikelets as floated. The ratio of filled and unfilled spikelets was defined as filled spikelets (%). Filled spikelets were washed in tap water and dried. The weight of brown rice was determined after the harvest of brown rice by husking of filled spikelets.
All primers used in this article are listed in Supplementary Table S1.
Tos17 insertion lines of GS1;3 (Os03g0712800) were identified through the mutant panel database.1 For the selection of not-listed Tos17 insertion lines, a nested PCR-based screening (Funayama et al., 2013) was carried out with pooled DNA samples provided by the National Institute of Agrobiological Sciences, NIAS, Tsukuba, Japan (Miyao et al., 2003). Tos17 and GS1;3 specific primers were used for the initial as well as the subsequent (nested) PCR. For the reactions, which were all conducted using the Gene Amp PCR System 9,700 (Thermo Fisher Scientific KK, Yokohama, Japan), the LA Taq DNA polymerase (Takara Bio Inc., Shiga, Japan) was used. Nested PCR products were purified and sequenced.
Seeds containing an identified Tos17 insertion in GS1;3 were obtained from NIAS.
Genotyping of the two candidate lines ND0163, and NE4721 with genomic DNA as template was conducted as previously described (Tabuchi et al., 2005). Homozygous lines of ND0163 were named gs1;3-1, and NE4721 were named gs1;3-2.
Total RNA from mature seeds and seedlings was extracted with benzyl chloride (Suzuki et al., 2004) or the RNeasy Plant Mini Kit (Qiagen, Hilden, Germany), respectively. The RNA quality was determined using the Agilent 2,100 Bioanalyzer (Agilent Technologies Japan Ltd., Tokyo, Japan). Reverse transcription was carried out using either the SuperScript First-Strand Synthesis System for RT-PCR (Invitrogen, Tokyo, Japan), with 1 μg of total RNA, or the PrimeScript RT reagent Kit with gDNA Eraser (Takara Bio Inc., Otsu, Shiga, Japan), with 0.5 μg of total RNA, according to the manufacturer’s instructions. The resulting cDNA was used to analyze the expression of OsGS1;1 (Ishiyama et al., 2004), OsGS1;2, OsGS1;3 (Tabuchi et al., 2005), and actin (Sonoda et al., 2003) with qPCR.
The qPCR was conducted in Light Cycler Capillaries (Roche Diagnostics K.K., Tokyo, Japan) using an initial denaturation for 10 min at 95°C, followed by 40 cycles of 95°C for 10 s, 60°C for 10 s, and 72°C for 7 s. Each 20 μl reaction contained 1 μl cDNA, 1x LC FastStart DNA Master SYBR Green I (Roche), and 0.5 μM primers. A standard curve was generated from a serial dilution of cDNA. The expression of GS1 genes was normalized relative to actin. Results were shown as a mean value of three independent samples harvested from three individual plants.
Total RNA from mature not imbibed seeds was extracted with Sepasol RNA I Super G (Nacalai Tesque, Kyoto, Japan) according to the manufacturer’s instructions. The reverse transcription was carried out with the Prime Script RT reagent Kit with gDNA Eraser, as described for the qPCR. Gene-specific primers for OsGS1;1 (Ishiyama et al., 2004), OsGS1;2, OsGS1;3 (Tabuchi et al., 2005), and actin (Sonoda et al., 2003) were used for the semi-quantitative RT-PCR. The reactions were conducted in a Takara PCR thermal cycler with either 30 or 35 cycles of 98°C for 10 s, 60°C for 30 s, and 72°C for 30 s, and a final elongation for 1 min. Each reaction contained 0.5 U Takara Ex Taq, 1x Ex Taq Buffer, 4 nmol dNTPs, 5 ng cDNA, and 2 pmol primers. The semi-quantitative RT-PCR products were separated on a 1.5% agarose gel and stained with ethidium bromide.
As a promoter, 1983 bp of the GS1;3 upstream region were amplified from the genomic DNA of Oryza sativa L. ssp. Japonica cv. Nipponbare and flanked with attB sites in a subsequent PCR (Hartley et al., 2000). The promoter sequence was cloned into pDONR221 via BP clonase (Thermo Fisher Scientific KK, Yokohama, Japan). Following sequence confirmation and linearization with PvuII and XhoI, the promoter was transferred from pDONR221 to pGWB3 (Nakagawa et al., 2007) via LR clonase (Thermo Fisher Scientific KK), resulting in the final construct proGS1;3::GUS. The recombinant vector was used for Agrobacterium-mediated transformation of rice as described previously (Hiei et al., 1994), with slight modifications (Kojima et al., 2000). Genomic DNA isolated from transgenic lines was subjected to PCR analysis to confirm the transformation.
Sterilized seeds were incubated in water at 4°C for 5 days in the dark for seed synchronization and then transferred to 30°C in the dark and incubated for either 0 h or 72 h. Seedlings were transferred to a 20 l container containing 14 kg of silt loam soil and 24 g of slow fertilizer containing 16% each of N, P, and K (Coop Chemical Co., Tokyo, Japan). Plants were cultured in a greenhouse with 26°C during a 14 h light period with supplementary artificial light, and 23°C during a 10 h dark period. Developing seeds were harvested at 35 days after flowering. For the GUS staining procedure seeds at both germination stage and ripening stage were cut in half and incubated in the GUS staining solution (100 mM sodium phosphate [pH 7.0], 10 mM EDTA, 0.5 mM K3Fe(CN)4, 0.5 mM K4Fe(CN)6-3H2O, 0.1% Triton X, 1 g L−1 X-Gluc, and 20% methanol; Kojima et al., 2000). Images were taken with a stereomicroscope (MZ12.5, Leica Microsystems K. K., Tokyo, Japan).
The mature seed germination ratio for WT Nipponbare, GS1;3 and GS1;2 insertion lines (Funayama et al., 2013) was analyzed as previously described (Sasaki et al., 2015). Fully ripened seeds were germinated in 9 cm diameter Petri dishes containing 4.5 ml water. Petri dishes were kept in a dark incubator box at 30°C for 72 h. Four independent repetitions, each containing 50 seeds per line, were tested. The ratio of germinated seeds was determined 14 times during 72 h for each independent set-up.
Mature seeds of WT Nipponbare were imbibed in water for 0, 12, 24, 48, or 72 h. Another set of WT, gs1;3-1, and gs1;3-2 seeds were imbibed in water for 0, 30, or 66 h. After imbibition, seeds were frozen in liquid N and powdered with an MB601U Multi-Bead Shocker (Yasui Co. Ltd., Tokyo, Japan). A 10-fold volume of 10 mM HCl was added, and the samples were homogenized with the Multi-Bead Shocker. The samples were cleared from debris by a 21,900 · g centrifugation for 10 min, and the supernatant was filtered with an Amicon Ultra-0.5 Centrifugal Filter (Millipore, Tokyo, Japan). Samples were derivatized with the AccQ-Fluor Reagent Kit (Nihon Waters K. K., Tokyo, Japan), and amino acid concentrations were determined as previously described (Tabuchi et al., 2005). Three to five independent samples were used for each data point, the samples were harvested from individual plants.
Mature seeds of WT Nipponbare, gs1;3-1, and gs1;3-2 were imbibed in water for 24 h. After imbibition, seeds were frozen in liquid N and powdered with MB601U Multi-Bead Shocker (Yasui Co. Ltd., Tokyo, Japan). Concentrations of plant hormones were determined as previously described (Kojima et al., 2009). The plant hormone cytokinin was quantified via ultra-performance liquid chromatography (UPLC)-electrospray interface (ESI) tandem quadrupole mass spectrometry (qMS/MS; AQUITY UPLC™ System/Xevo-TQS; Waters) as described previously (Kojima et al., 2009). Auxins, gibberellins, abscisic acid, salicylic acid, and jasmonic acid were quantified with ultra-high-performance liquid chromatography (UHPLC)-ESI quadrupole-orbitrap mass spectrometer (UHPLC/Q-Exactive™; Thermo Scientific) as described previously (Kojima and Sakakibara, 2012; Shinozaki et al., 2015). Three to four independent samples were used for each data point.
When the 12th leaf was expanding, plants were supplied with 15N-labeled 0.5 mM NH4Cl (4.06 atom %) for 5 days. Leaves from the 8th leaf to the flag leaf, main stem panicles, and leaf blades, leaf sheaths, and panicles of tillers were harvested. Dry weights of the 8th, 9th, 10th, 11th, 12th, 13th, and 14th leaf blades and main stem panicles were measured. Four plants were used for the measurements per genotype. Yield components were determined as previously described (Tamura et al., 2010). The 12th leaf blades were powdered with Multi-Beads Shocker, and the 15N/14N ratio and N content were determined with an elemental analyzer (Flash 2000, Thermo Fisher Scientific, Tokyo, Japan) equipped with isotope ratio MS (Delta V Advantage, Thermo Fisher Scientific). Efflux and influx were calculated as previously described (Makino et al., 1984).
Data were analyzed using Microsoft Excel add in software (Social Survey Research Information Co., Ltd., Tokyo, Japan). Correlation and partial correlation coefficients were determined between the root system architecture and biomass of plants. Correlations with a Value of p < 0.05 were considered statistically significant.
To investigate the temporal expression of GS1 isoforms during rice seed germination, a quantitative PCR (qPCR) analysis was conducted on wild-type (WT) Nipponbare seeds in a 72 h time course after imbibition (Figure 1A). While the expression of GS1;3 was the highest at imbibition and decreased over time, GS1;1 and GS1;2 expression levels were low in the beginning of germination. From 48 h after imbibition onwards, GS1;1 had the highest expression of all 3 isoforms, whereas GS1;2 exceeded GS1;3 expression at 72 h (Figure 1A).
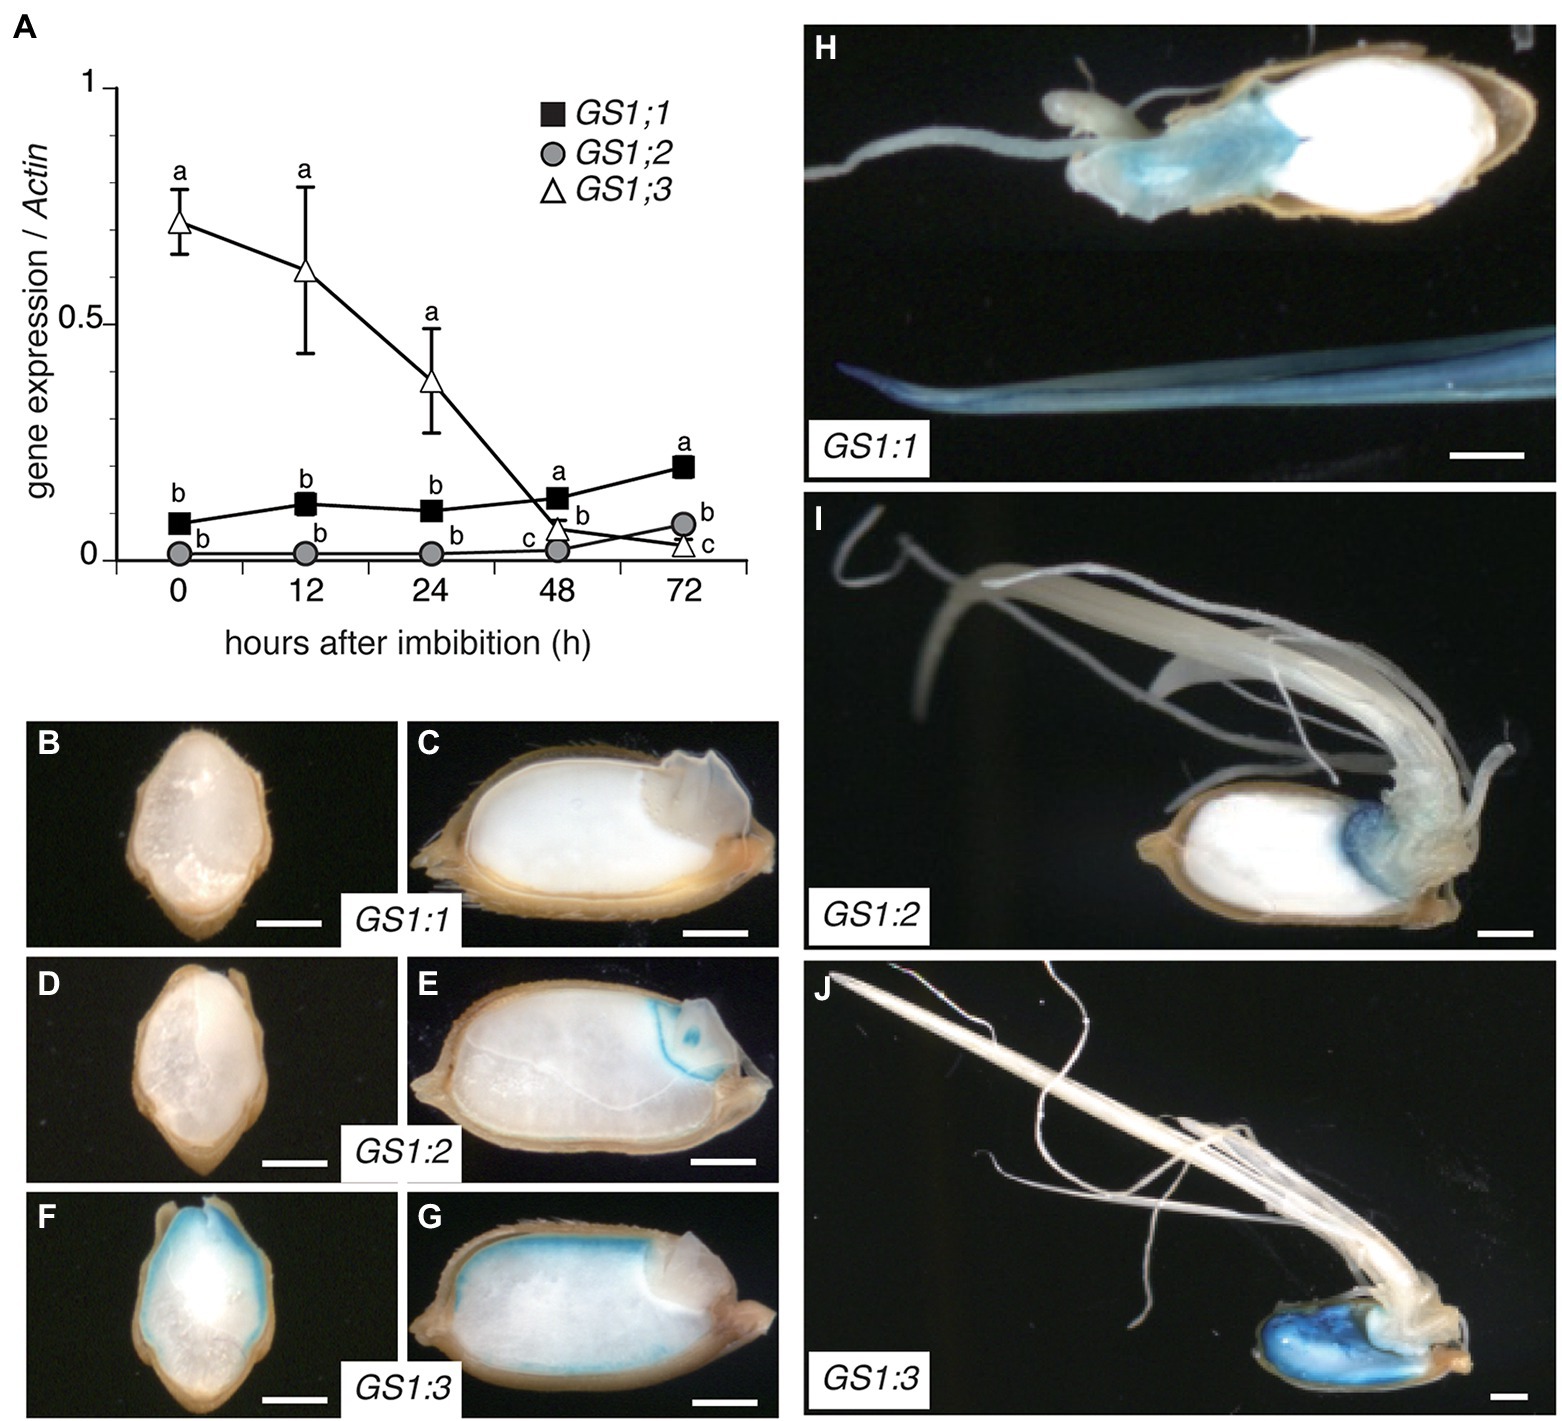
Figure 1. Differential expression and localization of cytosolic glutamine synthetase (GS1) genes during rice seed germination. (A) Time course qPCR analysis of GS1 isoforms in WT plants during rice seed germination after imbibition of mature seeds. Data represent mean ± SD (n = 3). (B–J) GS1 promoter-driven GUS activity in germinating rice seeds. Transgenic rice seeds harboring GS1;1pro::GUS, GS1;2pro::GUS, or GS1;3pro::GUS construct were germinated and cultured under controlled conditions for 72 h. Transverse (B,D,F) and longitudinal (C,E,G) sections of seeds expressing GS1;1 (B,C,H), GS1;2 (D,E,I), and GS1;3 (F,G,J). Images of seeds and seedlings were captured using a stereomicroscope at 24 h (B–G) and 72 h (H–J) after imbibition. Bars indicate 1 mm.
Besides the temporal analysis by qPCR, the spatial expression of the GS1 isoforms was analyzed by β-glucuronidase (GUS) expression under the control of GS1 isoform promoters.
At 24 h after imbibition, no GUS activity was detected in proGS1;1::GUS transgenic lines (Figures 1B,C), whereas proGS1;2::GUS was detected in the embryo (Figures 1D,E). The proGS1;3::GUS line showed an expression in the aleurone layer (Figures 1F,G). To visualize the expression pattern after the emergence of roots and shoots, the same transgenic lines were observed 72 h after imbibition (Figures 1H–J). The GS1;1 promoter showed an expression in the shoots and roots (Figure 1H), while the GS1;2 promoter showed mainly expression in the embryo with only a slight expression in the roots and shoots (Figure 1I). In contrast, the GS1;3 promoter line showed an additional expression in the endosperm, compared to the aleurone-specific expression detected at 24 h after imbibition (Figure 1J).
These data suggest a physiological role of GS1;3 in the aleurone and endosperm during seed germination, a physiological role of GS1;2 in the embryo and a general function of GS1;1 in roots and shoots.
To investigate the physiological function of GS1;3 in seed germination and seedling growth, a reverse genetics approach was used. Two independent Tos17 insertion lines of GS1;3 were identified by a screen of pooled Tos17 insertion line DNA samples. Figure 2A illustrates the Tos17 insertion position in the GS1;3 mutant lines. Semi-quantitative real-time PCR (RT-PCR) analysis 24 h after imbibition revealed that GS1;3 was not expressed in the mutant lines, but in the WT (Figure 2B). By contrast, GS1;1 and GS1;2 expressions were detected neither in WT seeds nor in mutant seeds (Figure 2B). Actin was expressed in all samples tested (Figure 2B).
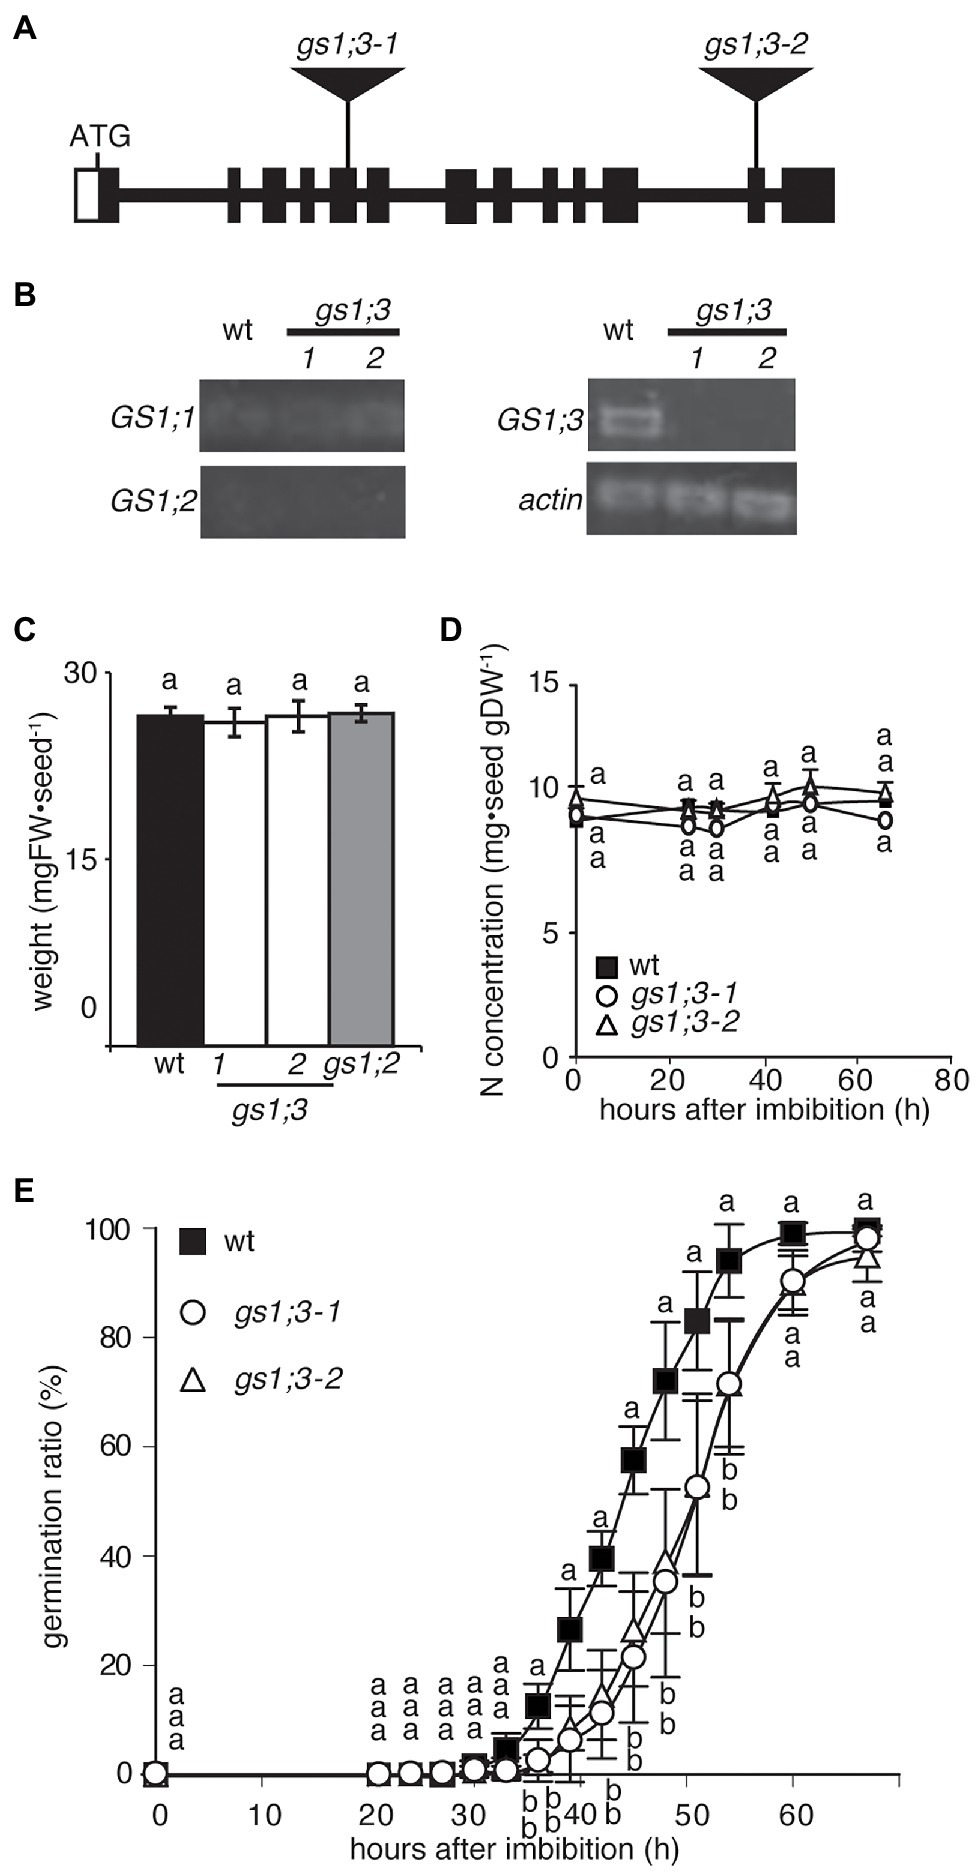
Figure 2. Loss of function of GS1;3 retarded seed germination in rice. (A) Schematic representation of the positions of Tos17 insertions in gs1;3-1 and gs1;3-2 mutants. Filled box indicates exon, and line indicates intron. Opened box indicates untranslated region. (B) Semi-quantitative RT-PCR analysis (30 cycles) of GS1 isoforms and actin in mature WT and GS1;3 mutant seeds. (C) Weight and (D) N concentration of mature WT, GS1;2 and GS1;3 mutant seeds. Each data point represents mean ± SD (n = 5–10 seeds). (E) Germination time course analysis of WT and GS1;3 mutants. During 20–72 h after imbibition, the ratio of germinated seeds was calculated every 3–6 h. Fifty seeds per line were analyzed during this period, and the experiment was repeated three times (n = 3 with 50 seeds each). The data represent the mean of 3 experiments ± SD. Significant differences within each group were determined using one-way analysis of variance (ANOVA) followed by Bonferroni tests and are indicated with different letters (p < 0.05).
Based on the aleurone layer and endosperm specific expression, the expected function of GS1;3 during seed germination and grain quality was analyzed in GS1;3 mutant and WT seeds. Neither the loss of function of GS1;3 nor the loss of function of GS1;2 in mutant seeds affected the weight of individual mature seeds, based on seeds selected against a salt water density selection (Figure 2C). The N concentration of mutant and WT seeds did not change significantly during the 72 h observation after imbibition (Figure 2D). Though the weight and N concentration of the GS1;3 mutant seeds were not changed at 0 h, they took significantly longer to germinate compared to WT seeds (Figure 2E). It took 51 h until 50% of GS1;3 mutant seeds germinated, whereas 50% of WT seeds germinated in 45 h. Thus, the germination of GS1;3 mutant seeds was delayed by 6 h compared with WT seeds (Figure 2E).
By contrast, the loss of function of GS1;2 did not affect seed germination (Supplementary Figure S1). Together the data suggest that GS1;3 is involved in the germination process itself.
For further analysis of the GS1;3 role in germination a time course measurement of ammonium and amino acids was conducted during seed germination. To get an overview of the time-dependent changes, mature WT seeds were analyzed first (Figures 3A–C). In WT seeds, the total concentration of free amino acids started to increase 24 h after imbibition and doubled at 72 h (Figure 3A). The time course did not show significant differences in the concentrations of aspartate (Asp), glutamine (Gln), asparagine (Asn), and glutamate (Glu) over time (Figures 3B,C). However, the concentration of free ammonium slightly decreased from 24 to 48 h after imbibition and increased at 72 h (Figure 3A).
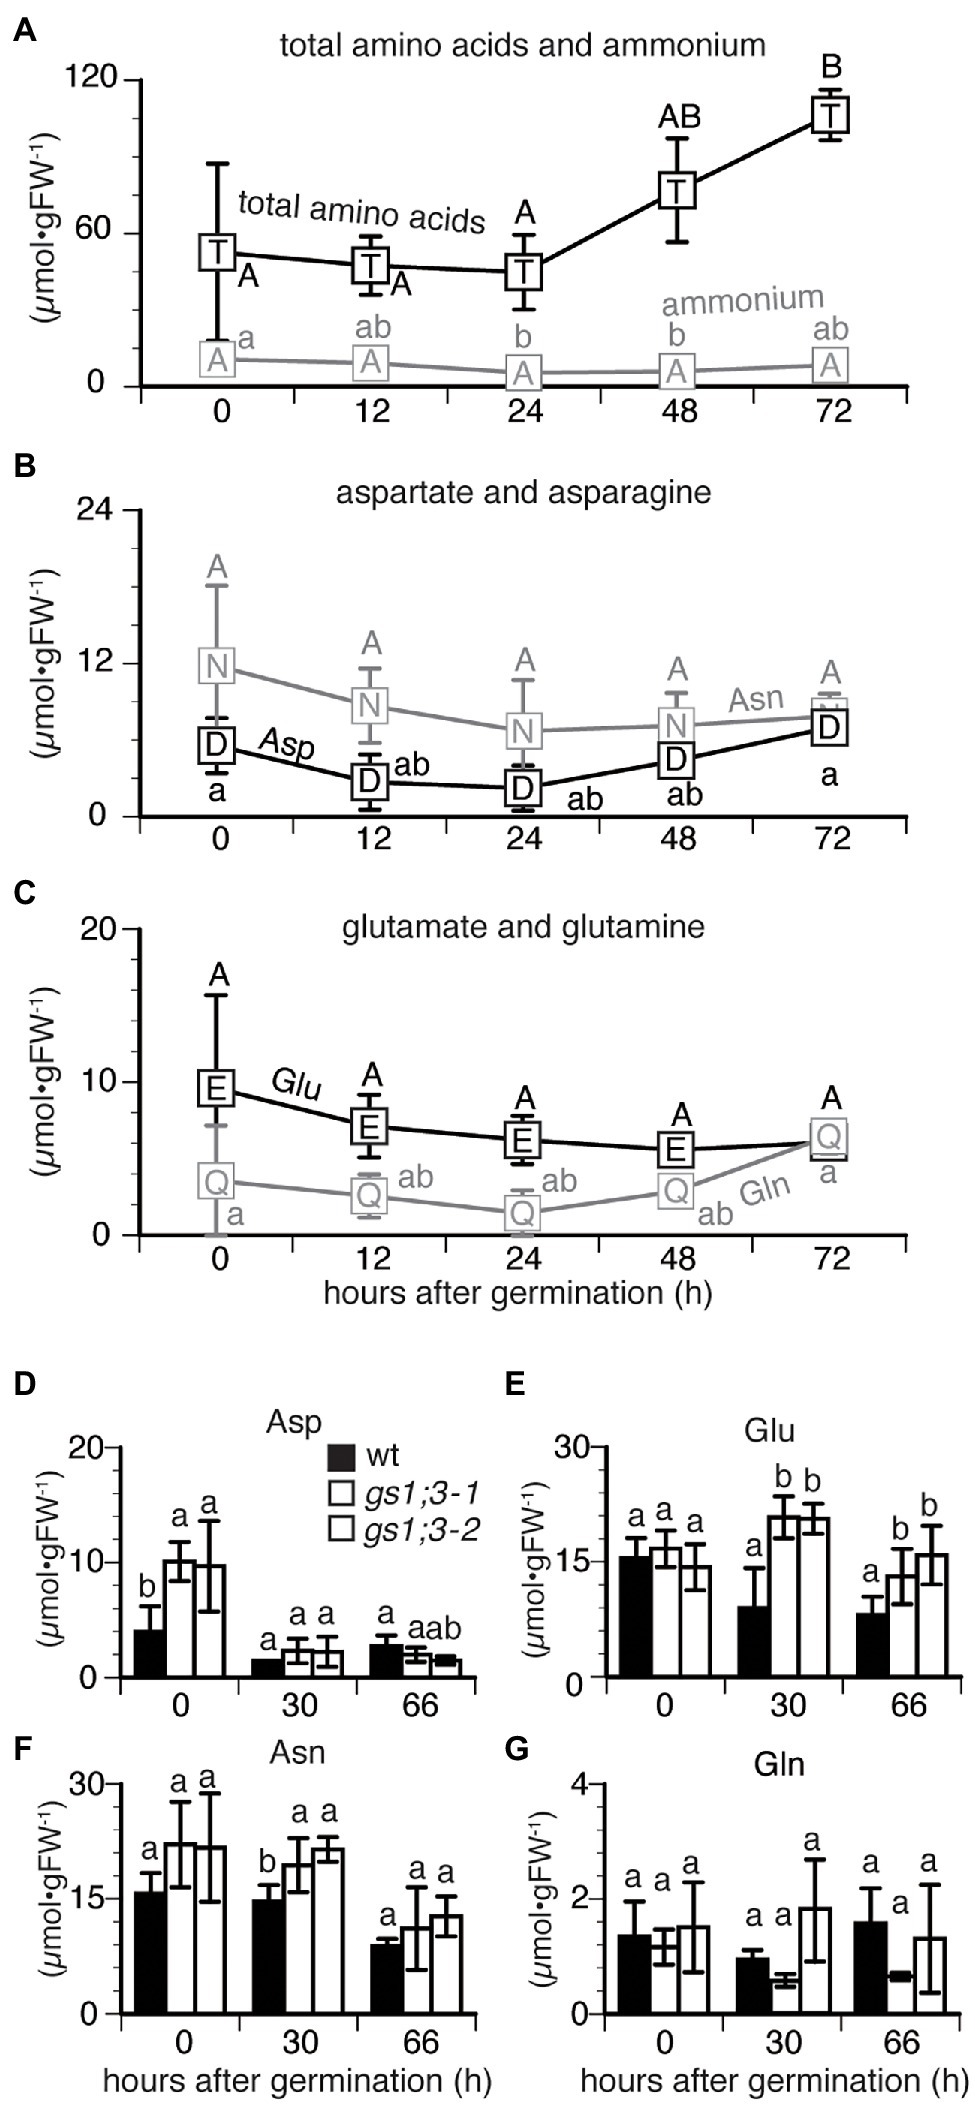
Figure 3. Changes in the concentration of free amino acids and ammonium in germinating rice seeds. Concentrations of (A) total amino acids and ammonium and (B,C) four selected amino acids in Nipponbare (WT) seeds sampled at 0, 12, 24, 48, and 72 h after imbibition. Data represent mean ± SD (n = 3–5). Mature seeds of WT and GS1;3 mutants harvested at 0, 30, and 66 h after imbibition (D–G). Data represent mean ± SD (n = 5). Significant differences within each group A–C, changes of each compound in different time and D–G, changes of compound at certain time point in different genotypes) were determined using one-way analysis of variance (ANOVA) followed by Bonferroni tests and are indicated with different letters (p < 0.05).
To analyze the GS1;3 specific functions, WT and GS1;3 mutant lines were analyzed at three time points (Figures 3D–G). The concentration of aspartate (Asp) in GS1;3 mutant seeds was significantly higher than that in WT seeds at the start of imbibition but sharply decreased after 30 h, reaching a similar concentration level compared to WT seeds (Figure 3D). Initially, the concentration of glutamate (Glu) was comparable in WT and mutant seeds (Figure 3E). However, while the Glu concentration decreased in WT 30 and 66 h after imbibition, it increased temporally at 30 h and decreased again to the initial level at 66 h for GS1;3 mutant lines (Figure 3E). Asparagine (Asn) showed only a temporal increase in the GS1;3 mutant lines at 30 h, compared to WT, while both WT and mutant plants showed a decrease in Asn at 66 h (Figure 3F). Glutamine (Gln) showed no marked changes in concentration during germination (Figures 3D,G). The data indicate on one hand that the storage components in mature grains of the gs1;3 mutants might be different (higher Asp at 0 h), which leads to a possible role of GS1;3 in seed ripening. On the other hand, the higher levels of Glu at 30 and 66 h in the mutant seeds indicate involvement in the GS/GOGAT cycle during germination.
Interestingly, though the germination speed was altered in gs1;3 knockout mutants, no significant differences between WT and GS1;3 mutants were detected in the plant hormone level in germinating seeds at 24 h after imbibition (Supplementary Figure S2).
To evaluate the GS1;3 loss-of-function effects during germination, GS1 expression was measured after 10 days of growth under different N regimes. Among the three GS1 genes, GS1;1 was expressed at high levels in roots and low levels in shoots, GS1;2 was mainly expressed in roots, and GS1;3 was barely expressed in seedlings in WT plants (Supplementary Figure S3). Actin was expressed under all conditions (Supplementary Figure S3). None of the genes of GS isoforms showed a differential expression under 5 or 1,000 μM ammonium supply, suggesting that transcriptional regulation by ammonium plays no role in the gene regulation of GS isoforms in the analyzed time-scale.
The loss of function of GS1;3 resulted in slight growth retardation in seedlings, when grown in water for 21 days (Figures 4A–E). The two GS1;3 mutants showed a significant decrease in shoot length, but only one line showed an increased root length compared to WT (Figure 4A). Compared with WT, the root and shoot weight was in both GS1;3 mutant lines not significantly different (Figure 4B). However, seeds of gs1;3-1 and gs1;3-2 were significantly heavier than those of WT 21 days after imbibition (Figure 4C), and the nitrogen amount in the seeds remained higher in the mutants (Figure 4D). Furthermore, the size of expanding 3rd leaf blades (Figure 4E) in GS1;3 mutants was significantly lower compared to WT plants.
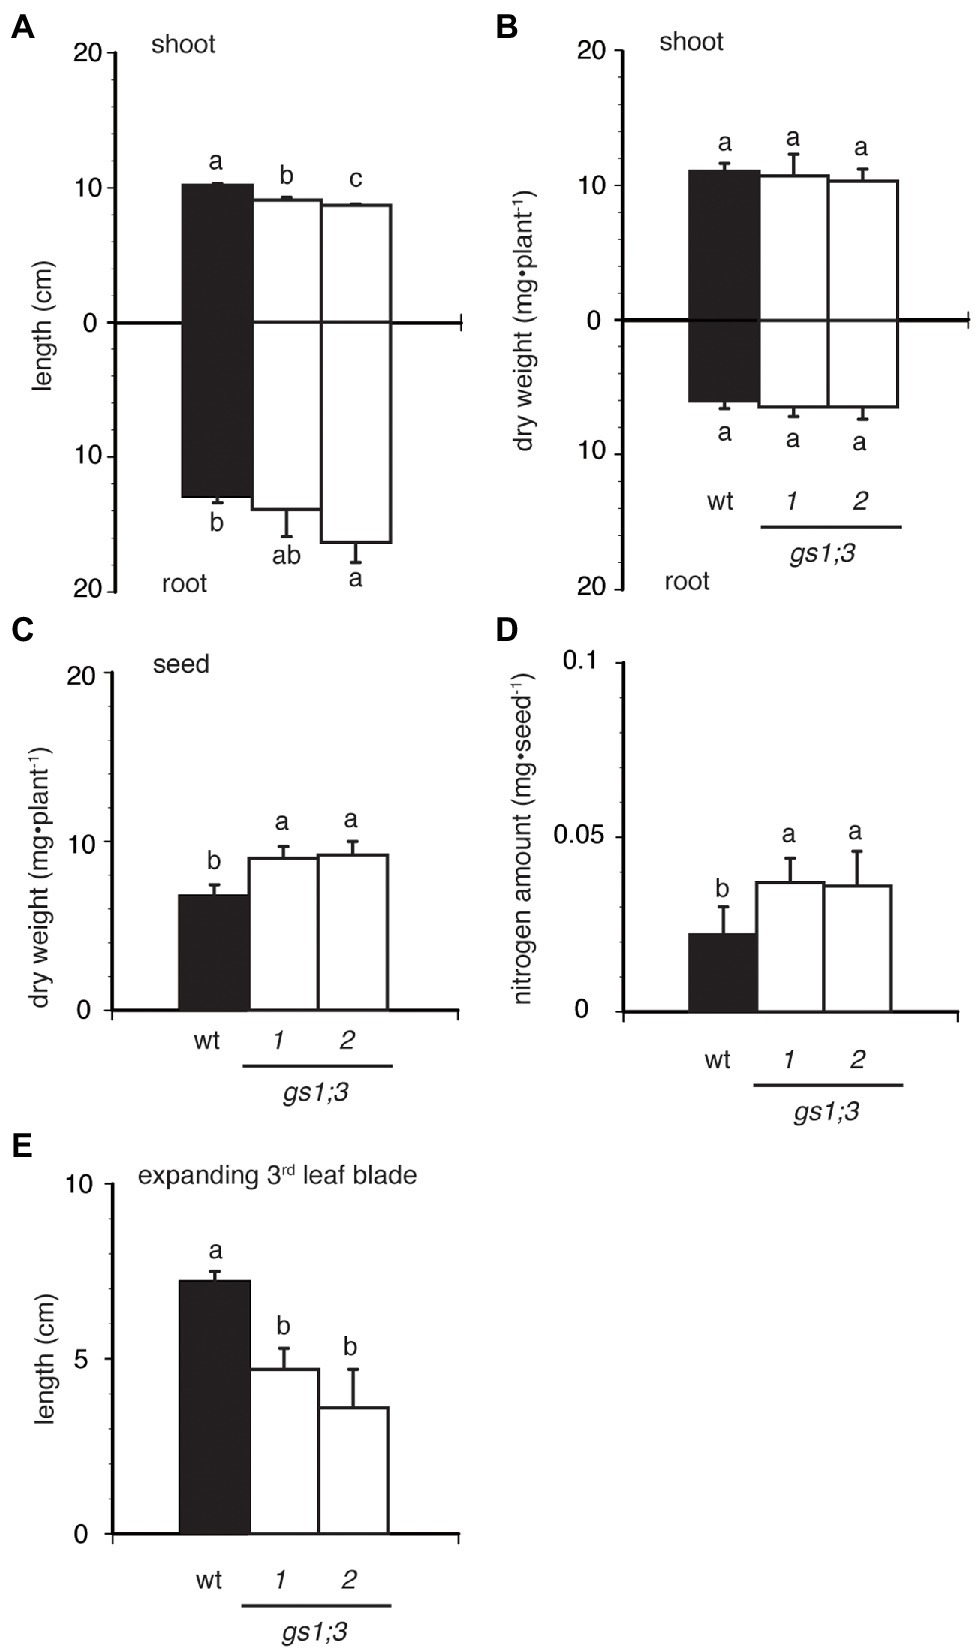
Figure 4. Seedling growth of WT and GS1;3 mutants in water. Seedling growth of WT and GS1;3 mutant plants cultured for 21 days in water. (A) root and shoot length, (B) root and shoot dry weight, (C) seed dry weight, (D) seed nitrogen amount after 21 days, and (E) third leaf blade length. Data represent mean ± SD (n = 5). Significant differences within each group were determined using one-way analysis of variance (ANOVA) followed by Bonferroni tests and are indicated with different letters (p < 0.05).
This suggests a decreased use of N in the grains during the growth of mutant seedlings since the mature seed weight and N concentration were the same for WT and GS1;3 mutants before imbibition (Figures 2C,D) while the seeds after 21 days of imbibition retained a higher weight and nitrogen content in GS1;3 mutants compared to WT plants. Taken together, the lack of GS1;3 resulted in the delayed germination, which led to retardation of the seedling growth. This could be due to limited ability to use nitrogen source in the seed.
While the involvement of GS1;3 was confirmed for the germination and the seedling growth under nitrogen-limited conditions, the question remained if the loss of GS1;3 also influences plant growth in a paddy field with normal nitrogen supply. We analyzed the growth and yield of GS1;3 mutant and WT plants in a paddy field in Kashimadai, Osaki-shi, Miyagi, Japan. Figure 5 illustrates the biomass and yield of mutant and WT rice at harvest. The shoot biomass of one GS1;3 mutant plant was heavier, whereas that of the other mutant plant was lighter than the WT (Figure 5A). Neither panicle dry weight (Figure 5B) nor yield (Figure 5C) was the same in GS1;3 mutant plants. The loss of GS1;3 functions significantly decreased the ratio of filled spikelets (%) by 6–8% compared to WT (Figure 5G). The panicle number was increased by 17–30% in both GS1;3 mutant plants compared to WT (Figure 5D), whereas the weight of dehusked, filled spikelets (brown rice) and spikelet number per panicle were not the same in GS1;3 mutant plants (Figures 5E,F). The different trend in several parameters like the shoot biomass and the weight of brown rice suggests that either an unspecified Tos17 insertion or low-level GS1;3 transcripts might influence these factors. Only when both lines showed a trend in the same direction the phenotype was regarded as GS1;3 specific. Overall, the field analysis indicated no impact of the loss of function of GS1;3 on yield, but a significant difference in grain filling and panicle number.
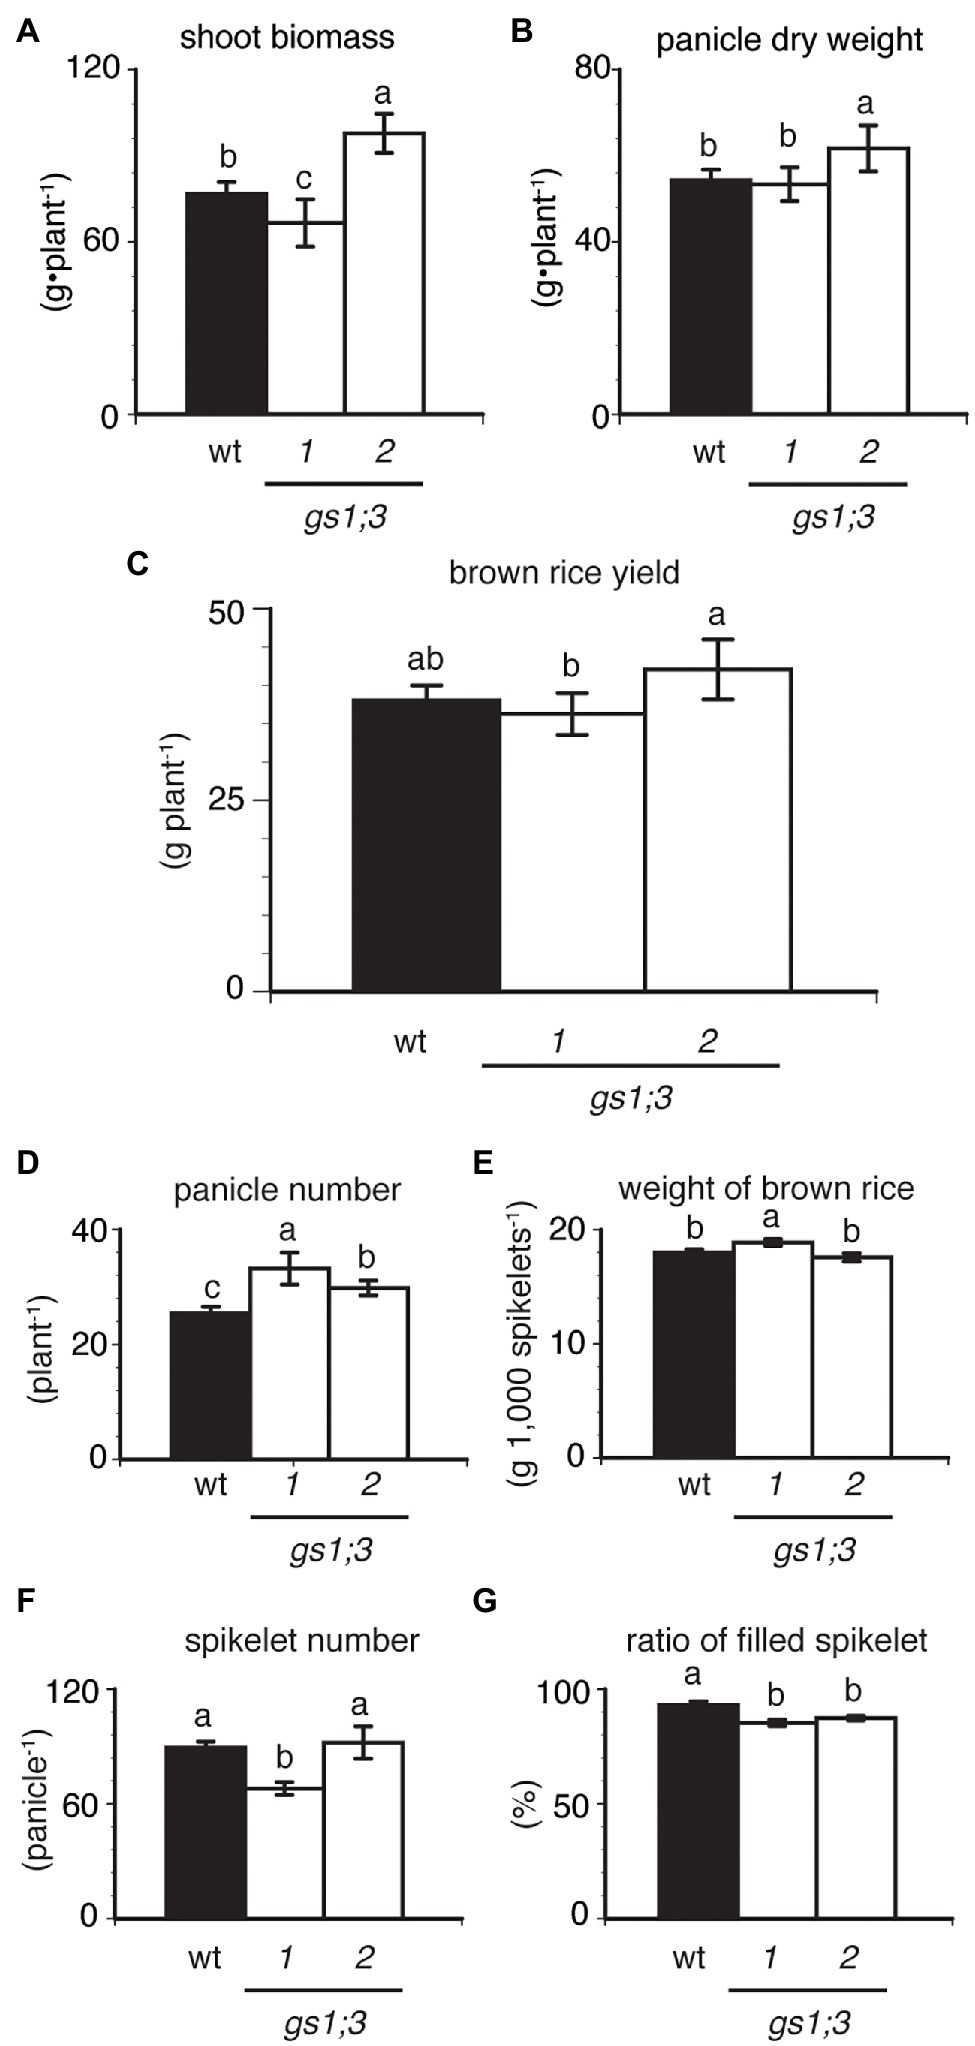
Figure 5. Productivity of GS1;3 mutants grown in the paddy field. (A) Shoot biomass, (B) panicle dry weight, (C) brown rice yield (yield of dehusked, filled spikelets), (D) total panicle number, (E) weight of brown rice, (F) spikelet number per panicle, and (G) the ratio of filled spikelets of Nipponbare (WT; closed column) and GS1;3 mutant (opened columns) plants harvested after 174 days at full maturity are shown. Data represent mean ± SD (n = 5). Significant differences within each group were determined using one-way analysis of variance (ANOVA) followed by Bonferroni tests and are indicated with different letters (p < 0.05).
While the analysis of GS1;3 mutants in paddy led to the identification of its involvement in grain filling, the nitrogen conditions in a paddy are hard to control. A reverse genetics study in maize demonstrated the impact of Gln1_3 and Gln1_4 on N translocation (Martin et al., 2006), and in order to investigate the physiological role of GS1;3 in N translocation, we analyzed the mutants grown with supply of the controlled N source in hydroponic culture. The growth and yield of GS1;3 mutants and WT plants were compared at harvest when grown with 0.5 mM NH4Cl as the sole N source.
The panicle dry weight of individual GS1;3 mutant plants was reduced by 26–64% at harvest (Figure 6A). The yield of GS1;3 mutants was more than 60% lower than that of the WT (Figure 6B). To identify what led to the yield decrease, a yield component analysis was performed. As the cause of the mutant yield decrease, a 20% reduction in spikelet number per panicle (Figure 6E) and > 30% reduction in the ratio of filled spikelets (Figure 6F) was identified. However, the panicle number was not significantly different (Figure 6C), and the 1,000-spikelet weight (Figure 6D) showed only a decrease for one of the two GS1;3 mutant lines compared to WT. This indicates that GS1;3 is mainly involved in grain filling during ripening.
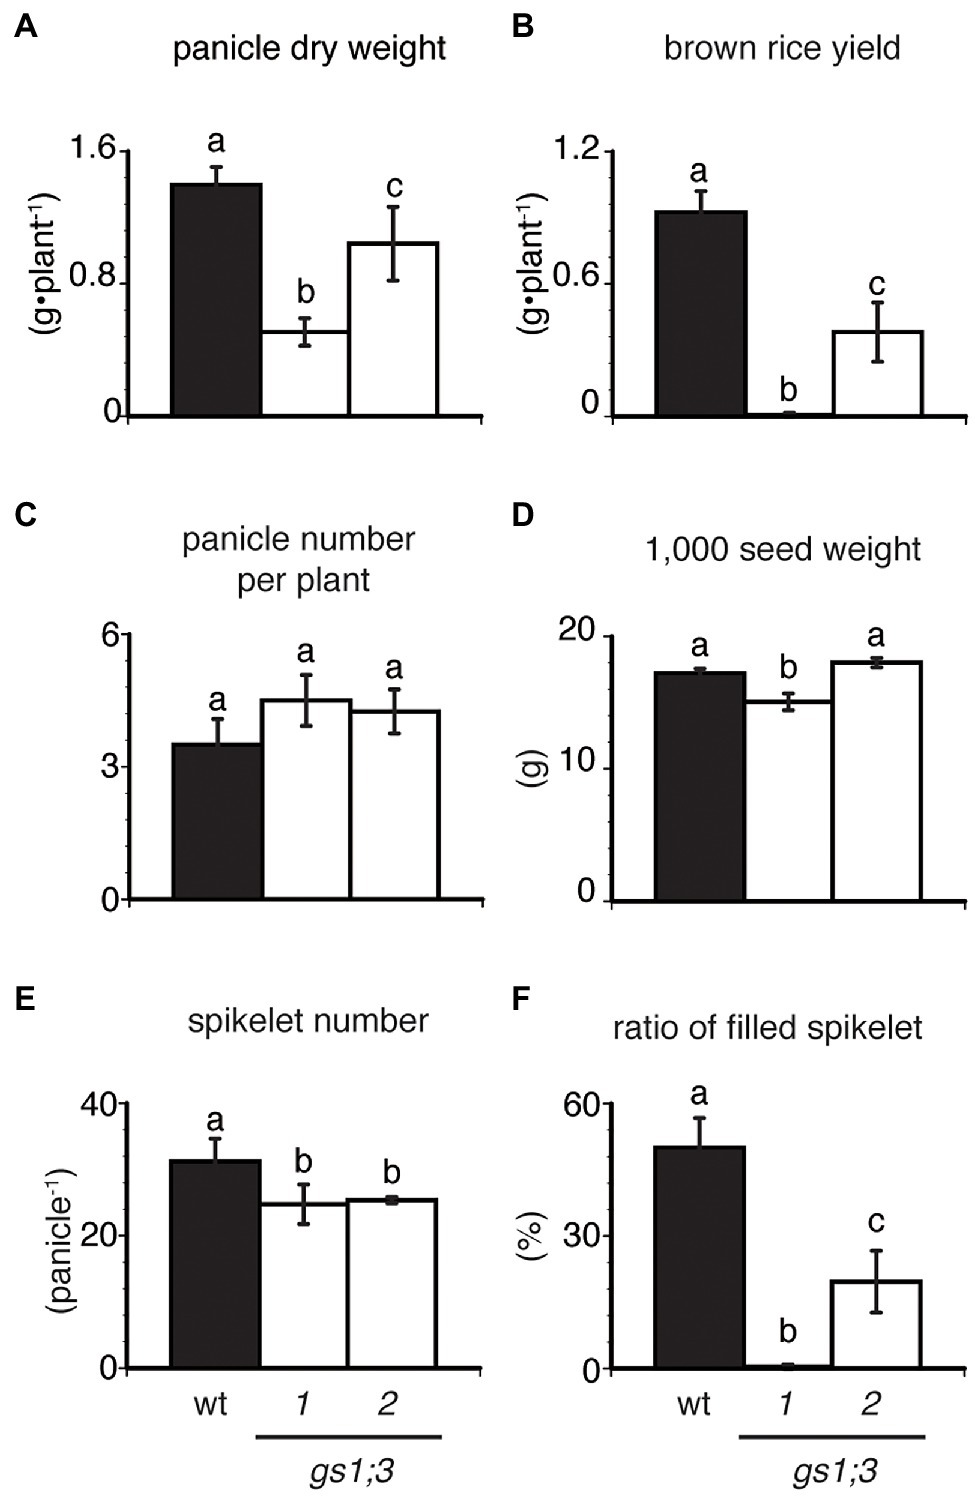
Figure 6. Productivity and growth of GS1;3 mutants in hydroponic culture. (A) panicle dry weight, (B) brown rice yield, (C) panicle number per plant, (D) 1,000 seed weight, (E) spikelet number per panicle, and (F) ratio of filled spikelets of WT and GS1;3 mutant plants grown in hydroponic culture with 0.5 mM NH4+ are shown. All samples were harvested 61 days after heading. Data represent mean ± SD (n = 5). Significant differences within each group were determined using one-way analysis of variance (ANOVA) followed by Bonferroni tests and are indicated with different letters (p < 0.05).
To further analyze the cause of the reduced yield, the panicle weight of the main stem was measured at heading and 21 days after heading. One of two GS1;3 mutant lines showed a significant decrease in the dry weight of the main stem panicles at the heading date, and both lines showed a decrease to around 50% of WT main stem panicle weight 21 days after heading (Figure 7A). The much lower weight of the mutant main stem panicles 21 days after heading is based on the significant increase of the WT main stem panicle and the marginal increase of the mutant main stem panicles compared to the heading date (Figure 7A). To confirm that GS1;3 is involved in the N translocation, 15N-labeled NH4Cl was supplied to trace the N movement. Plants were labeled with 15N at 19 days before heading when the 12th leaf was emerging. The 12th leaf blade was chosen as a proxy to determine the N translocation rate since the growth rate was minimal between the heading date and 21 days after (Figure 7B). The influx and efflux of N in the 12th leaf blade over the time course, ranging from 19 days before heading to 61 days after heading show that in WT, the N efflux was 5-fold higher than the N influx (Figure 7C). In GS1;3 mutants, the N efflux showed a significant reduction (21–38%) in the 12th leaf over time compared to the WT; however, no significant difference was detected in the N influx between WT and GS1;3 mutants (Figure 7C). In addition to the nitrogen translocation, the analysis of a GS1;3 promoter-driven GUS activity in a ripening grain at 35 days after heading revealed the localization of the promoter activity in the dorsal vascular bundles and aleurone layer (Figure 7D). These data support a role of GS1;3 in N translocation to seeds during the grain filling stage.
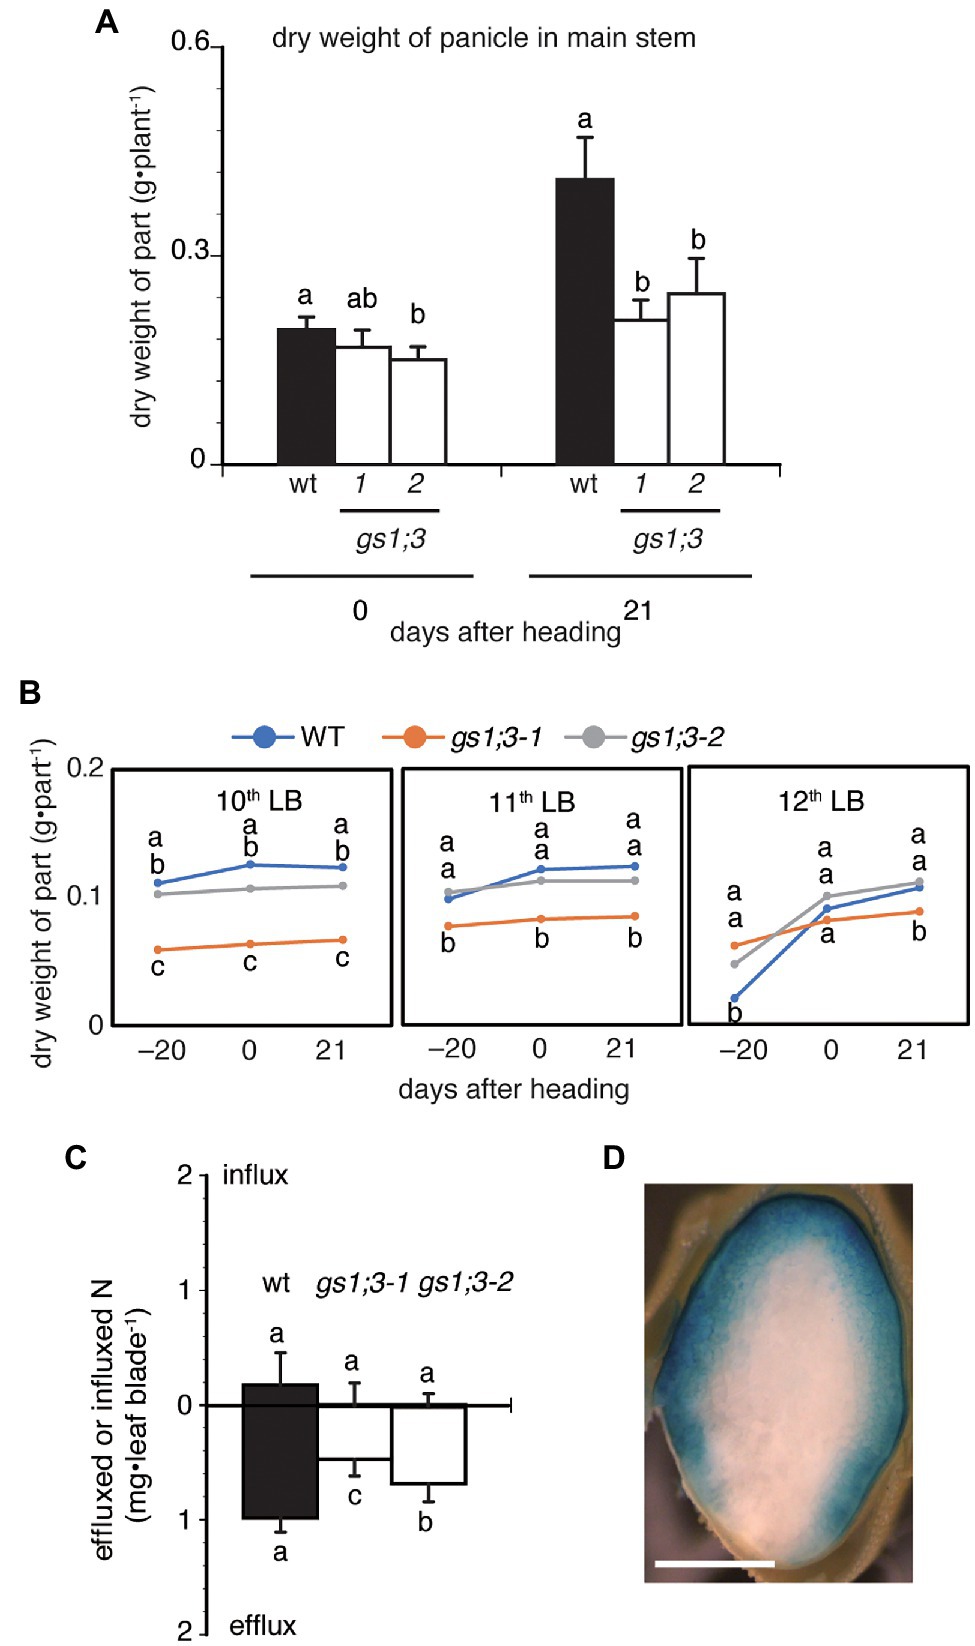
Figure 7. Influx and efflux of nitrogen in the 12th leaf blade on the main stem and GS1;3 promoter activity in ripening grains. (A) Dry weight of main stem panicles, and (B) dry weights of the 10th to 12th leaf blades of WT and GS1;3 mutant plants grown in hydroponic culture with 0.5 mM NH4+ are shown. For (A,B), plant organs were harvested 19 days before heading, at heading, 20 days after heading. (C) The influx and efflux of nitrogen in WT and GS1;3 mutant plants in the 12th leaf blades at 61 days after heading. Plants were grown in hydroponic culture and were supplied with 15N-labeled NH4Cl for 5 days from 19 days before heading onwards. Significant differences within each group were determined using one-way ANOVA followed by Bonferroni tests and are indicated with different letters (p < 0.05). Data represent mean ± SD (n = 8, for wt, gs1;3-1, and gs1;3-2; D) GS1;3 promoter-driven GUS activity in ripening rice grain. Transgenic plants expressing GS1;3pro::GUS were grown in the greenhouse on fully fertilized soil. Ripening grains were harvested at 35 days after heading and used for GUS staining. The transverse section is shown. Bar indicates 1 mm.
After imbibition GS1;3 showed a specific expression in the aleurone layer followed by a delayed expression in the endosperm, while GS1;1 and GS1;2 were expressed in the emerging plants, and lowly in the germinating seeds (Figure 1). The expression pattern of rice GS1;3 is comparable to the barley GS1;3 orthologue, HvGS1_3, which also showed an expression in the endosperm and was suggested to be important for seed maturation and germination, with a suggested role in the assimilation of ammonium from protein degradation in senescing leaves and/or seed reserves (Goodall et al., 2013). The localization of both, rice and barley GS1;3 isoforms are slightly different from wheat GS1;3, which showed an expression in the transfer cells, indicating a function in translocation similar to GS1;2 in barley and rice (Tabuchi et al., 2007; Goodall et al., 2013; Wei et al., 2021).
The delayed germination of the gs1;3 mutants (Figure 2) is likely based on the involvement of GS1;3 in storage component mobilization, that is, the assimilation of free ammonium derived from proteolysis. The limited N assimilation over time due to lack of the GS1;3 function in gs1;3 mutants resulted in the increase in the remaining nitrogen concentration in form of glutamate compared to WT (Figure 3E). The free ammonium level was unchanged in the GS1;3 mutants (data not shown) compared to WT, indicating that the conversion of storage protein to free ammonium is feedback regulated by the glutamate level. This supports the role of GS1;3 suggested by Goodall et al. (2013).
In addition to that function, it is likely that GS1;3 is important for the energy status in the germinating seed. The germinating seed is heterotroph, and the supply of oxygen is limited due to the dense seed structure as well as to waterlogged conditions in the case of rice seeds. Amino acids can serve as energy donors through their catabolism in the TCA cycle (Angelovici et al., 2011; Araújo et al., 2011; Kirma et al., 2012), and the aspartate family pathway plays a crucial role under energy shortage (Galili, 2011; Credali et al., 2013). When we analyze the amino acid data (Figure 3), we see an accumulation of Asn after 30 h, and an accumulation of Glu after 30 and 66 h in the GS1;3 mutant seeds. The role of Asn as an energy donor starts from its conversion to aspartate, the precursor of the branched Asn family pathway (Mini-review by Galili et al., 2014). Considering that Asp can be converted by the Asp aminotransferase to Glu, a substrate of GS1;3, and that gln, a product of GS1;3, is an important precursor to produce Asn via the Asn synthetase (Gaufichon et al., 2016), we can assume a detrimental effect in the initial steps of the energy donor function of Asn in the GS1;3 mutant lines. Since no energy is needed for the action of the Asp aminotransferase, an equilibrium between the glutamate and aspartate concentration is likely. With the decreased function of GS1;3, we see the increased levels of glutamate after 30 and 66 h. The accumulation of Asn could be a result of the product accumulation (aspartate) which could decrease the asparaginase activity. Since this blocks the initial step in this pathway, the energy production is reduced. Though amino acids are precursors of phytohormones, the phytohormone level is unchanged in the GS1;3 mutant plants (Supplementary Figure S2).
The role of rice GS1;3 in germinating seeds is therefore to assimilate ammonium derived from protein catabolism in the aleurone layer and the endosperm, which is linked to the energy status that is needed to maintain the storage protein proteolysis for seedling growth.
Under normal field conditions, the only remarkable phenotype of the GS1;3 mutants was a significant reduction in the ratio of filled spikelets (Figure 5G). This suggests that GS1;3 is not important for vegetative growth, besides the initial involvement in seed germination, which is consistent with former studies about major GS1 isoforms in rice (Tabuchi et al., 2005, 2007). However, the reduction in the ratio of filled spikelets suggested involvement in seed ripening in addition to germination.
Since N supply is one of the major factors, which influence grain filling and yield (Uribelarrea et al., 2004), and GS1;3 is expressed in ripening spikelets (Tabuchi et al., 2005), the GS1;3 mutants were analyzed under nitrogen-limited conditions.
The reduction of nitrogen supply markedly reduced the yield of GS1;3 mutant plants, mainly based on the reduction of the ratio of filled spikelets, leading to a decrease in panicle dry weight and brown rice, with a smaller but still significant decrease in the spikelet number (Figure 6).
The localization of rice GS1;3 in spikelets is in the endosperm and the aleurone layer (Figure 7D). While the effect of different GS1 isoforms on yield is well documented, most articles focus on isoforms that are important during vegetative growth, like Gln1_3 and Gln1_4, which exert their function due to their localization in the mesophyll and bundle sheath cells of maize leaves (Martin et al., 2006). The only known GS1 isoforms with predominant localization in seeds are GS1;3 in wheat (Wei et al., 2021), and GS1;3 in barley (Goodall et al., 2013), GLN1;5 in Arabidopsis (Schmid et al., 2005; Winter et al., 2007; Bassel et al., 2008; Le et al., 2010), and GS1;3 in rice (this study).
Considering the specific localization in spikelets and seeds, likely explanations for the phenotype are similar to the germinating seeds, namely, the involvement in the GS/GOGAT cycle for the build-up of the storage proteins, as well as its involvement in the energy metabolism.
As reviewed by Galili et al., 2014, monocotyledonous plants do not generate energy through photosynthesis in seeds, leaving again the asparagine pathway as a possible root for energy supply. Indeed, the Asp concentration in GS1;3 mutant line seeds was significantly higher compared to WT upon imbibition (Figure 3), suggesting that the production of energy is affected by the lack of GS1;3, due to the disturbance of the GS/GOGAT cycle in the endosperm/aleurone layer. Further support for this hypothesis is given in Figure 7A, which showed that the developing main stem panicle nearly doubled its weight in WT seeds 21 days after heading, while GS1;3 mutant seeds just slightly increased. With the production of storage components during heading, the spikelets get thicker, making them more and more impenetrable to oxygen, which is increasing the need for alternative energy sources, which cannot be supplied anymore in the case of GS1;3 seeds.
Since the plant weight in the GS1;3 mutant lines was not affected, they do not have a nitrogen limitation per se. When the 12th leave was used as a proxy for nitrogen translocation (Figures 7B,C), it was shown that the nitrogen efflux from the leave was reduced, which can be explained by a reduction in the sink strength (reduced ratio of filled spikelets) caused by the lack of GS1;3.
In conclusion, the GS1;3 involvement in seed germination and its influence on spikelet filling, which is more pronounced under nitrogen limitation, is based on its involvement in the assimilation of free ammonium in the aleurone layer and the endosperm during storage protein biosynthesis and degradation. It furthermore seems to be involved in the energy provision that fuels these processes. Future research will focus on the contribution of GS1;3 to the energy metabolism in non-photosynthetic tissues.
The importance of GS1;3 under nitrogen limitation makes it a possible target for improving crop productivity. A possible approach might be an overexpression of GS1;3, which has the potential to improve yield specifically under nitrogen-limited conditions. Successful examples are the overexpression of GS1;1 and GS1;2, that led to an improved tolerance to abiotic stress in rice (James et al., 2018), and the overexpression of GS1-1, which improved the nitrogen utilization efficiency in barley (Gao et al., 2019). Considering the assumed role of GS1;3 in the energy metabolism a positive effect might occur also in developing seeds without nitrogen limitation.
The original contributions presented in the study are included in the article/Supplementary Material, further inquiries can be directed to the corresponding author.
MT-K, KI, TH, TY, and SK contributed to conception and design of the study. MT-K, TU-O, EM, and HN performed the promoter analysis. YH, KS, and TF performed the seed germination analysis. MT-K and YH performed the amino acid measurement. TF, MT-K, YH, HN, KS, YS, and SK performed the growth analysis. MK, HS, HN, and KI performed the hormone analysis. TF, MT-K, YS, and AM isolated the Tos17 insertion lines. TF, MB, and SK performed the tracing analysis. MB and SK wrote the first draft of the manuscript. All authors contributed to the article and approved the submitted version.
Japan Advanced Plant Research Network supported by JSPS was also acknowledged for the use of Elemental Analyzer. JSPS KAKENHI Grant Numbers, 21688006 and 26450073 to SK and 22119003 to TY supported this work. TH was supported by a Grant-in-Aid for Scientific Research from the Ministry of Education, Culture, Sports, Science, and Technology of Japan (KIBAN B; 17H03780). This study was supported by the Network of Centers of Carbon Dioxide Resource Studies in Plants (NC-CARP).
The authors declare that the research was conducted in the absence of any commercial or financial relationships that could be construed as a potential conflict of interest.
All claims expressed in this article are solely those of the authors and do not necessarily represent those of their affiliated organizations, or those of the publisher, the editors and the reviewers. Any product that may be evaluated in this article, or claim that may be made by its manufacturer, is not guaranteed or endorsed by the publisher.
We are grateful to Ikumi Sakurada-Enomoto, Noriyuki Konishi, Wataru Tamura, Keiichi Kanno, Yosuke Nakayama, Fumi Imagawa, Masahide Saito, and Takanori Yasuda for technical assistance.
The Supplementary Material for this article can be found online at: https://www.frontiersin.org/articles/10.3389/fpls.2022.835835/full#supplementary-material
Angelovici, R., Fait, A., Fernie, A. R., and Galili, G. (2011). A seed high-lysine trait is negatively associated with the TCA cycle and slows down Arabidopsis seed germination. New Phytol. 189, 148–159. doi: 10.1111/j.1469-8137.2010.03478.x
Araújo, W. L., Tohge, T., Ishizaki, K., Leaver, C. J., and Fernie, A. R. (2011). Protein degradation - an alternative respiratory substrate for stressed plants. Trends Plant Sci. 16, 489–498. doi: 10.1016/j.tplants.2011.05.008
Bassel, G. W., Fung, P., Chow, T. F. F., Foong, J. A., Provart, N. J., and Cutler, S. R. (2008). Elucidating the germination transcriptional program using small molecules. Plant Physiol. 147, 143–155. doi: 10.1104/pp.107.110841
Credali, A., García-Calderón, M., Dam, S., Perry, J., Díaz-Quintana, A., Parniske, M., et al. (2013). The K+-dependent asparaginase, NSE1, is crucial for plant growth and seed production in Lotus japonicus. Plant Cell Physiol. 54, 107–118. doi: 10.1093/pcp/pcs156
Funayama, K., Kojima, S., Tabuchi-Kobayashi, M., Sawa, Y., Nakayama, Y., Hayakawa, T., et al. (2013). Cytosolic glutamine synthetase1;2 is responsible for the primary assimilation of ammonium in rice roots. Plant Cell Physiol. 54, 934–943. doi: 10.1093/pcp/pct046
Gadaleta, A., Nigro, D., Marcotuli, I., Giancaspro, A., Giove, S. L., and Blanco, A. (2014). Isolation and characterisation of cytosolic glutamine synthetase (GSe) genes and association with grain protein content in durum wheat. Crop Pasture Sci. 65, 38–45. doi: 10.1071/CP13140
Galili, G. (2011). The aspartate-family pathway of plants: linking production of essential amino acids with energy and stress regulation. Plant Signal. Behav. 6, 192–195. doi: 10.4161/psb.6.2.14425
Galili, G., Avin-Wittenberg, T., Angelovici, R., and Fernie, A. (2014). The role of photosynthesis and amino acid metabolism in the energy status during seed development. Front. Plant Sci. 5:447. doi: 10.3389/fpls.2014.00447
Gallais, A., and Hirel, B. (2004). An approach to the genetics of nitrogen use efficiency in maize. J. Exp. Bot. 55, 295–306. doi: 10.1093/jxb/erh006
Gao, Y. J., de Bang, T. C., and Schjoerring, J. K. (2019). Cisgenic overexpression of cytosolic glutamine synthetase improves nitrogen utilization efficiency in barley and prevents grain protein decline under elevated CO2. Plant Biotechnol. J. 17, 1209–1221. doi: 10.1111/pbi.13046
Gaufichon, L., Rothstein, S. J., and Suzuki, A. (2016). Asparagine metabolic pathways in Arabidopsis. Plant Cell Physiol. 57, 675–689. doi: 10.1093/pcp/pcv184
Goodall, A. J., Kumar, P., and Tobin, A. K. (2013). Identification and expression analyses of cytosolic glutamine synthetase genes in barley (Hordeum vulgare L.). Plant Cell Physiol. 54, 492–505. doi: 10.1093/pcp/pct006
Guan, M., de Bang, T. C., Pedersen, C., and Schjoerring, J. K. (2016). Cytosolic glutamine synthetase Gln1;2 is the main isozyme contributing to GS1 activity and can be up-regulated to relieve ammonium toxicity. Plant Physiol. 171, 1921–1933. doi: 10.1104/pp.16.01195
Guan, M., Møller, I. S., and Schjoerring, J. K. (2015). Two cytosolic glutamine synthetase isoforms play specific roles for seed germination and seed yield structure in Arabidopsis. J. Exp. Bot. 66, 203–212. doi: 10.1093/jxb/eru411
Guan, M., and Schjoerring, J. K. (2016). Peering into the separate roles of root and shoot cytosolic glutamine synthetase 1;2 by use of grafting experiments in Arabidopsis. Plant Signal. Behav. 11:e1245253. doi: 10.1080/15592324.2016.1245253
Habash, D., Bernard, S., Schondelmaier, J., Weyen, J., and Quarrie, S. (2007). The genetics of nitrogen use in hexaploid wheat: N utilisation, development and yield. Theor. Appl. Genet. 114, 403–419. doi: 10.1007/s00122-006-0429-5
Hartley, J. L., Temple, G. F., and Brasch, M. A. (2000). DNA cloning using in vitro site-specific recombination. Genome Res. 10, 1788–1795. doi: 10.1101/gr.143000
Hiei, Y., Ohta, S., Komari, T., and Kumashiro, T. (1994). Efficient transformation of rice (Oryza-sativa L) mediated by agrobacterium and sequence-analysis of the boundaries of the T-DNA. Plant J. 6, 271–282. doi: 10.1046/j.1365-313X.1994.6020271.x
Ishiyama, K., Inoue, E., Tabuchi, M., Yamaya, T., and Takahashi, H. (2004). Biochemical background and compartmentalized functions of cytosolic glutamine synthetase for active ammonium assimilation in rice roots. Plant Cell Physiol. 45, 1640–1647. doi: 10.1093/pcp/pch190
James, D., Borphukan, B., Fartyal, D., Ram, B., Singh, J., Manna, M., et al. (2018). Concurrent overexpression of OsGS1;1 and OsGS2 genes in transgenic Rice (Oryza sativa L.): impact on tolerance to abiotic stresses. Front. Plant Sci. 9:786. doi: 10.3389/fpls.2018.00786
Kirma, M., Araújo, W., Fernie, A., and Galili, G. (2012). The multifaceted role of aspartate-family amino acids in plant metabolism. J. Exp. Bot. 63, 4995–5001. doi: 10.1093/jxb/ers119
Kojima, M., Kamada-Nobusada, T., Komatsu, H., Takei, K., Kuroha, T., Mizutani, M., et al. (2009). Highly sensitive and high-throughput analysis of plant hormones using MS-probe modification and liquid chromatography tandem mass spectrometry: an application for hormone profiling in Oryza sativa. Plant Cell Physiol. 50, 1201–1214. doi: 10.1093/pcp/pcp057
Kojima, S., Kimura, M., Nozaki, Y., and Yamaya, T. (2000). Analysis of a promoter for the NADH-glutamate synthase gene in rice (Oryza sativa): cell type-specific expression in developing organs of transgenic rice plants. Aust. J. Plant Physiol. 27, 787–793. doi: 10.1071/PP99145
Kojima, M., and Sakakibara, H. (2012). “Highly sensitive high-throughput profiling of six phytohormones using MS-probe modification and liquid chromatography–tandem mass spectrometry,” in High-Throughput Phenotyping in Plants. ed. J. Normanly (New York, USA: Humana Press), 151–164.
Konishi, N., Ishiyama, K., Beier, M. P., Inoue, E., Kanno, K., Yamaya, T., et al. (2017). Contribution of two glutamine synthetase isozymes to ammonium assimilation in Arabidopsis roots. J. Exp. Bot. 68, 613–625. doi: 10.1093/jxb/erw454
Konishi, N., Saito, M., Imagawa, F., Kanno, K., Yamaya, T., and Kojima, S. (2018). Cytosolic glutamine synthetase isozymes play redundant roles in ammonium assimilation under low-ammonium conditions in roots of Arabidopsis thaliana. Plant Cell Physiol. 59, 601–613. doi: 10.1093/pcp/pcy014
Kusano, M., Tabuchi, M., Fukushima, A., Funayama, K., Diaz, C., Kobayashi, M., et al. (2011). Metabolomics data reveal a crucial role of cytosolic glutamine synthetase 1;1 in coordinating metabolic balance in rice. Plant J. 66, 456–466. doi: 10.1111/j.1365-313X.2011.04506.x
Le, B. H., Cheng, C., Bui, A. Q., Wagmaister, J. A., Henry, K. F., Pelletier, J., et al. (2010). Global analysis of gene activity during Arabidopsis seed development and identification of seed-specific transcription factors. Proc. Natl. Acad. Sci. U. S. A. 107, 8063–8070. doi: 10.1073/pnas.1003530107
Lea, P. J., and Azevedo, R. A. (2007). Nitrogen use efficiency. 2. Amino acid metabolism. Ann. Appl. Biol. 151, 269–275. doi: 10.1111/j.1744-7348.2007.00200.x
Lothier, J., Gaufichon, L., Sormani, R., Lemaitre, T., Azzopardi, M., Morin, H., et al. (2011). The cytosolic glutamine synthetase GLN1;2 plays a role in the control of plant growth and ammonium homeostasis in Arabidopsis rosettes when nitrate supply is not limiting. J. Exp. Bot. 62, 1375–1390. doi: 10.1093/jxb/erq299
Mae, T., and Ohira, K. (1981). The remobilization of nitrogen related to leaf growth and senescence in rice plants (Oryza-sativa-L). Plant Cell Physiol. 22, 1067–1074.
Makino, A., Mae, T., and Ohira, K. (1984). Relation between nitrogen and ribulose-1,5-bisphosphate carboxylase in rice leaves from emergence through senescence. Plant Cell Physiol. 25, 429–437.
Martin, A., Lee, J., Kichey, T., Gerentes, D., Zivy, M., Tatout, C., et al. (2006). Two cytosolic glutamine synthetase isoforms of maize are specifically involved in the control of grain production. Plant Cell 18, 3252–3274. doi: 10.1105/tpc.106.042689
Miyao, A., Tanaka, K., Murata, K., Sawaki, H., Takeda, S., Abe, K., et al. (2003). Target site specificity of the Tos17 retrotransposon shows a preference for insertion within genes and against insertion in retrotransposon-rich regions of the genome. Plant Cell 15, 1771–1780. doi: 10.1105/tpc.012559
Nakagawa, T., Kurose, T., Hino, T., Tanaka, K., Kawamukai, M., Niwa, Y., et al. (2007). Development of series of gateway binary vectors, pGWBs, for realizing efficient construction of fusion genes for plant transformation. J. Biosci. Bioeng. 104, 34–41. doi: 10.1263/jbb.104.34
Obara, M., Kajiura, M., Fukuta, Y., Yano, M., Hayashi, M., Yamaya, T., et al. (2001). Mapping of QTLs associated with cytosolic glutamine synthetase and NADH-glutamate synthase in rice (Oryza sativa L.). J. Exp. Bot. 52, 1209–1217. doi: 10.1093/jexbot/52.359.1209
Orsel, M., Moison, M., Clouet, V., Thomas, J., Leprince, F., Canoy, A. S., et al. (2014). Sixteen cytosolic glutamine synthetase genes identified in the Brassica napus L. genome are differentially regulated depending on nitrogen regimes and leaf senescence. J. Exp. Bot. 65, 3927–3947. doi: 10.1093/jxb/eru041
Sasaki, K., Takeuchi, Y., Miura, K., Yamaguchi, T., Ando, T., Ebitani, T., et al. (2015). Fine mapping of a major quantitative trait locus, qLG-9, that controls seed longevity in rice (Oryza sativa L.). Theor. Appl. Genet. 128, 769–778. doi: 10.1007/s00122-015-2471-7
Schmid, M., Davison, T. S., Henz, S. R., Pape, U. J., Demar, M., Vingron, M., et al. (2005). A gene expression map of Arabidopsis thaliana development. Nat. Genet. 37, 501–506. doi: 10.1038/ng1543
Shinozaki, Y., Hao, S. H., Kojima, M., Sakakibara, H., Ozeki-Iida, Y., Zheng, Y., et al. (2015). Ethylene suppresses tomato (Solanum Lycopersicum) fruit set through modification of gibberellin metabolism. Plant J. 83, 237–251. doi: 10.1111/tpj.12882
Sonoda, Y., Ikeda, A., Saiki, S., von Wiren, N., Yamaya, T., and Yamaguchi, J. (2003). Distinct expression and function of three ammonium transporter genes (OsAMT1;1-1;3) in rice. Plant Cell Physiol. 44, 726–734. doi: 10.1093/pcp/pcg083
Suzuki, Y., Kawazu, T., and Koyama, H. (2004). RNA isolation from siliques, dry seeds, and other tissues of Arabidopsis thaliana. BioTechniques 37, 542–544. doi: 10.2144/04374BM03
Tabuchi, M., Abiko, T., and Yamaya, T. (2007). Assimilation of ammonium ions and reutilization of nitrogen in rice (Oryza sativa L.). J. Exp. Bot. 58, 2319–2327. doi: 10.1093/jxb/erm016
Tabuchi, M., Sugiyama, K., Ishiyama, K., Inoue, E., Sato, T., Takahashi, H., et al. (2005). Severe reduction in growth rate and grain filling of rice mutants lacking OsGS1;1, a cytosolic glutamine synthetase1;1. Plant J. 42, 641–651. doi: 10.1111/j.1365-313X.2005.02406.x
Tamura, W., Hidaka, Y., Tabuchi, M., Kojima, S., Hayakawa, T., Sato, T., et al. (2010). Reverse genetics approach to characterize a function of NADH-glutamate synthase1 in rice plants. Amino Acids 39, 1003–1012. doi: 10.1007/s00726-010-0531-5
Thomsen, H. C., Eriksson, D., Moller, I. S., and Schjoerring, J. K. (2014). Cytosolic glutamine synthetase: a target for improvement of crop nitrogen use efficiency? Trends Plant Sci. 19, 656–663. doi: 10.1016/j.tplants.2014.06.002
Uribelarrea, M., Below, F. E., and Moose, S. P. (2004). Grain composition and productivity of maize hybrids derived from the Illinois protein strains in response to variable nitrogen supply. Crop Sci. 44, 1593–1600. doi: 10.2135/cropsci2004.1593
Wei, Y., Xiong, S., Zhang, Z., Meng, X., Wang, L., Zhang, X., et al. (2021). Localization, gene expression, and functions of glutamine synthetase isozymes in wheat grain (Triticum aestivum L.). Front. Plant Sci. 12:580405. doi: 10.3389/fpls.2021.580405
Winter, D., Vinegar, B., Nahal, H., Ammar, R., Wilson, G. V., and Provart, N. J. (2007). An "electronic fluorescent pictograph" browser for exploring and analyzing large-scale biological data sets. PLoS One 2:e718. doi: 10.1371/journal.pone.0000718
Yabuki, Y., Ohashi, M., Imagawa, F., Ishiyama, K., Beier, M. P., Konishi, N., et al. (2017). A temporal and spatial contribution of asparaginase to asparagine catabolism during the development of rice grains. Rice 10:3. doi: 10.1186/s12284-017-0143-8
Keywords: rice, GS1, yield, nitrogen translocation, germination, amino acids, grain filling
Citation: Fujita T, Beier MP, Tabuchi-Kobayashi M, Hayatsu Y, Nakamura H, Umetsu-Ohashi T, Sasaki K, Ishiyama K, Murozuka E, Kojima M, Sakakibara H, Sawa Y, Miyao A, Hayakawa T, Yamaya T and Kojima S (2022) Cytosolic Glutamine Synthetase GS1;3 Is Involved in Rice Grain Ripening and Germination. Front. Plant Sci. 13:835835. doi: 10.3389/fpls.2022.835835
Edited by:
Marta Wilton Vasconcelos, Catholic University of Portugal, PortugalCopyright © 2022 Fujita, Beier, Tabuchi-Kobayashi, Hayatsu, Nakamura, Umetsu-Ohashi, Sasaki, Ishiyama, Murozuka, Kojima, Sakakibara, Sawa, Miyao, Hayakawa, Yamaya and Kojima. This is an open-access article distributed under the terms of the Creative Commons Attribution License (CC BY). The use, distribution or reproduction in other forums is permitted, provided the original author(s) and the copyright owner(s) are credited and that the original publication in this journal is cited, in accordance with accepted academic practice. No use, distribution or reproduction is permitted which does not comply with these terms.
*Correspondence: Soichi Kojima, c29pY2hpLmtvamltYS5hMkB0b2hva3UuYWMuanA=
†Present address: Kazuhiro Sasaki, Japan International Research Center for Agricultural Sciences, Tsukuba, Japan
‡These authors have contributed equally to this work and share first authorship
Disclaimer: All claims expressed in this article are solely those of the authors and do not necessarily represent those of their affiliated organizations, or those of the publisher, the editors and the reviewers. Any product that may be evaluated in this article or claim that may be made by its manufacturer is not guaranteed or endorsed by the publisher.
Research integrity at Frontiers
Learn more about the work of our research integrity team to safeguard the quality of each article we publish.