
95% of researchers rate our articles as excellent or good
Learn more about the work of our research integrity team to safeguard the quality of each article we publish.
Find out more
ORIGINAL RESEARCH article
Front. Plant Sci. , 09 March 2022
Sec. Plant Biotechnology
Volume 13 - 2022 | https://doi.org/10.3389/fpls.2022.820996
This article is part of the Research Topic Sorghum and Pearl Millet as Climate Resilient Crops for Food and Nutrition Security, Volume II View all 9 articles
 Palakolanu Sudhakar Reddy1*
 Mahamaya G. Dhaware1
 Kaliamoorthy Sivasakthi1
 Kummari Divya1
 Marka Nagaraju2
 Katamreddy Sri Cindhuri1
 Polavarapu Bilhan Kavi Kishor3
 Pooja Bhatnagar-Mathur1†
 Vincent Vadez1
 Kiran K. Sharma1
Pearl millet [Pennisetum glaucum (L) R. Br.] is an important cereal crop of the semiarid tropics, which can withstand prolonged drought and heat stress. Considering an active involvement of the aquaporin (AQP) genes in water transport and desiccation tolerance besides several basic functions, their potential role in abiotic stress tolerance was systematically characterized and functionally validated. A total of 34 AQP genes from P. glaucum were identified and categorized into four subfamilies, viz., plasma membrane intrinsic proteins (PIPs), tonoplast intrinsic proteins (TIPs), nodulin-26-like intrinsic proteins (NIPs), and small basic intrinsic proteins (SIPs). Sequence analysis revealed that PgAQPs have conserved characters of AQP genes with a closer relationship to sorghum. The PgAQPs were expressed differentially under high vapor pressure deficit (VPD) and progressive drought stresses where the PgPIP2;6 gene showed significant expression under high VPD and drought stress. Transgenic tobacco plants were developed by heterologous expression of the PgPIP2;6 gene and functionally characterized under different abiotic stresses to further unravel their role. Transgenic tobacco plants in the T2 generations displayed restricted transpiration and low root exudation rates in low- and high-VPD conditions. Under progressive drought stress, wild-type (WT) plants showed a quick or faster decline of soil moisture than transgenics. While under heat stress, PgPIP2;6 transgenics showed better adaptation to heat (40°C) with high canopy temperature depression (CTD) and low transpiration; under low-temperature stress, they displayed lower transpiration than their non-transgenic counterparts. Cumulatively, lower transpiration rate (Tr), low root exudation rate, declined transpiration, elevated CTD, and lower transpiration indicate that PgPIP2;6 plays a role under abiotic stress tolerance. Since the PgPIP2;6 transgenic plants exhibited better adaptation against major abiotic stresses such as drought, high VPD, heat, and cold stresses by virtue of enhanced transpiration efficiency, it has the potential to engineer abiotic stress tolerance for sustained growth and productivity of crops.
Pearl millet [Pennisetum glaucum (L) R. Br.], which is a diploid (2n = 14) cereal crop from the Poaceae family, is the sixth most important cereal crop providing food security to over 500 million people across Africa and Asia. It is known to be a versatile dryland cereal used as multi-purpose crop for food, feed, fuel, construction material, and forage, especially in the arid and semiarid regions (Nambiar et al., 2011; Vadez et al., 2012). Its germplasm displays a high degree of genetic diversity and variable tolerance to most of the abiotic stresses, thereby providing better grain yield in areas that are too harsh for profitable production of other cereals like rice, wheat, sorghum, and maize. Pearl millet possesses abiotic stress tolerance due to efficient water conservation mechanisms (Kholová et al., 2010a; Reddy et al., 2017, 2021), which is considered as an efficient way of enhancing crop yield under terminal drought stress (Kholová et al., 2010a; Zaman-Allah et al., 2011b; Belko et al., 2012). Enhanced water conservation traits/genes that relate to hydraulic processes in the plant would be highly desirable for better drought adaptation of pearl millet cultivars (Kholová et al., 2010a,b, 2012; Reddy et al., 2017, 2021; Tharanya et al., 2018). The rapid response of the transpiration rate (Tr) to increased vapor pressure deficit (VPD) suggests a possible role of hydraulic signals mediating the Tr response upon rising VPD. These hydraulic signals are regulated by aquaporins (AQPs), the specialized membrane transporters that play a pivotal role in conducting water at the cellular level (Reddy et al., 2017; Shekoofa and Sinclair, 2018; Tharanya et al., 2018).
Aquaporins (AQPs) are members of the Major Intrinsic Proteins (MIP) family, which is represented in all kingdoms from archaea, animals to plants (Gomes et al., 2009; Maurel et al., 2015; Deshmukh et al., 2016). They are 23–31 kDa proteins having several specific characteristic features, including transmembrane helices (TM) linked by five inter-helical loops (LA-LE) and conserved dual aspargine-proline-alanine (NPA) motifs (Maurel et al., 2008). A number of AQPs have been identified in diverse plant species, including 35 in Arabidopsis (Johanson et al., 2001), 43 in maize (Chaumont et al., 2001), 34 in rice (Sakurai et al., 2005), 58 in Populus (Gupta and Sankararamakrishnan, 2009), 72 in soybean (Zhang et al., 2013), 41 in Sorghum (Reddy et al., 2015a), 57 in Brassica rapa (Sonah et al., 2017), 28 in Beta vulgaris (Kong et al., 2017), 65 in wheat (Madrid-Espinoza et al., 2018), 41 in Setaria italica (Singh et al., 2019), 39 in cucumber (Zhu et al., 2019), 76 in tobacco (De Rosa et al., 2020), and 38 in pomegranate (Liu et al., 2021). Plant AQPs show a high degree of gene multiplicity and assembled as tetramers that are typically divided into seven subfamilies, including plasma membrane intrinsic proteins (PIPs), tonoplast intrinsic proteins (TIPs), nodulin-26-like intrinsic proteins (NIPs), and small basic intrinsic proteins (SIPs) that have been identified in both primitive and higher plants (Anderberg et al., 2012). Hybrid intrinsic proteins (Hips), GlpF-like intrinsic proteins (GIPs) (Danielson and Johanson, 2008), and X-intrinsic proteins (XIPs) have only been identified in mosses as well as several dicotyledonous plants (Bienert et al., 2011), including soybean (Zhang et al., 2013), but were not identified in monocots. These subclasses have been defined based on sequence similarity as well as intracellular localization (Maurel et al., 2015). AQPs received special attention due to their association with water deficit conditions and correlated with the abiotic stress tolerance mechanism (Sreedharan et al., 2013; Afzal et al., 2016). Although a few AQPs have been identified and functionally characterized from crop plants, except for some preliminary reports, there is no detailed investigation on the functional validation of the AQP gene family in millets, including pearl millet (Reddy et al., 2017; Grondin et al., 2020).
Studies on AQPs have been demonstrated in both model and crop plants under different abiotic stresses, where the PIP family has been shown to play a major role in abiotic stress tolerance by modulating the water transport pathway (Fetter et al., 2004; Yaneff et al., 2014). The overexpression of the RsPIP2;1 gene has been shown to enhance drought and salt tolerance in transgenic Eucalyptus (Tsuchihira et al., 2010), while TdPIP1;1 and TdPIP2;1 from durum wheat and HvPIP2;5 from barley have been shown to improve salinity and osmotic stress tolerance in tobacco and Arabidopsis, respectively (Ayadi et al., 2011; Alavilli et al., 2016). Upon overexpression of AQPs from tomato (SlPIP2;1, SlPIP2;7, or SlPIP2;5) and rice (OsPIP1 and OsPIP2) in Arabidopsis, higher hydraulic conductivity levels and survival rates were displayed under drought stress conditions (Mosa et al., 2012; Li et al., 2016). Specific AQP inhibitors, such as HgCl2, AgNO3, and H2O2, have rapidly reduced the root hydraulic conductivity in chickpea and pearl millet (Sivasakthi et al., 2017a,2020; Tharanya et al., 2018). Grondin et al. (2020) reported that pearl millet genotypes contrasting for water use efficiency differed in AQP gene expression. PgPIP1;3 and PgPIP1;4 were significantly more expressed in the low-water-use efficiency line than the high-water-use efficiency line. In addition, the low-water-use efficiency line has more reduction of root hydraulic conductivity by azide (AQP inhibitor) treatment than the high-water-use efficiency line. Our earlier report, PgPIP2;3, showed higher transcript abundance in a high transpiration rate (TR) than the low TR line under high-VPD conditions (Reddy et al., 2017).
The overexpression of the StPIP1 gene was shown to ameliorate drought tolerance in potato where it improved water use efficiency, increased non-structural carbohydrates, thereby minimizing carbon starvation, and increasing biomass yield (Wang et al., 2017). The ectopic expression of MaPIP1;1 and MaPIP2;7 was shown to display multiple abiotic stress tolerance in transgenic banana (Xu et al., 2020, 2021), while transgenic rice overexpressing OsPIP1;3 promoted plant growth and water uptake (Liu et al., 2019). More recently, PePIP2;7 from bamboo has been demonstrated to confer abiotic stress tolerance in yeast and Arabidopsis (Sun et al., 2021).
Since pearl millet is a robust cereal crop of the semiarid tropics, it is important to understand different components of the abiotic stress tolerance mechanism. We systematically analyzed the sequences and relative expression of all PgAQPs under high VPD and progressive drought stress, besides the functional characterization of the PgPIP2;6 gene in tobacco. This work provides insights on the molecular basis of water conservation mechanisms in pearl millet.
Pearl millet AQP gene sequences were retrieved using maize, rice, and sorghum AQP genes as a search query and scanned against the pearl millet genome by NCBI blast N, X, and P databases. Chromosomal locations of PgAQPs were determined with the information obtained from the pearl millet genome database1. The intron-exon structures were predicted using the Gene Structure Display Server2 (Hu et al., 2015), and the MOTIF search3 was used to retrieve the conserved domains. Sequence analysis, including the open reading frame (ORF) and amino acid (AA) translations, molecular weight, and isoelectric point (pI) of PgAQP genes, was analyzed using the MacVector software (V16.09). The GRAVY (grand average of hydropathicity) instability and aliphatic indices were predicted by employing ProtParam of Expasy tools4 (Gasteiger et al., 2005). WoLFPSORT II5 was used to predict the subcellular locations (Guo et al., 2015), while the TMHMM server6 was used to screen the putative trans-membrane helices (Möller et al., 2001). Phosphorylation sites (serine, threonine, and tyrosine) of the PgAQPs were searched using the NetPhos 3.17 program (Bloom et al., 2004). Multiple sequence alignment (MSA) and phylogenetic analysis were carried out with full-length protein sequences of closely related AQPs from monocots and dicots using the ClustalW program of MacVector and MEGA 6.0 (Tamura et al., 2013). Bootstrap analysis was performed using 1,000 replicates, and the branch lengths corresponded to phylogenetic distances in units of the number of amino acid substitutions per site. Conserved motifs were identified with the help of the MEME suit8 with parameters such as the number of motifs 10, width of the motifs set in-between 3 and 60, while parameters were set as default (Bailey et al., 2009). PAL2NAL software was used to calculate the synonymous and non-synonymous sites, their substitution rates, and dN/dS for the PgAQPs orthologs and paralogs (Suyama et al., 2006). Promoter regions of all the identified PgAQP genes were searched by PlantCARE9 (Lescot et al., 2002). The 3D structure of PgPIP2;6 protein was modeled using SWISS-MODEL10, viewed and labeled using the PyMol viewer, and ligands of the protein were searched using SWISS-MODEL software. Online software tools, such as PatchDock11 and FireDock12, were used to dock the model against its ligand. For converting the Structure Data File (SDF) into Protein Data Bank (PDB) format, Marveanbeans software was used, while for docking the model with ligand PatchDock, an online server was utilized and the results were visualized by PyMol.
In a previous study, we have selected two pearl millet genotypes (ICMR 1152 and ICMR 1122), contrasting for VPD (Serraj et al., 2005; Reddy et al., 2017, 2021). These genotypes were used to express PgAQPs under high VPD and progressive drought stress. In the case of tobacco, both the transgenic and wild-type plants were grown in controlled glasshouse conditions at 26°C (14-h day) and 20°C (10-h night) 45 DAS. These plants were further subjected to progressive drought stress (Kholová et al., 2010a) and high VPD (Reddy et al., 2017, 2021) where the controls were maintained at 26°C for high-VPD treatment. Leaf and root tissues from the respective plants were collected and immediately snap frozen in liquid nitrogen for total RNA extraction and qRT-PCR analysis. Three biological replicates were maintained and collected for each stress treatment.
Based on the expression profile, PgPIP2;6 gene was selected and PCR amplified from the pearl millet cDNA and cloned between the CaMV35S - Nos terminator in the Gateway-compatible entry vector (pL12R34H-Ap) by digesting with NdeI and NotI restriction enzymes. The expression cassette of PgPIP2;6 gene (CaMV35S:PgPIP2;6:NosT) from the entry vector was further cloned into the Gateway-based plant transformation vector pMDC100 using LR Gateway cloning. The recombinant plasmid was transformed into Agrobacterium tumefaciens strain EHA105 by electroporation and used for tobacco transformation as reported previously (Divya et al., 2019); the selected rooted shoots were transferred to pots containing autoclaved sand and soil (1:1) mixture and maintained in a containment greenhouse until flowering and the seed set.
The untransformed wild type (WT) plants were used as negative control and a recombinant plasmid containing the PgPIP2;6 expression cassette as positive control. Fully grown transgenic tobacco plants (T0 generation) were self-pollinated using paper bags to produce T1 seeds. Progeny plants (T1) selected with kanamycin (50 mg L–1) on an agar medium were grown in a growth chamber at 25°C at a photoperiod of a 16-h light and 8-h dark cycle, followed by their advancement to T2 generation for further analysis. The T2 generation plants and their untransformed wild types were maintained at 25–27°C with a 16-h light and 8-h dark cycle with 300 μmol m–2 s–1 light and 70-80% relative humidity (RH) in a biosafe glasshouse and used for physiological and molecular analysis. The genomic DNA of the putative T0 tobacco transgenic plants (20 days) was isolated using the DNeasy Plant Mini Kit (Qiagen, Germany). Primer sets for CaMV35S_F (GATATCGTACCCCTACTCCAA)- PgPIP2;6_R (AGAAGACGGTGTAGACGAGCA) and NptII_F - NptII_R were used to confirm the transgene integration.
The T2 generation transgenic tobacco plants and the WT plants were grown in 8-inch plastic pots filled with 5.5 kg of Alfisol where 16 replicate pots of each genotype were grown and the 10 most uniform plants were selected to design the experiments in controlled environment growth chambers. One day before the experiment, the pots were well watered, allowed to drain to reach a field capacity, and bagged with a transparent plastic bag wrapped around the plant stem to prevent the evaporation of soil water during the evaluation of plant transpiration. In controlled growth chambers, the transpiration rate response to stable and increasing VPD is carried out; for stable VPD, the chamber was maintained at 1.2 kpa throughout the experiment, whereas, for increasing VPD or treatment, the chamber VPD was raised from 0.6 to 3.80 kPa gradually (Supplementary Table 5). Ten replications of wild-type and transgenic tobacco plants were used in both stable and increasing VPD chambers to measure the plant transpiration response throughout the day. An equal number of WT plants were also maintained in two chambers where one chamber was maintained at 1.2 kPa throughout the experiment (a low-VPD chamber), while the other had a ladder of VPD ranging from 0.69 to 3.8 kPa (a high-VPD chamber) with the VPD stress imposed as described earlier (Reddy et al., 2017, 2021) (Supplementary Table 5). Within each VPD level, the plants were weighed gravimetrically every 60 min with 0.01-g precision scales (KERN 3600-2N, Kern & Sohn GmbH, Balingen, Germany) to derive transpiration values from consecutive weighing. Between successive VPD levels, a 15-min transition was allowed to gradually increase the VPD to the next level. A data logger (Lascar Electronics Inc., United Kingdom) was positioned within the plant canopies in the growth chamber for regular records of air temperature and relative humidity throughout the measurement period. At the end of the VPD ladder (3.8 kPa at 03:00 pm), root and leaf samples were collected from low- (1.2 kPa) and high-VPD chambers (3.8 kPa), frozen immediately in liquid nitrogen, and stored at −80°C for RNA isolation. The plants were harvested at the end of transpiration measurement. The leaf area was measured by a leaf area meter (LI-3100C area meter, LI-COR®Biosciences, United States). At the end of the VPD experiment, shoots from low- and high-VPD chambers were cut using a razor blade. The root exudate (xylem sap) was collected for 45 min using pre-weighed Eppendorf® cones stuffed with tissue paper (Kimtech Science, Ontario, United States). The root exudation rate was calculated by normalizing the amount of sap exuded by the root surface area and time. The root surface area (cm2) and root volume (cm3) were calculated by scanning the roots with Shimadzu scanner and analyzing with Winrhizo software (Winrhizo, Regent Ltd., Canada).
Progressive drought stress was imposed on 45-day-old tobacco plants according to Kholová et al. (2010a). From the nine well-watered (WW) replicate pots, six were used for physiological measurements and three for qRT-PCR analysis. The plants from WW pots were maintained by daily re-watering up to an 80% field capacity by bringing pot weight to 100 g below the field capacity weight. For water stress (WS) treatment, 12 pots were exposed to the soil moisture stress, from which nine were kept for physiological measurements and three used for collecting tissue samples for gene expression analysis. For WS, the plants were partially compensated for transpiration, i.e., the plants were allowed to lose no more than 50-g water each day, and any transpiration loss of over 50 g was added back to the pots as described earlier (Vadez and Sinclair, 2001) to allow for progressive development of water-deficit over a 2-week period to measure parameters like normalized transpiration ratio (NTR) and fraction of transpirable soil water (FTSW) (Kholová et al., 2010a). When the NTR value of the test plants neared 0.1, which was an indication of WS (pots reached 10% water content), leaves, as well as root tissues, were collected and snap frozen in liquid nitrogen and stored at −80°C until RNA extraction.
The plants grown in a glasshouse for 45 days were exposed to heat stress at 40°C for 4 h and RH of 35%. Other set of plants was kept in control conditions in the growth chamber (28°C and 70% RH). Transpiration in both heat-stressed and control-chamber-grown plants was measured by weighing the pots before and after heat stress treatments. In addition, thermal images (infra-red) were taken in both heat-stressed and control plants in the chamber using infrared (IR) FlexCam S (Infrared Solutions, Plymouth, MN, United States) with a sensitivity of 0.09°C with an accuracy of ± 2%. SmartView 2.1.0.10 software (Fluke Thermography Everett, WA, United States) was used for the analysis of thermal images and estimation of canopy temperatures (Zaman-Allah et al., 2011a; Sivasakthi et al., 2017b). Leaf and root tissues from the control and heat stressed plants were collected, snap frozen in liquid nitrogen, and stored at −80°C for RNA extraction.
One set of 45-day-old plants was exposed to 4°C for 4 h in the cold room, while the other set of plants was maintained in a growth chamber (28°C and 70% RH) as controls. Transpiration in both cold-stressed and control plants was measured before and after stress treatment. Leaf and root tissues from the control and cold-stressed plants were collected, snap frozen in liquid nitrogen, and preserved at −80°C for RNA extraction.
Total RNA was isolated from pearl millet plants (VPD sensitive and insensitive genotypes treated with high VPD and progressive drought stress) and transgenic tobacco plants (control and treated) using 100 mg of tissue with RNeasy Plant Mini kit (Qiagen, Germany). The quantity and the quality of RNA were analyzed using a NanoVue plus spectrophotometer (GE Health Care, United States) and the ratio of the absorbance measured at 260 and 280 nm (260/280) of the samples ranging from 1.8 to 2. The integrity of the RNA was further verified through denaturing 1.4% agarose gel and Bioanalyzer. The total RNA isolated from control and treated samples was diluted to 30 ng/μl concentrations for the direct use in qRT-PCR reactions performed in the optical 96-well plates on a Realplex (Eppendorf, Germany). Reactions were performed in a total volume of 10 μl, containing 1 μl of RNA (30 ng), 400 nM of each primer, 5 μl of 2 × one step SYBR RT-PCR buffer 4 (Takara, Japan), and 0.5 μl of Prime Script One Step Enzyme Mix 2 (Takara, Japan), and final volume made up to 10 μl with RNase-free H2O. qRT-PCR reactions of all the samples were carried out by following a standard thermal profile: 42°C for 5 min and 95°C for 10 s (reverse transcription), followed by 40 cycles of 15 s at 95°C, 15 s at 62°C with a fluorescent signal recording and 15 s at 72°C. Amplicon dissociation curves were recorded after 40 cycles by heating from 58 to 95°C with fluorescence measured within 20 min. The experiments were independently repeated three times, and the data from these experiments were averaged. The relative expression levels of PgAQP genes in response to high VPD and progressive drought stress in Tr contrasting genotypes were estimated using qBase software (Hellemans et al., 2007) by normalizing with corresponding control samples as well as with reference genes (Reddy et al., 2015b). Relative expression levels of the PgPIP2;6 gene in response to different tissues of transgenic tobacco and abiotic stress treatments were estimated using the 2–ΔΔCt method (Livak and Schmittgen, 2001) by normalizing with L25 and EF-1 alpha reference genes (Schmidt and Delaney, 2010).
Transpiration response to increasing VPD (a high-VPD chamber) was analyzed with non-linear regression of Graph pad Prism version 6 (Graph Pad software, Inc., CA, United States), which provides r2, a break point, and slope values. For the progressive drought stress experiment, the relationship between NTR and FTSW was analyzed with non-linear regression of Graph pad Prism version 6 (Graph pad software, Inc., CA, United States), which provides breakpoint values (Kholová et al., 2010b). Software SmartView 2.1.0.10 (Fluke Thermography) was used for analysis of the thermal images and the estimation of canopy temperatures (Zaman-Allah et al., 2011a). CTD was calculated as the difference between the air temperature (T) and leaf temperature (CTD = T air – T leaf). The relative expression of the PgPIP2;6 gene under different abiotic stresses was analyzed according to Livak and Schmittgen (2001). All the data from stress experiments (VPD, drought, heat, cold) and relative expressions were analyzed with statistical program package CoStat version 6.204 (Cohort Software, Monterey, CA, United States). One-way ANOVA was carried out to test for genotypic difference among the transgenic events and WT. The means were compared using Tukey-Kramer test and least significant difference (LSD) (at p ≤ 0.05).
A phylogeny of AQPs was carried out to understand the evolutionary relationships among pearl millet AQPs within Pennisetum and with that of sorghum, maize, and rice (Figure 1A and Supplementary Figure 1). PgAQP’s were grouped into four major subfamilies based on their conserved and high similarity index, including PgPIPs, PgTIPs, PgNIPs, and PgSIPs (Figure 1A). A total of 34 PgAQP genes were identified in pearl millet and named based on their relationship with their counterparts in the related species (Table 1 and Supplementary Figure 1). Among all classes, the PgPIP subfamily occupied the highest number of AQP genes with 11 members. Exon/intron structure displayed a range of 1–19 (PgSIP2;1) introns, the highest number present in the PgNIP subfamily and the lowest in the PgTIP subfamily (Table 1 and Figure 1B). The identified AQPs were distributed on six chromosomes of pearl millet. Of the 34, 3 were located on Chromosome 1,7 on 2,15 on 3,5 on 4, 2 on 5, and 1 on 6. While Chromosome 3 was the hot spot with a maximum number of AQP genes with most PIPs and TIPs, Chromosome 7 did not show any AQP genes (Table 1). PgAQPs ORFs ranged from 636 bp (PgPIP2;8) to 2,823 bp (PgNIP4;1) with an average size of 528 bp. PgAQP proteins consisted of amino acids, ranging from 211 (PgPIP2;8) to 940 (PgNIP4;1), majority of them being basic, where the pI values varied between 4.9 (PgNIP1;4) and 9.7 (PgPIP2;2). The MWs ranged from 21K Da to 99.79K Da with an instability index varying from 20.68 (PgTIP2;2) to 41.75 (PgNIP4;1), which was the only unstable one. The GRAVY values indicated that most of them were hydrophobic except PgSIP2;1, the only hydrophilic AQP, and all exhibiting the highest aliphatic index (Table 1). Most of the PgAQPs showed the presence of serine, threonine, and tyrosine, where serine was the most dominating phosphorylation site (Supplementary Table 1). The highest number of serine residues was observed in the PgNIP subfamily, followed by PIPs and TIPs. Protein kinase C (PKC) and an unspecific kinase were the major types present in all the proteins. The common kinases in all subfamilies were next to PKC, cdc2, PKA, CDK1, DNAPK, P38MAPK, and PKG (Supplementary Table 1). Localization of PgAQPs indicated that, while they were abundant in the plasma membranes with an average of six transmembrane helices, only NIP3 subfamily members were found in the vacuole (Table 1). Motif organization of the four subfamilies of PgAQP was deduced by submitting protein sequences to MEME13. A total of 10 conserved motif sequences were identified in 34 PgAQP proteins, showing group-specific distribution. Motifs 1 and 5 were the most conserved across all PgAQPs subfamilies positioned at C-terminus (Supplementary Figure 2). While motifs 6 and 7 were conserved in all the PgTIPs and PgNIPs, motifs 2 and 8 were noticed at the PgPIP subfamily’s N-terminus and Motif 9 in TIP and NIP subfamilies. Motif 3 was common in all the groups situated in the middle (Supplementary Figures 3, 4). All PgAQP proteins had the inherent conserved NPA motif (Motifs 1 and 3) and the aromatic/arginine (ar/R) selectivity filter (Supplementary Figures 2, 3).
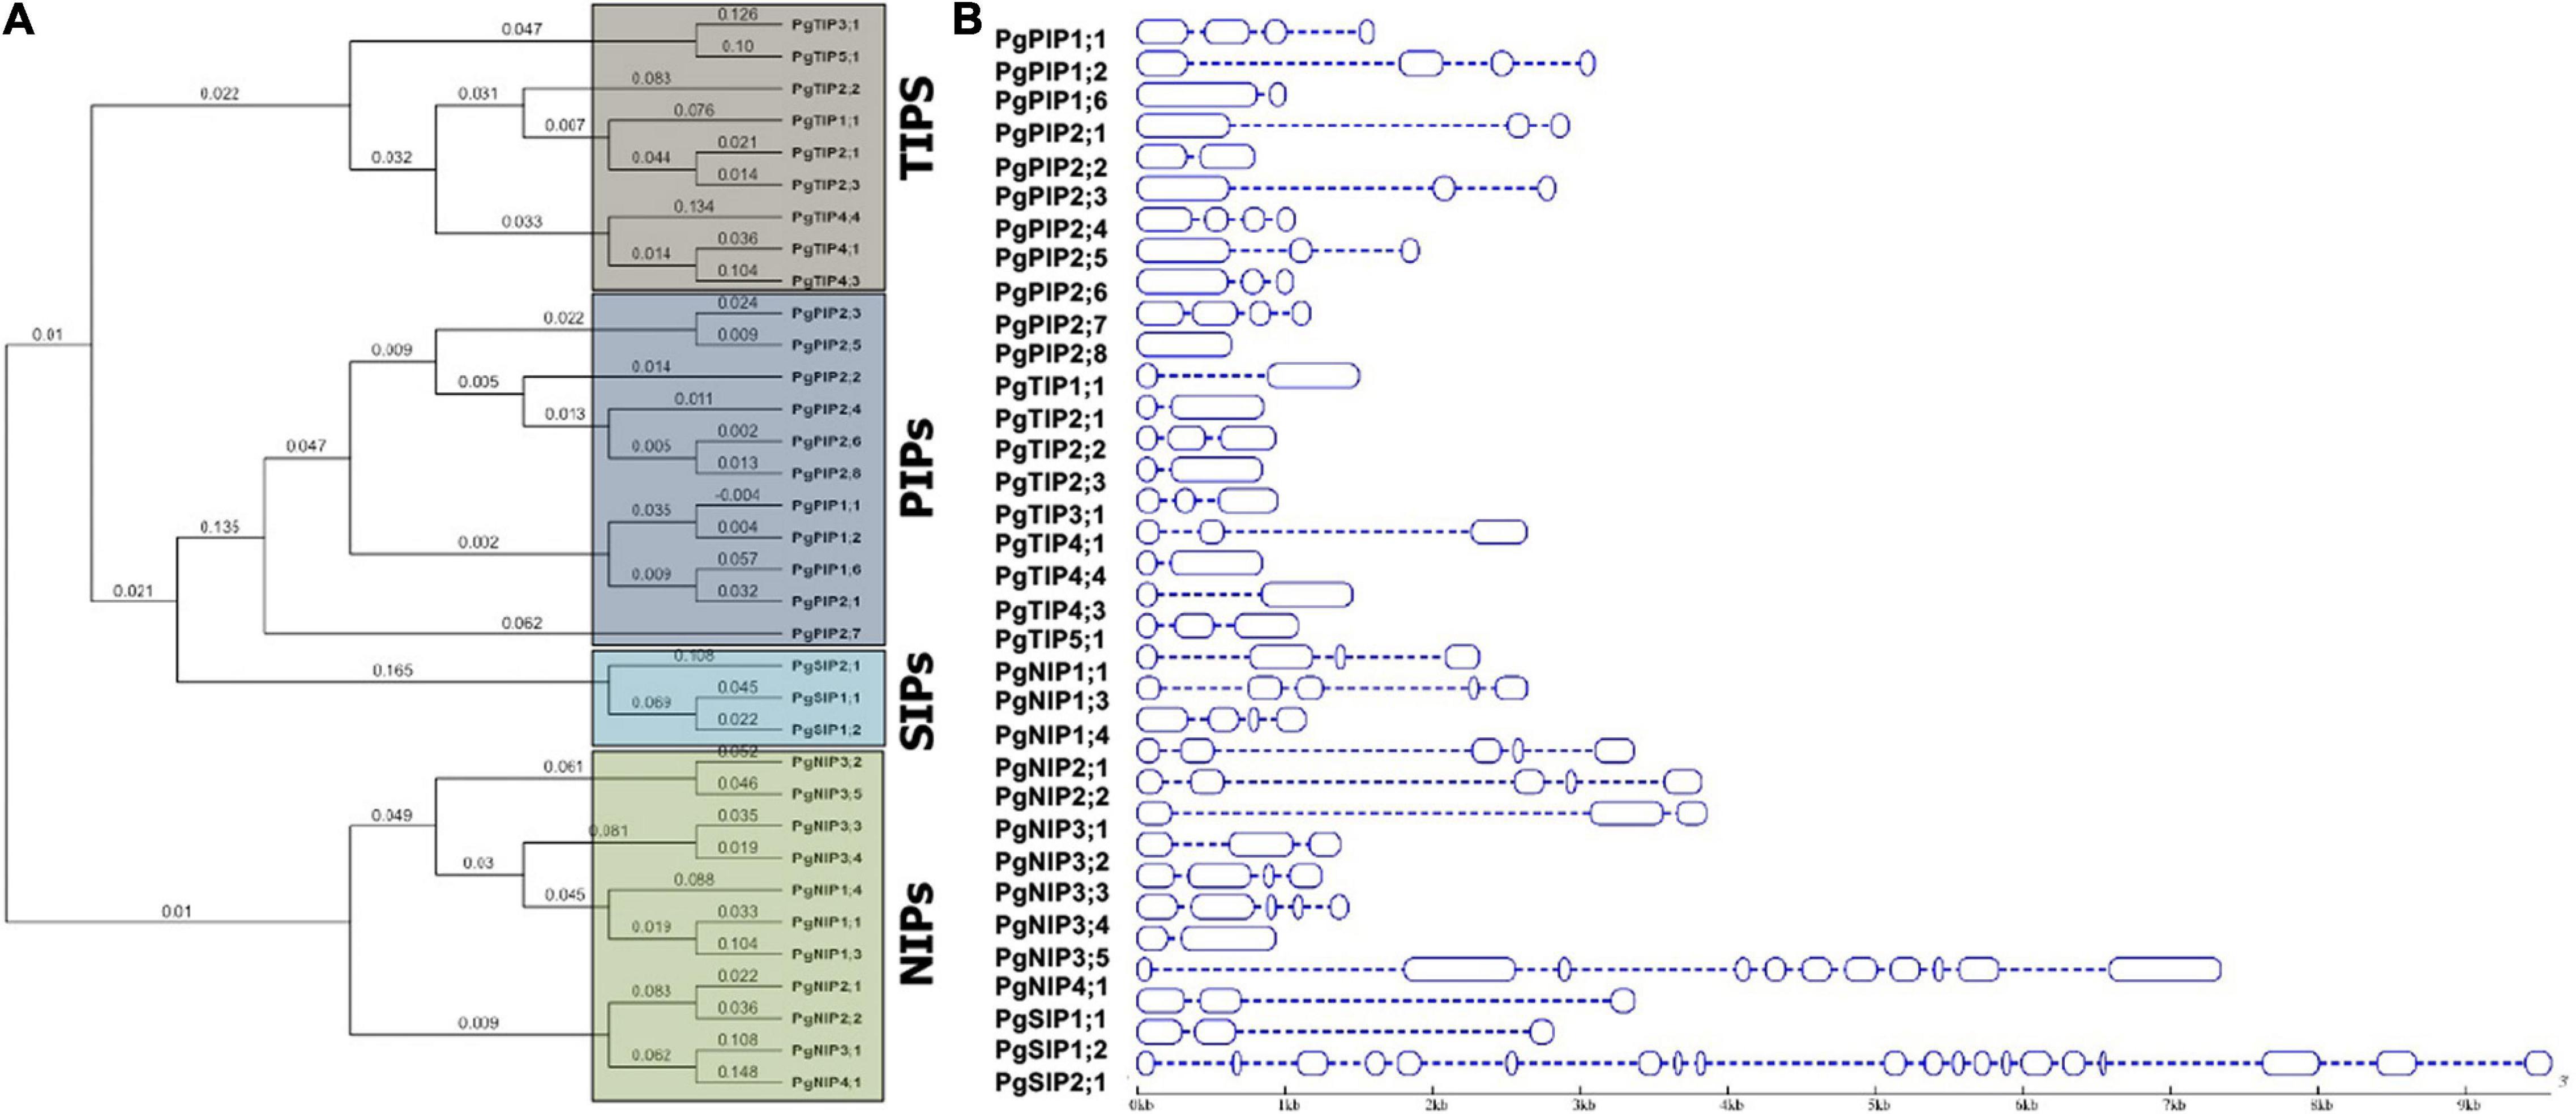
Figure 1. Characterization of pearl millet AQP proteins. (A) The phylogenetic tree was constructed using MacVector software by the NJ method. (B) Exon and intron structure of pearl millet AQP genes is indicated by blue rectangles and thin dotted lines, respectively. The scale bar indicates nucleotide size length in the base pairs.
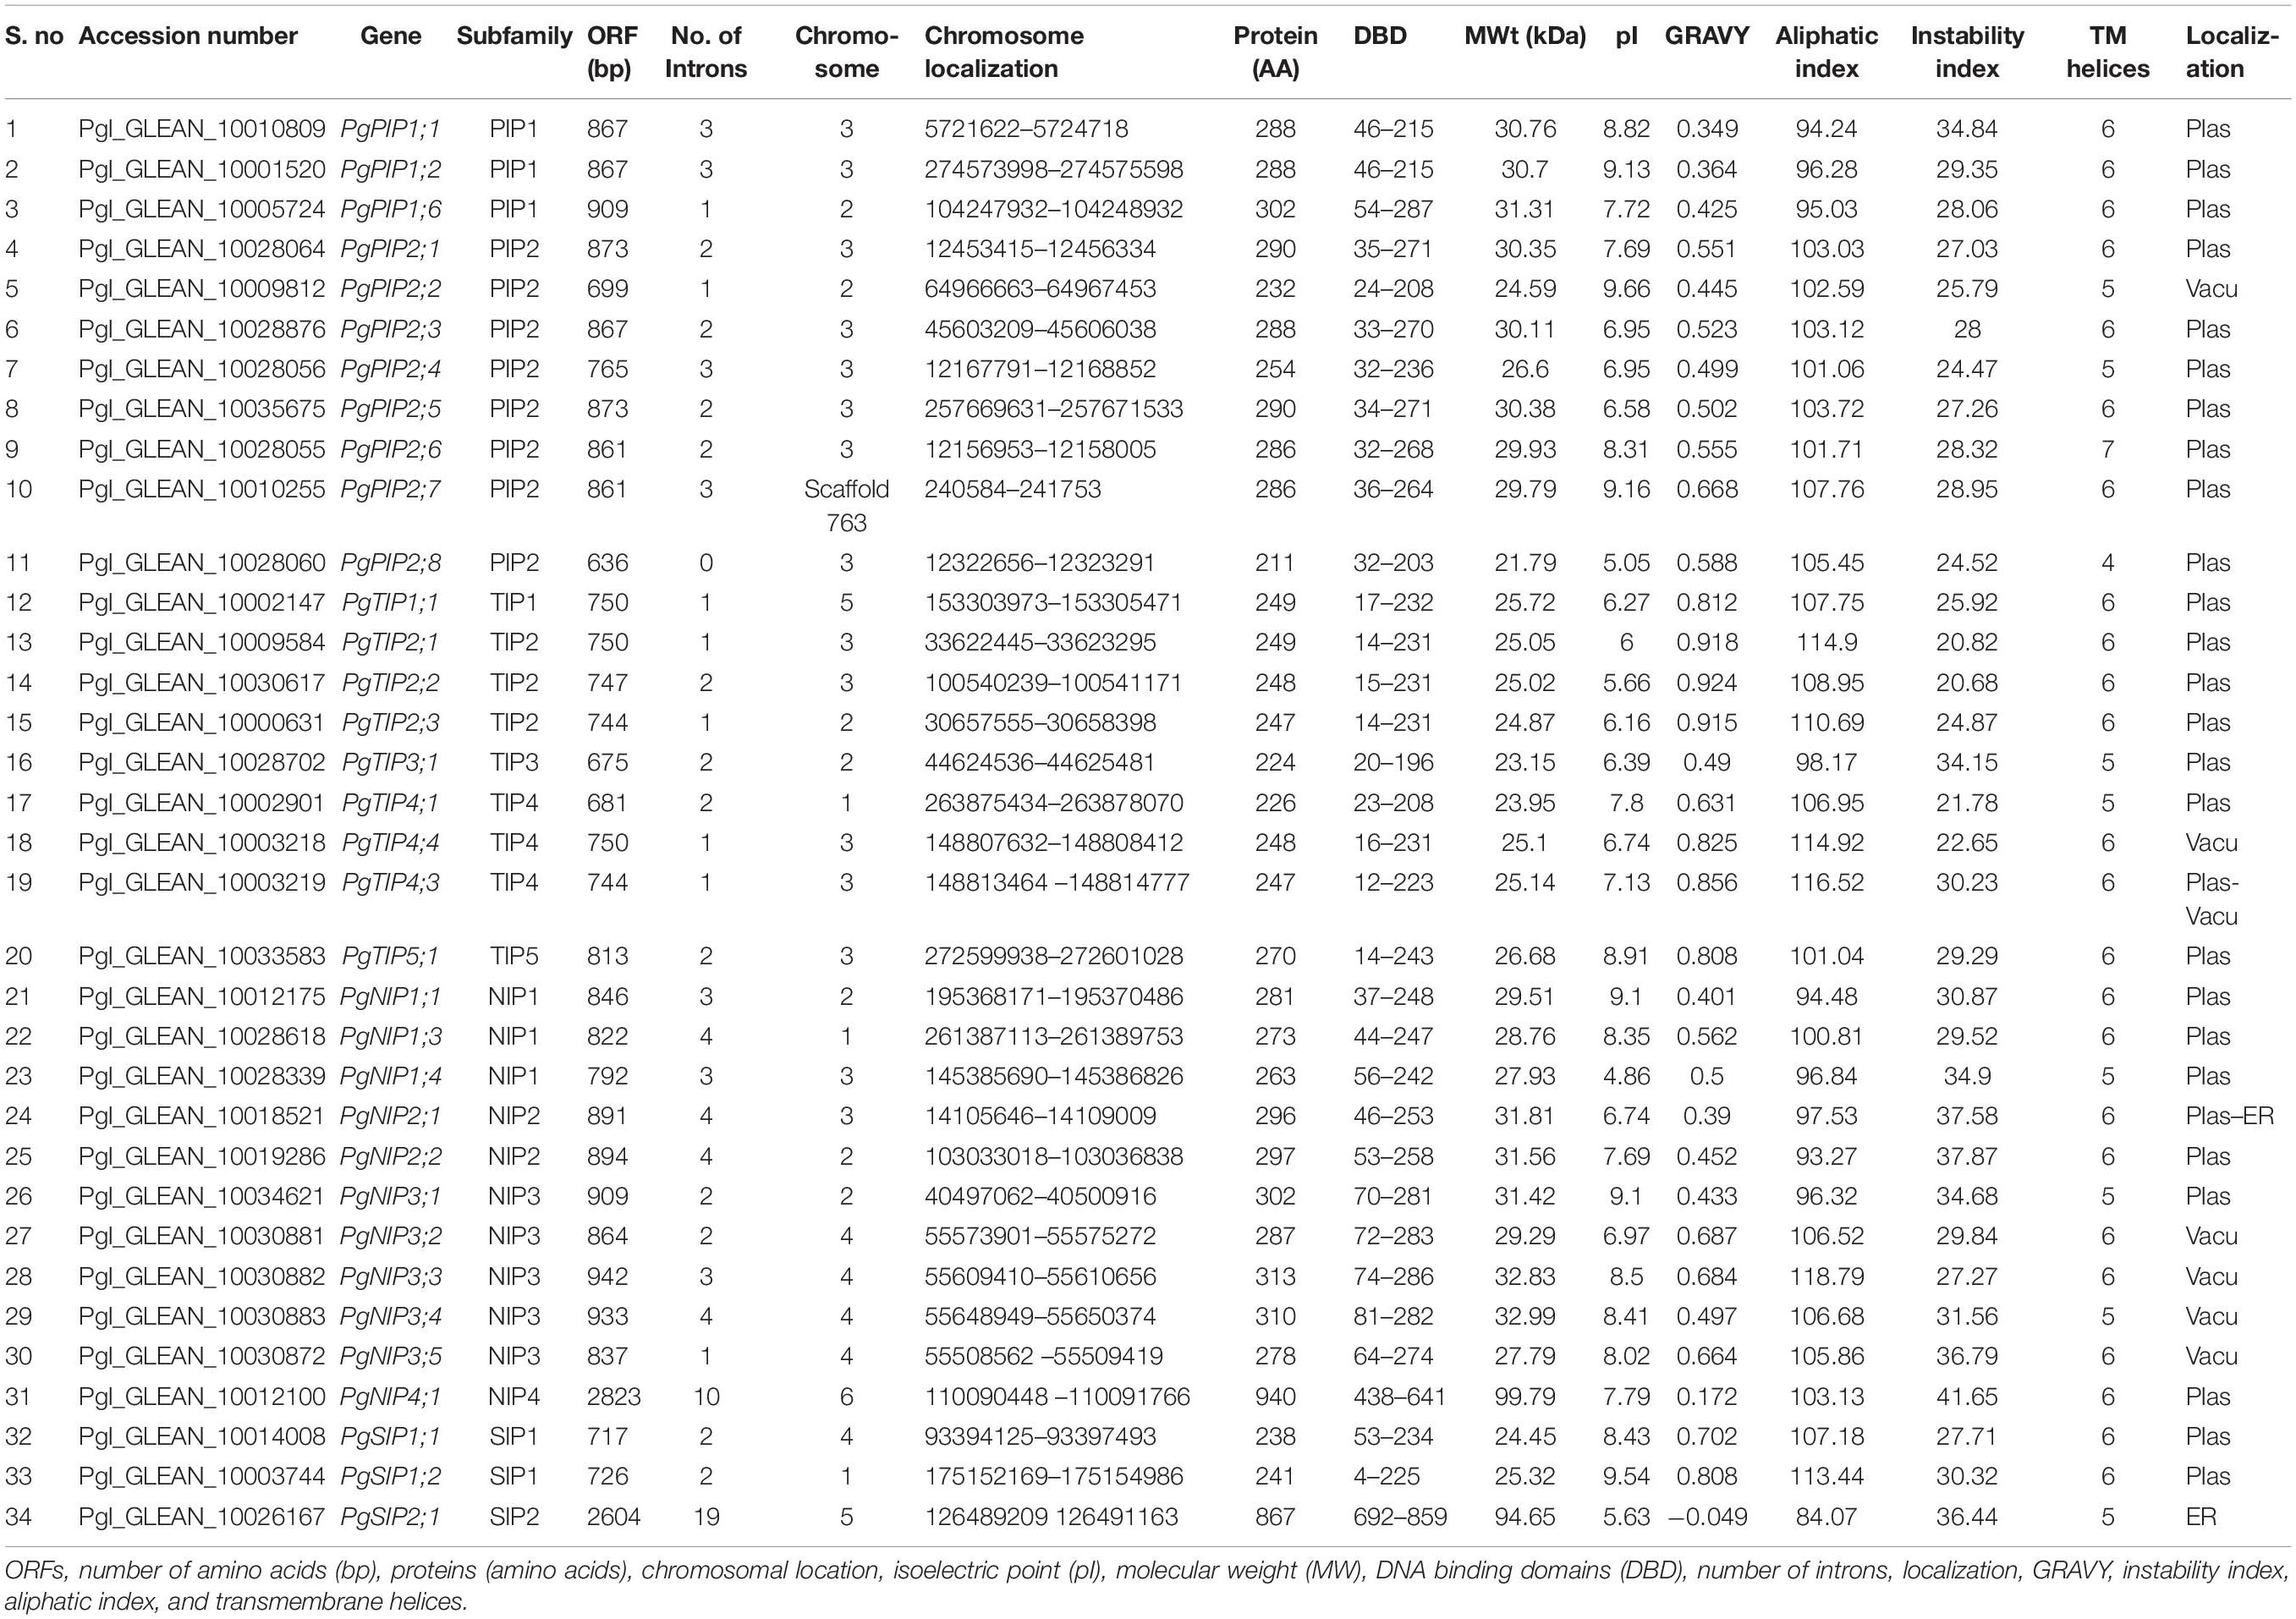
Table 1. Physico-chemical characteristics of PgAQPs.
A total of 13 paralogs were identified where five were from NIPs, four from PIPs, three from TIPs, and one from SIP. The paralog’s duplication events were grouped into regional and segmental gene duplications based on their chromosomal localization and phylogenetic analysis. Of the 13 events, five were regional duplications; PgPIP1;1/PgPIP1;2, PIP2;3/PIP2;5, and PIP2;6/PIP2;8 were noticed on Chromosome 3 and NIP3;2/NIP3;5, and NIP3;3/NIP3;4 on Chromosome 4. The remaining eight were segmental duplication events (Supplementary Table 1). Furthermore, among the non-synonymous to synonymous substitutions, out of 13, 9 events exhibited purifying/stabilizing selection (<1), while the remaining four were positive/Darwinian selection (>1). The evolutionary relationship of the pearl millet with others showed a class-specific, group-specific relationship (Supplementary Table 1). Of the 12 orthologous events, six had an orthologous relationship with sorghum while three each with maize and rice. There were only three orthologous duplication events (PgPIP2:7/SbPIP2:7; PgTIP5:1/SbTIP5:1, and PgNIP3:2/SbNIP3:2) that showed positive selection, while the remaining nine events exhibited Darwinian selection pressure, purifying/stabilizing selection during evolution. While sorghum and maize showed 16 orthologous events, sorghum and rice exhibited four events, rice and maize exhibited one orthologous event (Supplementary Figure 1).
To understand the regulatory mechanism of PgAQP genes of pearl millet, cis-acting elements specific to tissue and abiotic stress within the upstream regions of PgAQP genes were identified (Supplementary Table 4). Up to seven Skn1 elements specific to endosperm expression were detected in majority of the PgAQP genes. GCN4 was another endosperm specific element present only in the PgPIP genes (PgPIP2;1, PgPIP2;2, PgPIP1;1, and PgPIP1;2). CAT-box and CCGTCC-box related to meristem expression were noticed in the promoter regions of all the PgAQP genes. Along with tissue-specific cis-elements, several abiotic stress-inducible cis-elements were detected in the promoter regions of the PgAQP genes. HSE cis-element involved in heat stress was observed in the promoter regions of 6 PgAQP genes (PgPIP1;1, PgPIP2;1, PgTIP1;1, PgTIP2;2, PgNIP1;3, and PgNIP3;4). The cold-responsive LTR element was noticed in 11 PgAQP genes (PgPIP1;1, PgPIP1;6, PgPIP2;4, PgPIP2;7, PgPIP2;8, PgTIP2;1, PgTIP2;2, PgTIP2;3, PgTIP4;1, PgNIP3;1, and PgSIP1;1). While over 50% of the PgAQP genes had drought-inducible MBS elements, the ABRE cis-acting element involved in the abscisic acid (ABA)-inducibility was detected in the promoter regions of 15 PgAQP genes. The TCA cis-element involved in salicylic acid responsiveness was noticed in the promoter regions of the four PgAQP genes. CGTCA and TGACG-motifs involved in the MeJA responsiveness were recognized in most of the upstream regions of PgAQP genes. Several core promoter regions were observed in PgAQP promoters, including TATA-box, CCAAT-motif, and TC-rich repeats (Supplementary Table 4).
The expression profiling of PgAQPs was investigated among VPD-insensitive - ICMR 1122 and VPD-sensitive - ICMR 1152 genotypes in leaf and root tissues under progressive drought and high-VPD stresses using qRT-PCR. To understand the function of AQP genes in drought stress adaptation/tolerance of pearl millet, progressive drought stress was imposed in pearl millet genotypes (ICMR 1122 and ICMR 1152), contrasting for transpiration rate response to increasing VPD. Many PgAQP genes showed upregulation in both leaf and root tissues upon drought imposition (Figure 2A). PgPIP2;6 of ICMR 1152 and NIP1;3 and PgNIP1;3 of ICMR 1122 exhibited the highest level of expression in leaf as well as root tissues. Similarly, drought stress caused upregulation of six PgAQP genes like PgPIP2;5, PgPIP2;6, PgNIP3;2, PgNIP3;3, PgNIP3;5, PgNIP4;1, in both the tissues of the genotype ICMR 1152. PgTIP2;3, PgPIP2;8, and the PgTIPs, such as PgNIP1;1, PgNIP1;3, PgNIP3;1, PgNIP3;2, and PgSIP1;1, were upregulated only in leaf tissues. Notably, PgPIP1;2, PgPIP2;5, PgPIP2;6, PgTIP2;3, PgTIP3;1, PgTIP4;1, PgTIP4;3, PgTIP4;4, PgNIP1;1, PgNIP1;4, PgNIP1;3, PgNIP2;2, PgNIP3;3, PgNIP3;4, PgNIP3;5, PgNIP4;1, PgSIP1;1, PgSIP1;2, and PgSIP2;1 exhibited higher expressions in root tissues of the genotype ICMR 1122. In contrast, only one gene, PgNIP3;1, showed high transcript levels in the leaf tissues of same genotype. All genes recorded higher expressions in the ICMR 1152 genotype compared to ICMR 1122. The least expression/downregulation was noticed in almost all AQPs except a few in the leaf tissues of the ICMR 1122 genotype. In summary, differential expression patterns were observed in root tissues of ICMR 1122 and leaf and root tissues of ICMR 1152 (Figure 2A).
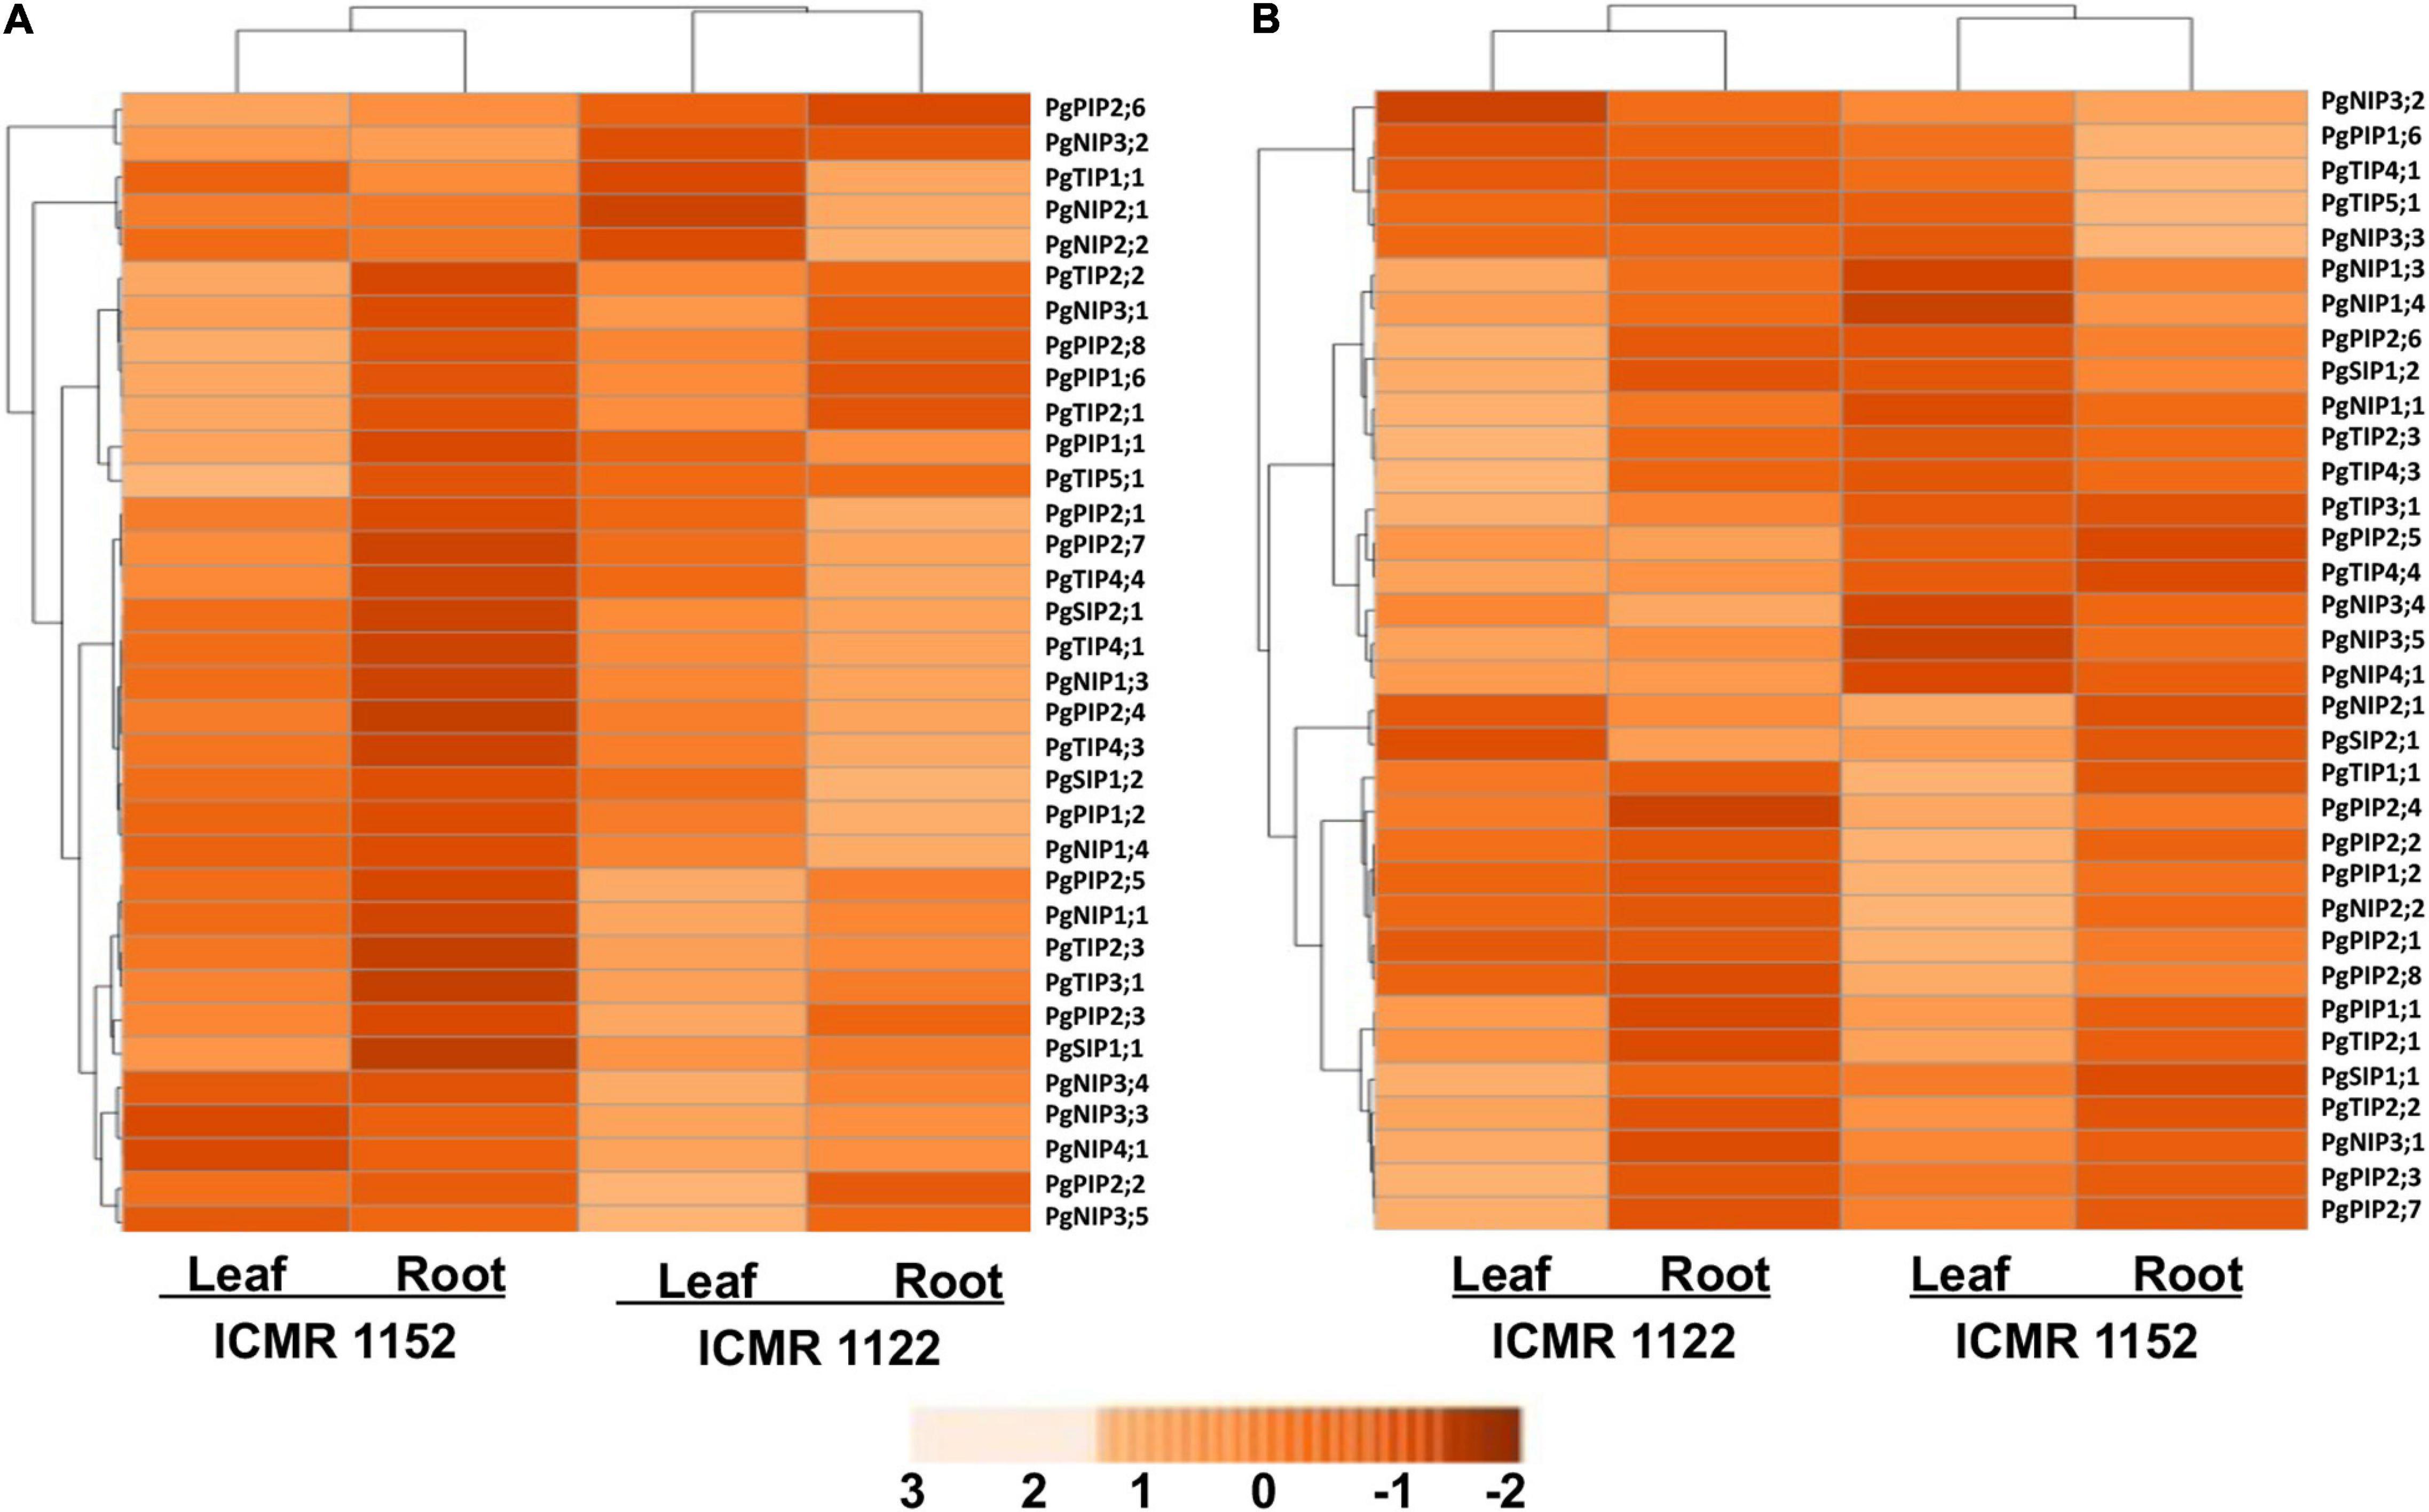
Figure 2. An expression profile of the 34 PgAQP genes in leaves and roots of VPD-sensitive and VPD-insensitive genotypes under (A) drought stress and (B) high VPD. The color bar represents normalized log2 values.
Under high-VPD conditions, PgAQP genes showed differential expressions where the AQP genes, viz., PgPIP1;6, PgPIP2;6, PgTIP4;1, PgTIP5;1, PgNIP1;1, PgNIP1;3, PgNIP1;4, PgNIP3;2, and PgNIP3;3, were upregulated in the root tissues of ICMR 1152 where expressions were highest among all the 34 tested PgAQPs. Interestingly, PgTIP3;1, PgTIP4;4, and PgNIP3;4 showed moderate or high expressions in roots and leaf tissues of ICMR 112 in comparison with ICMR 1152 (Figure 2B). Apart from these, 10 genes, namely, PgPIP1;1, PgPIP1;2, PgPIP2;2, PgPIP2;7, PgPIP2;8, PgTIP1;1, PgTIP2;1, PgTIP2;2, PgTIP4;1, and PgNIP3;2, displayed higher expression levels in the leaf tissues of ICMR 1152. Among them, PgPIP1;1; PgTIP1;1, PgTIP2;1, PgTIP2;2 and PgNIP3;2 exhibited expressions in the leaf tissues of ICMR 1122. Genes, such as PgNIP1;1, PgNIP1;3, PgNIP1;4, PgNIP3;2, PgNIP3;3, PgNIP3;4, and PgNIP5;1 exhibited significant upregulation in root tissues of both ICMR 1152 and ICMR 1122. PgTIP4;1, PgNIP1;3, and PgNIP3;3 in ICMR 1152 and PgTIP3;1, PgTIP4;4, PgNIP1;1, PgNIP1;3, and PgNIP4;1 in ICMR 1122 exhibited significant expressions in root tissues (Figure 2B). Other PgAQP genes revealed the lowest expression in both the tissues of ICMR 1122 upon high-VPD stress treatment. In general, the PgAQP genes were highly induced in root tissues than leaf tissues of both the genotypes in response to high-VPD stress.
Based on the gene expression profile, the gene PgPIP2;6 was cloned into the pMDC100 vector under the control of CaMV35S promoter using the Gateway-cloning system. Plant expression cassette harboring CaMV35sP-PgPIP2;6-NosT (Figure 3) was transformed into tobacco and the putative transgenic plants confirmed by PCR with CaMV35S trans_F - PgPIP2;6 trans_R and nptII F- nptII R primers for integration of the transgenes. Out of the 41 T0 transgenic plants, nine events in T1 were PCR positive that were analyzed through Mendelian segregation, and three T2 transgenic events (E 1–20, E 11–10, and E 28–9) were selected for further analysis.
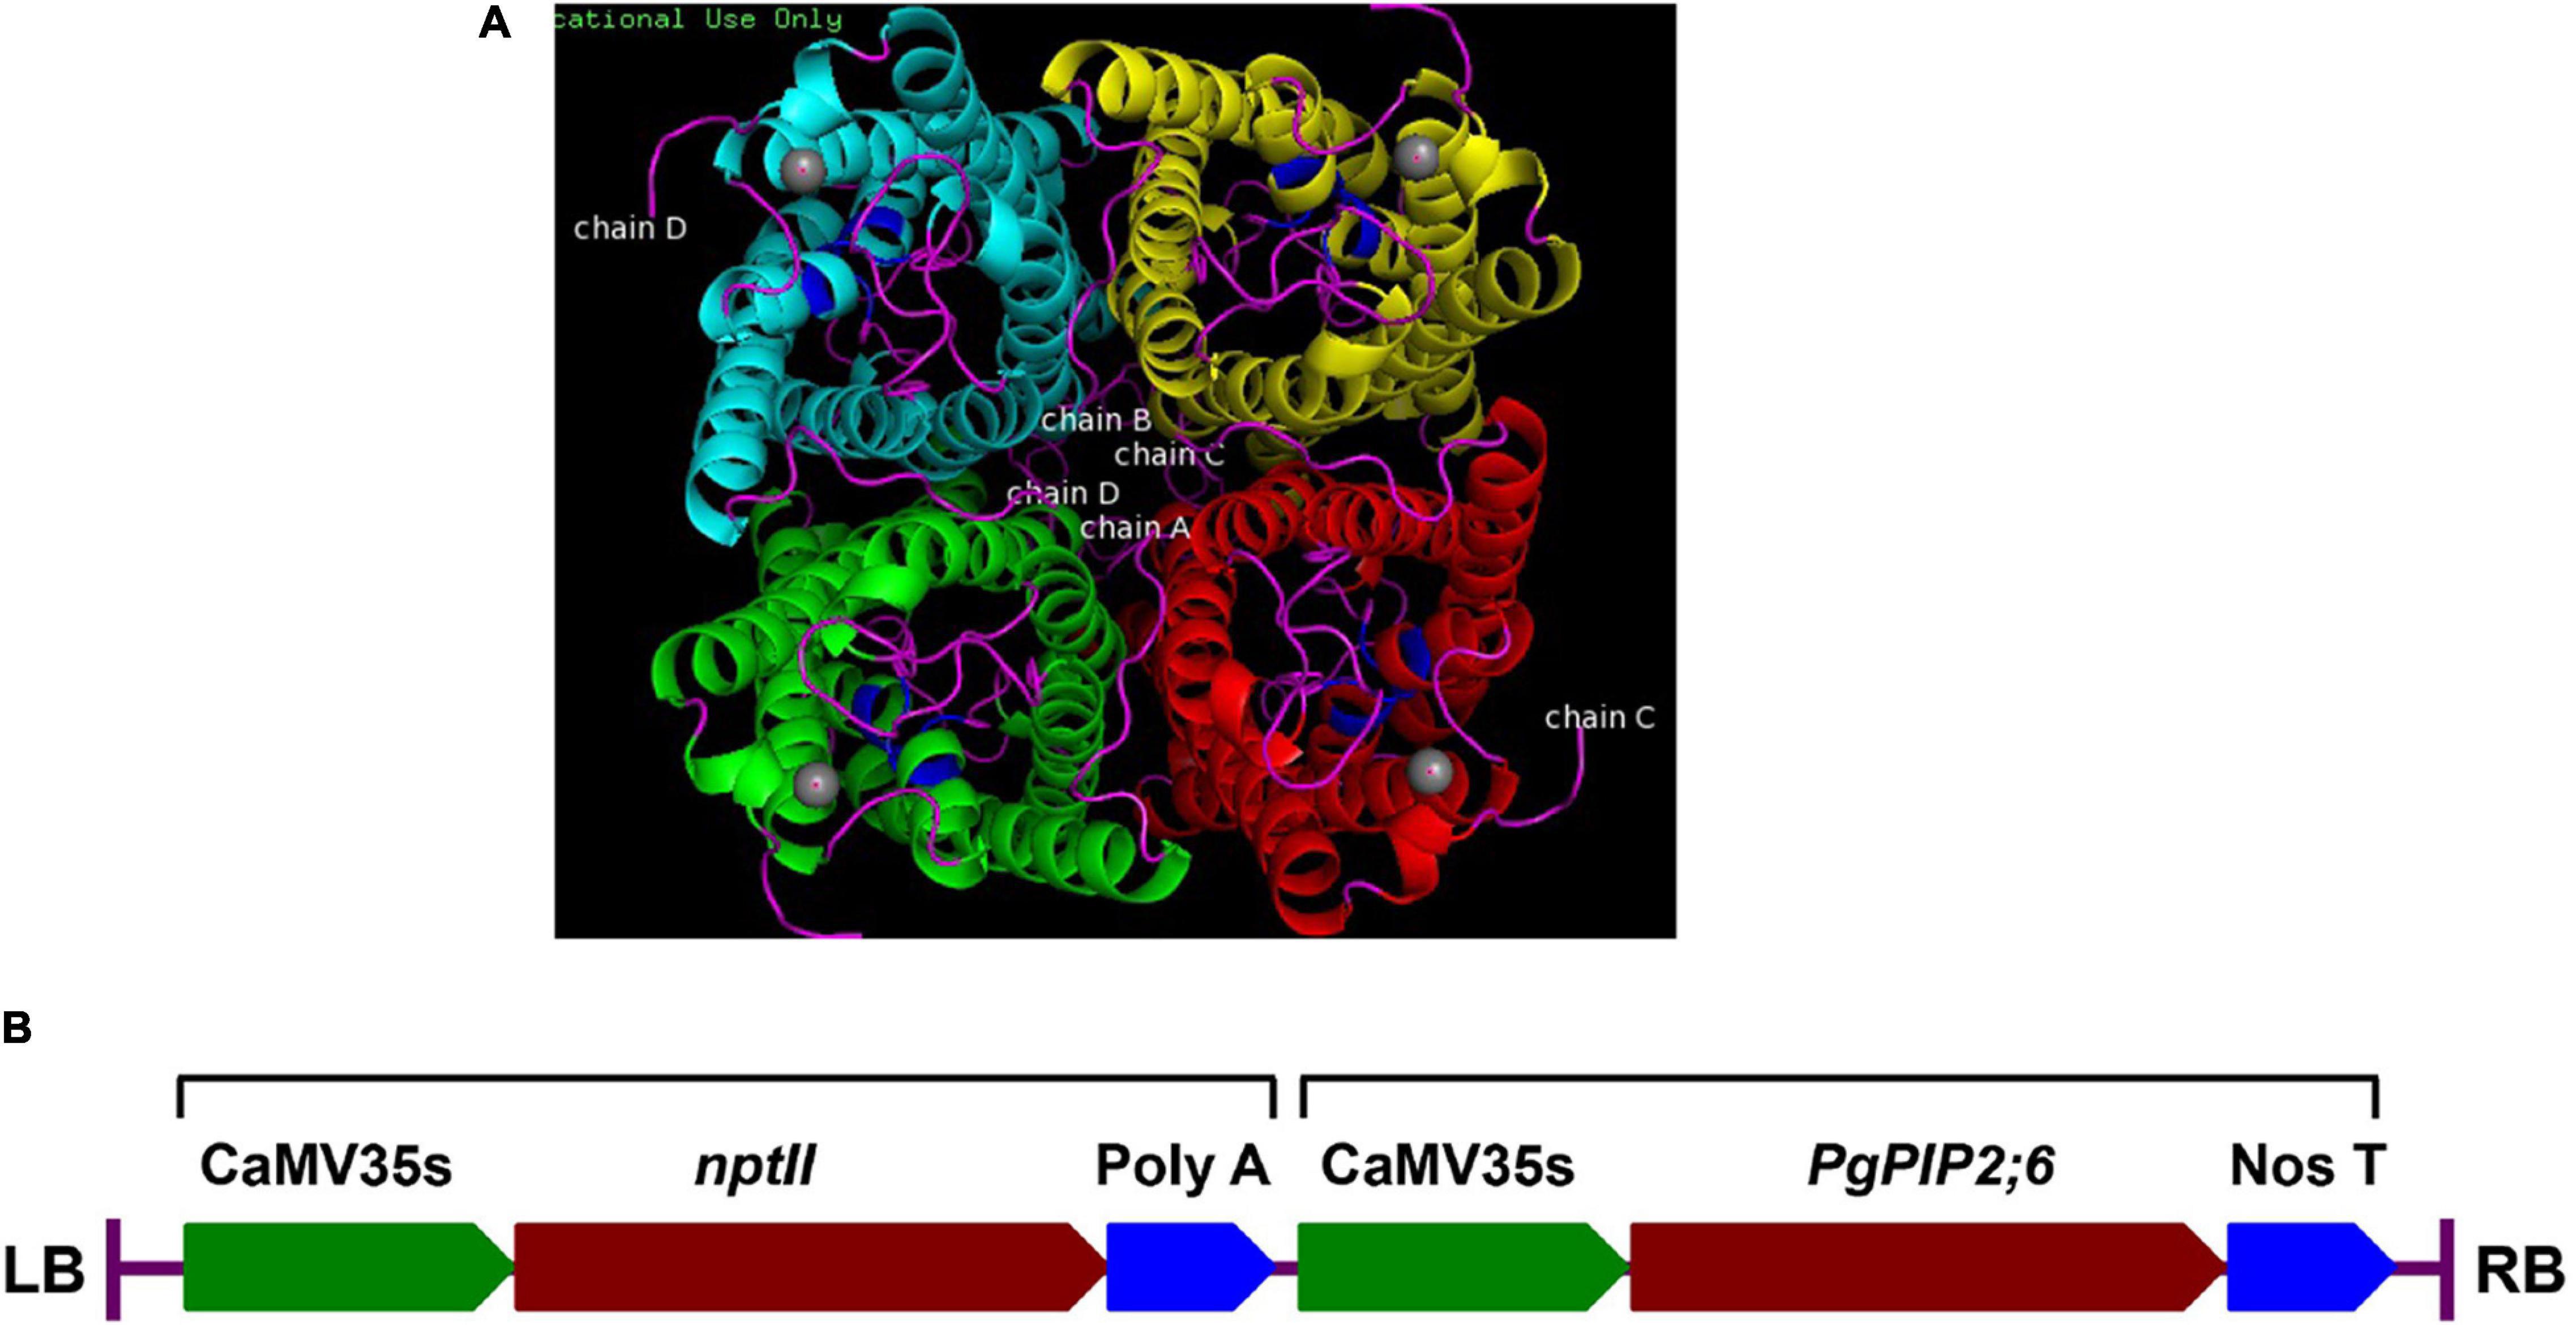
Figure 3. Characterization of the pearl millet PgPIP2;6 gene. (A) The 3D model of PgPIP2;6 protein built by using homology based in silico modeling. Aquaporin PgPIP2;6 is incorporated into the membranes in a tetrameric arrangement, comprising four individual pores. The protein structure has classical aquaporin structure with conserved NPA motif regions, which are highlighted in blue. The ligand of the protein binds to the protein near the NPA motifs. Ligand (Cadmium ion) is highlighted in gray spheres. (B) Schematic representation of the T-DNA region of the plant transformation vector (pMDC100), showing the two expression cassettes for nptII and PgPIP2;6 genes. RB, right border; 35SP, CaMV35s promoter; PgPIP2;6, pearl millet plasma intrinsic protein 2;6 gene; nptII, neomycin phosphotransferase gene; NosT, Nos terminator; LB, left border.
Transpiration rate (Tr) was gradually increased under a ladder or a high-VPD (0.6–3.8 kPa) chamber in both transgenic as well as WT plants (Figure 4A). By contrast, Tr was stable or parallel response in a low-VPD (1.2 kPa) chamber in both transgenic and WT plants (data not shown). Under high-VPD conditions, while Tr increased in all the tested genotypes, the slope of Tr decreased beyond the VPD breakpoint (2.4 kPa), thereby indicating limited transpiration response in most of the genotypes (Figure 4A). WT plants displayed higher Tr than the transgenic events (except in the transgenic event E 1–20). Transgenic events, such as E 11–10 and E 28–9, showed lower Tr at high VPD, indicating that they might have water-conserving character. Water conservation mechanisms were highly expressed under high evaporative demand. Mean Tr comparison between transgenic and WT plants in low-VPD and high-VPD-chamber conditions displayed statistically significant genotypic differences at p ≤ 0.05 (Figure 4B and Table 2). The root exudation rate was slightly higher when exposed to high VPD than in the low-VPD-exposed plants. Under low- and high-VPD (1.2 and 3.8 kPa) conditions, transgenic plants exhibited slightly lower root exudation rates than WT plants (Figure 4C), thereby implying lower Tr.
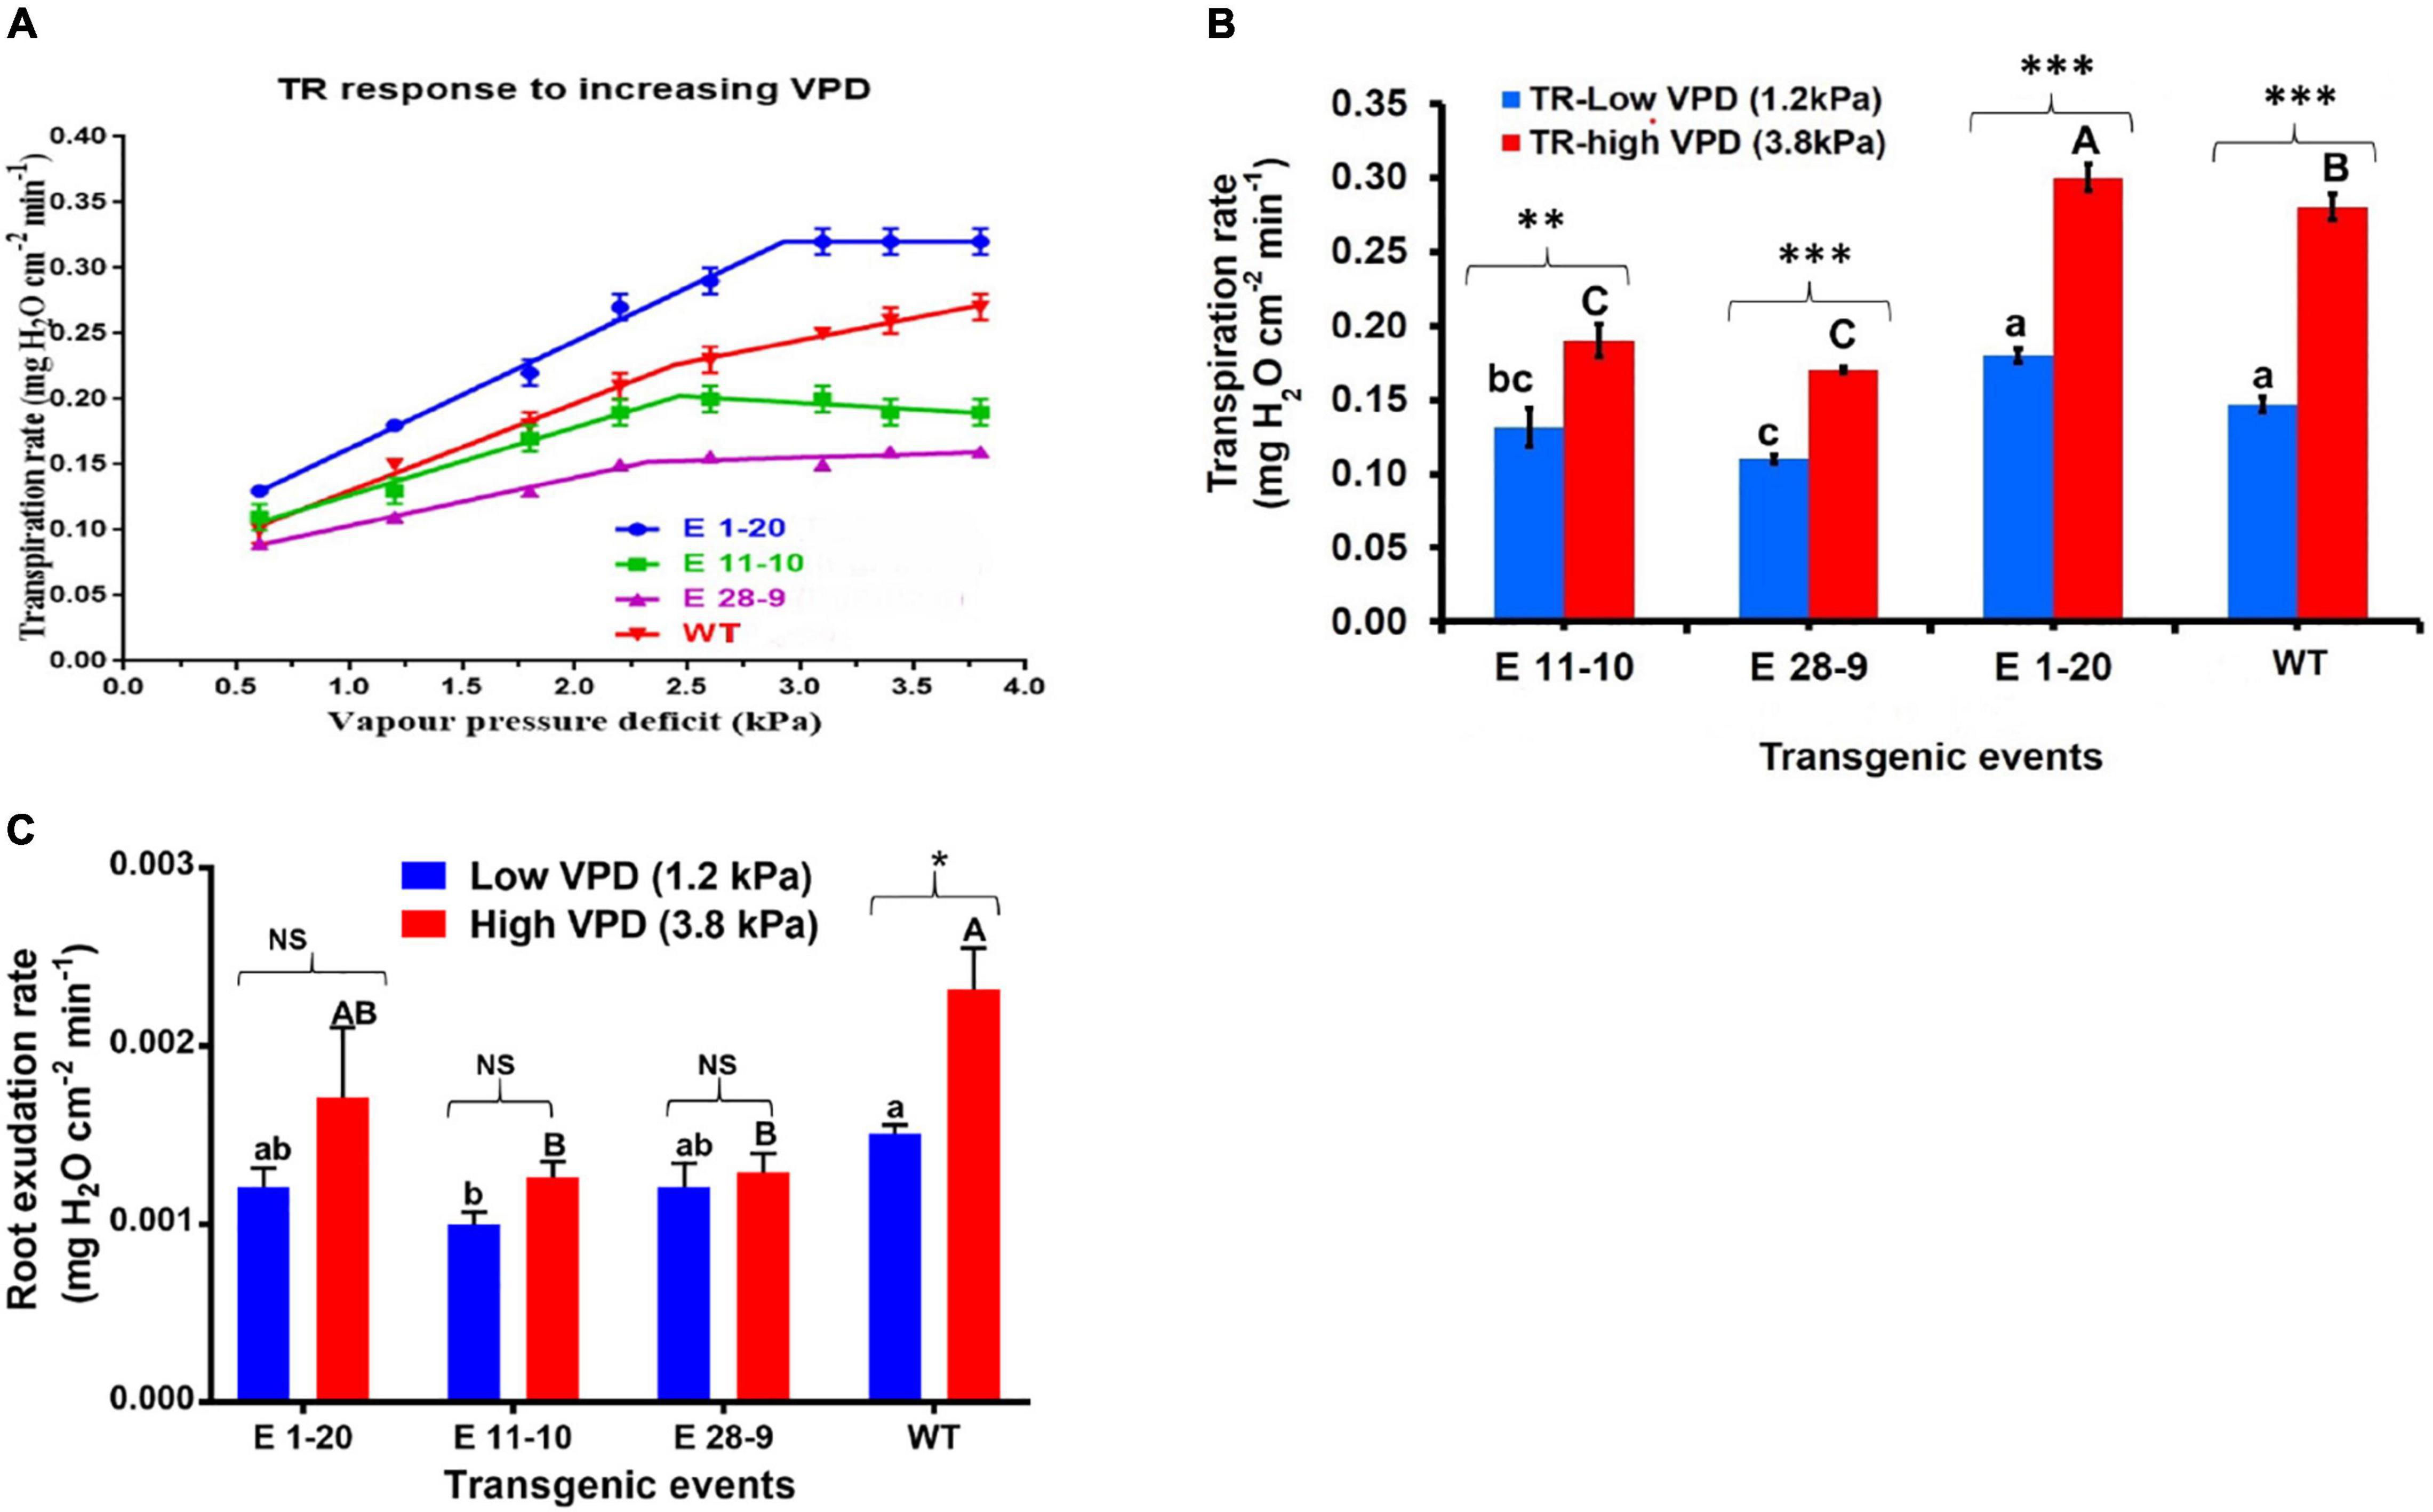
Figure 4. Performance of the transgenic and non-transgenic WT plants under stable and increasing VPD conditions. (A) Tr response to increasing VPD conditions in PgPIP2;6 transgenic and WT tobacco plants. A plot of transpiration rates against VPD for three transgenic tobacco lines [E 1–20 (the blue-color line); E 11–10 (the green-color line); E 28–9 (the pink-color line)] and WT (the red-color line) plants. Compared to WT, transgenic events (except E 1–20) showed limited Tr under high-VPD conditions. Each data point represents means (± SE) six replicates. (B) Mean Tr of PgPIP2;6 transgenic and WT plants under low-VPD and high-VPD conditions. The bars with blue color represent low-VPD (1.2 kPa) Tr, and bars with red color represent high-VPD (3.8 kPa) Tr. Data represent means (± SE) six replicates, and means were analyzed by the Tukey–Kramer test. The “P” indicates the probability of a difference among the transgenic events and WT plants in low and high VPD. Bars with different capital letters and small letters indicate significantly different at P ≤ 0.05 in high-VPD and low-VPD conditions. The asterisks indicate the significant difference at P ≤ 0.05 between low- and high-VPD treatments. “Bars with asterisk ** and *** symbols are significantly different at P < 0.01, P < 0.001 between low VPD and high VPD stress treatment. (C) The root exudation rate of transgenic and WT tobacco plants subjected to low (1.2 kPa) and high-(3.8 kPa) VPD stress. The exudation rate was calculated by sampling the root sap. Data were analyzed by the Tukey-Kramer test. Values represent means ± SE (n = 6). Bars with different capital letters and small letters indicate significantly different at P ≤ 0.05 in high VPD and low VPD conditions. Bars with asterisk * symbol is significantly different at P < 0.05, between low and high VPD exudation. Bars with NS indicate that both low and high VPD root exudation are statistically non-significant.
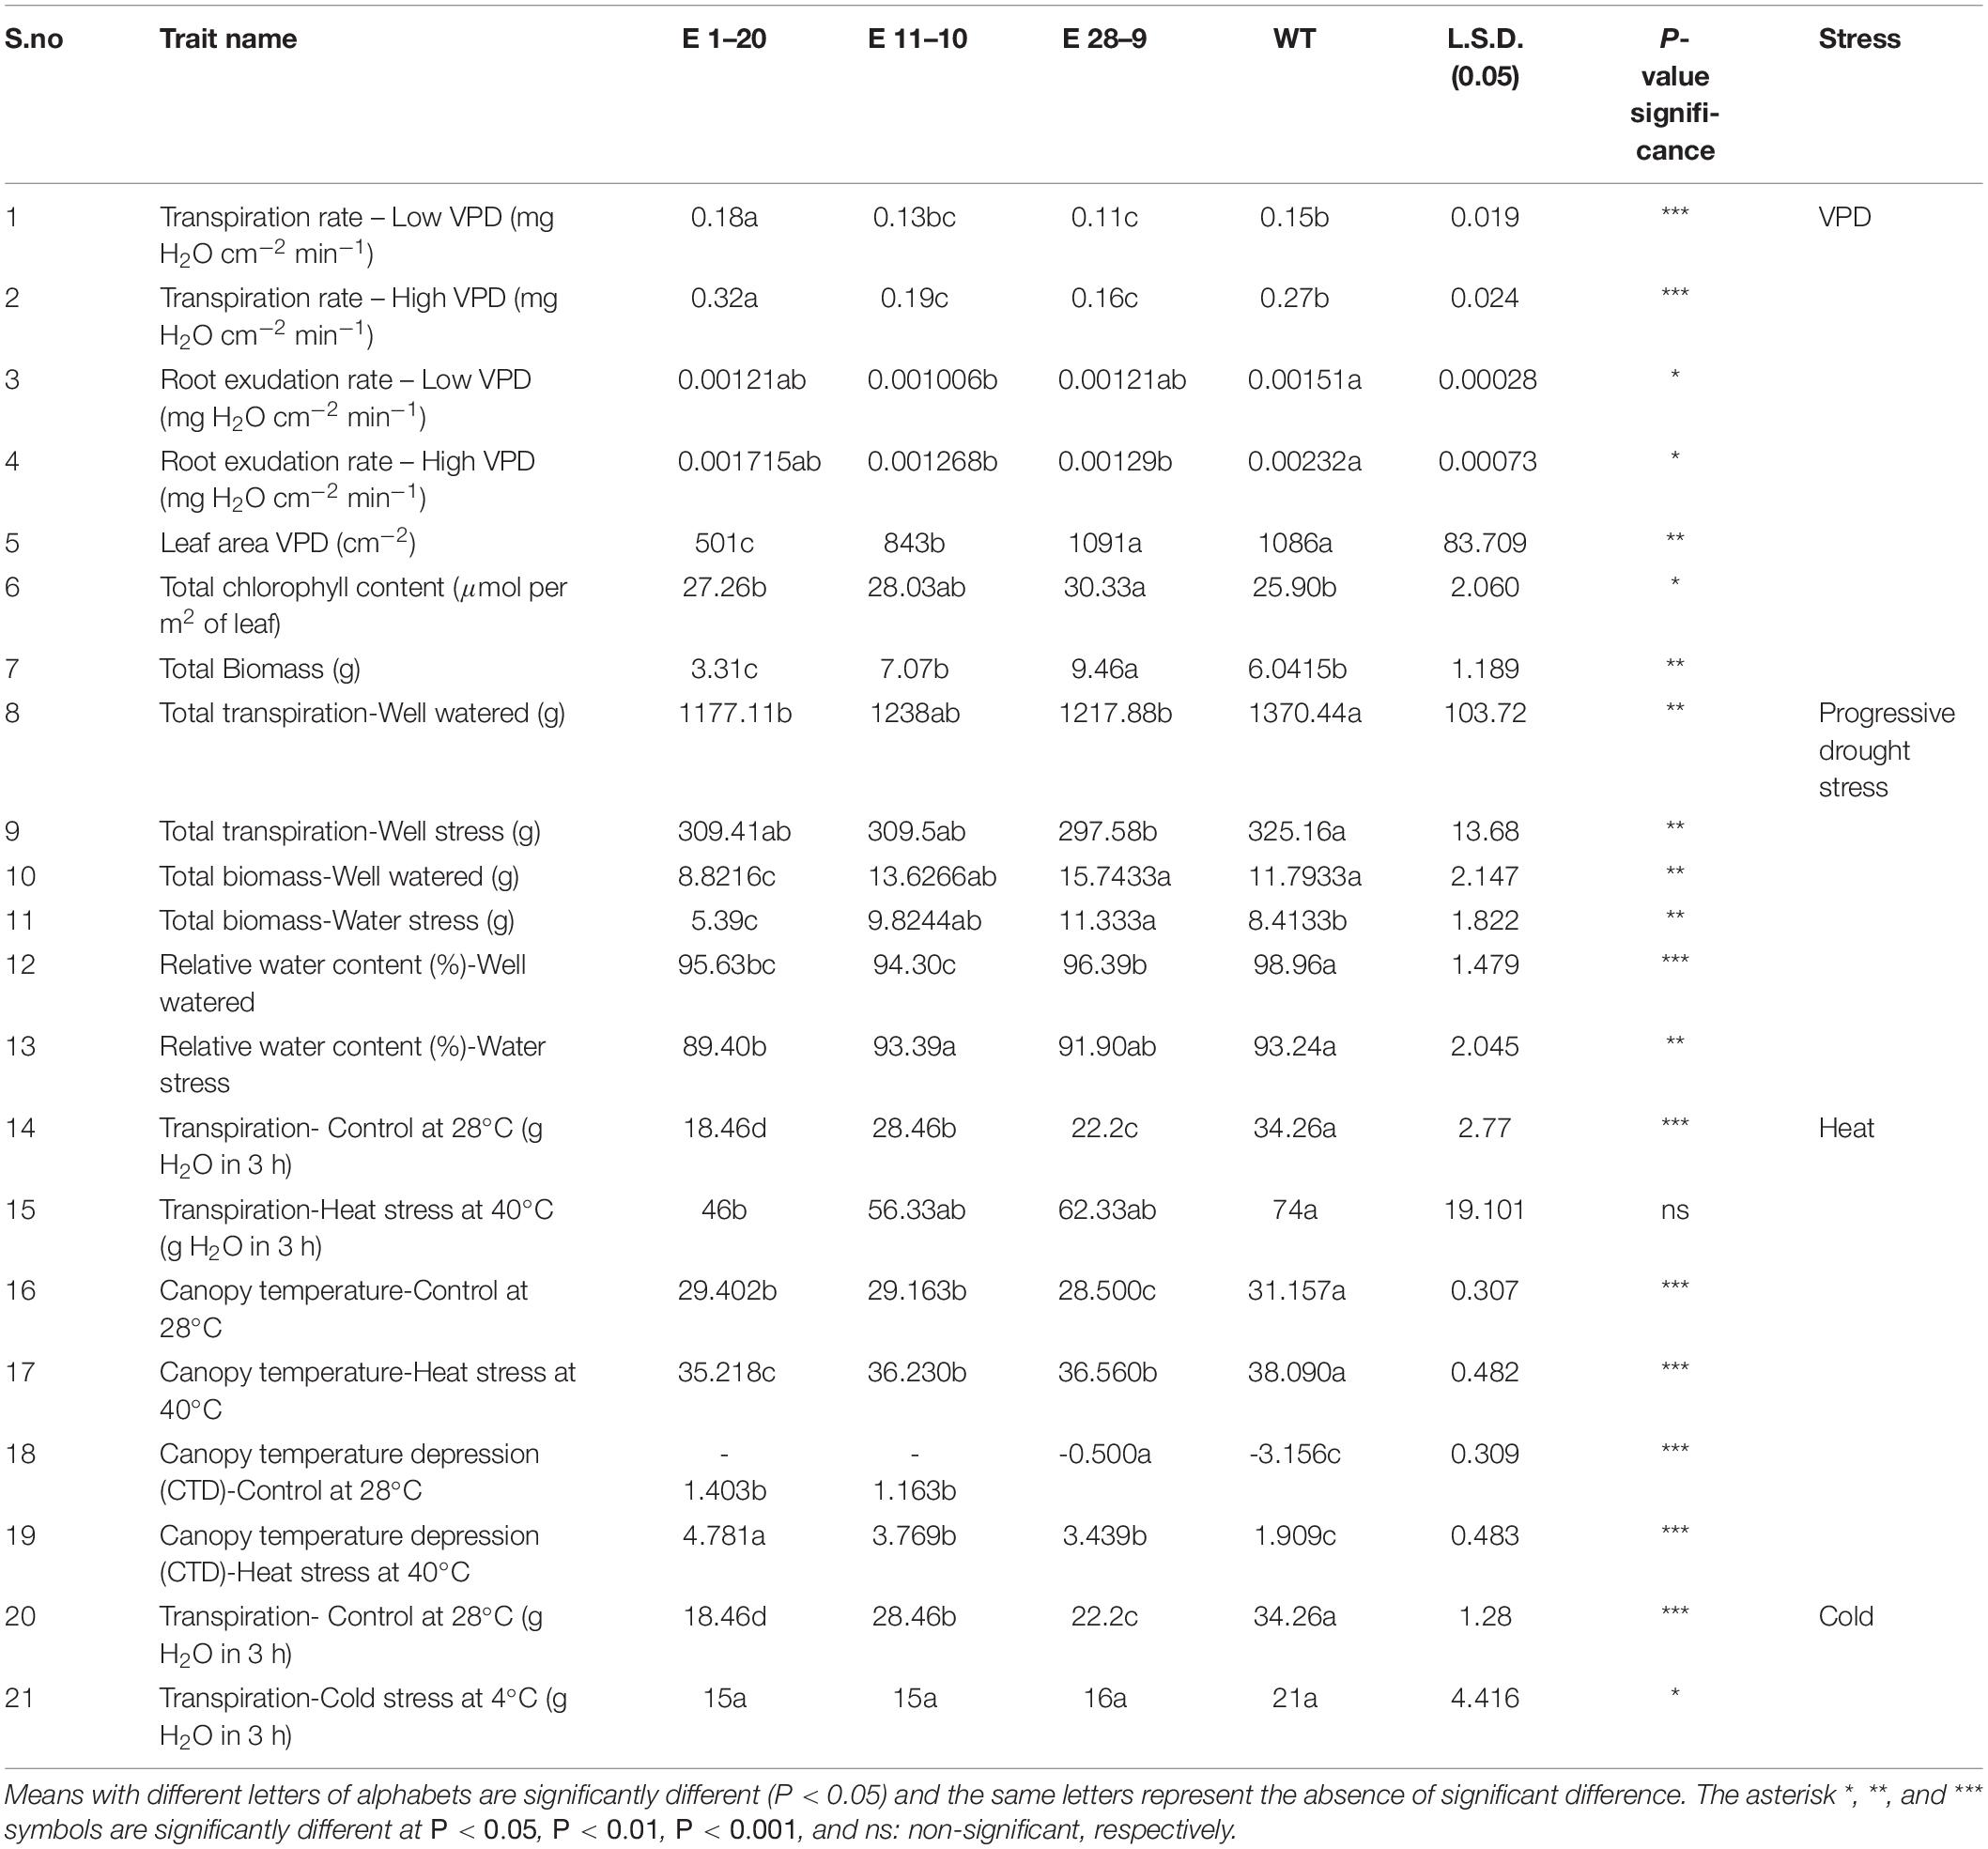
Table 2. Summary of different physiological traits that contribute to different abiotic stress tolerance in PgPIP2;6 transgenic and WT tobacco plants.
Imposition of progressive drought stress on transgenic and WT tobacco plants revealed that WT plants utilized soil moisture more quickly than the transgenics that also showed genotypic differences with declined transpiration between WT and transgenic plants (Figure 5A). Segmental regression analysis revealed a slightly higher FTSW breakpoint value in WT plants than the transgenic events (except the event E 28–9), although the events E 1–20 and E 11–10 exhibited a slower decline in transpiration than the WT plants (Figure 5A). Total transpiration was measured in WW as well as in WS plants where a threefold total transpiration difference was recorded (Figure 5B). While under WW conditions, events E 1–20 and E 28–9 were significantly different from WT (Figure 5B and Table 2). Similarly, event E 28–9 was significantly different from WT under WS conditions (Figure 5B and Table 2).
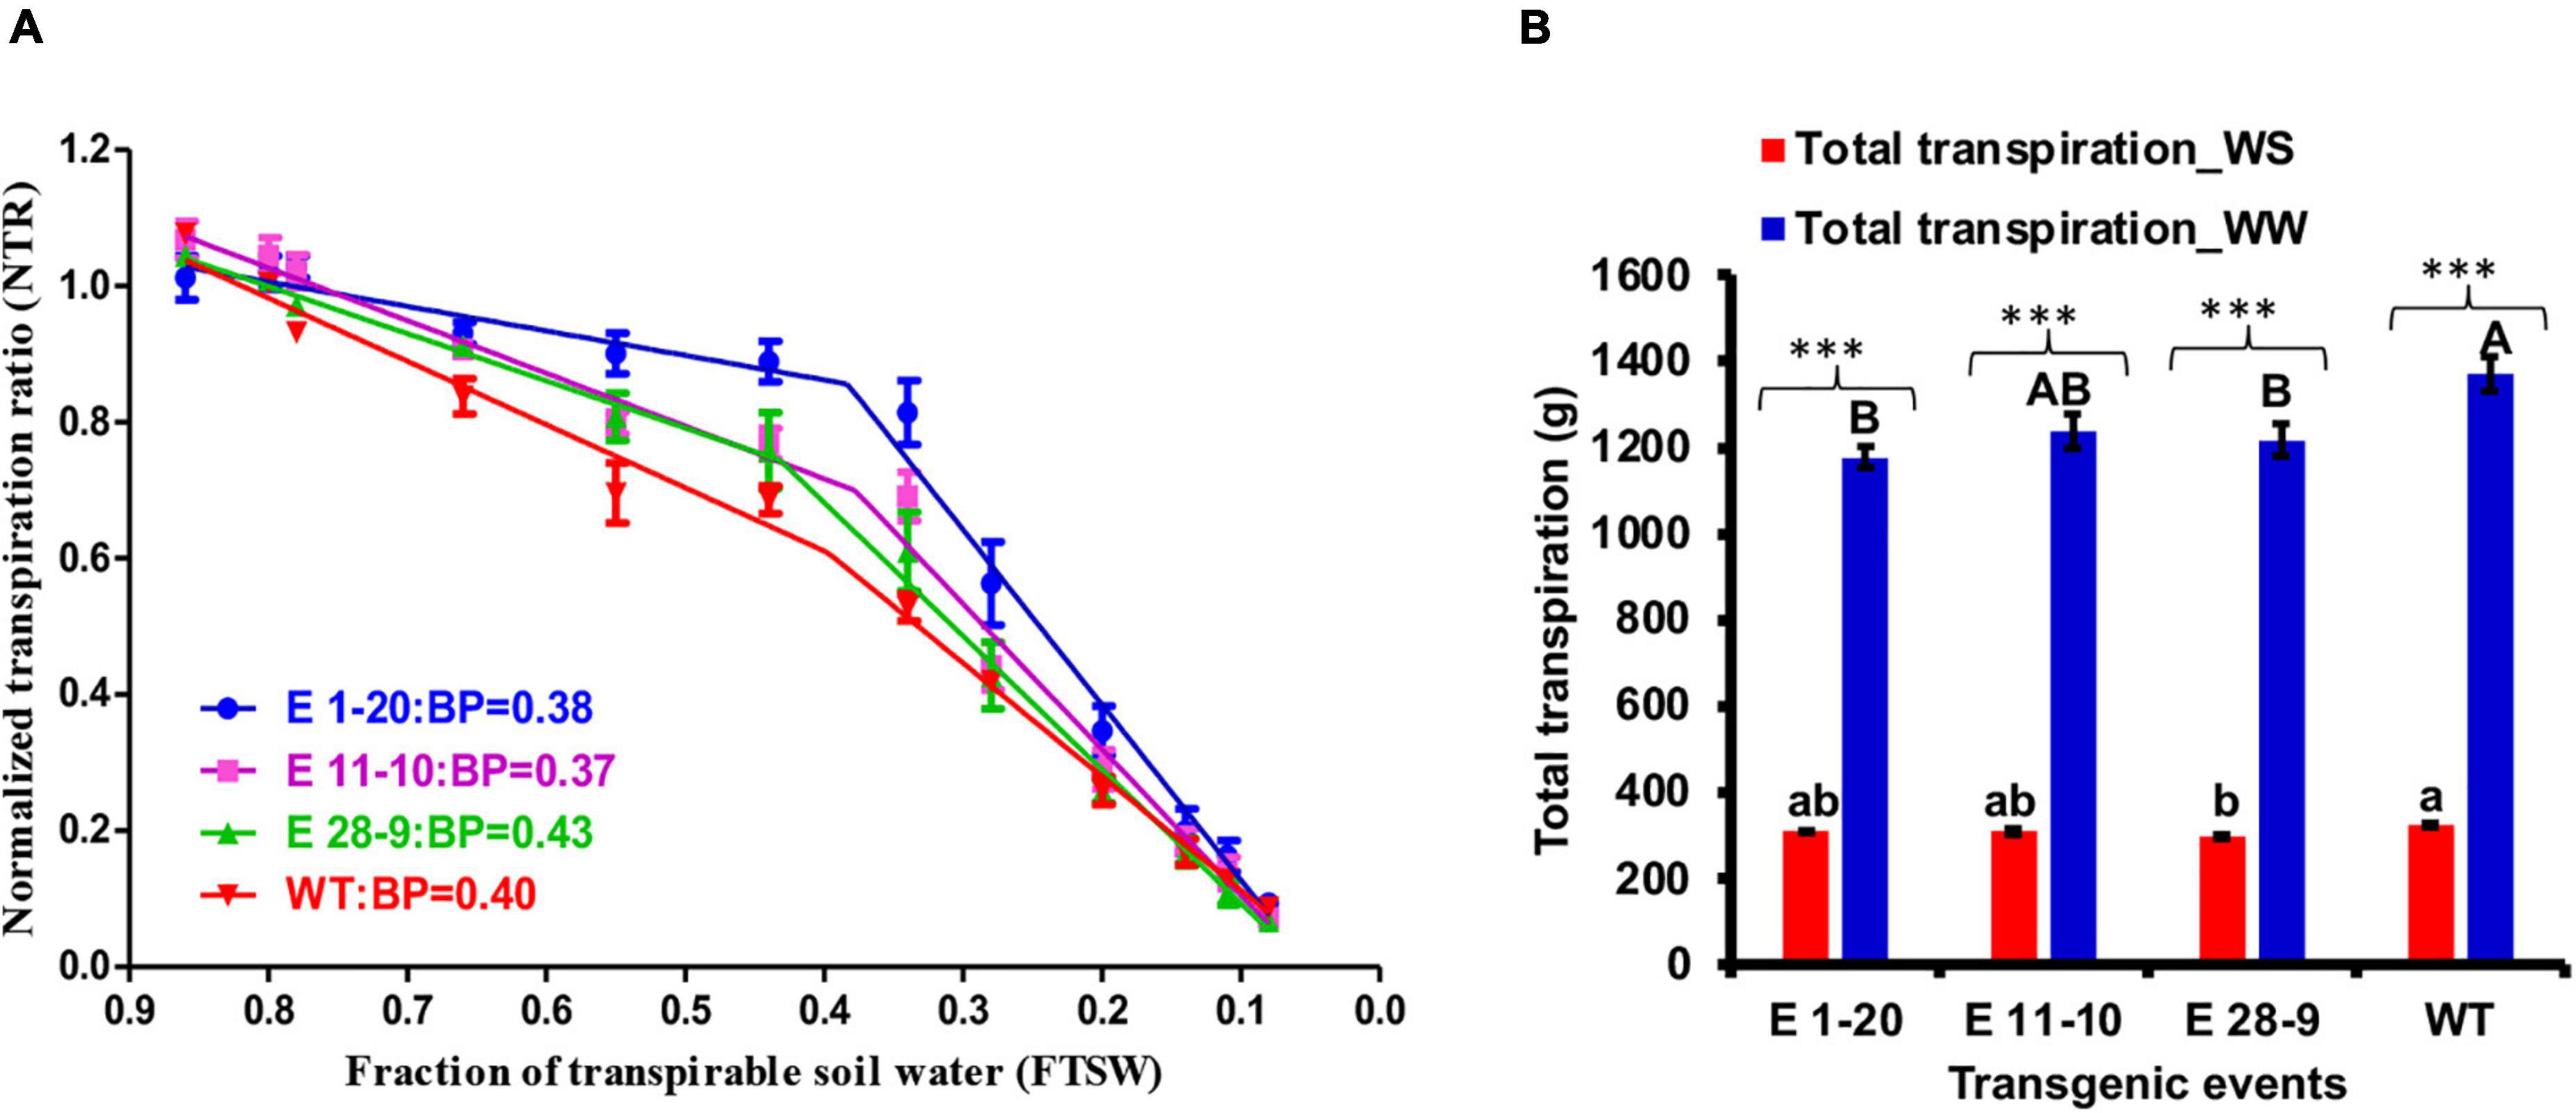
Figure 5. Progressive drought stress. (A) Relationship between the normalized transpiration rate (NTR) and fraction of transpirable soil water (FTSW) of transgenic [E 1–20 (blue color line); E 11–10 (pink color line); E 28–9 (green color line)] and WT (red color line) during progressive drought stress treatment. The FTSW thresholds where the transpiration initiated its decline were calculated with segmental regression procedure from Graphpad prism. Then, the regression lines of the relationships between the NTR and FTSW were drawn by fitting NTR to FTSW data above and below the respective thresholds for transpiration decline in each genotype. The dotted lines represent the NTR of well-watered control plants. Each point is the mean of NTR (n = 9), and the error bars are the SE of the mean. (B) Total transpiration content in PgPIP2;6 transgenic tobacco lines under well-watered (WW) and water stress (WS) treatment. Bars with different capital letters and small letters indicate significantly different at P ≤ 0.05 in both low and high VPD conditions. Bars with asterisk *** symbol are significantly different at P < 0.001 between WW and WS treatment.
Transpiration was measured in both control and heat-stressed plants where significant differences were noticed in their transpiration rates (Figure 6A), transgenics exhibiting lower transpiration than the WT plants (Figure 6A). Thermal image analysis revealed lower canopy temperature (CT) in transgenics than WT plants under high-temperature (40°C) stress (Figure 6B). Similarly, transgenics showed lower CT than the WT plants under optimum (28°C) and high-temperature (40°C) conditions (Figure 6C). Canopy temperature depression (CTD) analysis demonstrated higher CTD in transgenics than WT plants under high-temperature stress conditions (Figure 6D), which reverses the CT measurements. A comparison of the mean CT, CTD, and transpiration data among the transgenic and WT plants in both heat-stressed and control plants (optimum temperature, 28°C) revealed statistically significant (p ≤ 0.05) genotypic differences (Table 2). Under cold stress (4°C), there was no significant difference between transgenic and WT plants. By contrast, transgenic events E 1–20, E 11–10, and E 28–9 significantly lower transpiration than WT plants (Figure 7 and Table 2).
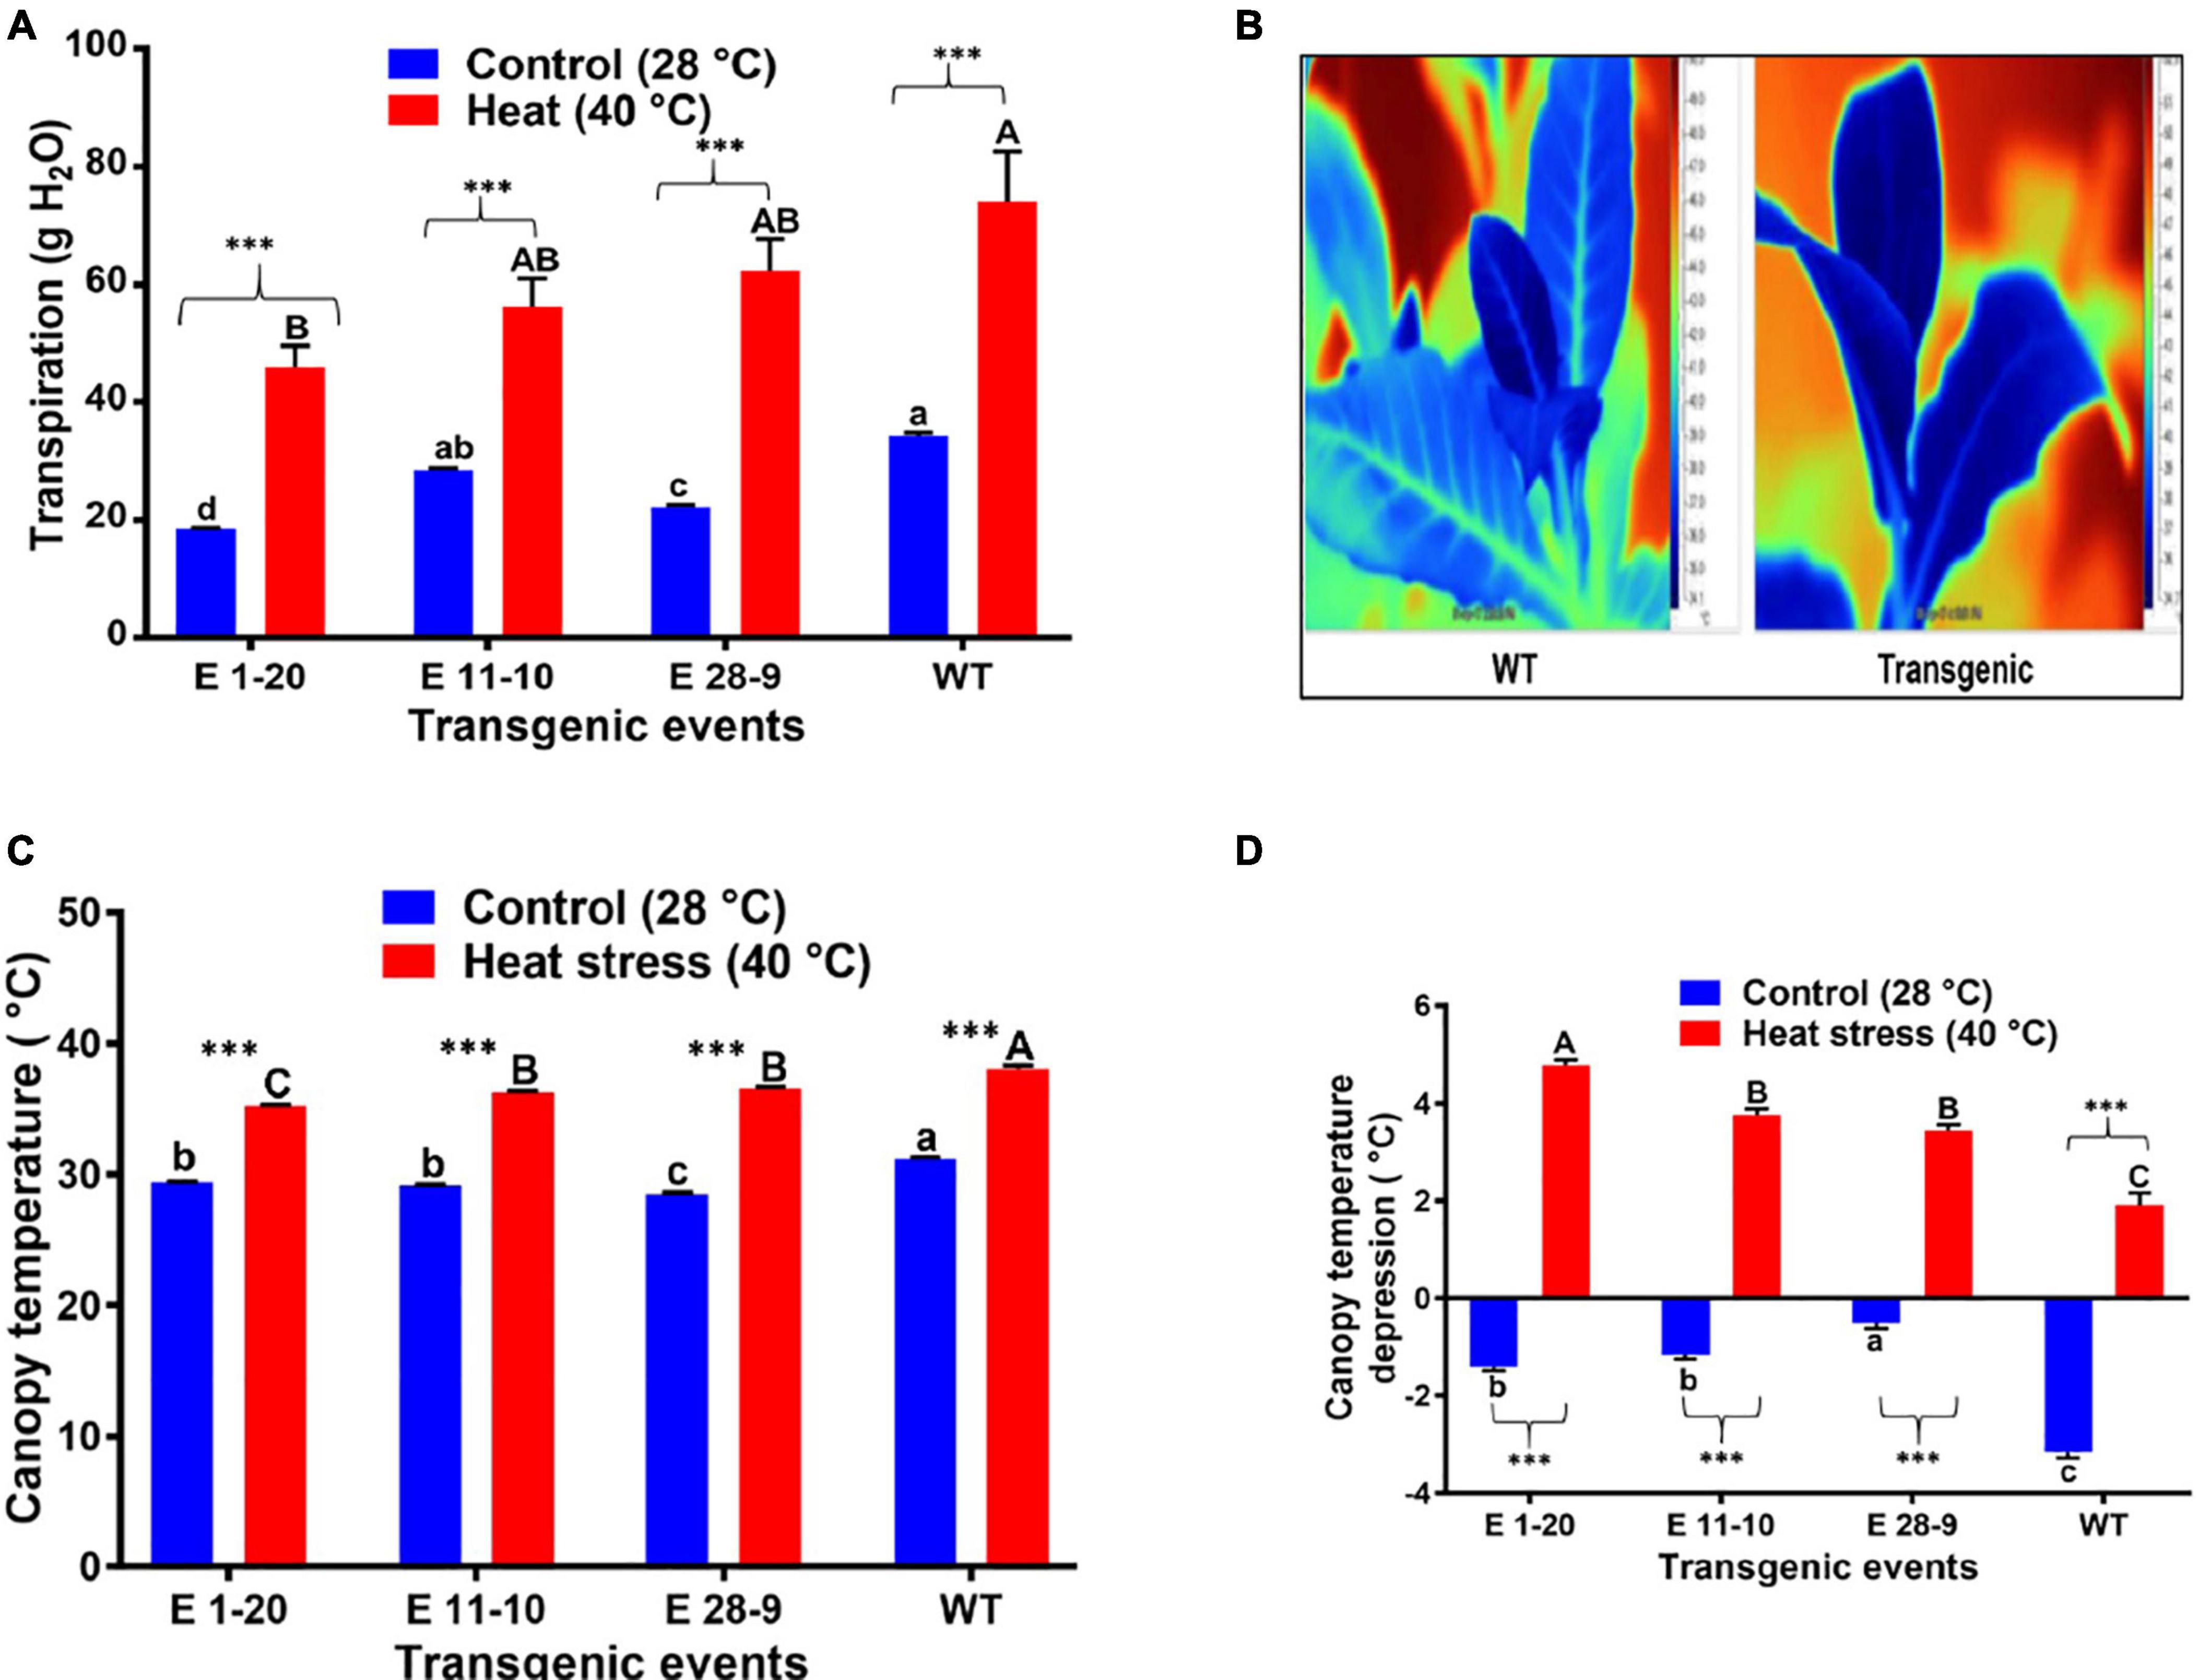
Figure 6. Physiological performance of PgPIP2;6 transgenic tobacco lines under heat stress at 40°C. (A) Tr in transgenic lines and WT plants subjected to heat stress treatment (40°C for 4 h). (B) Thermal infrared images of leaf from WT and transgenic tobacco plants. The images were taken after 4 h of heat stress treatment. The color scale to the right shows the variation in leaf temperature produced by heat. (C) Canopy temperature of the transgenic lines E 1–20, E 11–10, and E 28–9 and WT tobacco plants under 40°C heat stress and control (28°C) conditions. Measurements were taken after 4 h of stress treatment on three replicates of each line. Data are means ± SE. (D) Canopy temperature depression in transgenic tobacco lines and WT plants under heat stress. Data are means ± SE. Bars with different capital letters and small letters indicate significantly different at P≤0.05 in both control and heat stress conditions. Bars with asterisk *** symbols from (A,C,D) are significantly different at P < 0.001, between control and heat stress treatment.
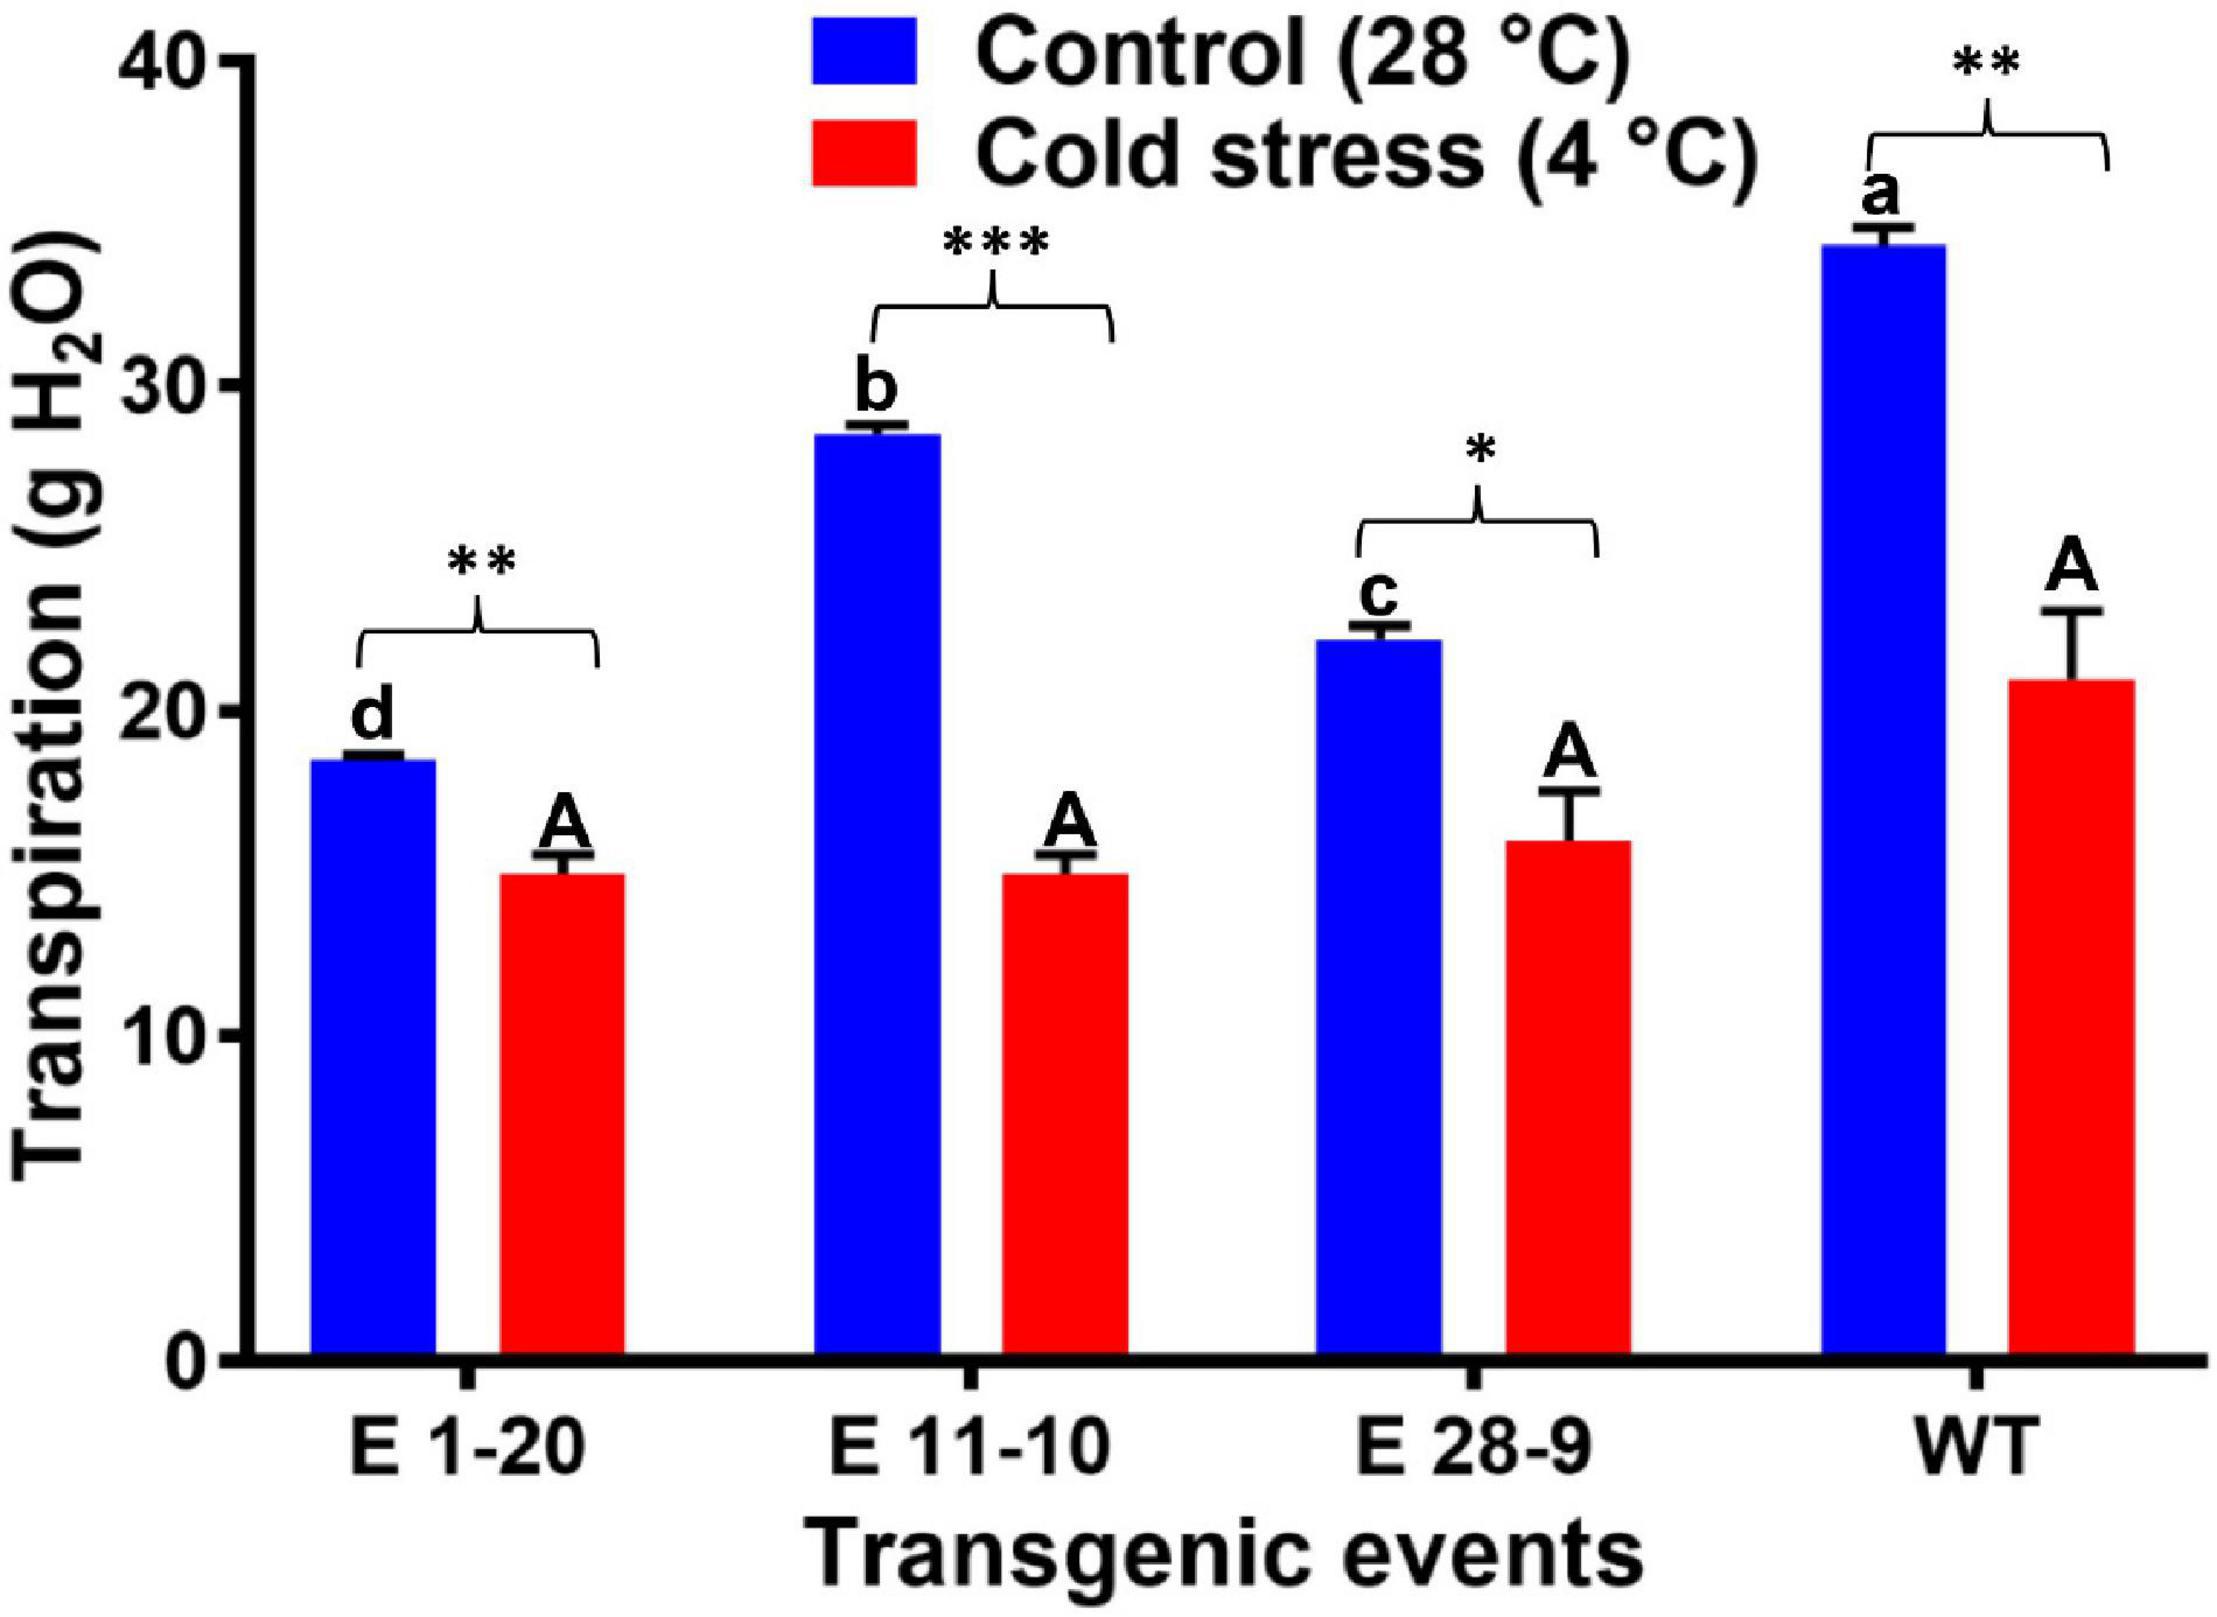
Figure 7. The transpiration rate in transgenic and WT plants subjected to cold stress treatment (4°C for 4 h). Bars with different capital letters and small letters indicate significantly different at P≤0.05 in both control and cold stress conditions. Bars with asterisk *, **, and *** symbols are significantly different at P < 0.05, P < 0.01, P < 0.001 between control and cold stress treatment.
Expression levels of the PgPIP2;6 gene in leaf and root tissues, subjected to different abiotic stress treatments, were compared with their corresponding control samples using the 2–ΔΔCt method where a steady upregulation was recorded in response to high VPD stress. Expression of PgPIP2;6 gene increased significantly in all the tested transgenic events (Figure 8A). Its expression in leaves was higher than that in root tissues in all the three transgenic events except for E 1–20 in which the expression levels were comparatively less in both the tissues. Overall, the transgenic event E 28–9 showed the highest expression levels in both leaf and root tissues in comparison with other transgenic events (Figure 8A). These expression results were closely related to Tr data where the event E 1–20 displayed higher Tr than the other event under high-VPD conditions (Figures 4A, 8A). The relative expression of PgPIP2;6 was investigated under drought vis-a-vis WW conditions for each transgenic event. Under WS conditions, significant variation in the abundance of the PgPIP2;6 transcript was observed among diverse transgenic events (Figure 8B). PgPIP2;6 transgene expression was upregulated under WS in root as well as in the leaf tissues. Overall, the transgenic event E 11–10 showed significantly higher transcript abundance in root tissues than other transgenic events (Figure 8B). A correlation was noticed between physiological characteristics, the level of expression of PgPIP2;6, and drought tolerance. Under heat stress, the PgPIP2;6 transgene showed significant upregulation in all the transgenic events. Higher expression levels were observed in the leaf compared to root tissues in all transgenics (Figure 8C). Among all the tested transgenic events, E 28–9 showed higher expression in leaf as well as root tissues. These expression results agree with the physiological data (Figure 6) where the events with lower PgPIP2;6 gene expression showed a higher transpiration rate under high-temperature conditions. Under cold stress, root tissues exhibited comparatively higher gene expression than the leaf where the transgenic event E 1–20 showed the highest expression in root tissues than the other two events (Figure 8D). PgPIP2;6 expression levels were upregulated in all the transgenic events under cold stress conditions that are similar to the Tr data obtained from the physiological experiments (Figure 7).

Figure 8. The relative expression of PgPIP2;6 gene in transgenic tobacco plants under high VPD (A), progressive drought (B), heat (C), and cold (D) stresses. Y-axis indicates the relative gene expression values, and names on the X-axis represent the transgenic events. Dark black-color bars indicate the leaf expression, and gray-color bars indicate root expression. Data points represent the PgPIP2;6 transgene expression values, obtained after normalization against the reference gene (UBC) and corresponding control samples by 2–ΔΔCt method. Each data point represents mean of three biological replications with standard error (±SE). Each biological replication represents mean of three technical replications. The “P” indicates the probability of a difference among the transgenic events expression in leaf and root tissues. Bars with different capital letters and small letters are indicated significantly different at P ≤ 0.05 in root and leaf tissues.
Maintaining water budget levels under different abiotic stress conditions is crucial for the plants to survive and to employ several adaptive mechanisms to cope with the environmental stresses (Mahdieh et al., 2008). AQP genes play critical roles in water transport, homeostasis, growth, and development of plants, including other organisms (Luu and Maurel, 2005; Galmés et al., 2007; Li et al., 2015; Afzal et al., 2016; Ranganathan et al., 2017). Functional characterization of AQPs in different crop species showed improved tolerance against abiotic stress conditions (Ayadi et al., 2011; Zhou et al., 2012; Liu et al., 2013; Ranganathan et al., 2016; Xu et al., 2020, 2021; Sun et al., 2021). An adaptive mechanism of pearl millet to most of the abiotic stresses also involves this important class of proteins through the regulation of AQP genes. The AQP gene family has been characterized in diverse taxa, such as Oryza sativa, Zea mays, Triticum aestevium, Hordeum vulgare, Sorghum bicolor, Panicum virgatum, and Brachypodium distachyon (Johanson et al., 2001; Forrest and Bhave, 2008; Nguyen et al., 2013; Hove et al., 2015; Azad et al., 2016). However, systematic characterization and functional validation of the AQP genes have not been demonstrated in Pennisetum glaucum. The present study carried out expression profiles of AQP genes in leaf and root tissues of contrasting genotypes under high VPD and progressive drought stresses with the primary objective of elucidating the essential roles being played by AQPs. In all, 34 AQP genes were identified in the P. glaucum genome that are closer to those from other monocots like rice, S. bicolor, and Z. mays. Pearl millet AQP proteins contained similar structural motifs like MIP domains, NPA, LE1, LE2, H1, H2, and P1-P5, thereby indicating similar functional roles in pearl millet also. The presence of cis-elements in the promoter regions infer that they might play a vital role in developmental and abiotic stress regulations. PgAQP genes displayed different expression patterns in different tissues (leaf and root) of the VPD-sensitive and insensitive genotypes, indicating their tissue specific roles during abiotic stress tolerance. Based on the expression data of all PgAQPs under high VPD and drought stress to VPD-sensitive and insensitive genotypes, the PgPIP2;6 gene of the PIP family could be a probable candidate gene that plays a pivotal role during abiotic stress tolerance, particularly drought. This result has been well aligned with our earlier study in pearl millet (Reddy et al., 2017). PgPIP1;3, PgPIP1;4, and PgPIP2;3 showed higher transcript abundance in high TR genotype than low TR genotype under high VPD conditions (Reddy et al., 2017; Grondin et al., 2020).
The PIP proteins belong to the AQP family, which are known to play critical roles during water transport in plasma membranes of many plant species (Martre et al., 2002; Tyerman et al., 2002; Song et al., 2016; Zargar et al., 2017) toward abiotic stress adaptation. In our pursuit to identify a functional role of the pearl millet PgPIP2;6 AQP gene in transgenic tobacco plants, sequence analysis of the protein with AQPs isolated from other monocot and dicot species revealed that PgPIP2;6 protein shares high sequence homology with ZmPIP2;6 and SbPIP from maize and sorghum where the predicted structure resembles that of a classic AQP. Homology-based modeling revealed the orientation of NPA motifs similar to that of other characterized AQPs, besides the capacity to form homotetramers that are typical of AQPs. The PgPIP2;6 gene sequence is similar to other well-characterized AQP sequences with all the essential components for its function. Transgenic lines with the PgPIP2;6 gene under the control of the constitutive CaMV35S promoter thus generated were advanced to T2 generation where three events (E 1–20, E 11–10, and E 28–9) were selected based on initial molecular characterization for elucidation of the function of the PgPIP2;6 gene under different abiotic stress conditions.
In the present study, PgPIP2;6 transgenic tobacco plants exhibited lower Tr at high VPD than WT plants, indicating that the transgene enabled the plants with water-conserving properties. Genotypic differences for the transpiration response to increasing VPD have also been reported in other crop species like soybean (Fletcher et al., 2007; Gilbert et al., 2011), sorghum (Gholipoor et al., 2010), peanut (Devi et al., 2010), pearl millet (Kholová et al., 2010b; Reddy et al., 2017, 2021), cowpea (Belko et al., 2012), maize (Yang et al., 2012; Gholipoor et al., 2013), and chickpea (Zaman-Allah et al., 2011a; Sivasakthi et al., 2017b). The Tr response of transgenic chickpea plants was shown to be associated with lower Tr slopes than WT control plants under increasing VPD conditions (Anbazhagan et al., 2015). The root exudation rate also showed a clear genotypic difference between WT and transgenics where the transgenic plants showed a lower exudation rate than the WT plants. Such a water conservation strategy has been shown to be directly linked to increased crop production under water-limited conditions (Zaman-Allah et al., 2011b; Vadez et al., 2013, 2014; Kholová et al., 2014). These results are in accordance with the previous reports in pearl millet, sorghum, and chickpea (Choudhary et al., 2013; Sivasakthi et al., 2017a,b; Tharanya et al., 2017). PgPIP2;6 transcript levels in transgenic tobacco were closely related with the Tr data where transgenic lines displayed lower Tr under high-VPD conditions. Exposure of plants to high VPD is known to reduce the stomatal apertures to control water losses (Kholová and Vadez, 2013). Since AQPs play a critical role in stomatal movements and regulation (Li et al., 2004), tobacco transgenics overexpressing PgPIP2;6 exhibited lower Tr in high-VPD conditions when compared to the WT controls. This suggests that these plants may have better water-conserving mechanisms by enhancing their transpiration efficiency, thereby leading to better adaptation to water-limiting conditions.
Controlled progressive drought stress imposition is an important methodology for assessing crop performance under water-limiting environments (Kholová et al., 2010a) where the FTSW is an important parameter for drought adaptation. In the present study, progressive drought stress imposed on transgenic tobacco plants resulted in a lower FTSW threshold value than the WT plants, resulting in a slower decline of soil moisture in transgenic plants, possibly due to their water-saving characteristics as also shown in chickpea (Anbazhagan et al., 2015). Genotypic differences were also found for transpiration response to progressive water-deficit stress in several other crops (Vadez and Sinclair, 2001; Bhatnagar-Mathur et al., 2007; Hufstetler et al., 2007; Devi et al., 2010; Anbazhagan et al., 2015). A correlation between physiological characteristics and expression of PgPIP2;6 transgene seems to be responsible for drought tolerance in our study where the physiological mechanisms linked to drought stress adaptation/tolerance are closely related to the expression of drought-responsive genes (Kiani et al., 2007). Expression of the PgPIP2;6 gene in root and leaf tissues under water-deficit conditions further supports the role in stress tolerance. Water transport through roots depends on the anatomical structure of roots regulated by the complex phenomenon. Plants growing under adverse conditions, including drought, reduce the water permeability of their root membrane cells to avoid possible loss of water from the roots to the soil, as has been proposed earlier (Steudle, 2000). Hence, the lower Tr found in PgPIP2;6 transgenic tobacco plants compared to WT plants presumably developed the adaptative mechanism. These results are consistent with the earlier reports on chickpea and pearl millet (Sivasakthi et al., 2017b; Tharanya et al., 2018).
Heat stress lowers the relative air humidity if water is supplemented to the ambient atmosphere (Prasch and Sonnewald, 2013), a scenario frequently occurring under natural climatic conditions and exerted in regular heat-stress studies. Consequently, plants suffer from heat stress and additional ambient water stress (Georgii et al., 2017). High temperature enhances transpiration to minimize heat damage by transpiration-mediated leaf cooling (Crawford et al., 2012). For any given environmental conditions, the canopy temperature (CT) is closely related to the rate of transpiration from the canopy surface, while the canopy temperature depression (CTD) indicates the capacity of stomata to regulate leaf water loss under stressed conditions (Isoda and Wang, 2002). Therefore, the differences in CT could possibly be used to estimate the differences in Tr, providing a more relevant trait proxy for Tr (Jones et al., 2002). Our results of thermal image analysis revealed that transgenic plants displayed lower CT than WT plants under high-temperature (40°C) conditions and optimum temperatures (28°C). Transgenics exhibited more CTD than WT plants under high-temperature stress conditions, inferring the adaptation of a possible water-saving strategy. During heat stress, plant-water relations are regulated through changes in abundance of AQPs (Maurel et al., 2008). AQP genes are expressed differentially in diverse tissues under various abiotic stress conditions in higher plants. Accordingly, it is noticed that PgPIP2;6 gene expression levels were significantly upregulated under high-temperature conditions in transgenic tobacco lines. This leads us to speculate that the upregulation of PgPIP2;6 might be a spontaneous response to heat stress and might play a critical role in speeding up the water homeostasis, following the stress.
Aquaporins have also been shown to respond to various environmental stresses, including cold (Jang et al., 2004; Aroca et al., 2005; Guo et al., 2006; Peng et al., 2008; Sade et al., 2010) that may be directly related to their function in the transport of water across membranes. In the present study, PgPIP2;6 transgenic lines of tobacco displayed slightly lower transpiration than the WT control plants under cold stress conditions. PgPIP2;6 expression levels were significantly upregulated in transgenics under cold stress except in the line E 11–10, which displayed comparatively lower expression and higher transpiration than the other two transgenics. Similarly, overexpression of OsPIP2;7 has been shown to enhance the Tr, leading to improved tolerance against low temperature in rice (Li et al., 2008). Leaf dehydration is caused by the imbalance between water lost by leaf transpiration and water taken up by the roots (Pardossi et al., 1992; Vernieri et al., 2001), resulting in a decrease in VPD between the atmosphere and the leaf surface, and leading to a decline in the transpiration rate (Aroca et al., 2003). Hence, under low-temperature stress, stomata of the tolerant transgenic plants close more rapidly (Aroca et al., 2001, 2003; Bloom et al., 2004). Besides, the recovery of plants from cold stress has been linked with the expression of AQPs, particularly PIPs (Afzal et al., 2016).
In conclusion, our study identified 34 AQP genes in pearl millet, which are grouped into four subfamilies, including 11 PIPs, 9 TIPs, 11 NIPs, and 3 SIPs. Phylogenetic relationship within the subfamilies of PgAQPs and between AQPs of related species shows their evolutionary relationship and possible functions with their localizations, mainly in the plasma membrane. Cis-motif analysis showed the presence of several tissue and abiotic stress-specific cis-elements, indicating their possible role during abiotic stress adaptation. Expression analysis of PgAQPs in Tr-contrasting genotypes of pearl millet in leaf and root tissues in VPD and progressive drought stress revealed their critical roles during abiotic stress conditions. Tobacco transgenics constitutively expressing PgPIP2;6 gene showed differences in response to diverse abiotic stresses. Tr under heat and drought stresses recorded marked differences between transgenics and the non-transgenic WT plants, where the transgenics exhibited better tolerance due to lower Tr when compared to WT plants. Constitutive expression of pearl millet aquaporin PgPIP2;6 in tobacco seemed to impart abiotic stress tolerance with reduced transpiration, thereby helping in water conservation. Further improvement in stress tolerance is possible by using tissue-specific or stress-inducible promoters for more specific AQP expression levels. Thus, these studies provide a point of reference for the functional studies and molecular breeding of a pearl millet crop for enhanced adaptation and resilience to abiotic stresses, especially under uncertainties due to the ensuing climate change.
The datasets presented in this study can be found in online repositories. The names of the repository/repositories and accession number(s) can be found in the article/Supplementary Material.
PR, PB-M, VV, and KKS conceived the idea and designed the project outline. PR, MD, KS, KD, KSC, and PK performed the experiments. PR, VV, PB-M, KS, PK, MN, and KKS analyzed the data. PR, MD, KS, KD, KKS, and PK prepared and refined the manuscript. All authors read and approved the manuscript.
PR acknowledges financial support from the Department of Science and Technology, Government of India for a fellowship and research grant through the INSPIRE Faculty Award No. IFALSPA-06, Young Scientist Award SB/YS/LS-12/2013 and the partial support from the core grant research (CRG) grant file No. DST No: EMR/20l6/006726. PK acknowledges VFSTR, Guntur for providing the Emeritus fellowship. This work was undertaken as part of the CGIAR Research Program on Grain Legumes and Dryland Cereals (CRP-GLDC) supported by CGIAR Fund Donors.
The authors declare that the research was conducted in the absence of any commercial or financial relationships that could be construed as a potential conflict of interest.
All claims expressed in this article are solely those of the authors and do not necessarily represent those of their affiliated organizations, or those of the publisher, the editors and the reviewers. Any product that may be evaluated in this article, or claim that may be made by its manufacturer, is not guaranteed or endorsed by the publisher.
We thank Rajeev Varshney and Prasad Bajaj, ICRISAT, for the basic sequence extraction information from the pearl millet genome.
The Supplementary Material for this article can be found online at: https://www.frontiersin.org/articles/10.3389/fpls.2022.820996/full#supplementary-material
Supplementary Figure 1 | Phylogenetic relationship of Pg Aquaporin proteins with Zea mays (Zm), Sorghum bicolor (Sb), and Oryza sativa (Os). Numbers on branches represent bootstrap values. Aquaporins in plants are broadly categorized into four subfamilies, PIPs (plasma membrane intrinsic proteins), TIPs (tonoplast intrinsic proteins), NIPs (nodulin-26-like intrinsic proteins), and SIPs (small basic intrinsic proteins).
Supplementary Figure 2 | Conserved protein motifs distribution in 34 PgAQPs. Conserved motifs were analyzed by the MEME Web server using their respective protein sequences. Ten conserved motifs were identified, and different motifs are assigned different colors. The scale represents the lengths of the proteins and motifs.
Supplementary Figure 3 | MEME identified conserved motif sequences in PgAQPs.
Supplementary Figure 4 | PgAQPs amino acid sequences were aligned using MacVector software. The red line on top of the sequences indicates predicted the MIP domain, and the blue-color portion of the alignment indicates predicted transmembrane domains. The NPA motifs, tetrad residues of ar/R filter, and FPs are highlighted. The two conserved NPA motifs are bold and highlighted in pink color. The residues at H2, H5, LE1, and LE2 of the ar/R filter and forger’s positions (P1–P5) are marked in yellow and green letters, respectively. Conserved residues are represented.
Supplementary Figure 5 | Expression analysis of the PgPIP2;6 gene in pearl millet by qRT-PCR. The relative expression level of PgPIP2;6 in different tissues (A) and under different abiotic stress conditions (B) (cold, 4°C; heat, 45°C; drought and salt, 250 mM; and ABA, 100 μM). The data represent the mean ± SE of three replicate samples.
Supplementary Table 1 | Primers used in the gene expression analysis.
Supplementary Table 2 | Types of protein kinases and phosphorylation sites in the phosphorylation events of PgAQPs.
Supplementary Table 3 | The paralogous duplication events and non-synonymous to synonymous substitution ratios (dN/dS) of AQPs.
Supplementary Table 4 | The orthologs and non-synonymous to synonymous substitutions of AQPs orthologs of Pennisetum glaucum, Sorghum bicolor, Oryzasativa, and Zea mays.
Supplementary Table 5 | A vapor pressure deficit (VPD) ladder set-up in a controlled-growth chamber.
Afzal, Z., Howton, T. C., Sun, Y., and Mukhtar, M. S. (2016). The roles of aquaporins in plant stress responses. J. Dev. Biol. 4:9. doi: 10.3390/jdb4010009
Alavilli, H., Awasthi, J. P., Rout, G. R., Sahoo, L., Lee, B. H., and Panda, S. K. (2016). Overexpression of a barley aquaporin gene, HvPIP2; 5 confers salt and osmotic stress tolerance in yeast and plants. Front. Plant Sci. 7:1566. doi: 10.3389/fpls.2016.01566
Anbazhagan, K., Bhatnagar-Mathur, P., Vadez, V., Dumbala, S. R., Kishor, P. K., and Sharma, K. K. (2015). DREB1A overexpression in transgenic chickpea alters key traits influencing plant water budget across water regimes. Plant Cell Rep. 34, 199–210. doi: 10.1007/s00299-014-1699-z
Anderberg, H. I., Kjellbom, P., and Johanson, U. (2012). Annotation of Selaginella moellendorffii major intrinsic proteins and the evolution of the protein family in terrestrial plants. Front. Plant Sci. 3:33. doi: 10.3389/fpls.2012.00033
Aroca, R., Amodeo, G., Fernández-Illescas, S., Herman, E. M., Chaumont, F., and Chrispeels, M. J. (2005). The role of aquaporins and membrane damage in chilling and hydrogen peroxide induced changes in the hydraulic conductance of maize roots. Plant Physiol. 137, 341–353. doi: 10.1104/pp.104.051045
Aroca, R., Tognoni, F., Irigoyen, J. J., Sánchez-Díaz, M., and Pardossi, A. (2001). Different root low temperature response of two maize genotypes differing in chilling sensitivity. Plant Physiol. Biochem. 39, 1067–1073.
Aroca, R., Vernieri, P., Irigoyen, J. J., Sánchez-Dıaz, M., Tognoni, F., and Pardossi, A. (2003). Involvement of abscisic acid in leaf and root of maize (Zea mays L.) in avoiding chilling-induced water stress. Plant Sci. 165, 671–679. doi: 10.1016/s0168-9452(03)00257-7
Ayadi, M., Cavez, D., Miled, N., Chaumont, F., and Masmoudi, K. (2011). Identification and characterization of two plasma membrane aquaporins in durum wheat (Triticum turgidum L. subsp. durum) and their role in abiotic stress tolerance. Plant Physiol. Biochem. 49, 1029–1039. doi: 10.1016/j.plaphy.2011.06.002
Azad, A. K., Jahed Ahmed, M., Asraful Alum, M., Hasan, M., Ishikawa, T., Sawa, Y., et al. (2016). Genome-wide characterization of major intrinsic proteins in four grass plants and their non-aqua transport selectivity profiles with comparative perspective. PLoS One 11:e0157735. doi: 10.1371/journal.pone.0157735
Bailey, T. L., Boden, M., Buske, F., Frith, M., Grant, C. E., Clementi, L., et al. (2009). MEME-suite: tools for motif discovery and searching. Nucleic Acids Res. 37, W202–W208. doi: 10.1093/nar/gkp335
Belko, N., Zaman-Allah, M., Cisse, N., Diop, N. N., Zombre, G., Ehlers, J. D., et al. (2012). Lower soil moisture threshold for transpiration decline under water deficit correlates with lower canopy conductance and higher transpiration efficiency in drought-tolerant cowpea. Funct. Plant Biol. 39, 306–322. doi: 10.1071/FP11282
Bhatnagar-Mathur, P., Devi, M. J., Reddy, D. S., Lavanya, M., Vadez, V., Serraj, R., et al. (2007). Stress-inducible expression of At DREB1A in transgenic peanut (Arachis hypogaea L.) increases transpiration efficiency under water-limiting conditions. Plant Cell Rep. 26, 2071–2082. doi: 10.1007/s00299-007-0406-8
Bienert, G. P., Bienert, M. D., Jahn, T. P., Boutry, M., and Chaumont, F. (2011). Solanaceae XIPs are plasma membrane aquaporins that facilitate the transport of many uncharged substrates. Plant J. 66, 306–317. doi: 10.1111/j.1365-313X.2011.04496.x
Bloom, A. J., Zwieniecki, M. A., Passioura, J. B., Randall, L. B., Holbrook, N. M., and St Clair, D. A. (2004). Water relations under root chilling in a sensitive and tolerant tomato species. Plant Cell Environ. 27, 971–979.
Chaumont, F., Barrieu, F., Wojcik, E., Chrispeels, M. J., and Jung, R. (2001). Aquaporins constitute a large and highly divergent protein family in maize. Plant Physiol. 125, 1206–1215. doi: 10.1104/pp.125.3.1206
Choudhary, S., Sinclair, T. R., and Prasad, P. V. (2013). Hydraulic conductance of intact plants of two contrasting sorghum lines, SC15 and SC1205. Funct. Plant Biol. 40, 730–738. doi: 10.1071/FP12338
Crawford, A. J., McLachlan, D. H., Hetherington, A. M., and Franklin, K. A. (2012). High temperature exposure increases plant cooling capacity. Curr. Biol. 22, R396–R397. doi: 10.1016/j.cub.2012.03.044
Danielson, J. Å, and Johanson, U. (2008). Unexpected complexity of the aquaporin gene family in the moss Physcomitrella patens. BMC Plant Biol. 8:45. doi: 10.1186/1471-2229-8-45
De Rosa, A. Watson-Lazowski, A., Evans, J. R., and Groszmann, M. (2020). Genome-wide identification and characterisation of Aquaporins in Nicotiana tabacum and their relationships with other Solanaceae species. BMC Plant Biol. 20, 1–29. doi: 10.1186/s12870-020-02412-5
Deshmukh, R. K., Sonah, H., and Bélanger, R. R. (2016). Plant Aquaporins: genome-wide identification, transcriptomics, proteomics, and advanced analytical tools. Front. Plant Sci. 7:1896. doi: 10.3389/fpls.2016.01896
Devi, M. J., Sinclair, T. R., and Vadez, V. (2010). Genotypic variation in peanut for transpiration response to vapor pressure deficit. Crop Sci. 50, 191–196.
Divya, K., Kishor, P. B. K., Bhatnagar-Mathur, P., Singam, P., Sharma, K. K., Vadez, V., et al. (2019). Isolation and functional characterization of three abiotic stress-inducible (Apx, Dhn and Hsc70) promoters from pearl millet (Pennisetum glaucum L.). Mol. Biol. Rep. 46, 6039–6052. doi: 10.1007/s11033-019-05039-4
Fetter, K., Van Wilder, V., Moshelion, M., and Chaumont, F. (2004). Interactions between plasma membrane aquaporins modulate their water channel activity. Plant Cell 16, 215–228. doi: 10.1105/tpc.017194
Fletcher, A. L., Sinclair, T. R., and Allen, L. H. (2007). Transpiration responses to vapor pressure deficit in well-watered ‘slow-wilting’and commercial soybean. Environ. Exp. Bot. 61, 145–151. doi: 10.1016/j.envexpbot.2007.05.004
Forrest, K. L., and Bhave, M. (2008). The PIP and TIP aquaporins in wheat form a large and diverse family with unique gene structures and functionally important features. Funct. Integr. Genomics 8, 115–133. doi: 10.1007/s10142-007-0065-4
Galmés, J., Pou, A., Alsina, M. M., Tomas, M., Medrano, H., and Flexas, J. (2007). Aquaporin expression in response to different water stress intensities and recovery in Richter-110 (Vitis sp.): relationship with ecophysiological status. Planta 226, 671–681. doi: 10.1007/s00425-007-0515-1
Gasteiger, E., Hoogland, C., Gattiker, A., Wilkins, M. R., Appel, R. D., and Bairoch, A. (2005). “Protein identification and analysis tools on the ExPASy server,” in The Proteomics Protocols Handbook, ed. J. M. Walker (Totowa, NJ: Humana Press), 571–607. doi: 10.1385/1-59259-584-7:531
Georgii, E., Jin, M., Zhao, J., Kanawati, B., Schmitt-Kopplin, P., Albert, A., et al. (2017). Relationships between drought, heat and air humidity responses revealed by transcriptome-metabolome co-analysis. BMC Plant Biol. 17:120. doi: 10.1186/s12870-017-1062-y
Gholipoor, M., Choudhary, S., Sinclair, T. R., Messina, C. D., and Cooper, M. (2013). Transpiration response of maize hybrids to atmospheric vapour pressure deficit. J. Agron. Crop Sci. 199, 155–160. doi: 10.1016/j.plaphy.2020.07.023
Gholipoor, M., Prasad, P. V., Mutava, R. N., and Sinclair, T. R. (2010). Genetic variability of transpiration response to vapor pressure deficit among sorghum genotypes. Field Crops Res. 119, 85–90.
Gilbert, M. E., Holbrook, N. M., Zwieniecki, M. A., Sadok, W., and Sinclair, T. R. (2011). Field confirmation of genetic variation in soybean transpiration response to vapor pressure deficit and photosynthetic compensation. Field Crops Res. 124, 85–92. doi: 10.1016/j.fcr.2011.06.011
Gomes, D., Agasse, A., Thiébaud, P., Delrot, S., Gerós, H., and Chaumont, F. (2009). Aquaporins are multifunctional water and solute transporters highly divergent in living organisms. Biochim. Biophys. Acta Biomemb. 1788, 1213–1228. doi: 10.1016/j.bbamem.2009.03.009
Grondin, A., Affortit, P., Tranchant-Dubreuil, C., de la Fuente-Cantó, C., Mariac, C., Gantet, P., et al. (2020). Aquaporins are main contributors to root hydraulic conductivity in pearl millet [Pennisetum glaucum (L) R. Br.]. PLoS One 15:e0233481. doi: 10.1371/journal.pone.0233481
Guo, L., Wang, Z. Y., Lin, H., Cui, W. E., Chen, J., Liu, M., et al. (2006). Expression and functional analysis of the rice plasma-membrane intrinsic protein gene family. Cell Res. 16:277. doi: 10.1038/sj.cr.7310035
Guo, M., Liu, J. H., Lu, J. P., Zhai, Y. F., Wang, H., Gong, Z. H., et al. (2015). Genome-wide analysis of the CaHsp20 gene family in pepper: comprehensive sequence and expression profile analysis under heat stress. Front. Plant Sci. 6:806. doi: 10.3389/fpls.2015.00806
Gupta, A. B., and Sankararamakrishnan, R. (2009). Genome-wide analysis of major intrinsic proteins in the tree plant Populus trichocarpa: characterization of XIP subfamily of aquaporins from evolutionary perspective. BMC Plant Biol. 9:134. doi: 10.1186/1471-2229-9-134
Hellemans, J., Mortier, G., De Paepe, A., Speleman, F., and Vandesompele, J. (2007). qBase relative quantification framework and software for management and automated analysis of real-time quantitative PCR data. Genome Biol. 8:R19. doi: 10.1186/gb-2007-8-2-r19
Hove, R. M., Ziemann, M., and Bhave, M. (2015). Identification and expression analysis of the barley (Hordeum vulgare L.) aquaporin gene family. PLoS One 10:e0128025. doi: 10.1371/journal.pone.0128025
Hu, B., Jin, J., Guo, A. Y., Zhang, H., Luo, J., and Gao, G. (2015). GSDS 2.0: an upgraded gene feature visualization server. Bioinformatics 31, 1296–1297. doi: 10.1093/bioinformatics/btu817
Hufstetler, E. V., Boerma, H. R., Carter, T. E., and Earl, H. J. (2007). Genotypic variation for three physiological traits affecting drought tolerance in soybean. Crop Sci. 47, 25–35. doi: 10.2135/cropsci2006.04.0243
Isoda, A., and Wang, P. (2002). Leaf temperature and transpiration of field grown cotton and soybean under arid and humid conditions. Plant Prod. Sci. 5, 224–228.
Jang, J. Y., Kim, D. G., Kim, Y. O., Kim, J. S., and Kang, H. (2004). An expression analysis of a gene family encoding plasma membrane aquaporins in response to abiotic stresses in Arabidopsis thaliana. Plant Mol. Biol. 5, 713–725.
Johanson, U., Karlsson, M., Johansson, I., Gustavsson, S., Sjövall, S., Fraysse, L., et al. (2001). The complete set of genes encoding major intrinsic proteins in Arabidopsis provides a framework for a new nomenclature for major intrinsic proteins in plants. Plant Physiol. 126, 1358–1369. doi: 10.1104/pp.126.4.1358
Jones, H. G., Stoll, M., Santos, T., Sousa, C. D., Chaves, M. M., and Grant, O. M. (2002). Use of infrared thermography for monitoring stomatal closure in the field: application to grapevine. J. Exp. Bot. 53, 2249–2260. doi: 10.1093/jxb/erf083
Kholová, J., and Vadez, V. (2013). Water extraction under terminal drought explains the genotypic differences in yield, not the anti-oxidant changes in leaves of pearl millet (Pennisetum glaucum). Funct. Plant Biol. 40, 44–53. doi: 10.1071/FP12181
Kholová, J., Hash, C. T., Kakkera, A., Kocova, M., and Vadez, V. (2010a). Constitutive water-conserving mechanisms are correlated with the terminal drought tolerance of pearl millet (Pennisetum glaucum (L.) R. Br.). J. Exp. Bot. 61, 369–377. doi: 10.1093/jxb/erp314
Kholová, J., Hash, C. T., Kumar, P. L., Yadav, R. S., Kočová, M., and Vadez, V. (2010b). Terminal drought-tolerant pearl millet [Pennisetum glaucum (L.) R. Br.] have high leaf ABA and limit transpiration at high vapour pressure deficit. J. Exp. Bot. 61, 1431–1440. doi: 10.1093/jxb/erq013
Kholová, J., Murugesan, T., Kaliamoorthy, S., Malayee, S., Baddam, R., Hammer, G. L., et al. (2014). Modelling the effect of plant water use traits on yield and stay-green expression in sorghum. Funct. Plant Biol. 41, 1019–1034.
Kholová, J., Nepolean, T., Hash, C. T., Supriya, A., Rajaram, V., Senthilvel, S., et al. (2012). Water saving traits co-map with a major terminal drought tolerance quantitative trait locus in pearl millet [Pennisetum glaucum (L.) R. Br.]. Mol. Breed. 30, 1337–1353.
Kiani, S. P., Grieu, P., Maury, P., Hewezi, T., Gentzbittel, L., and Sarrafi, A. (2007). Genetic variability for physiological traits under drought conditions and differential expression of water stress-associated genes in sunflower (Helianthus annuus L.). Theor. Appl. Genet. 114, 193–207. doi: 10.1007/s00122-006-0419-7
Kong, W., Yang, S., Wang, Y., Bendahmane, M., and Fu, X. (2017). Genome-wide identification and characterization of aquaporin gene family in Beta vulgaris. PeerJ 5:e3747. doi: 10.7717/peerj.3747
Lescot, M., Déhais, P., Thijs, G., Marchal, K., Moreau, Y., Van de Peer, Y., et al. (2002). PlantCARE, a database of plant cis-acting regulatory elements and a portal to tools for in silico analysis of promoter sequences. Nucleic Acids Res. 30, 325–327. doi: 10.1093/nar/30.1.325
Li, G. W., Zhang, M. H., Cai, W. M., Sun, W. N., and Su, W. A. (2008). Characterization of OsPIP2; 7, a water channel protein in rice. Plant Cell Physiol. 49, 1851–1858. doi: 10.1093/pcp/pcn166
Li, J., Yu, G., Sun, X., Liu, Y., Liu, J., Zhang, X., et al. (2015). AcPIP2, a plasma membrane intrinsic protein from halophyte Atriplex canescens, enhances plant growth rate and abiotic stress tolerance when overexpressed in Arabidopsis thaliana. Plant Cell Rep. 34, 1401–1415. doi: 10.1007/s00299-015-1796-7
Li, R., Wang, J., Li, S., Zhang, L., Qi, C., Weeda, S., et al. (2016). Plasma membrane intrinsic proteins SlPIP2; 1, SlPIP2; 7 and SlPIP2; 5 conferring enhanced drought stress tolerance in tomato. Sci. Rep. 6:31814. doi: 10.1038/srep31814
Li, Y., Wang, G. X., Xin, M., Yang, H. M., Wu, X. J., and Li, T. (2004). The parameters of guard cell calcium oscillation encodes stomatal oscillation and closure in Vicia faba. Plant Sci. 166, 415–421.
Liu, C., Li, C., Liang, D., Ma, F., Wang, S., Wang, P., et al. (2013). Aquaporin expression in response to water-deficit stress in two Malus species: relationship with physiological status and drought tolerance. Plant Growth Regul. 70, 187–197.
Liu, J., Qin, G., Liu, C., Liu, X., Zhou, J., Li, J., et al. (2021). Genome-wide identification of candidate aquaporins involved in water accumulation of pomegranate outer seed coat. PeerJ 9:e11810. doi: 10.7717/peerj.11810
Liu, S., Fukumoto, T., Gena, P., Feng, P., Sun, Q., Li, Q., et al. (2019). Ectopic expression of a rice plasma membrane intrinsic protein (OsPIP1;3) promotes plant growth and water uptake. Plant J. 102, 779–796. doi: 10.1111/tpj.14662
Livak, K. J., and Schmittgen, T. D. (2001). Analysis of relative gene expression data using real-time quantitative PCR and the 2-ΔΔCT method. Methods 25, 402–408.
Luu, D. T., and Maurel, C. (2005). Aquaporins in a challenging environment: molecular gears for adjusting plant water status. Plant Cell Environ. 28, 85–96.
Madrid-Espinoza, J., Brunel-Saldias, N., Guerra, F. P., Gutiérrez, A., and Del Pozo, A. (2018). Genome-wide identification and transcriptional regulation of aquaporin genes in bread wheat (Triticum aestivum L.) under water stress. Genes 9:497. doi: 10.3390/genes9100497
Mahdieh, M., Mostajeran, A., Horie, T., and Katsuhara, M. (2008). Drought stress alters water relations and expression of PIP-type aquaporin genes in Nicotiana tabacum plants. Plant Cell Physiol. 49, 801–813. doi: 10.1093/pcp/pcn054
Martre, P., Morillon, R. l., Barrieu, F. o., North, G. B., Nobel, P. S., and Chrispeels, M. J. (2002). Plasma membrane aquaporins play a significant role during recovery from water deficit. Plant Physiol. 130, 2101–2110. doi: 10.1104/pp.009019
Maurel, C., Boursiac, Y., Luu, D. T., Santoni, V., Shahzad, Z., and Verdoucq, L. (2015). Aquaporins in plants. Physiol. Rev. 95, 1321–1358.
Maurel, C., Verdoucq, L., Luu, D. T., and Santoni, V. (2008). Plant aquaporins: membrane channels with multiple integrated functions. Annu. Rev. Plant Biol. 59, 595–624. doi: 10.1146/annurev.arplant.59.032607.092734
Möller, S., Croning, M. D., and Apweiler, R. (2001). Evaluation of methods for the prediction of membrane spanning regions. Bioinformatics 17, 646–653. doi: 10.1093/bioinformatics/17.7.646
Mosa, K. A., Kumar, K., Chhikara, S., Mcdermott, J., Liu, Z., Musante, C., et al. (2012). Members of rice plasma membrane intrinsic proteins subfamily are involved in arsenite permeability and tolerance in plants. Transgenic Res. 21, 1265–1277. doi: 10.1007/s11248-012-9600-8
Nambiar, V. S., Dhaduk, J. J., Sareen, N., Shahu, T., and Desai, R. (2011). Potential functional implications of pearl millet (Pennisetum glaucum) in health and disease. J. Appl. Pharm. Sci. 1:62.
Nguyen, M. X., Moon, S., and Jung, K. H. (2013). Genome-wide expression analysis of rice aquaporin genes and development of a functional gene network mediated by aquaporin expression in roots. Planta 238, 669–681. doi: 10.1007/s00425-013-1918-9
Pardossi, A., Vernieri, P., and Tognoni, F. (1992). Involvement of abscisic acid in regulating water status in Phaseolus vulgaris L. during chilling. Plant Physiol. 100, 1243–1250. doi: 10.1104/pp.100.3.1243
Peng, Y., Arora, R., Li, G., Wang, X., and Fessehaie, A. (2008). Rhododendron catawbiense plasma membrane intrinsic proteins are aquaporins, and their over-expression compromises constitutive freezing tolerance and cold acclimation ability of transgenic Arabidopsis plants. Plant Cell Environ. 31, 1275–1289. doi: 10.1111/j.1365-3040.2008.01840.x
Prasch, C. M., and Sonnewald, U. (2013). Simultaneous application of heat, drought, and virus to Arabidopsis plants reveals significant shifts in signaling networks. Plant Physiol. 162, 1849–1866. doi: 10.1104/pp.113.221044
Ranganathan, K., Cooke, J. E., El Kayal, W., Equiza, M. A., Vaziriyeganeh, M., and Zwiazek, J. J. (2017). Overexpression of PIP2; 5 aquaporin alleviates gas exchange and growth inhibition in poplars exposed to mild osmotic stress with polyethylene glycol. Acta Physiol. Plant. 39:187.
Ranganathan, K., El Kayal, W., Cooke, J. E., and Zwiazek, J. J. (2016). Responses of hybrid aspen over-expressing a PIP2; 5 aquaporin to low root temperature. J. Plant Physiol. 192, 98–104. doi: 10.1016/j.jplph.2016.02.001
Reddy, P. S., Gupta, S., Yeshvekar, R. K., Chakravartty, N., Kaliamoorthy, S., Shankhapal, A. R., et al. (2021). Genome-wide miRNAs profiles of pearl millet under contrasting high vapor pressure deficit reveal their functional roles in drought stress adaptations. Physiol. Plant. 174:e13521. doi: 10.1111/ppl.13521
Reddy, P. S., Rao, T. S. R. B., Sharma, K. K., and Vadez, V. (2015a). Genome-wide identification and characterization of the aquaporin gene family in Sorghum bicolor (L.). Plant Gene 1, 18–28.
Reddy, P. S., Reddy, D. S., Sharma, K. K., Bhatnagar-Mathur, P., and Vadez, V. (2015b). Cloning and validation of reference genes for normalization of gene expression studies in pearl millet [Pennisetum glaucum (L.) R. Br.] by quantitative real-time PCR. Plant Gene 1, 35–42.
Reddy, P. S., Tharanya, M., Sivasakthi, K., Srikanth, M., Hash, C. T., Kholova, J., et al. (2017). Molecular cloning and expression analysis of aquaporin genes in pearl millet [Pennisetum glaucum (L) R. Br.] genotypes contrasting in their transpiration response to high vapour pressure deficits. Plant Sci. 265, 167–176. doi: 10.1016/j.plantsci.2017.10.005
Sade, N., Gebretsadik, M., Seligmann, R., Schwartz, A., Wallach, R., and Moshelion, M. (2010). The role of tobacco Aquaporin1 in improving water use efficiency, hydraulic conductivity, and yield production under salt stress. Plant Physiol. 152, 245–254. doi: 10.1104/pp.109.145854
Sakurai, J., Ishikawa, F., Yamaguchi, T., Uemura, M., and Maeshima, M. (2005). Identification of 33 rice aquaporin genes and analysis of their expression and function. Plant Cell Physiol. 46, 1568–1577. doi: 10.1093/pcp/pci172
Schmidt, G. W., and Delaney, S. K. (2010). Stable internal reference genes for normalization of real-time RT-PCR in tobacco (Nicotiana tabacum) during development and abiotic stress. Mol. Genet. Genomics 283, 233–241. doi: 10.1007/s00438-010-0511-1
Serraj, R., Hash, C. T., Rizvi, S. M. H., Sharma, A., Yadav, R. S., and Bidinger, F. R. (2005). Recent advances in marker-assisted selection for drought tolerance in pearl millet. Plant Prod. Sci. 8, 334–337. doi: 10.1626/pps.8.334
Shekoofa, A., and Sinclair, T. R. (2018). Aquaporin activity to improve crop drought tolerance. Cells 7:123. doi: 10.3390/cells7090123
Singh, R. K., Shweta, S., Muthamilarasan, M., Rani, R., and Prasad, M. (2019). Study on aquaporins of Setariaita lica suggests the involvement of SiPIP3; 1 and SiSIP1; 1 in abiotic stress response. Funct. Integr. Genomics 19, 587–596. doi: 10.1007/s10142-018-00653-0
Sivasakthi, K., Zaman-Allah, M., Tharanya, M., Kholová, J., Thirunalasundari, T., and Vadez, V. (2017b). “Chickpea,” in Water-Conservation Traits to Increase Crop Yields in Water-deficit Environments, ed. T. R. Sinclair (Cham: Springer), 35–45.
Sivasakthi, K., Tharanya, M., Kholová, J., Wangari Muriuki, R., Thirunalasundari, T., and Vadez, V. (2017a). Chickpea genotypes contrasting for vigor and canopy conductance also differ in their dependence on different water transport pathways. Front. Plant Sci. 8:1663. doi: 10.3389/fpls.2017.01663
Sivasakthi, K., Tharanya, M. Zaman-Allah, M. Kholová, J., Thirunalasundari, T., and Vadez, V. (2020). Transpiration difference under high evaporative demand in chickpea (Cicer arietinum L.) may be explained by differences in the water transport pathway in the root cylinder. Plant Biol. 22, 769–780. doi: 10.1111/plb.13147
Sonah, H., Deshmukh, R. K., Labbé, C., and Bélanger, R. R. (2017). Analysis of aquaporins in Brassicaceae species reveals high-level of conservation and dynamic role against biotic and abiotic stress in canola. Sci. Rep. 7:2771. doi: 10.1038/s41598-017-02877-9
Song, J., Ye, G., Qian, Z., and Ye, Q. (2016). Virus-induced plasma membrane aquaporin PsPIP2; 1 silencing inhibits plant water transport of Pisum sativum. Bot. Studies 57:15. doi: 10.1186/s40529-016-0135-9
Sreedharan, S., Shekhawat, U. K., and Ganapathi, T. R. (2013). Transgenic banana plants overexpressing a native plasma membrane aquaporin M usa PIP 1; 2 display high tolerance levels to different abiotic stresses. Plant Biotech. J. 11, 942–952. doi: 10.1111/pbi.12086
Steudle, E. (2000). Water uptake by roots: effects of water deficit. J. Exp. Bot. 51, 1531–1542. doi: 10.1093/jexbot/51.350.1531
Sun, H., Wang, S., Lou, Y., Zhu, C., Zhao, H., Li, Y., et al. (2021). A bamboo leaf-specific aquaporin gene PePIP2; 7 is involved in abiotic stress response. Plant Cell Rep. 40, 1104–1114. doi: 10.1007/s00299-021-02673-w
Suyama, M., Harrington, E., Bork, P., and Torrents, D. (2006). Identification and analysis of genes and pseudogenes within duplicated regions in the human and mouse genomes. PLoS Comput. Biol. 2:e76. doi: 10.1371/journal.pcbi.0020076
Tamura, K., Stecher, G., Peterson, D., Filipski, A., and Kumar, S. (2013). MEGA6: molecular evolutionary genetics analysis version 6.0. Mol. Biol. Evol. 30, 2725–2729.
Tharanya, M., Kholová, J., Sivasakthi, K., Thirunalasundari, T., and Vadez, V. (2017). “Pearl Millet,” in Water-Conservation Traits to Increase Crop Yields in Water-deficit Environments, ed. T. R. Sinclair (Cham: Springer International Publishing), 73–83.
Tharanya, M., Sivasakthi, K., Barzana, G., Kholová, J., Thirunalasundari, T., and Vadez, V. (2018). Pearl millet (Pennisetum glaucum) contrasting for the transpiration response to vapour pressure deficit also differ in their dependence on the symplastic and apoplastic water transport pathways. Funct. Plant Biol. 45, 719–736. doi: 10.1071/FP17161
Tsuchihira, A., Hanba, Y. T., Kato, N., Doi, T., Kawazu, T., and Maeshima, M. (2010). Effect of overexpression of radish plasma membrane aquaporins on water-use efficiency, photosynthesis and growth of Eucalyptus trees. Tree Physiol. 30, 417–430. doi: 10.1093/treephys/tpp127
Tyerman, S. D., Niemietz, C. M., and Bramley, H. (2002). Plant aquaporins: multifunctional water and solute channels with expanding roles. Plant Cell. Environ. 25, 173–194. doi: 10.1046/j.0016-8025.2001.00791.x
Vadez, V., and Sinclair, T. R. (2001). Leaf ureide degradation and N2 fixation tolerance to water deficit in soybean. J. Exp. Bot. 52, 153–159. doi: 10.1093/jexbot/52.354.153
Vadez, V., Hash, T., Bidinger, F. R., and Kholova, J. (2012). II. 1.5 Phenotyping pearl millet for adaptation to drought. Front. Physiol. 3:386. doi: 10.3389/fphys.2012.00386
Vadez, V., Kholova, J., Medina, S., Kakkera, A., and Anderberg, H. (2014). Transpiration efficiency: new insights into an old story. J. Exp. Bot. 65, 6141–6153. doi: 10.1093/jxb/eru040
Vadez, V., Kholova, J., Zaman-Allah, M., and Belko, N. (2013). Water: the most important ‘molecular’component of water stress tolerance research. Funct. Plant Biol. 40, 1310–1322. doi: 10.1071/FP13149
Vernieri, P., Lenzi, A., Figaro, M., Tognoni, F., and Pardossi, A. (2001). How the roots contribute to the ability of Phaseolus vulgaris L. to cope with chilling-induced water stress. J. Exp. Bot. 52, 2199–2206. doi: 10.1093/jexbot/52.364.2199
Wang, L., Liu, Y., Feng, S., Yang, J., Li, D., and Zhang, J. (2017). Roles of plasmalemma aquaporin gene StPIP1 in enhancing drought tolerance in potato. Front. Plant Sci. 8:616. doi: 10.3389/fpls.2017.00616
Xu, Y., Hu, W., Liu, J., Song, S., Hou, X., Jia, C., et al. (2020). An aquaporin gene MaPIP2-7 is involved in tolerance to drought, cold and salt stresses in transgenic banana (Musa acuminata L.). Plant Physiol. Biochem. 147, 66–76. doi: 10.1016/j.plaphy.2019.12.011
Xu, Y., Liu, J., Jia, C., Hu, W., Song, S., Xu, B., et al. (2021). Overexpression of a banana aquaporin gene MaPIP1; 1 enhances tolerance to multiple abiotic stresses in transgenic banana and analysis of its interacting transcription factors. Front. Plant Sci. 12:699230. doi: 10.3389/fpls.2021.699230
Yaneff, A., Sigaut, L., Marquez, M., Alleva, K., Pietrasanta, L. I., and Amodeo, G. (2014). Heteromerization of PIP aquaporins affects their intrinsic permeability. Proc. Nat. Acad. Sci. U.S.A. 111, 231–236. doi: 10.1073/pnas.1316537111
Yang, Z., Sinclair, T. R., Zhu, M., Messina, C. D., Cooper, M., and Hammer, G. L. (2012). Temperature effect on transpiration response of maize plants to vapour pressure deficit. Environ. Exp. Bot. 78, 157–162. doi: 10.1016/j.envexpbot.2011.12.034
Zaman-Allah, M., Jenkinson, D. M., and Vadez, V. (2011b). Chickpea genotypes contrasting for seed yield under terminal drought stress in the field differ for traits related to the control of water use. Funct. Plant Biol. 38, 270–281. doi: 10.1071/FP10244
Zaman-Allah, M., Jenkinson, D. M., and Vadez, V. (2011a). A conservative pattern of water use, rather than deep or profuse rooting, is critical for the terminal drought tolerance of chickpea. Environ. Exp. Bot. 62, 4239–4252. doi: 10.1093/jxb/err139
Zargar, S. M., Nagar, P., Deshmukh, R., Nazir, M., Wani, A. A., Masoodi, K. Z., et al. (2017). Aquaporins as potential drought tolerance inducing proteins: Towards instigating stress tolerance. J. Proteomics 169, 233–238. doi: 10.1016/j.jprot.2017.04.010
Zhang, D. Y., Ali, Z., Wang, C. B., Xu, L., Yi, J. X., Xu, Z. L., et al. (2013). Genome-wide sequence characterization and expression analysis of major intrinsic proteins in soybean (Glycine max L.). PLoS One 8:e56312. doi: 10.1371/journal.pone.0056312
Zhou, S., Hu, W., Deng, X., Ma, Z., Chen, L., Huang, C., et al. (2012). Overexpression of the wheat aquaporin gene, TaAQP7, enhances drought tolerance in transgenic tobacco. PLoS One 7:e52439. doi: 10.1371/journal.pone.0052439
Keywords: canopy temperature depression (CTD), exudation rate, Pennisetum glaucum, PgPIP2;6, progressive drought stress, transpiration rate, transpiration efficiency, vapor pressure deficit
Citation: Reddy PS, Dhaware MG, Sivasakthi K, Divya K, Nagaraju M, Sri Cindhuri K, Kavi Kishor PB, Bhatnagar-Mathur P, Vadez V and Sharma KK (2022) Pearl Millet Aquaporin Gene PgPIP2;6 Improves Abiotic Stress Tolerance in Transgenic Tobacco. Front. Plant Sci. 13:820996. doi: 10.3389/fpls.2022.820996
Received: 23 November 2021; Accepted: 13 January 2022;
Published: 09 March 2022.
Edited by:
Wolfram Weckwerth, University of Vienna, AustriaReviewed by:
Suprasanna Penna, Bhabha Atomic Research Centre (BARC), IndiaCopyright © 2022 Reddy, Dhaware, Sivasakthi, Divya, Nagaraju, Sri Cindhuri, Kavi Kishor, Bhatnagar-Mathur, Vadez and Sharma. This is an open-access article distributed under the terms of the Creative Commons Attribution License (CC BY). The use, distribution or reproduction in other forums is permitted, provided the original author(s) and the copyright owner(s) are credited and that the original publication in this journal is cited, in accordance with accepted academic practice. No use, distribution or reproduction is permitted which does not comply with these terms.
*Correspondence: Palakolanu Sudhakar Reddy, cC5zdWRoYWthcnJlZGR5QGNnaWFyLm9yZw==, cGFsYWtvbGFudXNyZWRkeUBnbWFpbC5jb20=
†Present address: Pooja Bhatnagar-Mathur, International Maize and Wheat Improvement Center (CIMMYT), Texcoco, Mexico
Disclaimer: All claims expressed in this article are solely those of the authors and do not necessarily represent those of their affiliated organizations, or those of the publisher, the editors and the reviewers. Any product that may be evaluated in this article or claim that may be made by its manufacturer is not guaranteed or endorsed by the publisher.
Research integrity at Frontiers
Learn more about the work of our research integrity team to safeguard the quality of each article we publish.