 Xin Cheng1†
 Jianjie He
 Maoteng Li
- 1College of Life Science and Technology, Huazhong University of Science and Technology, Wuhan, China
- 2Key Laboratory of Molecular Biophysics, the Ministry of Education of China, Wuhan, China
Tryptophan Aminotransferase of Arabidopsis1/Tryptophan Aminotransferase-Related (TAA1/TAR) proteins are the enzymes that involved in auxin biosynthesis pathway. The TAA1/TAR gene family has been systematically characterized in several plants but has not been well reported in Brassica napus. In the present study, a total of 102 BnTAR genes with different number of introns were identified. It was revealed that these genes are distributed unevenly and occurred as clusters on different chromosomes except for A4, A5, A10 and C4 in B. napus. Most of the these BnTAR genes are conserved despite of existing of gene loss and gene gain. In addition, the segmental replication and whole-genome replication events were both play an important role in the BnTAR gene family formation. Expression profiles analysis indicated that the expression of BnTAR gene showed two patterns, part of them were mainly expressed in roots, stems and leaves of vegetative organs, and the others were mainly expressed in flowers and seeds of reproductive organs. Further analysis showed that many of BnTAR genes were located in QTL intervals of oil content or seed weight, for example BnAMI10 was located in cqOC-C5-4 and cqSW-A2-2, it indicated that some of the BnTAR genes might have relationship with these two characteristics. This study provides a multidimensional analysis of the TAA1/TAR gene family and a new insight into its biological function in B. napus.
Introduction
Auxin is an essential phytohormone and controls almost every aspect during plant development (Paque and Weijers, 2016). At cellular level, auxin could stimulate cell division of cambium and cell elongation of branch, promote cell differentiation of xylem and phloem, and regulate callus morphogenesis (Paque and Weijers, 2016). At the organ and whole plant level, auxin could affect almost all developmental steps in plants from early embryogenesis to fruit ripening, and control organogenesis at the meristems, which determines the plant structure (Paque and Weijers, 2016). In addition, the application of auxin could reduce the lipid peroxidation of plant cells, thereby reducing the consumption of unsaturated fatty acids (Dhindsa et al., 1984). Meanwhile, it was also found that the biomass and oil yield was increased by adding appropriate amount of auxin in microalgal (Chang et al., 2022).
Indoleacetic acid (IAA) is the best-studied naturally active auxin. IAA is biosynthesized through two major ways: tryptophan (Trp)-dependent and Trp-independent pathways (Woodward and Bartel, 2005). The indole-3-pyruvic acid (IPyA) pathway, which is a tryptophan (Trp)-dependent pathway, appears to be the main contributing factor to the formation of free IAA (Zhao, 2012). There are two steps in the IPyA pathway to converse the Trp to IAA: The first step is catalyzed by the Tryptophan Aminotransferase of Arabidopsis 1 (TAA1), which belongs to TAA1-Related (TAA1/TAR) family of Trp aminotransferases that transfers the Trp to an alpha-keto acid, and to generate IPyA and another amino acid like L-glutamate (Zhao, 2012). The second step is transferring IPyA to IAA by an oxygen and NADPH-dependent reaction, which is catalyzed by the YUCCA (YUC) family of flavin monooxygenases (Zhao, 2012). Trp-independent pathways have not been fully explored yet, it was reported that some enzymes like Trp synthase α (TSA1) and indole synthase (INS) can catalyze the cleavage of indole 3-glycerol phosphate (IGP) to form indole and D-glyceraldehyde 3-phosphate (G3P), and indole was transformed into IAA (Zhang R. et al., 2008). In Arabidopsis genome, four genes were found to have close relationship with TAA1, which were referred as Tryptophan Aminotransferase Related 1-4 (TAR1, TAR2, TAR3, and TAR4) (Stepanova et al., 2008). It was revealed that the BnTAR proteins could classify into two families (Alliinase_C and Aminotran_1_2) according to the primary sequence and homology, which both belong to the superfamily of pyridoxal-5’-phosphate (PLP) dependent enzymes (Liepman and Olsen, 2004). The lack of the Epidermal Growth Factor (EGF) domain suggests that these proteins are not typical alliinases, although they share high sequence similarities with the EGF-alliinase group of C-S lyases (Stepanova et al., 2008).
B. napus is an important oil crop, it was an allotetraploid species that derived from the hybridization of B. rapa and B. oleracea in about 7500 years ago, its genome was contained many duplications as well as inversions and translocations (Chalhoub et al., 2014). Genomic differentiation events that resulted from whole-genome triplication (WGT) was occurred in Brassica species (Cheng et al., 2014). Structural and functional divergence of duplicate genes were also found in other gene families, such as the basic/helix-loop-helix (bHLH) gene family, the ionotropic glutamate receptor (iGluR) gene family, and the Receptor-like kinases (RLKs) gene family (Chiu et al., 2002; Shiu and Bleecker, 2003; Toledo-Ortiz et al., 2003). The characteristics of the duplicate genes suggested that the evolution could have caused an adaptive structural diversification, and this process was pervasive and could have contributed to the biological novelty in plants (Li et al., 2009). Thus, many duplicate genes have similar gene sequences but different functional performances (Liang et al., 2017).
Although there is one study on transaminases involved the TAA1/TAR protein of B. napus (Le Deunff et al., 2019), which suggests that TAA1/TAR not only play an important role in IAA biosynthesis but also in the plant nitrogen cycle. The previous studies have revealed that knock down of TAA1/TAR could lead to reduced plant height, decreased apical dominance, valveless gynoecia, vasculature defects, reduced organ number and complete sterility in Arabidopsis thaliana (Stepanova et al., 2008). Otherwise, over-expression of TaTAR could promote the root elongation (Shao et al., 2017). In addition, TAA1/TAR is also involved in ethylene response, it was revealed that the TAA1/TAR mutants were showed root-specific ethylene insensitivity in Arabidopsis (Stepanova et al., 2005). However, the gene evolution and structure of the BnTAR gene family in B. napus have not been reported.
Combined multiple methods to analyses the gene function was frequently used (Kim et al., 2016; Depuydt and Vandepoele, 2021). In our previous studies, many of the QTLs for the seed weight and oil content were identified (Raboanatahiry et al., 2018; Zhao et al., 2019; Yan et al., 2022), for instance, cqSW-A2-1, cqSW-A7-2, cqSW-C1-2 and cqSW-C9-2 for seed weight and cqOC-A1-1, cqOC-A9-11, cqOC-C2-2 and cqOC-C9-4 for oil content. These QTLs provided the convenience for the analysis of the BnTAR genes in QTL interval.
In this study, the systematical identification, structure and evolutionary analysis of the BnTAR gene family in B. napus were analyzed, and the expression patterns of several selected BnTAR members in different tissues of B. napus and their relationship with seed oil content and yield were also explored, which would provide informative clues to the future functional study.
Materials and methods
Identification of TAA1/TAR family genes in B. napus and other species
We used BLAST program to search Ensembl Plants (Ensembl Plants, RRID : SCR_008680) (http://plants.ensembl.org/index.html) (Yates et al., 2022) and 35 AtTAR paralogues, which are homologous to Arabidopsis thaliana AtTAR1 in phylogenetical tree, were identified. TAA1/TAR genes were identified in B. napus based on sequence similarity to the 36 TAR protein sequences of Arabidopsis by using the BLAT search program (BLAT, RRID : SCR_011919) in CNS-Genoscope database (CNS Genoscope, RRID : SCR_023020) (https://www.genoscope.cns.fr/brassicanapus/) (Chalhoub et al., 2014), and redundant sequences were removed manually. The TAA1/TAR genes in B. rapa and B. oleracea were obtained from the Brad database (Brassicaceae Database, RRID : SCR_023019) (http://brassicadb.cn) (Chen et al., 2022). All the candidate BnTAR genes were analyzed by using the Pfam database (Pfam, RRID : SCR_004726) (http://pfam.xfam.org/search) (El-Gebali et al., 2019), SMART database (SMART, RRID : SCR_005026) (http://smart.embl-heidelberg.de/) (Letunic et al., 2004) and NCBI Conserved Domain Search database (Conserved Domains Search, RRID : SCR_018729) (http://www.ncbi.nlm.nih.gov/Structure/cdd/wrpsb.cgi) (Lu et al., 2020) to confirm whether they are belonging to TAA1/TAR family or not. The categories of TAA1/TAR gene family in B. napus were using the Pfam analysis. For convenience, a univocal name is assigned to each BnTAR gene. For example, in the gene of ‘BnAMI1’, the first two letters denote the source organism Brassica napus, following by the family name and the gene number index (Ostergaard and King, 2008).
The TAR genes were also identified in other higher plants in order to trace the evolutionary origin of this family in Phytozome (Phytozome, RRID : SCR_006507) (https://phytozome-next.jgi.doe.gov/) (Goodstein et al., 2012), including of Amborella Trichopoda, Arabidopsis Thaliana, Brachypodium distachyon, Brassica oleracea, Brassica rapa, Chromochloris Zofingiensis, Glycine Max, Gossypium Hirsutum, Malus Domestica, Oryza Sativa and Zea Mays. In addition, NCBI BLAST (NCBI BLAST, RRID : SCR_004870) (https://blast.ncbi.nlm.nih.gov/Blast.cgi) (Altschul et al., 1990) was also used to search the TAA1/TAR family genes.
The chromosome locations, CDS lengths and the number of amino acids of the BnTAR genes were obtained from the CNS-Genoscope database (Chalhoub et al., 2014). The molecular weight (Mw) and isoelectric point (pI) were calculated by the Compute pI/Mw tool of ExPASy (ExPASy Bioinformatics Resource Portal, RRID : SCR_012880) (https://web.expasy.org/compute_pi/) (Bjellqvist et al., 1993; Bjellqvist et al., 1994). The grand average of hydropathy values (GRAVY) were calculated using the protein hydrophilicity analysis tool (protein hydrophilicity analysis tool, RRID : SCR_023015) (http://www.detaibio.com/sms2/protein_gravy.html) (Kyte and Doolittle, 1982). Subcellular location prediction was conducted using the Plant-mPLoc2.0 (Plant mPLoc, RRID : SCR_023014) (http://www.csbio.sjtu.edu.cn/bioinf/plant-multi/) (Chou and Shen, 2010) and Multi Loc2 (Multi Loc2, RRID : SCR_023013) (https://abi-services.informatik.uni-tuebingen.de/multiloc2/webloc.cgi) (Blum et al., 2009).
Multiple sequence alignment, phylogenetic and structural analysis
Multiple sequence alignment of all selected BnTAR, BrTAR and BoTAR protein sequences was conducted by using ClustalW (ClustalW, RRID : SCR_017277) in MEGA-X (MEGA, RRID : SCR_023017) (Higgins and Sharp, 1988; Tamura et al., 2013). The unrooted phylogenetic tree of full-length BnTAR protein sequences was constructed by using the MEGA-X with Neighbor-Joining (NJ) method (Saitou and Nei, 1987), and the bootstrap analysis was performed using 1,000 replicates.
Based on the alignments of their coding sequences with the corresponding genomic sequences, the exon-intron structures of the BnTAR genes were determined and a diagram was drawn by using Gene structure display server (Gene Structure Display Server, RRID : SCR_023011) (GSDS; http://gsds.gao-lab.org/) (Hu et al., 2015). The conserved motif structures of BnTAR genes were searched by using Multiple Expectation Maximization for Motif Elicitation (MEME Suite - Motif-based sequence analysis tools, RRID : SCR_001783) (http://alternate.meme-suite.org/) (Bailey et al., 2009). Secondary structural analysis was carried out by using the two following tools: PBIL GOR4 (PBIL GOR4, RRID : SCR_023012) (https://npsa-prabi.ibcp.fr/cgi-bin/npsa_automat.pl?page=npsa_gor4.html) (Jones, 1999) and PSIPRED (PSIPRED, RRID : SCR_010246) (http://bioinf.cs.ucl.ac.uk/psipred/) (Buchan et al., 2013). The Tertiary structures of the BnTARs were predicted using Phyre2 (Phyre, RRID : SCR_010270) (http://www.sbg.bio.ic.ac.uk/phyre2/html/page.cgi?id=index) (Kelley and Sternberg, 2009) and analyzed by VAST (Vector Alignment Search Tool, RRID : SCR_010655) (https://www.ncbi.nlm.nih.gov/Structure/VAST/vastsearch.html) (Gibrat et al., 1996).
Chromosomal location and gene duplication analysis
The chromosomal locations of the BnTAR genes were obtained from the CNS-Genoscope. Neighboring to homologous BnTAR genes on B. napus chromosomes or within a sequence distance of 50 kb were defined as tandemly duplicated BnTAR genes (Yu et al., 2014). According to the definition of tandemly duplicated genes, the genes with a distance of less than 50kb between the nearest genes as gene clusters. The synteny relationships between the BnTARs and AtTARs, BrTARs, and BoTARs were assessed by using the syntenic genes searching tool in BRAD database (http://brassicadb.org/brad/) (Wang et al., 2011) and the synteny tool in the B. napus Genome Browser (Chalhoub et al., 2014).
Calculation of the Ka/Ks
The paralogue pairs were determined according to the homology between A. thaliana and B. napus. The synonymous substitution rate and the non-synonymous substitution rate of all gene pairs were calculated by TBtools (TBtools, RRID : SCR_023018) (Toolbox for Biologists) (Chen et al., 2020).
Expression analysis of TAA1/TAR family genes in the intervals of QTLs for seed oil content and seed weight
The expression data of TAR family genes in various tissues and periods in B. napus could be accessed from BnTIR (BnTIR, RRID : SCR_023021) (http://yanglab.hzau.edu.cn/BnTIR) (Liu et al., 2021). The transcriptome data of seeds with different oil content or weight were obtained from the previous study of our group and can be found in the SRA database of NCBI (accessions for these SRA data: PRJNA661261 and PRJNA730112).
The QTLs from KN population for seed oil content and seed weight in B. napus were obtained from the previous published papers in our group (Raboanatahiry et al., 2018; Zhao et al., 2019; Yan et al., 2022), were used for determine the whether the TAA1/TAR family genes were located in the QTL interval or not. The KN population was derived from the microspore culture of F1 hybrids that derived from the hybridization between KenC-8 and N53-2, the oil content was about 40% and 50% in all cultivated environments, respectively (Wang et al., 2013), and the thousand seed weight was about 3.53 g and 3.81g in Dali of Shaanxi Province, respectively (Zhao et al., 2016). The genetic distances of the scanned QTLs are converted into physical distances according to the corresponding table (Table S8), in which the marker sequence is blasted on the genome to obtain the physical distance corresponding to the genetic distance. The start and end loci of the BnTAR genes were compared to the QTL interval to determine whether they were located within the QTL interval or not.
RNA extraction and RT-qPCR analysis
An RNAprep Pure Plant Plus Kit (Tiangen) was used to separate the total RNA from each frozen sample, and then ReverTra Ace® qPCR RT Master Mix with gDNA Remover (TOYOBO) was used to synthesize the first strand cDNA from the RNA according to the manufacturer’s instructions. Each reaction was repeated three times with a reaction volume of 20 μl containing 0.6 μl of gene-specific primers (1.0 μM), 1.0 μl of cDNA, 10 μl of SYBR green (TaKaRa), and 8.4 μl RNase-free double-distilled water. The PCR conditions were set as follows: Stage 1: 95°C for 5 min; stage 2: 40 cycles of 40 cycles, 95°C for 30 seconds, 55°C for 30 seconds, 72°C for 1 minute. In the stage 2, the fluorescence intensity was measured. A housekeeping gene (TIP41) was used as a reference for normalization and analyzed by using a Real-Time PCR System StepOne Plus (ABI), and each reaction was performed in triplicate. The primers for mRNA RT–qPCR are listed in Table S6.
Results
Genome-wide identification of the BnTAR superfamily genes in the B. napus genome
To identify the possible candidate BnTAR genes, we searched the CNS Genoscope database with the AtTAR genes for their homologies in B. napus. As a result, a total of 102 genes as BnTAR gene family members were identified, and it could be classified into Alliinase_C and Aminotran_1_2 two families based on conserved structural domains in Pfam database. The Alliinase_C family includes 12 members (named as from BnALL1 to BnALL12), and the other family includes 90 members (designated as BnAMI1- BnAMI90) (Table 1).
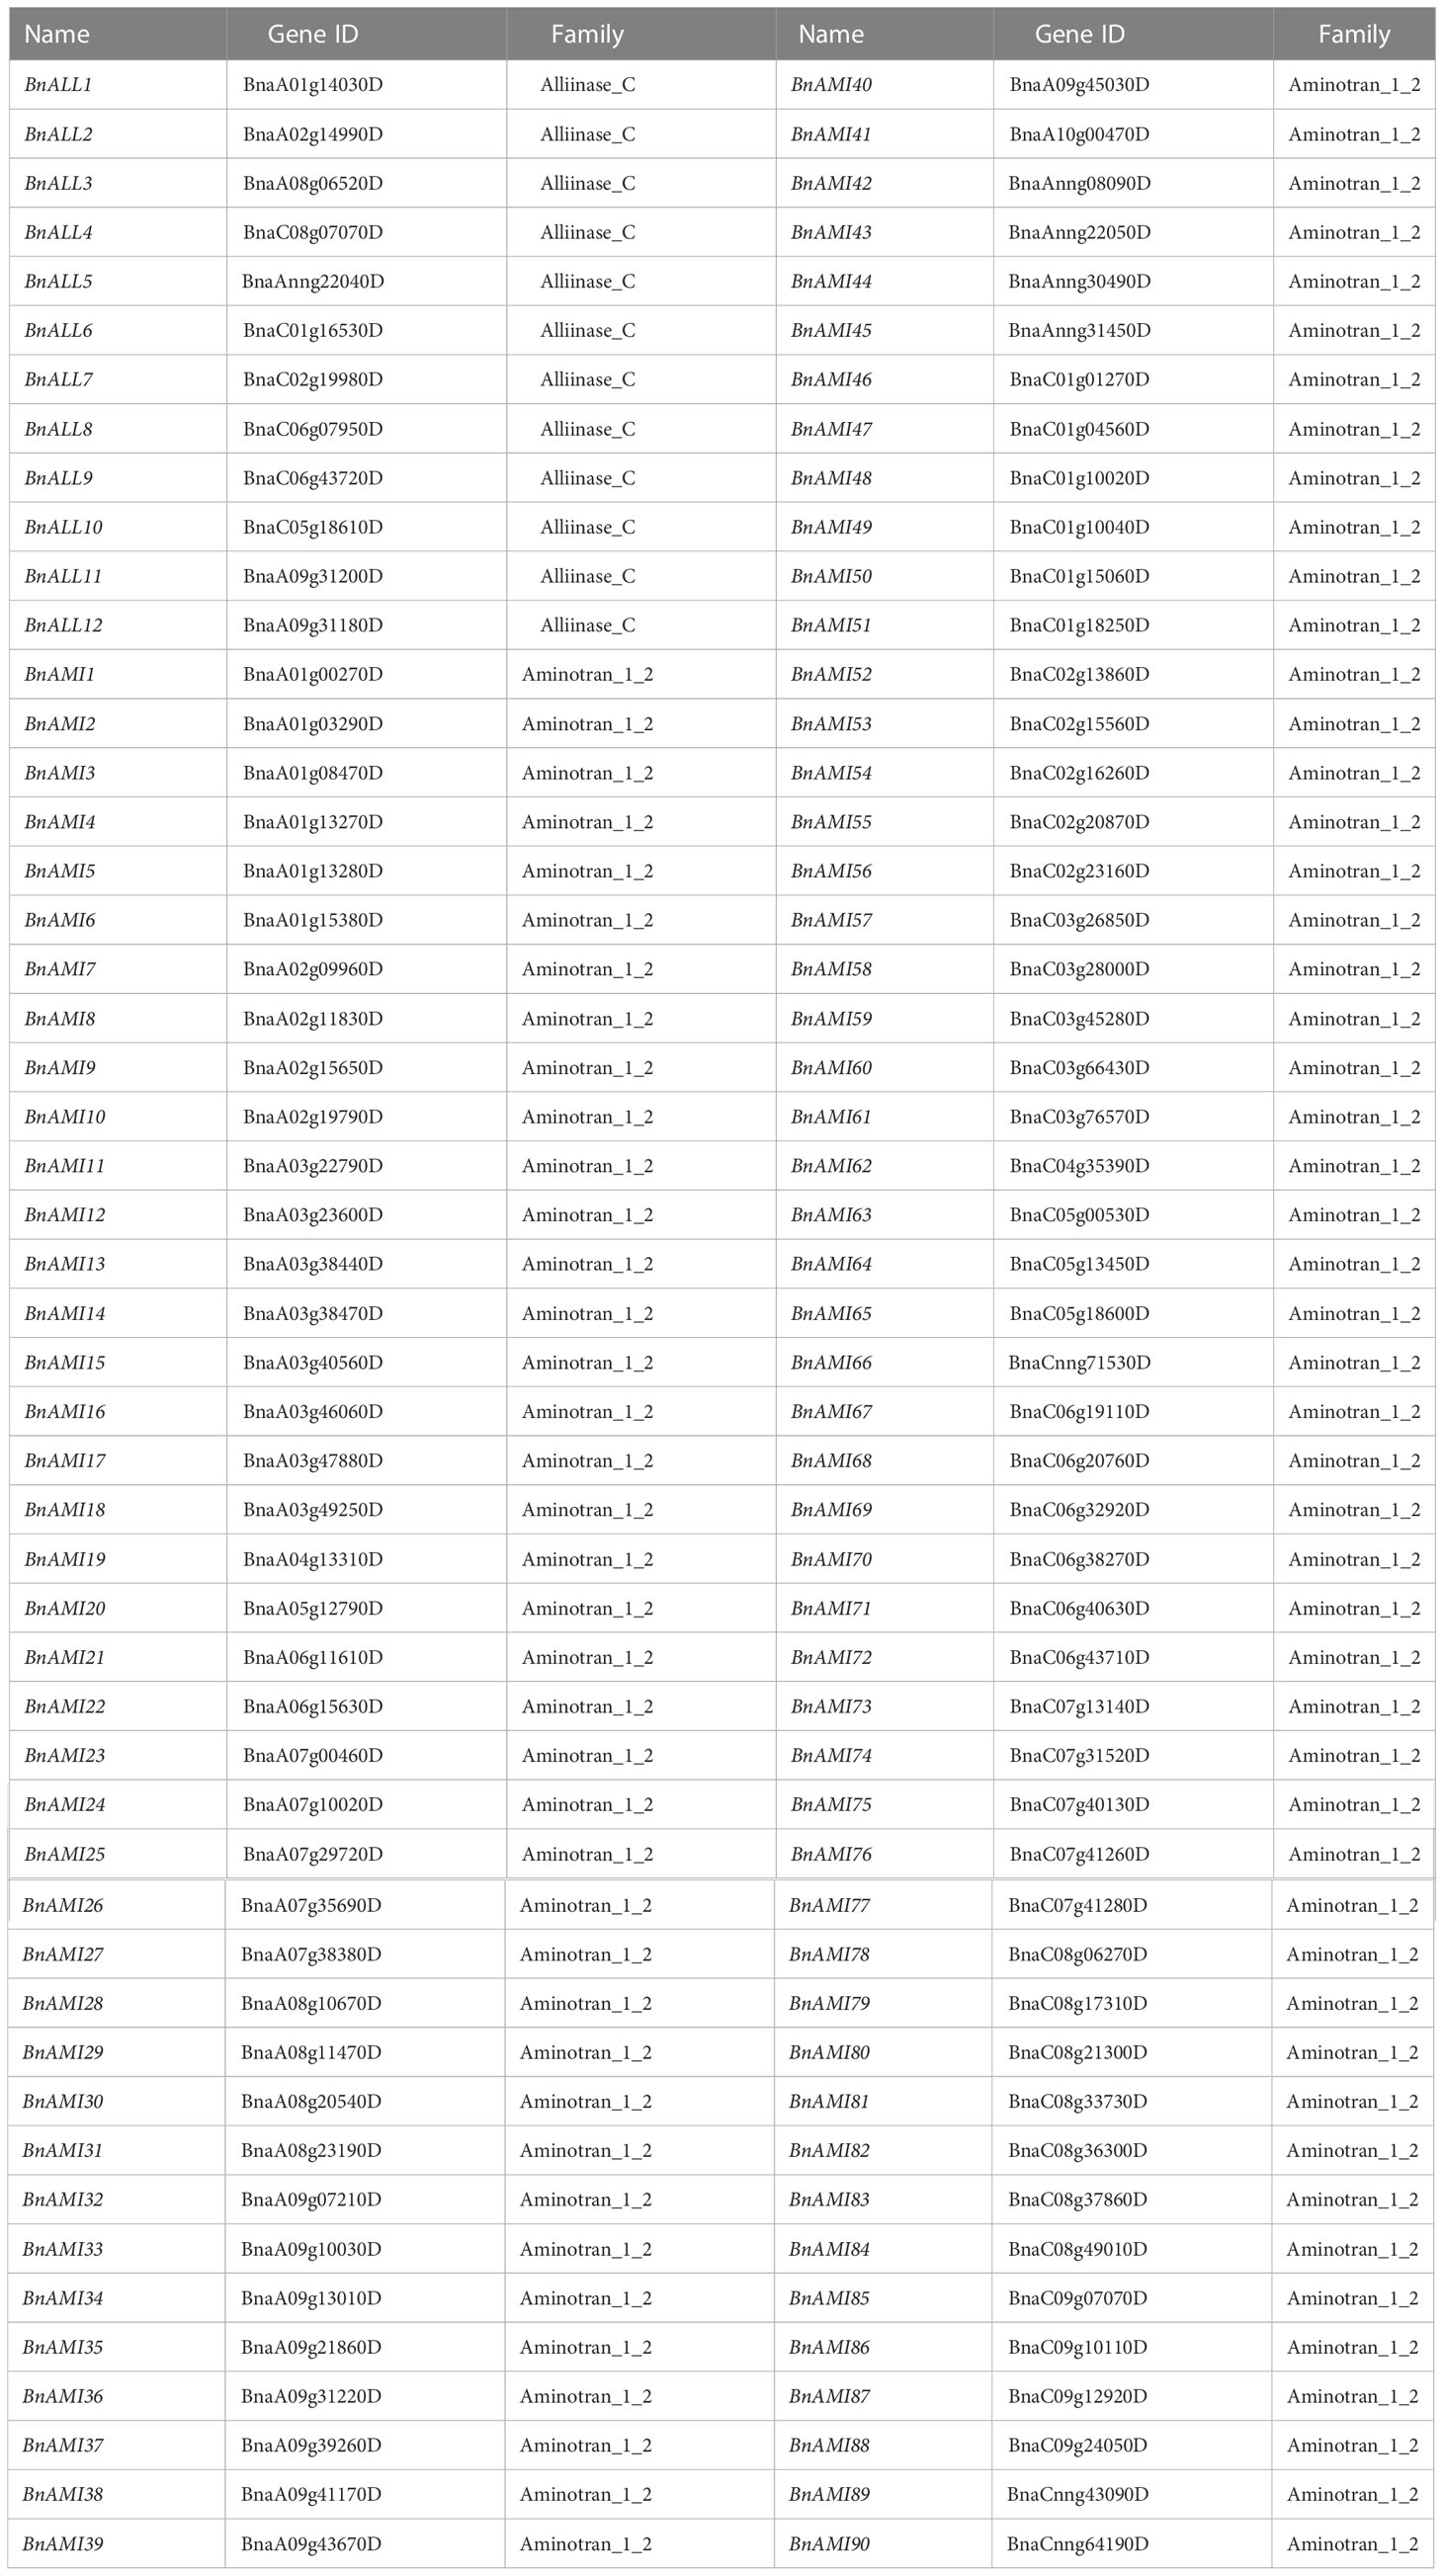
Table 1 Genome identification and classification of TARs genes in B. napus.
The properties of BnTAR were analyzed by Expasy database. All the BnTAR proteins had molecular weights less than 70 kDa, but the isoelectric points varied in a wide range, which are from 4.78 to 9.68 (Table S1). The hydrophilicity of BnTARs was assessed based on the grand average of hydropathy (GRAVY) value (Table S1). On average, the GRAVY values of BnALL proteins are higher than those of BnAMI proteins, it indicated the higher hydrophilicity of ALL proteins. Meanwhile, almost all the BnTARs with the GRAVY values less than zero, which demonstrated that most of BnTAR proteins are hydrophilic. The subcellular localization of 102 BnTAR proteins was predicted by using Plant-mPLoc and Multi Loc2 (Tables S1 and S2), it was revealed that most of them were located in the cytoplasm or chloroplast, only a few proteins were predicted in the secretory pathway or the nucleus.
Sequence alignment and phylogenetic analysis of BnTAR genes
We performed sequence alignment of BnTAR genes and constructed an unrooted phylogenetic tree of 102 BnTAR genes. This was used to determine the evolutionary relationships among BnTAR genes, and we found that most of the genes formed gene pairs with high Bootstrap support (Figure 1), it suggested that the chromosome duplication was contributed significantly to BnTAR gene formation. And most of the gene pairs have short branches (Figure 1), which might be separated in a more recent time. Aminotran_1_2 was generally divided into four large branches, among which BnAMI8 and BnAMI54 are in a separate clade (Figure 1). They are distant from the other members of the Aminotran_1_2 family, they might have diverged from other BnAMI genes earlier and their function might be more independently. Also, twelve genes of the Alliinase_C family are clustered together and share high similarities (Figure 1).
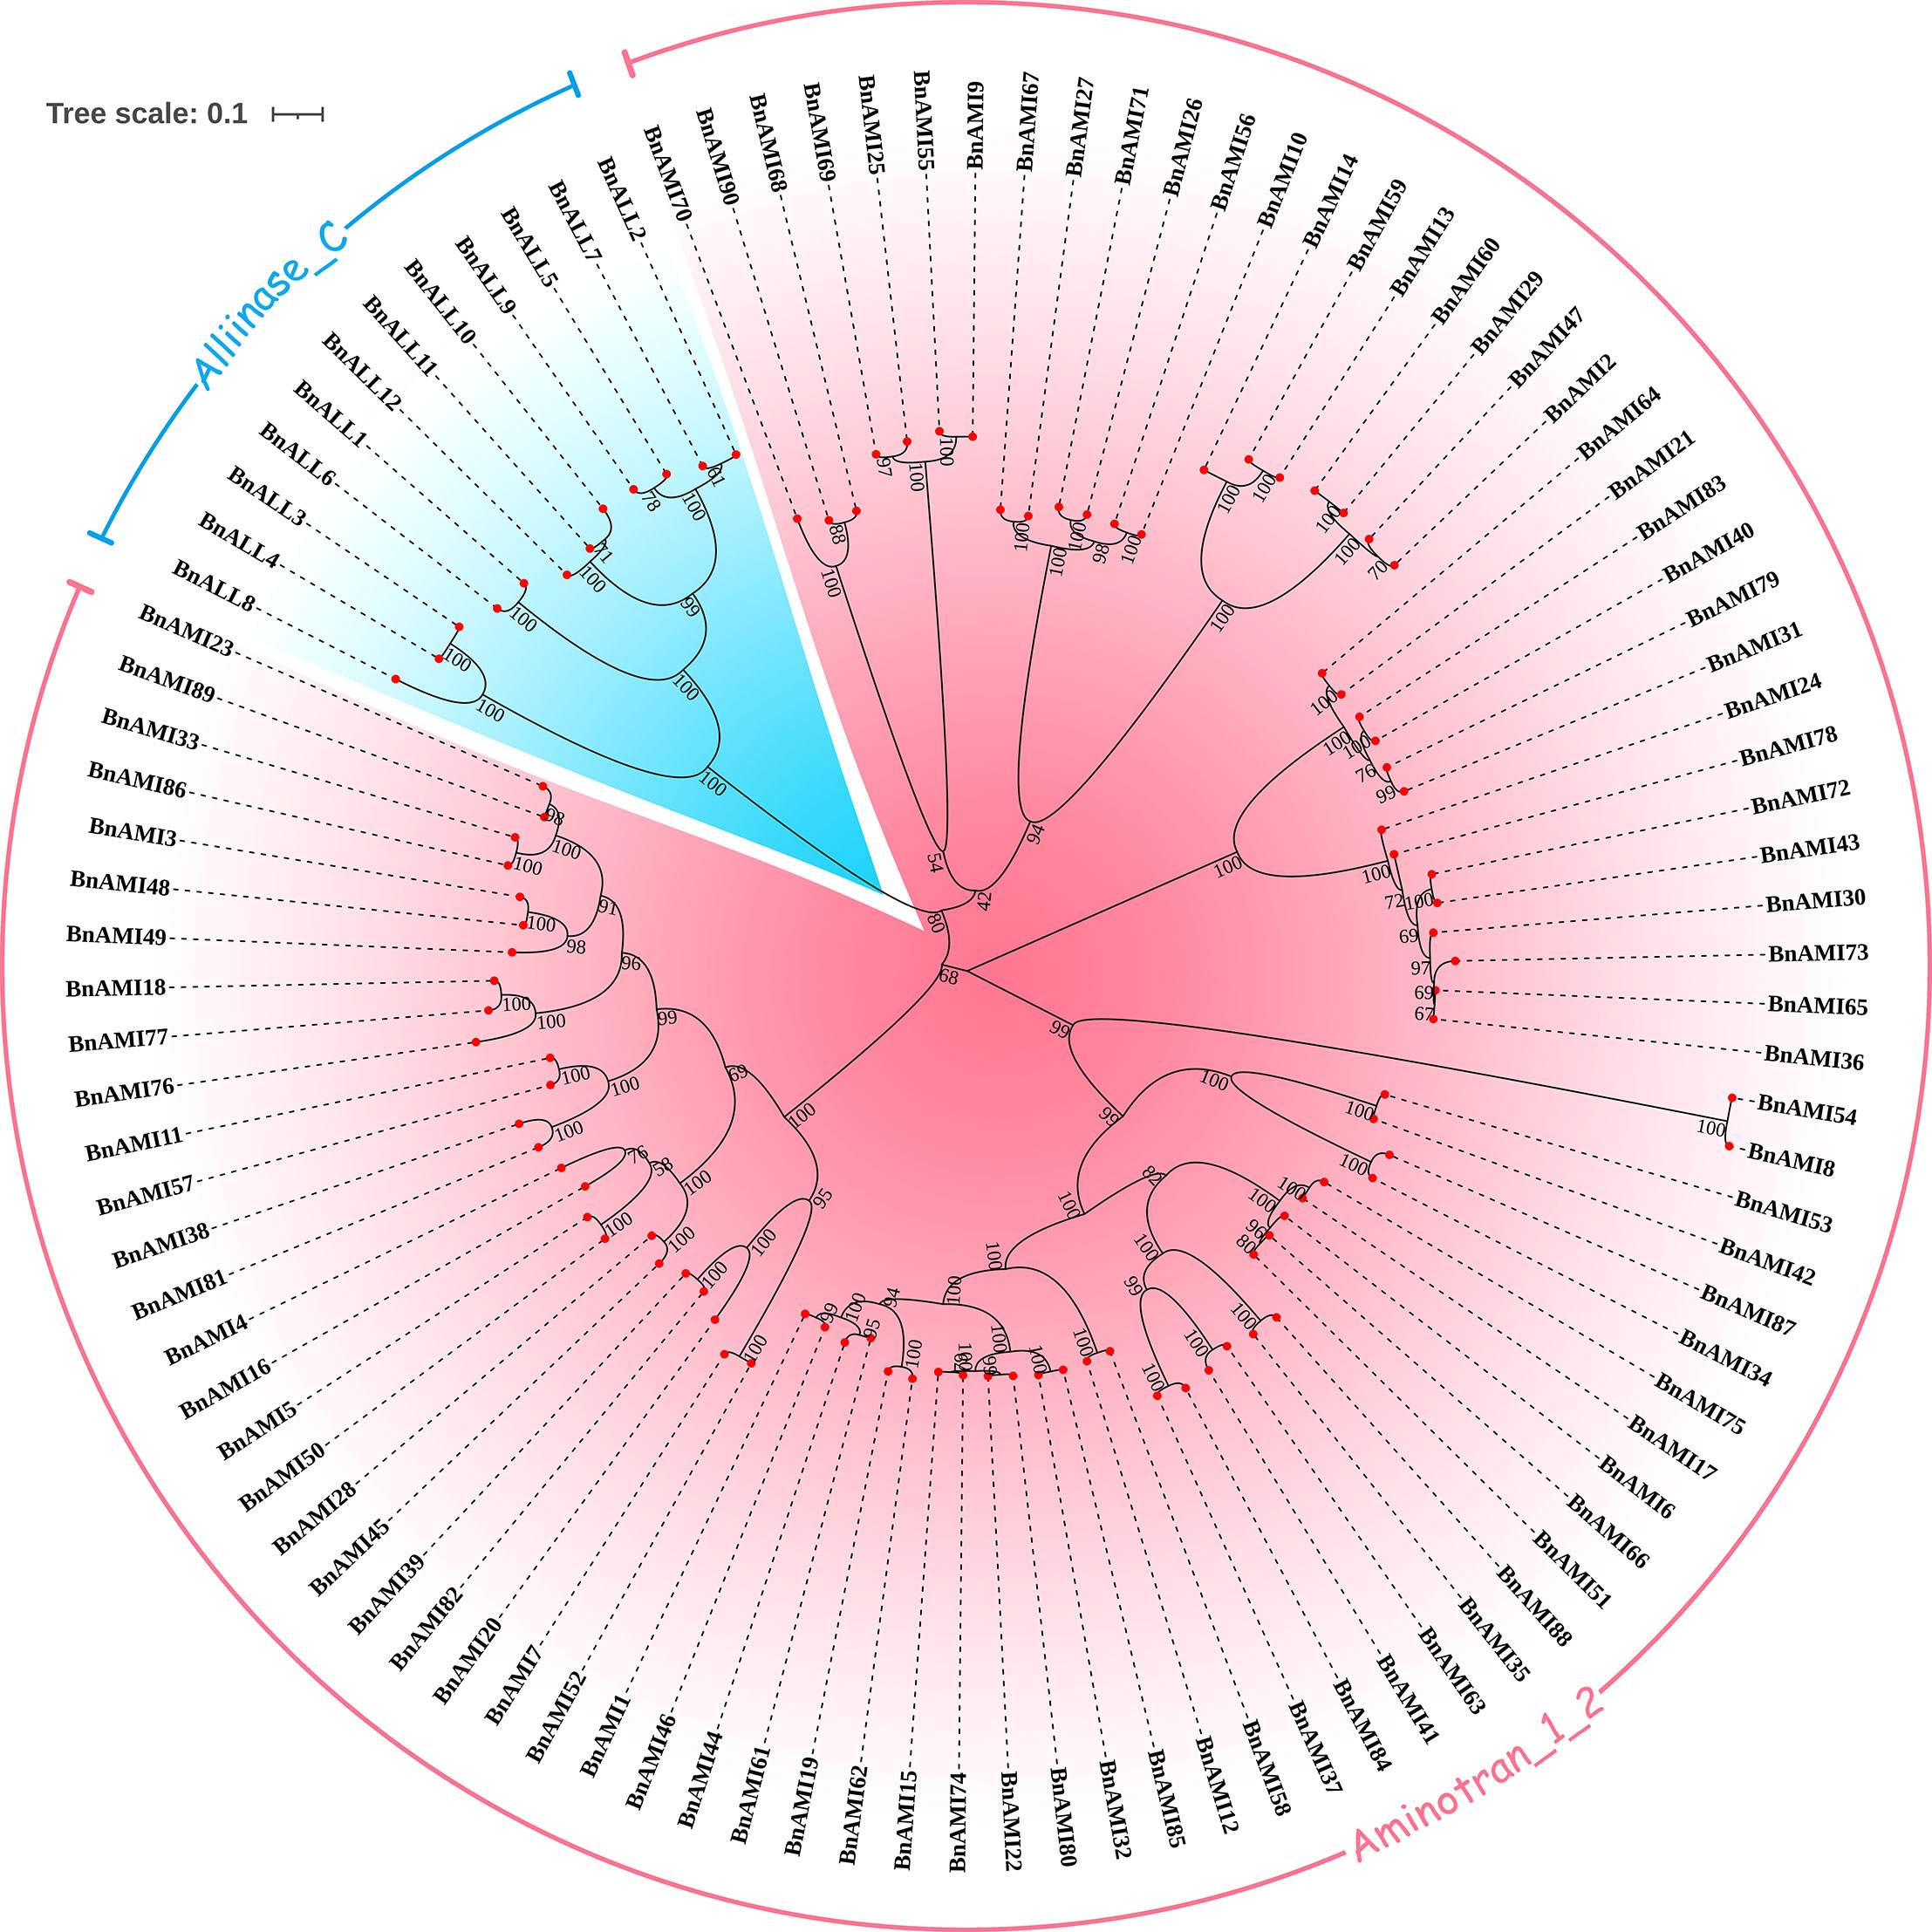
Figure 1 Phylogenetic analysis of the BnTAR genes. Different BnTAR gene families were marked in different colors.
According to the sequence comparison results, protein sequences of members of BnALL family are very conserved, with about 30.5%-36.7% of amino acids having over 90% similarity (Figure S1). In contrast, sequence conservation of the members of BnAMI family is of low level. Among the four large branches of the Aminotran_1_2 family, the branch that contained BnAMI31 and BnAMI65 was had the highest internal conserved type (Figure S1). About 45.2%-61.5% of the amino acids in this branch were with more than 90% similarity across the sequences, which suggested that these genes were had a high level of functional redundancy. The branch that contained the BnAMI2 and BnAMI69 was the least conserved, with about 6.83%-10.0% of amino acids having high similarity except BnAMI70 which is rather short (Figure S1). The large number of variation sites suggested that these genes have important roles in adaptation to ever-changing environment. The branch of BnAMI39 and BnAMI86 was with a close number of conserved amino acids to the branch of BnAMI8 and BnAMI80 (Figure S1), but the overall conservation was lower due to the presence of two genes with longer sequences, BnAMI8 and BnAMI54.
Chromosomal location and the expansion pattern of the BnTAR Genes
The chromosomal locations of BnTAR genes were analyzed, and 102 BnTAR genes that located on the 19 chromosomes of B. napus were found (Figure 2). However, only one BnTAR gene was located on chromosomes A4, A5, A10 and C4, respectively. In contrast, chromosome A9 was with 11 BnTAR genes. The BnTAR gene arrangement is also relatively concentrated on different chromosomes and some of the BnTAR genes were existed as gene clusters, such as BnAMI4 and BnAMI5 on A1, BnAMI48 and BnAMI49 on C1 (Figure 2), which might be caused by the duplication of BnTAR genes during the evolutionary history.
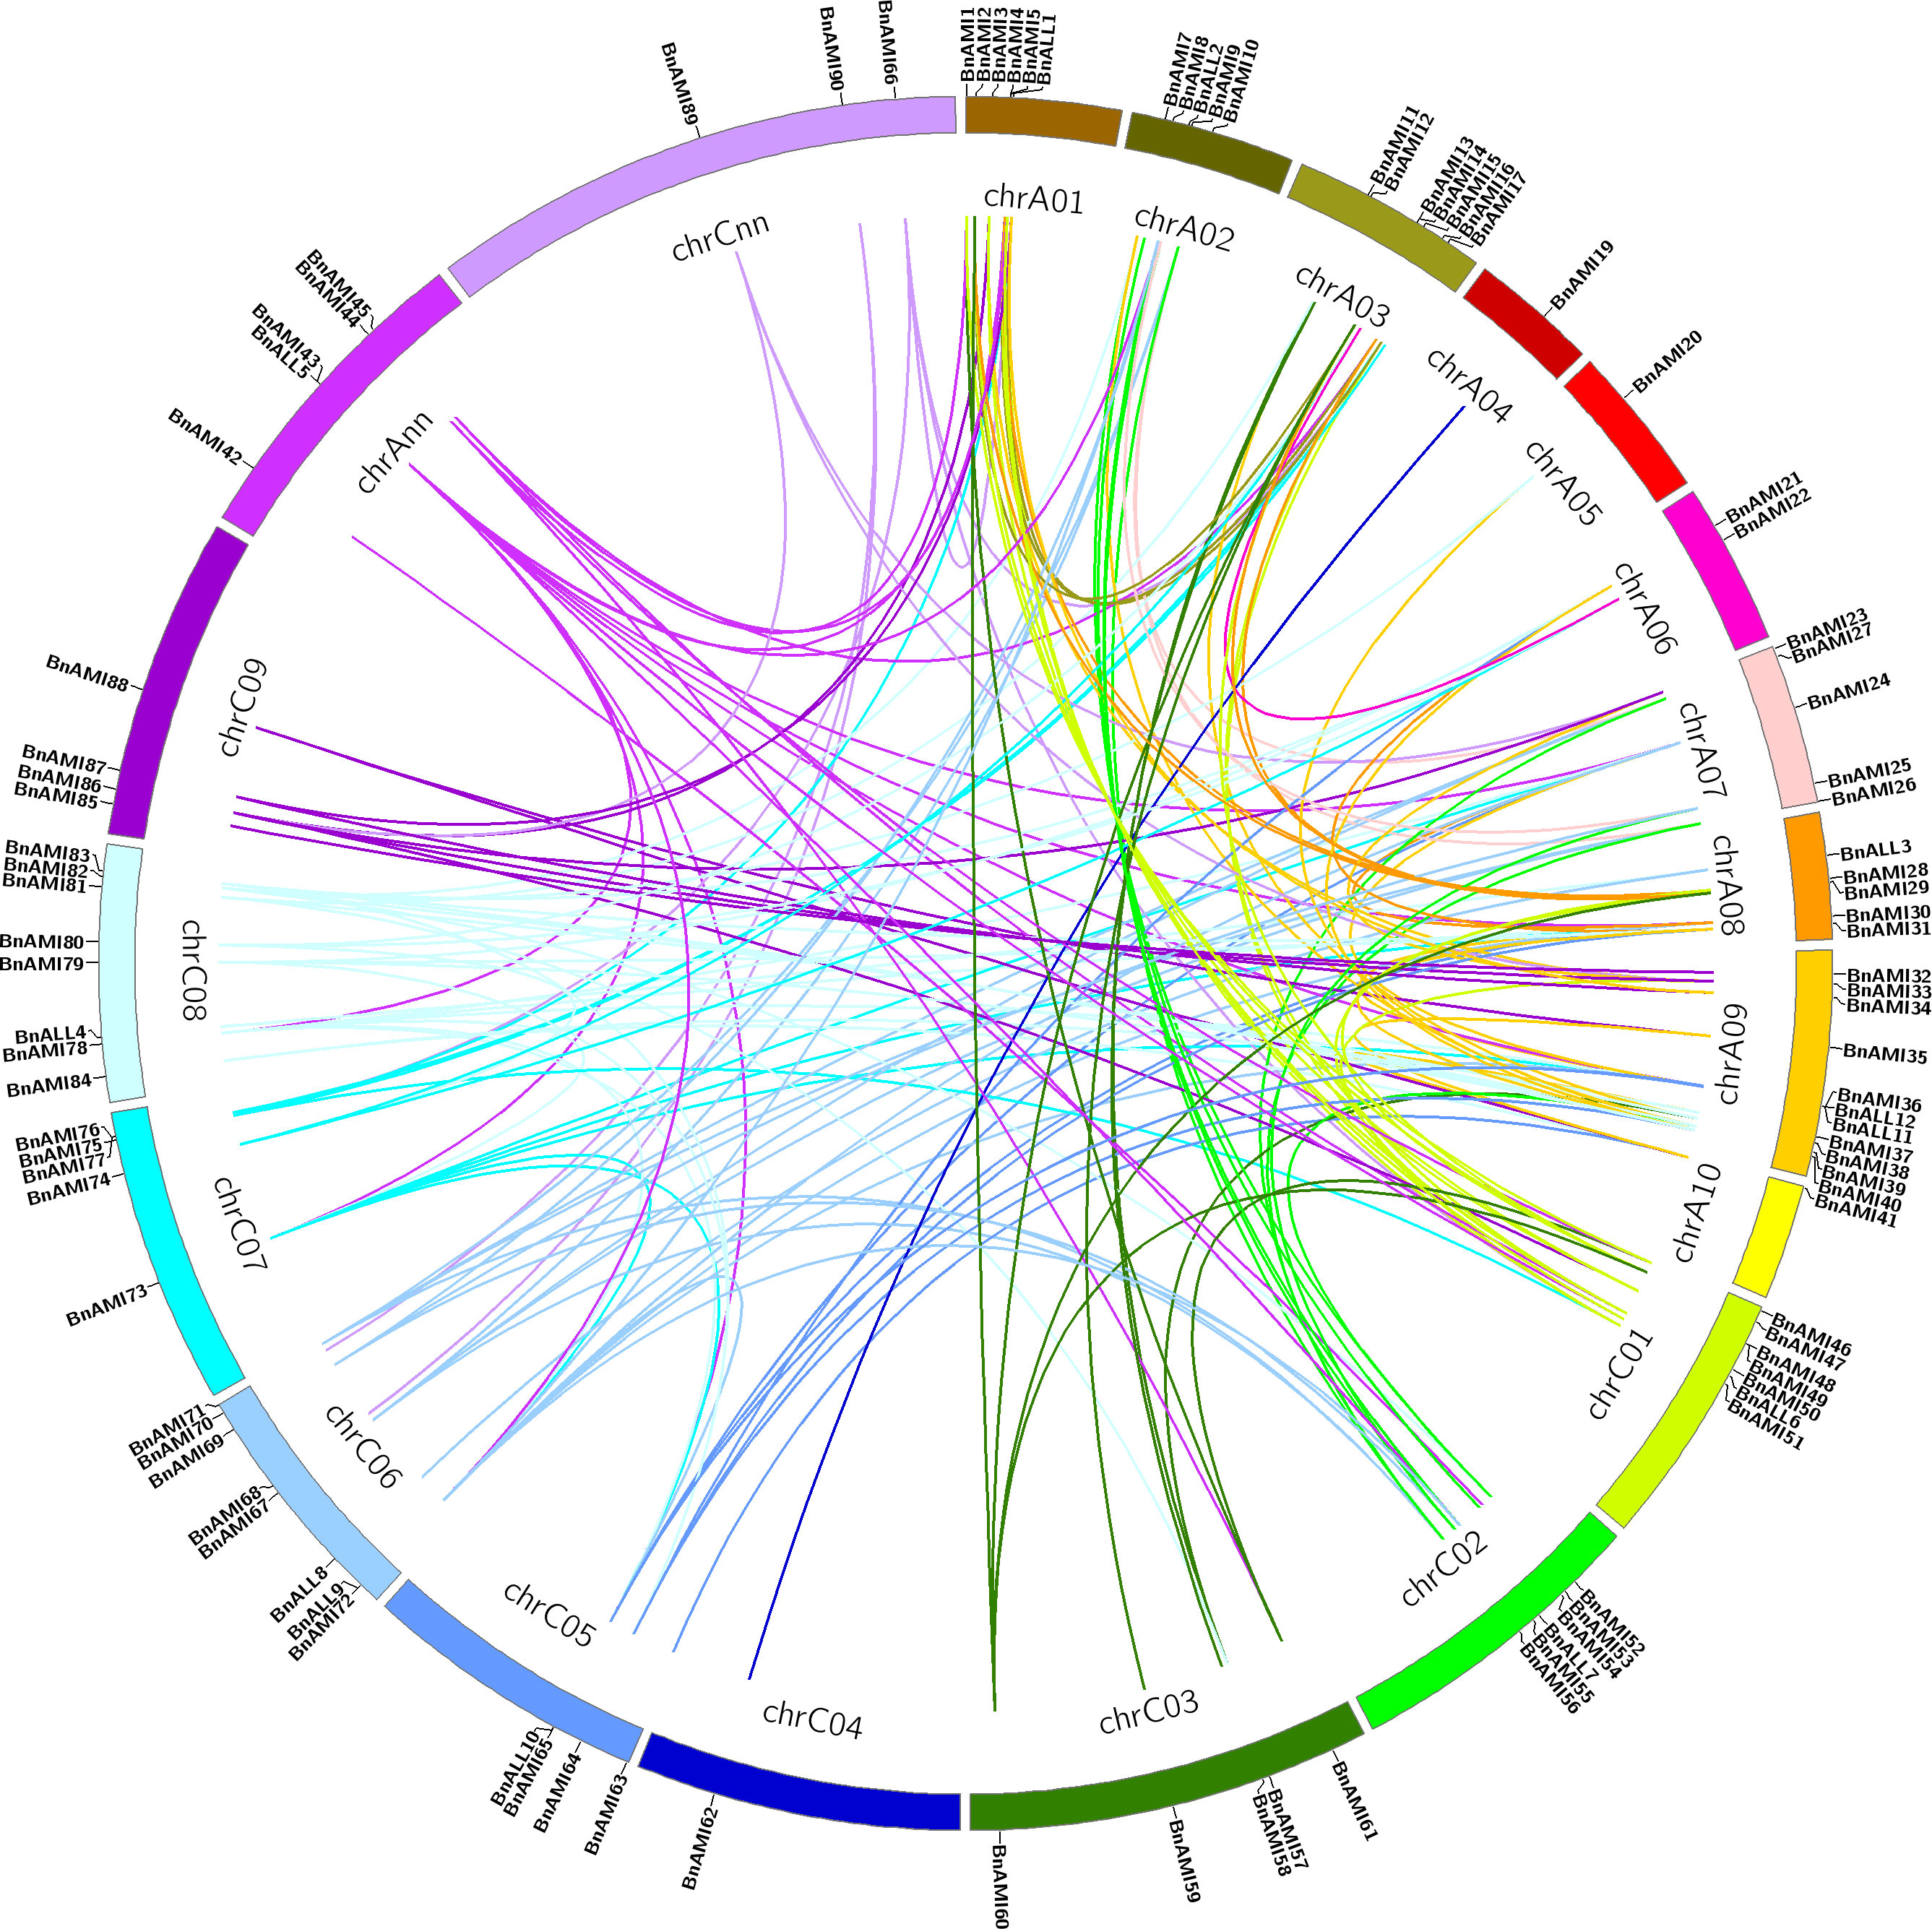
Figure 2 Distribution of BnTAR gene family among B. napus genome. The chromosomal information of the BnTAR genes was mapped to the B. napus chromosomes and the synteny relationship was highlighted in different colors.
To understand the expansion pattern of the BnTAR genes in B. napus, we investigated gene duplication events. Synteny analysis showed that the BnTAR genes are phylogenetically close to TAR genes in other three cruciferous species (B. rapa, B. oleracea, Arabidopsis thaliana). There are 36 TAR genes in A. thaliana, AT1G23310 was contained eight copies, it was formed by fragment duplication. In addition, AT1G17290, AT1G70580, AT1G72330 and AT1G80360 were all have six copies, it was involved in replication formation. In the synteny analysis of B. rapa, B. oleracea and B. napus, 54 BrTAR genes were found in the genome of B. rapa, and it showed that at most 7 BnTAR genes were corresponding to the same BrTAR gene (such as BraA03g055430), and at least 1 BnTAR gene corresponding to the same BrTAR gene (such as BraA02g021330). 58 BoTAR genes were found in the genome of B. oleracea, it was also revealed that at most 7 BnTAR genes were corresponding to the same BoTAR gene (such as BolC07g053890), and at least 1 BnTAR gene corresponding to the same BrTAR gene (BolC08g046990). Further analysis revealed that those 54 BrTAR genes were corresponding to 80 BnTAR genes, and 41 and 39 of these BnTAR genes are located in A genome and C genome of B. napus, respectively. As for 58 BoTAR genes, which corresponding to 89 BnTAR genes, and 42 and 47 of them were located in A genome and C genome of B. napus, respectively. However, 13 BnTAR genes were not corresponding to any BrTAR genes or BoTAR genes. These results indicated that the BnTAR gene was highly conservative in the evolutionary process, but it also produces unique BnTAR genes, such as BnAMI5. These results above demonstrated that segment duplication was played an important role in the evolution of these gene loci.
By comparing the gene distribution of TAR genes in the genomes of B. rapa, B. oleracea, A. thaliana and B. napus, we found that the codominance of AMI and ALL families are maintained, but some genes are duplicated or lost. In addition, the synteny maps of TAR genes in A. thaliana, B. rapa, and A subgenome of B. napus, and TAR genes in A. thaliana, B. oleracea, and C subgenome of B. napus were analyzed separately (Figure 3). The results showed that TAR genes were almost evenly distributed in the Arabidopsis genome. These AtTAR genes are synteny to BrTAR and BoTAR genes, it indicated that AtTAR genes were replicated and formed into BrTAR or BoTAR, which was the result of genomic rearrangement after whole-genome triplication (WGT) in Brassicaceae species. In addition, almost all the BrTAR or BoTAR genes were maintained a synteny relationship with BnTARs.
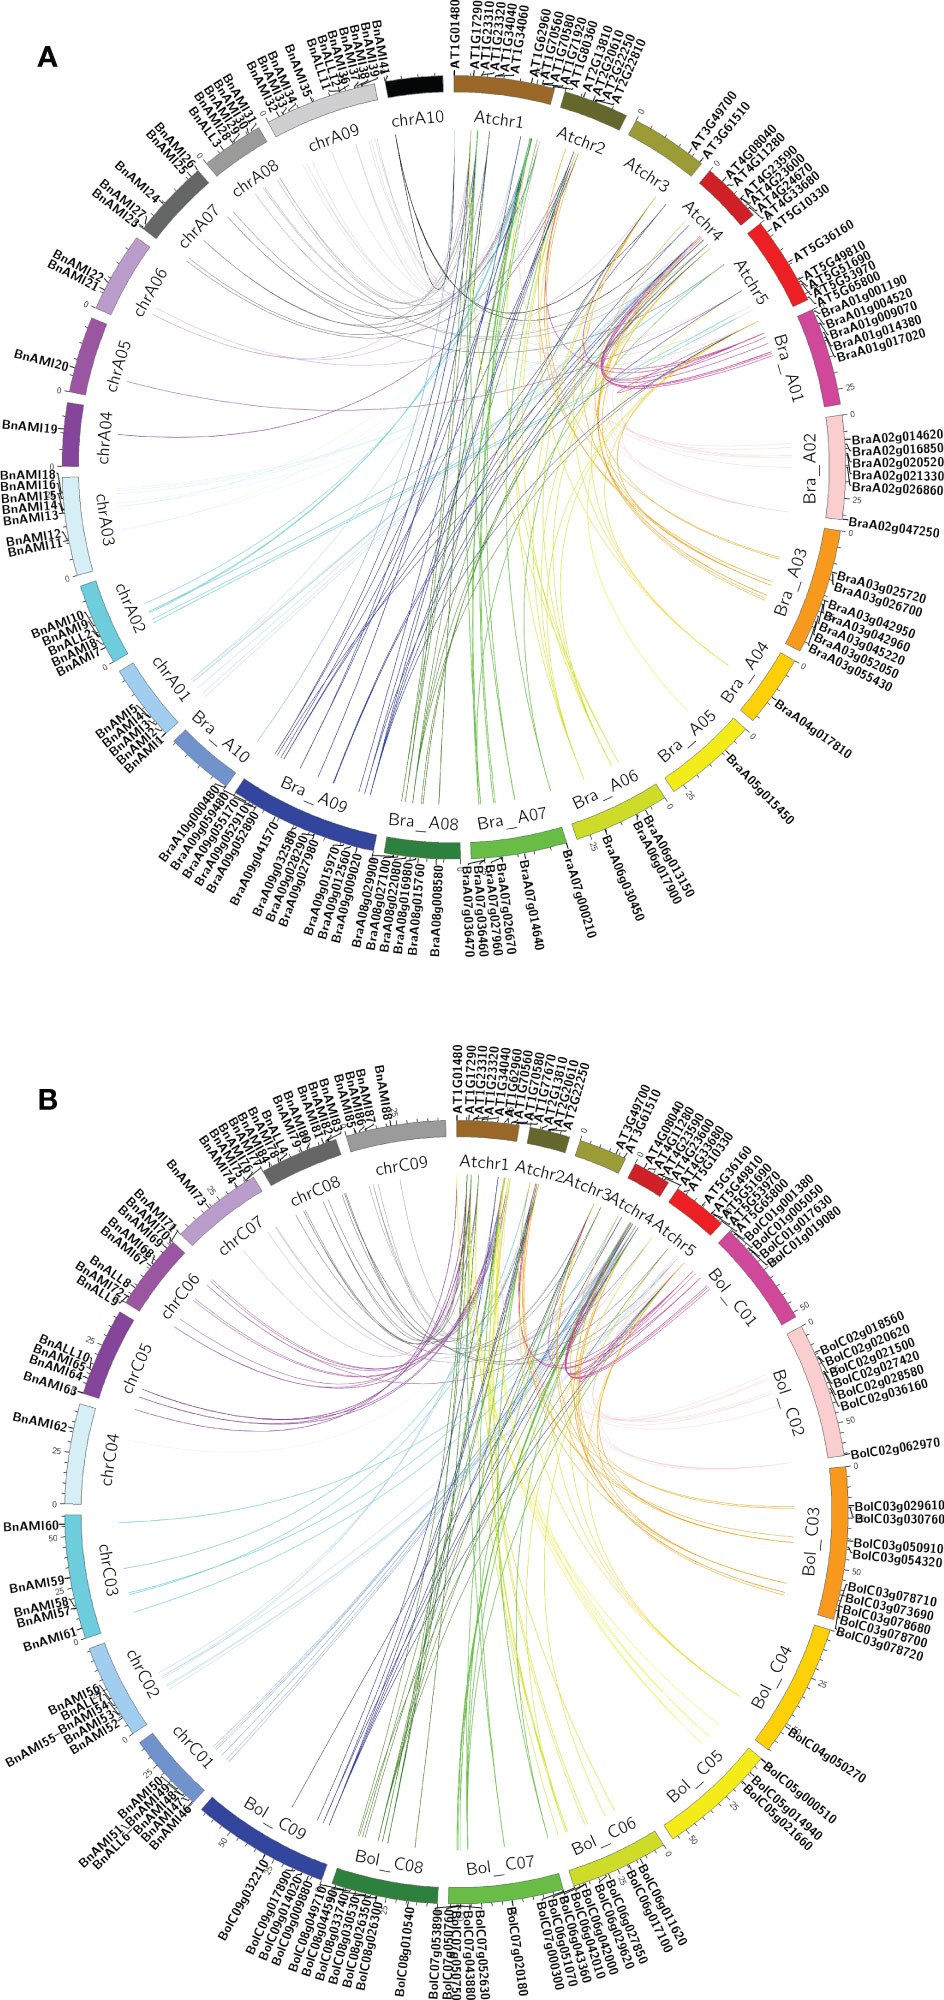
Figure 3 Synteny analysis map of TAR genes in B. napus, B. rapa, B. oleracea, and A. thaliana chromosomes. (A) The synteny of genes located on B. napus A subgenome, B. rapa genome and A. thaliana genome. (B) The synteny of genes located on B. napus C subgenome, B. oleracea genome and A. thaliana genome.
There are three mechanisms of gene family expansion: tandem duplication, segmental duplication and whole-genome duplication (WGD) (Xu et al., 2012). The original diploid genomes of Arabidopsis are ancient polyploids, which was undergo massive chromosomal rearrangements in the evolution (Schmidt et al., 2001). BnAMI13/BnAMI14 on A3 chromosome cluster and BnAMI76/BnAMI77 on C7 chromosome cluster are tandem duplicated genes (Table S1). Meanwhile, BnAMI59 is clustered together with BnAMI13/BnAMI14 and BnAMI18 together with BnAMI76/BnAMI77 (Figure 1), respectively, it suggested that these genes might come from the same ancestor. Interestingly, the two tandemly duplicated genes, BnAMI13 was clustered together with BnAMI59 but not with BnAMI14, and BnAMI77 was clustered together with BnAMI18 but not with BnAMI76 (Figures 1 and 4A). This might indicate that these genes were experienced tandem duplication and then whole-genome duplication during the evolutionary process, and then caused the independent genes being more closely related to one of the tandem duplicated genes. In addition, BnAMI74 and BnAMI75 might be associated with segmental duplication, as they show synteny relationships with BnAMI15 and BnAMI14, respectively. Phylogenetic analysis also indicated that BnAMI74/BnAMI15 and BnAMI75/BnAMI77 are homologous gene pairs, and they are respectively located in A and C subgenomes (Figure 4A), which might come from two different ancestors. Importantly, BnAMI13, BnAMI14, BnAMI15, BnAMI17 and BnAMI18 are all on the A3 chromosome cluster, and BnAMI74, BnAMI75, BnAMI76 and BnAMI77 are all on the C7 chromosome cluster, which indicates that the three duplication events play an important role in the formation of BnTAR gene clusters (Figure 4B).
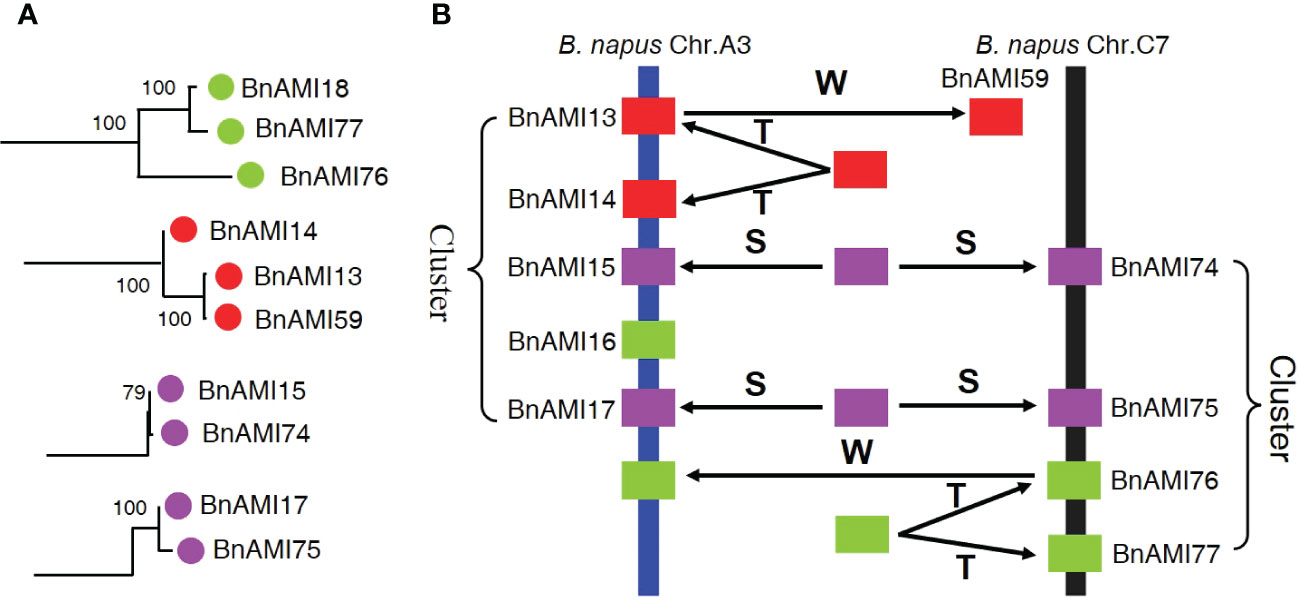
Figure 4 Phylogenetic relationships and hypothetical evolutionary progress of the cluster of BnTAR genes in B. napus chromosomes A3 and C7. (A) Phylogenetic relationships of selected BnTAR genes in the cluster. (B) Hypothetical mechanism of BnTAR gene cluster formation. The letters T, S, and W indicate putative tandem duplication, segmental duplication, and whole-genome duplication, respectively.
Meanwhile, non-synonymous (Ka) and synonymous (Ks) values are used to analyze the selection pressure on BnTAR genes during the evolutionary process (Table S3). The results showed that most of BnTAR genes had the Ka/Ks ratio values between 0.1 and 1, it indicated that BnTAR has low selection pressure during evolution. We also found that there existed more than one Arabidopsis gene homologous to the same gene of B. napus. For instance, two Arabidopsis genes AT1G70580 and AT1G23310, both homologous to BnAMI78 of B. napus, and there are even three Arabidopsis genes, AT1G01480, AT3G61510 and AT4G11280 are all homologous to BnAMI41 of B. napus (Table S3), this might be caused by synonymous substitution. Interestingly, four NaN values can be found in the Table S3, including of AT3G61510, AT4G11280 and BnAMI41 (Table S3). The NaN value appears because the pS is higher than 0.75, which means that there are more synonymous substitution sites resulting in higher sequence variability. These TAR genes themselves have high sequence similarity in A. thaliana and B. napus, most of the TAR family genes evolved neutrally, leading to a high rate of synonymous substitutions. Ultimately, this leads to a high level of synonymous substitution in BnAMI41, which resulted in its correspondence to multiple Arabidopsis duplicate genes. Therefore, there will be many Arabidopsis genes corresponding to the same B. napus gene together. These evolutionary relationships found through Ka/Ks ratio together with the homology homozygosity and chromosomal gene localization analyses above suggested that the WGD and segmental duplication play an important role in the evolution of the TAR gene family, which is consistent with the evolutionary process in Brassica species.
Gene structural analysis of BnTARs
Most of BnTAR genes are less than 5 kb except for BnALL10, BnAMI8 and BnAMI54 (Table S1, Figure S2). It was revealed that the different branches were with different intron-exon structural features. Most of the BnALL genes were contained no more than five introns, while most of the BnAMI genes were with more than five introns (Figure S2). Particularly, the BnAMI genes in the fourth main branch were more distinct from other branches with more than ten introns (Figure S2). BnAMI8 and BnAMI54, whose sequence length is larger than 6 kb, were found to have similar intron-exon structural features, it reflected their close phylogenetic relationship (Figure S2). And similarly, most of phylogenetical gene pairs have the similar intron-exon structures between each other (Figure S2).
Due to the low level of similarity of all BnTAR genes among the different branches, these genes were submitted to MEME for motif structural analysis, separately. The results showed that 9 conserved motifs were identified, of which the Motif 2 was observed in almost every branch (Figure 5). These conserved motifs were belonged to two Pfam domains, as shown in the Pfam codes (Pfam PF00155 and Pfam PF04864) and Web logo. In each phylogenetic branch, most of the gene pairs or genes in close branches have the similar motif composition. Sequence length of BnALL5 is below 600bp, but it still has two motifs (motif 1 and motif 7) (Figure 5), it suggested that the BnALL5 might had undergone fragment deletion or insertion during evolution, but the conserved motifs are still preserved, which might be essential to its function. The sequence lengths of BnAMI8 and BnAMI54 are particularly long, which were with 6 and 8 motifs, respectively (Figure 5). The other genes do not differ much in length, and most of them were contained more than five motifs, and in each branch, the types of motifs are roughly similar. These results demonstrated that the different TAR genes have different structural compositions, but are similar within one phylogenetic branch and the motifs encoding TAR structural domains are conserved.
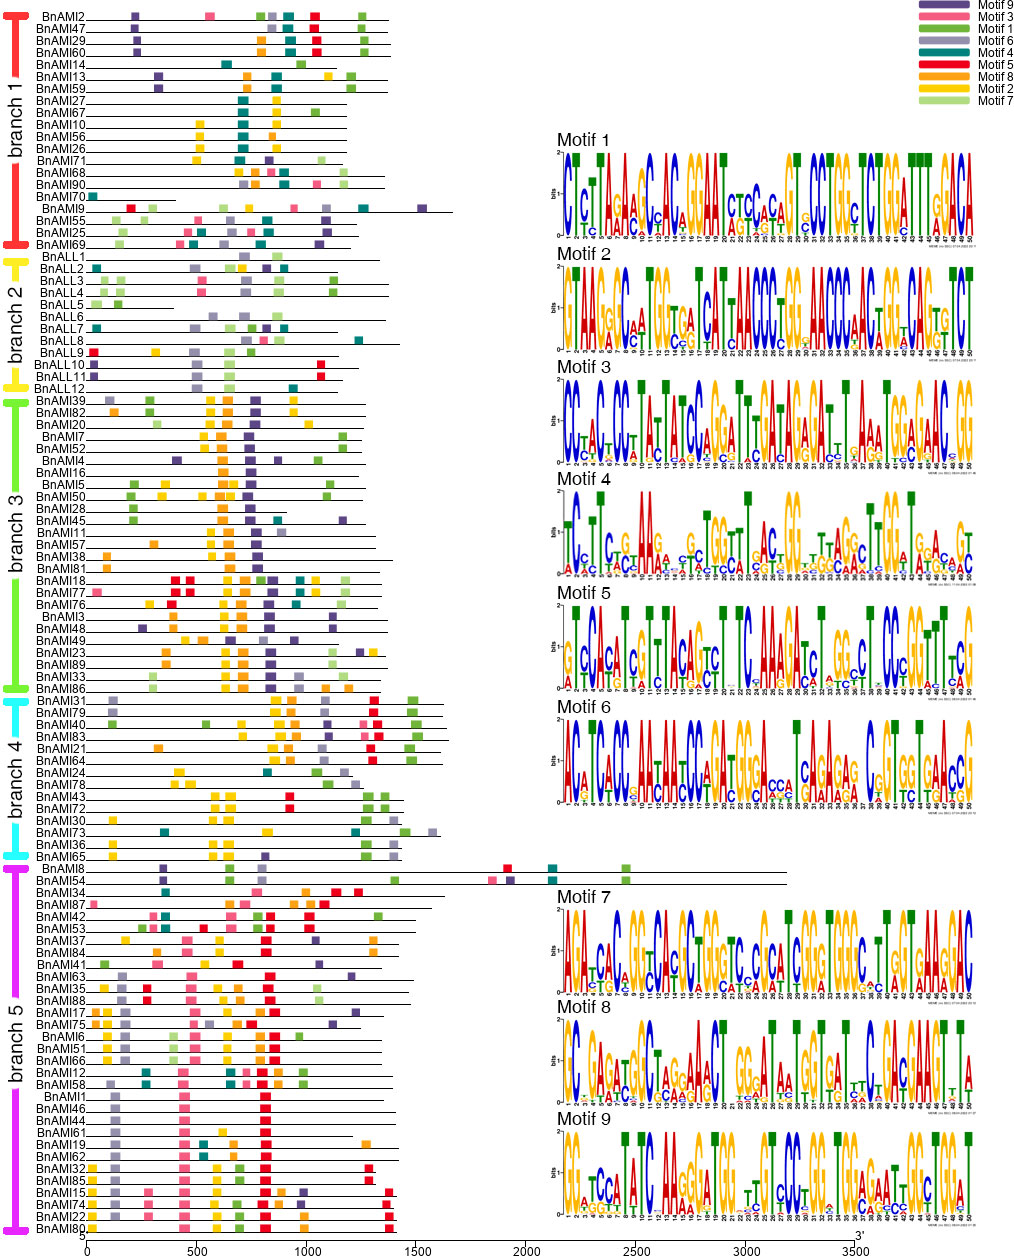
Figure 5 Motif patterns of different BnTAR branches and predicted consensus motifs in each BnTAR gene branch. Different motifs are shown in different colors. The lengths of the proteins and motifs can be estimated using the scale at the bottom. The motifs in Pfam of each branch are shown on the right.
Secondary and tertiary structural analysis of BnTAR
The protein secondary structure of BnTAR was predicted by using the GOR4 and PSIPRED. It was revealed that the BnTAR proteins were mainly contained α-helixes, β-folds and random coils. Further analysis showed that the α-helixes, β-folds and random coils was account for about 35%, 20% and 45%, respectively (Figure S3). In addition, 3D structures of BnTAR proteins were also modeled and predicted by using the Phyre2. Firstly, we use VAST to analyze the protein sequences of all BnTAR, and then compared them with the structures that obtained from the PDB database. The predicted structural domains were displayed in the Cn3D macromolecular structure viewer (α-helix in green, β-fold in yellow and random coil in blue) (Figures 6A, C, E, G). And the structures of Alliinase from Allium Sativum (garlic) (2HOX) (Figures 6A, B) and the Crystal Structure of Alanine Aminotransferase from Hordeum vulgare (3TCM) (Figures 6C, D) were selected for homology modeling, as their structures have been fully studied. In the three-dimensional structure, the BnTAR proteins all appeared to be overlapping bowl-shaped, with a hollow in the center of the protein (Figures 6B, D, F, H), which is the active center of the enzyme and contains the pyridoxal binding site. The pyridoxal binding sites of BnTAR, 2HOX and 3TCM are all contain 10 amino acids, among which the first three amino acids are continuous amino acids, the seventh and eighth amino acids are separated by a random amino acid, the eighth and ninth amino acids are continuous and there are seven amino acids between the ninth and tenth amino acid (Table S4). In addition, the ninth amino acid Lys which is very conserved is also the catalytic residue (Table S4). These ten amino acids are formed into the conserved hole structure of proteins. At the same time, the difference of amino acid sequence in the protein also leads to a slight difference in the distance from each amino acid to the catalytic residue Lys in the 3D structure (Table S5). The distance from the pyridoxal binding site amino acid to the catalytic residue Lys in BnALL and 2HOX is farther. For example, the distance from fifth amino acid Asn to Lys of BnALL10 and 2HOX are 6.1 nm and 6 nm, respectively, otherwise, the BnAMI78 and 3TCM are 4.4 nm (Table S5). These results suggest that BnTAR proteins have a conserved structure, but also show some differences in the three-dimensional structural state and the number of secondary structures, which may help them to perform different functions in different environments.
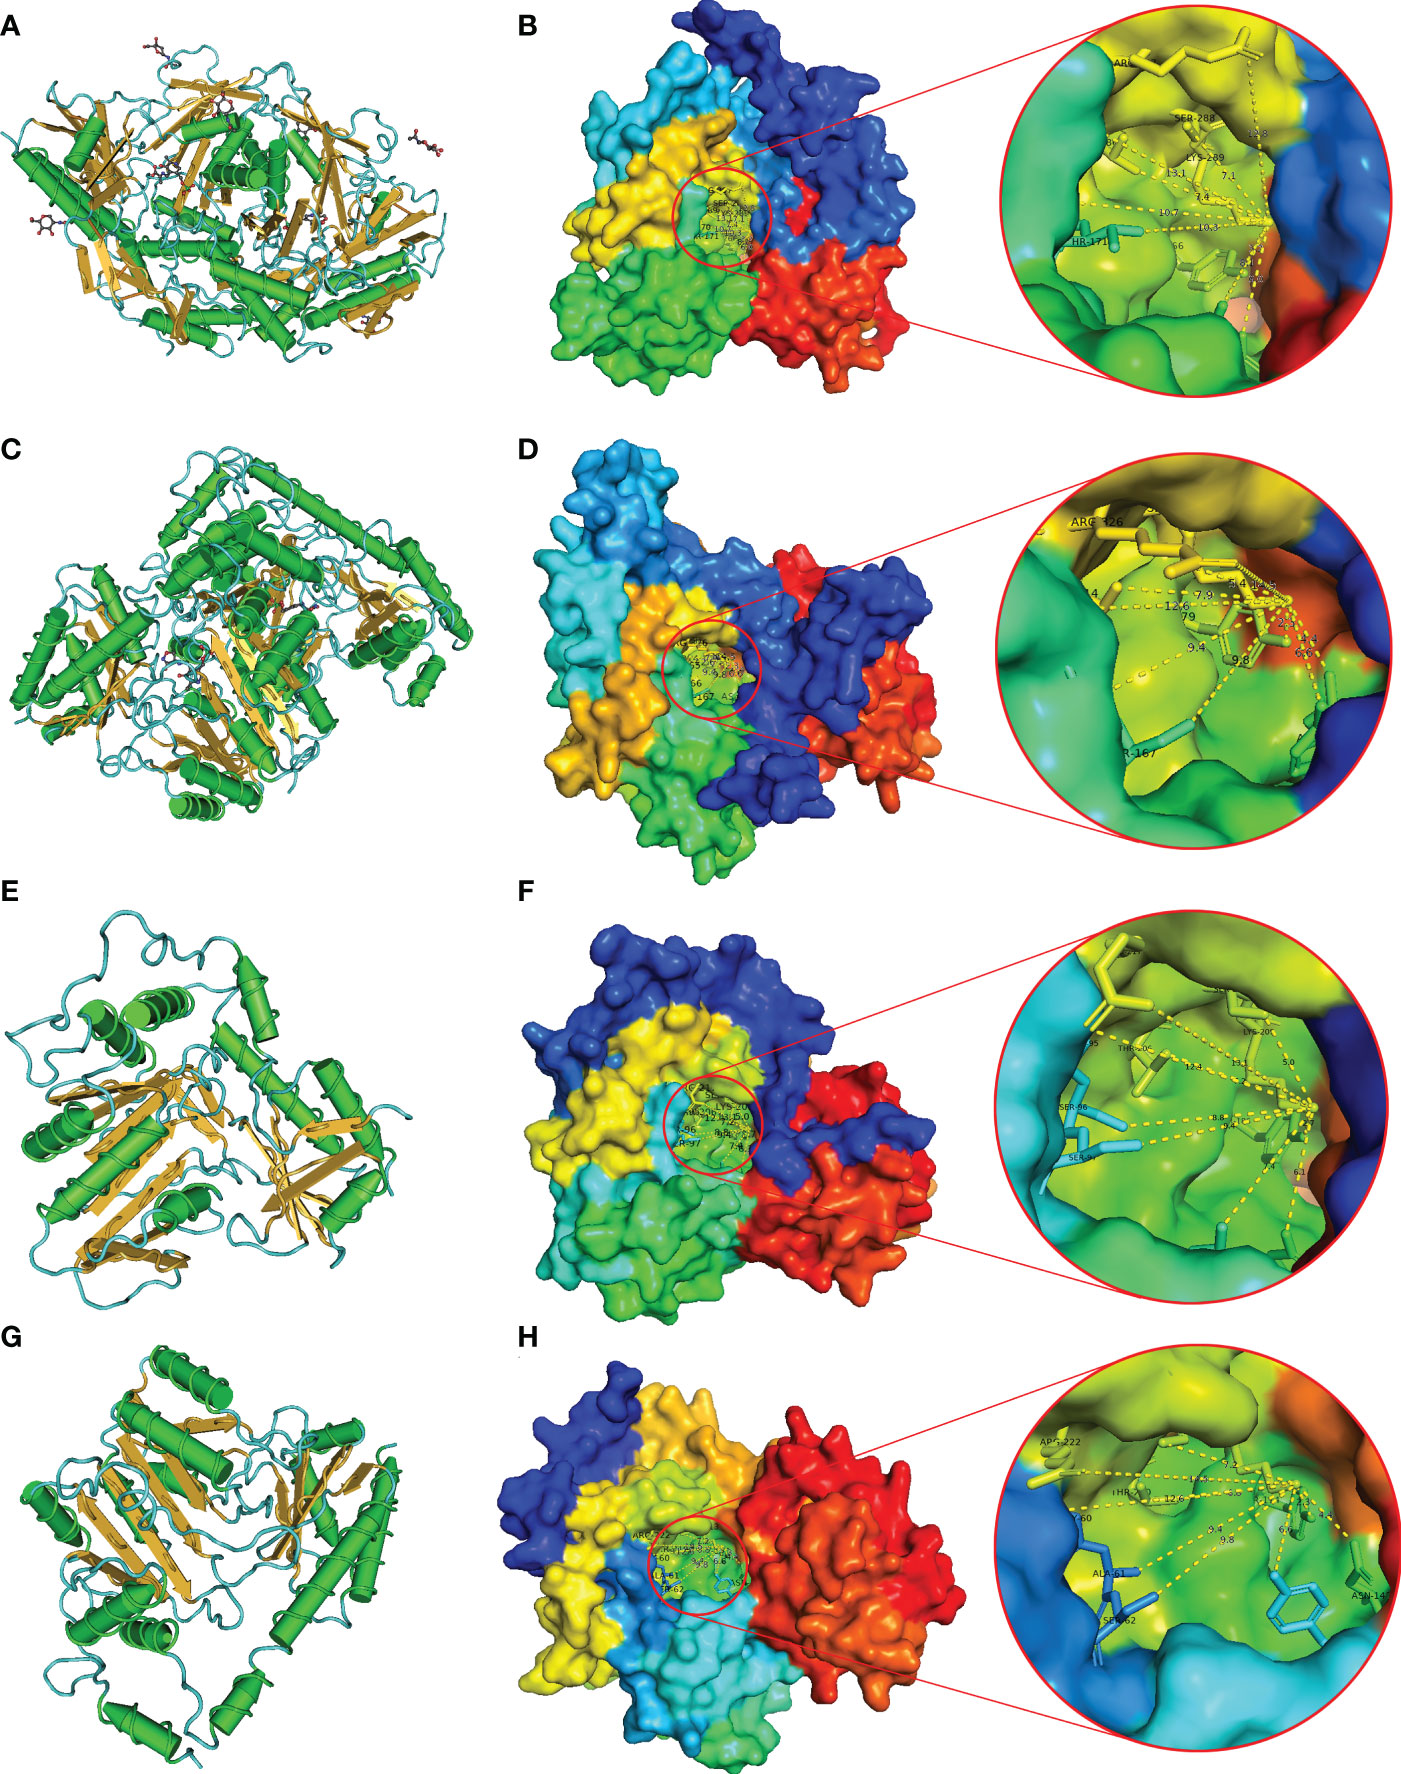
Figure 6 Predicted 3D structure of BnTAR genes. 2HOX and 3TCM were selected as examples. The models were predicted by Phyre2. Conserved domain analysis was highlighted using VAST. Red circles indicate the active center of the enzyme. (A) Predictive 3D structure of 2HOX in cylinder and plate mood. (B) The predicted 3D structure of 2HOX showed in the surface mood. (C) Predictive 3D structure of 3TCM in cylinder and plate mood. (D) The predicted 3D structure of 3TCM showed in the surface mood. (E) Predictive 3D structure of BnALL10 in cylinder and plate mood (F) The predicted 3D structure of BnALL10 showed in the surface mood. (G) Predictive 3D structure of BnAMI78 in cylinder and plate mood. (H) The predicted 3D structure of BnAMI78 showed in the surface mood.
Expression profiles analysis of BnTAR genes in different tissues
In order to fully understand the expression pattern of the BnTARs, the expression of BnTAR genes were performed by using the data in the BnTIR database (Figure S4). We found that about a third of the BnTAR genes were barely expressed in B. napus, but there were some genes (such as BnAMI78, BnAMI36, BnAMI65, BnAMI23, BnAMI27, BnALL2) that were highly expressed in specific tissues (Figure S4). It was revealed that a part of BnTAR genes expressed higher in more actively growing tissues like root, stem and leaf, such as BnAMI78, BnAMI36, BnAMI65 and BnAMI23 (Figure S4). Another part of BnTAR genes were showed higher expression levels in early developed seeds, such as BnAMI27, BnAMI67, BnALL2 and BnALL7 (Figure S4).
To validate the data obtained from the database, 19 BnTAR genes were selected for RT-qPCR analysis in order to investigate the expression pattern of BnTAR genes in different tissues of B. napus (Tables S6 and S7). The results indicated that the expression of different BnTAR genes in each tissue was different, and the expression pattern of each gene also varies in different tissues (Figure 7). It was showed that the expression of BnTAR genes could be roughly divided into two main patterns: one is mainly expressed in nutritional organs, such as roots and stems (represented by BnAMI71 and BnAMI53), while the other is mainly expressed in reproductive organs, such as flowers and seeds (characterized by BnAMI37 and BnAMI14). This is consistent with the expression pattern available in the BnTIR database.
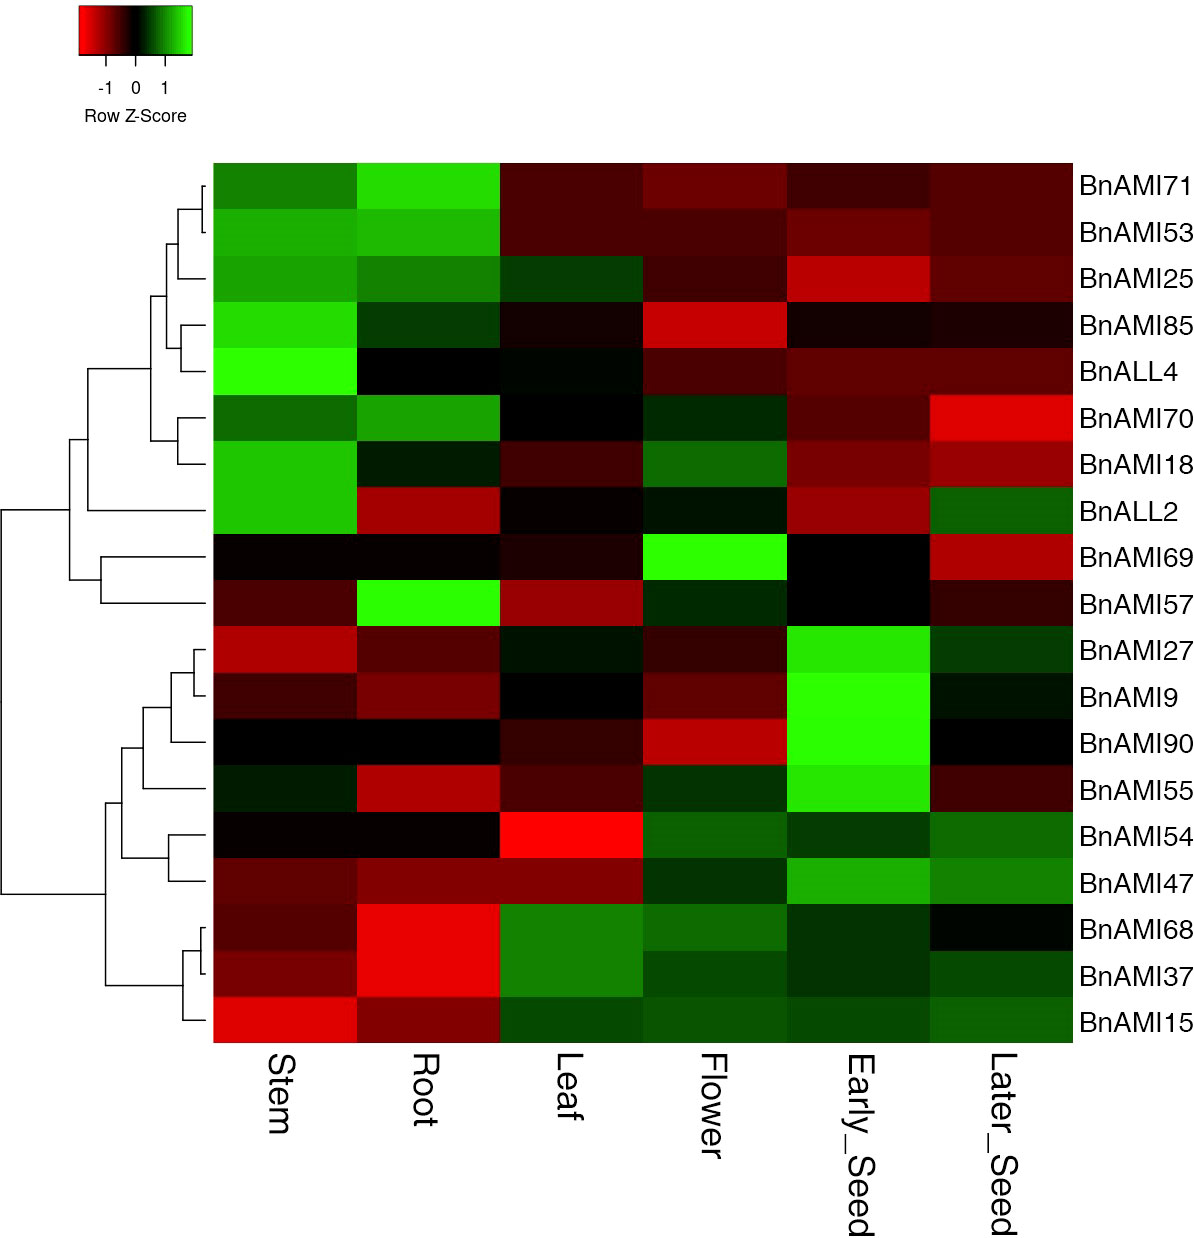
Figure 7 Hierarchical clustering of the expression profiles of BnTAR genes in different tissues. The color scale represents relative expression levels with high (green) or low (red). Early-developing seeds were got 14 days after flowering, and later-developing seeds were 27 days after flowering.
Relevance analysis of BnTAR genes and seed oil content and seed weight
Based on the transcriptome data of high and low oil content, and the transcriptome data of different seed weights in B. napus, we analyzed the contribution of the BnTAR genes to various agricultural traits. It was revealed that the expression of most BnTAR genes between samples has no obviously differences, and even many genes were barely expressed (Figure 8). However, four genes, BnALL2, BnALL7, BnAMI27 and BnAMI67, were with higher expression, especially in the later seed development stages (36-42 days after flower). It also showed that the expression level in the B. napus with high oil content was higher than that of B. napus with the low oil content (Figure 8A). Further analysis of the expression of these four genes was also significantly different in B. napus with different seed weight. It was revealed that the expression was up-regulated at mid-seed development stage (20-26 days after flower) and down-regulated at late development stage (32 days after flower) in relatively large seed B. napus (Figure 8B). Also, some genes with a certain amount of expression were also found to be differentially expressed in different samples, for example, BnAMI13 and BnALL4 have differential expression in high and low oil samples, BnAMI64 and BnALL4 have differential expression in different seed weight samples (Figure 8). These results suggest that most of the BnTAR genes might not contribute directly to seed oil or weight, but there are a number of genes (such as BnALL2, BnALL7, BnAMI27 and BnAMI67) are involved in influencing seed oil content and seed weight.
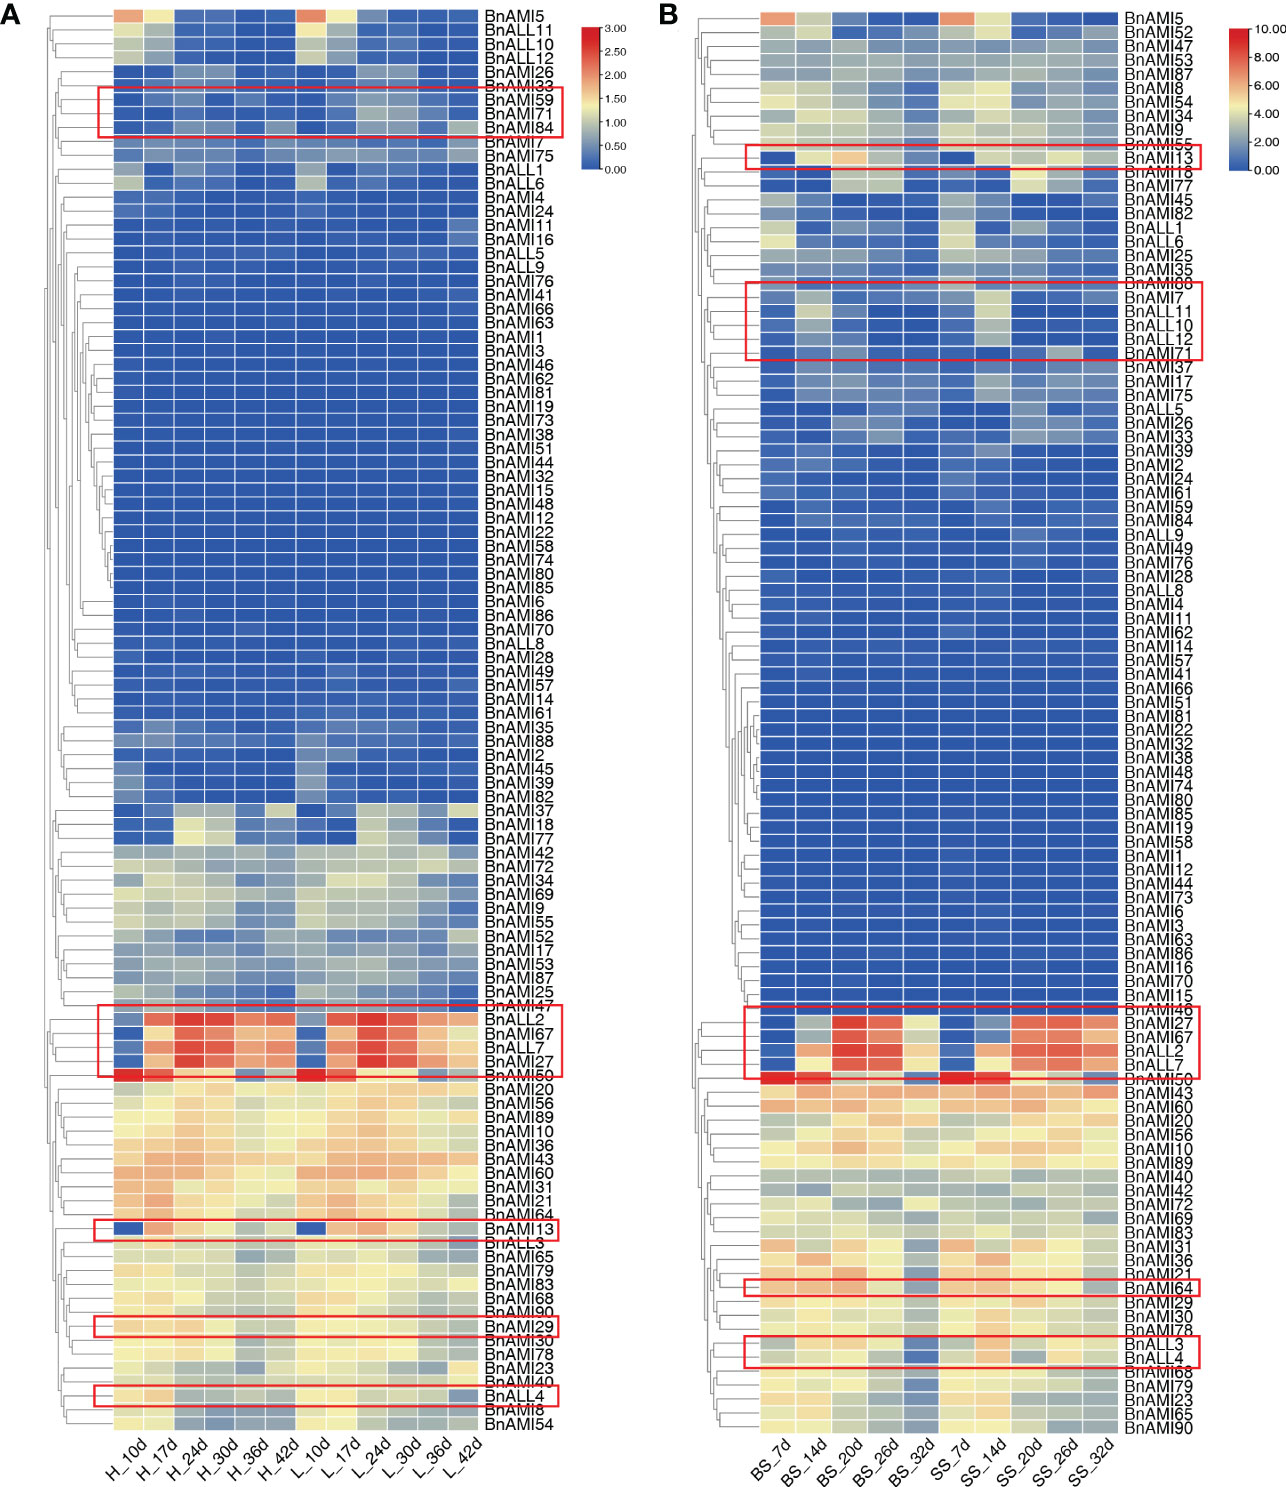
Figure 8 Expression of BnTAR gene in transcriptome data. The color scale represents relative expression levels with high (red) or low (blue). Red boxes indicate the genes that are differentially expressed. (A) The transcriptome data of high oil samples and low oil samples. ‘H’ means high oil samples while ‘L’ means low oil samples. (B) The transcriptome data of different seed weight simples. ‘BS’ means big seed simples and ‘SS’ means small seed simples. The letter ‘d’ all means how many days after flowering.
In order further analysis the relationship between these BnTAR genes with seed oil content and seed weight, the positions of 102 BnTAR genes were analyzed in order to make clear whether they were located in the quantitative trait locus (QTL) for seed oil content (Yan et al., 2022) and seed weight (Raboanatahiry et al., 2018; Zhao et al., 2019) that obtained in our group or not. It was revealed that 21 and 12 BnTAR genes were found to be located within the QTL interval of seed oil content and seed weight, respectively (Table 2). Among them, the BnAMI10 gene was located in both the cqOC-A2-3 interval for oil content and the cqSW-A2-2 interval for seed weight, which contribute to low oil content and small seed weight. It indicated that this gene might have the function for both seed weight and oil content. Also, many genes were found to be located in QTL intervals that obtained in multiple environments, such as interval of cqOC-A9-16 where the BnAMI40 gene is located, the phenotypic value to oil content was found to be significant with a maximum of 12.47% and a minimum of 9.84% and contribute to high oil content in multiple environments. Meanwhile, for seed weight, the interval of cqSW-C6-4 and cqSW-C9-6, where BnAMI69 and BnAMI86/BnAMI87 are located, both with the phenotypic value more than 8% to seed weight. The cqSW-C6-4 interval has an important contribution to seed weight enlargement, while cqSW-C9-6 contributes to seed weight reduction. At the same time, during the comparison with the transcriptome data, we found that some genes that showed significant differential expression in the transcriptome (e.g., BnALL2, BnALL3, BnAMI10, BnAMI67, etc.) were also located in the corresponding QTL intervals, which corroborates our results for the transcriptome analysis (Figure 8). These results indicated that many of BnTAR genes were more or less involved in oil formation and seed development in B. napus.
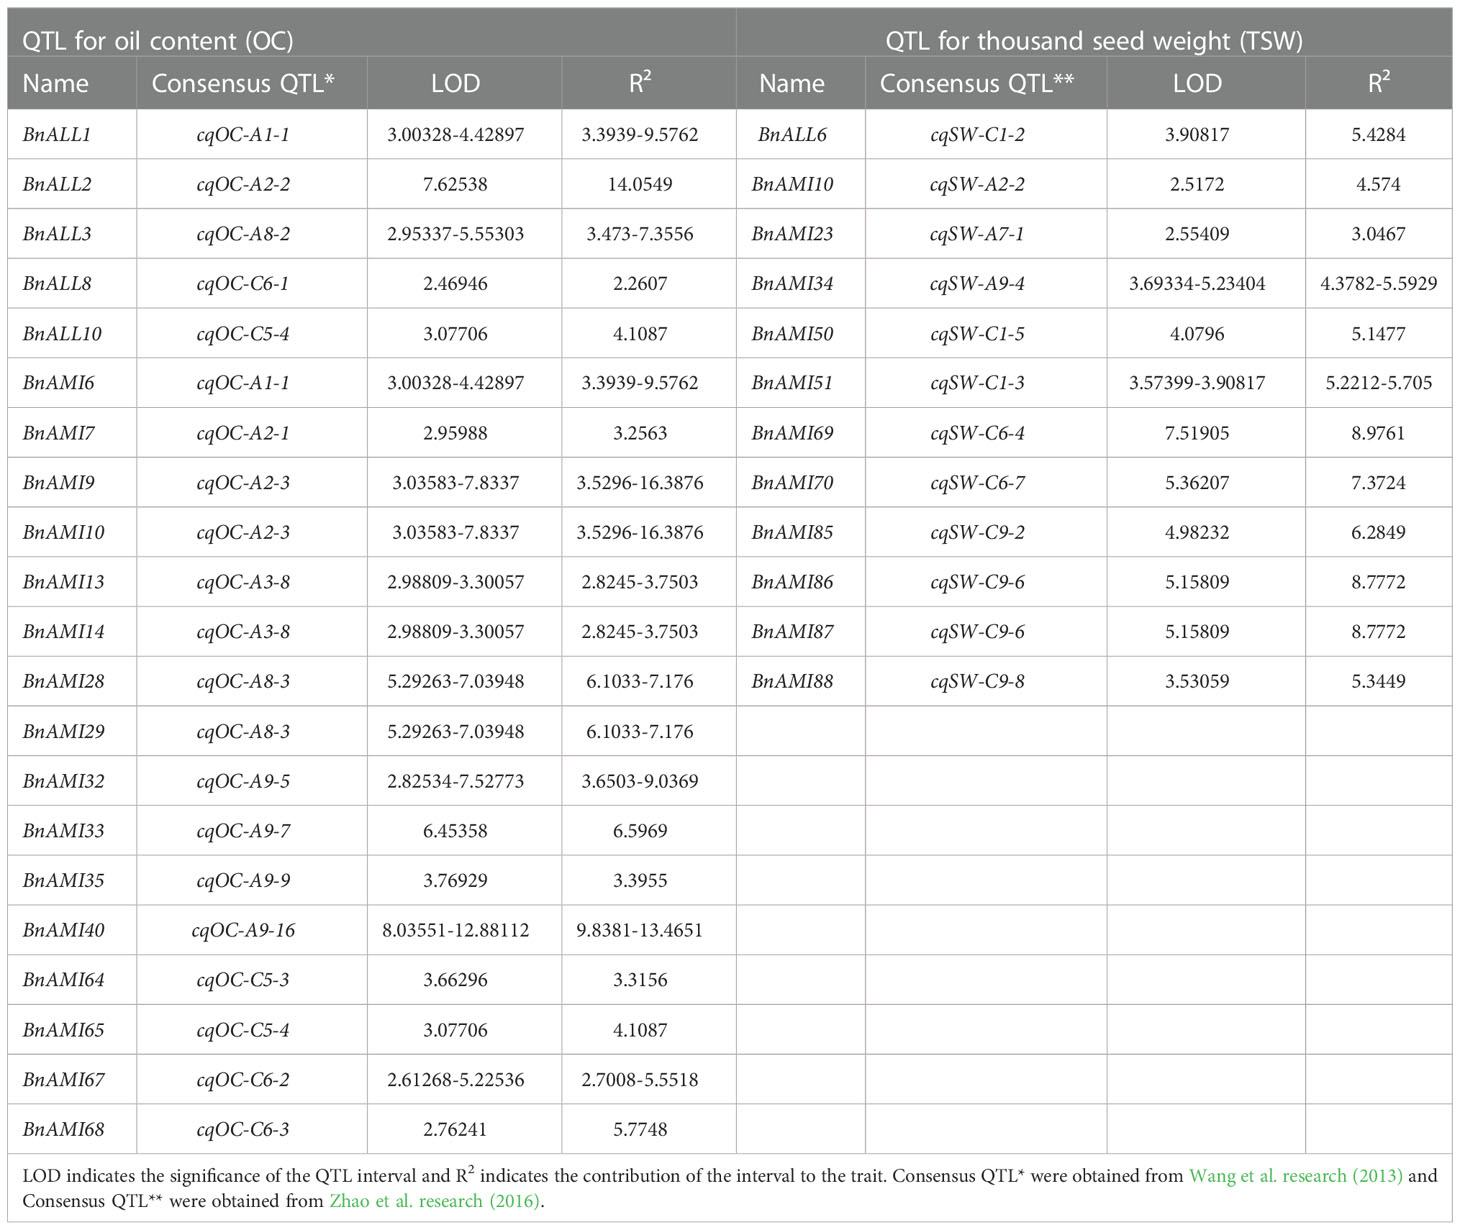
Table 2 Analysis of the QTL interval of the BnTAR genes.
Discussion
Structural characteristics of the BnTAR family
The TAA1/TAR gene family is a class of pyridoxal-5’-phosphate-dependent amino acid transaminases, which can catalyze the conversion of tryptophan into Indole-3-Pyruvate (Zhao, 2012). TAA1/TAR gene family has been found in many crops, such as rice and maize (Phillips et al., 2011; Kakei et al., 2017). However, the genome wide identification, expression pattern and its relationship with oil content and seed weight of the TAA1/TAR genes have not been reported in B. napus. In this study, 102 TAA1/TAR family genes were identified in B. napus by using the Darmor as reference genome (Chalhoub et al., 2014). At the same time, we also searched the corresponding BnTAR genes in ZS11 genome of B. napus (Liu et al., 2021), and 130 genes were found. However, some difference was found between the two genomes cannot be matched. For example, four BnTAR genes that corresponding to AT5G53970 were found in Darmor genome, while only two BnTAR genes were found in ZS11 genome. On the contrary, two BnTAR genes that corresponding to AT5G53970 were found in Darmor genome. Those differences might be due to the different genetic backgrounds of Darmor and ZS11.
Introns increase the length of transcripts and are prone to detrimental effects on gene expression during their splicing (Jeffares et al., 2008). Meanwhile, genes that respond to stress are contained fewer introns (Lan et al., 2013). In this study, BnTAR genes were found to have a large and variable number of introns, with only nine genes having fewer than three and a maximum of 14 (Figure S2). Perhaps it is because TARs genes, as an important enzyme in the auxin synthesis pathway that is the basis of plant life, maintain high expression and have more introns number throughout the whole plant life cycle. Meanwhile, BnTAR genes are very long (all but BnALL5 are >1000 bp), and genes length are two or three times longer than that of CDS length.
Motifs are evolutionarily conserved amino acid/nucleotide sequence regions that usually play an important role in structure and function (Semwal et al., 2022). Many amino acid transaminase genes have been found in Arabidopsis genome, and most of these amino acid transaminases contain similar motifs, such as Pfam aminotransferase I/II signature (Pfam 00155), Pfam alliinase signature (Pfam 04864), Pfam aminotransferase III signature (Pfam 00202), etc. (Liepman and Olsen, 2004). The type and number of motifs varied in each branch, but the conserved motifs of Pfam 00155 or Pfam 04864 could be observed in each member of the BnTAR gene family. The differences in the motifs between BnALLs and BnAMIs were likely due to their configurations in the functional form. The three-dimensional structural analysis showed that the BnTAR proteins were all appeared to be overlapping bowl-shaped with a hollow in the center of the protein (Figures 6B, D, F, H), which contains the pyridoxal binding site, moreover, the pyridoxal binding site of the BnTAR proteins contain ten amino acids, and the ninth binding site is very conserved as arginine, which is also a catalytic residue. In addition, TARs proteins complete the amino acid transaminase function in dimer form, which could also be found in the aminotransaminase family in other species (Liepman et al., 2019).
Duplication patterns and synteny analysis of the BnTAR family
Gene duplication not only expands genome content but also diversifies gene function to ensure optimal adapt-ability and evolution of plants (Xu et al., 2012). Tandem duplication, segmental duplication and whole-genome duplication (WGD) were the three mechanisms that could contribute to the gene family expansion (Xu et al., 2012). WGDs play a major role in Brassicas, particularly the mesopolyploidization events, which are simultaneously accompanied by extensive chromosomal and genetic diploidization processes (Hohmann et al., 2015). Many studies shown that Brassicaceae have experienced WGD events during their evolution (Rana et al., 2004; Parkin et al., 2005), nevertheless, little is known about the evolution and origin of the TAA1/TAR family in plants. B. napus was an allopolyploidy formed by the hybridization of B. rapa and B. oleracea in 7500 years ago (Chalhoub et al., 2014). In this study, it was revealed that the BnTAR family formation was associated with segmental duplications and WGD. The Arabidopsis genome contains 36 TARs genes; therefore, more than 108 TARs genes would be expected to produce through one WGT event in the B. oleracea or B. rapa genome, and finally leading to much more TARs genes in B. napus. However, only 102 TARs genes were observed in the B. napus genome in the present study. These results indicated that more than 50% of the duplicated TARs genes were lost after WGT, which might be due to the extensive chromosome reshuffling during the diploidization after WGT (Cheng et al., 2014). It was found that some duplicated TARs genes disappeared in the B. napus genome. For instance, certain genes that are homologous to Arabidopsis (AT1G34060, AT1G01480, AT1G34040, AT2G22810, AT2G24850, AT2G24850, AT4G08040, AT5G49810, AT5G51690, AT1G23320, AT1G62960, AT1G77670, AT2G13810, AT3G61510, AT4G11280, AT4G24670, AT4G28410, AT5G36160) had less than four copies in B. napus (Table S3), by simply calculating the Arabidopsis genes at three times after the WGD event, these Arabidopsis genes have thirty fewer homologous genes in B. napus, which indicates the thirty genes that were not detected might have been lost. Similar losses after WGT also can been observed in other gene families of Brassica (Yu et al., 2014).
Segmental duplication also plays an important role in the expansion of BnTAR family, and 71 BnTAR genes were determined to have one or two gene pairs in the corresponding regions. Therefore, the formation of 70% (71/102) of the BnTAR genes is related to segmental duplication. Synteny analysis demonstrated that most BnTAR gene family members are located in well-conserved synteny regions, and some genes were deleted or gained. Similarly, synteny genomic regions with some deleted genes have been identified in other gene families (Yu et al., 2014). Despite the loss of some genes after WGT, the present findings suggested that segmental replication and WGD might play an important role in the expansion of the TARs family in B. napus, while tandem replication only played a minor role. The characteristics of the BnTAR family duplication patterns and synteny analysis were consistent with the Brassicaceae evolutionary history.
The origin and evolution of auxin biosynthetic genes in plants have been controversial for a long time (Wang et al., 2014; Yue et al., 2014). However, the recent studies have found that auxin biosynthesis was mainly originated in charophycean green algae, which was most closely related to terrestrial plants (Romani, 2017). The present results of the phylogenetic, evolutionary, and structural analysis show that the BnTARs have a close phylogenetic relationship and similar structure (Figure 4, Figure S2, Table S3). As discussed above, BnTAR family genes undergo WGD and segmental replication, which was also observed in Oryza sativa and Triticum aestivum (Shao et al., 2017; Guo et al., 2020). BnAMI8 and BnAMI54 that belonged to a relatively unique phylogenetic branch with a different structure from other BnTAR, which may be caused by some additional gene replication and fusion events. Such events may produce more diverse monomers that combine to form more diverse amino transaminases.
The relationship between BnTAR genes and seed oil content and seed weight in B. napus
The expression patterns of BnTAR family genes are different in different tissues, it was found that about a third of the BnTAR genes were barely expressed in B. napus, further analysis showed that the expression of BnTAR genes were with two patterns, one was mainly expressed in vegetative organs (such as roots, stems and leaves), the other was mainly expressed in reproductive organs (such as flowers and seeds) (Figure 7, Figure S4). The similar TAA1/TAR genes expression patterns were also found in wheat and A. thaliana (Poulet and Kriechbaumer, 2017; Shao et al., 2017).
In recent studies, more attention has been paid to the effects of these genes on the formation of lateral roots (He et al., 2011; Zhou et al., 2011; Ma et al., 2014), while the effect of TAR gene on the yield of economic crops was ignored, and the role of the TAR gene in yield increase is only studied in wheat (Shao et al., 2017). By compared the transcriptomic results of high and low oil content samples, and the relatively high and low seed weight samples, a preliminary study on the effect of BnTAR genes on seed traits in B. napus was conducted. We found that the expression of most BnTAR genes was not significantly different between high and low oil samples and the relatively high and low seed weight samples, but there were still several genes, such as BnALL2, BnALL7, BnAMI27 and BnAMI67, which were higher in the late stage of seed development in high oil samples, higher in the middle stage of seed development and lower in the late stage of seed development in high seed weight samples (Figure 8), it suggested their effects on seed oil content and weight regulation.
QTL mapping is an effective tool for the analysis of the genetic mechanism of complex quantitative traits (Mauricio, 2001), and a number of QTLs for oil content have been detected in diverse crops, for instance, Zea mays (Mangolin et al., 2004; Zhang J. et al., 2008; Yang et al., 2010), Glycine max (Orf et al., 1999; Kabelka et al., 2004; Zhang et al., 2004), Arachis hypogaea (Sarvamangala et al., 2011; Pandey et al., 2014) and B. napus (Gu ]et al., 2016; Chao et al., 2022). On the basis of the results of the previous quantitative trait locus (QTL) results for oil content and seed weight in our group, we found that the 21 and 12 BnTAR genes were located in the QTL interval of oil content and seed weight, respectively (Table 2). And three major QTLs (cqOC-A9-9, cqOC-C5-3 and cqOC-C5-4), where BnAMI35, BnAMI64 and BnAMI65 located were showed a large effect (phenotypic variation>10%) in at least two trials (Chao et al., 2017). Also, some BnTAR genes, for example, BnALL2, BnALL3, BnAMI10, and BnAMI67, had not only been mapped in QTL intervals, but also affected seed oil content in previous transcriptome analysis. These results indicated that some of the BnTAR genes play an important role in regulating the seed weight and seed oil formation in B. napus.
Conclusion
In this study, 102 BnTAR genes were identified and comprehensively analyzed. A conserved catalytic structural domain of the TAR superfamily was observed, and WGD and segmental replication were the main events for the BnTAR gene family formation. Expression patterns combined with QTL analysis provided the new insights into the biological functions of BnTAR proteins for oil content and seed weight.
Data availability statement
The original contributions presented in the study are included in the article/Supplementary Material. Further inquiries can be directed to the corresponding author.
Author contributions
XC and XL did the identification of TAR family genes in B. napus, duplication pattern analysis, and drafted the manuscript. XL did multiple sequence alignments of the BnTAR genes and conducted the phylogenetic analysis. XC, XL, JH, and MT did the RT-qPCR experiment. XC, XL, and HL analyzed QTL and transcriptomic data. XC and XL collected TAR genes information of other species, and did the structural analysis and prepared Figures 1–8 and the Supplementary Information. ML designed and supervised the experiment. ML and JH revised the manuscript. All authors reviewed the manuscript.
Funding
This study is supported by the National Natural Science Foundation of China (32272067).
Conflict of interest
The authors declare that the research was conducted in the absence of any commercial or financial relationships that could be construed as a potential conflict of interest.
Publisher’s note
All claims expressed in this article are solely those of the authors and do not necessarily represent those of their affiliated organizations, or those of the publisher, the editors and the reviewers. Any product that may be evaluated in this article, or claim that may be made by its manufacturer, is not guaranteed or endorsed by the publisher.
Supplementary material
The Supplementary Material for this article can be found online at: https://www.frontiersin.org/articles/10.3389/fpls.2022.1098820/full#supplementary-material
References
Altschul, S. F., Gish, W., Miller, W., Myers, E. W., Lipman, D. J. (1990). Basic local alignment search tool. J. Mol. Biol. 215, 403–410. doi: 10.1016/s0022-2836(05)80360-2
Bailey, T. L., Boden, M., Buske, F. A., Frith, M., Grant, C. E., Clementi, L., et al. (2009). MEME SUITE: tools for motif discovery and searching. Nucleic Acids Res. 37, W202–W208. doi: 10.1093/nar/gkp335
Bjellqvist, B., Basse, B., Olsen, E., Celis, J. E. (1994). Reference points for comparisons of two-dimensional maps of proteins from different human cell types defined in a pH scale where isoelectric points correlate with polypeptide compositions. Electrophoresis 15, 529–539. doi: 10.1002/elps.1150150171
Bjellqvist, B., Hughes, G. J., Pasquali, C., Paquet, N., Ravier, F., Sanchez, J. C., et al. (1993). The focusing positions of polypeptides in immobilized pH gradients can be predicted from their amino acid sequences. Electrophoresis 14, 1023–1031. doi: 10.1002/elps.11501401163
Blum, T., Briesemeister, S., Kohlbacher, O. (2009). MultiLoc2: integrating phylogeny and gene ontology terms improves subcellular protein localization prediction. BMC Bioinf. 10, 274. doi: 10.1186/1471-2105-10-274
Buchan, D. W., Minneci, F., Nugent, T. C., Bryson, K., Jones, D. T. (2013). Scalable web services for the PSIPRED protein analysis workbench. Nucleic Acids Res. 41, W349–W357. doi: 10.1093/nar/gkt381
Chalhoub, B., Denoeud, F., Liu, S., Parkin, I. A., Tang, H., Wang, X., et al. (2014). Plant genetics. early allopolyploid evolution in the post-neolithic Brassica napus oilseed genome. Science 345, 950–953. doi: 10.1126/science.1253435
Chang, W., Li, Y., Qu, Y., Liu, Y., Zhang, G., Zhao, Y., et al. (2022). Mixotrophic cultivation of microalgae to enhance the biomass and lipid production with synergistic effect of red light and phytohormone IAA. Renewable Energy 187, 819–828. doi: 10.1016/j.renene.2022.01.108
Chao, H., Guo, L., Zhao, W., Li, H., Li, M. (2022). A major yellow-seed QTL on chromosome A09 significantly increases the oil content and reduces the fiber content of seed in Brassica napus. Theor. Appl. Genet. 135, 1293–1305. doi: 10.1007/s00122-022-04031-0
Chao, H., Wang, H., Wang, X., Guo, L., Gu, J., Zhao, W., et al. (2017). Genetic dissection of seed oil and protein content and identification of networks associated with oil content in Brassica napus. Sci. Rep. 7, 46295. doi: 10.1038/srep46295
Chen, C., Chen, H., Zhang, Y., Thomas, H. R., Frank, M. H., He, Y., et al. (2020). TBtools: An integrative toolkit developed for interactive analyses of big biological data. Mol. Plant 13, 1194–1202. doi: 10.1016/j.molp.2020.06.009
Cheng, F., Wu, J., Wang, X. (2014). Genome triplication drove the diversification of brassica plants. Horticult. Res. 1, 14024. doi: 10.1038/hortres.2014.24
Chen, H., Wang, T., He, X., Cai, X., Lin, R., Liang, J., et al. (2022). BRAD V3.0: an upgraded brassicaceae database. Nucleic Acids Res. 50, D1432–D1441. doi: 10.1093/nar/gkab1057
Chiu, J. C., Brenner, E. D., Desalle, R., Nitabach, M. N., Holmes, T. C., Coruzzi, G. M. (2002). Phylogenetic and expression analysis of the glutamate-receptor-like gene family in Arabidopsis thaliana. Mol. Biol. Evol. 19, 1066–1082. doi: 10.1093/oxfordjournals.molbev.a004165
Chou, K. C., Shen, H. B. (2010). Plant-mPLoc: a top-down strategy to augment the power for predicting plant protein subcellular localization. PloS One 5, e11335. doi: 10.1371/journal.pone.0011335
Depuydt, T., Vandepoele, K. (2021). Multi-omics network-based functional annotation of unknown arabidopsis genes. Plant J. 108, 1193–1212. doi: 10.1111/tpj.15507
Dhindsa, R. S., Amaral, A. C., Cleland, R. E. (1984). Rapid reduction by IAA of malondialdehyde levels in avena coleoptiles, a possible effect on lipid peroxidation. Biochem. Biophys. Res. Commun. 125, 76–81. doi: 10.1016/s0006-291x(84)80336-8
El-Gebali, S., Mistry, J., Bateman, A., Eddy, S. R., Luciani, A., Potter, S. C., et al. (2019). The pfam protein families database in 2019. Nucleic Acids Res. 47, D427–D432. doi: 10.1093/nar/gky995
Gibrat, J. F., Madej, T., Bryant, S. H. (1996). Surprising similarities in structure comparison. Curr. Opin. Struct. Biol. 6, 377–385. doi: 10.1016/s0959-440x(96)80058-3
Goodstein, D. M., Shu, S., Howson, R., Neupane, R., Hayes, R. D., Fazo, J., et al. (2012). Phytozome: a comparative platform for green plant genomics. Nucleic Acids Res. 40, D1178–D1186. doi: 10.1093/nar/gkr944
Gu, J., Chao, H., Wang, H., Li, Y., Li, D., Xiang, J., et al. (2016). Identification of the relationship between oil body morphology and oil content by microstructure comparison combining with QTL analysis in Brassica napus. Front. Plant Sci. 7. doi: 10.3389/fpls.2016.01989
Guo, T., Chen, K., Dong, N. Q., Ye, W. W., Shan, J. X., Lin, H. X. (2020). Tillering and small grain 1 dominates the tryptophan aminotransferase family required for local auxin biosynthesis in rice. J. Integr. Plant Biol. 62, 581–600. doi: 10.1111/jipb.12820
He, W., Brumos, J., Li, H., Ji, Y., Ke, M., Gong, X., et al. (2011). A small-molecule screen identifies l-kynurenine as a competitive inhibitor of TAA1/TAR activity in ethylene-directed auxin biosynthesis and root growth in arabidopsis. Plant Cell 23, 3944–3960. doi: 10.1105/tpc.111.089029
Higgins, D. G., Sharp, P. M. (1988). CLUSTAL: a package for performing multiple sequence alignment on a microcomputer. Gene 73, 237–244. doi: 10.1016/0378-1119(88)90330-7
Hohmann, N., Wolf, E. M., Lysak, M. A., Koch, M. A. (2015). A time-calibrated road map of brassicaceae species radiation and evolutionary history. Plant Cell 27, 2770–2784. doi: 10.1105/tpc.15.00482
Hu, B., Jin, J., Guo, A. Y., Zhang, H., Luo, J., Gao, G. (2015). GSDS 2.0: an upgraded gene feature visualization server. Bioinformatics 31, 1296–1297. doi: 10.1093/bioinformatics/btu817
Jeffares, D. C., Penkett, C. J., Bähler, J. (2008). Rapidly regulated genes are intron poor. Trends Genet. 24, 375–378. doi: 10.1016/j.tig.2008.05.006
Jones, D. T. (1999). Protein secondary structure prediction based on position-specific scoring matrices. J. Mol. Biol. 292, 195–202. doi: 10.1006/jmbi.1999.3091
Kabelka, E. A., Diers, B. W., Fehr, W. R., Leroy, A. R., Baianu, I. C., You, T., et al. (2004). Putative alleles for increased yield from soybean plant introductions. Crop Sci. 44, 784–791. doi: 10.2135/cropsci2004.7840
Kakei, Y., Nakamura, A., Yamamoto, M., Ishida, Y., Yamazaki, C., Sato, A., et al. (2017). Biochemical and chemical biology study of rice OsTAR1 revealed that tryptophan aminotransferase is involved in auxin biosynthesis: Identification of a potent OsTAR1 inhibitor, Pyruvamine2031. Plant Cell Physiol. 58, 598–606. doi: 10.1093/pcp/pcx007
Kelley, L. A., Sternberg, M. J. (2009). Protein structure prediction on the web: a case study using the phyre server. Nat. Protoc. 4, 363–371. doi: 10.1038/nprot.2009.2
Kim, J., Woo, H. R., Nam, H. G. (2016). Toward systems understanding of leaf senescence: An integrated multi-omics perspective on leaf senescence research. Mol. Plant 9, 813–825. doi: 10.1016/j.molp.2016.04.017
Kyte, J., Doolittle, R. F. (1982). A simple method for displaying the hydropathic character of a protein. J. Mol. Biol. 157, 105–132. doi: 10.1016/0022-2836(82)90515-0
Lan, T., Gao, J., Zeng, Q. Y. (2013). Genome-wide analysis of the LEA (late embryogenesis abundant) protein gene family in Populus trichocarpa. Tree Genet. Genomes 9, 253–264. doi: 10.1007/s11295-012-0551-2
Le Deunff, E., Beauclair, P., Deleu, C., Lecourt, J. (2019). Inhibition of aminotransferases by aminoethoxyvinylglycine triggers a nitrogen limitation condition and deregulation of histidine homeostasis that impact root and shoot development and nitrate uptake. Front. Plant Sci. 10. doi: 10.3389/fpls.2019.01387
Letunic, I., Copley, R. R., Schmidt, S., Ciccarelli, F. D., Doerks, T., Schultz, J., et al. (2004). SMART 4.0: towards genomic data integration. Nucleic Acids Res. 32, D142–D144. doi: 10.1093/nar/gkh088
Liang, Y., Wan, N., Cheng, Z., Mo, Y., Liu, B., Liu, H., et al. (2017). Whole-genome identification and expression pattern of the vicinal oxygen chelate family in rapeseed (Brassica napus l.). Front. Plant Sci. 8. doi: 10.3389/fpls.2017.00745
Liepman, A. H., Olsen, L. J. (2004). Genomic analysis of aminotransferases in Arabidopsis thaliana. Crit. Rev. Plant Sci. 23, 73–89. doi: 10.1080/07352680490273419
Liepman, A. H., Vijayalakshmi, J., Peisach, D., Hulsebus, B., Olsen, L. J., Saper, M. A. (2019). Crystal structure of photorespiratory Alanine:Glyoxylate aminotransferase 1 (AGT1) from Arabidopsis thaliana. Front. Plant Sci. 10, 1229. doi: 10.3389/fpls.2019.01229
Li, W., Liu, B., Yu, L., Feng, D., Wang, H., Wang, J. (2009). Phylogenetic analysis, structural evolution and functional divergence of the 12-oxo-phytodienoate acid reductase gene family in plants. BMC Evol. Biol. 9, 90. doi: 10.1186/1471-2148-9-90
Liu, D., Yu, L., Wei, L., Yu, P., Wang, J., Zhao, H., et al. (2021). BnTIR: an online transcriptome platform for exploring RNA-seq libraries for oil crop Brassica napus. Plant Biotechnol. J. 19, 1895–1897. doi: 10.1111/pbi.13665
Lu, S., Wang, J., Chitsaz, F., Derbyshire, M. K., Geer, R. C., Gonzales, N. R., et al. (2020). CDD/SPARCLE: the conserved domain database in 2020. Nucleic Acids Res. 48, D265–D268. doi: 10.1093/nar/gkz991
Ma, W., Li, J., Qu, B., He, X., Zhao, X., Li, B., et al. (2014). Auxin biosynthetic gene TAR2 is involved in low nitrogen-mediated reprogramming of root architecture in arabidopsis. Plant J. 78, 70–79. doi: 10.1111/tpj.12448
Mangolin, C. A., De Souza, C. L., Garcia, A., Garcia, A. F., Sibov, S. T., De Souza, A. P. (2004). Mapping QTLs for kernel oil content in a tropical maize population. Euphytica 137, 251–259. doi: 10.1023/B:EUPH.0000041588.95689.47
Mauricio, R. (2001). Mapping quantitative trait loci in plants: Uses and caveats for evolutionary biology. Nat. Rev. Genet. 2, 370–381. doi: 10.1038/35072085
Orf, J. H., Chase, K., Jarvik, T., Mansur, L. M., Cregan, P. B., Adler, F. R., et al. (1999). Genetics of soybean agronomic traits: I. comparison of three related recombinant inbred populations. Crop Sci. 39, 1642–1651. doi: 10.2135/cropsci1999.3961642x
Ostergaard, L., King, G. J. (2008). Standardized gene nomenclature for the brassica genus. Plant Methods 4, 10. doi: 10.1186/1746-4811-4-10
Pandey, M. K., Wang, M. L., Qiao, L., Feng, S., Khera, P., Wang, H., et al. (2014). Identification of QTLs associated with oil content and mapping FAD2 genes and their relative contribution to oil quality in peanut (Arachis hypogaea l.). BMC Genet. 15, 133. doi: 10.1186/s12863-014-0133-4
Paque, S., Weijers, D. (2016). Q&A: Auxin: the plant molecule that influences almost anything. BMC Biol. 14, 67. doi: 10.1186/s12915-016-0291-0
Parkin, I. A., Gulden, S. M., Sharpe, A. G., Lukens, L., Trick, M., Osborn, T. C., et al. (2005). Segmental structure of the Brassica napus genome based on comparative analysis with Arabidopsis thaliana. Genetics 171, 765–781. doi: 10.1534/genetics.105.042093
Phillips, K. A., Skirpan, A. L., Liu, X., Christensen, A., Slewinski, T. L., Hudson, C., et al. (2011). Vanishing tassel2 encodes a grass-specific tryptophan aminotransferase required for vegetative and reproductive development in maize. Plant Cell 23, 550–566. doi: 10.1105/tpc.110.075267
Poulet, A., Kriechbaumer, V. (2017). Bioinformatics analysis of phylogeny and transcription of TAA/YUC auxin biosynthetic genes. Int. J. Mol. Sci. 18, 1791. doi: 10.3390/ijms18081791
Raboanatahiry, N., Chao, H., Dalin, H., Pu, S., Yan, W., Yu, L., et al. (2018). QTL alignment for seed yield and yield related traits in Brassica napus. Front. Plant Sci. 9. doi: 10.3389/fpls.2018.01127
Rana, D., Van Den Boogaart, T., O'neill, C. M., Hynes, L., Bent, E., Macpherson, L., et al. (2004). Conservation of the microstructure of genome segments in Brassica napus and its diploid relatives. Plant J. 40, 725–733. doi: 10.1111/j.1365-313X.2004.02244.x
Romani, F. (2017). Origin of TAA genes in charophytes: New insights into the controversy over the origin of auxin biosynthesis. Front. Plant Sci. 8, 1616. doi: 10.3389/fpls.2017.01616
Saitou, N., Nei, M. (1987). The neighbor-joining method: a new method for reconstructing phylogenetic trees. Mol. Biol. Evol. 4, 406–425. doi: 10.1093/oxfordjournals.molbev.a040454
Sarvamangala, C., Gowda, M. V. C., Varshney, R. K. (2011). Identification of quantitative trait loci for protein content, oil content and oil quality for groundnut (Arachis hypogaea l.). Field Crops Res. 122, 49–59. doi: 10.1016/j.fcr.2011.02.010
Schmidt, R., Acarkan, A., Boivin, K. (2001). Comparative structural genomics in the brassicaceae family. Plant Physiol. Biochem. 39, 253–262. doi: 10.1016/S0981-9428(01)01239-6
Semwal, R., Aier, I., Raj, U., Varadwaj, P. K. (2022). Pr[m]: An algorithm for protein motif discovery. IEEE/ACM Trans. Comput. Biol. Bioinf. 19, 585–592. doi: 10.1109/tcbb.2020.2999262
Shao, A., Ma, W., Zhao, X., Hu, M., He, X., Teng, W., et al. (2017). The auxin biosynthetic TRYPTOPHAN AMINOTRANSFERASE RELATED TaTAR2.1-3A increases grain yield of wheat. Plant Physiol. 174, 2274–2288. doi: 10.1104/pp.17.00094
Shiu, S. H., Bleecker, A. B. (2003). Expansion of the receptor-like kinase/Pelle gene family and receptor-like proteins in arabidopsis. Plant Physiol. 132, 530–543. doi: 10.1104/pp.103.021964
Stepanova, A. N., Hoyt, J. M., Hamilton, A. A., Alonso, J. M. (2005). ). a link between ethylene and auxin uncovered by the characterization of two root-specific ethylene-insensitive mutants in arabidopsis. Plant Cell 17, 2230–2242. doi: 10.1105/tpc.105.033365
Stepanova, A. N., Robertson-Hoyt, J., Yun, J., Benavente, L. M., Xie, D. Y., Dolezal, K., et al. (2008). TAA1-mediated auxin biosynthesis is essential for hormone crosstalk and plant development. Cell 133, 177–191. doi: 10.1016/j.cell.2008.01.047
Tamura, K., Stecher, G., Peterson, D., Filipski, A., Kumar, S. (2013). MEGA6: Molecular evolutionary genetics analysis version 6.0. Mol. Biol. Evol. 30, 2725–2729. doi: 10.1093/molbev/mst197
Toledo-Ortiz, G., Huq, E., Quail, P. H. (2003). The arabidopsis basic/helix-loop-helix transcription factor family. Plant Cell 15, 1749–1770. doi: 10.1105/tpc.013839
Wang, C., Liu, Y., Li, S. S., Han, G. Z. (2014). Origin of plant auxin biosynthesis in charophyte algae. Trends Plant Sci. 19, 741–743. doi: 10.1016/j.tplants.2014.10.004
Wang, X., Wang, H., Long, Y., Li, D., Yin, Y., Tian, J., et al. (2013). Identification of QTLs associated with oil content in a high-oil Brassica napus cultivar and construction of a high-density consensus map for QTLs comparison in B. napus. PloS One 8, e80569. doi: 10.1371/journal.pone.0080569
Wang, X., Wang, H., Wang, J., Sun, R., Wu, J., Liu, S., et al. (2011). The genome of the mesopolyploid crop species Brassica rapa. Nat. Genet. 43, 1035–1039. doi: 10.1038/ng.919
Woodward, A. W., Bartel, B. (2005). Auxin: Regulation, action, and interaction. Ann. Bot. 95, 707–735. doi: 10.1093/aob/mci083
Xu, G., Guo, C., Shan, H., Kong, H. (2012). Divergence of duplicate genes in exon-intron structure. Proc. Natl. Acad. Sci. U. States America 109, 1187–1192. doi: 10.1073/pnas.1109047109
Yang, X., Guo, Y., Yan, J., Zhang, J., Song, T., Rocheford, T., et al. (2010). Major and minor QTL and epistasis contribute to fatty acid compositions and oil concentration in high-oil maize. Theor. Appl. Genet. 120, 665–678. doi: 10.1007/s00122-009-1184-1
Yan, S., Li, H., Chao, H., He, J., Ding, Y., Zhao, W., et al. (2022). Refinement of four major QTL for oil content in Brassica napus by integration of genome resequencing and transcriptomics. Crop J. 10, 627–637. doi: 10.1016/j.cj.2022.01.002
Yates, A. D., Allen, J., Amode, R. M., Azov, A. G., Barba, M., Becerra, A., et al. (2022). Ensembl genomes 2022: an expanding genome resource for non-vertebrates. Nucleic Acids Res. 50, D996–1003. doi: 10.1093/nar/gkab1007
Yue, J., Hu, X., Huang, J. (2014). Origin of plant auxin biosynthesis. Trends Plant Sci. 19, 764–770. doi: 10.1016/j.tplants.2014.07.004
Yu, J., Tehrim, S., Zhang, F., Tong, C., Huang, J., Cheng, X., et al. (2014). Genome-wide comparative analysis of NBS-encoding genes between brassica species and Arabidopsis thaliana. BMC Genomics 15, 3. doi: 10.1186/1471-2164-15-3
Zhang, J., Lu, X. Q., Song, X. F., Yan, J. B., Song, T. M., Dai, J. R., et al. (2008). Mapping quantitative trait loci for oil, starch, and protein concentrations in grain with high-oil maize by SSR markers. Euphytica 162, 335–344. doi: 10.1007/s10681-007-9500-9
Zhang, W. K., Wang, Y. J., Luo, G. Z., Zhang, J. S., He, C. Y., Wu, X. L., et al. (2004). QTL mapping of ten agronomic traits on the soybean ( Glycine max l. Merr.) genetic map and their association with EST markers. Theor. Appl. Genet. 108, 1131–1139. doi: 10.1007/s00122-003-1527-2
Zhang, R., Wang, B., Ouyang, J., Li, J., Wang, Y. (2008). Arabidopsis indole synthase, a homolog of tryptophan synthase alpha, is an enzyme involved in the trp-independent indole-containing metabolite biosynthesis. J. Integr. Plant Biol. 50, 1070–1077. doi: 10.1111/j.1744-7909.2008.00729.x
Zhao, Y. (2012). Auxin biosynthesis: a simple two-step pathway converts tryptophan to indole-3-acetic acid in plants. Mol. Plant 5, 334–338. doi: 10.1093/mp/ssr104
Zhao, W., Wang, X., Wang, H., Tian, J., Li, B., Chen, L., et al. (2016). Genome-wide identification of QTL for seed yield and yield-related traits and construction of a high-density consensus map for QTL comparison in Brassica napus. Front. Plant Sci. 7. doi: 10.3389/fpls.2016.00017
Zhao, W., Zhang, L., Chao, H., Wang, H., Ta, N., Li, H., et al. (2019). Genome-wide identification of silique-related traits based on high-density genetic linkage map in Brassica napus. Mol. Breed. 39, 86. doi: 10.1007/s11032-019-0988-1
Keywords: genome-wide identification, TAR gene family, agronomic traits, Brassica napus, phylogenetic analysis
Citation: Cheng X, Liu X, He J, Tang M, Li H and Li M (2022) The genome wide analysis of Tryptophan Aminotransferase Related gene family, and their relationship with related agronomic traits in Brassica napus. Front. Plant Sci. 13:1098820. doi: 10.3389/fpls.2022.1098820
Received: 15 November 2022; Accepted: 08 December 2022;
Published: 21 December 2022.
Edited by:
Liezhao Liu, Southwest University, ChinaReviewed by:
Jian Wu, Yangzhou University, ChinaJing Wen, Huazhong Agricultural University, China
Yu Pan, Southwest University, China
Copyright © 2022 Cheng, Liu, He, Tang, Li and Li. This is an open-access article distributed under the terms of the Creative Commons Attribution License (CC BY). The use, distribution or reproduction in other forums is permitted, provided the original author(s) and the copyright owner(s) are credited and that the original publication in this journal is cited, in accordance with accepted academic practice. No use, distribution or reproduction is permitted which does not comply with these terms.
*Correspondence: Maoteng Li, bGltYW90ZW5nNDI2QGh1c3QuZWR1LmNu
†These authors have contributed equally to this work