 Pingyu Yan
 Zixiong Xie1
 Hanguo Zhang
95% of researchers rate our articles as excellent or good
Learn more about the work of our research integrity team to safeguard the quality of each article we publish.
Find out more
ORIGINAL RESEARCH article
Front. Plant Sci. , 16 January 2023
Sec. Plant Breeding
Volume 13 - 2022 | https://doi.org/10.3389/fpls.2022.1079571
This article is part of the Research Topic Plant Genotyping: From Traditional Markers to Modern Technologies View all 15 articles
Korean pine is a native tree species in Northeast China. In order to meet the needs of germplasm resource evaluation and molecular marker-assisted breeding of Korean pine, we collected Korean pine clones from 7 populations in Northeast China, analyzed the genetic diversity and genetic structure by SSR molecular marker technology and clustered them to revealed the inter- and intrapopulation differentiation characteristics of each clone. The fingerprint profiles of 161 Korean pine clones were also constructed. 77 alleles were detected for 11 markers, and 18 genotypes were identified on average for each marker. The PIC of the different markers ranged from 0.155-0.855, and the combination of PI and PIsibs for the 11 markers was 3.1 × 10⁻⁸ and 1.14 × 10⁻³, respectively. MANOVA showed that genetic variation existed mainly within populations, accounting for 98% of the total variation. The level of genetic differentiation among populations was low, with an average Nm between populations of 11.036. Genetic diversity is lower in the Lushuihe population and higher in the Tieli population. The 161 Korean pine clones were divided into 4 or 7 populations, and the 7 populations were not clearly distinguished from each other, with only the Lushuihe population showing partial differentiation. There is no significant correlation between the genetic distance of Korean pine populations and the geographical distance of their superior tree sources. This result can provide recommendations for future Korean pine breeding programs. The combination of 11 markers could completely distinguish 161 clones and establish the fingerprint. Genetic diversity of Korean pine clones from the 7 populations was abundant, and the genetic distances of individuals and populations were evenly dispersed. The fingerprint map can be used for the identification of Korean pine clones.
Genetic diversity is the basis of evolution (Hughes et al., 2008) and provides the raw material for evolution of natural selection (Nevo, 1988; Zhang et al., 2022). Intraspecific genetic variation is the basis and most basic level of biodiversity (Pauls et al., 2013), and it is important for the evolution and conservation of species (Ellegren and Galtier, 2016). The level of genetic diversity within a population affects the productivity, growth and stability of that population (Hughes et al., 2008). Genetic diversity may not necessarily enable a population to persist, but reduced genetic diversity in a population may have long-term effects on its future evolution, as well as on its adaptive capacity in times of environmental change (Jump et al., 2009; Markert et al., 2010). The assessment of genetic diversity within and among populations is important for decision-making in genetic conservation programs, because studying the relationship between genetic diversity and fitness can predict the importance of genetic diversity for a given population (Eding et al., 2002). The genetic basis of a breeding population determines the genetic quality and long-term potential of breeding programs and products (Ivetić et al., 2016). The size of parental populations determines the level of genetic diversity in new stands (Flint-Garcia, 2013), so it is in our best interest to maintain diversity and promote systematic redundancy and resilience (Ledig, 1992). To avoid population genetic bottlenecks and maintain maximum effective population size, appropriate sampling strategies can maximize increase genetic diversity in the population of seed production (Ivetic et al., 2016). Regular monitoring of trends in genetic diversity utilization in breeding programs can provide breeders with options for developing new varieties and hybrids (Govindaraj et al., 2015; Jin et al., 2016).
Korean pine (Pinus koraiensis), a genus of pine in the family Pinaceae, National Key Conserved Wild Plants of Grade II in China, is a native species in northeast China (Lim, 2012). Traditionally, Korean pine is a good tree species capable of providing wood, pulp and oil. In addition, the seed of Korean pine is the most popular pine nut due to its nutritional value (Yoon et al., 1989; Wolff et al., 2000), high amounts of crude protein, crude fat, polysaccharides and crude fiber as well as vitamins, minerals and trace elements (Ca, P, Mn, Co, Cu and Zn) (Nergiz and Donmez, 2004; Zadernowski et al., 2009). The market demand for superior Korean pine seeds has promoted the development of Korean pine clones seed orchard, which were established in China as early as the early 1960s, and the technical system for the creation from fringe picking to seedlings management was proposed in the 1970s. Subsequently, Korean pine clones seed orchards were established in many places in northeast China to improve the genetic quality of Korean pine seeds that can be used for afforestation. At the same time, research on productivity techniques, flowering and fruiting patterns in Korean pine seed orchards is also being conducted (An et al., 1992). These excellent Korean pine resources have become important conventional breeding materials and are used in traditional breeding studies, including analysis of fruiting traits, selection of superior clones, analysis of seed traits, nutrient composition, variation studies of seed traits, genetic diversity analysis and studies on phenotypic diversity of needles and cones in Korean pine seed orchard (Zhang et al., 2015b; Tong et al., 2019; Weihuai et al., 2019; Pingyu et al., 2020; Qianping, 2020; Longhai et al., 2021). In addition, studies on the reaction conditions of ISSR, SSR and SRAP in Korean pine, laying the foundation for genetic differentiation of Korean pine populations based on molecular markers (Feng et al., 2004; Feng et al., 2010; Zhao et al., 2010).
Follow-up surveys conducted to confirm clones have generally shown that mislabeling of seed orchard divisions is relatively common (Wheeler and Jech, 1992). Plant varieties are often identified by morphology, traditionally. However, it is difficult to identify different clones morphologically, because there is little morphological variation among clones, and some morphological appearances are susceptible to environmental factors. The limitations of genetic markers for phenotype have led to the development of more effective-directly DNA-based markers called molecular markers, which is specific DNA fragments representing genome-level differences (Agarwal et al., 2008). Microsatellite is ideal for identifying individuals and studying genetic diversity, due to their ubiquity, reproducibility, a high level of polymorphism, co-dominant and high levels of transferability (Guan et al., 2019; Lv et al., 2020; Nn et al., 2020; Carletti et al., 2021). Therefore, SSR has been used for genetic diversity studies, genetic linkage, and fingerprinting of many important economic tree species, such as Date palm (Ziziphus jujuba Mill.), Poplar (Populus L.), and Pear (Pyrus spp) (Liang et al., 2005; Gao et al., 2012; Ma et al., 2012), as well as pines such as Masson pine (Pinus massoniana) (Afeng, 2005) and Camphor pine (Pinus sylvestris var. mongolica) (Huili et al., 2022).
In this study, we collected 161 clones from 7 Korean pine seed orchards in northeastern China. 11 SSR genotyping data of 161 clones of Korean pine were obtained by capillary electrophoresis. The fingerprint map of Korean pine clones was established, which provides a strong guarantee of technology for resource sharing and the distribution application of superior clones, and has important value in property protection and promotion of superior seed. In addition, the genetic diversity and genetic structure of Korean pine clones seed orchard are evaluated and systematically described, which can help improve the utilization efficiency of Korean pine resources, guide the development of further breeding strategies, and provide a basis for the scientific utilization of Korean pine germplasm resources.
In this study, a total of 161 clones were collected from 7 Korean pine seed orchards in Heilongjiang and Jilin Province, whose superior tree (refers to individuals with excellent growth, timber and resistance adaptations in natural or planted forests with similar environmental conditions, such as the same stand conditions, the same forest age and the same forestry measures) originated from 6 sites in Changbai Mountains and Xiaoxinganling, the main distribution areas of Korean pine (Table 1). Total of 805 samples collected, with 5 ramets has collected from each clone. Annual conifers of Korean pine were collected and snap-frozen in liquid nitrogen for DNA extraction.
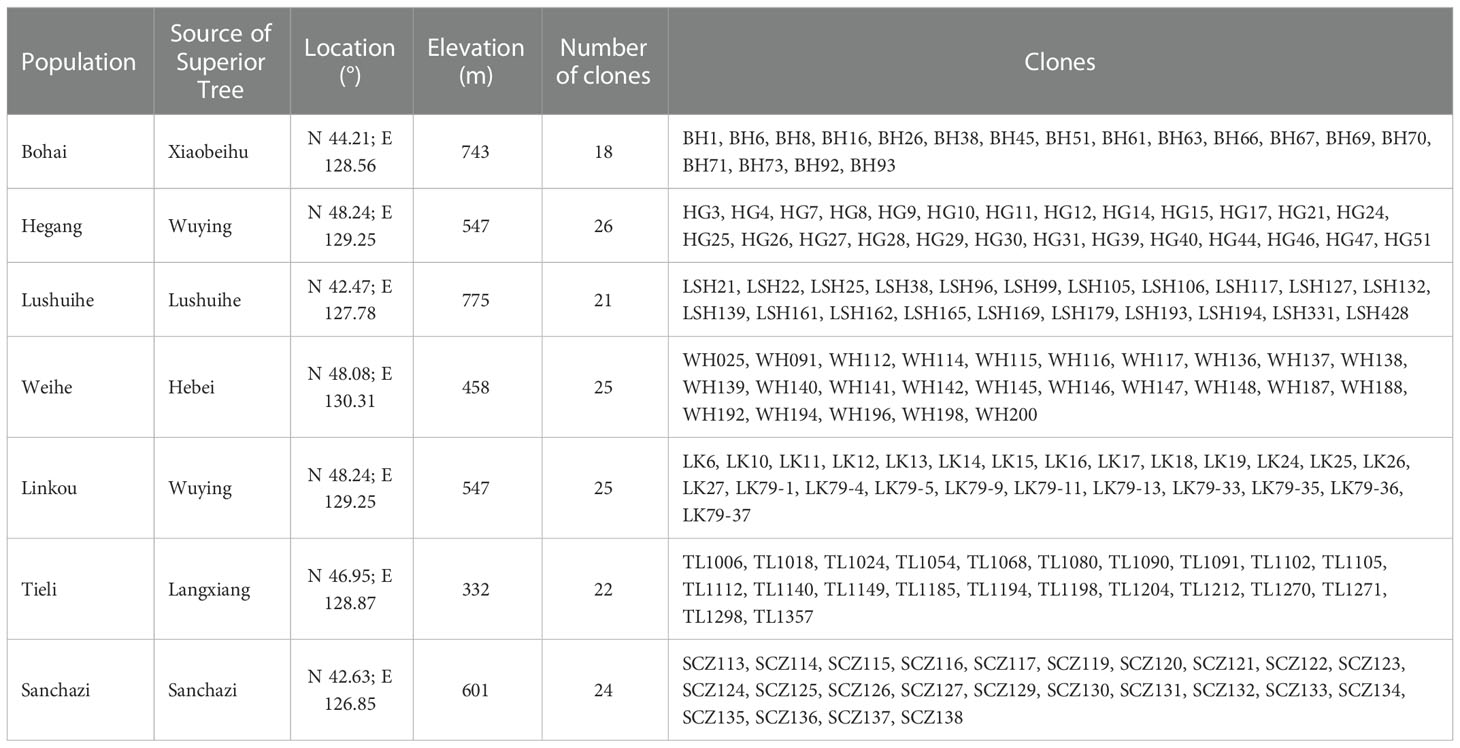
Table 1 Summary of material source information.
Total DNA of Korean pine samples was extracted using the DP-320 Plant Genome Extraction Kit (Tiangen, Beijing, China). The integrity of genomic DNA was examined using a 1% agarose gel, and DNA concentration and quality were examined using Micro-Spectrophotometer (Bio-DL, Shanghai, China.) after extraction. The concentration of each DNA sample was diluted to 10 ng/μL and stored at -20°C.
A total 142 primer pairs from the published SSR primers of 7 species of Pinaceae (Pinus taeda, Pinus albicaulis, Pinus dabeshanensis, Pinus armandii, Pinus koraiensis and Pinus massoniana) were selected and synthesized by Sangon Biotech (Shanghai) Co., Ltd., Shanghai, China (Liewlaksaneeyanawin et al., 2004; Echt et al., 2011; Yu et al., 2012; Dou et al., 2013; Xiang et al., 2015; Zhouxian et al., 2015; Zhang et al., 2015a; Dong et al., 2016; Lea et al., 2018; Li et al., 2020). Ten samples of DNA were randomly selected for polymorphism screening of synthesized primers. A PCR system was performed on DNA Engine thermal cycler (Biometra, Ilmenau OT Langewiesen, Germany) in 20μl volumes containing 0.5 μM each of forward and reverse primers, 200 μM dNTP, 2.0 μL 10×buffer, 2 U Taq DNA polymerase (TransGen Biotech Co., Beijing, China), and around 10 ng DNA. The PCR program was as follows: 3 min at 94°C, 35 cycles of 30 s at 94°C, 30 s at Tm (Table 2), and 15 s at 72°; and a final extension at 72°C for 7 min.
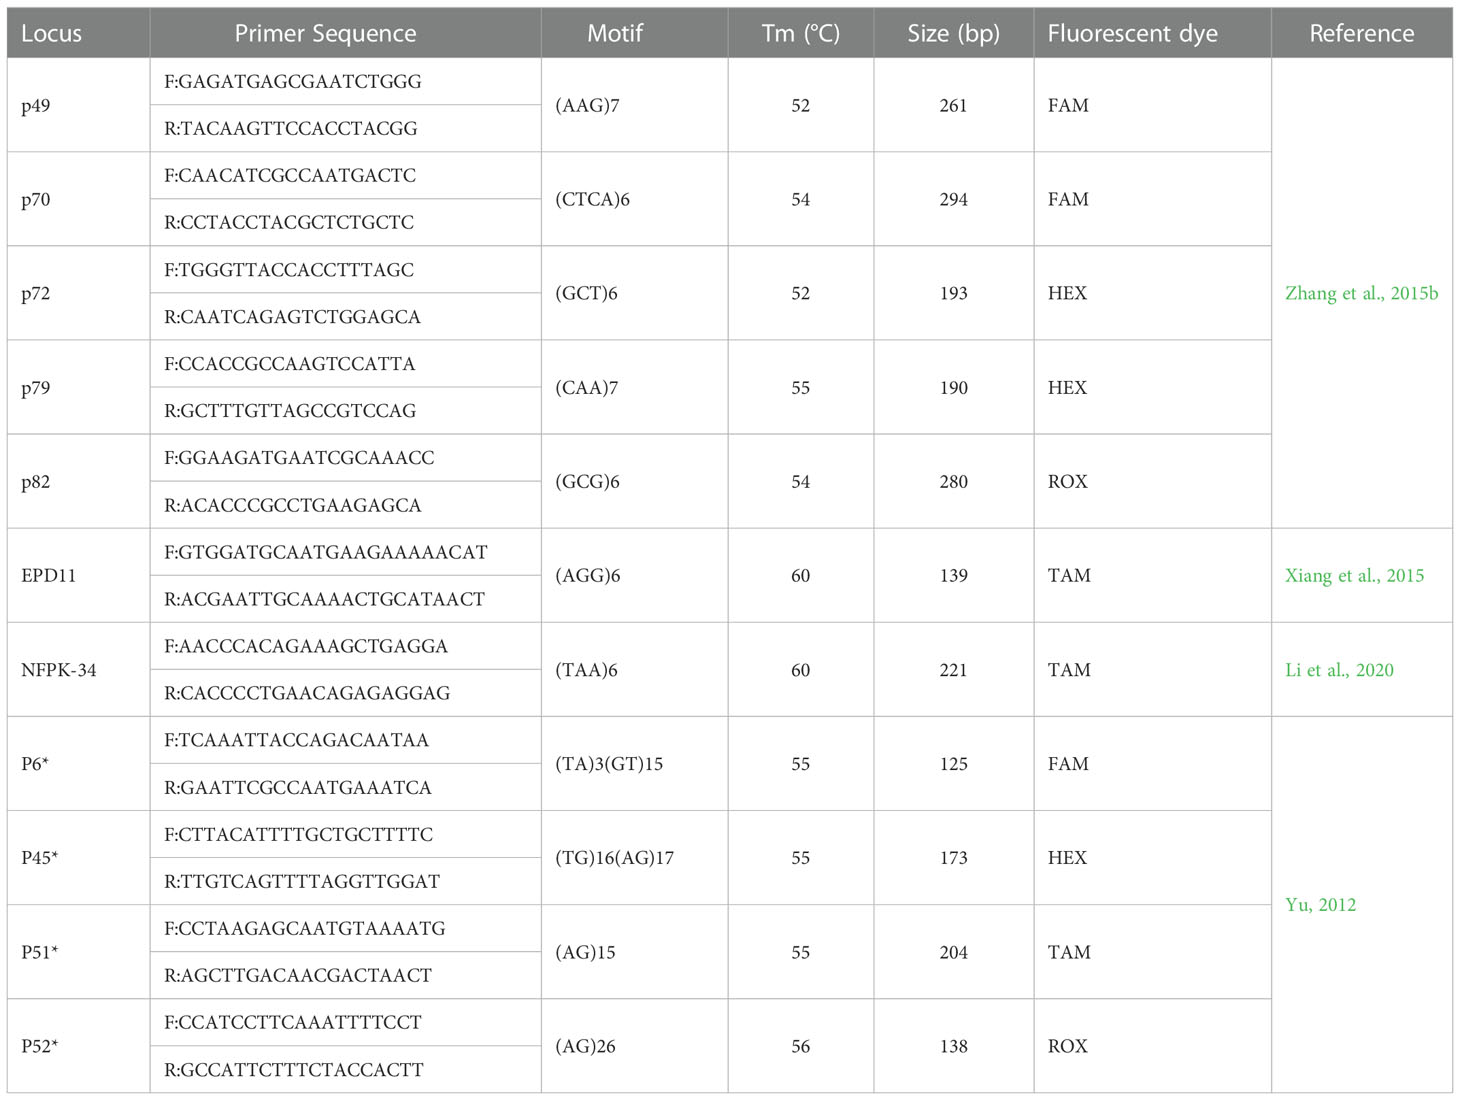
Table 2 SSR primer information of Korean pine.
The PCR products were then detected by 7% PAGE, and 11 SSR markers with good reproducibility and significant polymorphism were selected finally. Forward primer of each marker was labelled at the 5’ end with fluorescent dye HEX, 6-FAM, ROX, or TAM. PCR was performed under light-protected conditions with the same reaction system as above. All PCR products were sent to Sangon Biotech (Shanghai) Co., Ltd., Shanghai, China for capillary electrophoresis genotyping by ABI 3730XL (Applied Biosystems, Foster City, CA, USA) and the identification genotype data were collected for subsequent analysis.
The DNA polymorphism information was processed into a data matrix, and the data matrix was converted into various formats by DataFormater 2.7 for further analysis (Wenqiang et al., 2016). Genetic parameters such as number of alleles (Na), number of effective alleles (Ne), Shannon diversity index (I), observed heterozygosity (Ho) and expected heterozygosity (He) of each primer was calculated using Popgen 32 (Li et al., 2003), primer polymorphism information content (PIC) was calculated using PowerMarker V3.25 (Liu and Muse, 2005), and primer identity probabilities (PI) and random identity probabilities (PIsibs) were calculated using GenAIEX 6.51b2 (Peakall and Smouse, 2006). Significant deviations from both the Hardy-Weinberg equilibrium (HWE) and linkage disequilibrium (LD) between all pairs of SSR loci were identified by Genepop v4.2 (Raymond and Rousset, 1995).
GenAIEX 6.51b2 was used to calculate the number of alleles (Na), Shannon diversity index (I), number of effective alleles (Ne), number of more than 5% alleles (Na, F>5), observed heterozygosity (Ho), expected heterozygosity (He), unbiased expected heterozygosity (uHe), F-fixed index (F), and number of private loci (NPA) for each population (Peakall and Smouse, 2006). MANOVA, principal coordinates analysis (PCoA) and generation of interpopulation genetic differentiation coefficient (Fst) and gene flow (Nm) matrices were performed using GenAIEX 6.51b2 to delineate genetic variation between and within populations (Peakall and Smouse, 2006). Genetic distance matrix of clones clustering maps was generated by NtSys 2.10e and used for constructing a neighbor-joining dendrogram in MEGA 11 (Tohme et al., 1996; Tamura et al., 2011). Neighbor-joining dendrogram between populations was also constructed in MEGA 11 based on Nei genetic distance (Tamura et al., 2011).
Based on the latitude and longitude of the source location of superior tree, the geographical distance between the source locations of superior tree was calculated by the following formula:
R is the radii of the earth (6371.0 km);
X1, X2, Y1, Y2 are two location coordinates radians;
Radians= coordinates * Π/180;
SPSS v19.0 software was used to detect the correlation between geographic distance and genetic distance among the 6 superior tree sources.
The genetic structure was investigated in software STRUCTURE v2.3.4 using an admixed model with 100,000 burn-ins followed by 100,000 iterations (Ravelombola et al., 2018). Markov Chain Monte Carlo iterations run 10 times of a number (K = 2-18) of genetically homogeneous clusters. The operation results were imported into the Structure Harvester website (https://taylor0.biology.ucla.edu/structureHarvester/) (Earl and vonHoldt, 2012), and the optimal K values were selected according to the method of Evanno et al. (Evanno et al., 2005).
The fingerprint map of 161 clones was generated by combining the 11 pairs of SSR primers obtained from screening, sorting them in order from smallest to largest according to the size of the target fragment. The clone genotypes were coded using letters and arranged in a certain order to obtain the clone gene code. The name, scientific name and location of the clone, the source of the superior tree and the fingerprint code were organized into a separate Excel and uploaded to the online platform (https://cli.im/) to obtain the corresponding QR code for each clone (Li et al., 2022).
There were 55 combinations of loci in the whole population, of which 4 pairs (7.27%) had LD between loci combinations at the significance level of P<0.001. The results of primer genetic analysis (Table 3) showed that a total of 75 alleles were detected at the 11 SSR loci, of which 33.004 were effective alleles, with the mean value of major allele frequency was 0.622. 186 genotypes were identified, with an average of 16.909 genotypes per marker, and the observed heterozygosity and expected heterozygosity on average were 0.451 and 0.514, respectively. The mean values of Shannon diversity index and Nei diversity index were 1.094 and 0.512, respectively, indicating the high genetic diversity among clones. The polymorphism information content (PIC) of 11 markers ranged from 0.155 to 0.855, among which 10 markers showed moderate or high polymorphism relatively. All markers can effectively analyze the genetic structure and genetic diversity of Korean pine clones.
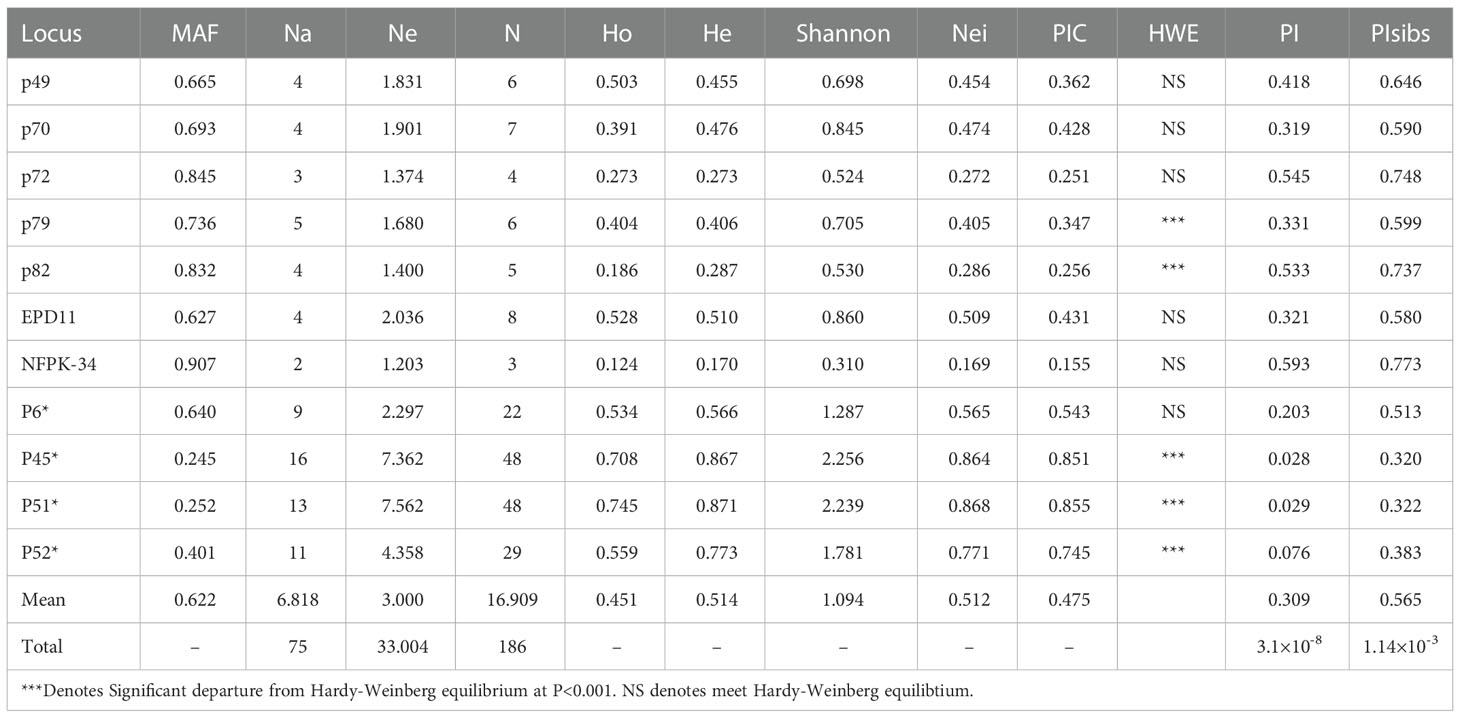
Table 3 Genetic diversity parameters of 11 SSR marker.
Two key statistical values, PI and PIsibs, were calculated to assess the ability to identify 11 markers for Korean pine clones (Table 3). PI for each molecular marker ranged from 0.028-0.593 with a mean value of 0.393. PIsibs is often defined as the upper PI limit, and the PIsibs of the 11 SSR markers ranged from 0.320-0.773 with a mean value of 0.565. The cumulative probability of identity of markers according to the obtained data (Figure 1), PI tended to 0 when the number of marker combinations is 7 and PIsibs tended to 0 when the number of marker combinations is 11. Assuming that all marker loci are independent of each other, the probability of two random Korean pine clones having the exact same multi-locus genotype combination among all 11 molecular markers is estimated to be 3.1×10⁻⁸, and the combined PIsibs was 1.14×10⁻³. 161 Korean pine clones could be considered to be completely distinguished by the 11 SSR markers. The above results prove that the combination of these markers not only had high polymorphism but also showed a strong potential for fingerprint recognition.
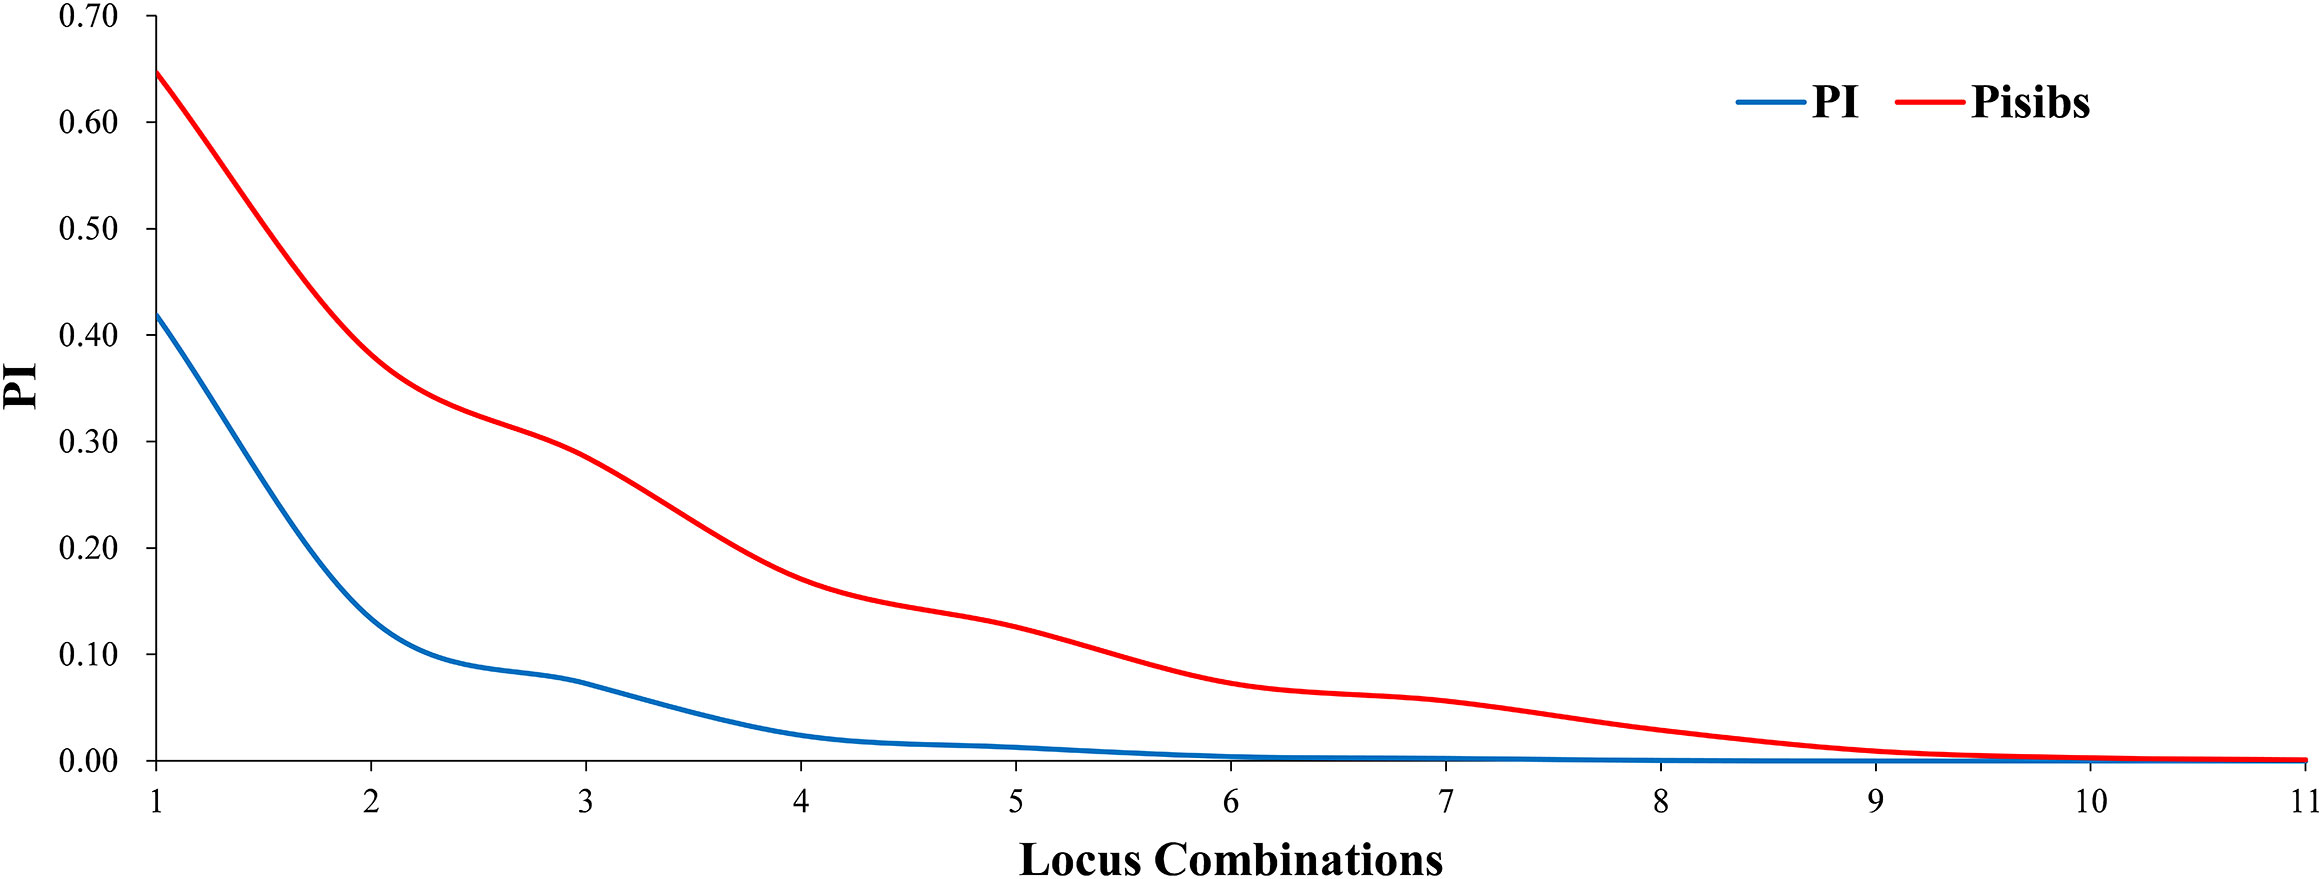
Figure 1 Identification ability of SSR markers in Korean pine clones.
MANOVA was performed to determine variate characteristics of the 7 populations, and the results showed that (Table 4): population genetic differentiation coefficient (Fst) was 0.044 (P< 0.001), indicating a low level of genetic differentiation among populations. Genetic variation existed mainly within populations, accounting for 98% of the total variation, and the incidence of genetic variation among populations was only 2%. All of which indicated that there were extensive exchanges of genetic resources within each population. The level of genetic differentiation between populations was low, while the genetic variation within populations was much higher than that between populations. The inbreeding coefficient (Fis) was 0.078 (Fis > 0), indicating the presence of homozygous excess and the presence of interpopulation inbreeding.
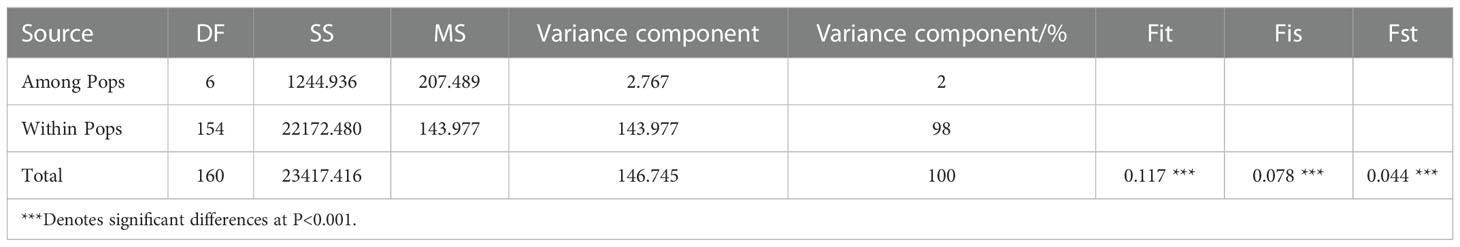
Table 4 MANOVA for the population of Korean pine clones.
Fst and Nm between two populations were calculated for seven populations to reveal genetic differences and gene flow among different populations of Korean pine clones. The results showed that (Figure 2): the Fst ranged from 0.012-0.047 with an average of 0.025, and the Nm ranged from 5.013-19.750 with an average of 11.036 among different populations, indicating that the genetic differentiation range among populations was small and there was a high frequency of genetic exchange. The highest Fst and the lowest Nm were found between the Lushuihe and Weihe, which may be due to the long geographical distance between Lushuihe and Hebei, the superior tree source of these two populations (Figure 3).
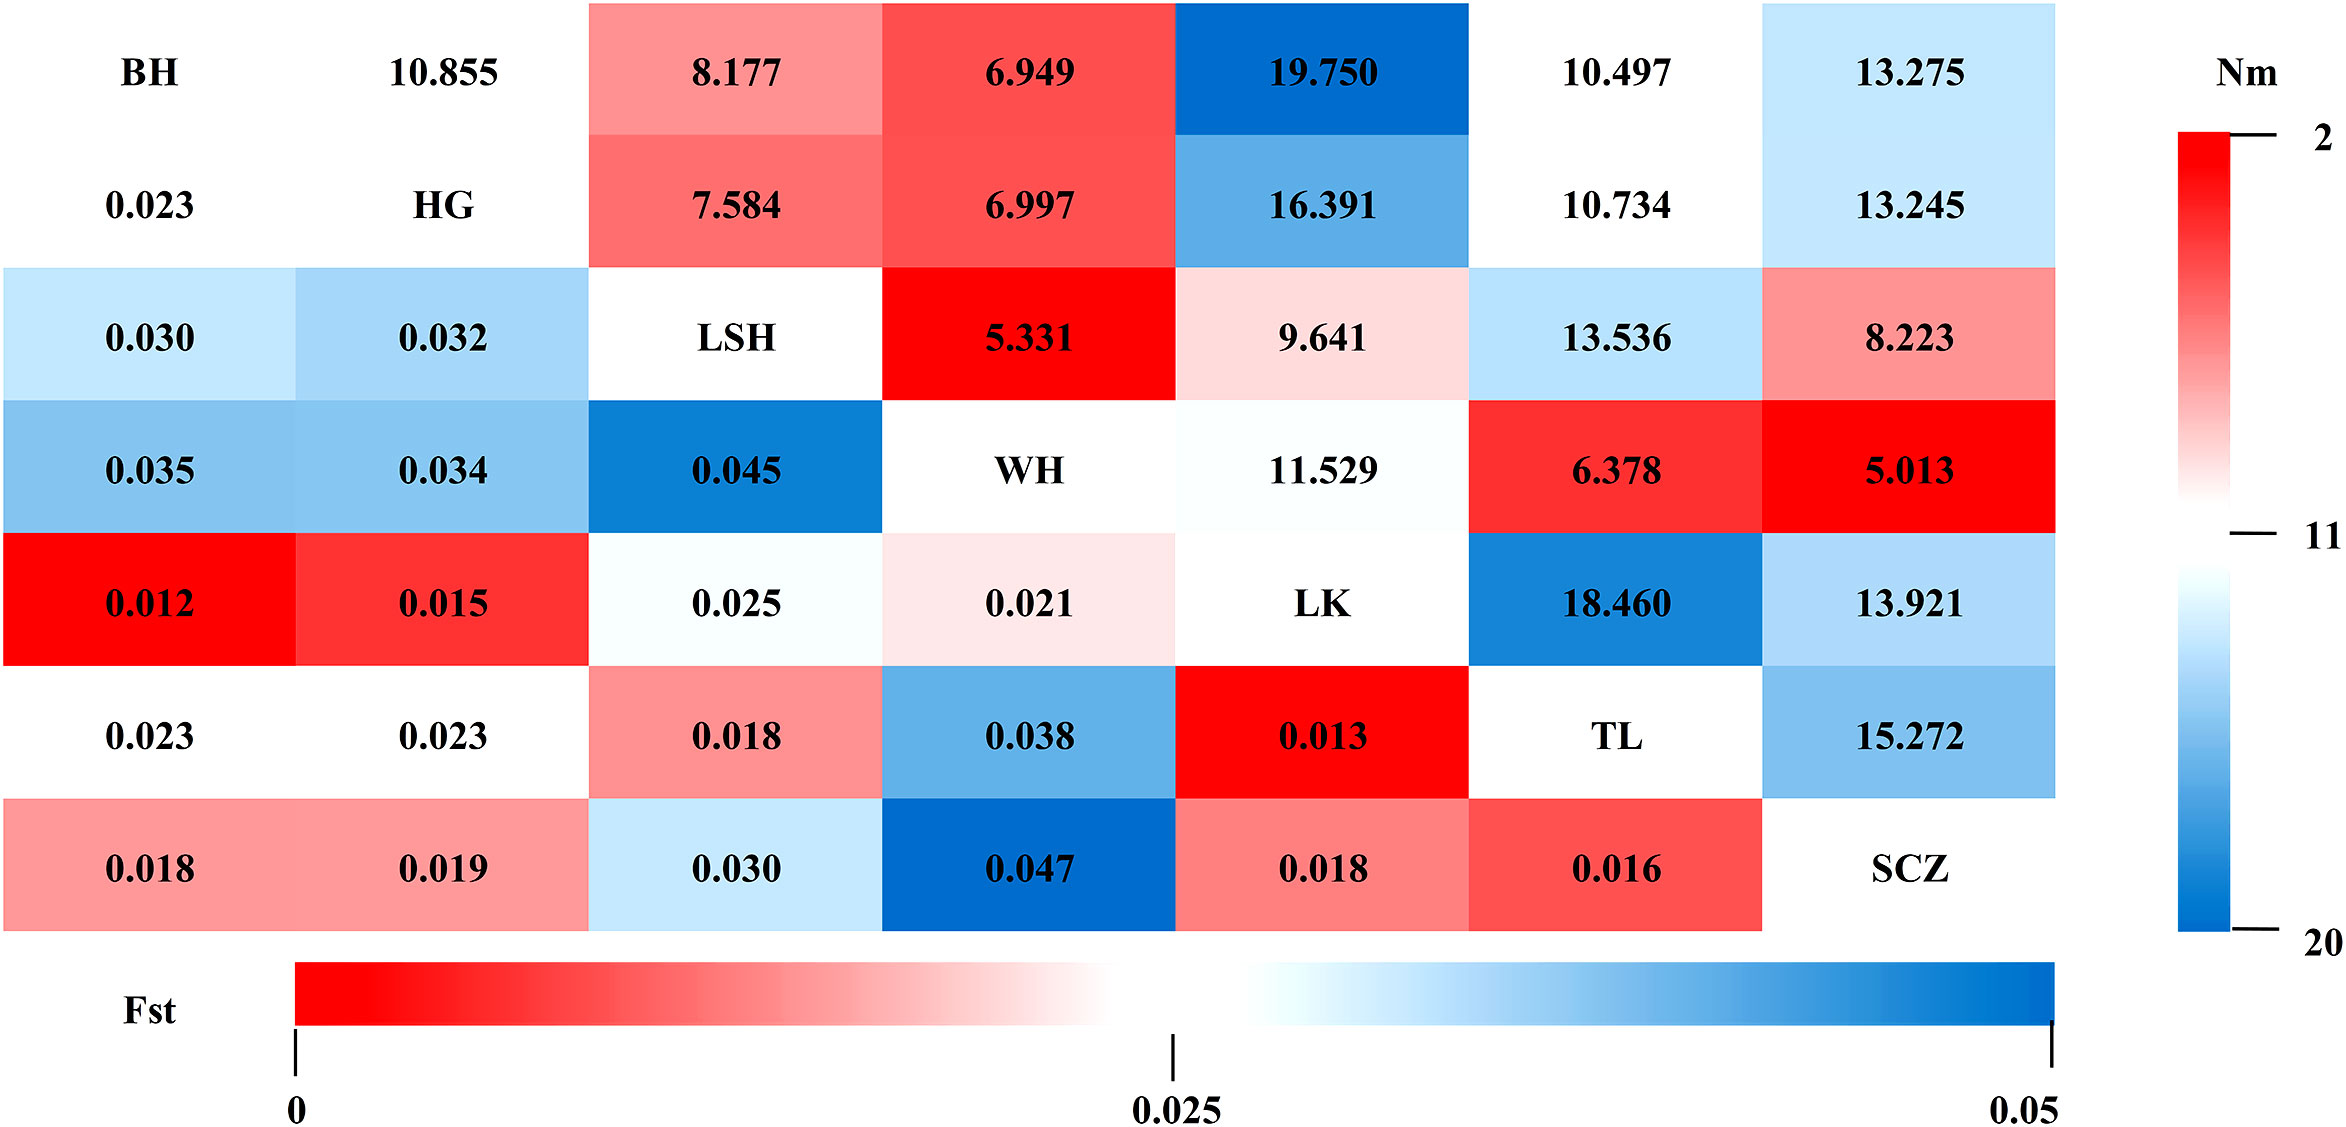
Figure 2 Genetic differentiation coefficients (lower left) and gene flow (upper right) between populations. (BH, Bohai; HG, Hegang; LSH, Lushuihe; WH, Weihe; LK, Linkou; TL, Tieli; SCZ, Sanchazi).
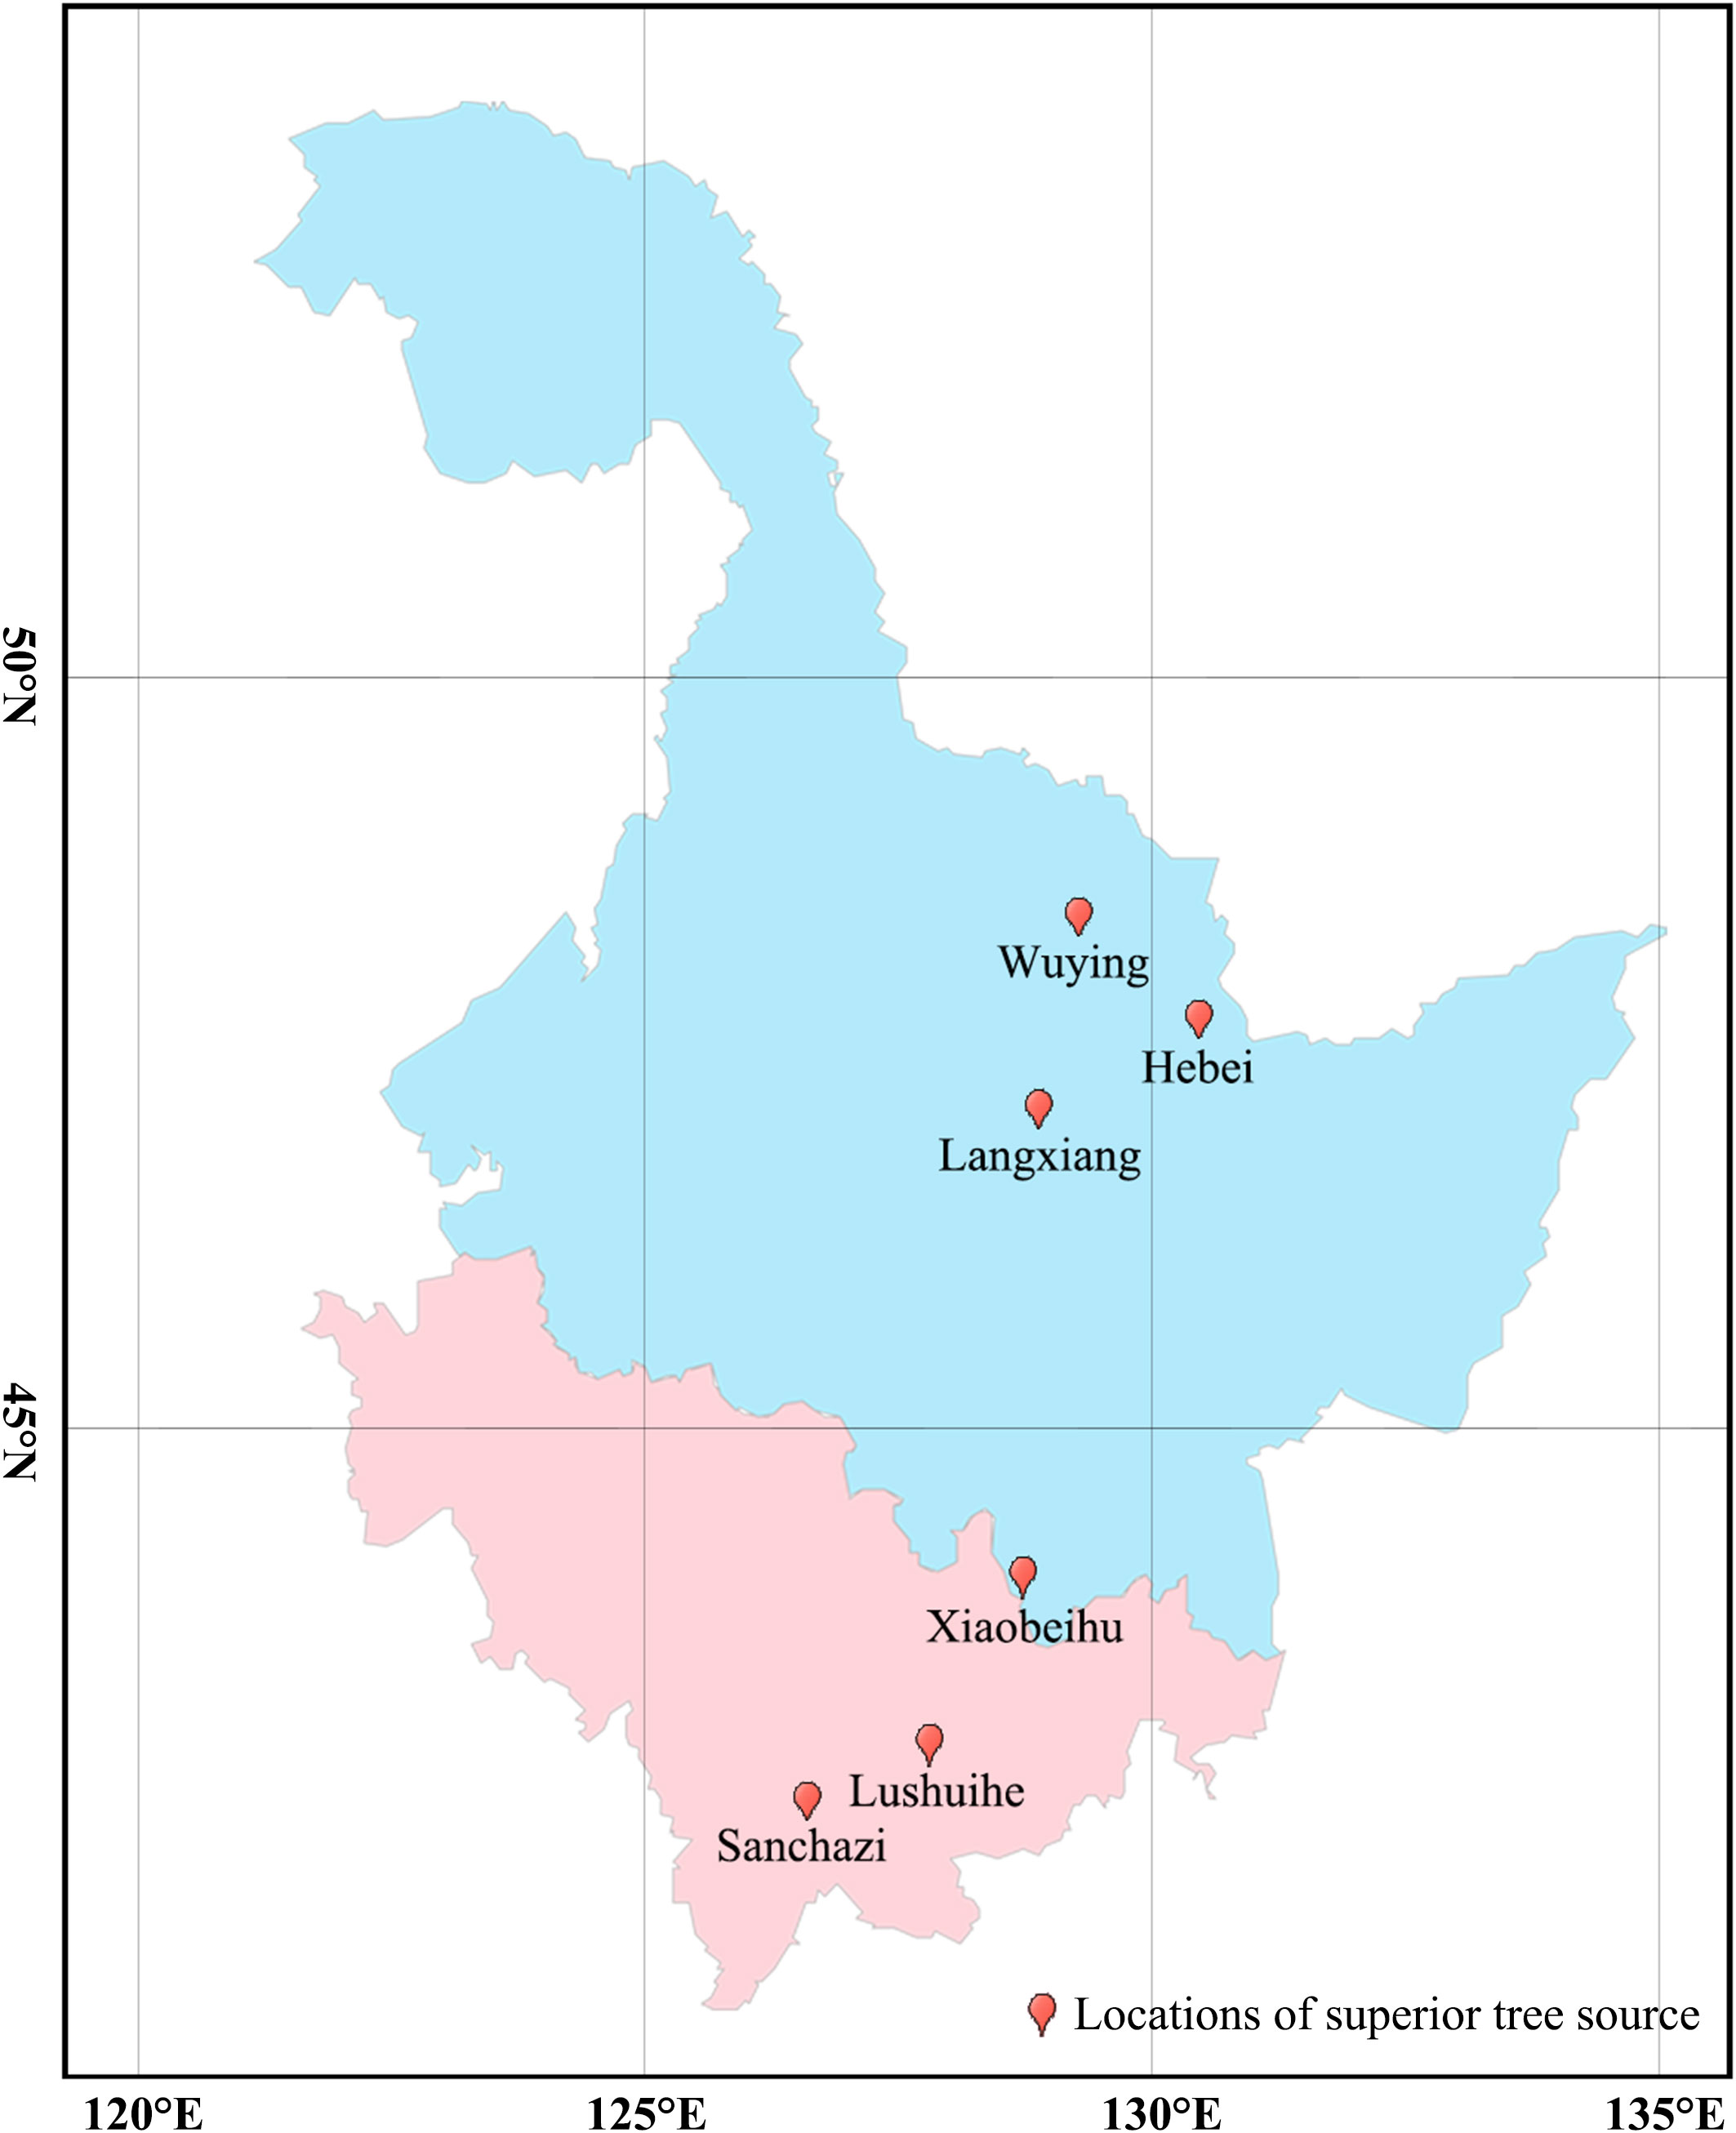
Figure 3 Geographical distribution of superior tree source of Korean pine populations. (Light blue indicates Heilongjiang Province and light purple indicates Jilin Province. The geographic conditions for each site can be found in Table 1).
To assess genetic diversity and genetic differentiation of these 7 populations, genetic diversity analysis was performed and results showed that (Table 5): the level of genetic differentiation within 7 populations did not vary significantly, with Tieli population having the highest genetic diversity and the highest number of alleles, Shannon diversity index, observed heterozygosity at 55, 1.087, 0.479 respectively. the lowest Shannon diversity index and observed heterozygosity was in Lushuihe population with 0.915, 0.473 respectively.
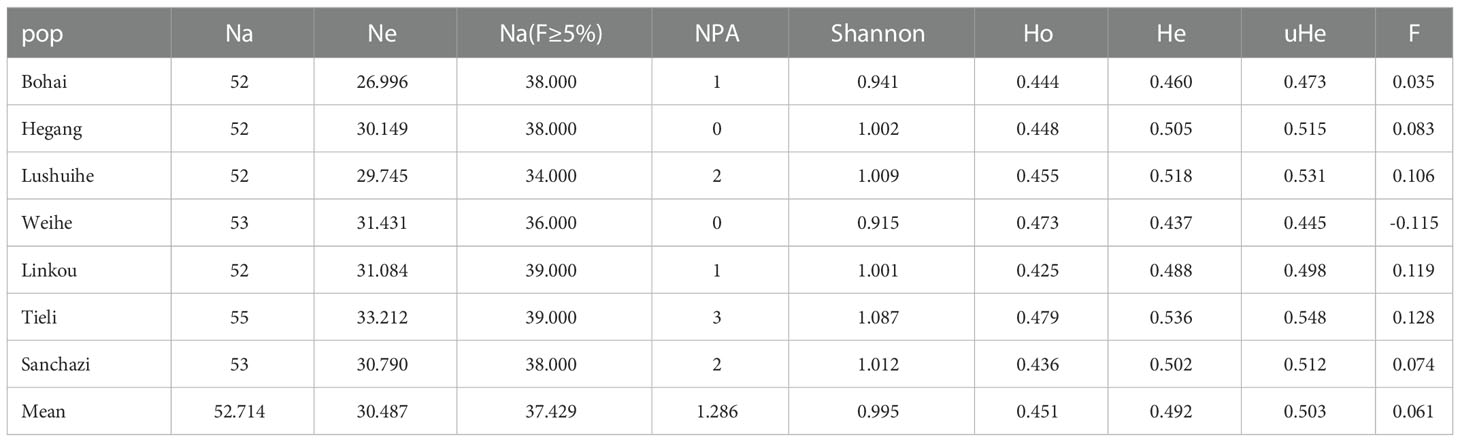
Table 5 Genetic parameters of 7 Korean pine populations.
The fixation index (F) ranged from -0.115 (Weihe) to 0.128 (Tieli), with an average of 0.061. F>0 indicates heterozygote deficiency, over-purity and inbreeding in Korean pine populations. Overall, the Tieli population showed high genetic diversity, while the Weihe population showed relatively lower genetic diversity, and no inbreeding was detected in this population.
The results of principal coordinate analysis (PCoA) of Korean pine clones from 7 populations showed that Coordinates 1 explained 9.93% of the variation and Coordinates 2 explained 7.45% of the variation, indicating that each of the above molecular markers has a high degree of independence. There is a high degree of distribution overlap among populations in the figure, with the Lushuihe population having an extensive distribution and some clones showing relative independence, while the other populations are relatively clustered, with the Linkou population being more dispersed. There is some genetic divergence between the Weihe population and the Tieli population, and the distribution range of Weihe is the smallest, indicating that the genetic diversity of clones within the Weihe population is low (Figure 4), which is similar to the results of the Shannon diversity index in Table 5.
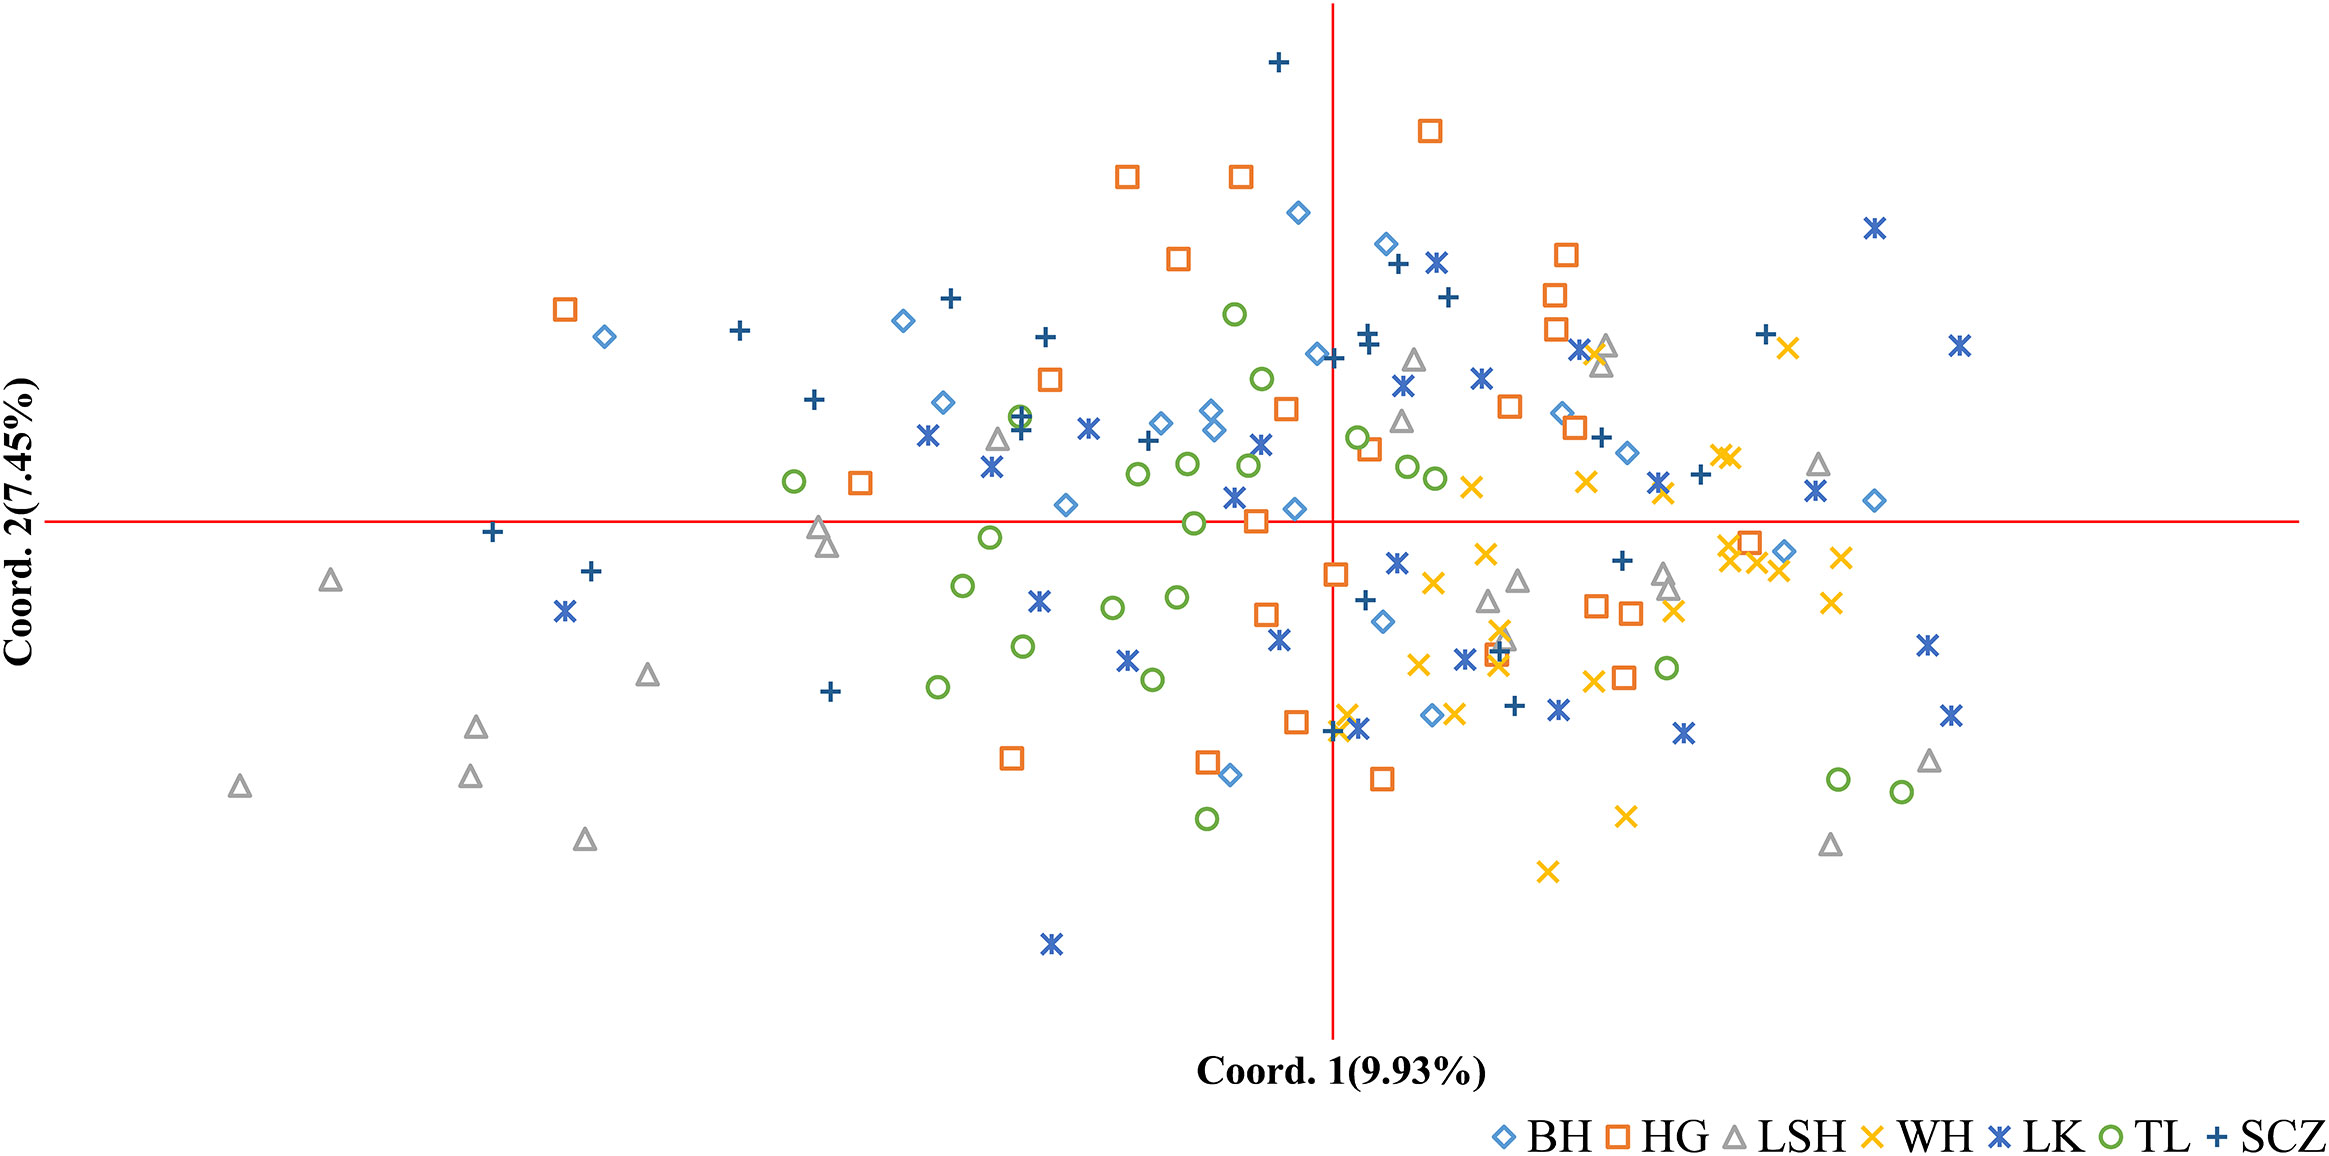
Figure 4 Principal coordinates analysis (PCoA) of Korean pine clones. (BH, Bohai; HG, Hegang; LSH, Lushuihe; WH, Weihe; LK, Linkou; TL, Tieli; SCZ, Sanchazi).
The results of cluster analysis among populations by the Nei genetic distance matrix showed (Figure 5A): The genetic distance among populations was small and the level of genetic differentiation was low, which was consistent with the results of MANOVA. The genetic distance between Bohai and Hegang, Lushuihe and Linkou was similar respectively, but the genetic distance of Weihe was far from Sanchazi. Lushuihe and Sanchazi were more independent, which was similar to the results of PCoA. However, it is worth noting that Hegang and Linkou have the same source location of superior tree, but they do not have the closest genetic relationship with each other. The correlation analysis between Nei genetic distance and geographic distance revealed that the Person coefficient was 0.075 (P=0.704), indicating the insignificant correlation between genetic distance and geographic distance of their superior tree sources.
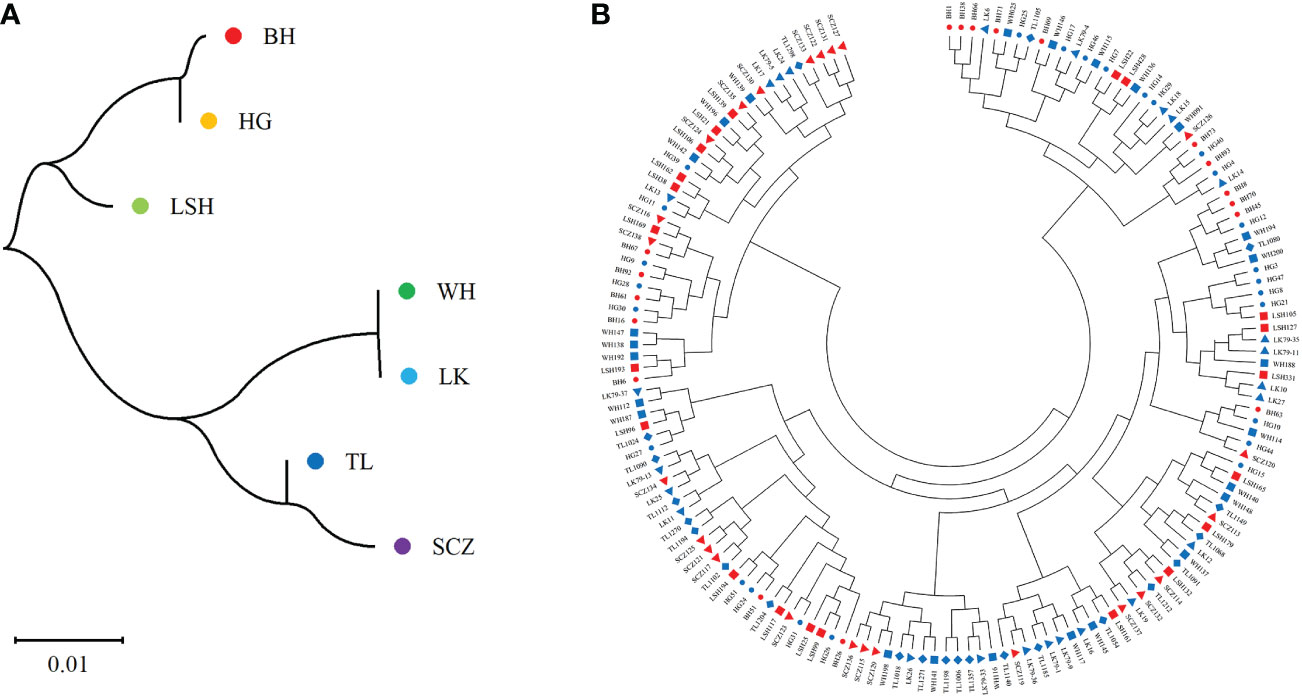
Figure 5 Neighbor-joining tree of populations and clones. (A) Neighbor-joining tree of 7 populations. (B) Neighbor-joining tree of 161Korean pine clons. (BH, Bohai; HG, Hegang; LSH, Lushuihe; WH, Weihe; LK, Linkou; TL, Tieli; SCZ, Sanchazi).
The genetic distances of 161 clones were calculated by NTsys 2.10e software, and the results of clustering using MEGA showed that (Figure 5B): the clones from different sources were not clearly separated from each other, and the clones in each cluster did not come from the same location or the same superior source. The clones from different places were dispersed in each cluster. Clustering results did not correlate significantly with the location of the clones. The above results indicate that there is a high degree of gene exchange among populations and little genetic differentiation among populations. However, clones from Changbai Mountain are highly distributed on the left side of the clustering map, while clones from Xiaoxinganling are highly distributed on the right side and the lower part of the clustering map in general. Similar to the results of the principal coordinate analysis, although the populations were not clearly divided, the clones of different populations had corresponding distribution ranges. For example, clones from Weihe had a small and relatively concentrated distribution range, which was consistent with the results of analysis of population diversity and the principal coordinate analysis, indicating that the genetic relationships among populations were similar and reflecting the degree of genetic differentiation within populations.
Structure analysis was performed on all the reference materials. ΔK had a maximum value when K=4 and 7 in K=2-18 (Figures 6A, B), indicating that the 161 clones could be divided into 4 classes or 7 classes. The populations were not clearly differentiated and no individuals had 100% population affiliation in both cases (Figures 6C, D). However, the Lushuihe partial clones had a significantly high probability of occurrence in a certain population, indicating that the Lushuihe population partial clones had relative genetic independence, which was similar to the results of PCoA.
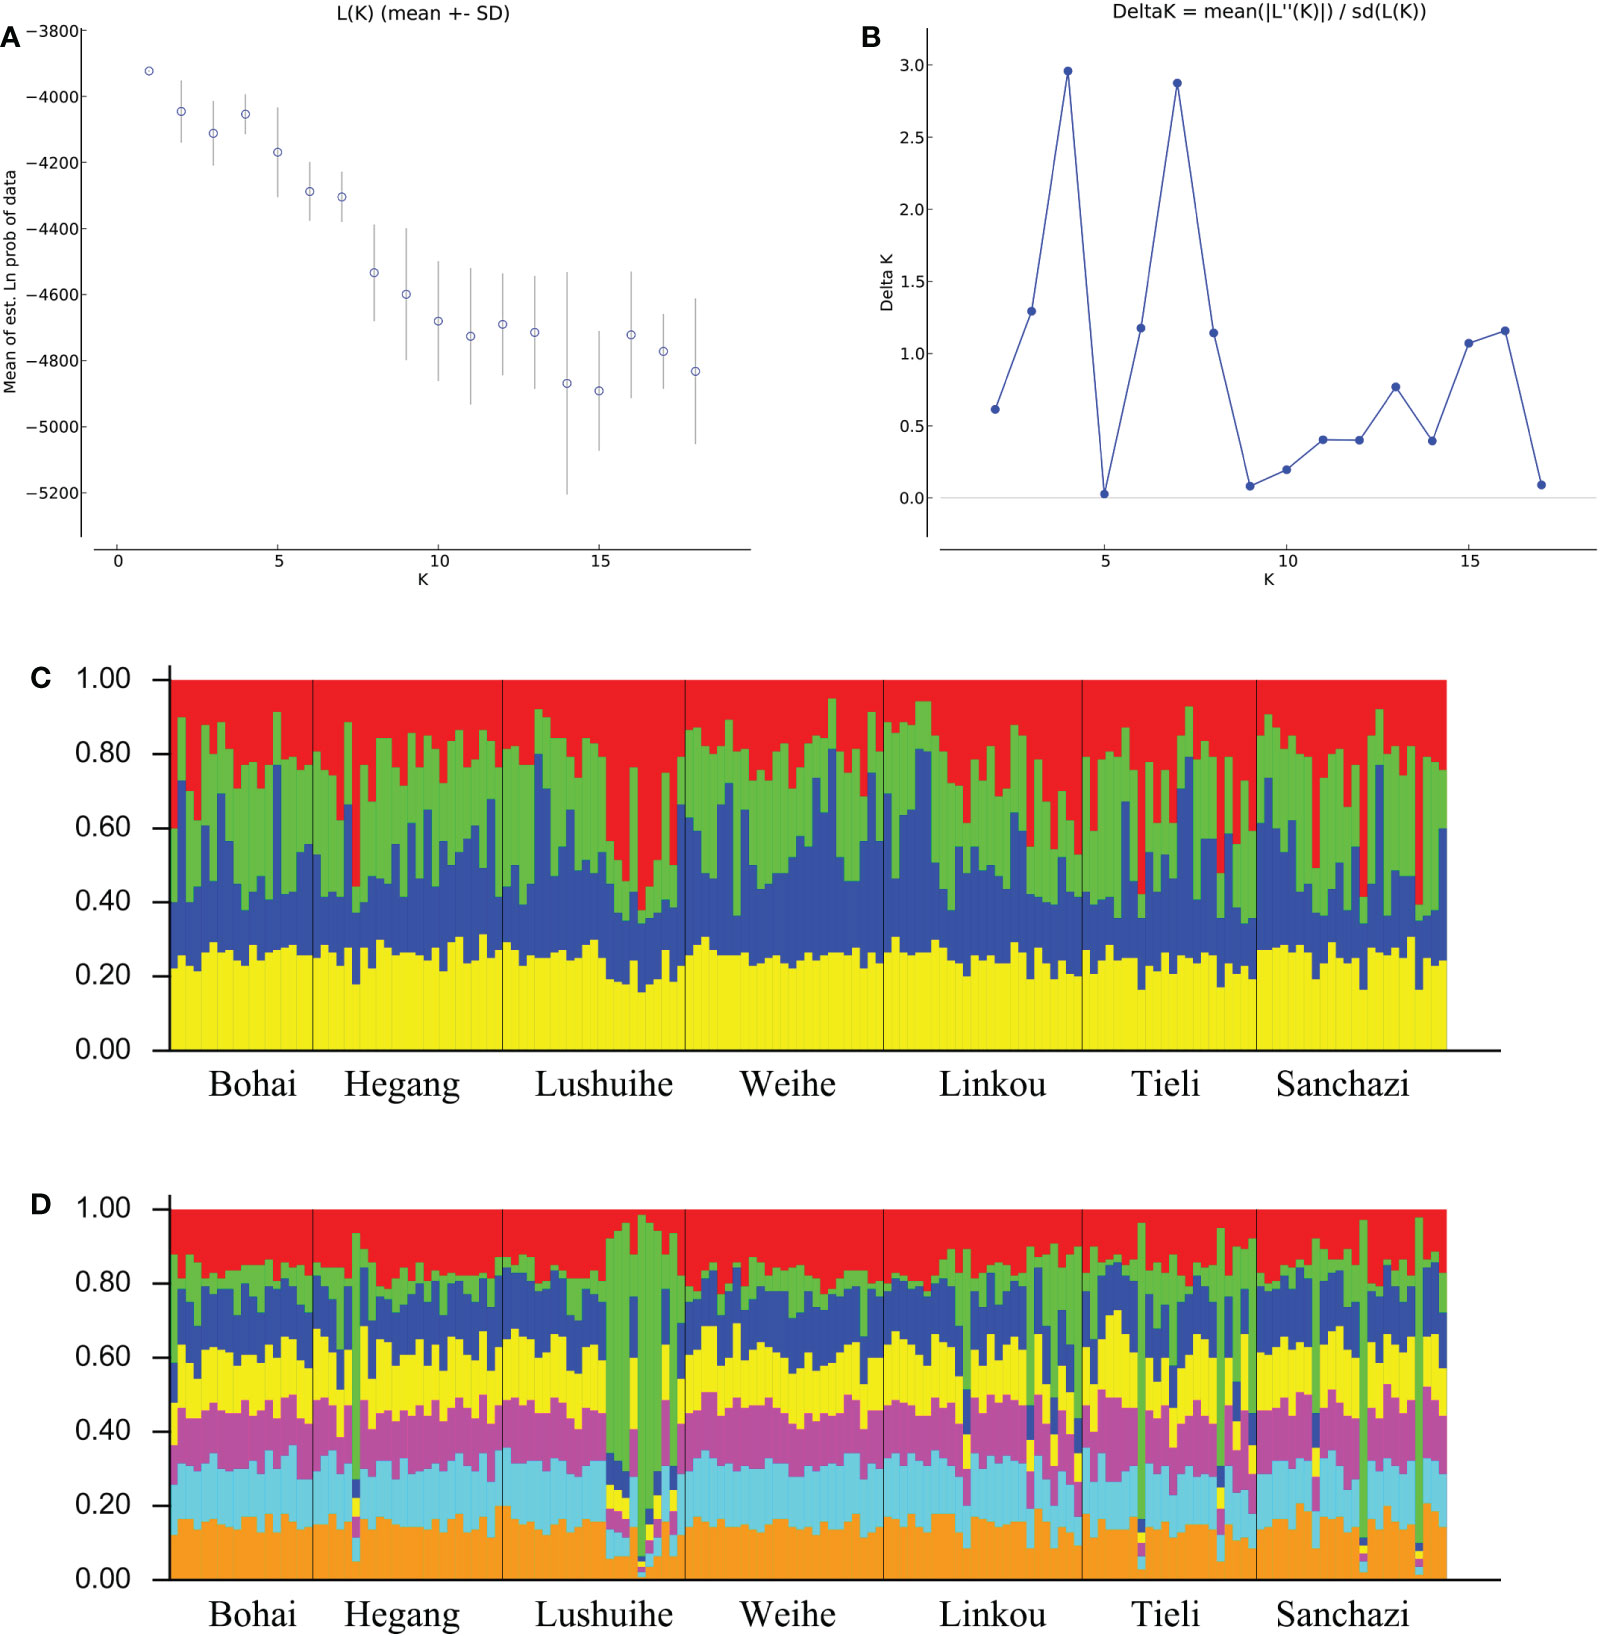
Figure 6 STRUCTURE analysis of Korean pine population. (A) Calculation of population structure using Mean LnP (K). (B) Relations between the optional number of cluster K and Delta K(C) Genetic structure map of 7 populations of Korean pine based on STRUCTURE analysis (K = 4). (D) Genetic structure map of 7 populations of Korean pine based on STRUCTURE analysis (K = 7).
Based on the genotyping data detected by 11 SSR markers, multiple locus matching analysis was performed in GenAlex 6.51 for 161 Korean pine clones. There is no identical genotype detected in two varieties, indicating that each of the 161 clones had its own unique SSR multi-locus genotype combination. The molecular markers were sorted according to the order of the target fragments from smallest to largest, and each marker consisted of two alleles. The molecular fingerprints of all 161 clones were generated according to the blocks with different color marking the different genotypes under each marker (Figure 7), with each color representing a variant locus information and each clone having a unique color block combination.
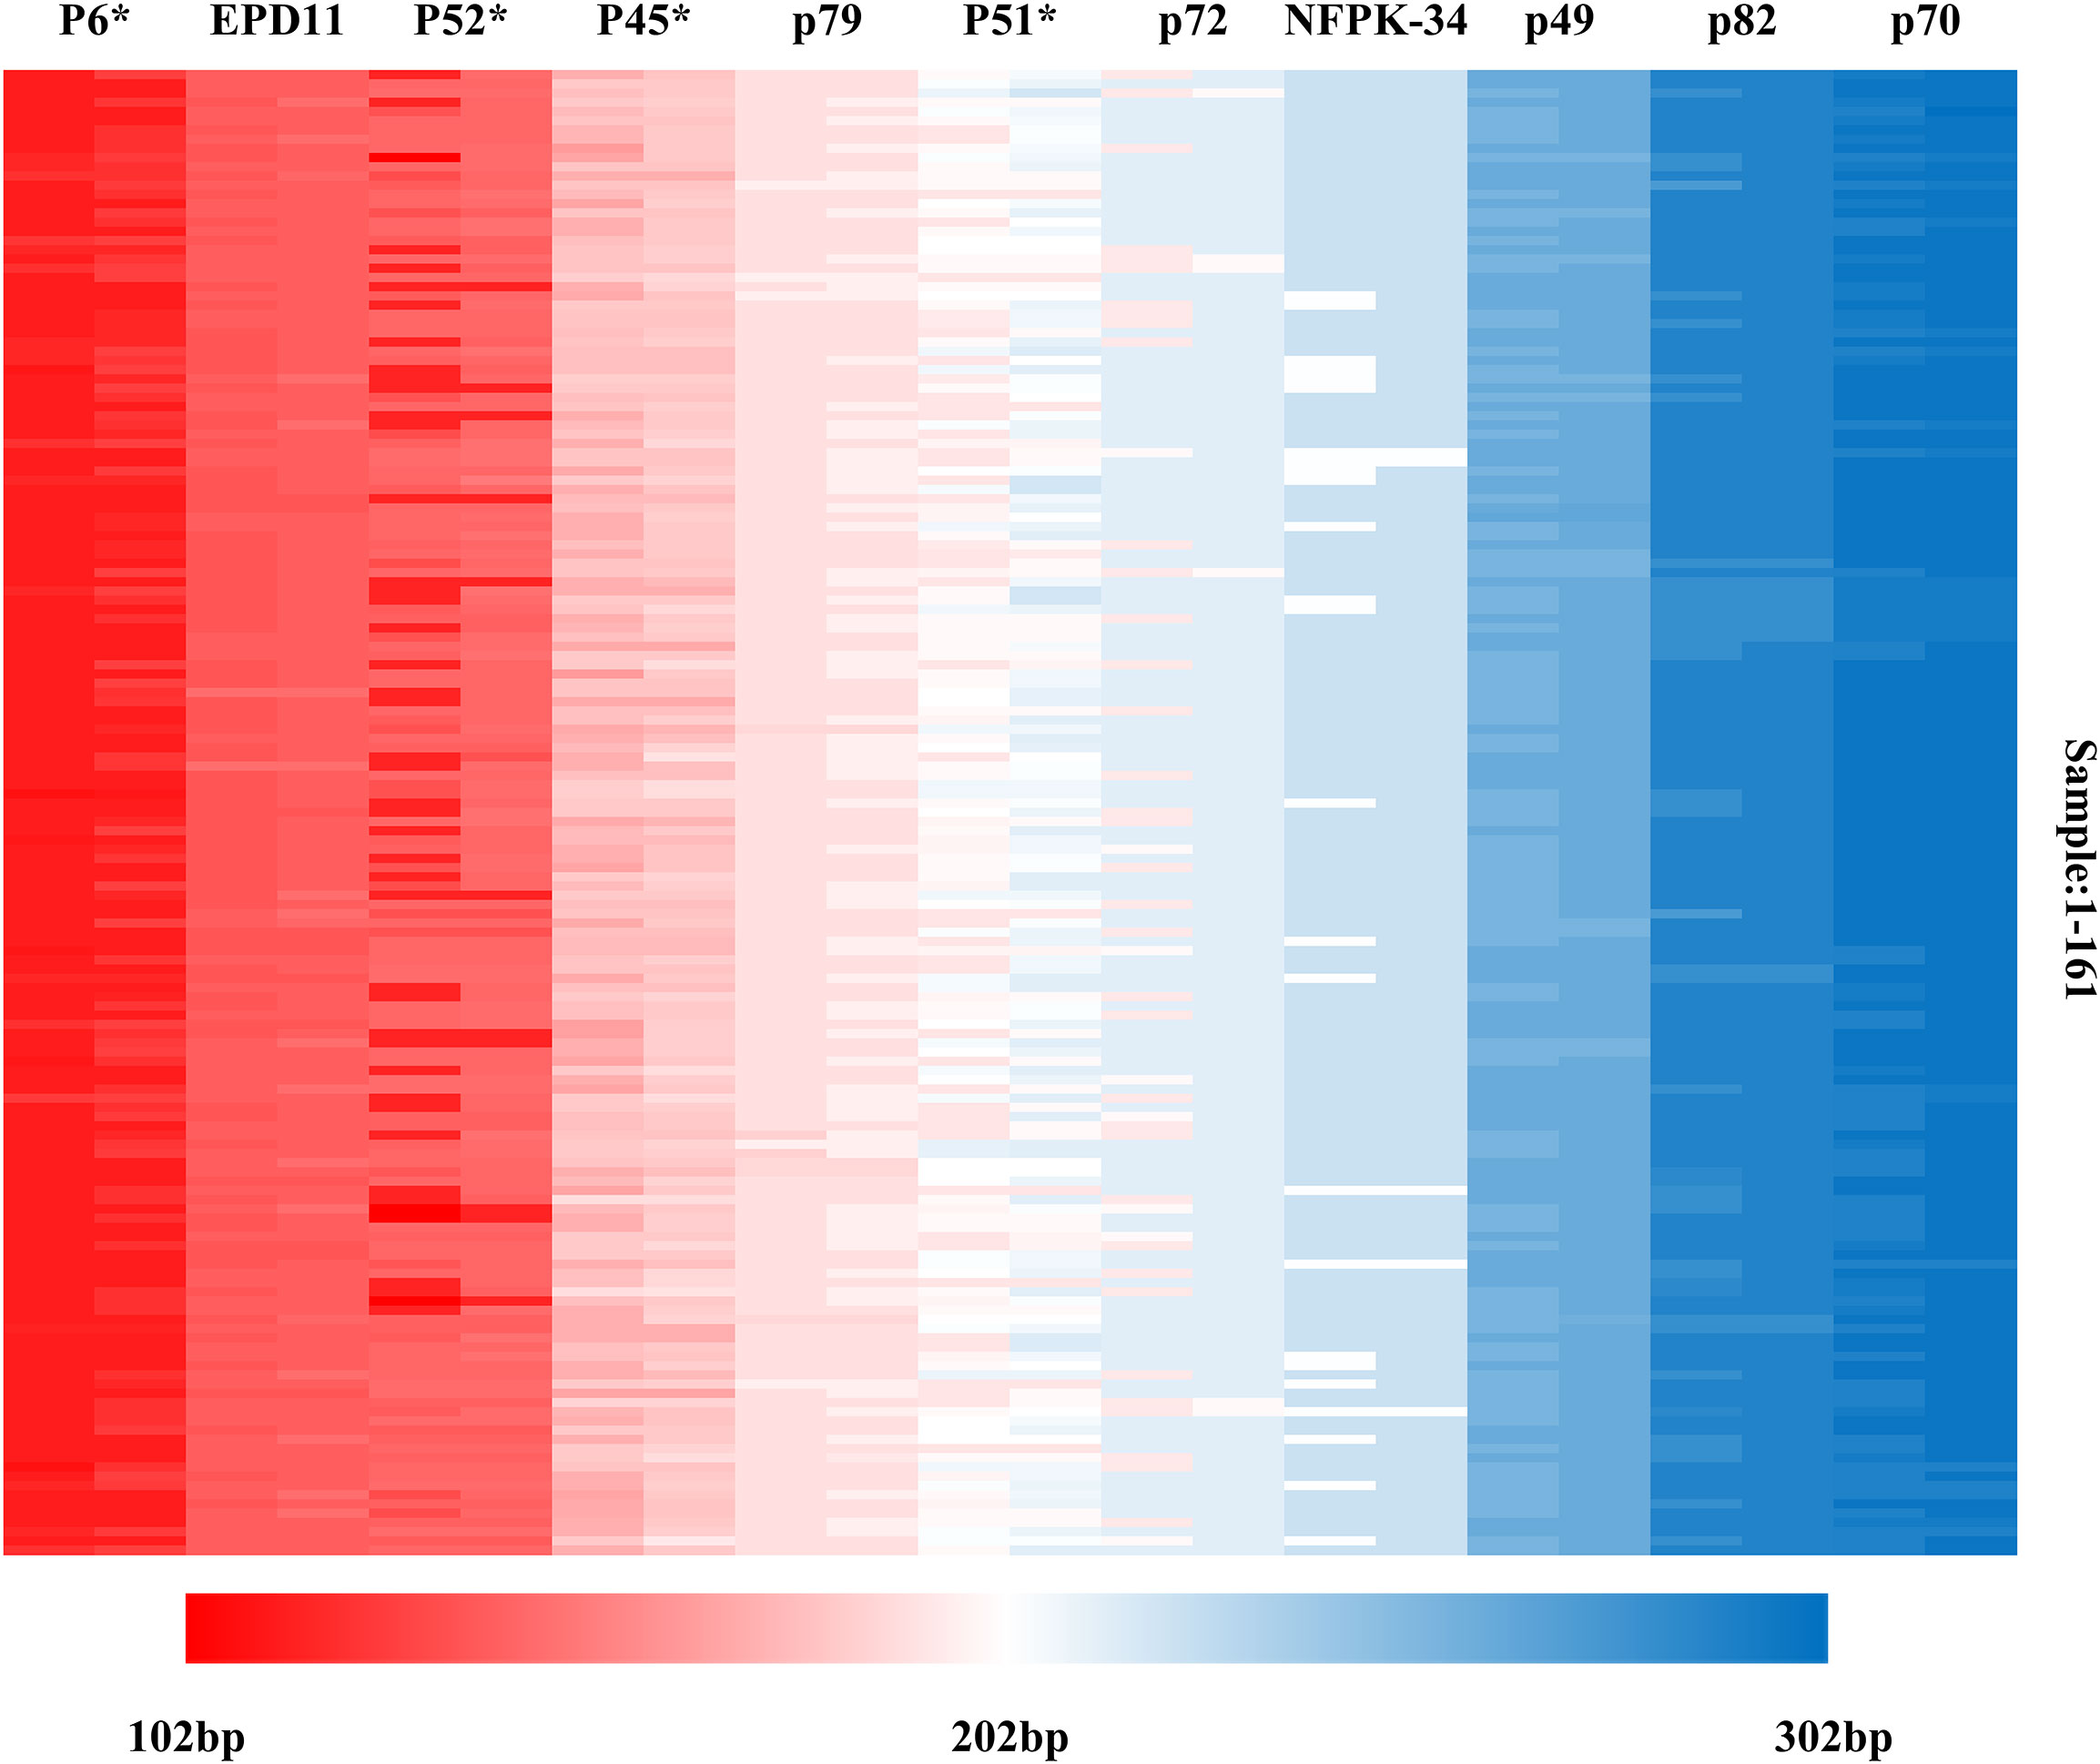
Figure 7 Molecular fingerprinting of Korean pine clones. (The different color blocks represent the corresponding allele fragment sizes).
The genotyping data of each marker are indicated by letters respectively, and sorted in the order of amplified fragments from smallest to largest, and each clone gets its corresponding 22-digit letter code (Supplementary Table S1).
The name, location, source and genotyping data of each clone were uploaded to the QR code generation platform (https://cli.im/batch) to generate a unique QR code for each clone, which can be scanned to obtain specific information of the clone (Supplementary Figure S1).
The genetic diversity of a population determines whether a population can adapt to a complex environment, and the higher the genetic diversity, the more adaptable the population is to different environments and the more resistant it is to shocks arising from environmental changes (Wachowiak et al., 2011). In order to develop a reasonable and effective breeding strategy, accelerate the process of genetic improvements of Korean pine, it is important to analyze the genetic diversity of Korean pine clone resources and evaluate the genetic structure of seed orchards by using SSR molecular marker. SSR markers have the advantages of codominance, stable amplification and good repeatability, which is a common method for genetic diversity analysis (Hao et al., 2017); at the same time, SSR molecular markers have strong specificity, clear bands and accurate data, which is suitable for the construction of fingerprint profile for a large number of resources (Park et al., 2009). Initially, we screened 11 Korean pine SSR loci, and the average values of Na and He for the 11 loci were 6.818, 0.514. PIC is an important parameter for expressing the degree of genetic diversity among plants, and its evaluation is beneficial to the establishment of plant gene pools and the acceleration of the breeding process (Avval, 2017). The average PIC of the SSR loci screened in this study was 0.475, showing moderate polymorphism (Botstein et al., 1980). Therefore, it is suitable for the genetic diversity evaluation of Korean pine breeding resources. The LD between 4 pairs of loci reached a significant level of P<0.001, but was not concentrated at one locus, and the results of PCoA showed that the molecular markers were highly independent, indicating that the screened loci were evenly distributed in the Korean pine genome and relatively independent in the process of transmission from generation to generation.
In order to elucidate the genetic variation among Korean pine populations, molecular variation analysis was conducted. The results showed that the genetic variation of Korean pine mainly originated from inter-individuals, accounting for 98%, and interpopulation variation accounted for only 2%. This indicates that the genetic differentiation within populations is much greater than between populations, which is consistent with the results of Feng et al. (Feng et al., 2006). The result is consistent with higher genetic diversity within populations and higher gene flow between populations. Therefore, we should pay attention to the selection of individuals within the population when the Korean pine population with high genetic diversity was constructed in the later stage, which is beneficial to the genetic improvement of Korean pine. The genetic diversity analysis of 7 populations revealed the differences in the level of genetic diversity among different populations, Tieli has the highest level of genetic diversity (I=1.087), the genetic diversity of Weihe population was low (I=0.915). Nevertheless, Weihe population is the only one with a fixed index (F) less than 0, indicating that the genetic diversity of this population is low, but there is no heterozygosity deficiency or inbreeding. Heterozygosity is often used to measure the degree of genetic variation and can provide useful information for the conservation of species (Schmidt et al., 2021). The results of this study based on SSR molecular markers showed that the overall He and Ho of 7 populations were 0.514 and 0.451. From a biological point of view, Korean pine is a monoecious, cross-pollinated plant that can generate new genotypes through genetic recombination, which is probably the main reason why Korean pine populations maintain a high genetic diversity. The Ho is smaller than He among these populations, except for the Weihe population, which indicating the presence of heterozygote deficiency, this may be due to inbreeding, non-random mating or disruption of population structure (Liao et al., 2019). Therefore, further analysis for the reason of heterozygote deficiency is necessary in future studies.
Genetic structure reveals the distribution patterns of genetic diversity between and within populations, reflects the adaptive potential of various species to their environment (Melo et al., 2014). Seven Korean pine populations in this study can be divided into 4 or 7 classes, and different populations are mismatched in classifications. Lushuihe population shows partial independence relatively, and the corresponding results were obtained by clustering results, which is consistent with the results of the principal coordinate analysis mentioned above. The results of interpopulation differentiation also show that the Lushuihe population has higher genetic differentiation and lower gene flow with other populations, which may be due to the relatively isolated population structure caused by the relatively unique geographical location of Lushuihe. Correlation analysis showed that there was no significant correlation between genetic distance and sources of superior tree’s geographical distance of Korean pine populations, which was also previously reported in Feng et al. (2009).
Screening and identifying the core SSR primer combinations suitable for variety identification is the key to constructing DNA fingerprinting. It is required that the core SSR primer combinations screened and identified have good marker polymorphism, and secondly, it is required that as few markers as possible are used to distinguish as many germplasms as possible. Construction of fingerprint profiles of Korean pine clones provides an important basis for the identification of resources from the 7 seed orchards. The DNA fingerprint profile of Korean pine clones based on SSR primer combinations can be directly used to identify the authenticity of clones in the 7 seed orchards, solving the long-standing problem of Korean pine clone identification. It is important for the selection and breeding of Korean pine clone in these 7 seed orchards. The critical point to ponder, the established fingerprint panel or Korean pine clonal identification was based on 7 seed orchards in northeast China. It does not cover the distribution range of the species which also can be found in Korea, Russia, Mongolia & Japan. Hence, this clonal identification tool developed will solely useful within China (limited to the resources from the 7 seed orchards).
In this study, 11 SSR markers were screened out, which could be used for the construction of fingerprints of Korean pine clones and the evaluation of genetic structure of the population. Genetic analysis of 7 populations of Korean pine using 11 SSR primers revealed the level of genetic diversity and genetic differentiation among and within populations. According to the genetic characteristics of Korean pine clone populations, the development of corresponding breeding strategies can maximize the breeding potential of Korean pine seed orchards and provide a scientific basis for the subsequent development and utilization of Korean pine germplasm. The DNA fingerprints of 161 Korean pine clones were constructed, which is an effective strategy for the identification of Korean pine clone, it will provide strong DNA evidence for identification of variety and superior seed validation.
The original contributions presented in the study are included in the article/Supplementary Material. Further inquiries can be directed to the corresponding author.
Conceptualization: PY and HZ. Methodology: XQ. Validation: KF. Resources: ZX. Writing-original draft preparation: PY. Writing-review and editing: LZ. All authors contributed to the article and approved the submitted version.
This work was supported by the Innovation Project of State Key Laboratory of Tree Genetics and Breeding (Northeast Forestry University) “Research on the Evaluation of Korean Pine Germplasm Resources and Construction Technology of Breeding Population” (2022A02), the Fundamental Research Funds for the Central Universities (2572022AW13) and Heilongjiang Touyan Innovation Team Program.
The authors declare that the research was conducted in the absence of any commercial or financial relationships that could be construed as a potential conflict of interest.
All claims expressed in this article are solely those of the authors and do not necessarily represent those of their affiliated organizations, or those of the publisher, the editors and the reviewers. Any product that may be evaluated in this article, or claim that may be made by its manufacturer, is not guaranteed or endorsed by the publisher.
The Supplementary Material for this article can be found online at: https://www.frontiersin.org/articles/10.3389/fpls.2022.1079571/full#supplementary-material
Afeng, Z. (2005). Establishment of fingerprinting for clones in pinus massoniana with microsatellite markers (Nanjing (Jiangsu province: Nanjing Forestry University). master's thesis.
Agarwal, M., Shrivastava, N., Padh, H. (2008). Advances in molecular marker techniques and their applications in plant sciences. Plant Cell Rep. 27 (4), 617–631. doi: 10.1007/s00299-008-0507-z
An, Z., Xangxuan, W., Jixiang, L. (1992). A study on the pruning technique for seed high yield of Pinus koraiensis in seed orchard. Scientia Silvae Sinicae. 38(04), 349–352.
Avval, S. E. (2017). Assessing polymorphism information content (PIC) using SSR molecular markers on local species of citrullus colocynthis. case study: Iran, sistan-balouchestan province. J. Mol. Biol. Res. 7 (1).
Botstein, D., White, R. L., Skolnick, M., Davis, R. W. (1980). Construction of a genetic linkage map in man using restriction fragment length polymorphisms. Am. J. Hum. Genet. 32 (3), 314–331.
Carletti, G., Cattivelli, L., Vietto, L., Nervo, G. (2021). Multiallelic and multilocus simple sequence repeats (SSRs) to assess the genetic diversity of aSalixspp. germplasm collection. J. Forestry Res. 32 (1), 263–271. doi: 10.1007/s11676-019-00913-0
Dong, W.-L., Wang, R.-N., Yan, X.-H., Niu, C., Gong, L.-L., Li, Z.-H. (2016). Characterization of polymorphic microsatellite markers in Pinus armandii (Pinaceae), an endemic conifer species to China. Appl. Plant Sci. 4 (10). doi: 10.3732/apps.1600072
Dou, J. J., Zhou, R. C., Tang, A. J., Ge, X. J., Wu, W. (2013). Development and characterization of nine microsatellites for an endangered tree, pinus wangii (Pinaceae). Appl. Plant Sci. 1. doi: 10.3732/apps.1200134
Earl, D. A., vonHoldt, B. M. (2012). STRUCTURE HARVESTER: a website and program for visualizing STRUCTURE output and implementing the evanno method. Conserv. Genet. Resour. 4 (2), 359–361. doi: 10.1007/s12686-011-9548-7
Echt, C. S., Saha, S., Deemer, D. L., Nelson, C. D. (2011). Microsatellite DNA in genomic survey sequences and UniGenes of loblolly pine. Tree Genet. Genomes 7 (4), 773–780. doi: 10.1007/s11295-011-0373-7
Eding, H., Crooijmans, R. P. M. A., Groenen, M. A. M., Meuwissen, T. H. E. (2002). Assessing the contribution of breeds to genetic diversity in conservation schemes. Genetics selection Evol. GSE 34 (5), 613–633. doi: 10.1186/1297-9686-34-5-613
Ellegren, H., Galtier, N. (2016). Determinants of genetic diversity. Nat. Rev. Genet. 17 (7), 422–433. doi: 10.1038/nrg.2016.58
Evanno, G., Regnaut, S., Goudet, J. (2005). Detecting the number of clusters of individuals using the software STRUCTURE: A simulation study. Mol. Ecol. 14 (8), 2611–2620. doi: 10.1111/j.1365-294X.2005.02553.x
Feng, F., Chen, M., Zhang, D., Sui, X., Han, S. (2009). Application of SRAP in the genetic diversity of pinus koraiensis of different provenances. Afr. J. Biotechnol. 8 (6), 1000–1008.
Feng, F., Han, S., Wang, H. (2006). Genetic diversity and genetic differentiation of natural pinus koraiensis population. J. Forestry Res. 17 (1), 21–24. doi: 10.1007/s11676-006-0005-5
Feng, F., Wang, F., Liu, T. (2004). The influence factors of the ISSR-PCR experiment system on pinus koraiensis sieb.et zucc. Chin. Bull. Bot. 21 (3), 326–331.
Feng, F. J., Zhao, D., Sun, X. Y., Han, S. J., Xiao-Yana, X. U. (2010). Establishment and optimization of the SSR-PCR reaction system in pinus koraiensis sieb.et zucc. Nonwood For. Res.
Flint-Garcia, S. A. (2013). Genetics and consequences of crop domestication. J. Agric. Food Chem. 61 (35), 8267–8276. doi: 10.1021/jf305511d
Gao, Y., Tian, L., Liu, F., Cao, Y. (2012). Using the SSR fluorescent labeling to establish SSR fingerprints for 92 cultivars in pyrus. Acta Hortic. Sin. 39 (8), 1437–1446.
Govindaraj, M., Vetriventhan, M., Srinivasan, M. (2015). Importance of genetic diversity assessment in crop plants and its recent advances: An overview of its analytical perspectives. Genet. Res. Int. 2015, 431487–431487. doi: 10.1155/2015/431487
Guan, C., Zhang, P., Hu, C., Chachar, S., Riaz, A., Wang, R., et al. (2019). Genetic diversity, germplasm identification and population structure of diospyros kaki thunb. from different geographic regions in China using SSR markers. Scientia Hortic. 251, 233–240. doi: 10.1016/j.scienta.2021.110064
Hao, L., Zhang, L., Zhang, G., Wang, Y., Han, S., Bai, Y. (2017). Genetic diversity and population genetic structure of salix psammophila. Acta Botanica Boreali-Occidentalia Sin. 37 (8), 1507–1516.
Hughes, A. R., Inouye, B. D., Johnson, M. T. J., Underwood, N., Vellend, M. (2008). Ecological consequences of genetic diversity. Ecol. Lett. 11 (6), 609–623. doi: 10.1111/j.1461-0248.2008.01179.x
Huili, W., Shuxue, Y., Li, G., Hailong, L., Wei, L. (2022). Genetic diversity assessment and fingerprint construction of superior tree populations of pinus sylvestris var. mongolica. J. OF GANSU Agric. Univ. 57 (003), 057. doi: 10.13432/j.cnki.jgsau.2022.03.013
Ivetić, V., Devetaković, J., Maksimović, Z. (2016). Initial height and diameter are equally related to survival and growth of hardwood seedlings in first year after field planting. REFORESTA 2), 6–21. doi: 10.21750/REFOR.2.02.17
Ivetic, V., Devetakovic, J., Nonic, M., Stankovic, D., Sijacic-Nikolic, M. (2016). Genetic diversity and forest reproductive material - from seed source selection to planting. Iforest-Biogeosciences Forestry 9, 801–812. doi: 10.3832/ifor1577-009
Jin, Y., Ma, Y., Wang, S., Hu, X.-G., Huang, L.-S., Li, Y., et al. (2016). Genetic evaluation of the breeding population of a valuable reforestation conifer platycladus orientalis (Cupressaceae). Sci. Rep. 6. doi: 10.1038/srep34821
Jump, A. S., Marchant, R., Penuelas, J. (2009). Environmental change and the option value of genetic diversity. Trends Plant Sci. 14 (1), 51–58. doi: 10.1016/j.tplants.2008.10.002
Lea, M. V., Syring, J., Jennings, T., Cronn, R., Bruederle, L. P., Neale, J. R., et al. (2018). Development of nuclear microsatellite loci for pinus albicaulis engelm. (Pinaceae), a conifer of conservation concern. PloS One 13 (10). doi: 10.1371/journal.pone.0205423
Ledig, F. T. (1992). Human impacts on genetic diversity in forest ecosystems. Oikos 63 (1), 87–108. doi: 10.2307/3545518
Liang, H., Liu, C., Liu, X., Yang, M. (2005). Simple sequence repeat (SSR) analysis and identify of different cultivars in populus l. J. Agric. Univ. Hebei 28 (4), 27–31.
Liao, R., Luo, Y., Yisilam, G., Lu, R., Wang, Y., Li, P. (2019). Development and characterization of SSR markers for sanguinaria canadensis based on genome skimming. Appl. Plant Sci. 7 (9). doi: 10.1002/aps3.11289
Liewlaksaneeyanawin, C., Ritland, C. E., El-Kassaby, Y. A., Ritland, K. (2004). Single-copy, species-transferable microsatellite markers developed from loblolly pine ESTs. Theor. Appl. Genet. 109 (2), 361–369. doi: 10.1007/s00122-004-1635-7
Li, L., Lejing, L., Zhiyong, Z., Bo, L., Jie, R. (2022). Construction of SSR fingerprint and genetic diversity analysis of 93 maple germplasm resources. Mol. Plant Breed. 20 (4), 1250–1263. doi: 10.13271/j.mpb.020.001250
Li, X., Liu, X., Wei, J., Li, Y., Tigabu, M., Zhao, X. (2020). Development and transferability of EST-SSR markers forPinus koraiensisfrom cold-stressed transcriptome through illumina sequencing. Genes 11 (5). doi: 10.3390/genes11050500
Liu, K. J., Muse, S. V. (2005). PowerMarker: An integrated analysis environment for genetic marker analysis. Bioinformatics 21 (9), 2128–2129. doi: 10.1093/bioinformatics/bti282
Li, T., Yang, W., Song, L., Su, X., Yang, Z., Guo, H. (2003). Exploring on the genetic polymorphism in haliotis discus hannai ino and h. diversicolor reeve by RAPD technique. Oceanologia Limnologia Sin. 34 (4), 444–449.
Longhai, H., Fenggang, P., Hongzhi, L., Xiaozhong, S., Lianjun, Y., Hanguo, Z. (2021). Variation of cone-and-seed traits and clonal selection of pinus koraiensis. J. Beihua University (Natural Science) 22 (2), 6.
Lv, J., Li, C., Zhou, C., Chen, J., Li, F., Weng, Q., et al. (2020). Genetic diversity analysis of a breeding population of eucalyptus cloeziana f. muell. (Myrtaceae) and extraction of a core germplasm collection using microsatellite markers. Ind. Crops Products 145. doi: 10.1016/j.indcrop.2020.112157
Ma, L., Kong, D., Liu, H., Wang, S., Li, Y., Pang, X. (2012). Construction of SSR fingerprint on 36 Chinese jujube cultivars. Acta Hortic. Sin. 39 (4), 647–654.
Markert, J. A., Champlin, D. M., Gutjahr-Gobell, R., Grear, J. S., Kuhn, A., McGreevy, T. J., Jr., et al. (2010). Population genetic diversity and fitness in multiple environments. BMC Evolutionary Biol. 10. doi: 10.1186/1471-2148-10-205
Melo, A. T. D., Coelho, A. S. G., Pereira, M. F., Blanco, A. J. V., Franceschinelli, E. V. (2014). High genetic diversity and strong spatial genetic structure in cabralea canjerana (Vell.) mart. (Meliaceae): implications to Brazilian Atlantic forest tree conservation. Natureza Conservacao 12 (2), 129–133. doi: 10.1016/j.ncon.2014.08.001
Nergiz, C., Donmez, I. (2004). Chemical composition and nutritive value of pinus pinea l. seeds. Food Chem. 86 (3), 365–368. doi: 10.1016/j.foodchem.2003.09.009
Nevo, E. (1988). Genetic diversity in nature: Patterns and theory. Evolutionary Biol. 23, 217–246. doi: 10.1007/978-1-4613-1043-3_6
Nn, A., Iss, A., As, A., Sd, A., Mkp, B., La, A., et al. (2020). Population genetic structure and diversity analysis in economically important pandanus odorifer (Forssk.) kuntze accessions employing ISSR and SSR markers. Ind. Crops Products 143. doi: 10.1016/j.indcrop.2019.111894
Park, Y.-J., Lee, J. K., Kim, N.-S. (2009). Simple sequence repeat polymorphisms (SSRPs) for evaluation of molecular diversity and germplasm classification of minor crops. Molecules 14 (11), 4546–4569. doi: 10.3390/molecules14114546
Pauls, S. U., Nowak, C., Balint, M., Pfenninger, M. (2013). The impact of global climate change on genetic diversity within populations and species. Mol. Ecol. 22 (4), 925–946. doi: 10.1111/mec.12152
Peakall, R., Smouse, P. E. (2006). GENALEX 6: Genetic analysis in excel. population genetic software for teaching and research. Mol. Ecol. Notes 6 (1), 288–295. doi: 10.1111/j.1471-8286.2005.01155.x
Pingyu, Y., Peng, W., Weiman, Y., Hanguo, Z. (2020). Analysis of seeding characters of Korean pine seed orchard and selection of excellent clones. For. Eng. 36 (6), 11. doi: 10.16270/j.cnki.slgc.2020.06.003
Qianping, T. (2020). Genetic diversity analysis on indivitual of pinus koraiensis in seed orchard based on ISSR-PCR. For. Sci. Technol. 45 (2), 4. doi: 10.19750/j.cnki.1001-9499.2020.02.005
Ravelombola, W., Shi, A., Weng, Y., Mou, B., Motes, D., Clark, J., et al. (2018). Association analysis of salt tolerance in cowpea (Vigna unguiculata (L.) walp) at germination and seedling stages. Theor. Appl. Genet. 131 (1), 79–91. doi: 10.1007/s00122-017-2987-0
Raymond, M., Rousset, F. (1995). GENEPOP (Version 1.2): Population genetics software for exact tests and ecumenicism. J. Heredity 68 (3), 248–249.
Schmidt, T. L., Jasper, M.-E., Weeks, A. R., Hoffmann, A. A. (2021). Unbiased population heterozygosity estimates from genome-wide sequence data. Methods Ecol. Evol. 12 (10), 1888–1898. doi: 10.1111/2041-210x.13659
Tamura, K., Peterson, D., Peterson, N., Stecher, G., Nei, M., Kumar, S. (2011). MEGA5: Molecular evolutionary genetics analysis using maximum likelihood, evolutionary distance, and maximum parsimony methods. Mol. Biol. Evol. 28 (10), 2731–2739. doi: 10.1093/molbev/msr121
Tohme, J., Gonzalez, D. O., Beebe, S., Duque, M. C. (1996). AFLP analysis of gene pools of a wild bean core collection. Crop Sci. 36. doi: 10.2135/cropsci1996.0011183X003600050048x
Tong, Y., Tang, Y., Chen, H., Zhang, T., Zuo, J., Wu, J., et al. (2019). Phenotypic diversity of pinus koraiensis populations in a seed orchard. Acta Ecologica Sin. 39 (17), 6341–6348.
Wachowiak, W., Salmela, M. J., Ennos, R. A., Iason, G., Cavers, S. (2011). High genetic diversity at the extreme range edge: Nucleotide variation at nuclear loci in scots pine (Pinus sylvestris l.) in Scotland. Heredity 106 (5), 775–787. doi: 10.1038/hdy.2010.118
Weihuai, W., Yutong, C., Qianshun, D., Dan, H., Zhixin, L., Hanguo, Z., et al. (2019). Analysis of characters and nutritional components of pinus koraiensis seeds on clones and superior trees. For. Eng. 35 (2), 11. doi: 10.16270/j.cnki.slgc.2019.02.002
Wenqiang, F., Hongmei, G., Xin, S., Aiguo, Y., Zhongfeng, Z., Min, R. (2016). DataFormater, a software for SSR data formatting to develop population genetics analysis. Mol. Plant Breed. 1), 6. doi: 10.13271/j.mpb.014.000265
Wheeler, N. C., Jech, K. S. (1992). The use of electrophoretic markers in seed orchard research. New Forests 6 (1-4), 311–328. doi: 10.1007/BF00120650
Wolff, R. L., Pédrono, F., Pasquier, E., Marpeau, A. M. (2000). General characteristics of pinus spp. seed fatty acid compositions, and importance of Δ5-olefinic acids in the taxonomy and phylogeny of the genus. Lipids 35 (1), 1–22. doi: 10.1007/s11745-000-0489-y
Xiang, X., Zhang, Z., Wang, Z., Zhang, X., Wu, G. (2015). Transcriptome sequencing and development of EST-SSR markers in pinus dabeshanensis, an endangered conifer endemic to China. Mol. Breed. 35 (8). doi: 10.1007/s11032-015-0351-0
Yoon, T. H., Im, K. J., Koh, E. T., Ju, J. S. (1989). Fatty acid compositions of pinus koraiensis seed. Nutr. Res. 9 (3), 357–361. doi: 10.1016/S0271-5317(89)80079-X
Yu, J.-H., Chen, C.-M., Tang, Z.-H., Yuan, S.-S., Wang, C.-J., Zu, Y.-G. (2012). Isolation and characterization of 13 novel polymorphic microsatellite markers for Pinus koraiensis (Pinaceae). Am. J. Bot. 99 (10), E421–E424. doi: 10.3732/ajb.1200145
Zadernowski, R., Naczk, M., Czaplicki, S. (2009). Chemical composition of pinus sibirica nut oils. Eur. J. Lipid Sci. Technol. 111 (7), 698–704. doi: 10.1002/ejlt.200800221
Zhang, Z., Zhang, H., Mo, C., Zhang, L. (2015a). Transcriptome sequencing analysis and development of EST-SSR markers for pinus koraiensis. Scientia Silvae Sinicae 51 (8), 114–120.
Zhang, Q., Zhang, X., Yang, Y., Xu, L., Feng, J., Wang, J., et al. (2022). Genetic diversity of juglans mandshurica populations in northeast China based on SSR markers. Front. Plant Sci. 13. doi: 10.3389/fpls.2022.931578
Zhang, Z., Zhang, H., Zhou, Y., Liu, L., Yu, H., Wang, X., et al. (2015b). Variation of seed characters in Korean pine (Pinus koraiensis) multi-clonal populations. J. Beijing Forestry Univ. 37 (2), 067–068.
Zhao, D., Zhang, D. D., Xin, S., Feng, F. J. (2010). Establishment and optimization of the SRAP-PCR reaction system on pinus koraiensis sieb.et zucc. Res. Explor. Laboratory.
Keywords: Korean pine, SSR, genetic diversity, clone, fingerprint
Citation: Yan P, Xie Z, Feng K, Qiu X, Zhang L and Zhang H (2023) Genetic diversity analysis and fingerprint construction of Korean pine (Pinus koraiensis) clonal seed orchard. Front. Plant Sci. 13:1079571. doi: 10.3389/fpls.2022.1079571
Received: 25 October 2022; Accepted: 29 December 2022;
Published: 16 January 2023.
Edited by:
Patricio Hinrichsen, Agricultural Research Institute, ChileReviewed by:
Kevin Kit Siong Ng, Forest Research Institute Malaysia (FRIM), MalaysiaCopyright © 2023 Yan, Xie, Feng, Qiu, Zhang and Zhang. This is an open-access article distributed under the terms of the Creative Commons Attribution License (CC BY). The use, distribution or reproduction in other forums is permitted, provided the original author(s) and the copyright owner(s) are credited and that the original publication in this journal is cited, in accordance with accepted academic practice. No use, distribution or reproduction is permitted which does not comply with these terms.
*Correspondence: Hanguo Zhang, aGFuZ3VvemhhbmcxQHNpbmEuY29t
Disclaimer: All claims expressed in this article are solely those of the authors and do not necessarily represent those of their affiliated organizations, or those of the publisher, the editors and the reviewers. Any product that may be evaluated in this article or claim that may be made by its manufacturer is not guaranteed or endorsed by the publisher.
Research integrity at Frontiers
Learn more about the work of our research integrity team to safeguard the quality of each article we publish.