
95% of researchers rate our articles as excellent or good
Learn more about the work of our research integrity team to safeguard the quality of each article we publish.
Find out more
ORIGINAL RESEARCH article
Front. Plant Sci. , 04 January 2023
Sec. Plant Nutrition
Volume 13 - 2022 | https://doi.org/10.3389/fpls.2022.1074245
This article is part of the Research Topic A Wonder Legume, Soybean: Prospects for Improvement View all 7 articles
 Rahul Kumar1
 Manisha Saini1
 Meniari Taku1
 Pulak Debbarma1
 Rohit Kumar Mahto1,2
 Ayyagari Ramlal1†
 Deepshikha Sharma1
 Ambika Rajendran1
 Renu Pandey3
 Kishor Gaikwad4
 S. K. Lal1
 Akshay Talukdar1*
Seed size and shape are important traits determining yield and quality in soybean. Seed size and shape are also desirable for specialty soy foods like tofu, natto, miso, and edamame. In order to find stable quantitative trait loci (QTLs) and candidate genes for seed shape and 100-seed weight, the current study used vegetable type and seed soybean-derived F2 and F2:3 mapping populations. A total of 42 QTLs were mapped, which were dispersed across 13 chromosomes. Of these, seven were determined to be stable QTLs and five of them were major QTLs, namely qSL-10-1, qSW-4-1, qSV-4-1, qSLW-10-1, and qSLH-10-1. Thirteen of the 42 QTLs detected in the current study were found at known loci, while the remaining 29 were discovered for the first time. Out of these 29 novel QTLs, 17 were major QTLs. Based on Protein Analysis Through Evolutionary Relationships (PANTHER), gene annotation information, and literature search, 66 genes within seven stable QTLs were predicted to be possible candidate genes that might regulate seed shape and seed weight in soybean. The current study identified the key candidate genes and quantitative trait loci (QTLs) controlling soybean seed shape and weight, and these results will be very helpful in marker-assisted breeding for developing soybean varieties with improved seed weight and desired seed shape.
Soybean [Glycine max (L.) Merr.] is one of the most economically important crops in the world, which is also used as a model plant for research on legumes (Kumar et al., 2022). It is a rich source of both edible oil and plant-based protein, which also fixes atmospheric nitrogen through a symbiotic interaction with soil microorganisms (Wang et al., 2019). Soybean is a marvellous legume meeting daily oil and protein dietary needs (Rajendran et al., 2022). Soybean is widely grown and consumed globally and constitutes nearly 28% of vegetable oil and 70% of protein meals worldwide (SoyStats, 2021). Because of its great nutritional content, it is used in both human food and animal feed (Ramlal et al., 2022a; 2022b). Besides, it is used in the pharmaceutical and cosmetic industries. The seed size and color are important for specific uses of soybean seeds. For example, in specialty soy food products, such as tofu, natto, miso, and edamame, seed weight and seed shape are critically considered (Cui et al., 2004). For food-type soybean, round seeds are preferred over others. Similarly, large seeds are considered to be ideal for tofu, edamame, and miso production, while small seeds are for natto manufacture (Wilson, 1995; Yan et al., 2017).
Despite being one of the most economically significant leguminous seed crops and producing more than a quarter of the world’s edible oil and animal feed, soybean has a rather low yield level (Egli, 2008). The seed size and shape play a key role in determining seed weight and yield in soybean (Salas et al., 2006; Yan et al., 2017). Seed appearance including seed length (SL), seed width (SW), and seed height (SH), as well as seed shape traits such as length-to-width (SLW), length-to-height (SLH), and width-to-height (SWH) ratios, affect seed yield (Xu et al., 2011). Seed size, which is measured as 100-seed weight (100-SW), is a fitness trait that is essential for environmental adaptation (Tao et al., 2017). Under natural conditions, greater seed resources stored in larger seeds enable seedlings to grow more rapidly at the seedling stage and increase competitiveness and survival (Manga and Yadav, 1995). Increased seed number also translates directly into fitness, resulting in selection pressure to produce more (and thus smaller) seeds (Westoby et al., 1992). Environmental factors can also exert a strong influence on seed size by affecting assimilate supply (Borrell et al., 2014) and carbon translocation (Zolkevich et al., 1958). However, such traits are very complex in nature and difficult to improve through normal breeding approaches.
An effective method to clarify complicated trait architecture is quantitative trait loci (QTL) analysis. In soybean, natural selection for larger seeds has led to an accumulation of minor QTLs, and QTL mapping has shed light on these evolutionary changes (Salas et al., 2006; Hina et al., 2020). More than 400 QTLs for seed size and shape are now documented in the USDA Soybean Genome Database (SoyBase; http://www.soybase.org), however, majority of these QTLs are unconfirmed i.e. these are neither mapped across several environments nor validated on mapping population with different genetic background (Hina et al., 2020). For instance, 16 QTLs for seed size and shape were found on 12 different soybean chromosomes by Mian et al. (1996). On 16 soybean chromosomes, Hoeck et al. (2003) found 27 QTLs related to seed size, while Li et al. (2008) found three QTLs for seed length (SL) on Chr. 7, Chr.13, and Chr.16. Lü et al. (2011) found 19 main-effect QTLs (M-QTLs) and three epistatic-effect QTLs (E-QTLs) for SL on eight chromosomes. In the recombinant inbred line (RIL) population obtained from a hybrid between Li-shui-zhong-zi-huang and Nannong493-1, Xie et al. (2014) finely mapped QTLs for soybean seed size traits on Chr.6. For six soybean seed size and shape variables, Hina et al. (2020) found 88 main and epistatic-effect QTLs. Similarly, 42 additive effect QTLs for seed traits were mapped by Li et al. (2020). However, across various genetic backgrounds and conditions, only a few numbers of stable QTLs associated with seed and yield-related traits [seed length (SL), seed width (SW), seed height (SH), length-to-width (SLW), length-to-height (SLH), and width-to-height (SWH) and 100-seed weight (100-SW)] have been found. Therefore, for effective employment of QTLs in marker-assisted breeding, it is essential to find QTLs and confirm them in a variety of backgrounds and conditions. Despite this, there are only a few papers focusing on the mapping of QTLs for seed size and shape using the high-density map in various genetic backgrounds of soybean (Karikari et al., 2019). In addition, most of the published reports did not mine the candidate genes for seed shape and seed weight (Zhang et al., 2004; Niu et al., 2013; Kato et al., 2014; Wu et al., 2018). Keeping these issues in mind, the current study was attempted using an F2 and F2:3 population derived from a cross between vegetable type (AGS 457) and seed types (SKAF 148) soybean to determine the most significant genomic areas and potential genes for seed size and shape in soybeans. These findings will be useful for marker-assisted breeding (MAB) for the seed size and shape of soybean seeds and create soybean varieties with increased yield and quality.
In this study, F2 and F2:3 populations were used. These populations were developed by crossing soybean genotypes AGS 457 and SKAF 148. The SKAF 148 is a small-seeded grain type soybean while AGS 457 is a large-seeded vegetable soybean genotype. Both genotypes varied widely in seed size and shape. Young leaves were collected from 237 F2 plants and the two parental genotypes that were grown in the field of the Indian Agricultural Research Institute in New Delhi, India, during the 2020 growing season (July 2020-November 2020). Furthermore, 237 F2:3 lines and the two parents were sown in a field of Indian Agricultural Research Institute, New Delhi, India in a randomized complete block design with two replications in the 2021 growing seasons. Each plot has one row of 1 m long constituting 10 plants in each row with a space of 10 cm between the adjacent plants. Five individuals from each of the F2:3 families were taken for phenotypic evaluation.
The traits were assessed in the plants of F2 and F2:3 mapping populations. Seed shape and 100 seed weight were evaluated in both generations. Using an electronic Vernier Caliper, the following seed dimensions were measured: length (mm), width (mm), and height (mm) (Figure 1). This information was used to calculate the seed’s volume (mm3) as width × height × length, seed length to width ratio (SLW), seed length to height ratio (SLH), and seed width to height ratio (SWH) (Salas et al., 2006). A weighing machine (KERN ABT 320-4M) was used to calculate the weight (g) of 100 seeds (100 seed weight). The Pearson phenotypic correlation coefficients between traits were calculated using R. (R Core Team, 2013).

Figure 1 Seed Length (SL), Seed Width (SW) and Seed Height (SH).
Genomic DNA was extracted from the young leaves using a modified CTAB method as described by Lodhi et al. (1994). On an ethidium bromide-stained 0.8% agarose gel, the DNA’s purity was examined. Based on the consensus soybean genetic linkage map published by Cregan et al. (1999) and Song et al. (2004), SSR markers scattered throughout the 20 genetic linkage groups were chosen. A set of 638 SSR markers were used for polymorphic survey and 123 polymorphic markers were employed for genotyping of the F2 population.
We used the program QTL IciMapping V4.2 to make the linkage map and find QTLs. A genetic distance of 50 cM and a minimum LOD score of 2.5 was used to construct the linkage map connecting the markers. Kosambi’s mapping function (Kosambi, 1944) was used to calculate map distances. Utilizing the composite interval mapping approach (CIM), the QTL analysis was performed (Zeng, 1994). A LOD score of 2.5 was maintained to confirm the presence of a QTL in a particular genomic region.
In this study, when a particular QTL was mapped in both the F2 and the F2:3 generations, it was considered a stable QTL. Model genes within the genomic physical position of the stable QTLs on the soybean genome (Glyma2.0) available at SoyBase (http://www.soybase.org) and EnsemblPlants (https://plants.ensembl.org) were downloaded. Phytozome 13 (http://phytozome-next.jgi.doe.gov) was used to conduct a Gene Ontology (GO) enrichment analysis for all the genes in each QTL region. In order to facilitate high-throughput analysis according to family and subfamily, molecular function, biological process, and pathway, the projected candidate genes were then subjected to Protein Analysis Through Evolutionary Relationships (PANTHER) Classification System.
There was a considerable variation in seed sizes and other seed features between the parental genotypes AGS 457 and SKAF 148 (Table 1) (Figure 2). The frequency distribution of the F2 data exhibited that all the seed-related traits were distributed normally (Figure 3), indicating their polygenic inheritance. Transgressive segregation was also noted for all the traits studied. In the F2:3 population, significant correlation coefficients for seed traits ranged from -0.135 to 0.75. (Table 2). Seed Width (SW), Seed Volume (SV), Seed Length to Width Ratio (SLW), Seed Length to Height Ratio (SLH), Seed Width to Height Ratio (SWH), and 100 Seed Weight (100SW) all had positive associations with seed length (SL). However, there was no discernible relationship between seed length and seed height. Seed length, Seed width, and Seed Volume were found significantly correlated with 100 seed weight while seed height had a non-significant correlation with 100 seed weight. Seed Length and Width ratio (SLW) had a significant positive association with seed volume while SLH and SWH had a non-significant association with seed volume that indicates seed length and seed width as the major determinant of seed shape and seed weight of soybean.
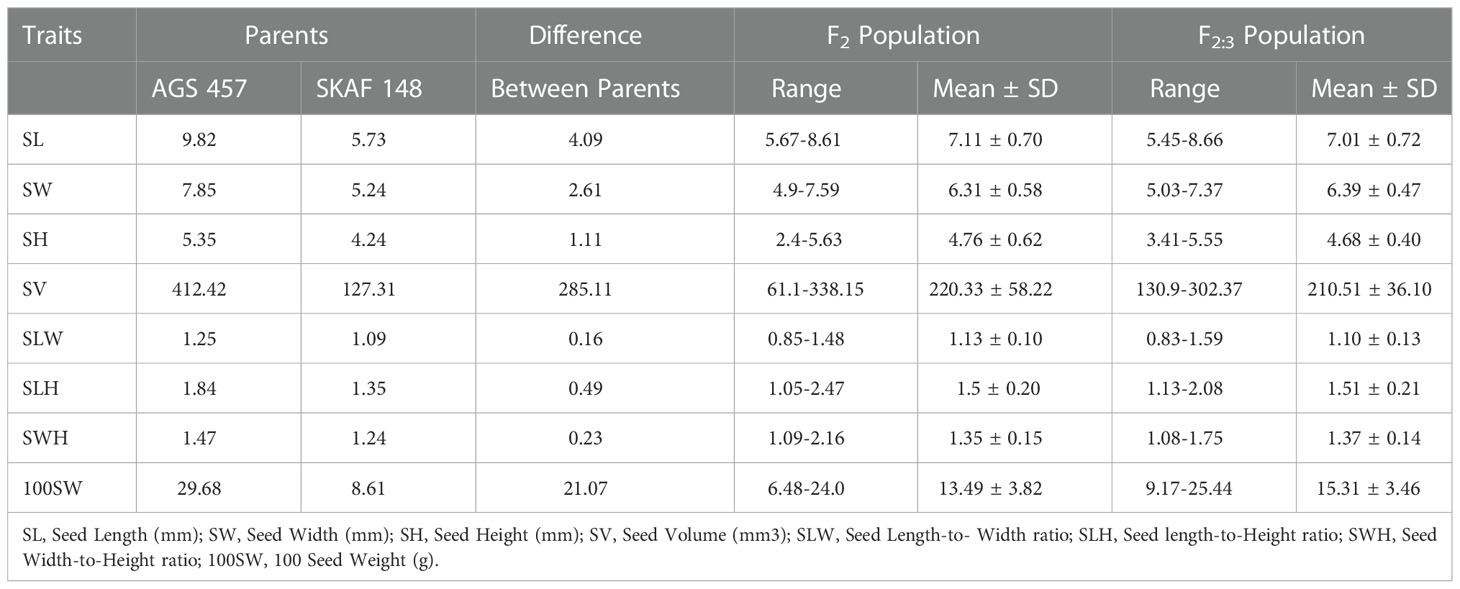
Table 1 Descriptive statistics of evaluated quantitative traits in parents, F2 population and F2:3 population.
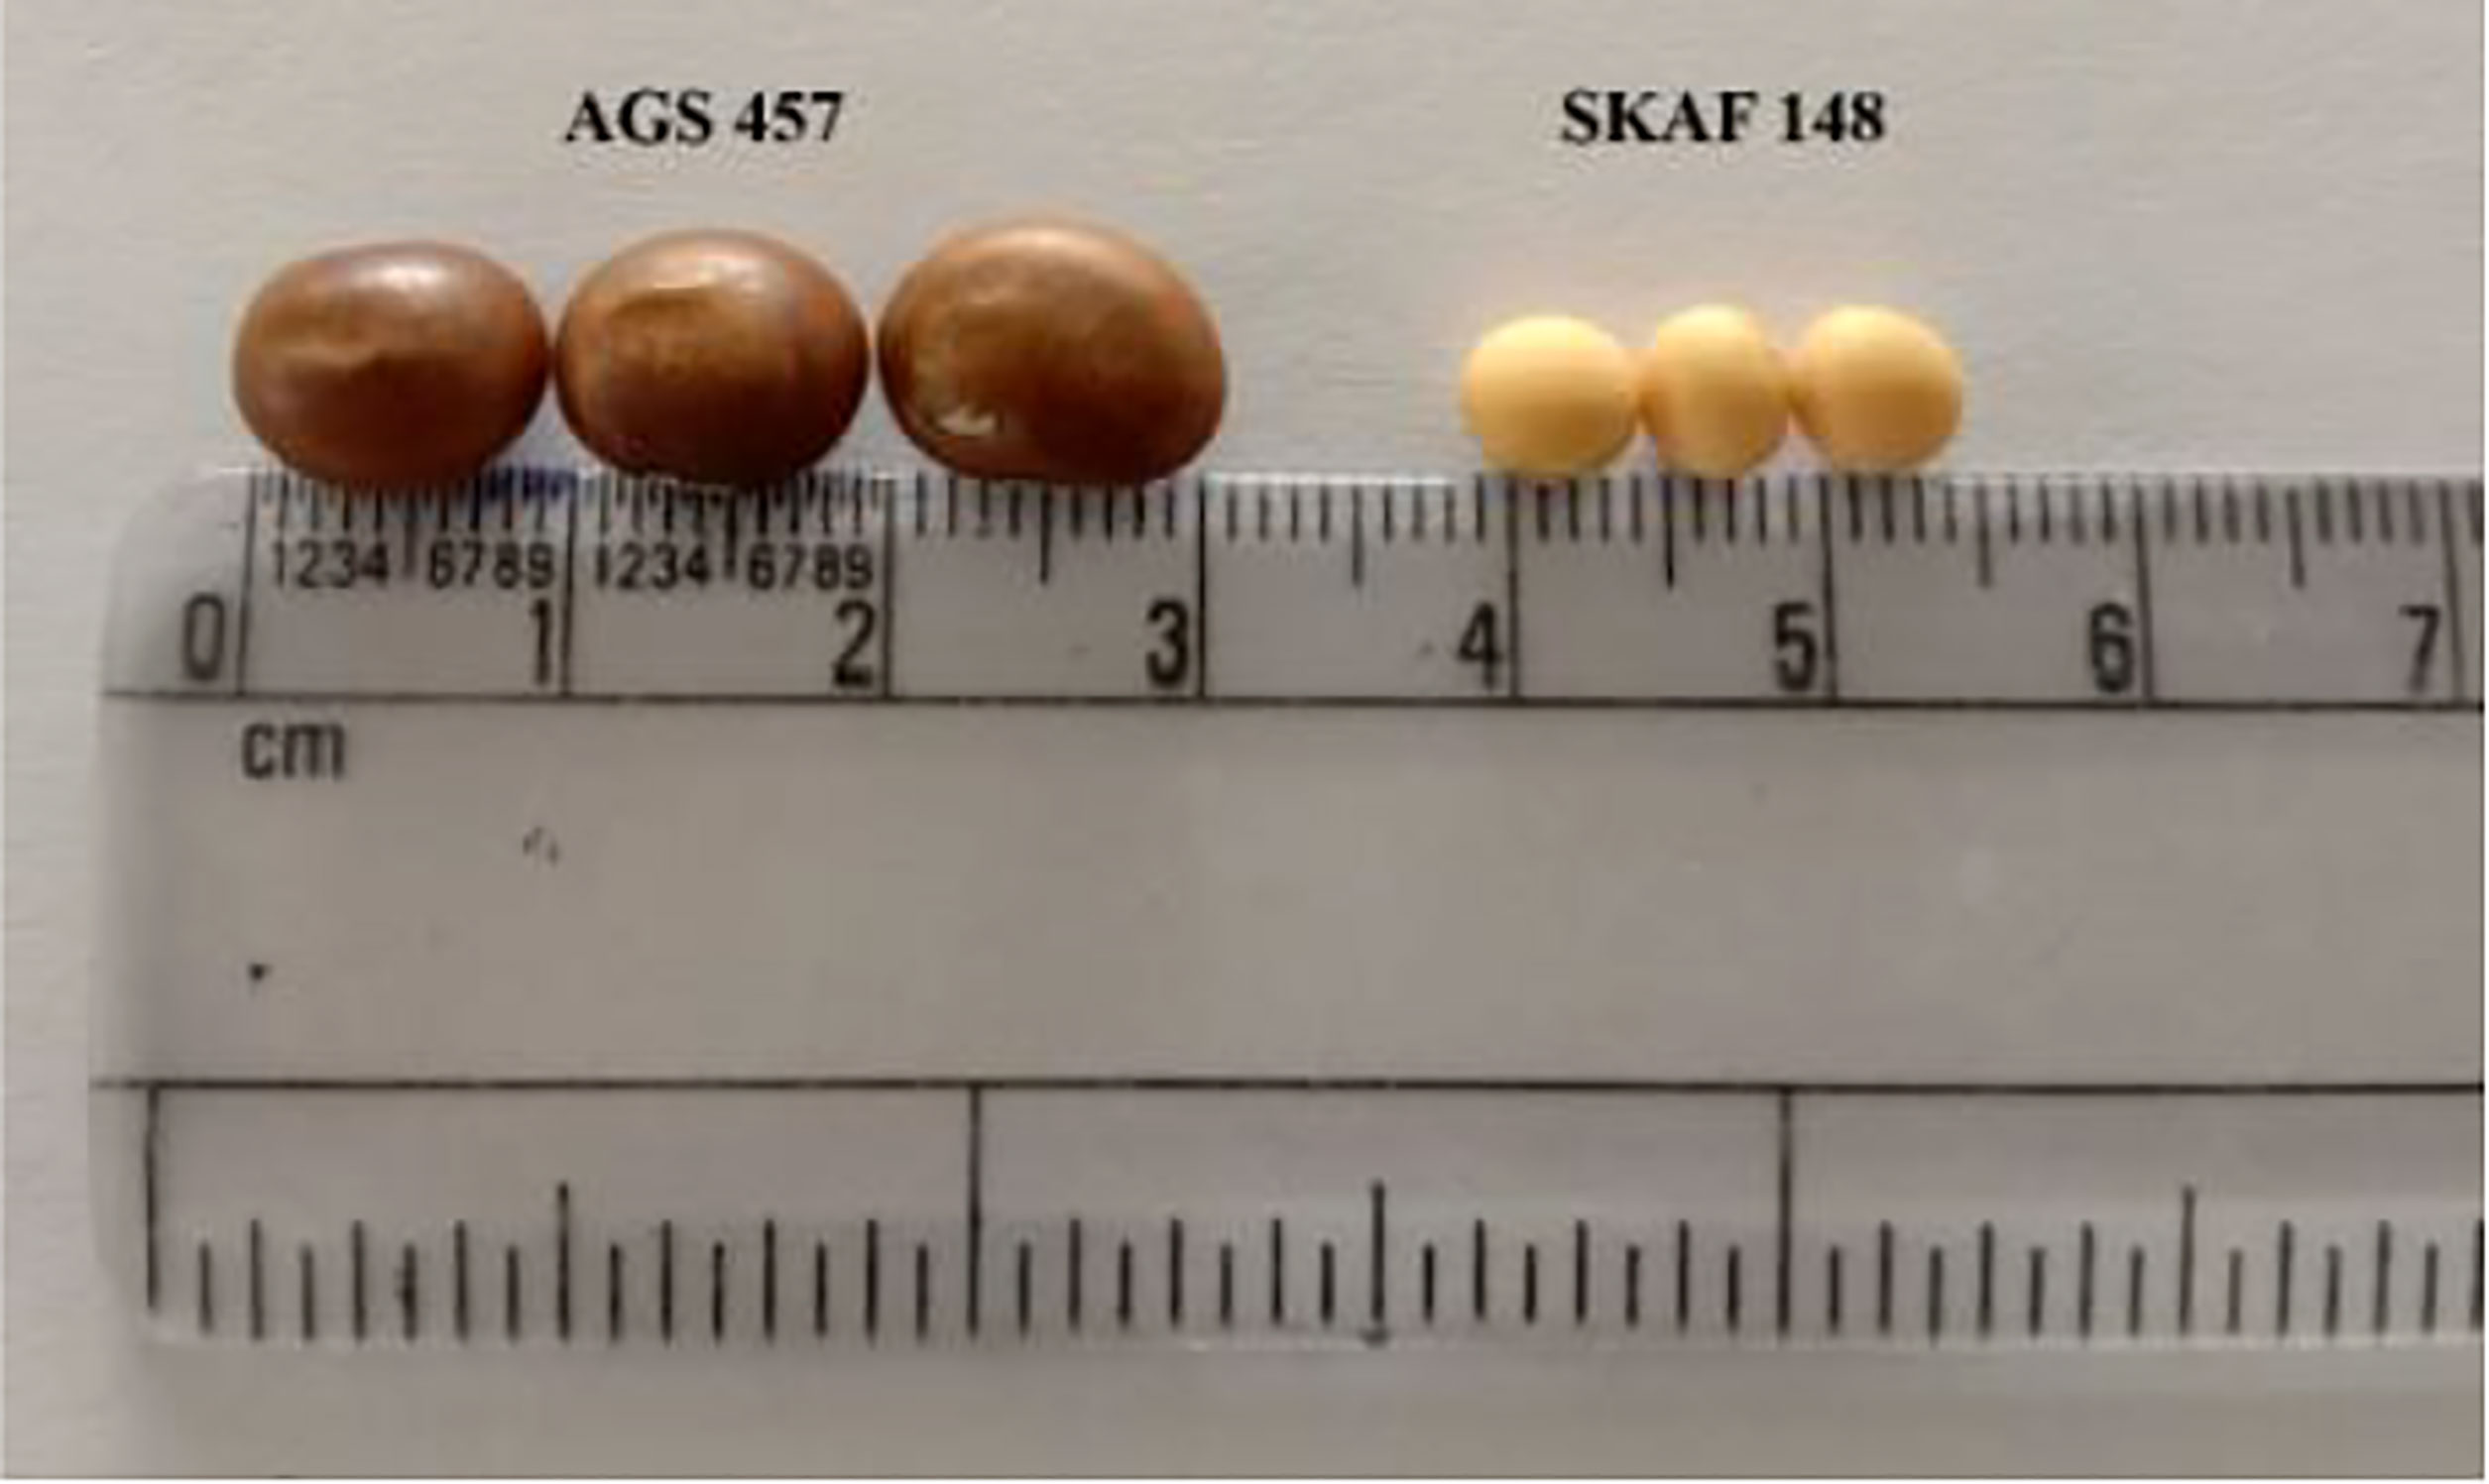
Figure 2 Comparison of the seed size and seed shape between the AGS 457 and SKAF 148.
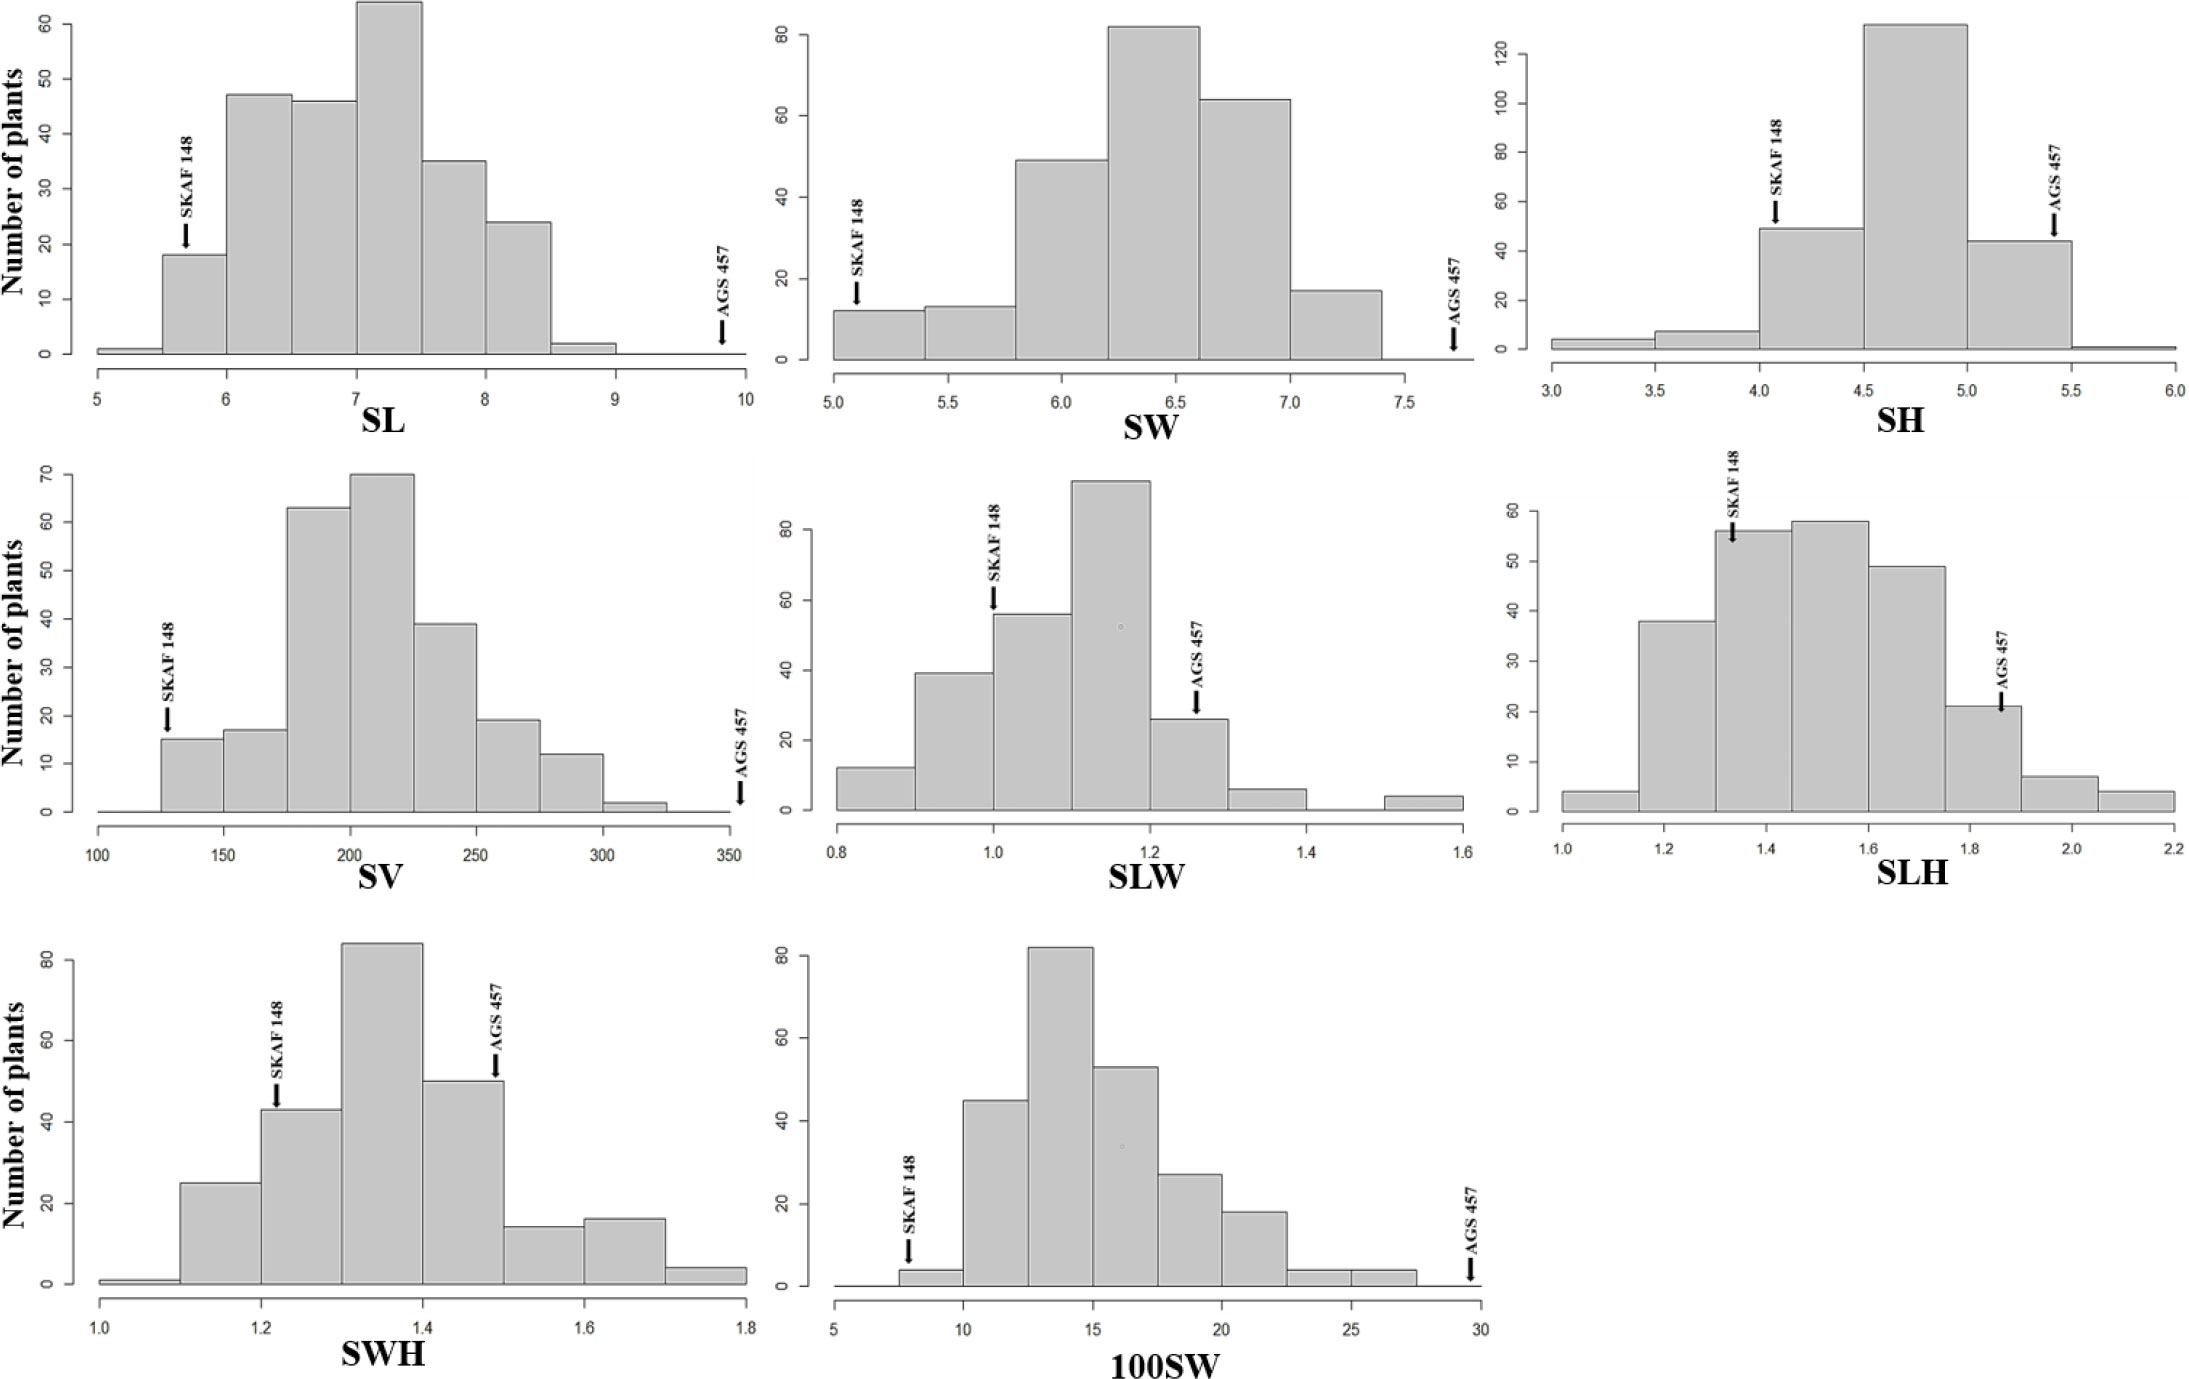
Figure 3 Frequency distributions of seed-related traits [SL, Seed Length (mm); SW, Seed Width (mm); SH, Seed Height (mm); SV, Seed Volume (mm3); SLW, Seed Length to Width ratio; SLH, Seed length to Height ratio; SWH, Seed Width to Height ratio and 100SW, 100 seed weight (g)] in the F2:3 population derived from the cross of AGS 457 X SKAF 148. Parental means are denoted with arrows.
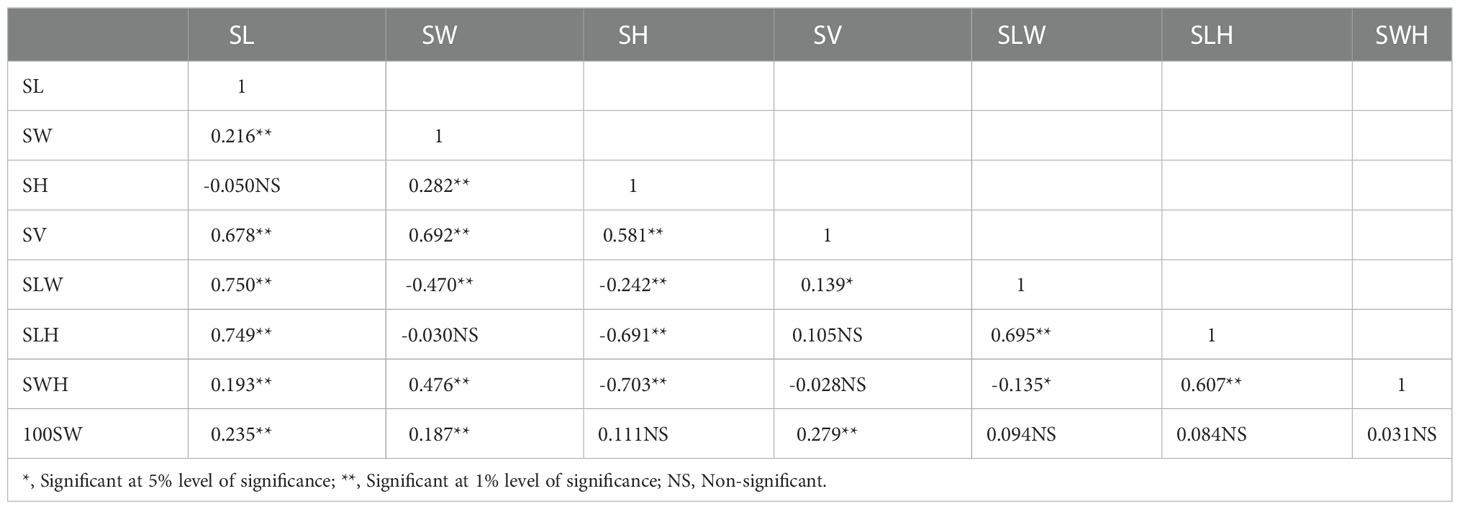
Table 2 Pearson phenotypic correlation coefficient among seed-related traits in F2:3 population.
The two parents were examined for genetic polymorphism using 638 SSR markers, out of which, 123 markers (19.28%) were found to be polymorphic. The polymorphic markers were selected to genotype the plants in the F2 generation. The linkage map constructed with these markers developed twenty separate linkage groups (LGs), which had a total length of 2005.7cm covering 79.5% of the entire soybean genome (2523.6cM). The majority of the markers comprising the linkage groups had map locations, which corresponded well with the soybean composite map (http://soybase.agron.iastate.edu/); however, minor variation in the map distance has been observed among the markers in the map.
The F2 and F2:3 populations developed in this study were used to map and analyze the QTLs for the seed-related traits in soybean. In the F2 population, 17 unique QTLs were mapped using Composite Interval Mapping (CIM), with each QTL accounting for 5.03% to 23.79% of the phenotypic variances of the corresponding traits. The 17 QTLs were distributed on eight chromosomes, viz., Chrs.4, 6, 10, 11, 13, 16, 17, and 18 (Figure 4). There were one or more QTLs on each of these eight chromosomes, with Chr.06 having the highest number i.e., four QTLs. In the F2:3 population, 25 QTLs were identified and mapped for the seed-related traits. The phenotypic variance explained (PVE) by any individual QTL ranged from 3.8% to 33.94%. The detected QTLs were discovered across eleven distinct chromosomes viz., Chromosome 2, 4, 5, 6, 7, 9, 10, 11, 12, 13, and 18 (Figure 4). The maximum number of QTLs i.e., 5 were found on chromosome 4.
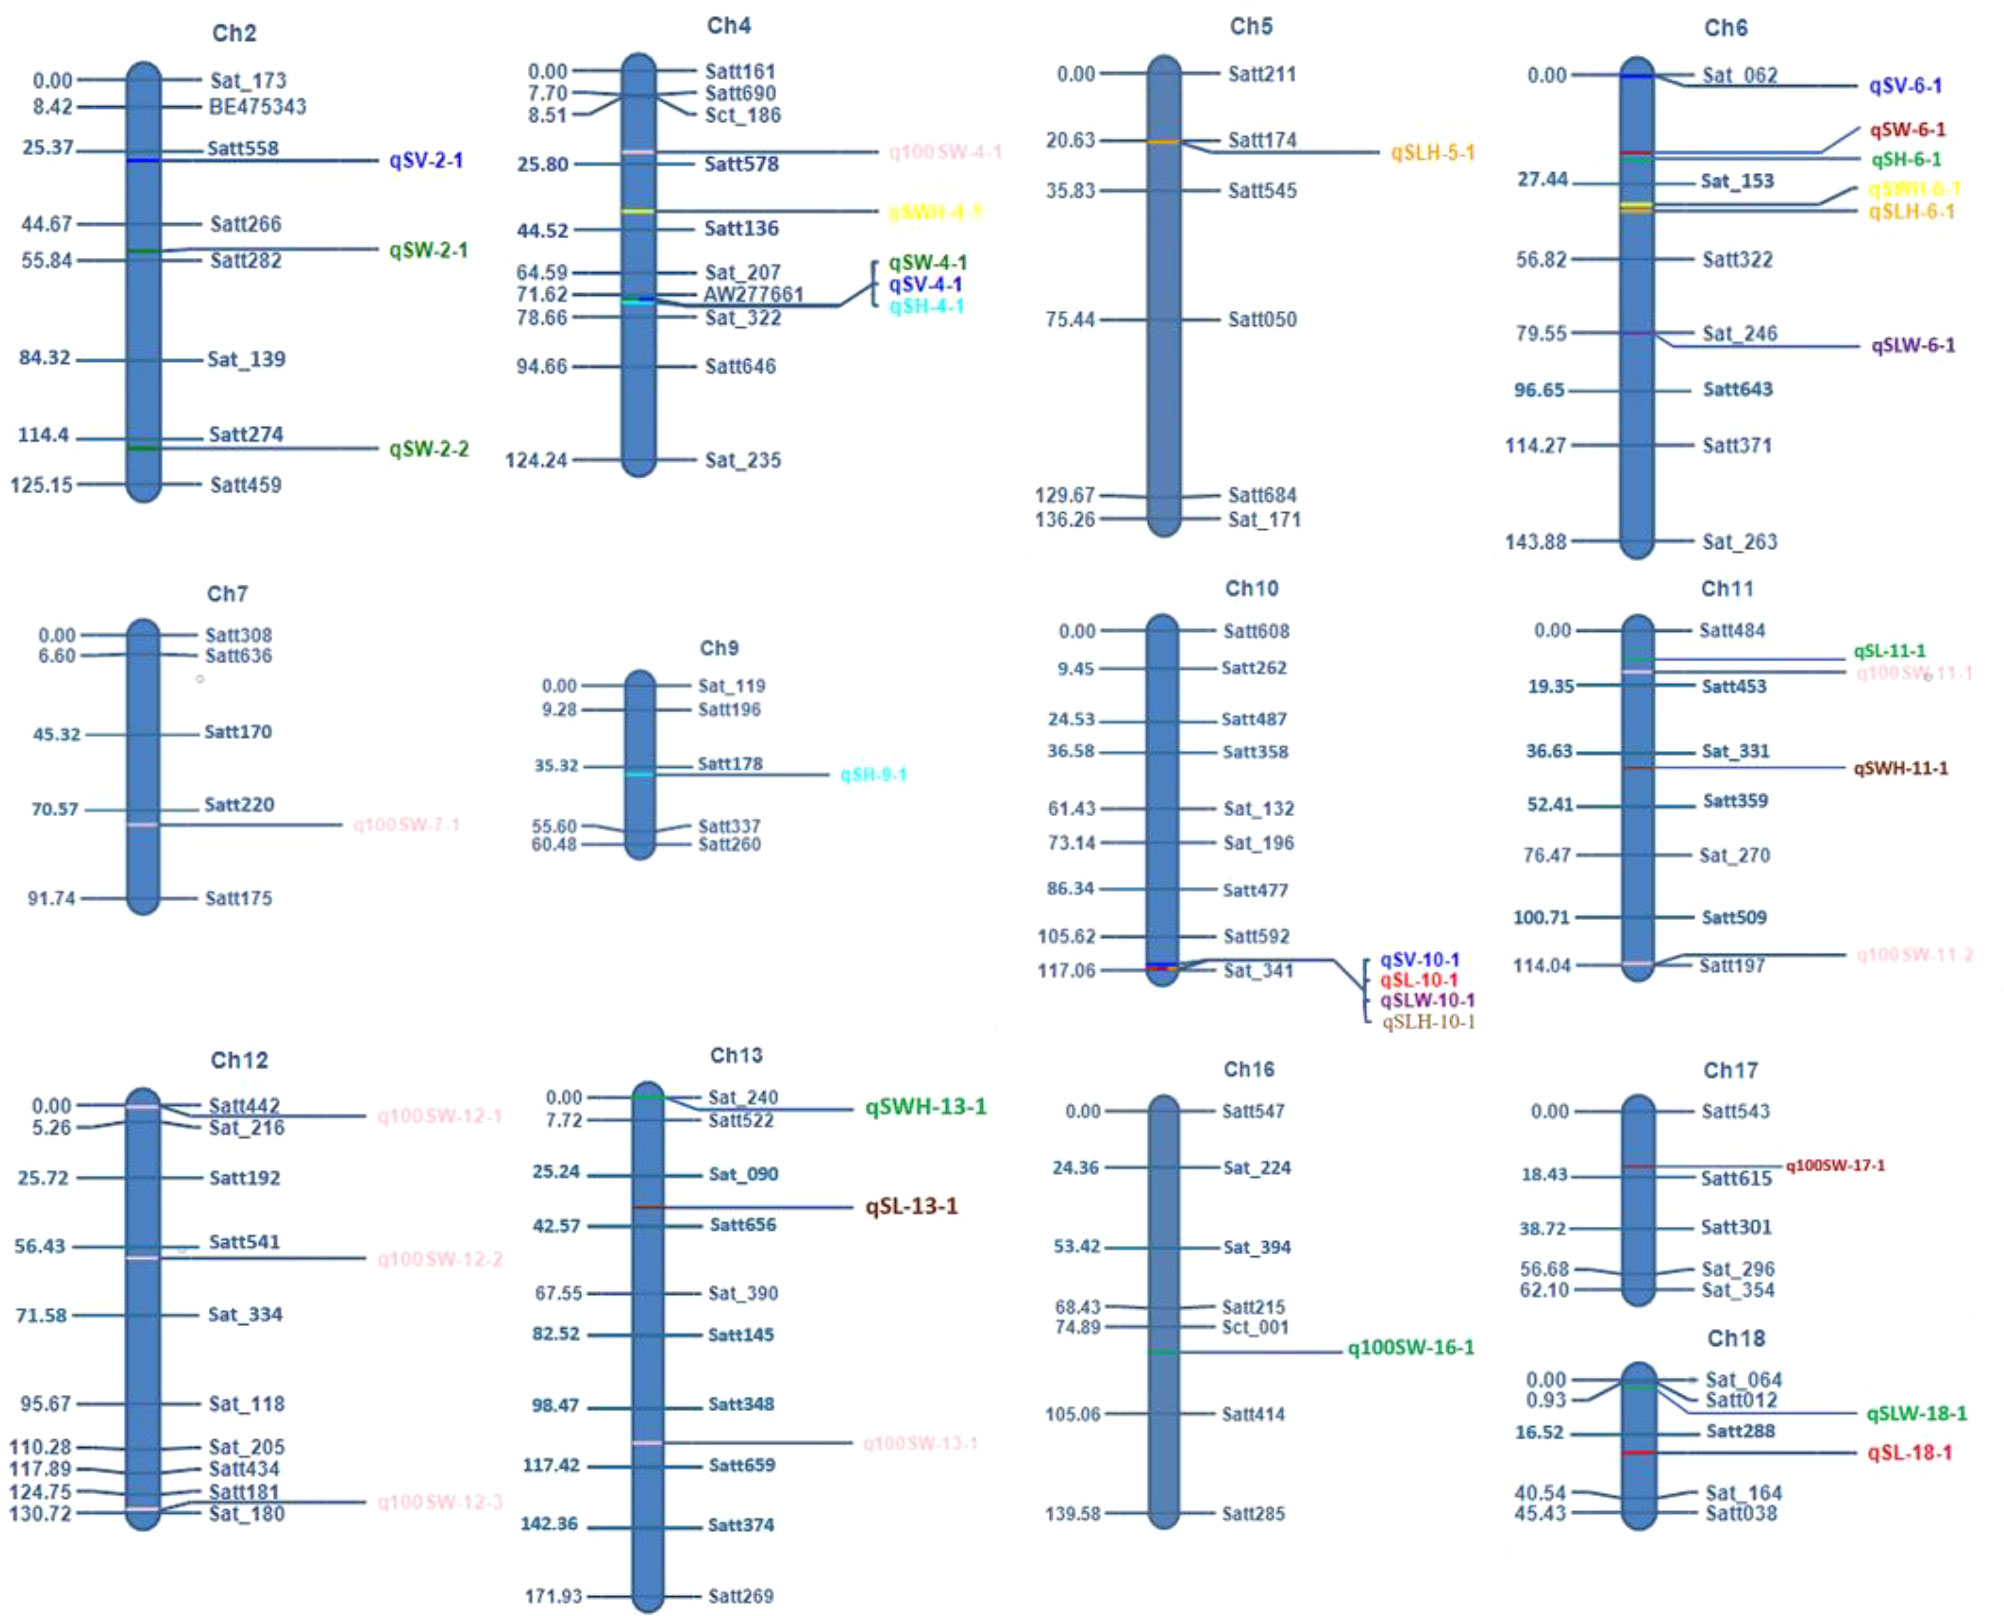
Figure 4 Mapping positions of various seed shape and 100 seed weight QTLs in this study.
For seed length, three QTLs viz., qSL-10-1, qSL-11-1, and qSL-13-1 were mapped on chromosome 10, 11, and 13, in the F2 generation plants, while two QTLs qSL-10-1 and qSL-18-1 were mapped in the F2:3 population on chromosome 10 and 18 respectively. The first major QTL qSL-10-1 on chromosome 10 was mapped in the marker interval Satt592-Sat_341 with a LOD score of 4.71 and a PVE of 13.7%. On chromosome 13, the second major QTL, qSL-13-1 was mapped in the Sat_090-Satt656 interval and had a LOD score of 3.18, and accounted for 22.84% of the phenotypic variations of seed length. On chromosome 18, the third major QTL, qSL18-1, was located in the marker region Satt288-Sat_164 Sattwith a LOD score of 2.87, accounting for 17.21% of PVE. Since the QTL qSL-10-1 was discovered in both the F2 and F2:3 populations, it was regarded as a stable QTL (Table 3). The allele contributed by the genotype SKAF 148 reduced the seed length in both the mapping populations
Four significant QTLs for seed width, designated as qSW-2-1, qSW-2-2, qSW-4-1, and qSW-6-1, were found on chromosomes 2, 4, and 6. The QTL qSW-4-1 was found to be a major effect stable QTL and was mapped in both the mapping populations (Table 3). It was mapped in the marker interval AW277661-Sat_322 on chromosome 4 with LOD score of 7.58 with a PVE value of 14.15%. The alleles from the genotype AGS 457 contributed positively to the seed width. For seed height, one QTL i.e., qSH-6-1 was mapped on F2 plants (Table 4) while two more QTLs viz., qSH-4-1 and qSH-9-1 were mapped on F2:3 populations (Table 5). Out of these, only two QTLs viz., qSH-4-1 and qSH-9-1 were major ones with PVE 17.52% and 17.28%, respectively. There was no stable QTLs found for the seed height. Similarly, for seed volume, two QTLs viz., QTLs qSV-2-1 and qSV-4-1 were mapped on the F2 population (Table 4) while four QTLs viz., QTLs qSV-2-1, qSV-4-1, qSV-6-1 and qSV-10-1 were mapped in the F2:3 population (Table 5). The QTLs viz., qSV-4-1 and qSV-6-1 appeared to be consistent QTL with higher PVE (Table 3). The alleles from SKAF148 were found to reduce the seed volume.
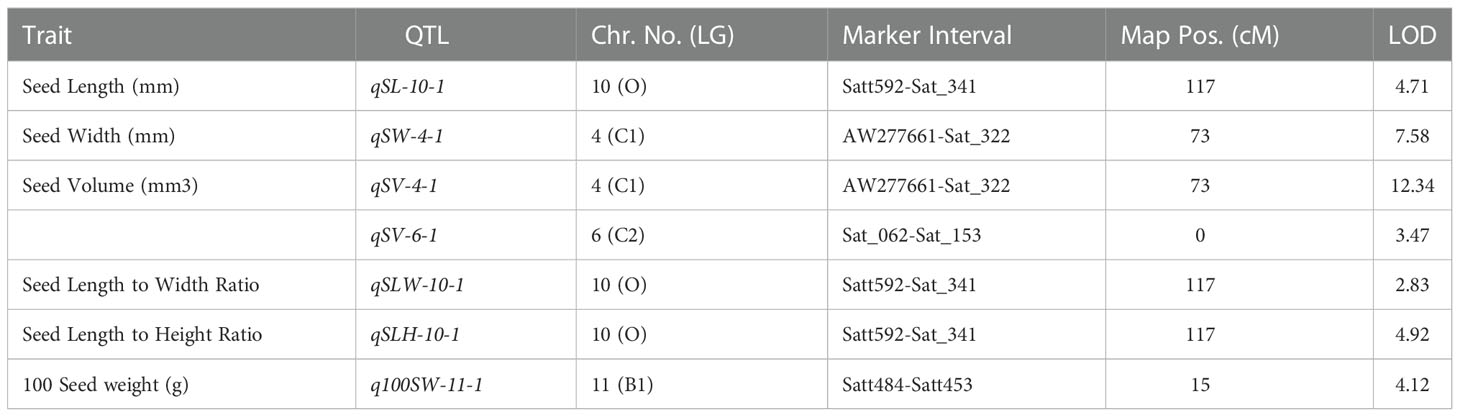
Table 3 Consistent QTLs for yield-related traits discovered in both F2 and F2:3 mapping populations derived from AGS 457 X SKAF 148.
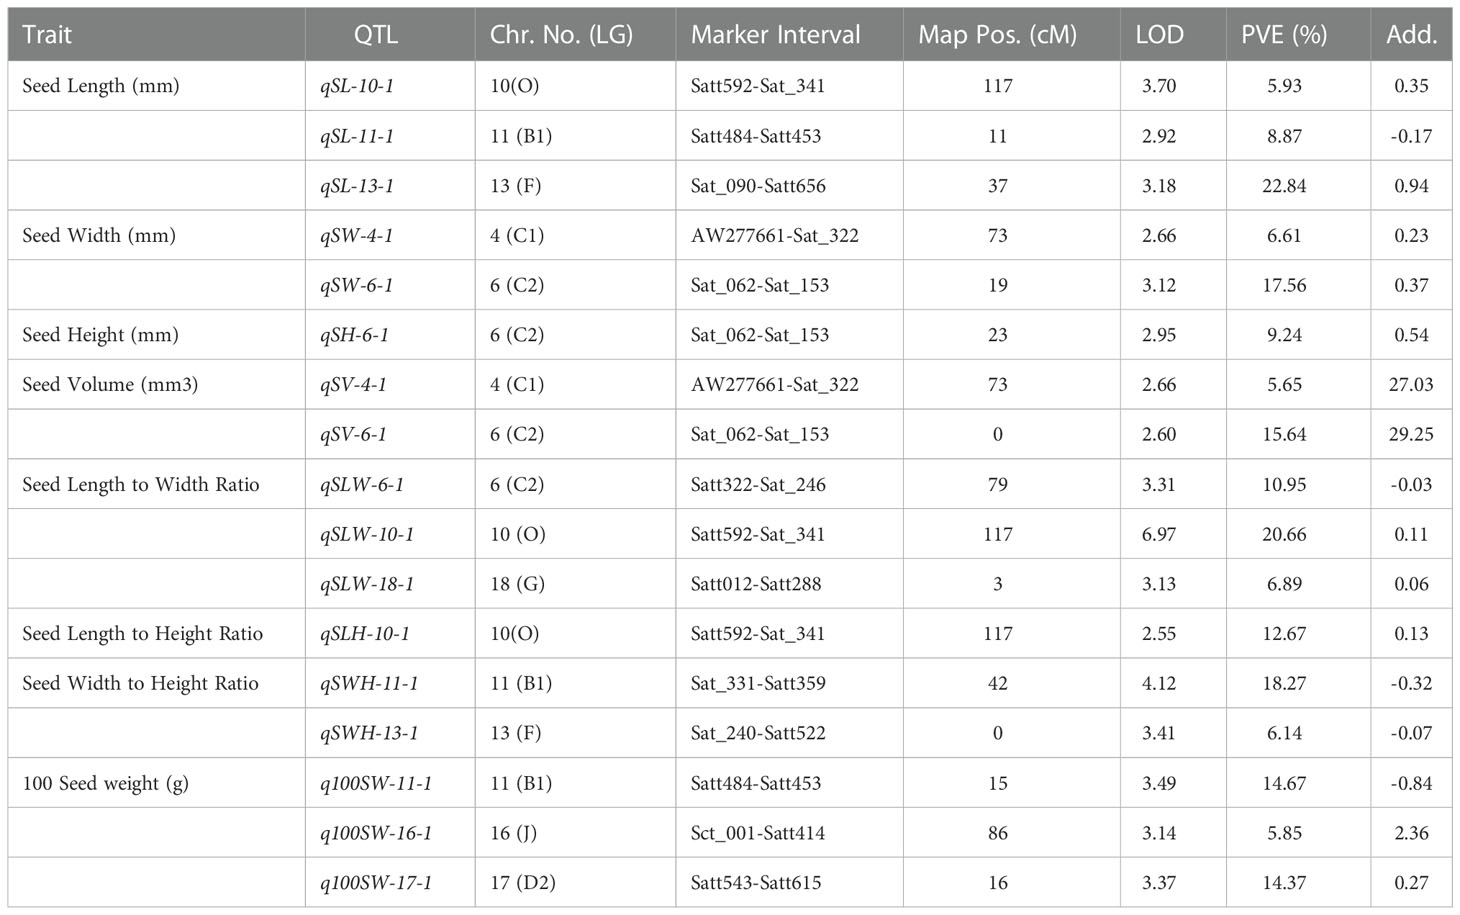
Table 4 QTLs identified for seed-related traits in the F2 mapping population derived from AGS 457 X SKAF 148.
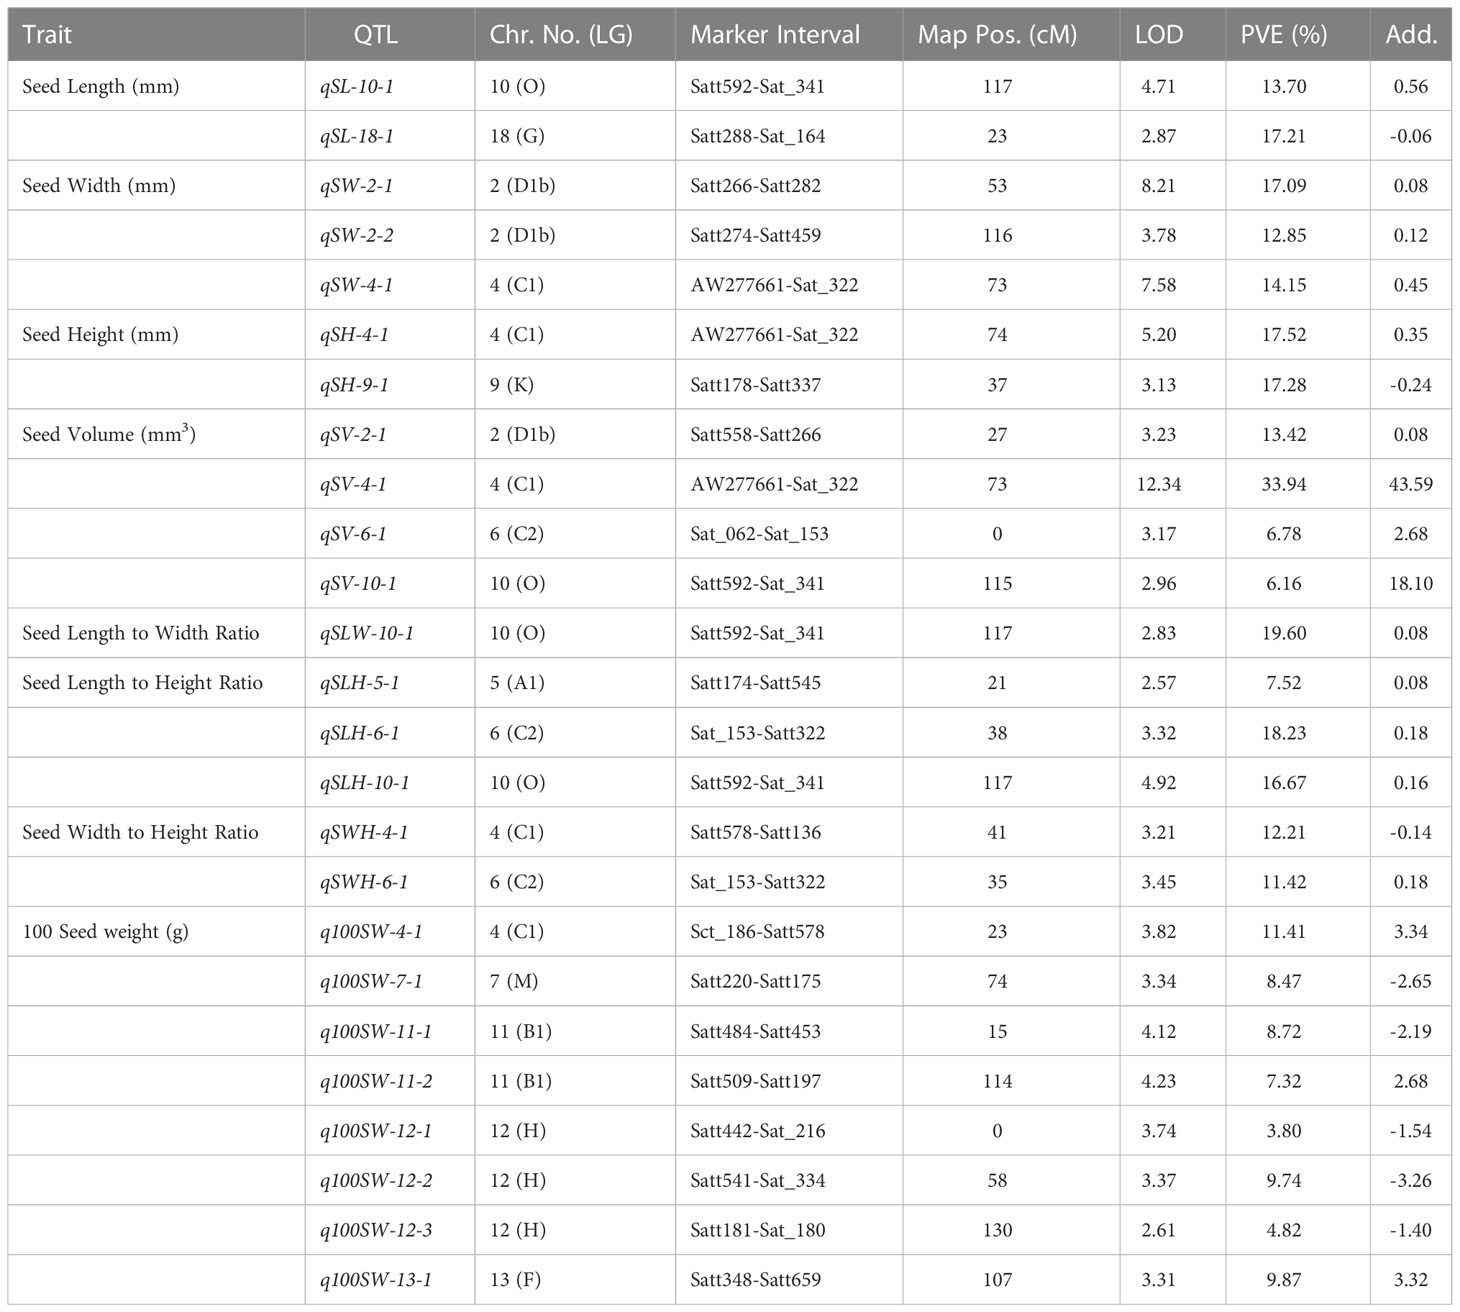
Table 5 QTLs identified for yield-related traits in the F2:3 mapping population derived from AGS 457 X SKAF 148.
An important seed trait that affects seed shape is the seed length-to-width ratio. In F2 and F2:3 populations, a total of four QTLs were mapped for this trait. Out of these, two major effects QTL viz., qSLW-6-1 and qSLW-10-1 were located on chromosomes 6 and 10 with PVE 10.95% and 19.6%, respectively. The QTL qSLW-10-1 was mapped in both generations and hence can be considered a stable one (Table 3). Similarly, four QTLs for the seed length-to-height ratio were identified. In the F2 population, one QTL qSLH-10-1 on chromosome 10 was mapped (Table 4) while in the F2:3 population, three QTLs on chromosomes 5, 6, and 10 were mapped (Table 5). qSLH-6-1 and qSLH-10-1, two significant QTLs, were located on chromosomes 6 and 10, respectively. The QTL qSLH-10-1, which appeared on both the populations in the marker interval Satt592-Sat_341, had 16.67% PVE and appeared to be a major QTL (Table 3). Similarly, for the seed width-to-height ratio, four QTLs viz., qSWH-4-1, qSWH-6-1, qSWH-11-1 and qSWH-13-1 were mapped; however, none were consistent QTL.
An important economic factor influencing soybean yield is seed weight. For 100 seed weight (100SW), eleven QTLs were mapped, of which three QTLs were mapped in the F2 population on chromosomes 11, 16, and 17 (Table 4) while eight QTLs were mapped in the F2:3 population on chromosomes 4, 7, 11, 12, and 13 (Table 5). Three major QTLs viz., q100SW-4-1, q100SW-11-1, and q100SW-17-1 had PVE 11.41%, 14.67%, 14.37%, respectively. Mapped in both F2 and F2:3 populations, QTL q100SW-11-1 at the marker interval Satt484-Satt453 which accounted for 14.67% of PVE could be regarded as a stable QTL (Table 3). The majority of the 100-seed weight QTLs in the F2 and F2:3 population showed negative additive effects with negative alleles from the parent with lower seed weight i.e., SKAF148. It is important to note that majority of the QTLs for 100 seed weight were located on chromosomes 11 and 12 suggesting the significance of these two chromosomes in regulating seed-weight inheritance.
Seed oil and protein content in soybean have a significant correlation with seed size and shape (Hacisalihoglu and Settles, 2017) as seed oil and protein content represents a major component of soybean seeds, representing 18–22% and 38–42% respectively (Wu et al., 2018). Some of the QTLs identified in this study have QTLs linkage/pleiotropy that regulate other nutritional traits. Previously, Junyi et al. (2007) and Qi et al. (2011) have identified QTLs for protein and oil content in the same region of identified QTL qSL-11-1 on chromosome 11, which is related to seed length. QTL qSH-9-1 on chromosome 9, regulating seed height in this study found consistent with the QTLs for oil and protein content reported by earlier workers (Csanadi et al., 2001; Priolli et al., 2015). Two QTLs q100SW-11-2 and q100SW-13-1 on chromosome 11 and 13 respectively regulating the weight of 100 seeds in soybean were found consistent with the QTLs for protein and oil content reported by earlier workers (Junyi et al., 2007; Qi et al., 2011). These findings indicate that seed size and shape QTLs also regulate the seed protein and oil content in soybean as soybean seeds have a major component of seed oil (18-22%) and protein content (38-42%) (Hina et al., 2020).
Based on the mapping results, we selected seven QTLs which were stable QTLs viz., qSL-10-1, qSW-4-1, qSV-4-1, qSV-6-1, qSLW-10-1, qSLH-10-1 and q100SW-11-1 for gene ontology (GO) and candidate gene prediction analysis. Within the physical genomic interval of qSL-10-1, qSW-4-1, qSV-4-1, qSV-6-1, qSLW-10-1, qSLH-10-1 and q100SW-11-1, the 62, 15, 13, 77, 58, 62, and 94 model genes were present, respectively that were downloaded from SoyBase ((http://www.soybase.org) and EnsemblPlants (https://plants.ensembl.org) (Supplementary Table 1). Phytozome 13 was used to annotate all of the genes found in each QTL region. Each of the seven stable QTLs had a higher proportion of genes associated with the cell part, cell organelle, catalytic activity, binding, metabolic process, and cellular process which demonstrates the importance of these processes in the development of soybean seeds (Karikari et al., 2019). However, we employed PANTHER analysis, gene annotation data, and literature search to discover the potential candidate genes underlying the aforementioned seven stable QTLs accountable for soybean seed size and seed shape. A set of 66 genes out of 381 model genes inside the physical regions of the seven stable QTLs were found to be potential candidate genes influencing soybean seed size and shape based on the PANTHER analysis, gene annotation, and published literature (Table 6). Out of these 66 genes, eight genes each belongs to the ubiquitin-protein ligase class, oxygenase and non-receptor serine/threonine protein kinase. Seven genes each found to be associated with amino acid transporter, DNA-binding transcription factor and glycosyltransferase. Six genes had the association for ATP-binding cassette (ABC) transporter and five genes for calmodulin-related. Seven genes as a transporter and two genes were associated with aspartic protease.
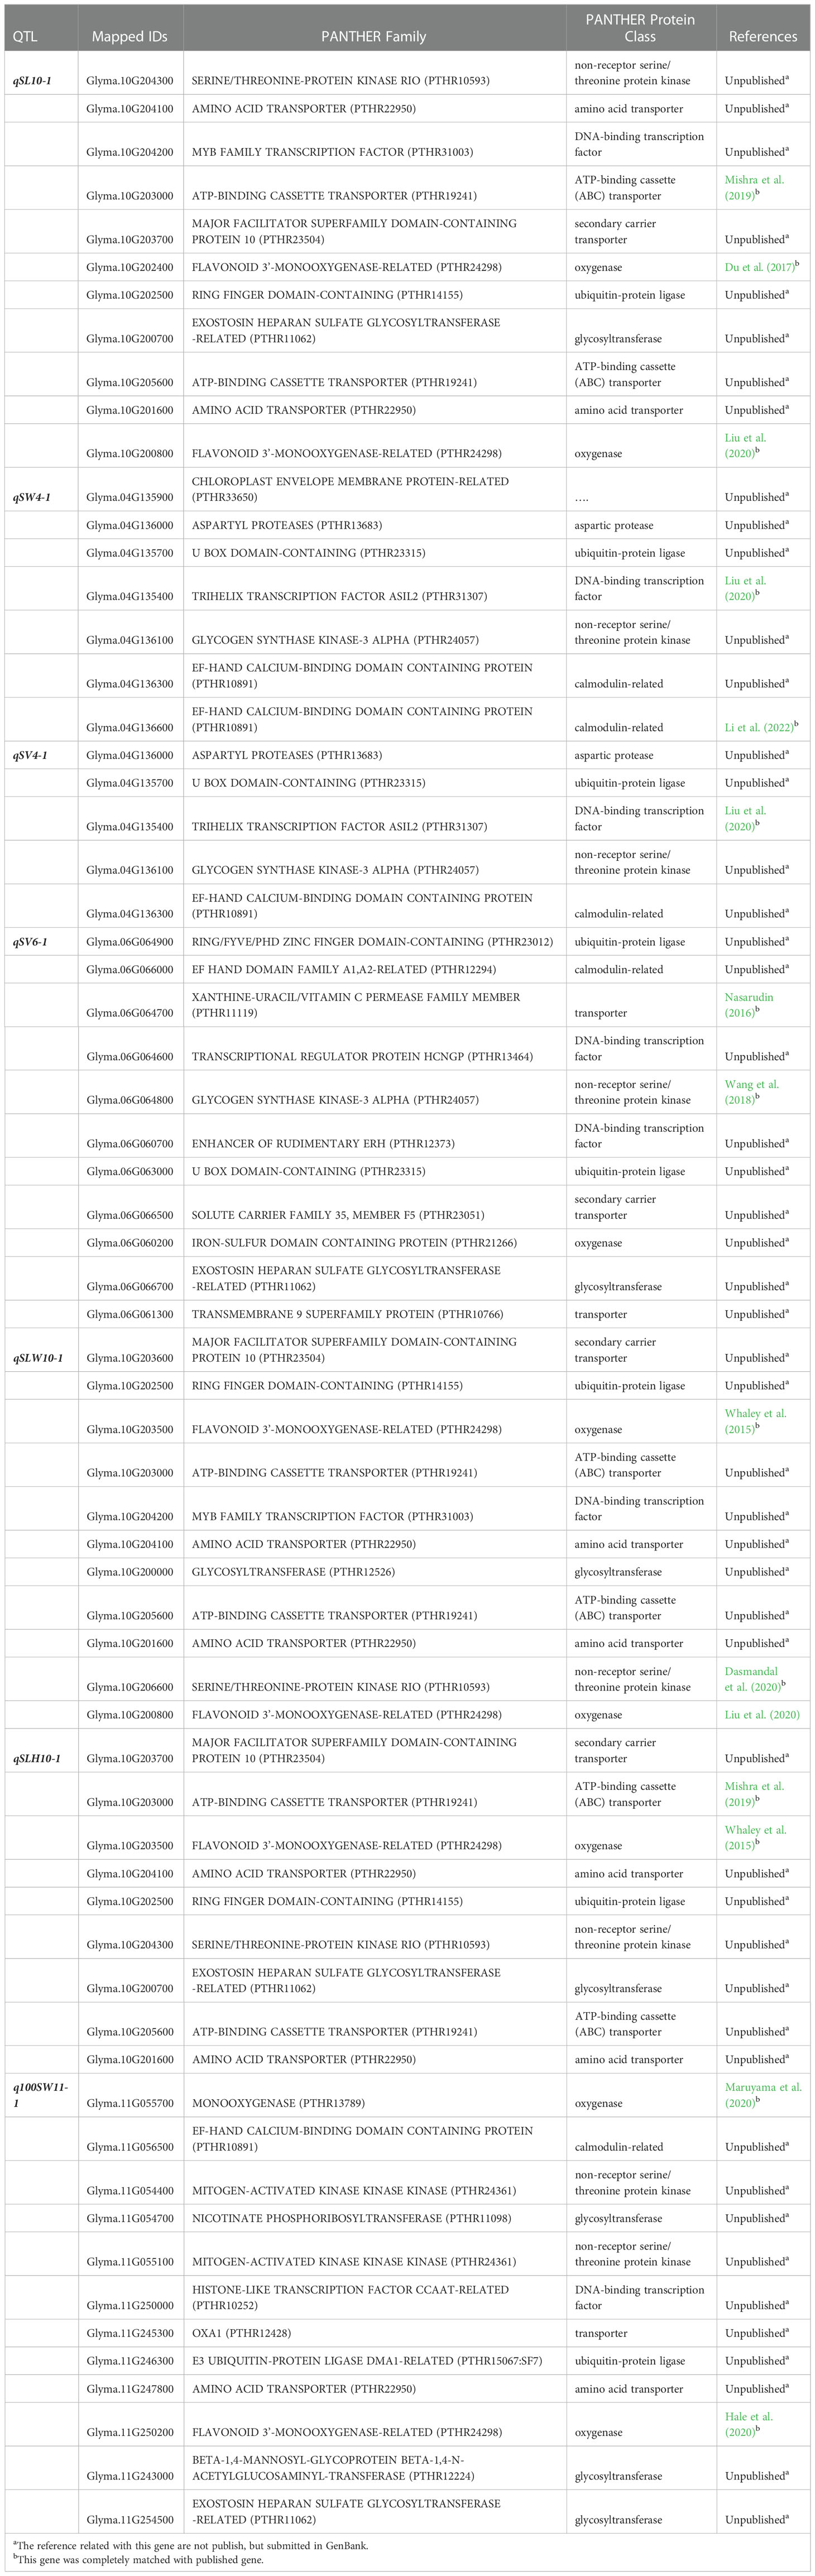
Table 6 Sixty-six possible candidate genes predicated within seven stable QTL regions identified in this study based on PANTHER analysis, gene annotation, and available literature.
PANTHER revealed that the Glyma.04G135900 gene did not encode any proteins.
The economically important traits that affect soybean production and quality include seed size and shape (Gandhi, 2009). Therefore, creating soybean cultivars with better seed sizes and shapes is thought to be a crucial goal of soybean breeding projects. To create better cultivars, it is necessary to have a detailed understanding of genetic architecture and the process behind the trait of interest. Seed size and shape are intricate quantitative features that are controlled by numerous genes and are extremely sensitive to their environment (Hina et al., 2020). Due to small-sized mapping populations and low-density genetic maps, many QTLs related to soybean seed size and shape have been reported over the past few decades but have not yet been stable and confirmed (Zhang et al., 2004; Niu et al., 2013; Kato et al., 2014; Wu et al., 2018). As a result, they cannot be inferred for breeding improved seed sizes and shapes in soybean. Therefore, the current study used F2 and F2:3 mapping populations derived from the cross of vegetable (AGS 457) and seed type (SKAF 148) soybean, evaluated in the 2020 and 2021 growing seasons at the Indian Agricultural Research Institute, New Delhi, India in order to find stable significant QTLs and potential candidate genes for soybean seed size and shape traits.
An essential economic trait influencing soybean yield is seed shape and seed weight. Therefore, the breeders have been pursuing to develop varieties with desirable seed shapes and seed weights with an eventual higher yield. However, like yield, seed shape and seed weight are also polygenic traits controlled by numerous genes and hence hard to manage effectively through conventional approaches. Despite the fact that many QTLs relating to soybean seed weight, size, and shape have been reported over the past few decades, most of these QTLs remained unutilized owing to their unstable or unconfirmed performances in other genetic backgrounds. Therefore, the current study targeted discovering QTLs in one generation of the population (F2) and confirm it in another generation (F2:3) for reliability and applicability of the QTLs in the breeding program. Genetic diversity between the parental genotypes is essential for mapping QTL, the wider the better. The genotypes used in this study i.e., AGS457 and SKAF148 differed significantly for the seed shape and seed weight traits. It caused the mapping populations to become extremely variable, which allowed for the mapping of multiple novel QTLs.
Additionally, the variability in the F2 population facilitated recombination among the alleles resulting in the recovery of transgressive segregants. Li et al. (2008) and Zhang et al. (2010) also reported the appearance of transgressive segregants in segregating populations of soybean. The ability to select one trait through another is provided by the correlation among the target traits. In this study, a strong association was found between the characteristics linked to seed shape and seed weight. The wider range and higher value of the correlation coefficients (-0.05 to 0.75) indicated their strength of association. A substantial positive association was found between seed length and seed width, seed volume, seed length to width ratio, seed length to height ratio, seed width to height ratio, and seed weight (Li et al., 2020). Similarly, seed width had a strong positive relationship with seed length, height, volume, and weight, while there was no statistically significant relationship between seed height and 100 seed weight which is consistent with those in Xie et al. (2014). These findings demonstrated the significance of seed length and width in defining the shape of the soybean seed and overall yield.
Seed weight and seed shape are complex traits and a host of loci are involved in genetic control of them (Liang et al., 2016; Khosla et al., 2020). The normal distribution of the traits in the segregating generations and the number of QTLs mapped for it support the concept of multi-genic control of these traits. In this study, 42 QTLs for seed shape and seed weight-related traits were mapped in F2 (17 QTLs) and F2:3 (25 QTLs) populations. Seven out of the 42 QTLs were mapped in both generations and hence can be regarded as stable QTLs. Similarly, 13 of the 42 QTLs detected in the current study matched with the previously reported QTLs, while the remaining 29 were reported for the first time i.e., novel. Out of these 29 novel QTLs, 17 appeared to be major QTLs with PVE of more than 10%. Out of the five QTLs for seed length mapped here, one QTL i.e., qSL-10-1 was a major effect and stable QTL (13.7% PVE) and would be suitable for deployment in the breeding program. Similarly, qSW-4-1 was a stable QTL for seed width. The qSW-4-1 along with three other QTLs of seed width viz., qSW-2-1, qSW-2-2, and qSW-6-1 corresponded to similar QTLs reported by Salas et al. (2006); Xu et al. (2011); Niu et al. (2013) and Yu et al. (2018). The QTLs qSW-6-1 and qSW-2-1 had PVE 17.56% and 17.09%, respectively and fit to deploy for improvement of seed width. Similarly, two QTLs for seed height viz., qSH-4-1 and qSH-6-1 correspond to the similar QTLs reported by Niu et al. (2013) and Yu et al. (2018) respectively. However, QTL qSH-9-1 accounted for 17.28% of phenotypic variance and was a novel QTL for seed height.
For seed volume, six novel QTLs were mapped on chromosomes 2, 4, 6, and 10, of which, QTL qSV-4-1 with PVE 33.94% was a major one and fit for deployment in the breeding program. The parental genotypes, AGS457 and SKAF had seed volumes of 412.42 mm3 and 127.31 mm3, respectively. This huge difference in seed volume in the parental genotypes supported the discovery of multiple novel QTLs for seed volume. The ratio of seed length to width (SLW) is crucial in determining the shape of the seed. One out of the four QTLs for SLW i.e., qSLW-10-1 was located in the marker region Satt592-Sat_341 and accounted for 19.6% of PVE. The positive alleles from the genotype AGS 457 contributed to the positive additive effect of this QTL. The seed width-to-height ratio (SWH) and seed length-to-height ratio (SLH) had four QTLs each. Two of the four QTLs for seed width to height ratio i.e., qSWH-4-1 and qSWH-6-1 were novel and major and suitable for deployment in the breeding program. The remaining QTLs for SLH and SWH are the same as reported earlier by Yang et al. (2013) and Rathod et al. (2019). Seed size is an important trait for adaptation to a certain environment. It also determines the overall yield of soybean (Tao et al., 2017). In this study, 11 QTLs were mapped for seed size i.e., 100-seed weight, out of which eight were novel and the rest corresponded to those reported earlier by Xu et al. (2011), Niu et al. (2013) and Liu et al. (2018). The huge difference in seed size of the parental genotypes contributed towards the mapping of several QTLs for seed size. There was one stable QTL for seed size i.e., q100SW-11-1, and deserves further confirmation and deployment. Some of the seed size and shape QTLs viz qSL-11-1, qSH-9-1, q100SW-11-2, qSLH-5-1, qSWH-11-1, qSWH-13-1 and q100SW-13-1 were found consistent with the QTLs for oil and protein content in soybean reported by earlier workers (Csanadi et al., 2001; Junyi et al., 2007; Qi et al., 2011; Priolli et al., 2015). These findings indicate that these seed size and shape QTLs regions showed QTLs linkage/pleiotropy which regulates other nutritional traits viz. seed protein and oil content in soybean (Hina et al., 2020).
Identification of the actual candidate gene that lies beneath the QTL region is crucial for improving the target trait through through breeding approach. In this study, using information from the available literature, gene annotation, and bioinformatics tools, potential candidate genes for soybean seed shape and 100-seed weight were identified. The seven stable QTLs identified in this study viz., qSL-10-1, qSW-4-1, qSV-4-1, qSV-6-1, qSLW-10-1, qSLH-10-1, and q100SW-11-1 were used for this purpose. Out of the 381 model genes extracted from the physical genomic interval of the seven stable QTLs, 66 were considered as potential candidate genes as per PANTHER analysis, gene function, and available literature (Karikari et al., 2019). The candidate genes are primarily associated with cell components, catalytic activity, transportation, metabolic, and cellular processes, all of which are crucial for seed development (Fan et al., 2006; Li and Li, 2014). For instance, the oxygenase protein class includes the genes Glyma.10G202400, Glyma.10G200800, Glyma.06G060200, Glyma.10G203500, and Glyma.11G055700, which are associated with the QTLs qSL-10-1, qSV-6-1, qSLW-10-1, qSLH-10-1 and q100SW-11-1. These genes affect soybean seed size (Zhao et al., 2016). Similar to this, members of the protein family E3 ubiquitin-protein ligase are involved in the ubiquitin-proteasome pathway. The E3 ubiquitin-protein ligase genes Glyma.10G202500, Glyma.04G135700, Glyma.06G064900, and Glyma.06G063000, were identified here as potential candidate genes. Members of this protein family include genes for GW2 in rice (Choi et al., 2018), TaGW2 in wheat (Lv et al., 2022), and ZmGW2 in maize (Kong et al., 2014), all of which have been reported to have a significant impact on seed development (Ge et al., 2016; Lv et al., 2022).
The link between the source (leaf) and sink (seed) regulates seed development in plants (Snyder, 1993). Therefore, the genes Glyma.10G204100, Glyma.10G201600, Glyma.11G247800, Glyma.10G203000, Glyma.10G205600 and Glyma.06G064700 from the amino acid transporter and ATP-binding cassette (ABC) transporter are plausible candidate genes for seed shape and seed weight in soybean (Li et al., 2019). Since a calmodulin-like domain protein kinase is necessary for storage product accumulation during seed development in rice (Asano et al., 2002), genes Glyma.04G136300, Glyma.04G136600 Glyma.06G066000 and Glyma.11G056500 were suspected of being involved in soybean seed development. Serine/threonine protein kinase is involved in ABA signaling, and is crucial for the regulation of seed growth and dormancy. Therefore, the non-receptor serine/threonine protein kinase genes Glyma.10G204300, Glyma.04G136100, Glyma.06G064800, Glyma.10G206600, Glyma.11G054400, and Glyma.11G055100 can be potential candidate genes influencing soybean seed development. Candidate genes discovered in this study are involved directly or indirectly in regulating seed development, as well as seed size and shape, such as cell component, storage of proteins and lipids, transport, metabolic process, signal transduction of plant hormones, degradation of the ubiquitin-proteasome pathway, and fatty acid beta-oxidation (Table 6). Hence, based on the gene function, GO, and literature search, the above 66 genes were considered as the most potentially possible candidate genes for regulating the seed sizes and shapes in soybeans. With the help of these findings, strategies for increasing soybean yield can be developed by comprehending functional networks. Important genetic resources for soybean are made available by the markers and candidate genes discovered in this study. Lastly, the major and stable QTLs identified in the present study ought to be mapped finely for the identification of tightly linked markers for effective molecular breeding towards improving seed shape, seed weight, and yield of soybean.
The present study used vegetable and seed soybean-derived F2 and F2:3 mapping populations to detect QTLs as well as mine possible candidate genes controlling seed shape and 100-seed weight in soybean. This study has identified a total of 42 QTLs for seed shape and 100 seed weight out of which 29 were novel. In addition, seven out of 42 QTLs were stable QTLs identified in both F2 and F2:3 mapping populations and five of them were major ones viz., qSL-10-1, qSW-4-1, qSV-4-1, qSLW-10-1 and qSLH-10-1. In total, 66 possible candidate genes were mined within the seven stable QTLs and most of them belonged to ubiquitin-protein ligase and oxygenase that have been earlier reported to play significant roles in seed/organ size development and regulation. Our study provides the major and stable QTLs and candidate genes regulating seed shape and 100 seed weight in soybean, and these findings will be of great use for marker-assisted breeding (MAB) of soybean varieties with improved seed-weight and desired seed shape.
The original contributions presented in the study are included in the article/Supplementary Material. Further inquiries can be directed to the corresponding author.
RK, RP, KG, SL and AT conceived and designed the experiments. MS, MT, PD, RM, AyR, DS and AmR assisted the experiments. RK, MS and AT analyzed the data. RK and AT drafted and revised the manuscript. All authors have read and agreed to the current version of the manuscript.
This work was supported by the internal funding of the Indian Agricultural Research Institute, New Delhi.
The authors declare that the research was conducted in the absence of any commercial or financial relationships that could be construed as a potential conflict of interest.
All claims expressed in this article are solely those of the authors and do not necessarily represent those of their affiliated organizations, or those of the publisher, the editors and the reviewers. Any product that may be evaluated in this article, or claim that may be made by its manufacturer, is not guaranteed or endorsed by the publisher.
The Supplementary Material for this article can be found online at: https://www.frontiersin.org/articles/10.3389/fpls.2022.1074245/full#supplementary-material
Asano, T., Kunieda, N., Omura, Y., Ibe, H., Kawasaki, T., Takano, M., et al. (2002). Rice SPK, a calmodulin-like domain protein kinase, is required for storage product accumulation during seed development: Phosphorylation of sucrose synthase is a possible factor. Plant Cell 14 (3), 619–628. doi: 10.1105/tpc.010454
Borrell, A. K., van Oosterom, E. J., Mullet, J. E., George-Jaeggli, B., Jordan, D. R., Klein, P. E. (2014). Stay-green alleles individually enhance grain yield in sorghum under drought by modifying canopy development and water uptake patterns. New Phytol. 203, 817–830. doi: 10.1111/nph.12869
Choi, B. S., Kim, Y. J., Markkandan, K., Koo, Y. J., Song, J. T., Seo, H. S. (2018). GW2 functions as an E3 ubiquitin ligase for rice expansin-like 1. Int. J. Mol. Sci. 19 (7), 1904. doi: 10.3390/ijms19071904
Csanádi, G. Y., Vollmann, J., Stift, G., Lelley, T. (2001). Seed quality QTLs identified in a molecular map of early maturing soybean. Theoretical and Applied Genetics 103 (6), 912–919.
Cui, Z., James, A. T., Miyazaki, S., Wilson, R. F., Carter, T. (2004). Breeding specialty soybeans for traditional and new soyfoods (Champaign, IL, USA: AOSC Press), 274–332.
Dasmandal, T., Rao, A. R., Sahu, S. (2020). Identification and characterization of circular RNAs regulating genes responsible for drought stress tolerance in chickpea and soybean. Indian J. Genet. Plant Breed. 80 (01), 1–8. doi: 10.31742/IJGPB.80.1.1
Du, J., Wang, S., He, C., Zhou, B., Ruan, Y. L., Shou, H. (2017). Identification of regulatory networks and hub genes controlling soybean seed set and size using RNA sequencing analysis. J. Exp. Bot. 68 (8), 1955–1972. doi: 10.1093/jxb/erw460
Egli, D. B. (2008). Comparison of corn and soybean yields in the united states: Historical trends and future prospects. Agron. J. 100, S–79. doi: 10.2134/agronj2006.0286c
Fan, C., Xing, Y., Mao, H., Lu, T., Han, B., Xu, C., et al. (2006). GS3, a major QTL for grain length and weight and minor QTL for grain width and thickness in rice, encodes a putative transmembrane protein. Theor. Appl. Genet. 112 (6), 1164–1171. doi: 10.1007/s00122-006-0218-1
Ge, L., Yu, J., Wang, H., Luth, D., Bai, G., Wang, K., et al. (2016). Increasing seed size and quality by manipulating BIG SEEDS1 in legume species. Proc. Natl. Acad. Sci. 113 (44), 12414–12419. doi: 10.1073/pnas.1611763113
Hacisalihoglu, G., Settles, A. M. (2017). Quantification of seed ionome variation in 90 diverse soybean (Glycine max) lines. J. Plant Nutr. 40, 2808–2817. doi: 10.1080/01904167.2017.1382528
Hale, B., Phipps, C., Rao, N., Wijeratne, A., Phillips, G. C. (2020). Differential expression profiling reveals stress-induced cell fate divergence in soybean microspores. Plants 9 (11), 1510. doi: 10.3390/plants9111510
Hina, A., Cao, Y., Song, S., Li, S., Sharmin, R. A., Elattar, M. A., et al. (2020). High-resolution mapping in two RIL populations refines major “QTL hotspot” regions for seed size and shape in soybean (Glycine max L.). Int. J. Mol. Sci. 21 (3), 1040. doi: 10.3390/ijms21031040
Hoeck, J. A., Fehr, W. R., Shoemaker, R. C., Welke, G. A., Johnson, S. L., Cianzio, S. R. (2003). Molecular marker analysis of seed size in soybean. Crop Sci. 43 (1), 68–74. doi: 10.2135/cropsci2003.0068
Junyi, G., Wang, Y., Wu, X., Chen, S. (2007). A comparative study on segregation analysis and QTL mapping of quantitative traits in plants—with a case in soybean. Frontiers of Agriculture in China 1 (1), 1–7.
Karikari, B., Chen, S., Xiao, Y., Chang, F., Zhou, Y., Kong, J., et al. (2019). Utilization of interspecific high-density genetic map of RIL population for the QTL detection and candidate gene mining for 100-seed weight in soybean. Front. Plant Sci. 10, 1001. doi: 10.3389/fpls.2019.01001
Kato, S., Sayama, T., Fujii, K., Yumoto, S., Kono, Y., Hwang, T. Y., et al. (2014). A major and stable QTL associated with seed weight in soybean across multiple environments and genetic backgrounds. Theoretical and applied genetics 127 (6), 1365–1374.
Khosla, G., Gill, B. S., Sirari, A., Sharma, P., Dhaliwal, I. (2020). Identifying QTL for seed weight in a cross between vegetable and grain type soybeans. Indian J. Genet. Plant Breed. 80 (04), 475–479. doi: 10.31742/IJGPB.80.4.15
Kong, M., Li, C., Sun, Q., Lu, M., Wang, W., Pan, J., et al. (2014). Isolation and expression analysis of the E3 ubiquitin ligase encoding gene ZmGW2-1 in maize. J. Anhui Agric. Univ. 41 (6), 1004–1011.
Kosambi, D. D. (1944). The estimation of map distance from recombination values. Ann. Eugen. 12, 172–175.
Kumar, R., Mahto, R. K., Kumar, R., Saini, M., Talukdar, A. (2022). Development of seed shape software ‘SEEDFIG’ and study of seed size and seed shape traits in soybean (Glycine max [L.] Merr.). The Pharma Innovation J. 11 (10), 1547–1550.
Liang, H., Xu, L., Yu, Y., Yang, H., Dong, W., Zhang, H. (2016). Identification of QTLs with main, epistatic and QTL by environment interaction effects for seed shape and hundred-seed weight in soybean across multiple years. J. Genet. 95 (2), 475–477. doi: 10.1007/s12041-016-0648-8
Li, M., Chen, L., Zeng, J., Razzaq, M. K., Xu, X., Xu, Y., et al. (2020). Identification of additive–epistatic QTLs conferring seed traits in soybean using recombinant inbred lines. Front. Plant Sci. 11, 566056. doi: 10.3389/fpls.2020.566056
Li, N., Li, Y. (2014). Ubiquitin-mediated control of seed size in plants. Front. Plant Sci. 5, 332. doi: 10.3389/fpls.2014.00332
Li, X., Liu, X., Gu, M., Pi, B., Sun, S., Zhao, T., et al. (2022). Overexpression of GsCNGC20-f from glycine soja confers submergence tolerance to hairy-root composite soybean plants and arabidopsis seedlings by enhancing anaerobic respiration. Environ. Exp. Bot. 199, 104901. doi: 10.1016/j.envexpbot.2022.104901
Liu, D., Li, M., Liu, Y., Shi, L. (2020). Integration of the metabolome and transcriptome reveals the resistance mechanism to low nitrogen in wild soybean seedling roots. Environ. Exp. Bot. 175, 104043. doi: 10.1016/j.envexpbot.2020.104043
Liu, D., Yan, Y., Fujita, Y., Xu, D. (2018). Identification and validation of QTLs for 100-seed weight using chromosome segment substitution lines in soybean. Breed. Sci. 68 (4), 442–448. doi: 10.1270/jsbbs.17127
Liu, W., Zhang, Y., Li, W., Lin, Y., Wang, C., Xu, R., et al. (2020). Genome-wide characterization and expression analysis of soybean trihelix gene family. PeerJ 8, e8753. doi: 10.7717/peerj.8753
Li, N., Xu, R., Li, Y. (2019). Molecular networks of seed size control in plants. Annu. Rev. Plant Biol. 70, 435–463. doi: 10.1146/annurev-arplant-050718-095851
Li, W., Zheng, D. H., Van, K. J., Lee, S. H. (2008). QTL mapping for major agronomic traits across two years in soybean (Glycine max L. merr.). J. Crop Sci. Biotechnol. 11 (3), 171–176.
Lodhi, M. A., Ye, G. N., Weeden, N. F., Reisch, B. I. (1994). A simple and efficient method for DNA extraction from grapevine cultivars andVitis species. Plant Molecular Biology Reporter 12 (1), 6–13.
Lü, H. Y., Liu, X. F., Wei, S. P., Zhang, Y. M. (2011). Epistatic association mapping in homozygous crop cultivars. PloS One 6 (3), e17773. doi: 10.1371/journal.pone.0017773
Lv, Q., Li, L., Meng, Y., Sun, H., Chen, L., Wang, B., et al. (2022). Wheat E3 ubiquitin ligase TaGW2-6A degrades TaAGPS to affect seed size. Plant Sci. 320, 111274. doi: 10.1016/j.plantsci.2022.111274
Manga, V. K., Yadav, O. P. (1995). Effect of seed size on development traits and ability to tolerate drought in pearl millet. J. Arid Environ. 29, 169–172. doi: 10.1016/S0140-1963(05)80087-4
Maruyama, K., Urano, K., Kusano, M., Sakurai, T., Takasaki, H., Kishimoto, M., et al. (2020). Metabolite/phytohormone–gene regulatory networks in soybean organs under dehydration conditions revealed by integration analysis. Plant J. 103 (1), 197–211. doi: 10.1111/tpj.14719
Mian, M. A. R., Bailey, M. A., Tamulonis, J. P., Shipe, E. R., Carter, T. E., Parrott, W. A., et al. (1996). Molecular markers associated with seed weight in two soybean populations. Theor. Appl. Genet. 93 (7), 1011–1016. doi: 10.1007/BF00230118
Mishra, A. K., Choi, J., Rabbee, M. F., Baek, K. H. (2019). In silico genome-wide analysis of the ATP-binding cassette transporter gene family in soybean (Glycine max L.) and their expression profiling. BioMed. Res. Int. 2019. doi: 10.1155/2019/8150523
Nasarudin, N. S. (2016). Genome-wide association mapping of temperature response in agronomically important traits of soybean. Master thesis. University of Illinois at Urbana-Champaign.
Niu, Y., Xu, Y., Liu, X. F., Yang, S. X., Wei, S. P., Xie, F. T., et al. (2013). Association mapping for seed size and shape traits in soybean cultivars. Mol. Breed. 31 (4), 785–794. doi: 10.1007/s11032-012-9833-5
Priolli, R. H.G., Campos, J. B., Stabellini, N. S., Pinheiro, J. B., Vello, N. A. (2015). Association mapping of oil content and fatty acid components in soybean. Euphytica 203 (1), 83–96.
Qi, Z. M., Wu, Q., Han, X., Sun, Y. N., Du, X. Y., Liu, C. Y., et al (2011). Soybean oil content QTL mapping and integrating with meta-analysis method for mining genes. Euphytica 179 (3), 499–514.
R Core Team (2013) R: A language and environment for statistical computing. R Foundation for Statistical Computing, Vienna, Austria. Available at: http://www.R-project.org/.
Rajendran, A., Lal, S. K., Raju, D., Ramlal, A. (2022). Associations of direct and indirect selection for pregermination anaerobic stress tolerance in soybean (Glycine max). Plant Breed. 141 (5), 634–643. doi: 10.1111/pbr.13048
Ramlal, A., Nautiyal, A., Baweja, P., Mahto, R. K., Mehta, S., Mallikarunja, B. P., et al. (2022a). Harnessing heterosis and male sterility in soybean [Glycine max (L.) merrill]: A critical revisit. Front. Plant Sci. 13. doi: 10.3389/fpls.2022.981768
Ramlal, A., Nautiyal, A., Baweja, P., Kumar, V., Mehta, S., Mahto, R. K., et al. (2022b). Angiotensin-converting enzyme inhibitory peptides and isoflavonoids from soybean [Glycine max (L.) Merr.]. Front. Nutri. 9, 1068388. doi: 10.3389/fnut.2022.1068388
Rathod, D. R., Chandra, S., Kumar, A., Yadav, R. R., Talukdar, A. (2019). Deploying inter-specific recombinant inbred lines to map QTLs for yield-related traits in soybean. Indian J. Genet. Plant Breed. 79 (04), 693–703. doi: 10.31742/IJGPB.79.4.7
Salas, P., Oyarzo-Llaipen, J. C., Wang, D., Chase, K., Mansur, L. (2006). Genetic mapping of seed shape in three populations of recombinant inbred lines of soybean (Glycine max L. merr.). Theor. Appl. Genet. 113 (8), 1459–1466. doi: 10.1007/s00122-006-0392-1
Schnyder, H. (1993). The role of carbohydrate storage and redistribution in the source-sink relations of wheat and barley during grain filling–a review. New Phytol. 123 (2), 233–245. doi: 10.1111/j.1469-8137.1993.tb03731.x
Snyder, H. E. (1993). Soya Beans: The Crop. Encyclopedia of Food Science and Technology and Nutrition. Vol. 16 Eds. In: Macrae, R., Robinson, R. K., Sadler, M. J. (London: Academic Press), pp. 4215–4218
Song, Q. J., Marek, L. F., Shoemaker, R. C., Lark, K. G., Concibido, V. C., Delannay, X., et al. (2004). A new integrated genetic linkage map of the soybean. Theor. Appl. Genet. 109 (1), 122–128. doi: 10.1007/s00122-004-1602-3
SoyStats (2021). Retrieved from http://soystats.com/ (Accessed on October 1, 2022).
Tao, Y., Mace, E. S., Tai, S., Cruickshank, A., Campbell, B. C., Zhao, X., et al. (2017). Whole-genome analysis of candidate genes associated with seed size and weight in sorghum bicolor reveals signatures of artificial selection and insights into parallel domestication in cereal crops. Front. Plant Sci. 8, 1237. doi: 10.3389/fpls.2017.01237
Wang, D., Bales-Arcelo, C., Zhang, Z., Gu, C., DiFonzo, C. D., Zhang, G., et al. (2019). U.S. Patent 10,253,329.
Wang, L. S., Chen, Q. S., Xin, D. W., Qi, Z. M., Zhang, C., Li, S. N., et al. (2018). Overexpression of GmBIN2, a soybean glycogen synthase kinase 3 gene, enhances tolerance to salt and drought in transgenic arabidopsis and soybean hairy roots. J. Integr. Agric. 17 (9), 1959–1971. doi: 10.1016/S2095-3119(17)61863-X
Westoby, M., Jurado, E., Leishman, M. (1992). Comparative evolutionary ecology of seed size. Trends Ecol. Evol. 7, 368–372. doi: 10.1016/0169-5347(92)90006-W
Whaley, A., Sheridan, J., Safari, S., Burton, A., Burkey, K., Schlueter, J. (2015). RNA-Seq analysis reveals genetic response and tolerance mechanisms to ozone exposure in soybean. BMC Genomics 16 (1), 1–13. doi: 10.1186/s12864-015-1637-7
Wilson, J. D. O. (1995). “Storage of orthodox seeds,” in Seed quality: basic mechanisms agricultural implications Basra, A. S. (ed). (NY: Food product press) 173–208.
Wu, D., Zhan, Y., Sun, Q., Xu, L., Lian, M., Zhao, X., et al. (2018). Identification of quantitative trait loci underlying soybean (Glycine max [L.] merr.) seed weight including main, epistatic and QTL_ environment effects in different regions of northeast China. Plant Breed 137, 194–202. doi: 10.1111/pbr.12574
Xie, F. T., Niu, Y., Zhang, J., Bu, S. H., Zhang, H. Z., Geng, Q. C., et al. (2014). Fine mapping of quantitative trait loci for seed size traits in soybean. Mol. Breed. 34 (4), 2165–2178. doi: 10.1007/s11032-014-0171-7
Xu, Y., Li, H. N., Li, G. J., Wang, X., Cheng, L. G., Zhang, Y. M. (2011). Mapping quantitative trait loci for seed size traits in soybean (Glycine max L. merr.). Theor. Appl. Genet. 122 (3), 581–594. doi: 10.1007/s00122-010-1471-x
Yang, Z., Xin, D., Liu, C., Jiang, H., Han, X., Sun, Y., et al. (2013). Identification of QTLs for seed and pod traits in soybean and analysis for additive effects and epistatic effects of QTLs among multiple environments. Mol. Genet. Genomics 288 (12), 651–667. doi: 10.1007/s00438-013-0779-z
Yan, L., Hofmann, N., Li, S., Ferreira, M. E., Song, B., Jiang, G., et al. (2017). Identification of QTL with large effect on seed weight in a selective population of soybean with genome-wide association and fixation index analyses. BMC Genomics 18 (1), 1–11.
Yu, M., Liu, Z., Jiang, S., Xu, N., Chen, Q., Qi, Z., et al. (2018). QTL mapping and candidate gene mining for soybean seed weight per plant. Biotechnol. Biotechnol. Equip. 32 (4), 908–914. doi: 10.1080/13102818.2018.1438851
Zeng, Z. B. (1994). Precision mapping of quantitative trait loci. Genetics 136 (4), 1457–1468. doi: 10.1093/genetics/136.4.1457
Zhang, D., Cheng, H., Wang, H., Zhang, H., Liu, C., Yu, D. (2010). Identification of genomic regions determining flower and pod numbers development in soybean (Glycine max L.). J. Genet. Genomics 37 (8), 545–556. doi: 10.1016/S1673-8527(09)60074-6
Zhang, W. K., Wang, Y. J., Luo, G. Z., Zhang, J. S., He, C. Y., Wu, X. L., et al (2004). QTL mapping of ten agronomic traits on the soybean (Glycine max L. Merr.) genetic map and their association with EST markers. Theoretical and Applied Genetics 108 (6), 1131–1139.
Zhao, B., Dai, A., Wei, H., Yang, S., Wang, B., Jiang, N., et al. (2016). Arabidopsis KLU homologue GmCYP78A72 regulates seed size in soybean. Plant Molecular Biology 90 (1), 33–47.
Keywords: soybean, seed shape, seed weight, QTL, candidate genes, marker assisted breeding
Citation: Kumar R, Saini M, Taku M, Debbarma P, Mahto RK, Ramlal A, Sharma D, Rajendran A, Pandey R, Gaikwad K, Lal SK and Talukdar A (2023) Identification of quantitative trait loci (QTLs) and candidate genes for seed shape and 100-seed weight in soybean [Glycine max (L.) Merr.]. Front. Plant Sci. 13:1074245. doi: 10.3389/fpls.2022.1074245
Received: 19 October 2022; Accepted: 30 November 2022;
Published: 04 January 2023.
Edited by:
Xiaorong Fan, Nanjing Agricultural University, ChinaReviewed by:
Yuri Shavrukov, Flinders University, AustraliaCopyright © 2023 Kumar, Saini, Taku, Debbarma, Mahto, Ramlal, Sharma, Rajendran, Pandey, Gaikwad, Lal and Talukdar. This is an open-access article distributed under the terms of the Creative Commons Attribution License (CC BY). The use, distribution or reproduction in other forums is permitted, provided the original author(s) and the copyright owner(s) are credited and that the original publication in this journal is cited, in accordance with accepted academic practice. No use, distribution or reproduction is permitted which does not comply with these terms.
*Correspondence: Akshay Talukdar, YWtzaGF5LnRhbHVrZGFyMUBnbWFpbC5jb20=
†ORCID: Ayyagari Ramlal, orcid.org/0000-0002-1093-9877
Disclaimer: All claims expressed in this article are solely those of the authors and do not necessarily represent those of their affiliated organizations, or those of the publisher, the editors and the reviewers. Any product that may be evaluated in this article or claim that may be made by its manufacturer is not guaranteed or endorsed by the publisher.
Research integrity at Frontiers
Learn more about the work of our research integrity team to safeguard the quality of each article we publish.