 Jiaying Zhang
 Shuigen Li
 Haishan An
 Xueying Zhang
 Boqiang Zhou
94% of researchers rate our articles as excellent or good
Learn more about the work of our research integrity team to safeguard the quality of each article we publish.
Find out more
ORIGINAL RESEARCH article
Front. Plant Sci. , 08 December 2022
Sec. Functional and Applied Plant Genomics
Volume 13 - 2022 | https://doi.org/10.3389/fpls.2022.1073332
This article is part of the Research Topic Growth Regulation in Horticultural Plants: New Insights in the Omics Era View all 14 articles
Introduction: Blueberry (Vaccinium corymbosum L.) is a popular fruit with an abundance of anthocyanins in its leaves and fruits. Light is one of the pivotal environmental elements that affects plant growth and development, but the regulatory mechanism between light quality and anthocyanin formation is poorly understood.
Methods: An integrated transcriptome and metabolome analysis was performed to investigate the effects of white (control), blue (B), red (R), and red/blue (60R/40B) light on blueberry growth and reveal the potential pathway controlling anthocyanin biosynthesis in blueberry leaves.
Results: The anthocyanin content was significantly improved by the blue and red/blue light when compared with white light, whereas there was a significant reduction in the photosynthesis under the blue light, showing an inverse trend to that of anthocyanin accumulation. Transcriptomic analysis resulted in the assembly of 134,709 unigenes. Of these, 22 were differentially expressed genes (DEGs) that participate in the anthocyanin biosynthesis pathway, with the majority being significantly up-regulated under the blue light. Most of the photosynthesis-related genes that were down-regulated were expressed during anthocyanin accumulation. Targeted metabolome profiling identified 44 metabolites associated with anthocyanin biosynthesis. The contents of most of these metabolites were higher under blue light than the other light conditions, which was consistent with the transcriptome results. The integrated transcriptome and metabolome analysis suggested that, under blue light, leucoanthocyanidin dioxygenase (LDOX), O-methyltransferase (OMT), and UDP-glucose flavonoid glucosyltransferase (UFGT) were the most significantly expressed, and they promoted the synthesis of cyanidin (Cy), malvidin (Mv), and pelargonidin (Pg) anthocyanidins, respectively. The expression levels of dihydroflavonol 4-reductase (DFR) and OMT, as well as the accumulation of delphinidin (Dp), peonidin (Pn), and petunidin (Pt), were significantly increased by the red/blue light.
Discussion: The blue and red/blue lights promoted anthocyanin biosynthesis via inducing the expression of key structural genes and accumulation of metabolites involved in anthocyanin synthesis pathway. Moreover, there was a possible feedback regulating correlation between anthocyanin biosynthesis and photosynthesis under different light qualities in blueberry leaves. This study would provide a theoretical basis for elucidating the underlying regulatory mechanism of anthocyanin biosynthesis of V. corymbosum.
Blueberry (Vaccinium corymbosum L.) is a fruit-bearing shrub in the genus Vaccinium, which is part of the heath family (Ericaceae). It is a commercially important small fruit crop owing to its healthy and flavorful bioactive compounds, including vitamins, anthocyanins, and other phenolic compounds (Zhang L. et al., 2019; Kalt et al., 2020). Blueberries are inherently high in anthocyanins and can be used to fight some human cancers (Seeram et al., 2006) and regulate oxidative stress in organs (Song et al., 2016), blood glucose levels (Fallah et al., 2020a), and inflammatory responses (Fallah et al., 2020b). Due to these potential health benefits, interest in blueberry anthocyanins has been increasing (Chai et al., 2021). The previous studies on anthocyanin biosynthesis have mainly focused on blueberry fruits and discovered some crucial differentially expressed genes or transcription factors related to anthocyanin biosynthesis pathway (Lin et al., 2018), but reports on anthocyanin accumulation in the leaves have been limited. Leaves are abundant in metabolites and the site of secondary plant metabolite production. Anthocyanins are one of the most important classes of secondary metabolite, and the anthocyanins in leaves may promote plant growth and development (Guo et al., 2020). Secondary metabolites, including flavonoids and anthocyanins, extracted from Lithocarpuspo lystachyus Rehd and blueberry leaves, can play a crucial role in the treatment of diabetes, hypertension, and chronic illnesses (Ehlenfeldt and Prior, 2001; Takeshita et al., 2009; Hou et al., 2011; Hou et al., 2012; Li et al., 2021). Anthocyanins in blueberry leaves may also be involved in the scavenging of reactive oxygen species (ROS), which could enhance disease resistance in humans (Sakaida et al., 2007). Additionally, the blueberry leaf is a commonly used drug for treating human thrombotic stroke in clinical trials (Nagao et al., 2008). Nevertheless, the true value of the blueberry plant including its leaves has not been fully explored yet, resulting in the unnecessary waste of this resource. Exploring and studying nutritious compounds, such as the anthocyanins in blueberry leaves, will lead to more efficient utilization of fruit resources and help to satisfy the growing demand for natural foods and medicines. Therefore, there is substantial interest in understanding the anthocyanin metabolism in blueberry leaves. Regrettably, our current understanding of the molecular mechanisms underlying anthocyanin biosynthesis is limited and how environmental factors regulate anthocyanin accumulation in blueberry leaves is unclear.
Anthocyanins are the most conspicuous class of flavonoid metabolic branches involved in the phenylpropane metabolic pathway, which presents numerous secondary metabolic pathways in plants (Allan et al., 2008; Wang et al., 2017). The anthocyanin biosynthesis pathway in plants is well understood and key enzyme genes involved in anthocyanin biosynthesis, including cinnamate 4-hydroxylase (C4H), 4-coumarate-CoA ligase (4CL), chalcone isomerase (CHI), chalcone synthase (CHS), flavanone 3-hydroxylase (F3H), flavonoid 3′-monooxygenase (F3’H), flavonoid 3′, 5′-hydroxylase (F3’5H), dihydroflavonol-4-reductase (DFR), phenylalanine ammonialyase (PAL), anthocyanidin synthase (ANS), and UDP-glucose flavonoid glucosyltransferase (UFGT), have been identified in the colored tissues of several plants. Moreover, the pathway is regulated by the interaction of DNA-binding R2R3MYB transcription factors and MYC-like basic helix–loop–helix (bHLH) and WD40-repeat proteins, i.e., MYB-bHLH-WD40 transcription factor complexes (Jaakola, 2013). The up-regulation of these genes could promote anthocyanin accumulation (Liu et al., 2016; Gao et al., 2021). Aside from these genes and transcription factors, anthocyanin biosynthesis is also influenced by environmental factors (Liu et al., 2016; Lin et al., 2018). A considerable amount of new research has focused on elucidating the environmental regulations controlling anthocyanin biosynthesis, specifically the impact of light-mediated regulation (Jaakola, 2013). Light exposure can increase anthocyanin concentrations, especially in the fruit skin, and the shading of fruits can have the opposite effect (Takos et al., 2006). In the pathway of light-controlled anthocyanin biosynthesis, light-receptor could interact with the CONSTITUTIVE PHOTOMORPHOGENIC1 (COP1), which regulated the expression level of the ELONGATED HYPOCOTYL5 (HY5), or interact directly with certain anthocyanin biosynthesis-related MYB transcription factors to promote the transcription of structural pathway genes regulating anthocyanin biosynthesis (Stracke et al., 2010; Li et al., 2012). In recent decades, researchers have found that light quality can significantly affect the biosynthesis of anthocyanins; UV and other types of light (e.g., blue light) have been associated with the regulation of anthocyanin biosynthesis (Ordidge et al., 2011; Li et al., 2013). Additionally, light quality was found to regulate the gene expression patterns related to anthocyanin synthesis and the regulation of anthocyanin accumulation and stability (Briggs and Olney, 2001; Zoratti et al., 2014). During anthocyanin biosynthesis, the regulatory effects of anthocyanin pigmentation were found to vary according to the different light quality, which influences the levels of key enzymes that are involved in anthocyanin biosynthesis (Mol et al., 1996). For most plants, blue light induces an increase in the transcript levels for the PAL1, CHS, CHI, and DFR genes, which encode anthocyanin biosynthesis enzymes (Feinbaum et al., 1991; Batschauer et al., 1996; Noh and Spalding, 1998). Red light (600–700nm) may markedly increase peroxidase (POD) and phenylalanine ammonialyase (PAL) activity in a phytochrome-type response, irritating the aggrandizement of anthocyanin content in the flavonoid metabolic pathways of rice, maize, and turnips (Reddy et al., 1994; Sharma et al., 1999). Some studies have elucidated the effects of different light qualities on anthocyanin accumulation in certain plants and the transcriptome profiling analysis of blueberry fruit has revealed the mechanisms of red and blue light-mediated anthocyanin biosynthesis regulations (Li and Yang, 2007; Lu et al., 2015; Ottosen et al., 2015; Samkumar et al., 2021). However, none of these studies have demonstrated the regulatory mechanism underlying anthocyanin biosynthesis is response to different spectra by integrating the transcriptome and metabolome analysis. This approach may allow us to gain a better understanding of the key genes and metabolites involved in anthocyanin formation under different light qualities in blueberry leaves.
RNA-sequencing is a powerful tool that can be used to unravel novel genes, identify gene expression levels, and facilitate the study of mechanisms underlying metabolite variations (Lv et al., 2019; Zhang Y. et al., 2019). However, it is still difficult to determine a direct correlation between transcript abundance and the associated levels of the respective metabolites since numerous variables are often considered (Lou et al., 2014). Metabolomics is an important part of systematic biology that focuses on the quantitative analysis of all metabolites in an organism to understand the correlations between phenotype and the metabolite (Zhang X. et al., 2019; Guo et al., 2020). An integrative analysis of the transcriptome and metabolome, to investigate the transcript levels in conjunction with the metabolic products, could contribute to the identification of functional genes and the elucidation of pathways involved in plant metabolism processes (Lou et al., 2014).
In this study, an integrated transcriptome and metabolome analysis was used to understand the key genes and metabolites associated with anthocyanin biosynthesis in blueberry leaves under different light qualities. The differential levels of anthocyanin metabolites and their regulatory genes in blueberry leaves were identified under four light qualities, i.e., blue (B), red (R), red/blue (60R/40B), and white light. The connection network was mapped based on a correlation analysis between transcript expression and metabolite levels to highlight the regulator genes and metabolites related to anthocyanin accumulation under different light qualities. Moreover, a correlation analysis between anthocyanin accumulation and photosynthesis was also conducted. The data presented herein will not only provide novel insights into the molecular mechanisms underlying the biosynthesis and regulation of anthocyanins in blueberry, but also useful insights to aid in the breeding of new blueberry varieties with enhanced anthocyanin content.
In this study, three-year-old southern-highbush blueberries of the cultivar ‘Misty’ were utilized, and the plants were grown in a plant factory system with artificial lighting (PFAL) at Zhuang-hang Comprehensive Experimental Station of Shanghai Academy of Agricultural Sciences, Shanghai, China. The growth conditions in the PFAL were as follows: the temperature was set at 25 ± 2°C during the daytime and 22 ± 2°C at night, the photoperiod was 16-h light and 8-h dark, and the CO2 concentration and relative humidity were set at approximately 400 μmol·mol-1 and 65% ± 5%, respectively. The blueberry plants were treated respectively with four light qualities: white (W), full blue (B), full red (R), and 60% red + 40% blue (60R/40B), and the white light treatment was considered the control. The light intensity of all treatments was equal at 200 ± 5 µmol·m-2·s-1, each treatment with four experimented blueberry plants. Approximately 30 days after the treatments, the fifth to tenth mature leaves, which were similar developmental stage, had no disease, no mechanical damage, and complete form, were collected from the top branch of each blueberry plant. Approximately 3 g of leaves were collected from each plant and immediately frozen in liquid nitrogen and stored at −80°C for transcriptome profiling and metabolite quantitative analysis. The determination of physiological indicators was performed with four replicates and each plant as a replicate. The transcriptome and metabolome were analyzed with three biological replicates.
Anthocyanin content in the fresh leaf samples was determined according to the method improved by Li et al. (2016). Leaves were harvested from the blueberry plants, quickly weighed, and homogenized with a mortar and pestle; they were then treated with 0.1 mol·L−1 acidized ethanol (10mL) in a microcentrifuge tube and then with water at 60°C for 30 min. The extraction procedure was performed twice and then the samples were centrifuged at 1,500g for 5 min at 4°C, and the supernatants were then collected. The absorbance of the samples was measured at 530, 620, and 650 nm, respectively, using an ultraviolet–visible spectrophotometer (UV-2000) (Spark, TECAN, Switzerland). The values are reported as (1) ΔOD = (OD530 − OD620) − 0.1 (OD650 − OD620) and (2) anthocyanin content = (ΔOD × V × 1000000)/(ξ× m), where V is the dilution volume, ξ is the molar absorption coefficient, and m is the fresh weight of the sample. All measurements were performed with four replicates.
The photosynthesis of the blueberry leaves was measured using a leaf gas exchange system (CIRAS-3; PP Systems). During the measurements, the gas exchange system controlled the environmental conditions within the curette. The temperature of the leaf was 25.0 ± 0.2°C and the CO2 concentration was 390 ± 5 μmol·mol-1. To discover the photosynthetic efficiency of the different spectra, light response curves were constructed for the blueberry leaves under corresponding light qualities. Photosynthesis indicators, including the maximum gross assimilation rate (Ag, max) and maximum quantum yield for CO2 assimilation (QYm, inc), were calculated according to the light response curves.
Total RNA from the blueberry leaves was isolated using the Polysaccharides and Polyphenolics-rich RNA Prep Pure Plant Kit (TIANGEN, China), following the manufacturer’s instructions. The integrity of the RNA was verified using an Agilent 2100 Bio analyzer (Agilent Technologies, USA). The RNA-Seq and libraries were constructed using the Biomarker Technologies Corporation (Beijing, China) and the Vcorymbosum_v1.0 genome was used as the reference genome in this study. Before conducting data analysis, it is vital to ensure that the red reads are of sufficient quality. Remove reads containing joints and low-quality reads (N was more than 10%; base number with mass value Q≤ 10 accounted for more than 50%), clean reads with high quality were obtained. StringTie was used to assemble the clean reads above and construct a traffic network using the alignment information to construct a multivariable shear map through using the maximum flow algorithm to assemble reads and evaluate its expression. Using the FPKM (Fragments Per Kilobase of transcript per Million fragments mapped) as an indicator to measure the expression level of transcripts or genes through the maximum flow algorithm. The edgeR was used to analysis significant difference of genes transcript level and gene with an adjusted FDR < 0.01& Fold Change ≥2 was identified as differentially expressed. The functions of the unigenes were determined by aligning them to protein databases using BLASTx, including NCBI non-redundant (Nr) and nucleotide (Nt), Swiss-Prot, Kyoto Encyclopedia of Genes and Genomes (KEGG), Clusters of Orthologous Groups of proteins (COGs), and Gene Ontology (GO) databases. GO classification was performed by mapping the relationship between the Swiss-Prot and GO terms, and the genes were mapped to the KEGG database to annotate their potential metabolic pathways (Kanehisa et al., 2008).
Total RNA was isolated from the blueberry leaves collected under the four light-quality treatments. For the qRT-PCR analysis, the SYBR RNA RT-PCR Kit (TaKaRa, Japan) was used to synthesis the first-strand of cDNA and the Light Cycler 480 (Roche, USA) was used to perform the qRT-PCR procedure. qRT-PCR was performed with the SYBR-Green PCR kit (TaKaRa, Japan) and the reaction mixture system was prepared according to the manufacturer’s instructions. The qPCR program was previously described by Zhang et al. (2021b). The expression level of each gene was calculated in triplicate based on the 2-ΔΔCt algorithm, and VcGAPDH was used as the internal reference gene. Snap Gene software (www.snapgene.cn) was used to design the primers for the target genes (Table S1).
Anthocyanins are secondary metabolites in plants. The qualitative and quantitative analysis of the anthocyanins could be measured using the LC-MS/MS system. Freeze-dried blueberry leaves (50 mg) were crushed and dissolved in 500 μL of extract. They were then centrifuged at 1200 g/min for 10min; the extracts were filtrated and absorbed for LC-MS/MS analysis. The instrument system used for data acquisition included an Ultra Performance Liquid Chromatography (UPLC) and Tandem Mass Spectrometry (MS/MS). Qualitative analysis of the anthocyanins detected using mass spectrometry was performed based on the construction of standard databases and the quantification of anthocyanins was identified by employing scheduled multiple reaction monitoring (MRM). The Analyst 1.6.3 software (Sciex) was used to acquire and dispose data and the quantities of all metabolites were analyzed using Multiquanta 3.0.3 software (Sciex). To draw standard curves for the different substances the concentration was used as the abscissa and the peak area as the ordinate. The integrated peak areas for all detected samples were substituted into the standard curve linear equation for calculation and the absolute content values for each sample were obtained.
Targeted anthocyanins and their intermediates were selected based on the following criteria: (1) the obtained compounds should be related to the phenylpropanoid and anthocyanin biosynthesis pathways and their molecular formula and mass information was established using the KEGG and plant metabolic network databases; (2) certain filtrated daughter ions in the anthocyanins could be identified as similar compounds as described in the literary references; and (3) the MS2 spectra of the selected metabolites and standard compounds was as found in the METLIN and LIPDMAPS databases. The obtained anthocyanin-related compounds are shown in Supplementary Table S2.
Pearson’s correlation coefficient (PCC), a statistical method used to measure the linear relationship between two variables with values between −1 and 1, was used to calculate the correlation coefficient between the transcriptome and metabolome data and further integration to analyze the relationships between the gene transcript and metabolite content. Associations between PCC > 0.8and P < 0.05 were selected and the network of genes and metabolites was constructed using Cytoscape software (Cytoscape Consortium, San Diego, CA). Additionally, genes and metabolites related to anthocyanin biosynthesis were mapped using the KEGG pathway database.
For this study, all experiments were performed in triplicate and the results are expressed as the mean ± standard deviation (SD). Analysis of variance (ANOVA) was performed to estimate the significant differences between the treatment means at P < 0.05. A heat map was constructed to exhibit the gene expression pattern and metabolite accumulation and to separate the groups of genes and metabolites with similar expressions and accumulation values. Principal component analysis (PCA) was performed to realize the metabolite variability among the white, blue, red, and red/blue light treatment groups.
The relative spectra under different wavelengths were significantly different (Figure 1I) and the different light qualities influenced the color gradation and anthocyanin synthesis in the blueberry leaves. The color gradation in the blueberry leaves was deepest with the blue light, followed by the red/blue, red, and white lights, and the corresponding anthocyanin content was highest under the blue light, followed by red/blue, red, and white lights. The anthocyanin content of the leaves under blue, red/blue, and red lights was approximately 4.6-, 3.7-, and 1.6-fold higher, respectively, than that under the white light (the control group) (Figure 1II). A phenomenon was identified in which the blue and red lights could promote the accumulation of anthocyanin, but differed significantly in their impact levels. The promotion of anthocyanin biosynthesis was more prominent under blue light than red light, while the accumulation was in between these two levels with the red/blue light combination. Leaf photosynthesis exhibited adverse effects on anthocyanin accumulation, which were strongest under white light but lowest under blue light. The photosynthesis indices, including Ag, max and QYm, inc, presented a consistent trend, with the greatest index under the white light, followed by red, red/blue, and blue (Figure 1III). Blue and red lights can promote anthocyanin accumulation but impair photosynthesis in blueberry leaves. In contrast, white light prejudiced anthocyanin biosynthesis but facilitated photosynthesis.
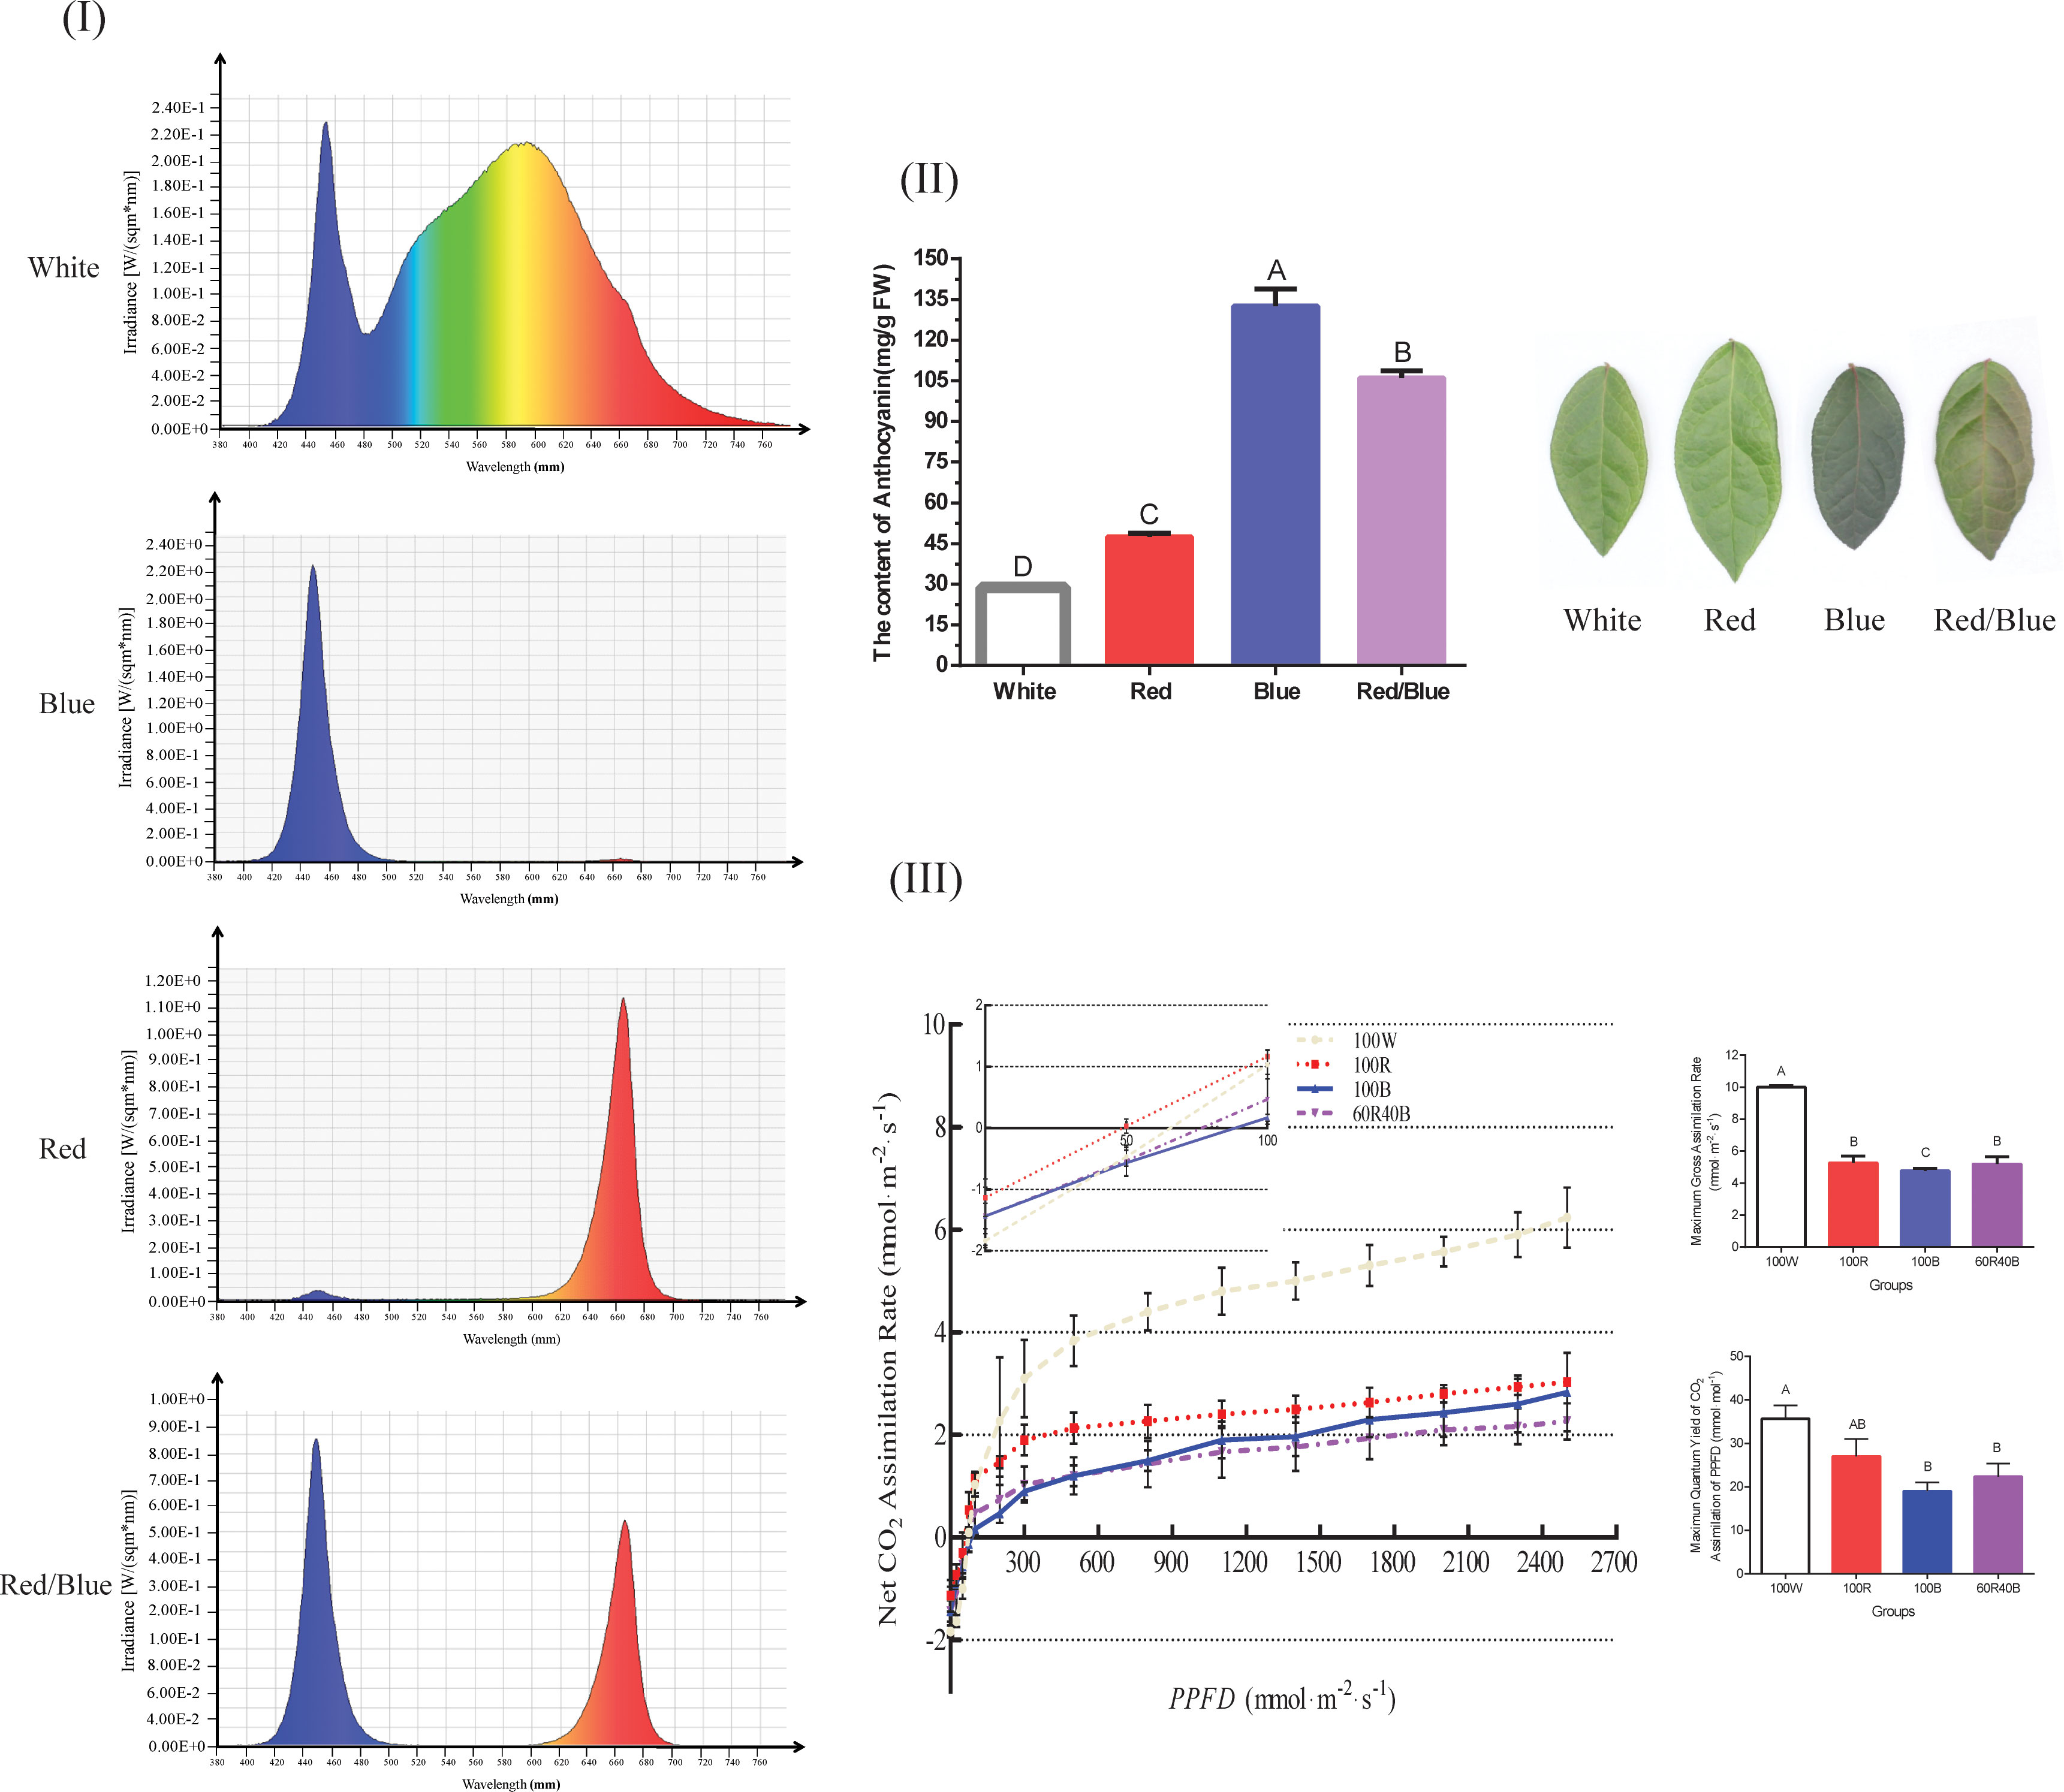
Figure 1 Spectrum plot showing the different light qualities and anthocyanin content, light response curves, and photosynthesis of blueberry leaves under four light spectra. (I) Dynamic distributions of the relative spectra under different wavelengths; (II) Anthocyanin content and phenotypic comparisons of blueberry leaves under four light spectra; (III) Net assimilation (An)-light response curves, Ag, max, and QYm, inc for blueberry leaves under different light spectra. Ag, max, maximum gross assimilation rate; QYm, inc, maximum quantum yield of CO2 assimilation; Capital letters indicate significant differences at P < 0.01 among the different treatments. Error bars indicate the standard deviation based on three replicates.
To elucidate the molecular genetics mechanisms underlying anthocyanin biosynthesis in blueberry leaves when under different light conditions, a comparative transcriptome analysis was performed. The Illumina sequencing platform was used to construct and sequence twelve RNA-Seq libraries (each treatment with three biological replicates). The rigorous quality estimation and data cleaning resulted in 21.48–26.23 M clean reads with Q30 bases that were identified as high-quality reads for further analysis. Their GC contents and Q30 ranges were 46.93%–47.36% and 94.69%–94.93%, respectively (Table S3). Moreover, the N percentage was 0.00% in all samples.
To substantiate the effects of light quality on the transcript levels of anthocyanin biosynthesis genes in blueberry leaves, DEGs between samples from the light quality treatments were identified using pairwise comparisons of the four cDNA libraries (blue vs. white, red vs. white, red/blue vs. white, and blue vs. red), and the fragments per kilo-base per million mapped reads (FPKMs) of all DEGs were calculated. A total of 1812 (640 up-regulated and 1172 down-regulated), 596 (250 up-regulated and 346 down-regulated), 3283 (1123 up-regulated and 2160 down-regulated), and 3428 (1974 up-regulated and 1457 down-regulated) differentially expressed genes (P < 0.05, fold change > 2) were found during the comparisons of the blue and white, red and white, red/blue and white, and blue and red libraries, respectively, whereas 13 DEGs were shared among the four comparisons (Figure 2I; Table S4). The number of DEGs was substantially higher in the blue vs. white comparison when compared with red vs. white, which indicated a strong gene expression disturbance experienced by the blueberry leaves under blue light. The blueberry leaves were more sensitive and actively responded to blue light to promote anthocyanin accumulation when compared to red light. GO term annotation was performed to improve our understanding of the functions of these DEGs in blueberry leaves under different light conditions. The DEGs were considered enriched in GO-terms if at least one of the terms was categorized as a biological process, cellular component, or molecular function (Figure 2II). The results of the GO-biological process (GO-BP) analysis revealed that significantly enriched DEGs were associated with metabolic processes, mainly phenylalanine and secondary metabolisms, among the four comparisons. To further explore the enriched metabolic pathways related to anthocyanin accumulation in blueberry leaves, we mapped all DEGs to reference canonical pathways in the KEGG database. A total of 4097 DEGs (blue vs. white:844; red vs. white:307; red/blue vs. white:1440; and blue vs. red:1506) with annotated KEGG results were classified into five main categories, including organismal systems, metabolism, genetic information processing, environmental information processing, and cellular processes, based on the type of KEGG pathways (Figure 2III). During metabolism classification, phenylpropanoid biosynthesis and starch and sucrose metabolism (photosynthesis) were the primary enriched pathways throughout the four comparisons. Additionally, DEGs were annotated by searching against the COG dataset. COG-annotated putative proteins were functionally classified into at least 26 categories, including cellular structure, biochemical metabolism, molecular processing, and signal transduction (Figure S1). In addition, the DEGs were collected and classified into 17 groups based on their annotated functions (Table 1). Among all the categories, phenylalanine metabolism, secondary metabolism, starch and sucrose metabolism, and carbohydrate metabolism (photosynthesis) were highly significant and enriched pathways, as well as being enriched they also had a greater number of DEGs. The results indicated that these DEGs were associated with metabolic pathways that could contribute to the biosynthesis and accumulation of anthocyanin in blueberry leaves under different light qualities.
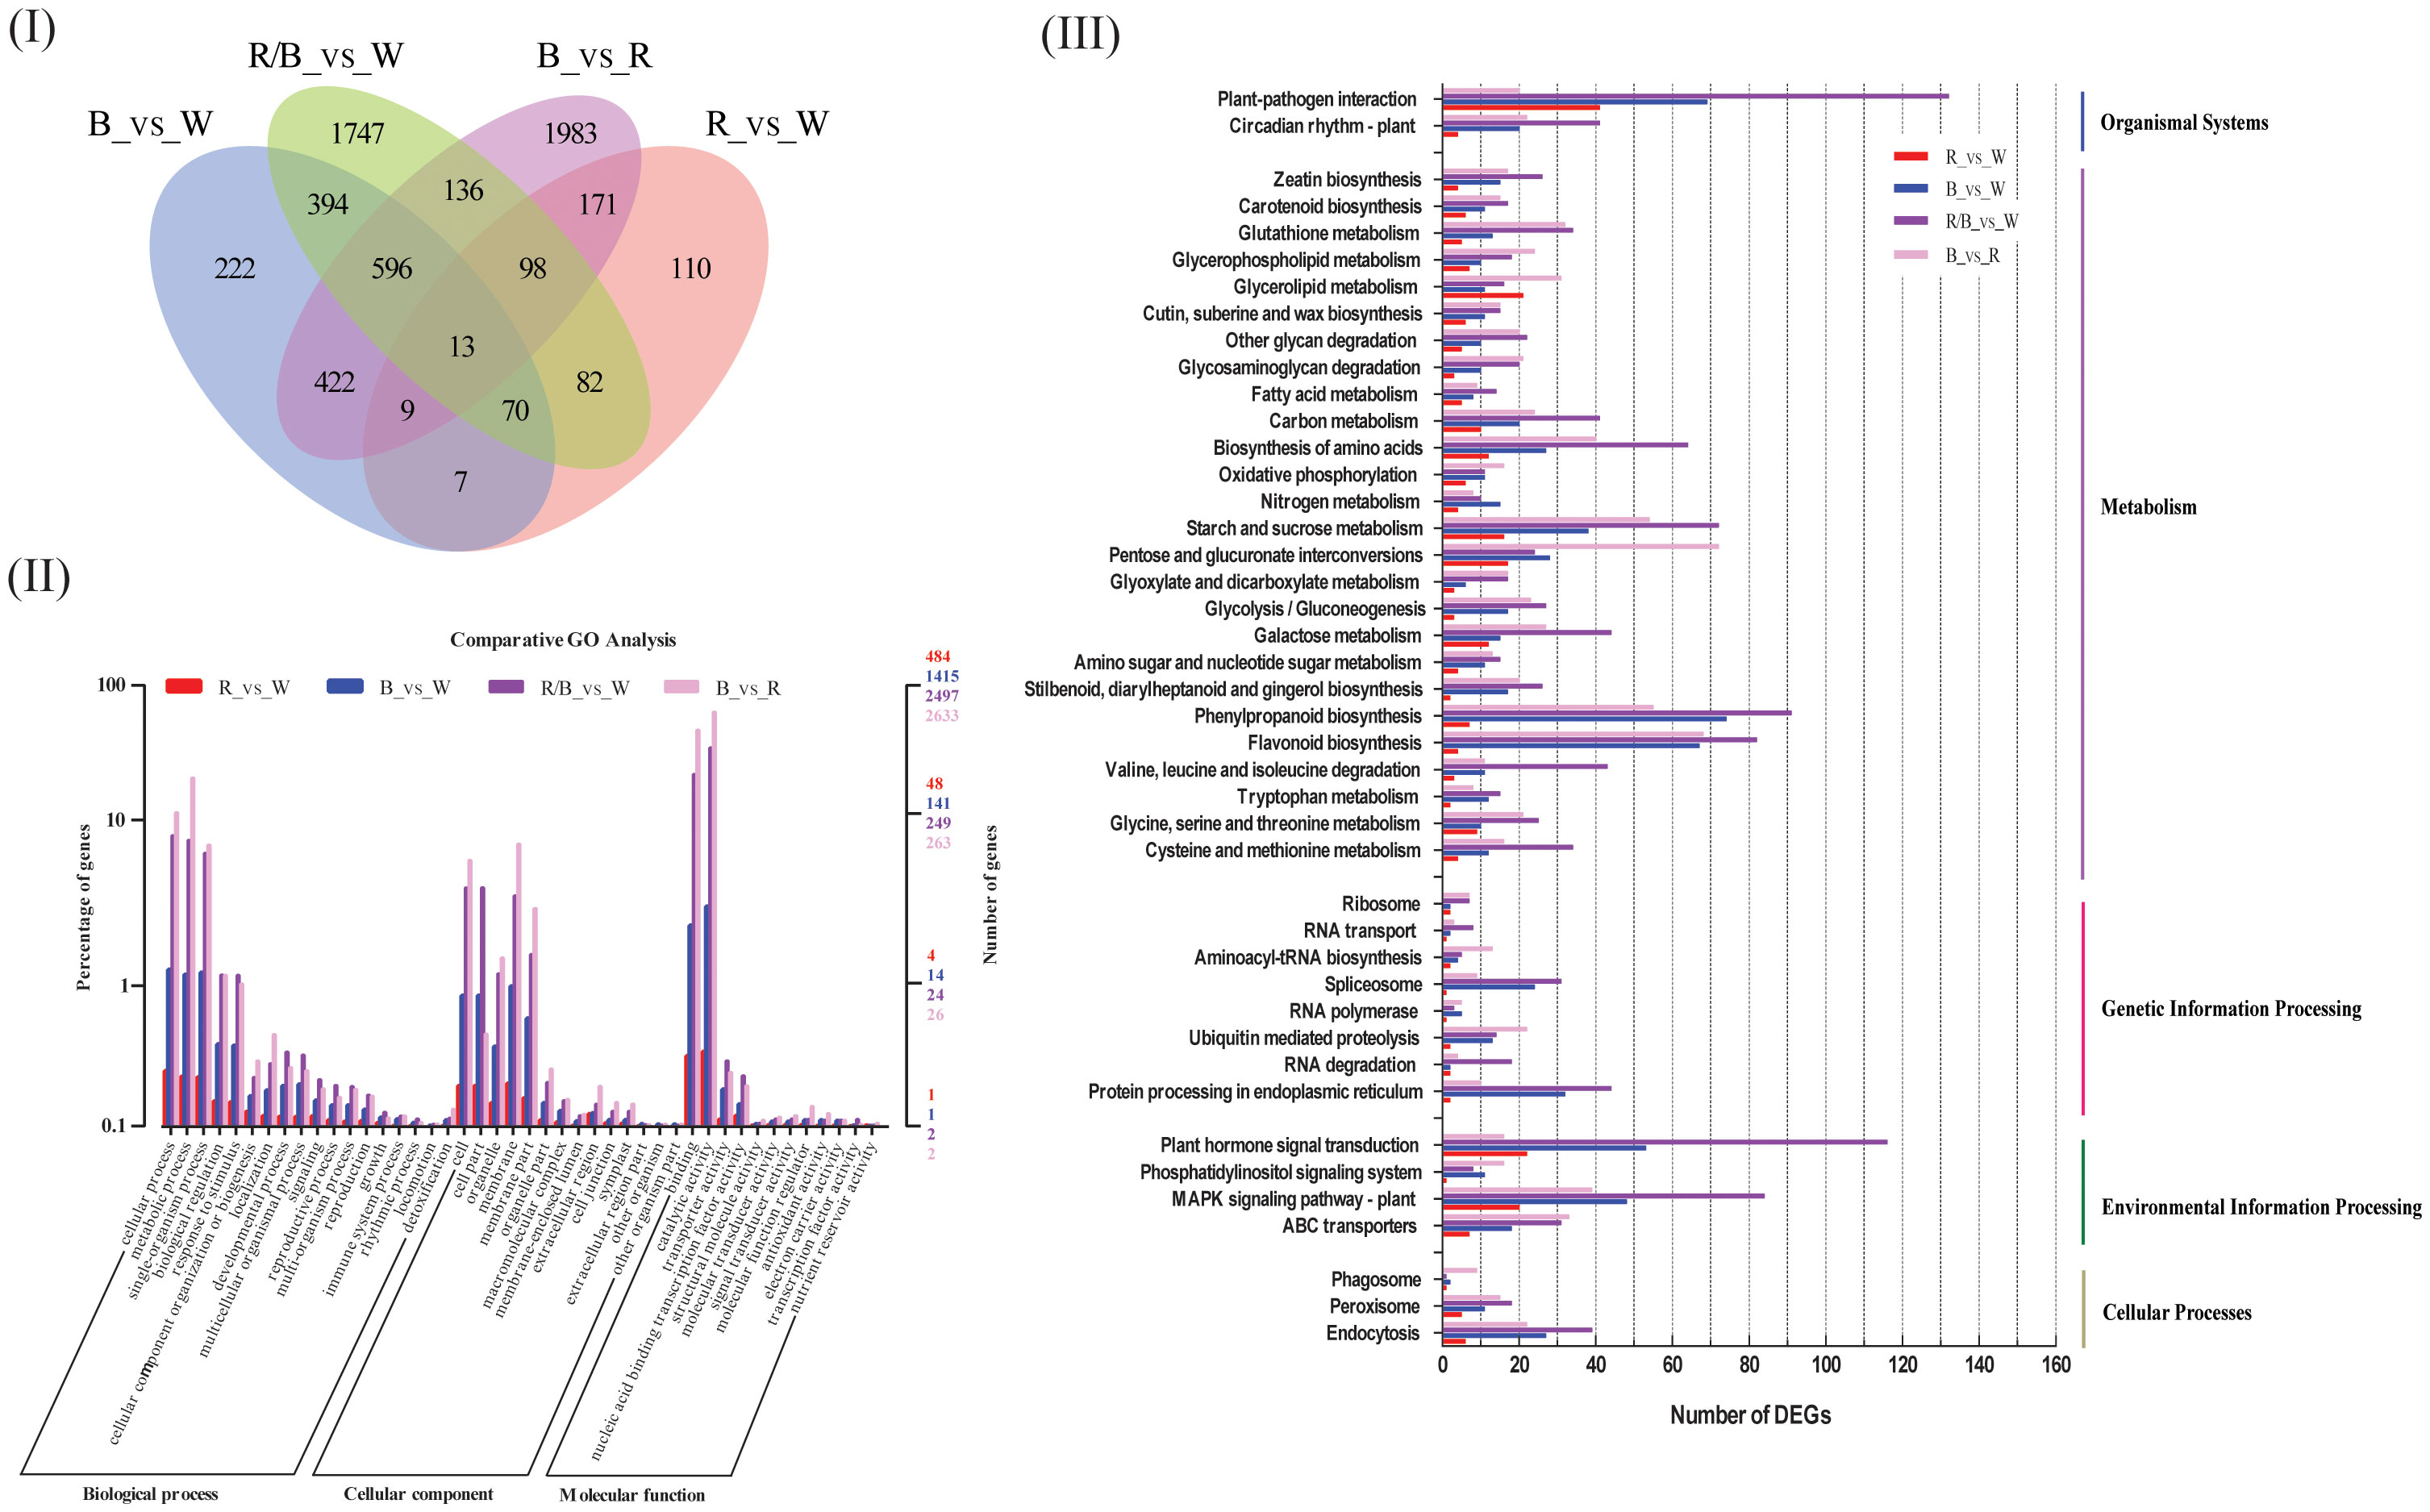
Figure 2 Functional annotation results of the genes differentially expressed in blue (B), red (R), and red/blue (60R/40B) when compared with those of the corresponding control (white light) and the comparison of B vs. R using the transcriptome data from blueberry ‘Misty’ leaves; (I) Venn diagram showing the shared and common DEGs for all light quality treatments; (II) Functional annotation of the DEGs based on the Clusters of Orthologous Groups (COG) database; (III) Annotation information obtained from the Gene Ontology (GO) database; (IV) Functional classification of DEGs based on the Kyoto Encyclopedia of Genes and Genomes (KEGG) dataset.
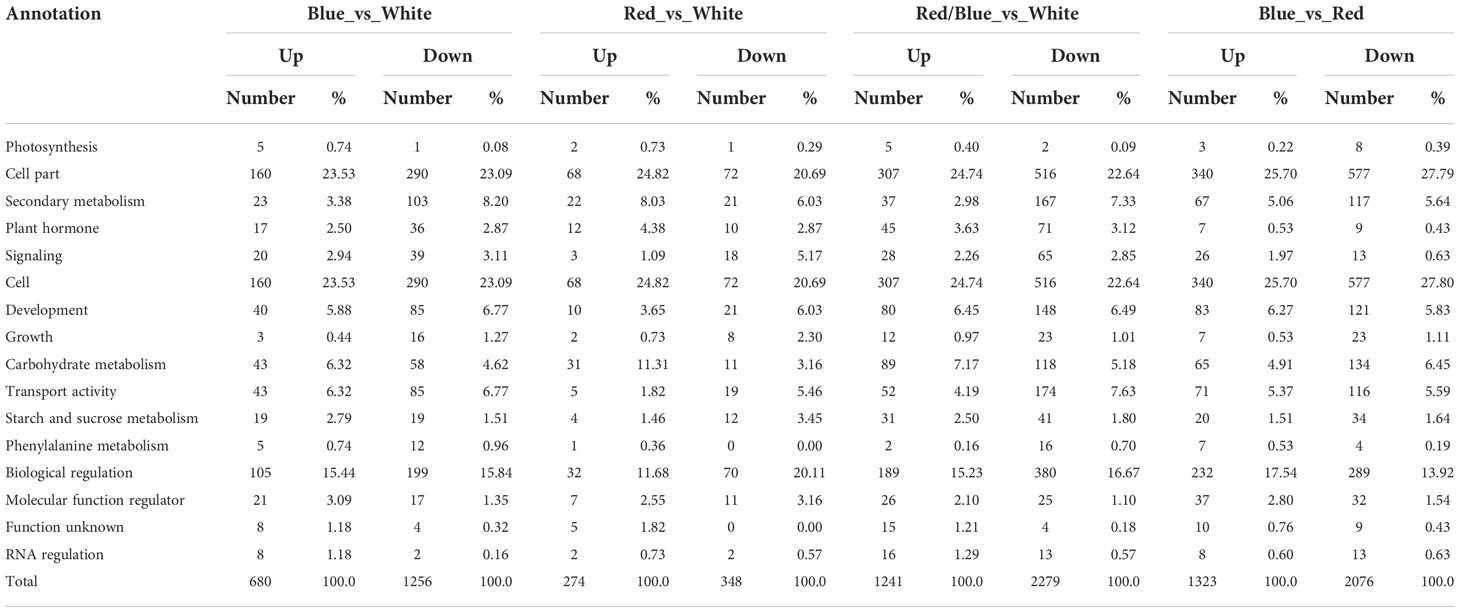
Table 1 Functional categories of the genes differentially expressed in the blue, red, and red/blue light when compared with white light and the comparison of blue vs. red in blueberry leaf.
The transcriptome analysis under light conditions showed that the DEGs related to phenylalanine, secondary, starch and sucrose, and carbohydrate (photosynthesis) metabolism processes may help blueberry leaves to accumulate anthocyanins. The physiological indicators suggested that there were significant differences in anthocyanin accumulation and photosynthesis in blueberry leaves due to the distinct light qualities. The DEGs implicated in the crucial steps of these processes were consequently screened. Moreover, the blueberry leaf was treated with distinct spectra, the DEGs associated with photoreceptor responses to the different light qualities were searched for. Core genes related to anthocyanin biosynthesis, photosynthesis, and photoreceptors were studied in detail, and the results demonstrated that most of the uni-transcripts showed significant changes in their expression levels (Figure 3; Table S5). An opposite dynamic trend was observed between the expression patterns of the anthocyanin accumulation-related and photosynthesis-related DEGs. The expression levels for most of the anthocyanin biosynthesis-related DEGs were higher in the blue light when compared with the other lights, but the DEGs associated with photosynthesis were down-regulated with the blue light. There may be feedback regulation among the DEGs related to anthocyanin accumulation and photosynthesis under blue light. DEGs encoding phytochrome, as receptor proteins of red and far-red light (600–750 nm), were up-regulated under red or red/blue light. Consistently, DEGs encoding cryptochrome, which mediated several responses to blue light and UV-A (320–500 nm), were up-regulated under blue light (Figure 3I). In relation to photosynthesis, there were DEGs among the different spectra. Photosynthesis-related DEGs were down-regulated under blue light when compared with the other treatments (Figure 3II), which was consistent with the weakness of photosynthesis under blue light. These results suggest that blue light prejudiced photosynthesis in the blueberry leaves, which is in sharp contrast to the results for anthocyanin accumulation under blue light. In many cases, changes in anthocyanin biosynthesis correspond to changes in the expression of genes that encode pathway enzymes. Among the related anthocyanin accumulation processes, 22 DEGs (including C4H, 4CL, CHS, DFR, F3’H, F3’5H, F3H, LDOX, OMT, and UFGT) were found to participate in vital steps in the anthocyanin pathway. Among these, LDOX, UFGT, and OMT were expressed well under blue light, whereas DFR and OMT were highly expressed under red/blue light. These DEGs contributed to the cyanidin, pelargonidin, malvidin, delphinidin, petunidin, and peonidin accumulation in the anthocyanin biosynthesis pathway (Figure 3III). Additionally, the expression of the DEGs related to lignin and flavonoid metabolism, which are also significant secondary metabolite pathways in plants, decreased in the blue light in comparison with that in white, red, and red/blue lights. These results indicate that blue light could promote the accumulation of anthocyanin but hinder the photosynthesis and secondary metabolism process of lignin and flavonoids in blueberry leaves when compared with other light sources via the direct or indirect regulation of the expression levels of related DEGs.
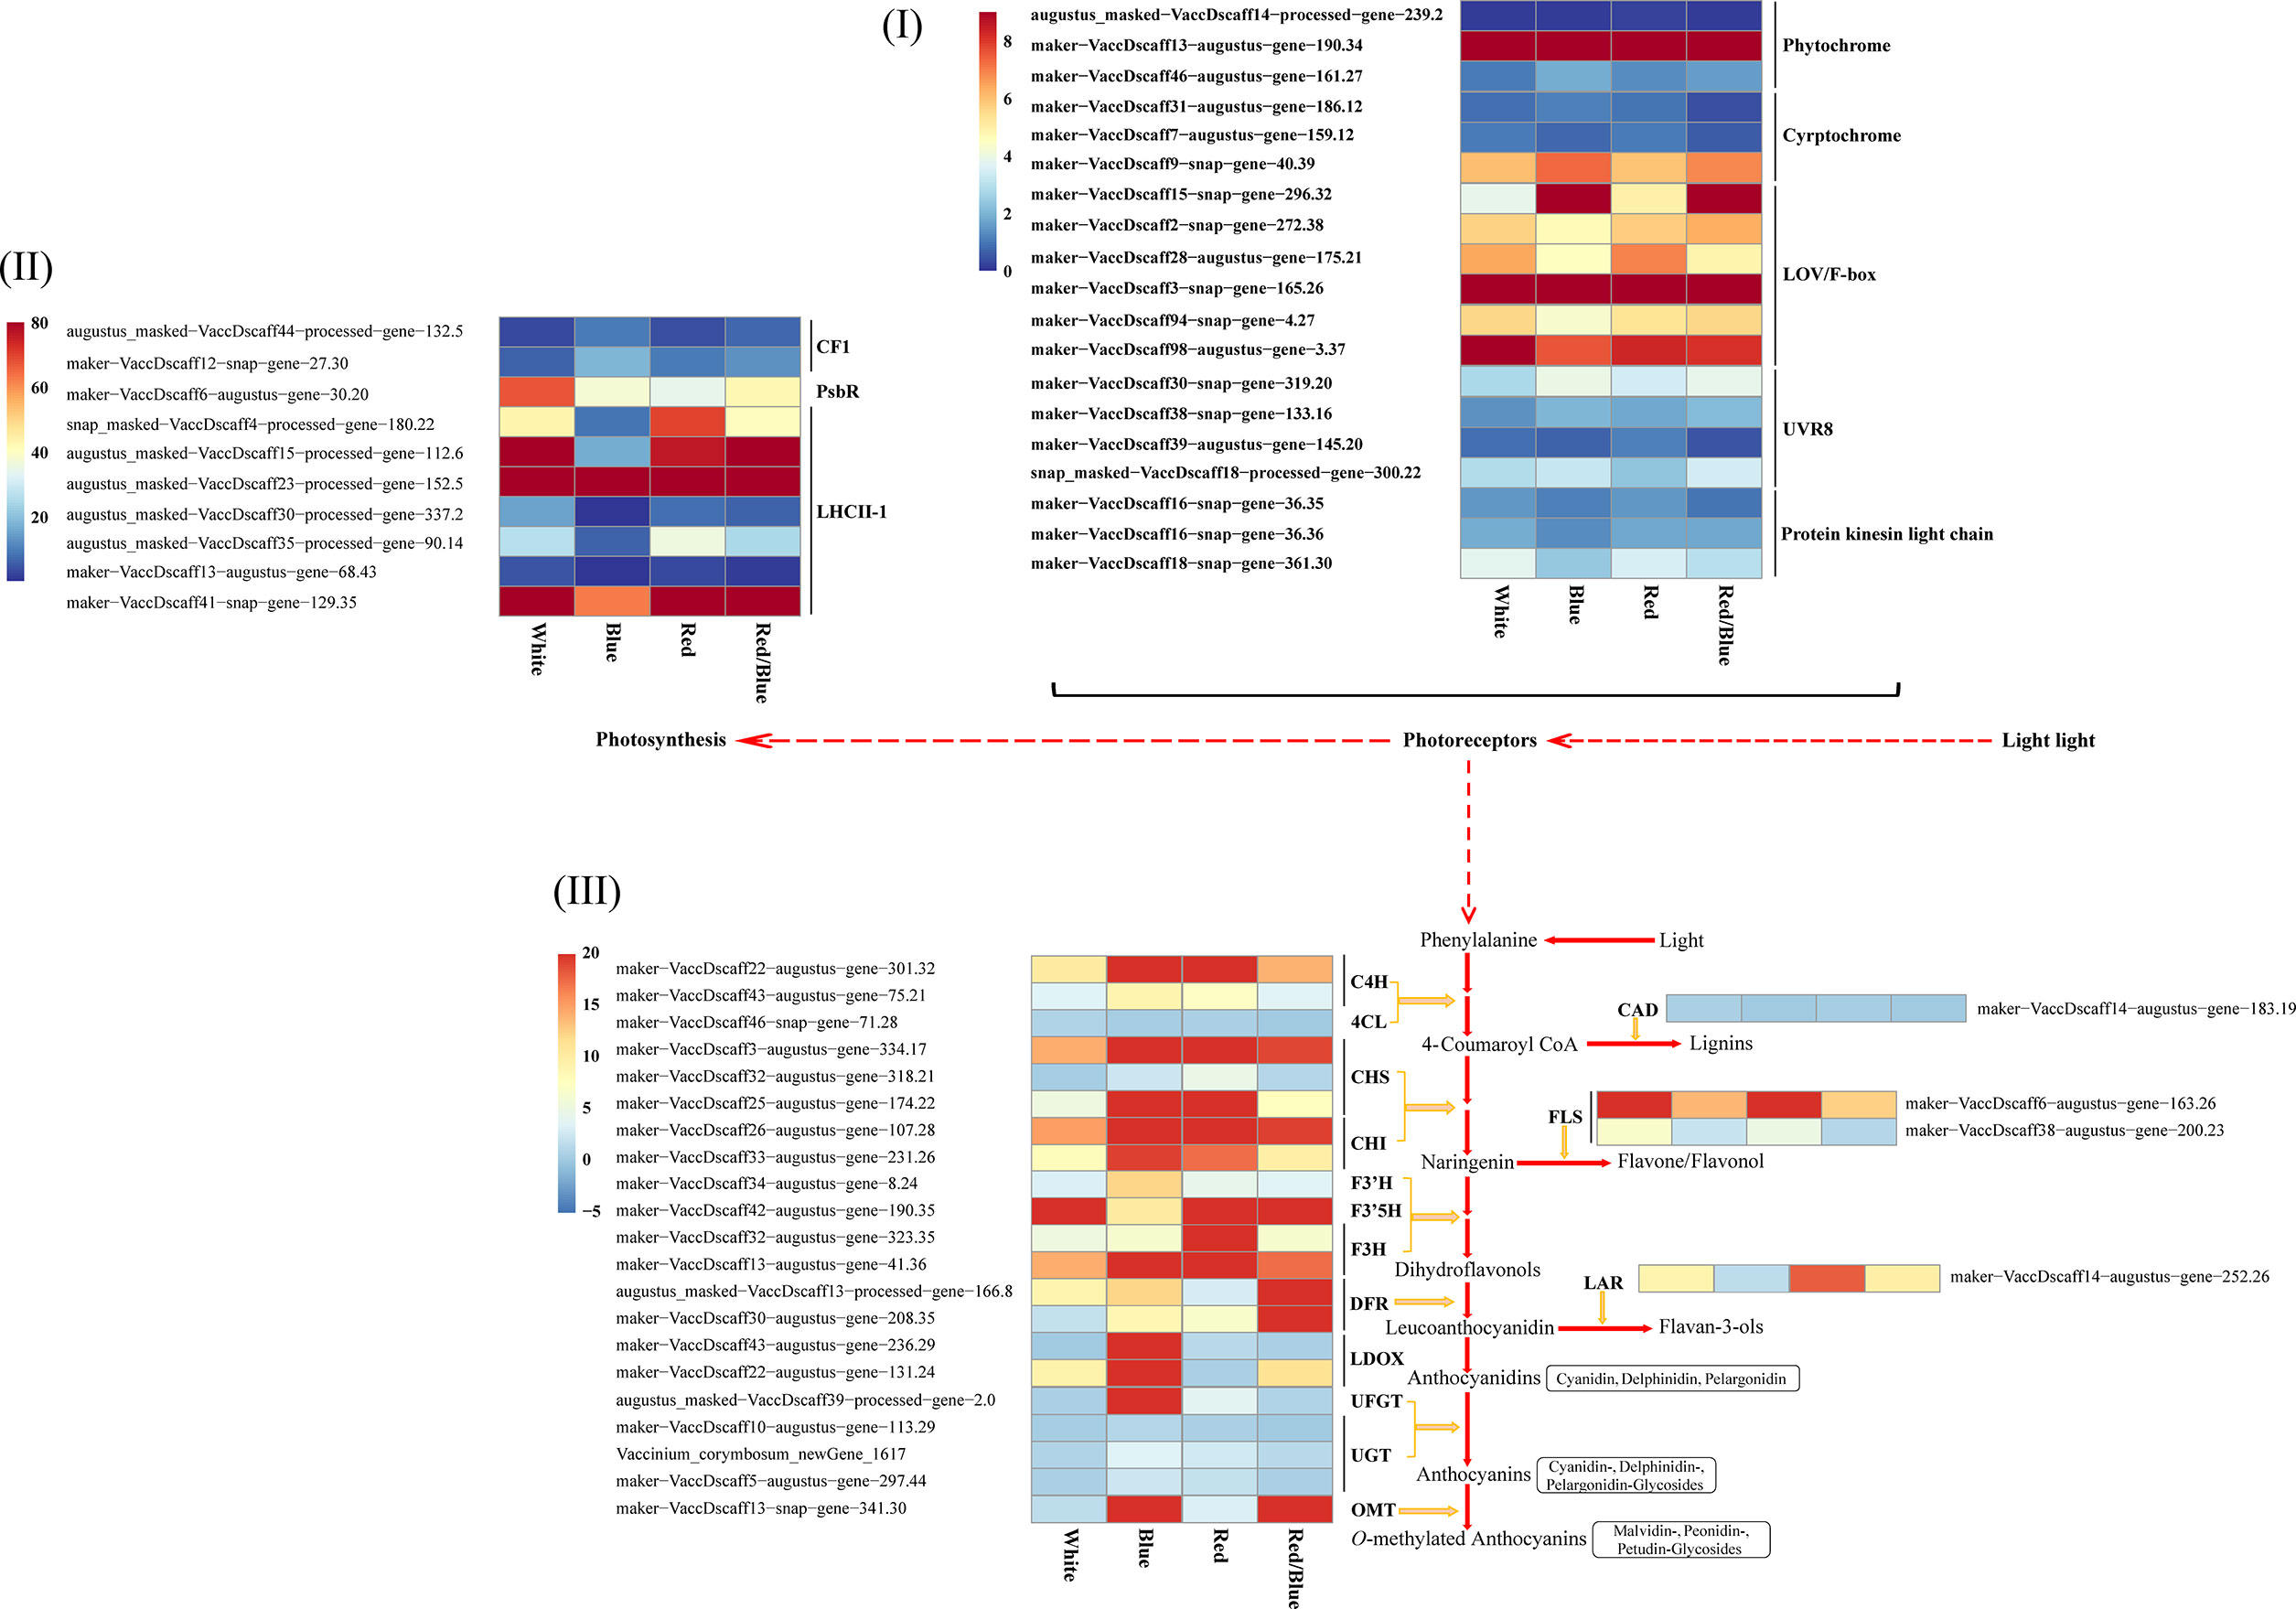
Figure 3 Expression heatmap showing the differentially expressed genes related to photoreceptor, photosynthesis, and anthocyanin and flavonoid biosynthesis pathway under different light qualities for the blueberry leaf. (I) Differential expression of the genes related to the photoreceptor, including phytochrome, cryptochrome, LOV/F-box, UVR8, and protein kinases in the light chain; (II) Expression levels of the DEGs from CF1, PsBR, and LHCII-1; (III) Expression patterns of the DEGs involved in the anthocyanin and flavonoid biosynthesis pathway. Enzyme names and expression levels are shown at the side of each step. C4H, cinnamate 4-hydroxylase; 4CL, 4-coumarate:CoA ligase; CHS, chalcone synthase; CHI, chalcone isomerase; OMT, O-methyltransferase; F3′H, flavonoid3′-monooxygenase; F3′5H, flavonoid 3′, 5′-hydroxylase; DFR, dihydroflavonol-4-reductase; LDOX, leucoanthocyanidin dioxygenase; LAR, leucoanthocyanidin reductase; UFGT, UDP-glucose flavonoid glucosyltransferase; UGT, anthocyanidin 3-O-glucoside 5-O-glucosyltransferase; CAD, cinnamyl alcohol dehydrogenase; FLS, flavonolsynthase; Red and blue, respectively, indicated high and low expression according to the color bar using the unit variance scaling method.
Blueberry leaves under different light qualities showed significantly different TFs, belonging primarily to 20 different families (Figure 4I; Table S6). The differentially expressed TFs belonged mostly to the AP2/ERF-ERF, bZIP, bHLH, MYB, and NAC families. The number distribution mole for the TFs in the blueberry leaves under different light qualities was consistent with the quantitative distribution of the gene function annotation. There were more differentially expressed genes or TFs under the red/blue light, indicating that the red/blue light combination was beneficial for changes in gene or TF expression levels.
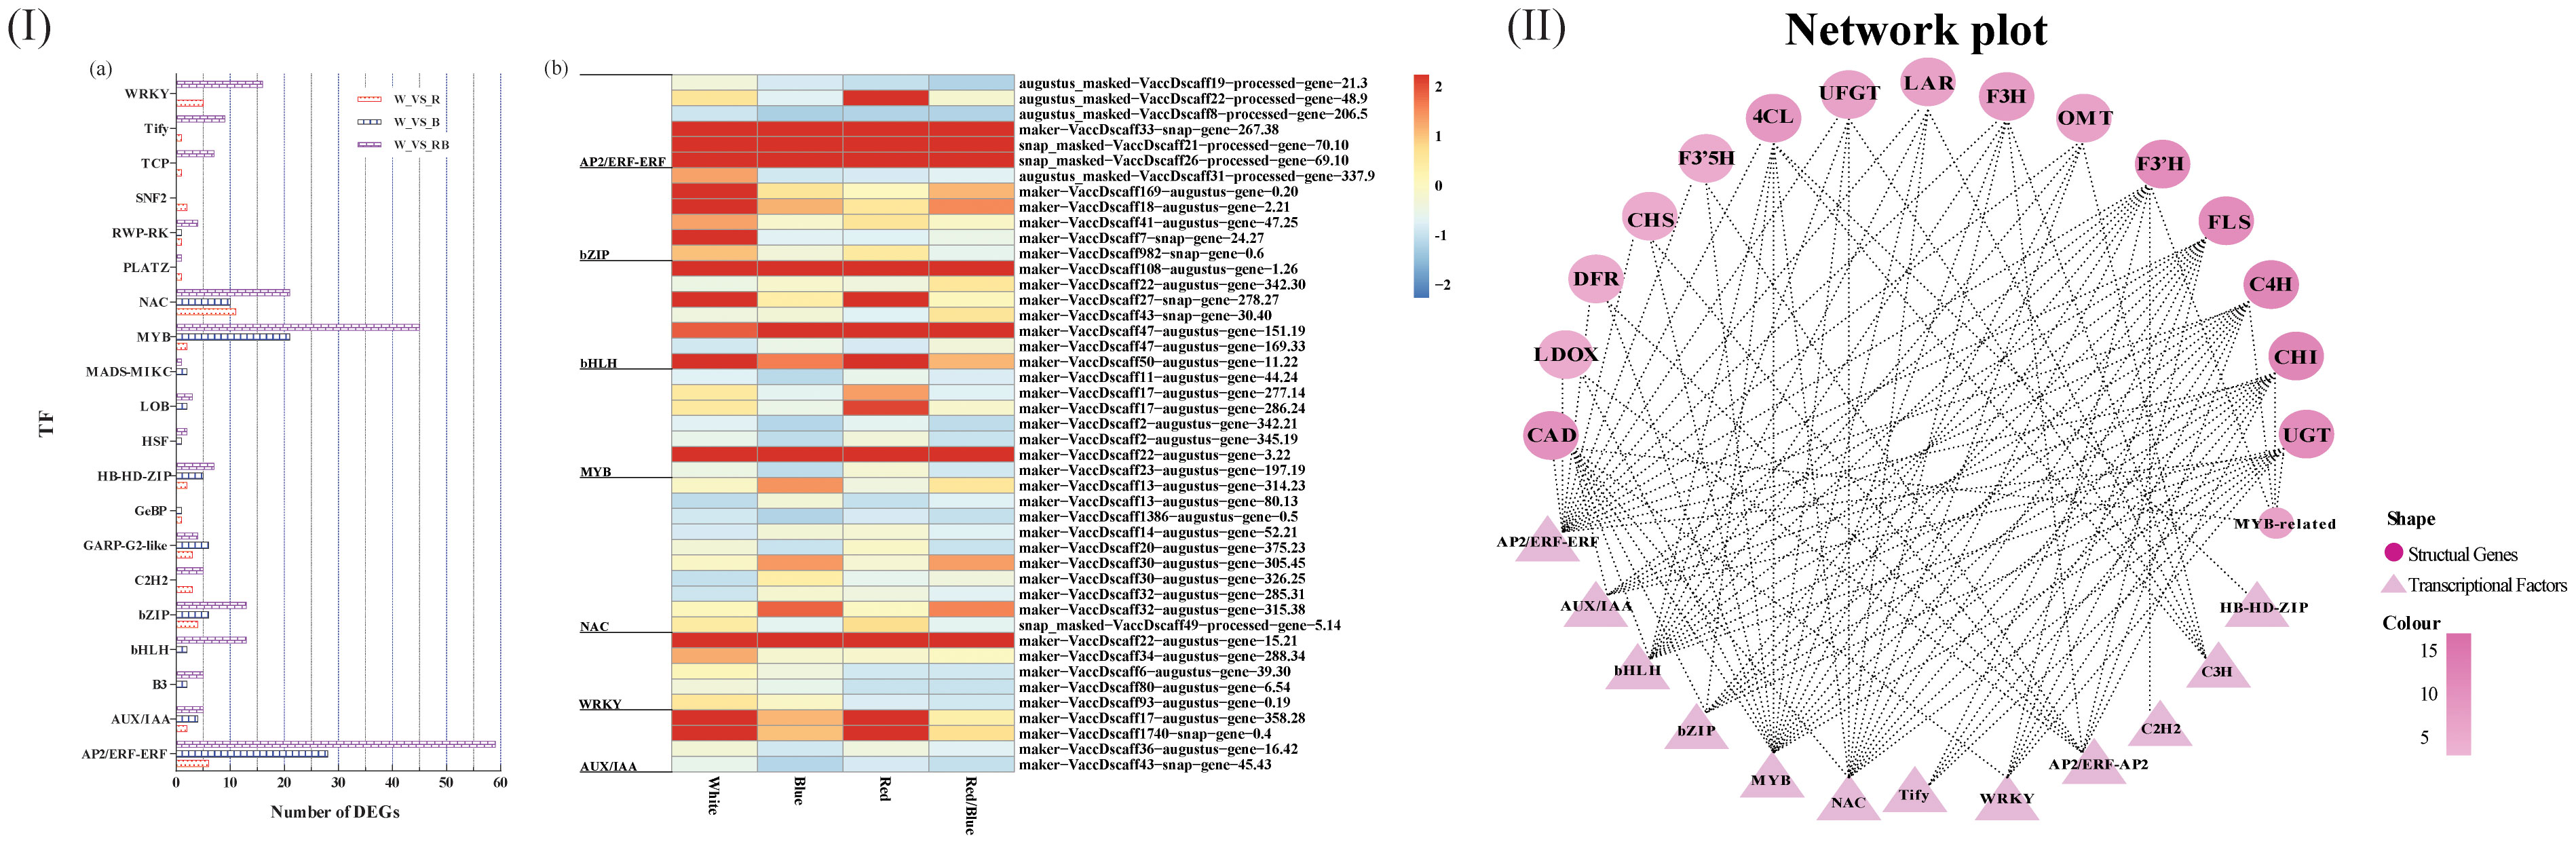
Figure 4 Distribution of the differentially expressed transcription factors (TFs) and co-expression networks between candidate genes and transcription factors. (I) Quantitative statistics for the differentially expressed TFs (A) and a heatmap showing the candidate TFs under various light qualities (B); (II) Co-expression networks between differentially expressed structural genes involved in the anthocyanin and flavonoid biosynthetic pathway and differentially expressed TFs under different light spectra.
TFs regulate gene expression patterns by acting as activators or repressors to induce or inhibit gene promoter activity. There is a potential regulatory mechanism by which differentially expressed TFs (DETFs) may influence anthocyanin biosynthesis by adjusting the expression levels of the DEGs implicated in anthocyanin accumulation under different light qualities. To verify this hypothesis, co-expression networks were established between the TFs and genes using gene expression profile data based on the correlation coefficient. The resulting co-expression networks indicated that different TFs connected distinct genes, and there were correlations among them (Figure 4II). TFs (MYB, NAC, and bHLH) connected more genes related to anthocyanin accumulation, and these TFs were highly expressed in blueberry leaves under blue light.
To further validate the comparative transcriptome results, the transcript level variances of some putative genes or TFs related to anthocyanin accumulation were evaluated by qRT-PCR analysis with three biological replicates (Figure 5). Structural genes, including F3H, LDOX, OMT, and UFGT, involved in the anthocyanin biosynthesis pathway exhibited similar dynamic trends, with the highest transcript levels under blue light, followed by red/blue, red, and white. The expression level of DFR was the highest under red/blue light, and the effect of inducing DFR transcripts was the least significant under white light. The transcript level for UFGT was the lowest under red/blue light, and its peak occurred under blue light. Moreover, the transcript level for the OMT was second highest under the red/blue light. These expression trends agreed with the alterations in gene expression detected by the transcriptome analysis, corroborating the RNA-sequencing data. These results coincided with the dynamic changes in anthocyanin content under different light qualities (they were highest in blue light, followed by red/blue, red, and white light), indicating that these structural genes may play a role in anthocyanin biosynthesis in blueberry leaves in response to the different spectra. The expression levels of the TFs (AP2/ERF-AP2, bZIP, NAC, and WRKY) were higher in the blue, red, and red/blue lights than in the corresponding control (white light). Moreover, a correlation analysis of the gene expression results was obtained using qRT-PCR and RNA-Seq data under different light qualities and a close connection was identified between them (correlation coefficient: R2 = 0.908). The high consistency between the RNA-Seq and qRT-PCR results suggested that the RNA-Seq data were reliable for evaluating the regulation of gene expression under different light quality treatments in blueberry leaves.
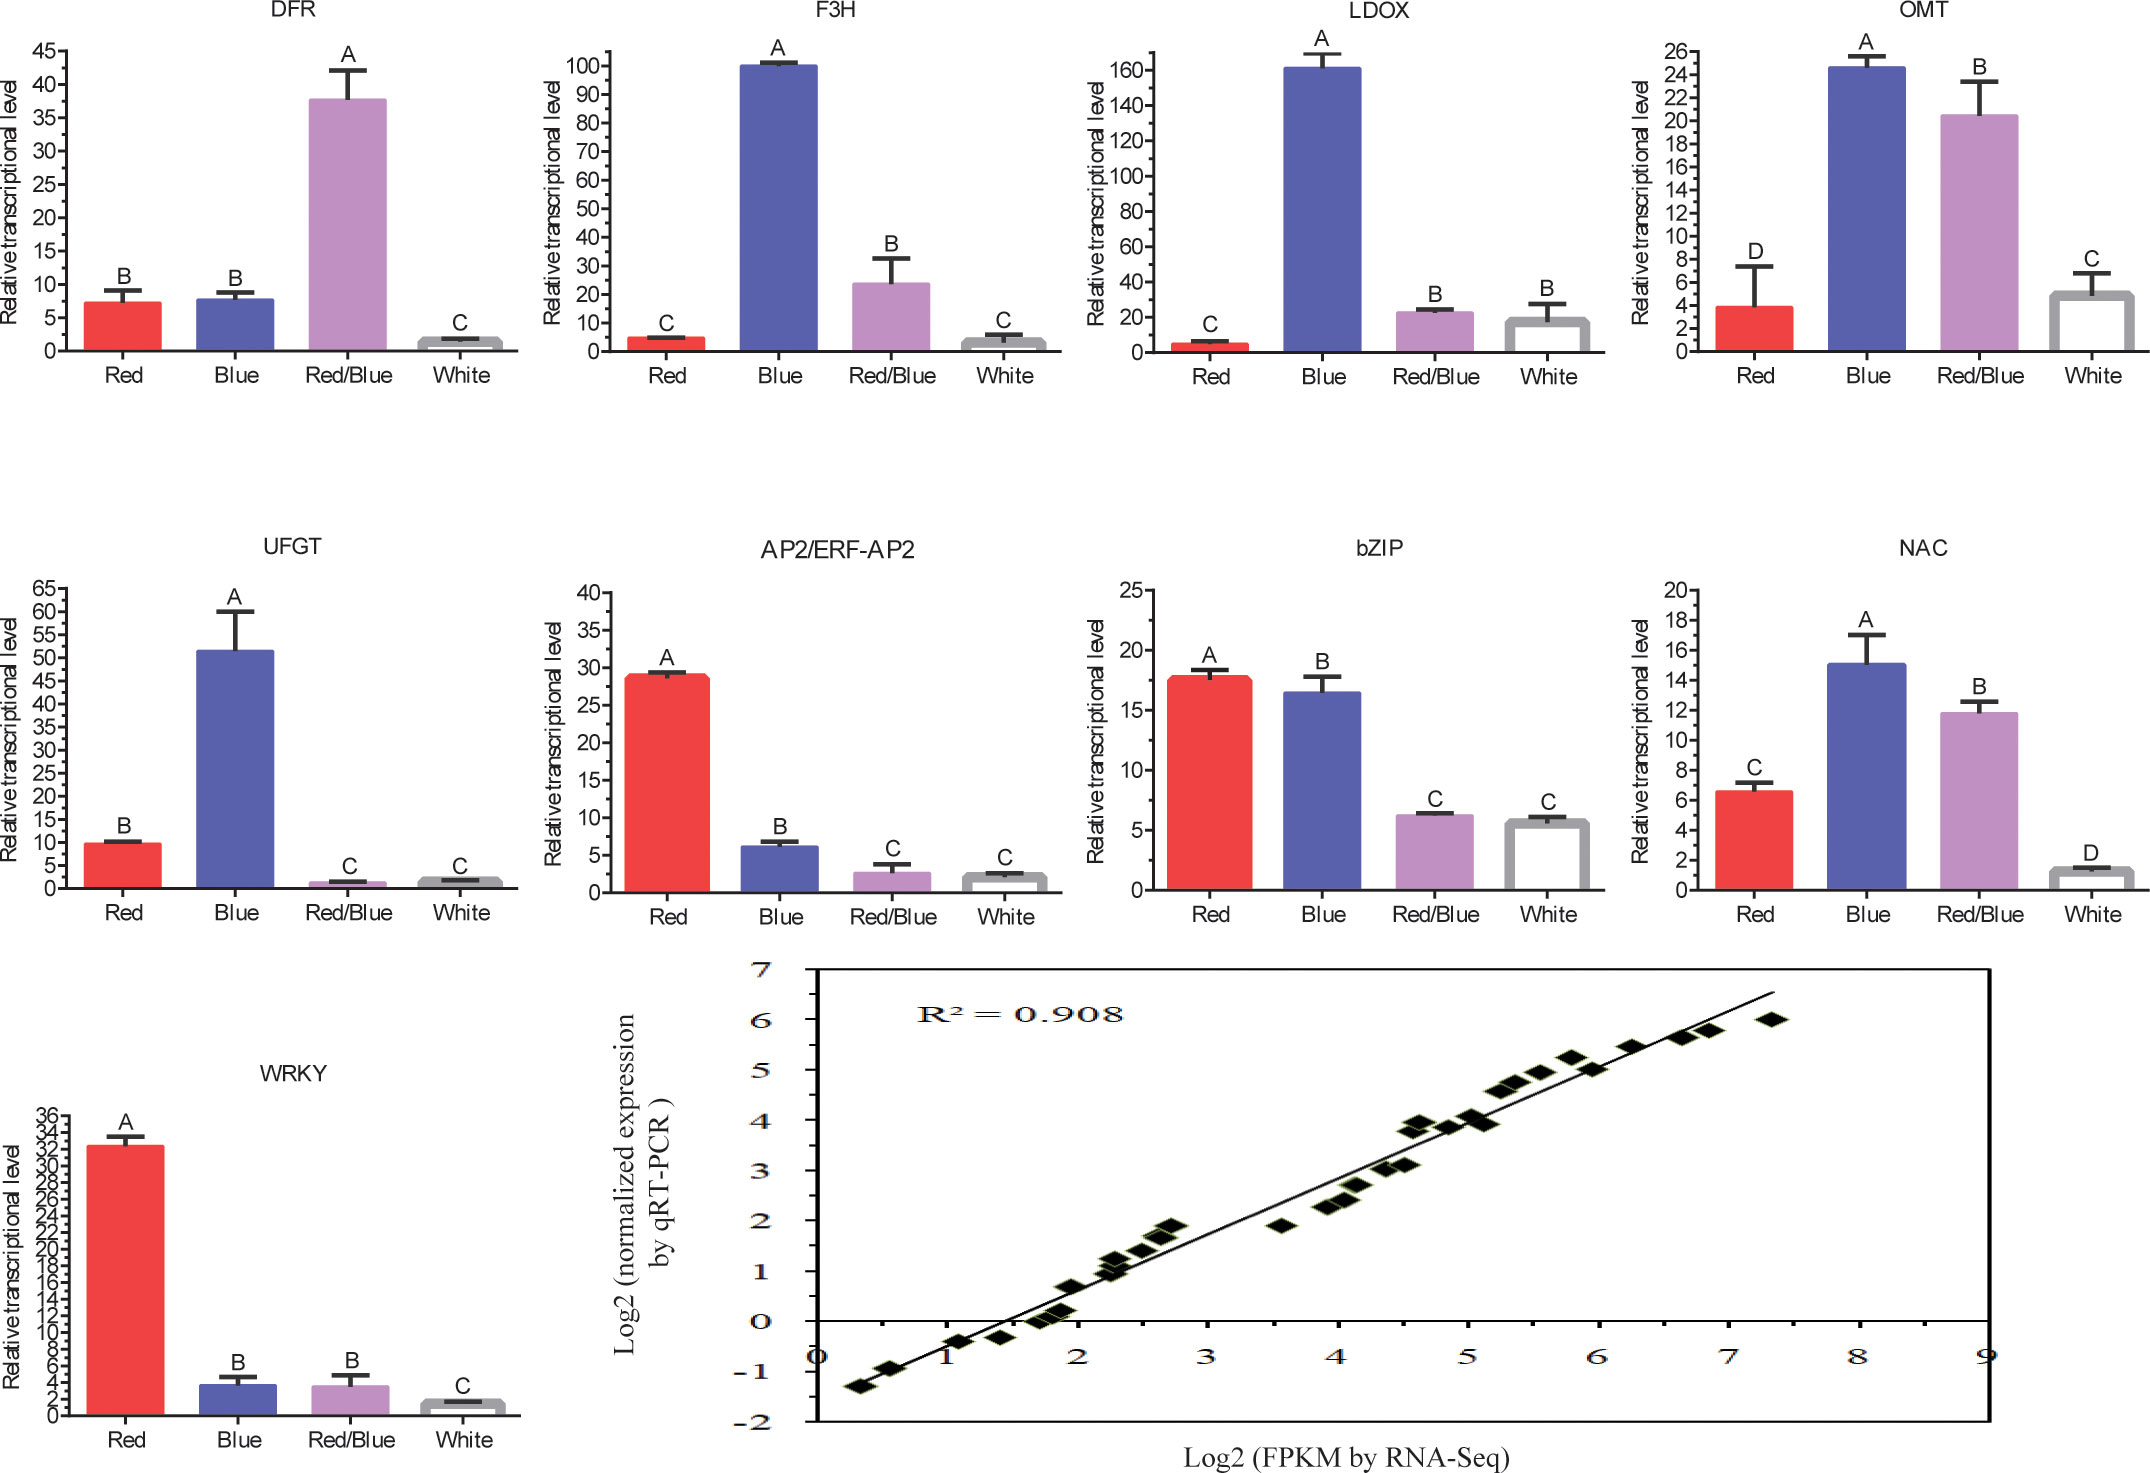
Figure 5 Quantitative RT-PCR validation of the structural genes involved in the anthocyanin biosynthesis pathway and transcription factors and the correlation analysis of the gene expression results obtained from the qRT-PCR and RNA-Seq under different light qualities (red, blue, red/blue, and white). The x-axis represents the different light qualities while the y-axis represents the relative expression of each gene. Capital letters indicate significant differences at P < 0.01 among the different treatments. Error bars represent the standard deviation based on three replicates.
To compare the metabolite compositions associated with anthocyanin accumulations in the blueberry leaves under different light conditions, the major anthocyanins were determined using LC-MS/MS. In total, 108 anthocyanidins were detected and grouped into eight categories (Figure 6I). The largest category (pelargonidin) contained 19 metabolites, followed by cyanidin (n=17), peonidin (n=17), delphinidin (n=16), and malvidin (n=13). The PCA for the anthocyanin derivatives was used to classify twelve samples into four distinct clusters, accurately reflecting the four light quality treatments for the blueberry leaves (Figure 6II). In this model, the secondary principal component (PC2; 22.66% of the total variables) was clearly separated between blue and red/blue light. The differences between the white and red light resulted from PC1 and PC2 in this model (48.09% and 22.66% of the variables, respectively). An Orthogonal Partial Least Squares-Discriminant Analysis (OPLS-DA) model was performed to identify the differentially accumulated metabolites responsible for metabolic differentiation among the various light quality treatments for the blueberry leaves. A total of 43 (25 up-accumulated; 3 down-accumulated), 41 (7 up-accumulated; 4 down-accumulated), 44 (24 up-accumulated; 3 down-accumulated), and 42 (22 up-accumulated; 1 down-accumulated) metabolites were selected for comparison analysis as follows: blue vs. white, red vs. white, red/blue vs. white, and blue vs. red lights, respectively (Table S7). The hierarchical clustering and correlation analysis exhibited a compact dependence of the anthocyanin metabolites on the different light qualities of the blueberry leaves (Figure 6III). The overall accumulation of the anthocyanin metabolites was higher under blue light than under the other light conditions, and the accumulation of cyanidin, pelargonidin, malvidin, peonidin, and petunidin was significantly higher under the blue and red/blue lights when compared with the white and red lights.
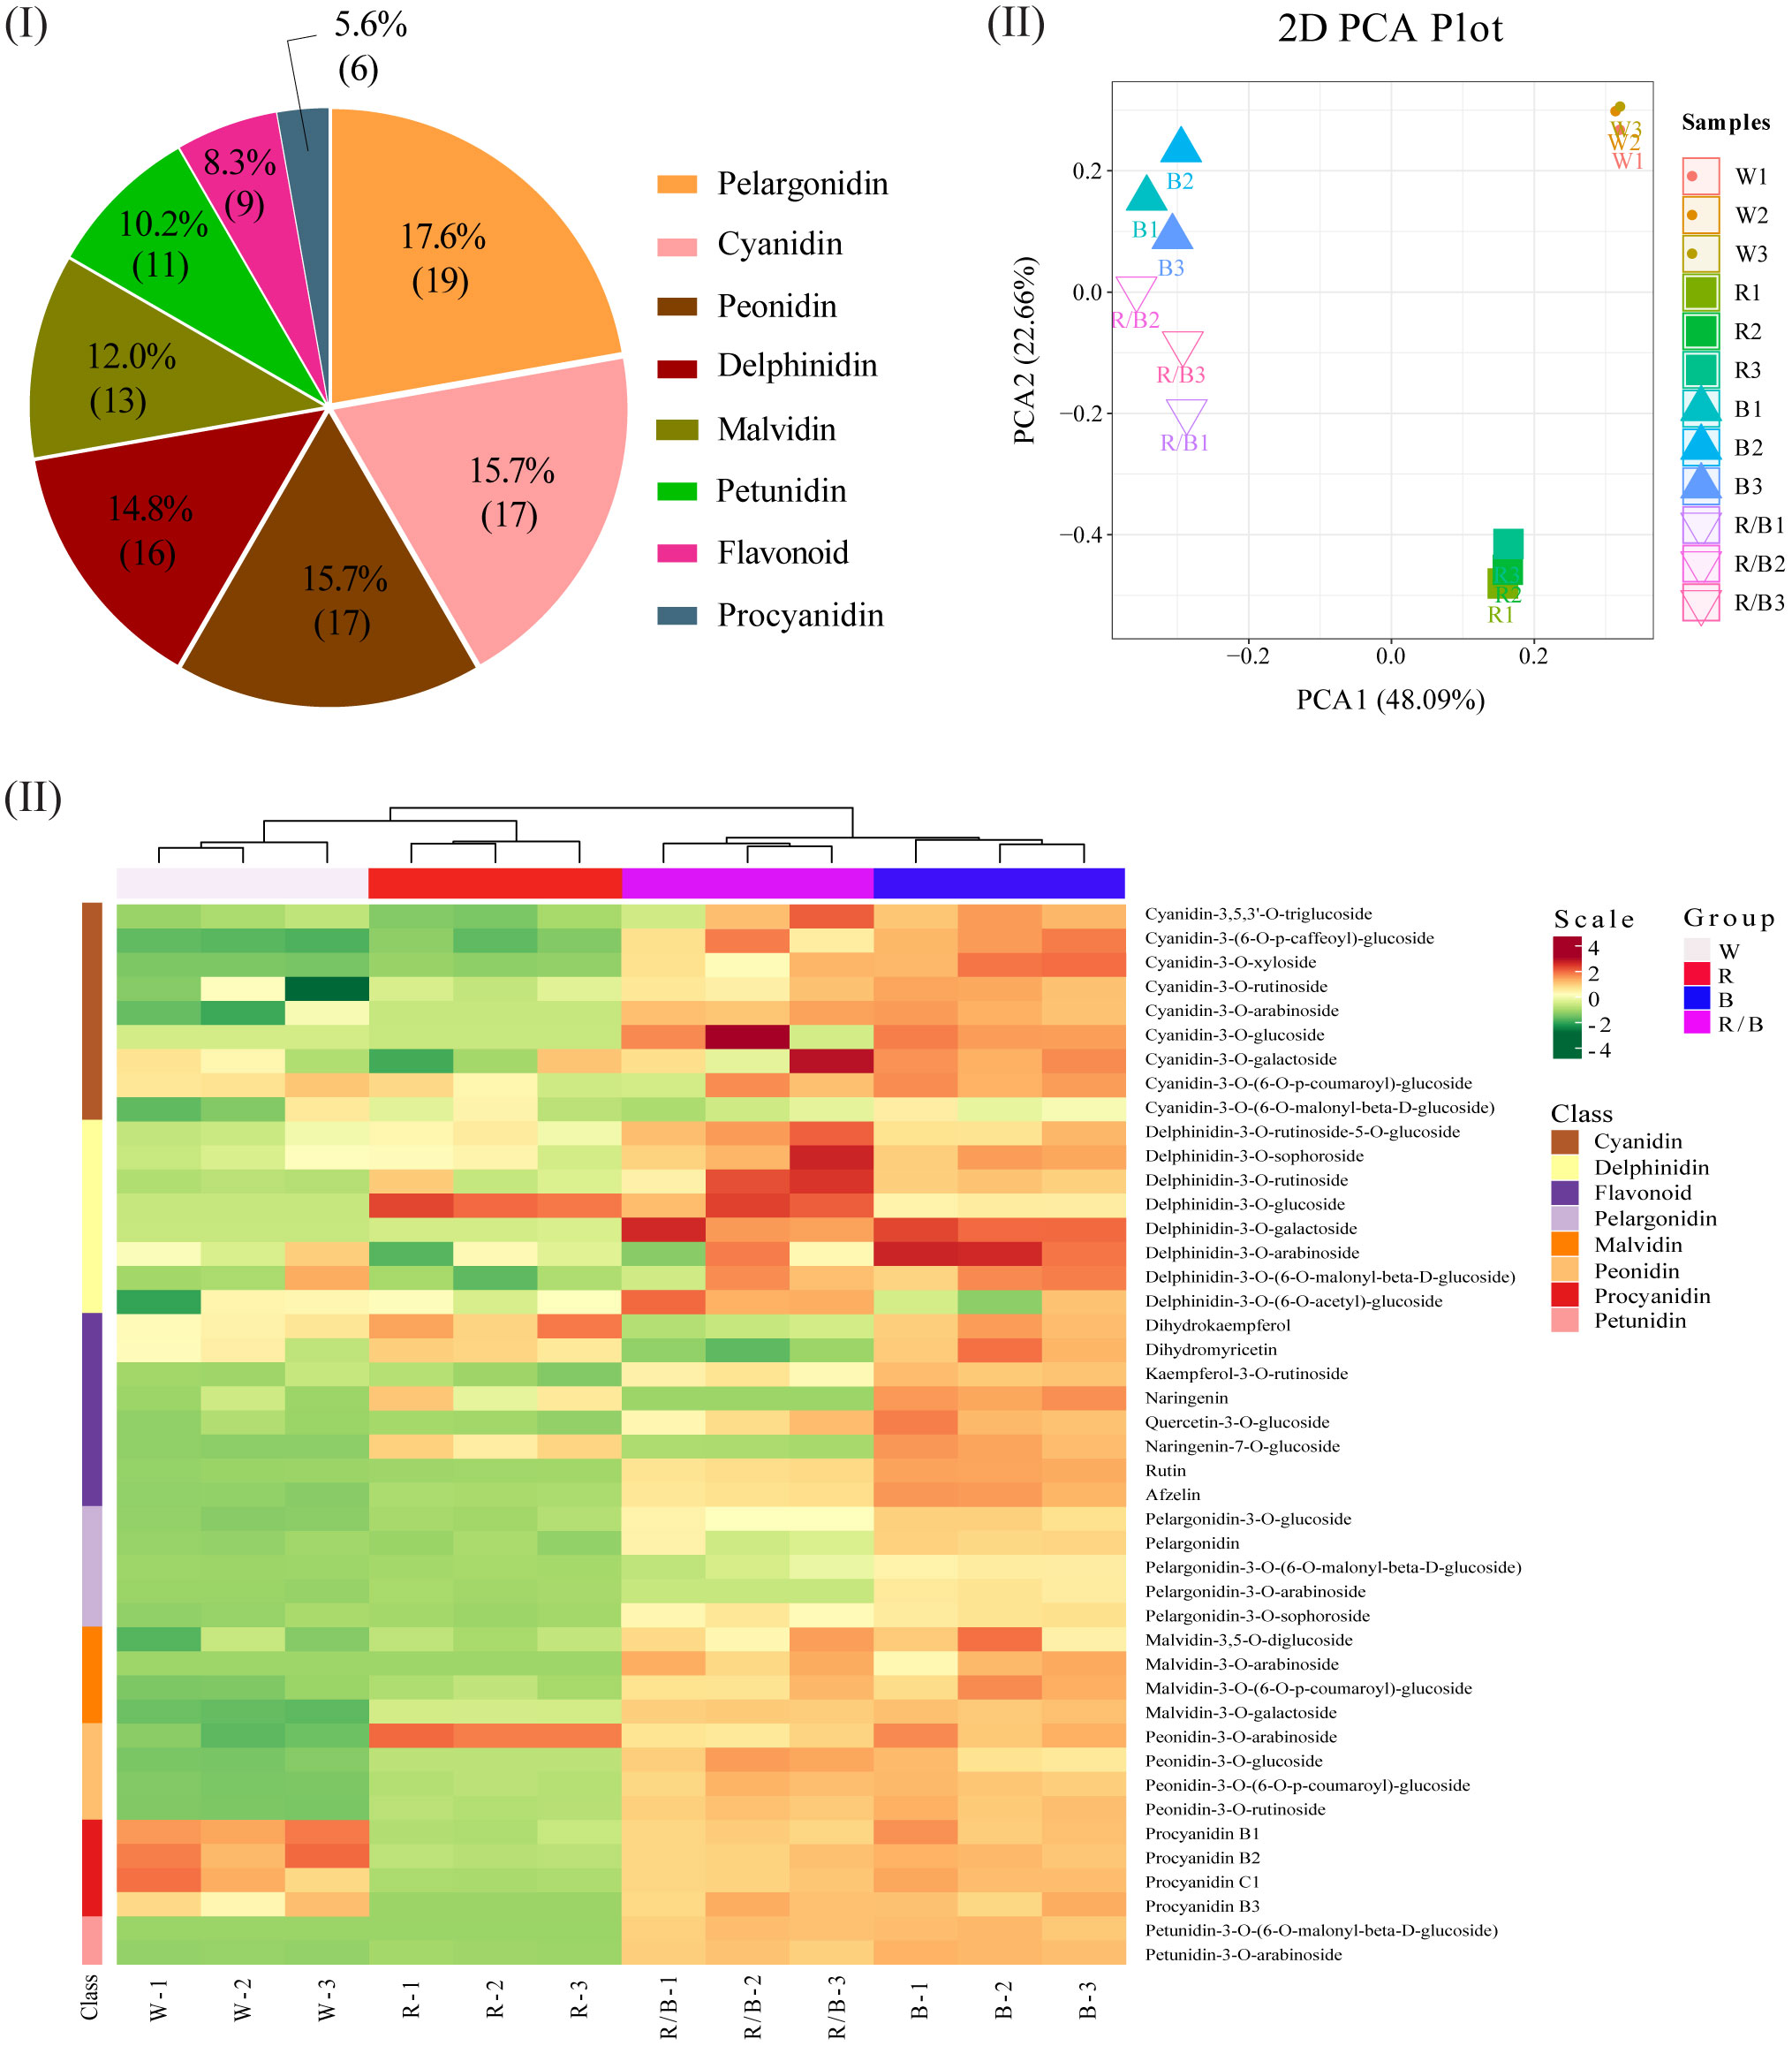
Figure 6 Metabolome profiling of ‘Misty’ blueberry leaves under different light qualities: white (W), red (R), blue (B), and red/blue (R/B). (I) Primary classification of the metabolites identified in the leaves. (II) Principal component analysis (PCA) scores for the leaves under different light qualities for the first component (PC1) and second component (PC2). (III) Hierarchical clustering and correlation analysis of the leaf metabolites under different light qualities.
Based on the KEGG database annotation, 44 metabolites were found to be involved in the anthocyanin biosynthesis pathway and the identified anthocyanin derivatives and their relevant compounds were rearranged based on their corresponding positions in the anthocyanin biosynthesis pathway, which were established based on the KEGG, PMN, and literature references. Among them, two naringenins (Ng), one dihydrokaempferol (Dk), one kaempferol (Ka), three flavones, nine cyanidins (Cy), four peonidins (Pn), five pelargonidins (Pg), one dihydromyricetin, eight delphinidins (Dp), two petunidins (Pt), four malvidins (Mv), and four proanthocyanidins (Pa) were identified (Figure 7). Each metabolite in the anthocyanin biosynthesis pathway differed significantly under the different light conditions in the blueberry leaves. Interestingly, the content for most metabolites was highest under the blue light but lowest under the white light, suggesting that the blue light was beneficial in promoting anthocyanin accumulation in blueberry leaves. The dynamic changes in the content of metabolites in the anthocyanin biosynthesis pathway were consistent with the variations in the expression levels for the genes related to anthocyanin accumulation under the different light qualities. Among all anthocyanin derivatives, the quantification of Cy-type, Pg-type, and Mv-type derivatives were more advantageous under blue light than under other light qualities. However, the combination of blue and red light could dramatically improve the Dp-type, Pn-type, and Pt-type derivative content.
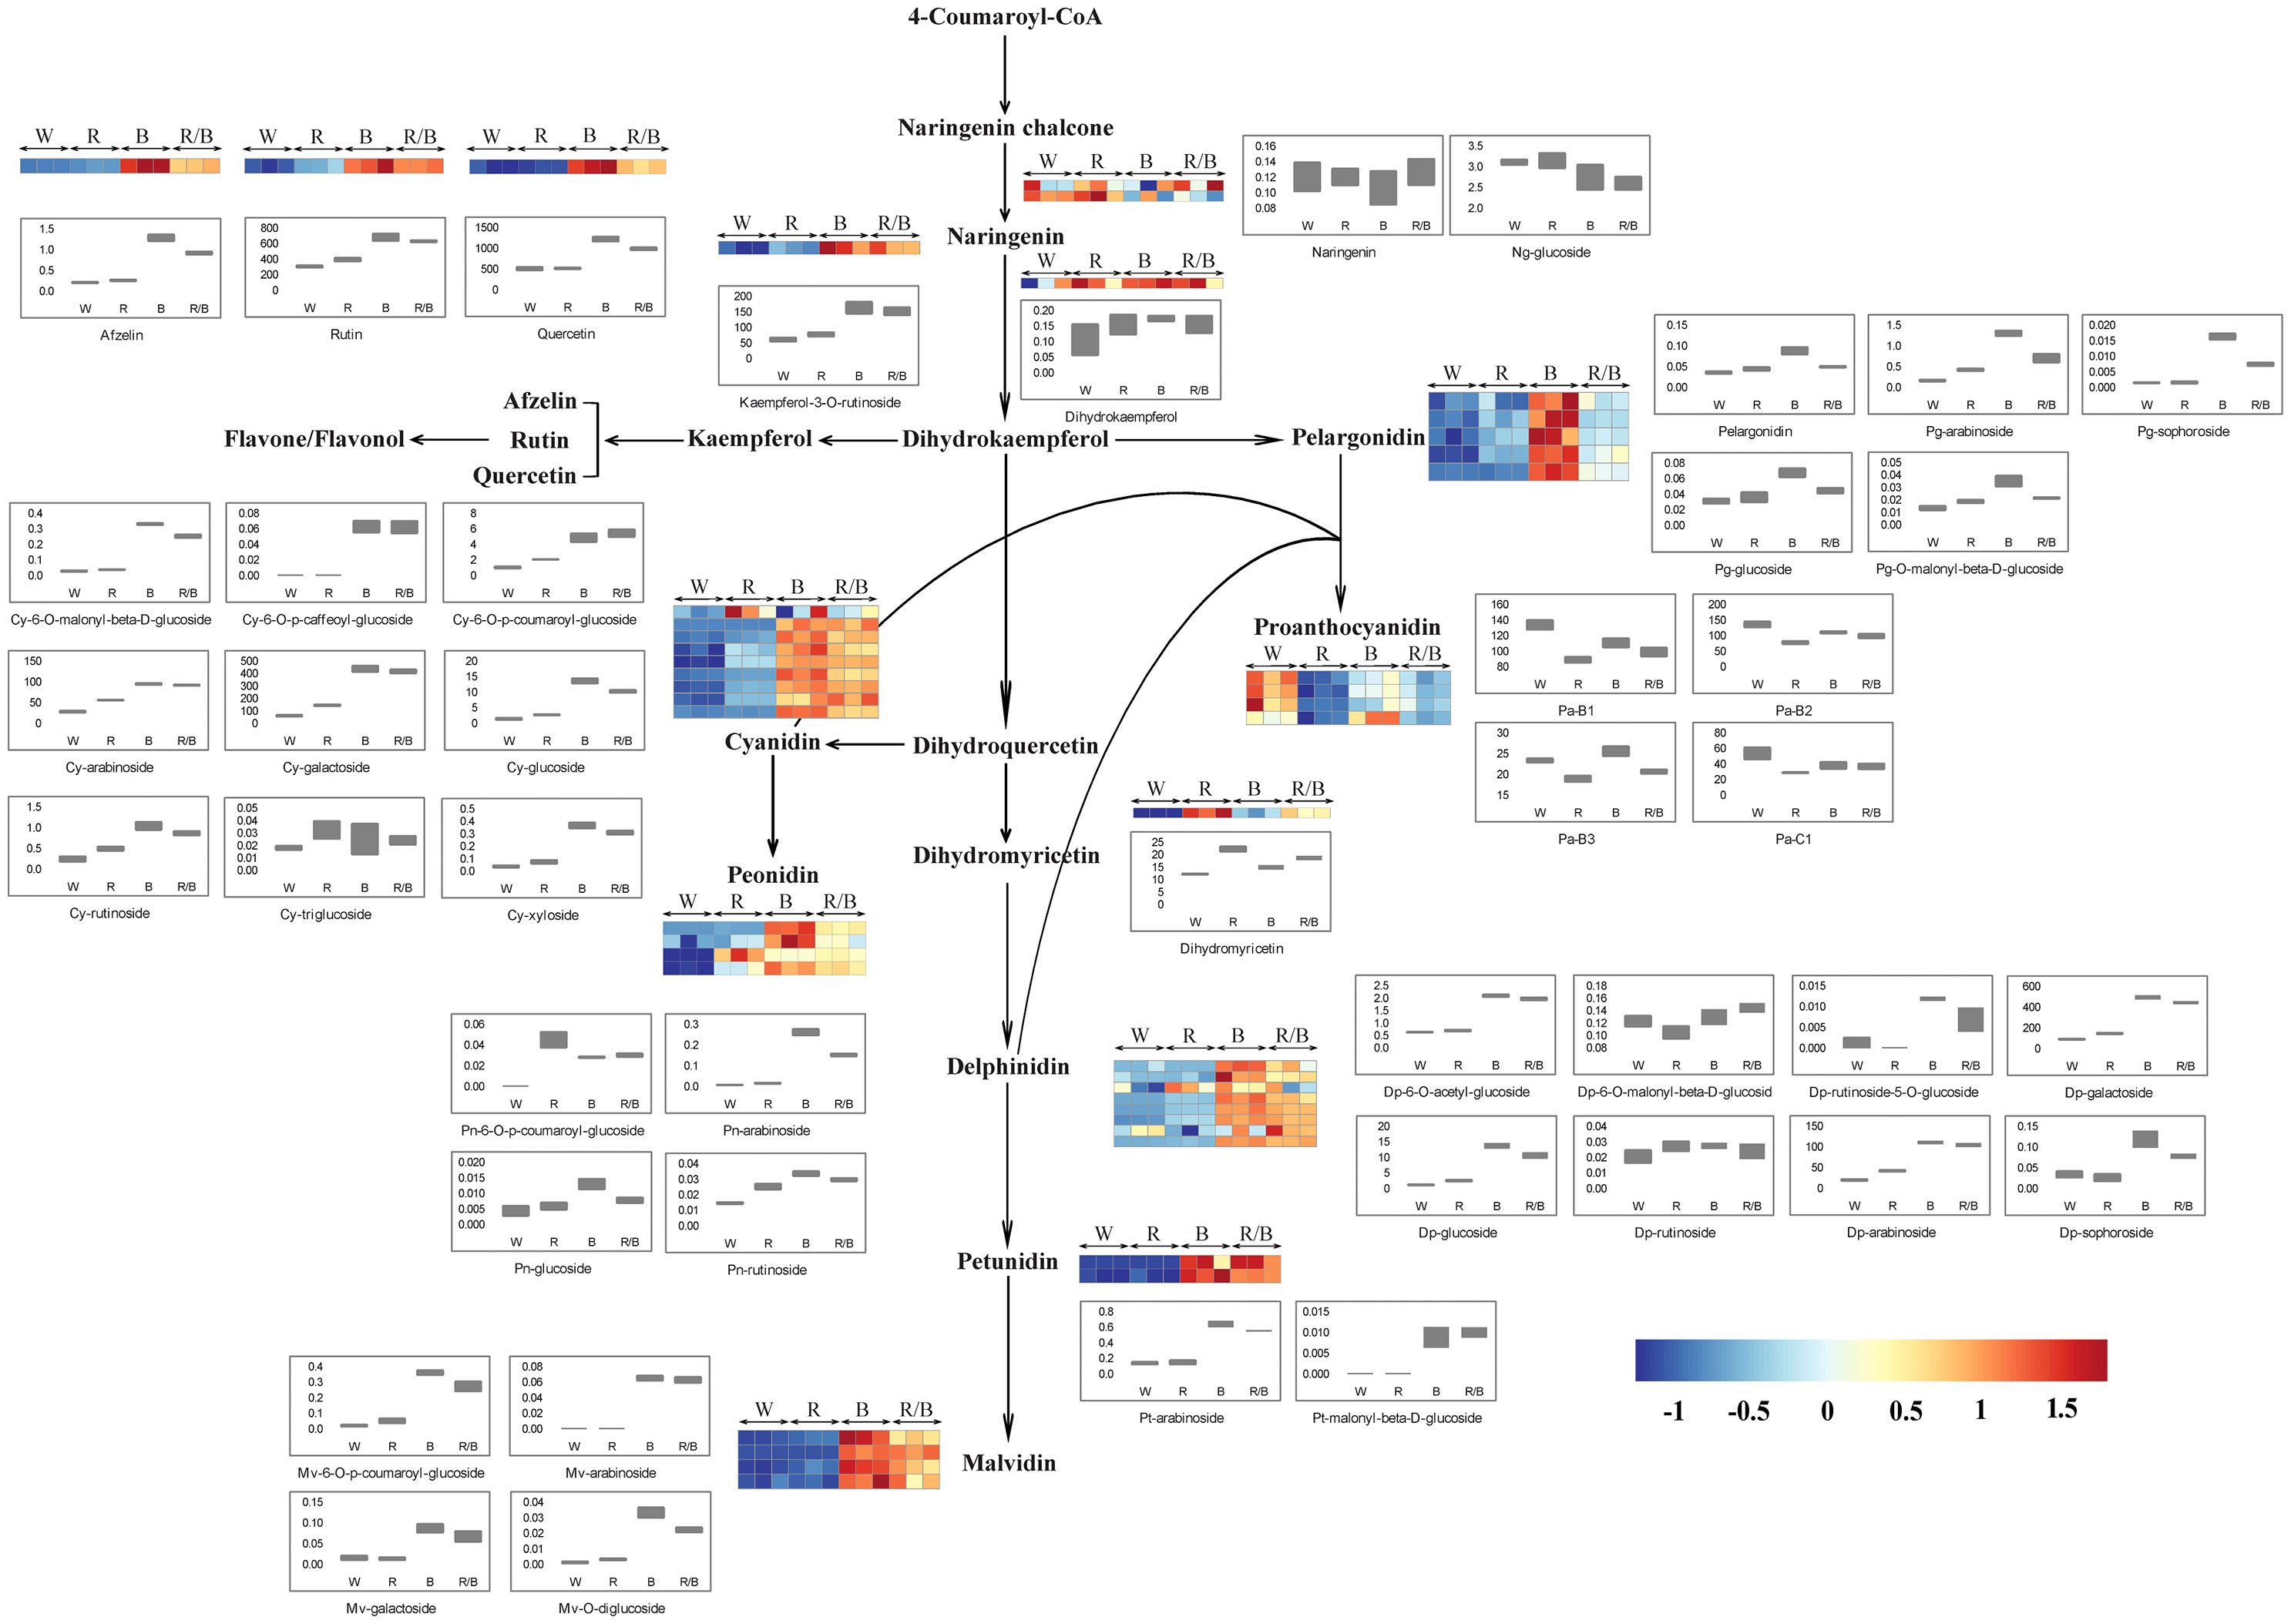
Figure 7 Model showing the changes in the abundance of anthocyanin and flavonoid biosynthesis pathway metabolites in blueberry leaves under different light qualities. The model was constructed based on the KEGG pathway and a literary reference. Ng, naringenin; Pg, pelargonidin; Cy, cyanidin; Pa, proanthocyanidin; Pn, peonidin; Dp, delphinidin; Pt, petunidin; Mv, malvidin; W, white; R, red; B, blue; R/B, Red/Blue; Each colored unit represents the normalized intensity of each compound ion according to the color scale (three biological replicates × four treatments, n=12). Box-and-whisker plots show the changes in the metabolites for each treatment. Maximum and minimum values of a metabolite among three biological replicates are represented at the upper and lower ends of the whisker, respectively.
To understand the regulatory networks for the anthocyanins that were implicated in the differential distribution of anthocyanin derivatives under the different light qualities, we performed an integrated analysis of the core differentially accumulated metabolites (DAMs) and DEGs related to anthocyanin accumulation in the four comparisons (blue vs. white, red vs. white, red/blue vs. white, and blue vs. red). Based on the above results, the DEGs related to secondary metabolism, carbohydrate metabolism processes(photosynthesis), anthocyanin biosynthesis, and anthocyanin derivatives of Cy, Dp, Ng, Pg, Pa, Pn, Pt, and Mv were used to perform an interaction network based on the Pearson correlation analysis. In this interaction network, genes and metabolites were closely related, and positive and negative correlations between gene expression levels and anthocyanin accumulation content were discovered (Figure 8; Table S8). In contrast to the comparison between red and white (28), there were much stronger correlations between DAMs and DEGs in both comparisons with blue vs. white (57) and red/blue vs. white (56). This result demonstrated that the blue light or blue/red combination may play a more prominent role in promoting the biosynthesis and accumulation of anthocyanins because there were more DAMs and DEGs related to anthocyanin formation. Because of the changes in DAM content and the DEG transcriptional level, the color and anthocyanin content of the blueberry leaves differed significantly under different light qualities. In the blue vs. white correlation network, there was a close correlation between Cy and LDOX, Mv and OMT, and Pg and UFGT levels. LDOX, OMT, and UFGT are upstream regulatory genes for Cy, Mv, and Pg synthesis in the anthocyanin pathway, and their high expression contributes to Cy, Mv, and Pg accumulation, respectively. Based on the results of the analysis of the DEG transcriptional profile and DAM metabolic profile, the expression levels of LDOX, OMT, and UFGT and the contents of the Cy, Mv, and Pg derivatives were highest under blue light. This validated the idea that blue light induced substantial accumulation of the Cy, Mv, and Pg derivatives via the promotion of LDOX, OMT, and UFGT expression, respectively, further facilitating anthocyanin synthesis. A similar phenomenon was also found in the red/blue vs. white correlation network: there were higher expression levels of DFR and OMT, greater accumulation of Dp, Pn, and Pt derivatives, and an intimate connection between DFR and Dp, OMT and Pn, and OMT and Pt under a combination of red and blue lights. DFR and OMT induced the synthesis of Dp, Pn, and Pt derivatives, leading to an increase in anthocyanin content under the red/blue light in the blueberry leaves. Additionally, in the blue vs. red correlation network, UFGT and OMT were closely connected with Pg and Pn, respectively. Among the DEG transcriptional profiles and DAM metabolic profiles with the comparison of blue vs. red, the transcript levels of UFGT and OMT and the accumulations of Pg and Pn were higher in blue when compared with red. This further indicates that UFGT and OMT play vital roles in promoting Pg and Pn accumulation, respectively.
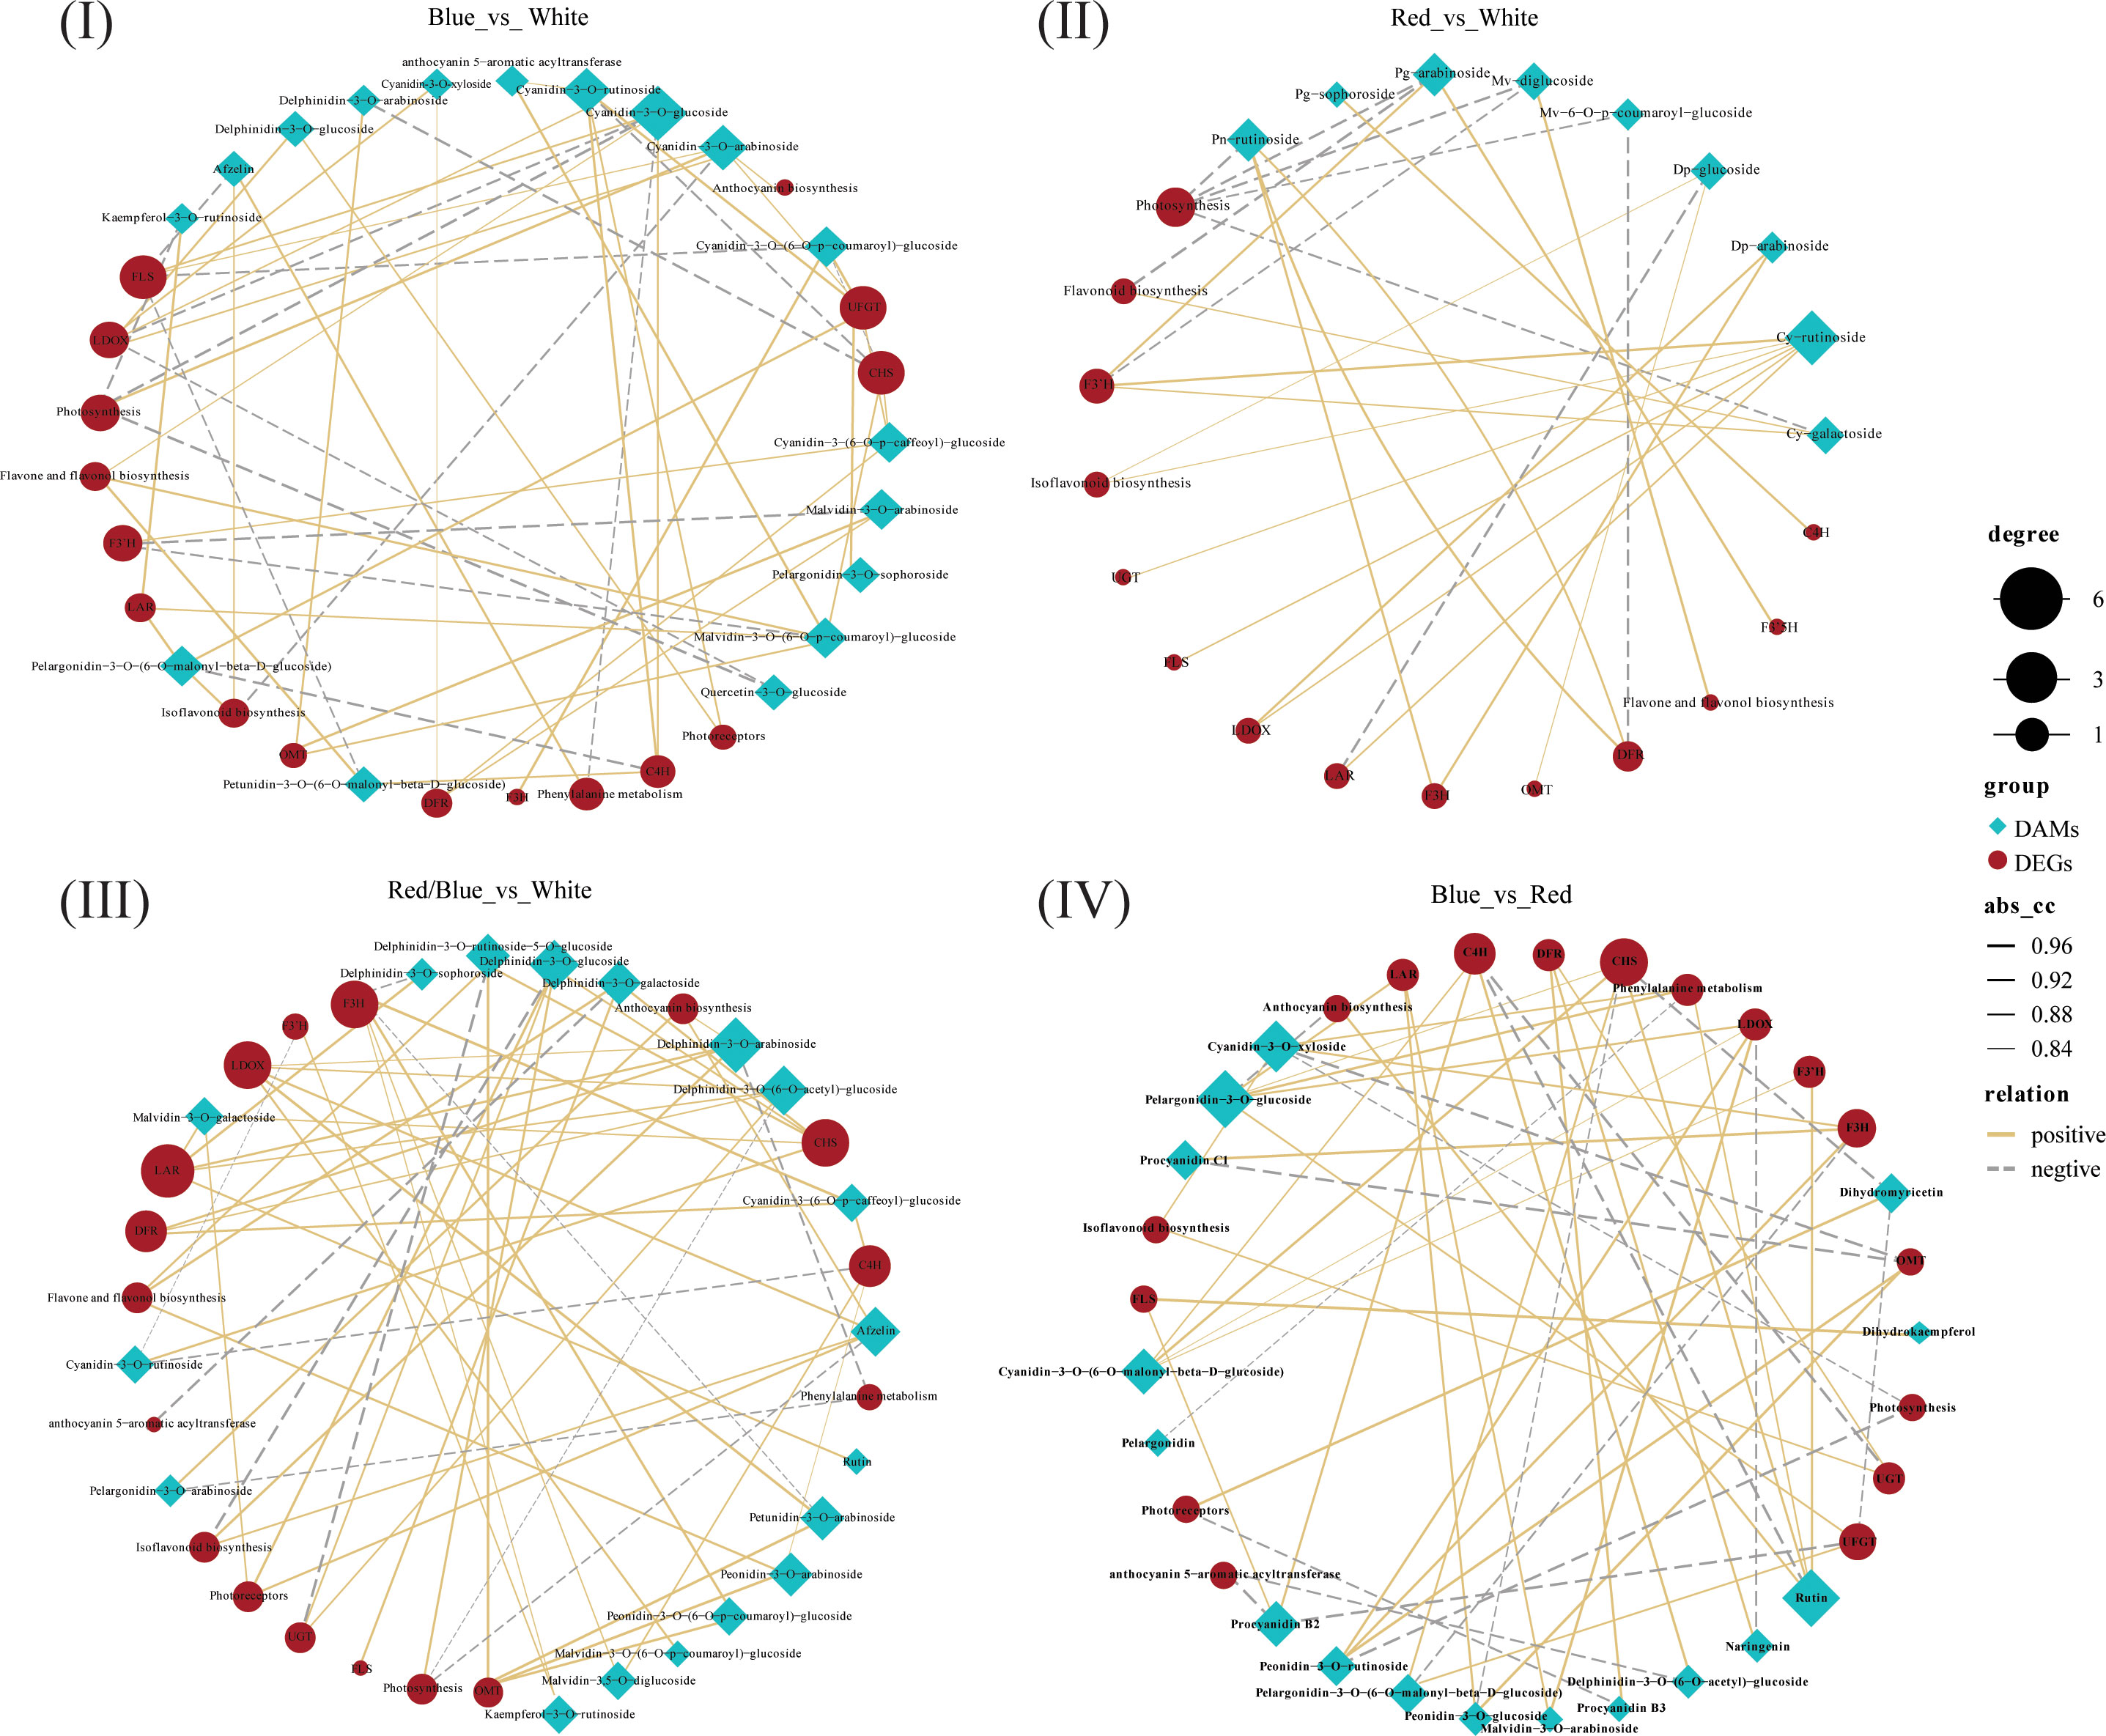
Figure 8 Results of the correlation analysis for the differentially expressed genes (DEGs) and differentially accumulated metabolites (DAMs) involved in the anthocyanin biosynthesis pathway of blueberry leaves based on the correlation coefficient (CC) and the p-value for the correlation coefficient (CCP) between DAMs and DEGs. Analysis of (I) blue vs. white, (II) red vs. white, (III) red/blue vs. white, and (IV) blue vs. red. The size of the black dots indicates the number of connected DAMs or DEGs; the width of the connecting lines indicates the strength of the correlation; solid lines indicate positive correlations and dashed lines indicate negative correlations.
Blueberry is a commercially popular small fruit crop with leaves and fruit that are abundant in anthocyanins, which are secondary metabolites considered beneficial for human health (Hou et al., 2011; Norberto et al., 2013; Zhou et al., 2013). Under natural growth conditions, the biosynthesis of anthocyanins is dramatically affected by light, including both light quality and intensity. This occurs via regulatory gene activity and key metabolites level associated with anthocyanin biosynthesis that can modulate anthocyanin content and pigmentation activity (Dixon and Paiva, 1995; Chalker-Scott, 1999; Jaakola, 2013; Ottosen et al., 2015; Ma et al., 2019), among which, the light quality plays a more critical role (Briggs and Olney, 2001; Zoratti et al., 2014). However, little is known about the molecular mechanisms underlying the changes in anthocyanin content in response to different light qualities in blueberry leaves. In this study, an integrated analysis of the transcriptome and metabolome during anthocyanin biosynthesis under different light qualities was carried out, which allowed us to gain insight into the key metabolites, genes, and metabolic pathways involved in anthocyanin biosynthesis and accumulation in blueberry.
During the development of green tissues (such as leaves, flower buds, and stems) and tissue-cultured cells, light promotes the accumulation of anthocyanins by activating gene transcript levels related to anthocyanin metabolic pathways (Uleberg et al., 2012; Zhang et al., 2021a). In the early stages of anthocyanin synthesis, the expression patterns of related genes can be regulated by different light qualities and intensities, and this expression pattern is dramatically changed and accompanied by distinct species. For example, anthocyanin accumulation within the blueberry peel is significantly affected by light, the content of anthocyanin and expression level of genes related to anthocyanin synthesis pathway were significantly different under various light treatments including: intensity 100%, 50%, and 20% (Guo et al., 2021). Moreover, the differences in the light qualities on the anthocyanin biosynthesis also were significant. Compared with the white control film, the red and yellow films led to a substantial increase in the total anthocyanin content (TAC), while the green and blue films caused a decrease in TAC. The colored film treatment also significantly affects the related enzyme activity and the expression of structural genes and transcription factors in strawberry fruits (Miao et al., 2016). Other studies have shown that the anthocyanin content of purple celery was significantly higher with the blue light treatment when compared with the other light quality conditions (red, green, yellow, and fluorescent lamps) (Field et al., 2001; Neill and Gould, 2003; Hughes et al., 2005). In this study, we measured the anthocyanin content in blueberry leaves under different light qualities and found that the maximal accumulations occurred with blue light, followed by red/blue, red, and white (control). Compared with the white light, the blue, red, and red/blue combination could markedly enhance the accumulation of anthocyanin, but the effects of the other light qualities varied. Blue light was more favorable for the accumulation of anthocyanin than red, red/blue, and white light in blueberry leaves, which is consistent with a previous report on wild-type petunias, in which blue light radiation significantly increased the anthocyanin content in leaves (Nick et al., 2009; Tao et al., 2018), while red light has been reported to promote anthocyanin accumulation in strawberry fruit (Fragaria ananassa) (Miao et al., 2016). The impacts of the different light qualities on the anthocyanin content differed markedly between plants and tissues. Additionally, the effects of the red/blue combination were intermediated between blue and red lights, indicating that the functions among the blue and red lights on anthocyanin biosynthesis were redundant.
In this investigation, we discovered that there was an opposing trend between anthocyanin synthesis and photosynthesis: blue light promoted anthocyanin accumulation, but decreased photosynthesis; while photosynthesis was highest and the anthocyanin content lowest in white light when compared with the other light conditions. An increase in the accumulated anthocyanin causes the leaf color to turn from green to light-red as it decreases the chlorophyll content, and reduces the chlorophyll a/b ratios, resulting in reduced photosynthesis in broadleaf evergreen species (Hughes and Smith, 2007). In contrast, anthocyanin biosynthesis indirectly affects the circadian leaf starch metabolism and attenuates the sugar-promoted feedback resulting in the down-regulation of photosynthesis. The lower the observed photosynthesis rate decrease in red leaves with higher anthocyanin content than in the green leaves with lower anthocyanin accumulation (Landi et al., 2015; Piccolo et al., 2018). To some degree, the accumulation of anthocyanin inhibits photosynthesis (Piccolo et al., 2020). The blueberry leaves were treated with different light qualities and this affected the anthocyanin content which was significantly higher, but photosynthesis was lower under the blue and red/blue combination lights than under white and red lights. This is in accordance with previous reports, in which an increase in anthocyanin accumulation was accompanied by a reduction in photosynthesis (Murakami et al., 2008). Another explanation is that the abundant accumulation of anthocyanin in the leaves appeared to screen underlying photosynthetic tissues, increasing light saturation and compensation points, reducing the maximal photosynthetic assimilation rate (Amax) (Nick et al., 2009). Notwithstanding the insights proposed by these investigations, the correlation and regulatory mechanism between anthocyanin accumulation and photosynthesis is yet to be defined under different light qualities, and future studies on blueberry leaves and other plant tissues will be required.
Recently, the integration of large-scale datasets derived from high-throughput functional genomics techniques has been successfully applied to study the functions of genes regulating tissue development, environmental responses, and plant metabolism (An et al., 2020; Raza et al., 2021). Comparative transcriptome analysis of bilberry (V. myrtillus L.), for example, under different light qualities (red and blue) has provided information about the gene transcript level and regulation related to anthocyanin biosynthesis (Samkumar et al., 2021). Our results showed that the majority of the DEGs in the flavonoid and anthocyanin biosynthesis pathways were up- and down-regulated under different light qualities in blueberry leaves using RNA-Seq. Anthocyanins are biosynthesized via a branch of the flavonoid pathway, and their synthesis is affected by the presence or absence of upstream genes. The anthocyanin biosynthesis pathway is relatively clear in plants, and related key structural genes, including C4H, 4CL, CHS, CHI, OMT, F3’H, F3’5H, DFR, LDOX, LAR, UFGT, UGT, and FLS, which have been identified in the colored tissues of several plants (Gao et al., 2021). Blue light has been identified as a strong positive influence on anthocyanin biosynthesis in numerous fruit crops, for instance, in sweet cherries (Kokalj et al., 2019). Red light can also do it in similar ways (Zhang et al., 2018). Our results showed that blue and the red/blue light combination up-regulated most of the anthocyanin biosynthesis genes, including CHS, CHI, F3H, DFR, LDOX, OMT, and UFGT, in blueberry leaves, and this led to a higher accumulation of anthocyanin under both blue and red/blue light combination treatments when compared with white light. It should be noted that multiple unigenes were annotated as the same enzyme in this study. For example, three CHS-encoding genes and two DFR-encoding genes were identified. The main reason for this was that these unigenes belong to different selective splicing transcripts as well as a specific gene family (Yang et al., 2005).
The photoreceptor can induce the accumulation of anthocyanin by promoting the expression of anthocyanin biosynthesis genes. Red light, acting via phytochromes, stimulates PAL activity in the cotyledons and hypocotyls of tomato seedlings, and exposure to UV-B has been shown to stimulate PAL activity, thus, increasing anthocyanin content in rice, maize, and turnip plants (Brodenfeldt and Mohr, 1988; Reddy et al., 1994; Sharma et al., 1999). Phytochrome B has a specialized function in red light, whereas cryptochrome senses blue light to promote secondary metabolite synthesis and anthocyanin accumulation. Previous studies have reported that UV light regulates the synthesis of anthocyanins through different photoreceptors, including the UV-B receptor UV RESISTANCE LOCUS 8 (UVR8) (Brown et al., 2005; Christie et al., 2012; Giliberto et al., 2005). In this study, genes related to photoreceptors differed in their expression levels under different light qualities and subsequently played a potential role in anthocyanin accumulation. The DEGs related to phytochromes were highly expressed in response to red light, whereas cryptochrome-related DEGs were substantially expressed under blue light. These results indicate that the transcript levels of these photoreceptor genes were relatively high under their corresponding light quality, while the lowest expression level of the photoreceptor-related genes was observed under white light. Blue and red light may promote anthocyanin biosynthesis by inducing the expression of photoreceptor-related genes to stimulate the gene promoter activity involved in the anthocyanin biosynthesis pathway. Photosynthesis is an important physiological process in plants under light conditions, and the photosynthesis-related DEGs showed an opposite dynamic trend with DEGs related to anthocyanin synthesis in gene expression patterns, which was consistent with their corresponding physiological index content. This result may further confirm the above conjecture that anthocyanin accumulation may restrain photosynthesis to a certain extent in blueberry leaves.
In several cases, changes in the expression of genes related to anthocyanin biosynthesis correspond to changes in the content of anthocyanin derivatives in this pathway (Kyoungwon et al., 2016). Consistent with the transcriptome results, the level of metabolite accumulation in the anthocyanin biosynthesis pathway differed substantially under different light qualities. Anthocyanins are glycosides and acylglycosides of anthocyanidin aglycones that are biosynthesized through the flavonoid pathway via the phenylpropanoid pathway (Stushnoff et al., 2010; Jaakola, 2013). Among these metabolic pathways, cyanidin (Cy), delphinidin (Dp), pelargonidin (Pg), peonidin (Pn), petunidin (Pt), and malvidin (Mv) are the primary metabolic derivatives that play vital roles in anthocyanin pigmentation (Tahara, 2007). In this study, the accumulation levels of these derivatives differed under different light qualities; blue and red/blue could promote the synthesis of more metabolites than red and white lights could, which was consistent with the total anthocyanin content and leaf color under different light qualities. Among these derivatives, the accumulation of Cy, Pg, and Mv derivatives and Dp, Pn, and Pt derivatives were significantly higher under blue light and the red/blue light combination, respectively (Figure 7). It has been reported that the six anthocyanidins that generally occur in colored tissues are Cy, Pg, Mv, Dp, Pn, and Pt and that they play vital roles in anthocyanin pigmentation and biosynthesis. Additionally, in the correlation network between the transcriptome and metabolome of blue vs. white, Cy, Pg, and Mv were found to be closely associated with LDOX, UFGT, and OMT, respectively. Previous studies have reported that individual enzymes also have an impact on the overall stability of the biosynthesis pathway, as the silencing, over-expression, or heterologous expression of single enzyme genes often leads to substantial changes in the anthocyanin composition of the target tissue (Griesser et al., 2008; Han et al., 2010; Han et al., 2012). Therefore, as regulative downstream materials, the high expression of LDOX, UFGT, and OMT resulting in the abundant accumulation of Cy, Pg, and Mv under blue light in blueberry leaves. Similarly, in the red/blue vs. white correlation network, similar relationships were observed between Dp, Pn, and Pt and DFR and OMT. The expression levels of DFR and OMT were higher, when accompanied by the abundant synthesis of Dp, Pn, and Pt with the combination of the red and blue lights. This is consistent with a previous report by Kyoungwon et al. (2016), in which the Dp derivative was shown to positively correlate with the expression level of genes, including DFR, CHS, and CHI; consequently, the more significant up-regulation of these genes has a role in the more significant accumulation of the Dp derivative. OMT, a vital enzyme gene in the anthocyanin biosynthesis pathway, catalyzes the formation of O-methylated anthocyanins, such as Mv, Pn, and Pt (Koes et al., 2005). High levels of OMT expression can induce the accumulation of Mv, Pn, and Pt under blue and red/blue light. Thus, we concluded that blue and red/blue lights induce the activity of the DEGs associated with anthocyanin biosynthesis and consequently, this facilitates the accumulation of anthocyanins in blueberry leaves under blue and red/blue lights, respectively.
In this study, blue and red/blue, and red lights were found to promote anthocyanin accumulation in blueberry leaves, and there was a redundant function that facilitated anthocyanin biosynthesis and accumulation between the blue and red lights. Additionally, correlation analysis of the changes in gene expression and metabolite levels suggested that blue light induced substantial LDOX, UFGT, and OMT expression to promote the accumulation of cyanidin, pelargonidin, and malvidin anthocyanidins; while the combination of red and blue light facilitated the up-regulation of DFR and OMT, leading to the accumulation of large amounts of downstream metabolites, including delphinidin, petunidin, and peonidin derivatives (Figure 9). Meanwhile, there was a sharp adverse dynamic trend between anthocyanin accumulation and photosynthesis in the blueberry leaves under different light quality treatments. The results obtained in this study provide new insights into the molecular mechanisms underlying anthocyanin biosynthesis and how the inter-correlation between anthocyanin accumulation and photosynthesis is regulated.
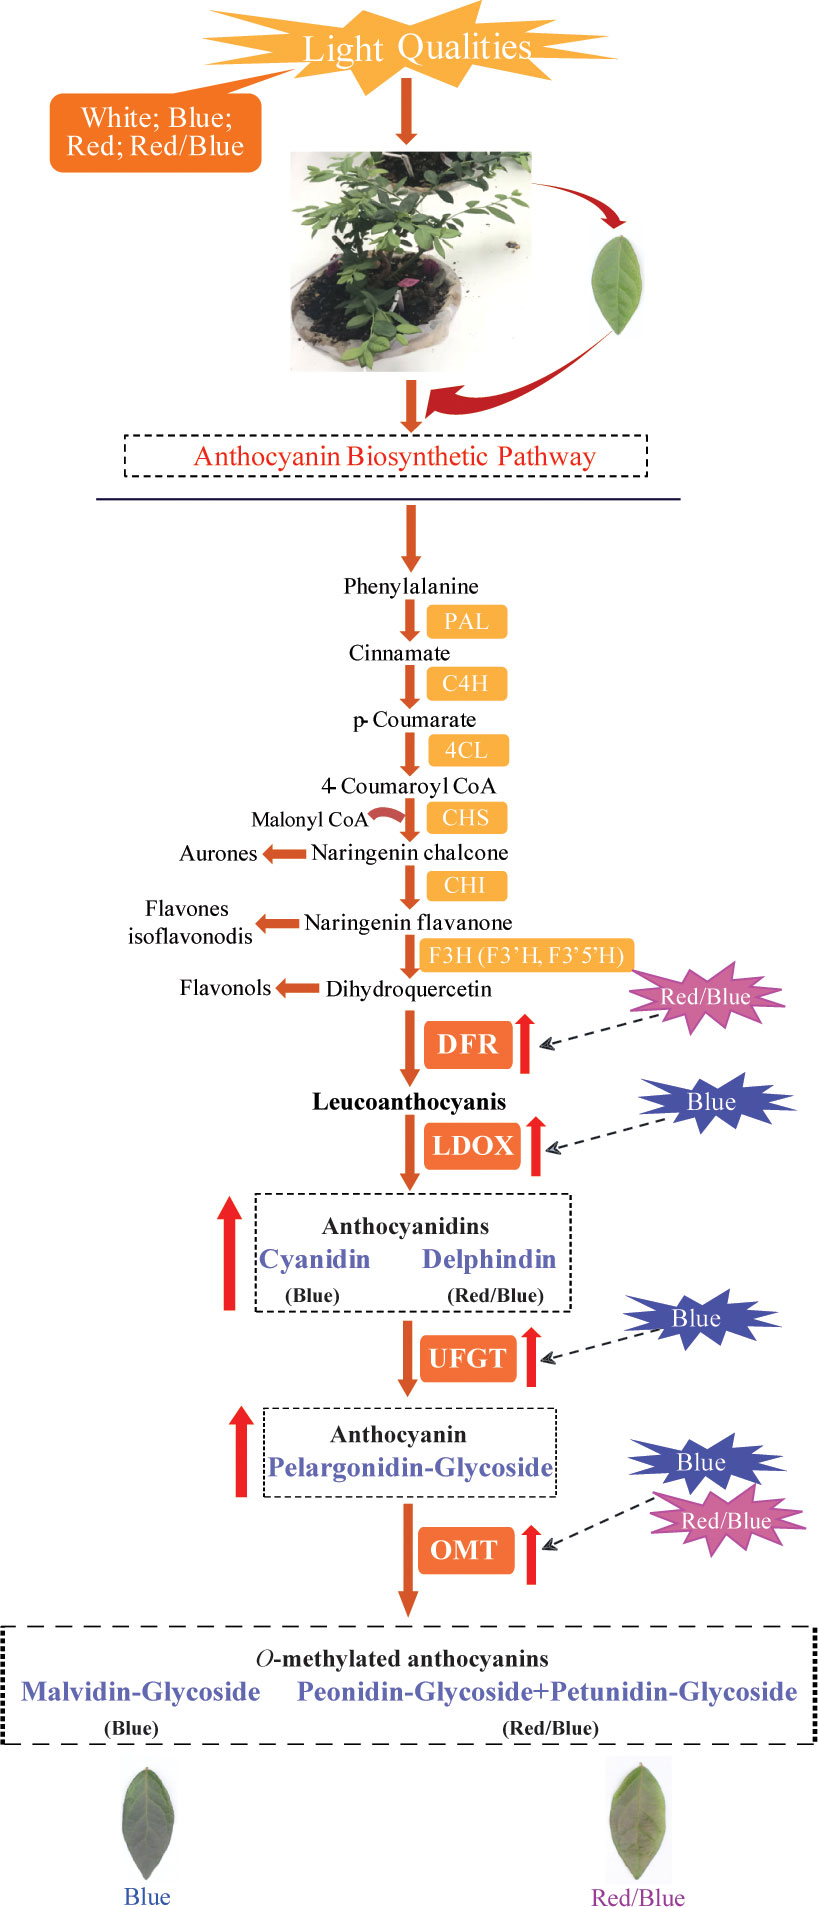
Figure 9 Proposed model of the molecular regulatory mechanism underlying anthocyanin biosynthesis in blueberry leaves in response to different light qualities. The red up-arrow indicates a significant increase; the dotted line arrow indicates a potential role for positive regulation.
The data presented in the study are deposited in the NCBI repository with the link: https://www.ncbi.nlm.nih.gov/, accession number PRJNA880737.
XZ and HA organized the entire project. JZ, HA, and SL performed the experiments and data analysis SL and BZ helped to review and modify the manuscript. XZ and HA edited the manuscript. All authors contributed to the article and approved the submitted version.
This work was supported by Key Scientific Project of Shanghai Science and Technology Commission (No. 17391900800) and Excellent Team Program of Shanghai Academy of Agricultural Sciences (No. 2022-022).
The authors declare that the research was conducted in the absence of any commercial or financial relationships that could be construed as a potential conflict of interest.
All claims expressed in this article are solely those of the authors and do not necessarily represent those of their affiliated organizations, or those of the publisher, the editors and the reviewers. Any product that may be evaluated in this article, or claim that may be made by its manufacturer, is not guaranteed or endorsed by the publisher.
The Supplementary Material for this article can be found online at: https://www.frontiersin.org/articles/10.3389/fpls.2022.1073332/full#supplementary-material
Allan, A. C., Hellens, R. P., Laing, W. A. (2008). MYB transcription factors that colour our fruit. Trends Plant Sci. 13, 99–102. doi: 10.1016/j.tplants.2007.11.012
An, H. S., Zhang, J. Y., Xu, F. J., Jiang, S., Zhang, X. Y. (2020). Transcriptomic profiling and discovery of key genes involved in adventitious root formation from green cuttings of highbush blueberry (Vaccinium corymbosum l.). BMC Plant Biol. 20, 182–195. doi: 10.1186/s12870-020-02398-0
Batschauer, A., Rocholl, M., Kaiser, T., Nagatani, A., Furuya, M., Schafer, E. (1996). Blue and UV-a light-regulated CHS expressionin arabidopsis independent of phytochrome a and phytochromeB. Plant J. 9, 63–69. doi: 10.1046/j.1365-313X.1996.09010063.x
Briggs, W. R., Olney, M. A. (2001). Photoreceptors in plant photomorphogenesis to date. five phytochromes, two cryptochromes, one phototropin, and one superchrome. Plant Physiol. 125, 85–88. doi: 10.1104/pp.125.1.85
Brodenfeldt, R., Mohr, H. (1988). Time courses for phytochrome-induced enzyme levels in phenylpropanoid metabolism (phenylalanine ammonia-lyase, naringenin-chalcone synthase) compared with time courses for phytochrome-mediated end-product accumulation (anthocyanin, quercetin). Planta. 176, 383–390. doi: 10.1007/BF00395419
Brown, B. A., Cloix, C., Jiang, G. H., Kaiserli, E., Herzyk, P., Kliebenstein, D. J. (2005). A UV-b-specific signalling component orchestrates plant UV protection. P. Nat. Acad. Sci. U.S.A. 102, 18225–18230. doi: 10.1073/pnas.0507187102
Chai, Z., Herrera-Balandrano, D. D., Yu, H. A. (2021). Comparative analysis on the anthocyanin composition of 74 blueberry cultivars from China. J. Food Compos. Anal. 4, 104051. doi: 10.1016/j.jfca.2021.104051
Chalker-Scott, L. (1999). Environmental significance of anthocyanins in plant stress responses. Photochem. Photobiol. 70, 1–9. doi: 10.1111/j.1751-1097.1999.tb01944.x
Christie, J. M., Arvai, A. S., Baxter, K. J., Heilmann, M., Pratt, A. J., O'Hara, A. (2012). Plant UVR8 photoreceptor senses UV-b by tryptophan-mediated disruption of cross-dimer salt bridges. Sci. 335, 1492–1496. doi: 10.1126/science.1218091
Dixon, R. A., Paiva, N. L. (1995). Stress-induced phenylpropanoid metabolism. Plant Cell. 7, 1085–1097. doi: 10.1105/tpc.7.7.1085
Ehlenfeldt, M. K., Prior, R. L. (2001). Oxygen radical absorbance capacity (ORAC) and phenolic and anthocyanin concentrations in fruit and leaf tissues of highbush blueberry. J. Agric. Food Chem. 49, 2222–2227. doi: 10.1021/jf0013656
Fallah, A. A., Sarmast, E., Fatehi, P., Jafari, T. (2020b). Impact of dietary anthocyanins on systemic and vascular inflammation: systematic review and meta-analysis on randomized clinical trials. Food Chem. 135, 110922. doi: 10.1016/j.fct.2019.110922
Fallah, A. A., Sarmast, E., Jafari, T. (2020a). Effect of dietary anthocyanins on biomarkers of glycemic control and glucose metabolism: a systematic review and meta-analysis of randomized clinical trials. Food Res. Int. 137, 109379. doi: 10.1016/j.foodres.2020.109379
Feinbaum, R. L., Storz, G., Ausbel, F. M. (1991). High intensity and blue light regulated expression of chimeric chalcone synthase genes in transgenic arabidopsis thaliana plants. Mol. Gen. Genet. 226, 449–456. doi: 10.1007/BF00260658
Field, T., Lee, D., Holbrook, N. (2001). Why leaves turn red in autumn. the role of anthocyanins in senescing leaves of red-osier dogwood. Plant Physiol. 127, 566–574. doi: 10.1104/pp.900027
Gao, X., Chen, Q., Yang, Y. (2021). Transcriptomic analysis reveals anthocyanin biosynthesis regulation in blueberry (Vaccinium ashei) fruit. Cana. J. Plant Sci. 102, 195–206. doi: 10.1139/CJPS-2020-0118
Giliberto, L., Perrotta, G., Pallara, P., Weller, J. L., Fraser, P. D., Bramley, P. M., et al. (2005). Manipulation of the blue light photoreceptor cryptochrome 2 in tomato affects vegetative development, flowering time, and fruit antioxidant content. Plant Physiol. 137, 199–208. doi: 10.1104/pp.104.051987
Griesser, M., Hoffmann, T., Bellido, M. L., Rosati, C., Fink, B., Kurtzer, R., et al. (2008). Redirection of flavonoid biosynthesis through the down-regulation of an anthocyanidin glucosyltransferase in ripening strawberry fruit. Plant Physiol. 146, 1528–1539. doi: 10.1104/pp.107.114280
Guo, X. L., Wang, D. L., Shakeel, M. (2021). Transcriptome analysis reveals light-induced anthocyanin synthesis candidate genes in rabbiteye blueberry (Vaccinium ashei: Reade). Biotechnol. Biotec. Eq. 35 (1), 747–758. doi: 10.1080/13102818.2021.1924078
Guo, J. Y., Wu, G., Wang, T., Wang, F. (2020). Integrated analysis of the transcriptome and metabolome in young and mature leaves of ginkgo biloba l. Ind. Crops Prod. 143, 111906. doi: 10.1016/j.indcrop.2019.111906
Han, Y. P., Vimolmangkang, S., Soria-Guerra, R. E., Korban, S. S. (2012). Introduction of apple ANR genes into tobacco inhibits expression of both CHI and DFR genes in flowers, leading to loss of anthocyanin. J. Exp. Bot. 63, 2437–2447. doi: 10.1093/jxb/err415
Han, Y., Vimolmangkang, S., Soria-Guerra, R. E., Rosales-Mendoza, S., Zheng, D. M., Lygin, V. A. (2010). Ectopic expression of apple F30H genes contributes to anthocyanin accumulation in the arabidopsis tt7 mutant grown under nitrogen stress. Plant Physiol. 153, 806–820. doi: 10.1104/pp.109.152801
Hou, S. Z., Chen, S. X., Huang, S., Jiang, D. X., Zhou, C. J., Chen, C. Q., et al. (2011). The hypoglycemic activity of Lithocarpuspo lystachyus rehd. leaves in the experimental hyperglycemic rats. J. Ethnopharmacol. 138, 142–149. doi: 10.1016/j.jep.2011.08.067
Hou, S. Z., Xu, S. J., Jiang, D. X., Chen, S. X., Wang, L. L., Huang, S., et al. (2012). Effect of the flavonoid fraction of Lithocarpuspo lystachyus rehd. on spontaneously hypertensive and normotensive rats. J. Ethnopharmacol. 143 (2), 441–447. doi: 10.1016/j.jep.2012.06.016
Hughes, N. M., Neufeld, H. S., Burkey, K. O. (2005). Functional role of anthocyanins in high-light winter leaves of the evergreen herb galax urceolata. New Phytol. 168, 575–587. doi: 10.1111/j.1469-8137.2005.01546.x
Hughes, N. M., Smith, W. K. (2007). Seasonal photosynthesis and anthocyanin production in 10 broad leaf evergreen species. Funct. Plant Biol. 34, 1072–71079. doi: 10.1071/FP07205
Jaakola, L. (2013). New insights into the regulation of anthocyanin biosynthesis in fruits. Trends Plant Sci. 18 (9), 477–483. doi: 10.1016/j.tplants.2013.06.003
Kalt, W., Cassidy, A., Howard, L. R., Krikorian, R., Stull, A. J., Tremblay, F. (2020). Recent research on the health benefits of blueberries and their anthocyanins. Adv. Nutr. 11, 224–236. doi: 10.1093/advances/nmz065
Kanehisa, M., Araki, M., Goto, S., Hattori, M., Hirakawa, M., Itoh, M., et al. (2008). KEGG for linking genomes to life and the environment. Nucleic Acids Res. 36 (746), 480–484. doi: 10.1093/nar/gkm882
Koes, R., Verweij, W., Quattrocchio, F. (2005). Flavonoids: a colorful model for the regulation and evolution of biochemical pathways. Trends Plant Sci. 10, 236–242. doi: 10.1016/J.TPLANTS.2005.03.002
Kokalj, D., Zlatic, E., Cigic, B., Vidrih, R. (2019). Postharvest light-emitting diode irradiation of sweet cherries (Prunus avium l.) promotes accumulation of anthocyanins. Postharvest Biol. Tec. 148, 192–199. doi: 10.1016/j.postharvbio.2018.11.011
Kyoungwon, C., Kwang-Soo, C., Hwang-Bae, S. (2016). Network analysis of the metabolome and transcriptome reveals novel regulation of potato pigmentation. J. Exp. Bot. 5, 1519–1533. doi: 10.1093/jxb/erv549
Landi, M., Tattini, K., Gould, S. (2015). Multiple functional roles of anthocyanins in plant environment interactions. Environ. Exp. Bot. 119, 4–17. doi: 10.1016/j.envexpbot.2015.05.012
Li, K. X., Liu, K., Chen, Y. (2021). Comprehensive transcriptome and metabolome analysis of Lithocarpuspo lystachyus leaf revealed key genes in flavonoid biosynthesis pathways. J. Amer. Soc Hortic. Sci. 146, 147–157. doi: 10.21273/JASHS05020-20
Li, Y. Y., Mao, K., Zhao, C., Zhao, X. Y. (2013). Molecular cloning and functional analysis of a blue light receptor gene MdCRY2 from apple (Malus domestica). Plant Cell Rep. 32, 555–566. doi: 10.1007/s00299-013-1387-4
Li, Y. Y., Mao, K., Zhao, C., Zhao, X. Y., Zhang, H. L., Shu, H. R., et al. (2012). MdCOP1 ubiquitin E3 ligases interact with MdMYB1 to regulate light-induced anthocyanin biosynthesis and red fruit coloration in apple. Plant Physiol. 160 (2), 1011–1022. doi: 10.1104/pp.112.199703
Lin, Y., Wang, Y., Li, B., Tan, H., Li, D. N., Li, L. (2018). Comparative transcriptome analysis of genes involved in anthocyanin synthesis in blueberry. Plant Physiol. Biochem. 127, 561–572. doi: 10.1016/j.plaphy.2018.04.034
Liu, Y., Kui, L. W., Espley, R. V., Li, W., Yang, H., Yu, B. (2016). Functional diversification of the potato R2R3MYB anthocyanin activators AN1, MYBA1, and MYB113 and their interaction with basic helix-loop-helix cofactors. J. Exp. Bot. 67, 2159–2176. doi: 10.1093/jxb/erw014
Li, Q. H., Yang, H. Q. (2007). Cryptochrome signaling in plants. Photochem. Photobiol. 83, 94–101. doi: 10.1562/2006-02-28-IR-826
Li, L., Zhang, H., Liu, Z., Cui, X., Zhang, T., Li, Y., et al. (2016). Comparative transcriptome sequencing and de novo analysis of Vaccinium corymbosum during fruit and color development. BMC Plant Biol. 16 (1), 223. doi: 10.1186/s12870-016
Lou, Q., Liu, Y., Qi, Y. (2014). Transcriptome sequencing and metabolite analysis reveals the role of delphinidin metabolism in flower colour in grape hyacinth. J. Exp. Bot. 12, 3157–3164. doi: 10.1093/jxb/eru168
Lu, X. D., Zhou, C. M., Xu, P. B., Luo, Q., Lian, H. L., Yang, H. Q. (2015). Red-light-dependent interaction of phyB with SPA1 promotes COP1-SPA1 dissociation and photomorphogenic development in Arabidopsis. Mol. Plant 8, 467–478. doi: 10.1016/j.molp.2014.11.025
Lv, Y., Xu, L., Dossa, K., Zhou, K., Zhu, M., Xie, H., et al. (2019). Identification of putative drought-responsive genes in rice using gene coexpression analysis. Bioinformation. 15, 480–489. doi: 10.6026/97320630015480
Ma, Z. H., Li, W. F., Mao, J., Li, W., Zuo, C. W., Zhao, X., et al. (2019). Synthesis of light-inducible and light-independent anthocyanins regulated by specific genes in grape ‘Marselan’ (V. vinifera l.). Peer J. 3, 1–24. doi: 10.7717/peerj.6521
Miao, L., Zhang, Y., Yang, X. (2016). Colored light-quality selective plastic films affect anthocyanin content, enzyme activities, and the expression of flavonoid genes in strawberry (Fragaria ananassa) fruit. Food Chem. 207, 93–100. doi: 10.1016/j.foodchem.2016.02.077
Mol, J., Jenkins, G. I., Schafer, E., Weiss, D. (1996). Signal perception, transduction, and gene expression involved in anthocyanin biosynthesis. Crit. Rev. Plant Sci. 15, 525–557. doi: 10.1080/07352689609382369
Murakami, P. F., Schaberg, P. G., Shane, J. B. (2008). Stem girdling manipulates leaf sugar concentrations and anthocyanin expression in sugar maple trees during autumn. Tree Physiol. 28, 1467–1473. doi: 10.1093/treephys/28.10.1467
Nagao, K., Higa, K., Shirouchi, B., Nomura, S., Inoue, N., Inafuku, M. (2008). Effect of Vaccinium ashei reade leaves on lipid metabolism in otsuka long-Evans tokushima fatty rats. Biosci. Biotechno. Biochem. 72, 1619–1622. doi: 10.1271/bbb.80036
Neill, S. O., Gould, K. S. (2003). Anthocyanins in leaves: light attenuators or antioxidants. Funct. Plant Biol. 30, 865–873. doi: 10.1071/fp03118
Nick, W. A., David, H. L., Zhang, H. B., Louis, J. I., Paula, E. J., Kevin, M. D. (2009). Light-induced vegetative anthocyanin pigmentation in petunia. J. Exp. Bot. 60, 2191–2202. doi: 10.1093/jxb/erp097
Noh, B., Spalding, E. P. (1998). Anion channels and the stimulation of anthocyanin accumulation by blue light in Arabidopsis seedlings. Plant Physiol. 116, 503–509. doi: 10.1104/pp.116.2.503
Norberto, S., Silva, S., Meireles, M., Faria, A., Pintado, M., Calhau, C. (2013). Blueberry anthocyanins in health promotion: a metabolic overview. J. Funct. Foods. 5, 1518–1528. doi: 10.1016/j.jff.2013.08.015
Ordidge, M., García-Macías, P., Battey, N. H., Gordon, M. H., John, P., Vysini, E., et al. (2011). Development of colour and firmness in strawberry crops is UV light sensitive, but colour is not a good predictor of several quality parameters. J. Sci. Food Agric. 92, 1597–1604. doi: 10.1002/jsfa.4744
Ottosen, C. O., Ouzounis, T., Rosenqvist, E. (2015). Spectral effects of artificial light on plant physiology and secondary metabolism: A review. Hortic. Sci. 50, 1128–1135. doi: 10.21273/HORTSCI.50.8.1128
Piccolo, E. L., Landi, M., Massai, R. (2020). Girled-induced anthocyanin accumulation in red-leafed Prunus cerasifera: Effect on photosynthesis, photoprotection and sugar metabolism. Plant Sci. 294, 110456. doi: 10.1016/j.plantsci.2020.110456
Piccolo, E. L., Landi, M. E., Pellegrini, G., Agati, C., Giordano, T., Giordani, G., et al. (2018). Multiple consequences induced by epidermally-located anthocyanins in young, mature and senescent leaves of Prunus. Front. Plant Sci. 9. doi: 10.3389/fpls.2018.00917
Raza, A., Su, W., Hussain, M. A. (2021). Integrated analysis of metabolome and transcriptome reveals insights for cold tolerance in rapeseed (Brassica napus l.). Front. Plant Sci. 12. doi: 10.3389/fpls.2021.721681
Reddy, V. S., Goud, K. V., Sharma, R., Reddy, A. R. (1994). UV-B responsive anthocyanin production in a rice cultivar is associated with a specific phase of phenylalanine ammonia lyase biosynthesis. Plant Physiol. 105, 1059–1066. doi: 10.1104/pp.105.4.1049
Sakaida, H., Nagao, K., Higa, K., Shirouchi, B., Inoue, N., Hidaka, F. (2007). Effect of Vaccinium ashei reade leaves on angiotensin converting enzyme activity in vitro and on systolic blood pressure of spontaneously hypertensive rats in vivo. Biosci. Biotechno. Biochem. 71, 2335–2337. doi: 10.1271/bbb.70277
Samkumar, A., Jones, D., Karppinen, J., Andrew, P. D., Nina, S., Richard, V. E. (2021). Red and blue light treatment of ripening bilberry fruits reveal differences in signaling through abscisic acid-regulated anthocyanin biosynthesis. Plant Cell Environ. 44, 3227–3245. doi: 10.1111/pce.14158
Seeram, N. P., Adams, L. S., Zhang, Y. J., Lee, R., Sand, D., Scheuller, H. S., et al. (2006). Blackberry, black raspberry, blueberry, cranberry, red raspberry, and strawberry extracts inhibit growth and stimulate apoptosis of human cancer cells in vitro. J. Agric. Food Chem. 54, 9329–9339. doi: 10.1021/jf061750g
Sharma, R., Singh, A., Selvi, M. (1999). Sun light-induced anthocyanin pigmentation in maize vegetative tissues. J. Exp. Bot. 50, 1619–1625. doi: 10.1093/jexbot/50.339.1619
Song, Y., Huang, L., Yu, J. (2016). Effects of blueberry anthocyanins on retinal oxidative stress and inflammation in diabetes through Nrf2/HO-1 signaling. J. Neuroimmunol. 301, 1–6. doi: 10.1016/j.jneuroim.2016.11.001
Stracke, R., Favory, J. J., Gruber, H., Bartelniewoehner, L., Ulm, R. (2010). The arabidopsis bZIP transcription factor HY5 regulates expression of the PFG1/MYB12 gene in response to light and ultraviolet-b radiation. Plant Cell Environ. 33, 88–103. doi: 10.1111/j.1365-3040.2009.02061.x
Stushnoff, C., Ducreux, L. J., Hancock, R. D., Hedley, P. E., Holm, D. G., McDougall, G. J., et al. (2010). Flavonoid profiling and transcriptome analysis reveals new gene-metabolite correlations in tubers of Solanum tuberosum l. J. Exp. Bot. 61, 1225–1238. doi: 10.1093/jxb/erp394
Tahara, S. (2007). A journey of twenty-five years through the ecological biochemistry of flavonoids. Biosci. Biotechnol. Biochem. 71, 1387–1404. doi: 10.1271/bbb.70028
Takeshita, M., Ishida, Y. I., Akamatsu, E. (2009). Proanthocyanidin from blueberry leaves suppresses expression of subgenomic hepatitis c virus RNA. J. Biol. Chem. 284, 21165–21176. doi: 10.1074/jbc.M109.004945
Takos, A. M., Felix, W., Jacob, S. R., Bogs, J., Robinson, S. P., Walker, A. R. (2006). Light-induced expression of a MYB gene regulates anthocyanin biosynthesis in red apples. Plant Physiol. 142, 1216–1232. doi: 10.1104/PP.106.088104
Tao, R., Bai, S., Ni, J., Yang, Q., Zhao, Y., Teng, Y. (2018). The blue light signal transduction pathway is involved in anthocyanin accumulation in ‘Red zaosu’ pear. Planta. 248, 37–48. doi: 10.1007/s00425-018-2877-y
Uleberg, E., Rohloff, J., Jaakola, L. (2012). Effects of temperature and photoperiod on yield and chemical composition of northern and southern clones of bilberry (Vaccinium myrtillus l.). J. Agric. Food Chem. 60, 10406–10414. doi: 10.1021/jf302924m
Wang, H., Guo, X., Hu, X., Li, T., Fu, X., Liu, R. H. (2017). Comparison of phytochemical profiles, antioxidant and cellular antioxidant activities of different varieties of blueberry (Vaccinium spp.). Food Chem. 217, 773–781. doi: 10.1016/j.foodchem.2016.09.002
Yang, T., Li, J., Wang, H. X., Zeng, Y. (2005). A geraniol-synthase gene from cinnamomum tenuipilum. Phytochem. 66, 285–293. doi: 10.1016/j.phytochem.2004.12.004
Zhang, G., Cui, X., Niu, J. (2021a). Visible light regulates anthocyanin synthesis via malate dehydrogenases and the ethylene signaling pathway in plum (Prunus salicina l.). Physiol. Plantarum. 83, 1–11. doi: 10.1111/ppl.13383
Zhang, X., Hong, M., Wan, H., Luo, L., Yu, Z., Guo, R. (2019). Identification of key genes involved in embryo development and differential oil accumulation in two contrasting maize genotypes. Genes (Basel). 10, 993. doi: 10.3390/genes10120993
Zhang, Y., Jiang, L., Li, Y., Chen, Q., Ye, Y., Zhang, Y., et al. (2018). Effect of red and blue light on anthocyanin accumulation and differential gene expression in strawberry (Fragaria ananassa). Molecules. 23, 820. doi: 10.3390/molecules23040820
Zhang, L. Q., Jiang, S., Meng, J. J., An, H. S., Zhang, X. Y. (2019). First report of leaf spot caused by nigrosporaoryzae on blueberry in shanghai. China Plant Dis. 103, 2473. doi: 10.1094/PDIS-02-19-0242-PDN
Zhang, Y., Lin, L., Long, Y., Guo, H., Wang, Z., Cui, M., et al. (2019). Comprehensive transcriptome analysis revealed the effects of the light quality, light intensity, and photoperiod on phloriz in accumulation in Lithocarpuspo lystachyus rehd. Forests. 10, 995. doi: 10.3390/f10110995
Zhang, J. Y., Li, J. M., Xue, C. (2021b). The variation of stone cell content in 236 germplasms of sand pear (Pyrus pyrifolia) and identification of related candidate genes. Hortic. Plant J. 7, 108–116. doi: 10.1016/j.hpj.2020.09.003
Zhou, C. J., Huang, S., Liu, J. Q., Qiu, S. Q., Xie, F. Y., Song, H. P., et al. (2013). Sweet tea leaves extract improves leptin resistance in diet-induced obese rats. J. Ethnopharmacol. 145, 386–392. doi: 10.1016/j.jep.2012.09.057
Keywords: Vaccinium corymbosum L., anthocyanin, light quality, transcriptome, metabolome
Citation: Zhang J, Li S, An H, Zhang X and Zhou B (2022) Integrated transcriptome and metabolome analysis reveals the anthocyanin biosynthesis mechanisms in blueberry (Vaccinium corymbosum L.) leaves under different light qualities. Front. Plant Sci. 13:1073332. doi: 10.3389/fpls.2022.1073332
Received: 18 October 2022; Accepted: 21 November 2022;
Published: 08 December 2022.
Edited by:
Chenxia Cheng, Qingdao Agricultural University, ChinaCopyright © 2022 Zhang, Li, An, Zhang and Zhou. This is an open-access article distributed under the terms of the Creative Commons Attribution License (CC BY). The use, distribution or reproduction in other forums is permitted, provided the original author(s) and the copyright owner(s) are credited and that the original publication in this journal is cited, in accordance with accepted academic practice. No use, distribution or reproduction is permitted which does not comply with these terms.
*Correspondence: Haishan An, YW5oYWlzaGFuQHNhYXMuc2guY24=; Xueying Zhang, emhhbmd4dWV5aW5nQHNhYXMuc2guY24=
†These authors have contributed equally to the work
Disclaimer: All claims expressed in this article are solely those of the authors and do not necessarily represent those of their affiliated organizations, or those of the publisher, the editors and the reviewers. Any product that may be evaluated in this article or claim that may be made by its manufacturer is not guaranteed or endorsed by the publisher.
Research integrity at Frontiers
Learn more about the work of our research integrity team to safeguard the quality of each article we publish.