
95% of researchers rate our articles as excellent or good
Learn more about the work of our research integrity team to safeguard the quality of each article we publish.
Find out more
ORIGINAL RESEARCH article
Front. Plant Sci. , 23 December 2022
Sec. Plant Nutrition
Volume 13 - 2022 | https://doi.org/10.3389/fpls.2022.1069191
This article is part of the Research Topic Phosphorus Starvation in Plants View all 8 articles
 Jiajia Luo1†
 Zeping Cai2†Rui Huang1†Yuanhang Wu2
 Chun Liu1,2Chunqiong Huang1Pandao Liu1Guodao Liu1
 Rongshu Dong1*
Phosphorus (P) is an essential macronutrient element for plant growth, and deficiency of inorganic phosphate (Pi) limits plant growth and yield. Elephant grass (Pennisetum purpureum) is an important fodder crop cultivated widely in tropical and subtropical areas throughout the world. However, the mechanisms underlying efficient P use in elephant grass under Pi deficiency remain poorly understood. In this study, the physiological and molecular responses of elephant grass leaves and roots to Pi deficiency were investigated. The results showed that dry weight, total P concentration, and P content decreased in Pi-deprived plants, but that acid phosphatase activity and P utilization efficiency (PUE) were higher than in Pi-sufficient plants. Regarding Pi starvation-responsive (PSR) genes, transcriptomics showed that 59 unigenes involved in Pi acquisition and transport (especially 18 purple acid phosphatase and 27 phosphate transporter 1 unigenes) and 51 phospholipase unigenes involved in phospholipids degradation or Pi-free lipids biosynthesis, as well as 47 core unigenes involved in the synthesis of phenylpropanoids and flavonoids, were significantly up-regulated by Pi deprivation in leaves or roots. Furthermore, 43 unigenes related to Pi-independent- or inorganic pyrophosphate (PPi)-dependent bypass reactions were markedly up-regulated in Pi-deficient leaves, especially five UDP-glucose pyrophosphorylase and 15 phosphoenolpyruvate carboxylase unigenes. Consistent with PSR unigene expression changes, metabolomics revealed that Pi deficiency significantly increased metabolites of Pi-free lipids, phenylpropanoids, and flavonoids in leaves and roots, but decreased phospholipid metabolites. This study reveals the mechanisms underlying the responses to Pi starvation in elephant grass leaves and roots, which provides candidate unigenes involved in efficient P use and theoretical references for the development of P-efficient elephant grass varieties.
Phosphorus (P) is an essential nutrient required for plant growth, and is a major component of cellular macromolecules and a crucial element of metabolism (Lambers, 2021). Inorganic phosphate (Pi) is the only form of P that can be absorbed directly by plants. Unfortunately, low Pi availability is a significant constraint on agricultural production, because Pi is readily immobilized and precipitated as insoluble Pi complexes in soil (López-Arredondo et al., 2014). López-Arredondo et al. (2014) have reported that Pi deficiency is a feature of ~70% of global cultivated lands. Thus, excessive amounts of Pi fertilizers are applied to optimize crop yields, but only 30% can be taken up by crops, and the rest is lost through runoff, leaching, and water erosion into ground and surface waters or fixed in soils (Cong et al., 2020). Veneklaas et al. (2012) have reported that agricultural P runoff is a major source of environmental pollution. Furthermore, Pi fertilizer is mainly obtained from non-renewable and finite rock P, and global P resources could be depleted within 50–100 years (Chowdhury et al., 2017). Thus, P fertilizer overuse, P resource scarcity, and P pollution threaten food security and ecological development of agriculture. These P issues are closely linked with the ineffective use of P (Dissanayaka et al., 2021). In this regards, in-depth understanding of P use mechanisms will provide information to develop more P-efficient crops.
Plants’ P use efficiency has been divided into P acquisition efficiency (PAE) and P utilization deficiency (PUE) (Ding et al., 2020). Plant PAE is the capacity for Pi uptake from the soil by roots. In response to Pi deprivation, plants have evolved multiple strategies to enhance P acquisition, including regulating the activity of Pi transporters (PHTs) to increase Pi uptake, enhancing root exploration for Pi, and improving Pi scavenging (e.g., through phosphatase and ribonuclease) (Cong et al., 2020; Ding et al., 2020). Purple acid phosphatases (PAPs) are involved in the remobilization not only of external organic P (extracellular type PAPs), but also of intracellular organic P (intracellular type PAPs) (Farhadi et al., 2020). Previous studies have reported that PAPs play important roles in response to Pi starvation in various plant species, such as Oryza sativa, Zea mays, Glycine max, and Cicer arietnum (Zhang et al., 2011; Li et al., 2012; González-Muñoz et al., 2015; Bhadouria et al., 2017). Pi transporter 1 (PHT1) family genes are believed to be associated with Pi uptake and translocation (Roch et al., 2019). In addition, flavonoids can directly mobilize Pi from rhizosphere insoluble inorganic P (e.g., Fe-Pi and Al-Pi) (Ding et al., 2020). Multidrug and toxic compound extrusion (MATE) proteins perform various functions in plants, and MATE subfamily II (MATE II) members reportedly use flavonoids as substrates, and are involved in flavonoids transport (Wang et al., 2016).
Plant PUE is the capacity to produce total biomass or yield by per unit P, also represented by the proficiency of Pi recycling in plants (Dissanayaka et al., 2018). The PUE of Pi-deprived plants can be increased by enhancing the remobilization and recycling of internal Pi. Firstly, vacuolar phosphate influx transporter (VPE) functions as a Pi-mobilizing enzyme to transport vacuolar Pi into the cytosol to enhance Pi recycling in Pi-deprived plants (Dissanayaka et al., 2021). Secondly, nucleic acids represent ~50% of organic P in a plant cell, especially ribonucleic acid (RNA), and ribonucleases (RNSs) degrade RNA to release Pi, to increase Pi recycling in response to Pi starvation in plants (Dissanayaka et al., 2021). Furthermore, membrane lipid remodeling is an important response to enhance Pi recycling under low-Pi stress, and this process involves two main steps; phospholipid degradation to liberate Pi and phospholipid replacement by Pi-free lipids (major galactolipids and sulfolipids) (Dissanayaka et al., 2018; Ding et al., 2020). Moreover, regulation bypass enzymes in glycolytic metabolism can reduce Pi use and alleviate low-Pi stress; for example, inorganic pyrophosphate (PPi)-dependent and Pi-independent glycolytic enzymes replace Pi- and adenylate-dependent enzymes (Cong et al., 2020; Dissanayaka et al., 2021).
Elephant grass (Pennisetum purpureum) is a perennial C4 plant of the Poaceae family, and is primarily cultivated as an important fodder crop in tropical and subtropical areas of Brazil, America, and Africa (Yan et al., 2020). In addition, elephant grass is the most widely cultivated tropical forage in south China, and forage grass shortage caused by the novel coronavirus epidemic has aggravated the cultivation of elephant grass in recent years. Although elephant grass is characterized by high biomass production, with plants reaching a height of 2–6 m, a yield of up to 45 t/ha green matter, and allowing three or four cuttings per year, this crop requires a large amount of P fertilizer (Ferreira et al., 2022). Therefore, development of high P efficiency elephant grass cultivars could reduce the application of P fertilizer, resulting in more environmentally friendly and sustainable agricultural production (Zhang et al., 2022). Previous studies related to elephant grass have mainly focused on the development of bioenergy (such as bioethanol and biodiesel), phytoremediation of soils polluted by heavy metals (such as cobalt and chromium), and tolerance to abiotic stresses (such as high temperature, drought, and low fertility) (Anderson et al., 2008; Lotfy and Mostafa, 2014; Yan et al., 2020). However, the molecular mechanisms underlying efficient P use under Pi deficiency in elephant grass have not been reported.
Herein, we investigated changes in genes and metabolites induced by Pi deficiency by combining transcriptome and metabolome analyses, to explore efficient use P strategies and mine critical genes in Pi-deficient elephant grass. The findings provide candidate genes and lay a theoretical foundation for developing more P-efficient elephant grass cultivars.
Elephant grass was provided by the Chinese Academy of Tropical Agricultural Sciences (CATAS), Hainan, China. In a previous study, Huang et al. (2021) found that dry weight, total P content, acid phosphatase (APase) activity, and expression levels of three PAP genes of elephant grass were significantly altered by Pi deficiency for 10 days. Therefore, we conducted the present study based on Huang et al. (2021) to identify the genes and metabolites associated with P use in response to low-Pi stress in elephant grass. Briefly, elephant grass stems were sprouted for 7 days, and uniform seedlings were transferred to Magnavaca’s solution, as described by Famoso et al. (2010). The hydroponic culture solution was supplemented with 600 μM KH2PO4 and adjusted to pH 5.80, and plants were cultivated in a greenhouse with a temperature range of 26−35°C under a natural day–night cycle. After 10 days of preculture, seedlings were treated with 0 μM KH2PO4 (low-Pi treatment, LP) or 600 μM KH2PO4 (high-Pi treatment, HP). For LP treatment, 600 μM KCl was instead added to supplement potassium. After 10 days of Pi treatment, elephant grass shoots and roots were harvested for dry weight and total P measurement, with each treatment including six biological replicates, and each biological replicate including one seedling. For dry weight analysis, samples were oven dried at 75°C. For total P analysis, ~0.05 g of each shoot or root sample powder was burned to ash at a temperature of 600°C using a muffle furnace. The total P concentration was determined by phosphorus–molybdate blue color reaction, and the optical density at 700 nm (OD700) value of reaction products was measured by spectrophotometry (Bio-Rad, CA, USA), as described by Murphy and Riley (1962). Finally, P content and P utilization efficiency were calculated depending on the dry weight and total P concentration of plant samples, as described previously (Chen et al., 2021). After 10 days of Pi treatment, mixed leaves (including upper, middle, and lower leaves) and whole roots were harvested for APase activity, transcriptome, and metabolome analyses, with each treatment including three biological replicates (four seedlings from each treatment were combined to form one biological replicate). The APase activity of Pi-deficient samples was measured using ρ-nitrophenylphosphate as substrate, as described previously (Luo et al., 2020).
For transcriptomic analysis, total RNA was extracted from three biological replicate samples of leaves and roots under LP or HP treatments (total 12 samples) using RNeasy Mini kits (Tiangen Biotech, Beijing, China). The concentration and quality of total RNA were assessed by a Nanodrop 2000c Spectrophotometer (ThermoFisher Scientific, Waltham, MA, USA) and an Agilent 2100 Bioanalyzer (Agilent Technologies, CA, USA), respectively. Furthermore, equal amounts of RNA were taken from 12 samples and mixed them together for full-length transcriptomic sequencing, and a cDNA library was constructed using a SMARTer PCR cDNA Synthesis Kit (Clontech, Terra Bella, CA, USA). DNA sequencing was performed on a PacBio Sequel II platform. Circular consensus sequences (CCSs) were identified using SMRTlink software (version 10.2; http://ccs.how/) and redundant CCSs were filtered by CD-HIT software (version 4.8.1;Fu et al., 2012). Non-redundant isoforms were generated after clustering and polishing of CCSs.
From the 12 samples, cDNA libraries were generated using an NEBNext Ultra RNA Library Prep Kit (NEB, PA, USA). Libraries were sequenced on an Illumina NovaSeq platform (Illumina, CA, USA), and 150-bp paired-end (PE150) reads were produced with an insert size ~350 bp. All raw reads were subjected to filtering of low-quality and adaptor reads using the filter module of SOAPnuke (version 2.16). Clean reads were further mapped back to the full-length isoforms database using bowtie2 (version 2.2.5). Genes expression levels in each sample were calculated using RSEM (version 1.3.3), and normalized to the fragments per kilobase million mapped reads (FPKM). For annotation, all expressed isoform sequences were aligned by BLAST search (E-value <1E–5) against Nr and Swiss-Prot (protein sequence databases), Nt (nucleotide sequence database), KEGG (Kyoto Encyclopedia of Genes and Genome), KOG (Clusters of orthologous groups for eukaryotic complete genomes), Pfam (Protein Family), and GO (Gene Ontology) databases. To identify differentially expressed genes (DEGs), the DESeq2 (version 1.32.0) package in R software (version 4.0.2) was employed to calculate gene expression differences between LP and HP treatments, and genes with |log2(LP/HP)| > 1 and adjusted P-value (Padj) < 0.05 were defined as DEGs. Thus, DEGs with log2(LP/HP) > 1 or log2(LP/HP) < –1 were defined as up-regulated and down-regulated, respectively. Subsequently, KEGG and GO enrichment analysis were executed using the R platform, as previously described (Tai et al., 2018), and KEGG pathways or GO terms with Padj < 0.05 were defined as significantly enriched.
Using the protein sequences encoded by PSR genes in the model plants Arabidopsis thaliana (TAIR, www.arabidopsis.org) and O. sativa (https://data.jgi.doe.gov/) as references, elephant grass proteins were subjected to homology-based searching to predict the presence of PSR genes; genes with a BLASTP (version 2.9.0) alignment E-value < 1E–10 (indicating coverage of >35% in A. thaliana and O. sativa) were identified as candidate genes (Liu et al., 2022). In this study, we searched for the following genes in elephant grass:
* PSR genes involved in Pi acquisition and transport, such as genes of the PAP, RNS, PHT1, and VPE families;
* genes involved in the membrane phospholipid remodeling metabolic pathway, such as the genes coding for phospholipase A (PLA), phospholipase D (PLD), phosphatidate phosphatase (PAH), and glycerophosphodiester phosphodiesterase (GDPD);
* genes involved in the alternative pathway of cytosolic glycolysis, such as those encoding sucrose synthase/UDP-glucose pyrophosphorylase (UGPase), PPi-dependent 6-phosphofructokinase (PPi-PFK), and phosphoenolpyruvate carboxylase (PEPC);
* genes implicated in the flavonoid metabolic pathway, such as those encoding phenylalanine ammonia-lyase (PAL), 4-coumarate-CoA ligase (4CL), trans-cinnamate 4-monooxygenase (C4H), chalcone synthase (CHS), and members of the MATE II family of proteins.
* PSR genes of A. thaliana and O. sativa are listed in Supplementary Table S18.
Phylogenetic analysis of PAP and PHT1 family genes was performed using the amino acid sequences of A. thaliana and O. sativa, and the identified differentially expressed isoforms in elephant grass. Multiple sequence alignment was performed by ClustalX software, and a neighbor-joining phylogenetic tree was constructed with 1,000 bootstrap replicates using MEGA7 software.
To investigate changes in the abundance of lipids, a targeted lipid metabolomics study was performed at BGI Co. Ltd (Shenzhen, China). Lipid metabolites were extracted from all 12 samples, and levels were measured using ultra performance liquid chromatography–tandem mass spectrometry (UPLC-MS/MS) technology as previously described (McLoughlin et al., 2018). Briefly, 25 mg of each sample was extracted in dichloromethane/methanol (3:1 v/v, –20°C precooling), and the supernatant was lyophilized and resuspended before analysis. Subsequently, lipids in 5-μl extracts of each sample were separated by a CSH C18 column (Waters, MA, USA). Under positive ion mode, the mobile phase consisted of solvent A (0.1% v/v formic acid + 10 mM ammonium formate + 60% v/v acetonitrile aqueous) and solvent B (0.1% v/v formic acid + 10 mM ammonium formate + 10% v/v acetonitrile aqueous + 90% v/v isopropanol). Under negative ion mode, the mobile phases of solvent A and solvent B without 0.1% (v/v) formic acid were the same as in positive ion mode. The flow rate and column temperature were set as 0.35 ml/min and 55°C, respectively. The m/z range of MS scans was 200−2,000, the flow rates of sheath gas and auxiliary gas were 40 L/min and 10 L/min, and the temperatures of capillary and aux gas heaters were 320°C and 350°C, respectively. Additionally, qualitative and quantitative analyses of lipid metabolites were performed using LipidSearch software (version 4.1) as described by Chauhan et al. (2019). The metaX package in R software (version 4.0.2) was employed to preprocess the original data exported by LipidSearch, including the deletion of lipid molecules missing from >80% of experimental samples, adding missing values using the K-nearest neighbor (KNN) algorithm, and normalization of data by the probabilistic quotient normalization (PQN) method. Finally, differentially accumulated lipids (DALs) were identified based on fold change of LP/HP >2 or <0.5 and Padj <0.05, where Padj represented the P-value of t-test after false discovery rate (FDR) correction.
In leaves and roots of elephant grass under Pi deprivation, targeted determination of phenylpropanoids and flavonoids was performed by UPLC-MS/MS technology at Shanghai Applied Protein Technology Co. Ltd (Shanghai, China). Briefly, 100 mg of each sample was extracted using methanol, acetonitrile, and water (2:2:1 v/v/v) by ultrasonic-assisted extraction, and the supernatant was retained. Extracts (2 μl) of each sample were loaded onto the UPLC-MS/MS system, and liquid chromatography analysis was performed using an ACQUITY UPLC system (Waters) equipped with a BEH C18 column (Waters). The mobile phase composition and gradient elution conditions were consistent with those reported by Norazhar et al. (2021). Additionally, MS/MS analysis was performed using a QTrap 5500 tandem MS instrument (AB SCIEX, MA, USA). The concentrations of metabolites were quantified by the standard curve method, and standard metabolites were brought from Sigma-Aldrich and Steraloids. Differentially accumulated metabolites (DAMs) were defined by a P-value <0.05, and we used a t-test to assess the significance of differences between two comparison pairs, including LPL vs. HLP and LPR vs. HLR.
Total RNA from elephant grass leaf and root tissues was extracted using TRNZol reagent (Tiangen) in accordance with the manufacture’s protocol. First-strand cDNA synthesis from total RNA was performed using a HiScript II 1st Strand cDNA Synthesis Kit plus gDNA eraser (Vazyme, Nanjing, China). Subsequently, qRT-PCR was carried out using ChamQ Universal SYBR qPCR Master Mix (Vazyme) on a QuantStudio 6 Flex qRT-PCR system (Applied Biosystems, Waltham, MA, USA) following the manufacturer’s instructions. Twenty DEGs were selected for analysis by qRT-PCR, and the Actin1 gene (gene ID PpACT1, isoform26256, NCBI accession number MT784734) served as a reference gene to normalize gene expressions, as described by Huang et al. (2021). Primers used to amplify genes for qRT-PCR analysis are listed in Supplementary Table S23. Relative expression values were calculated by the 2-ΔΔCT method (An et al., 2022).
Data analysis was conducted in Excel 2016 (Microsoft Corporation, Redmond, WA, USA). The significance of difference was tested by Student’s t-test using SPSS software (version 19.0; IBM, USA). In addition, the R program (version 4.2.0) was employed to visualize the results of principal component analysis (PCA) and to generate volcano diagrams and heatmaps. The co-expression networks were constructed using Cytoscape (version 3.6.1).
The sequencing data of full-length transcriptome and comparative transcriptome are deposited in the Sequence Read Archive (SRA) of the NCBI database, under Bioproject accession number PRJNA854591.
In this work, in accordance with the study of Huang et al. (2021), elephant grass was treated with 0 μM KH2PO [low Pi supply (LP), i.e., Pi deficient] or 600 μM KH2PO4 [high Pi supply (HP), i.e., Pi sufficient] for 10 days. The results showed that Pi deficiency had a significant impact on elephant grass growth. The whole-plant dry weight, total P concentration, and P content in Pi-deficient leaves and roots were significantly decreased, by 52.5%–95.6%, relative to Pi-sufficient plants (Figures 1A, C, D). Conversely, the APase activities of leaves and roots were increased by 33.8% and 31.6%, respectively, under Pi deficiency stress (Figure 1B). In addition, PUE was increased by 7.8- and 8.2-fold in Pi-deficient leaves and roots, respectively, compared with Pi-sufficient plants (Figure 1E). These results indicate that Pi deficiency resulted in reduced biomass accumulation, decreased total P storage, and enhanced PUE in elephant grass.
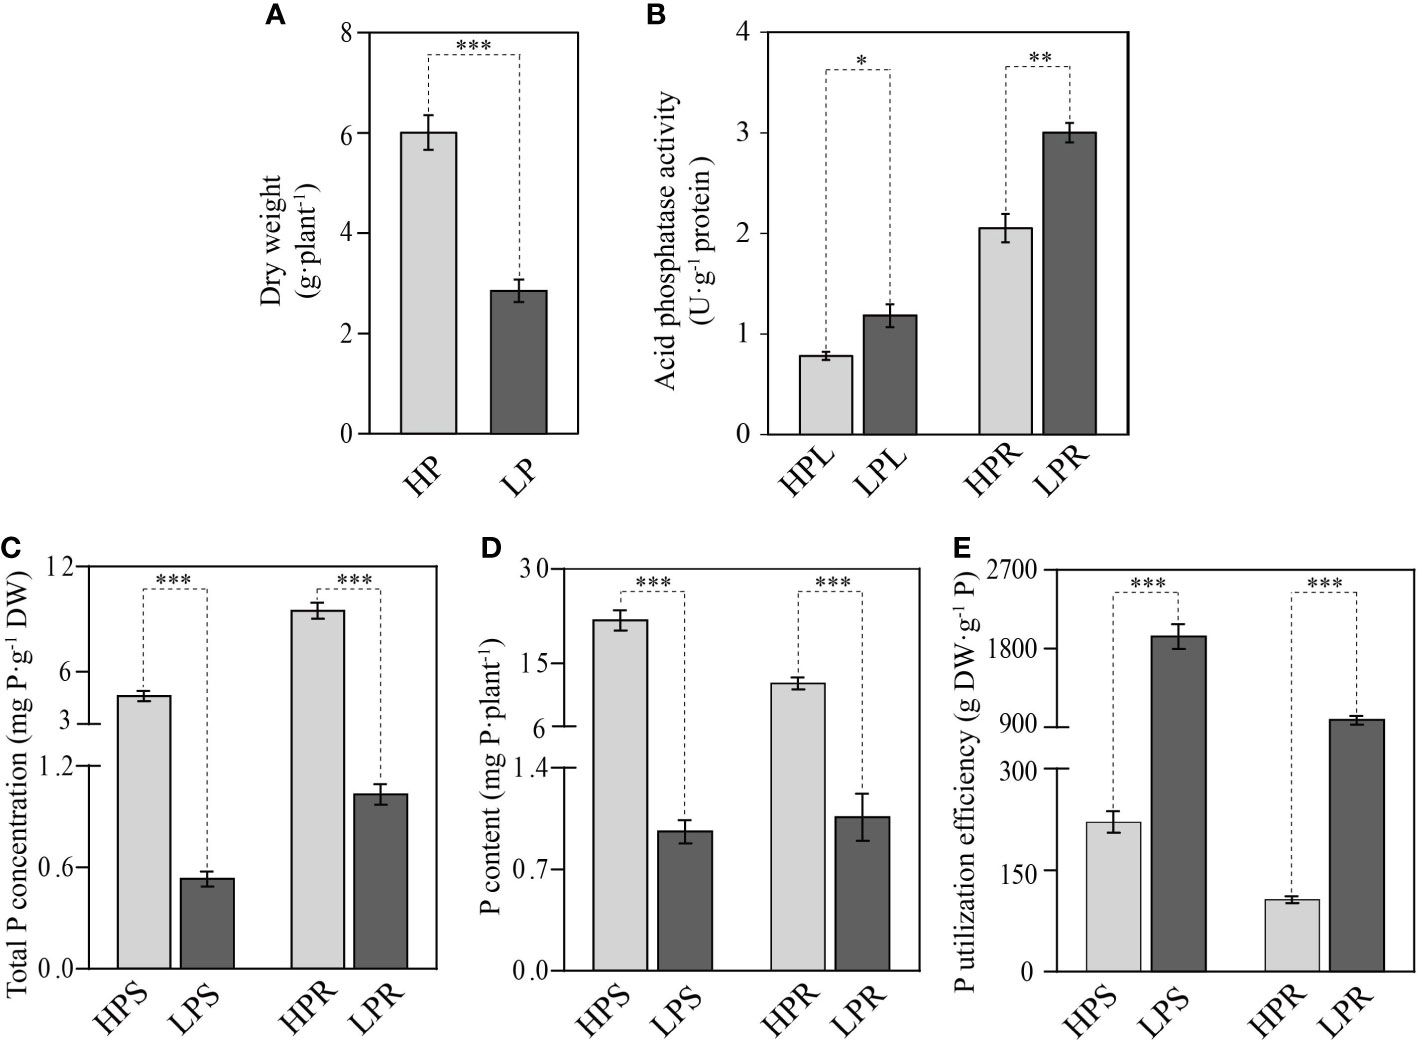
Figure 1 Effects of Pi starvation on elephant grass (Pennisetum purpureum). (A) Dry weight of total plant. (B) Acid phosphatase activity of leaves and roots. (C–E) Total P concentration (C), P content (D), and P utilization efficiency (E) of shoots and roots. The uniform seedlings were treated with (HP) or without (LP) 600 μmol/L KH2PO4 for 10 days. HPL, HPS, and HPR indicate, respectively, leaves, shoots, and roots under the HP condition LPL, LPS, and LPR indicate, respectively, leaves, shoots, and roots under the LP condition,. The data are displayed as means and standard error (SE). Significant differences between different treatments are marked by asterisks: *P <0.05, **P <0.01, ***P <0.001.
Full-length and comparative transcriptome sequencing of elephant grass leaves and roots was carried out. In the full-length transcriptome data, we identified 93,953 transcripts, which were grouped into 88,715 unigenes (Supplementary Table S1). Subsequently, RNA sequencing (RNA-seq) was performed to analyze the global expression profile of unigenes under Pi starvation. The full-length transcriptome was used as a reference. RNA-Seq results are displayed in Supplementary Table S2. A total of 53,595 unigenes expressed in more than one sample were identified; the annotation and expression levels of these unigenes are given in Supplementary Tables S3,S4, respectively.
Hierarchical clustering and PCA showed that Pi starvation profoundly influenced the transcriptomes of elephant grass leaves and roots (Figures 2A-C). We identified 2,076 up-regulated unigenes and 1,183 down-regulated unigenes in elephant grass leaves and 822 up-regulated unigenes and 503 down-regulated unigenes in elephant grass roots (Figures 2D-F; Supplementary Table S5). A total of 4,172 DEGs expressed in at least one tissue were detected, including 3,760 specific DEGs and 412 overlapping DEGs (Figure 2F). The specific and overlapping DEGs were divided into clusters 1−4 and clusters 5−8, respectively (Figure 2F). Cluster 1 (up-regulated only in leaves) had the most specific DEGs and Cluster 5 (up-regulated in leaves and roots) had the most overlapping DEGs (Figure 2F). The differential expression patterns of DEGs in Clusters 1−8 are shown in Figure 2G.
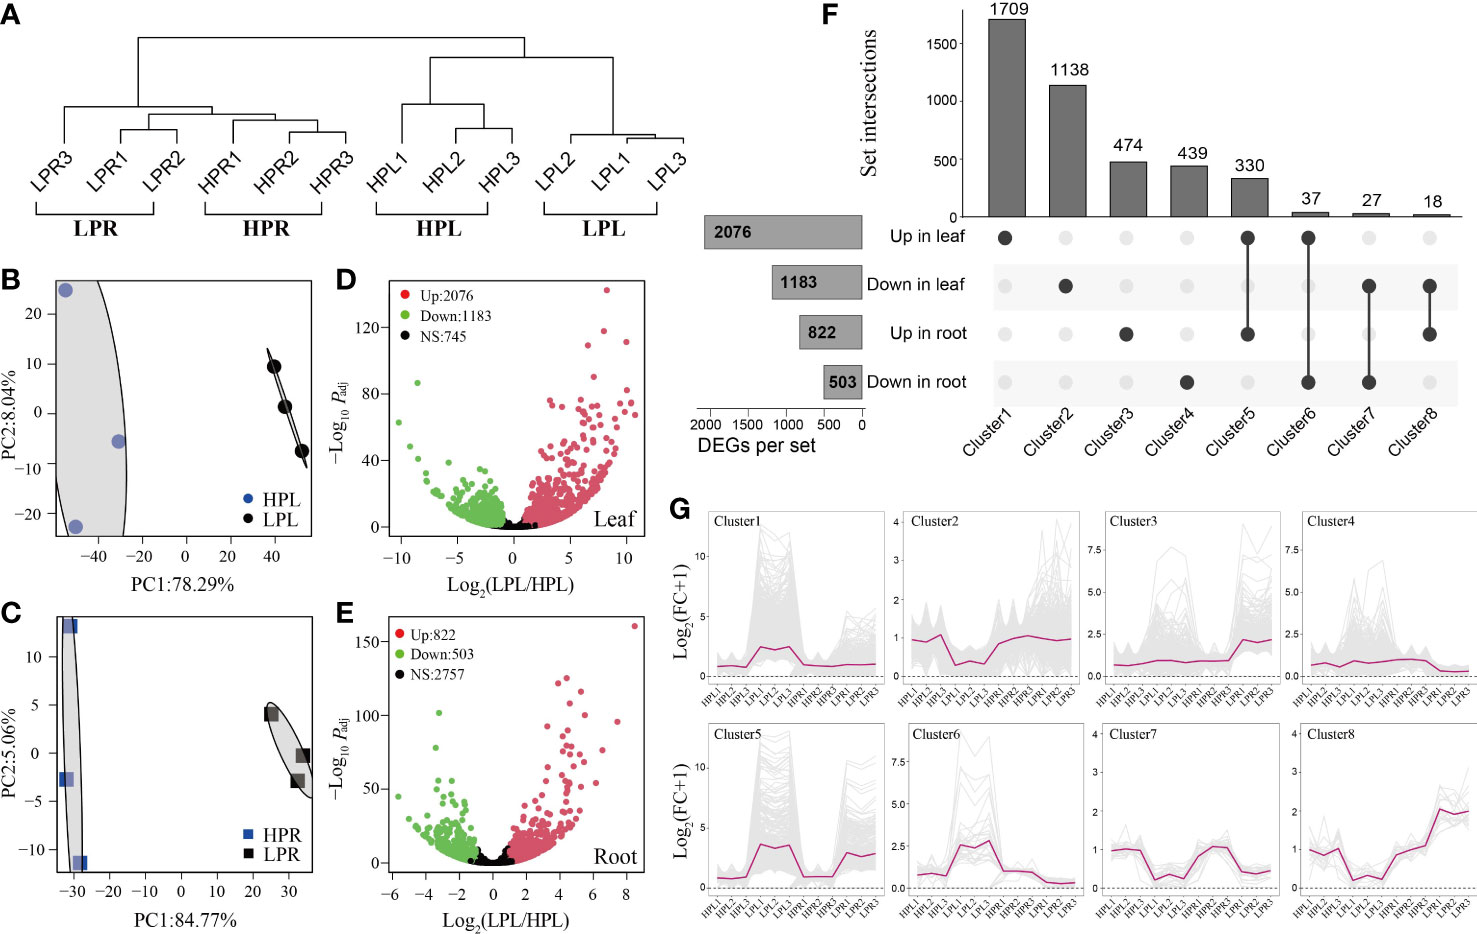
Figure 2 Overview of differentially expressed unigenes (DEGs) in the transcriptome of elephant grass. (A) Hierarchical clustering of all samples based on expressed genes in the transcriptome. (B, C) Principal component analysis of all expressed unigenes in leaves (B) and roots (C). (D, E) Volcano diagrams of distribution of unigenes in Pi-deficient leaves (D) and roots (E). (F) Specific and overlapping DEGs in Pi-deficient leaves and roots. (G) The differential expression patterns of DEGs in Clusters 1–8. The fold change of each unigene was normalized to the mean generated with all HP samples. LPL and LPR represent, respectively, leaves and roots treated with 0 μmol/L KH2PO4. HPL and HPR represent, respectively, leaves and roots treated with 600 μmol/L KH2PO4, the same as below.
We performed KEGG and GO enrichment analysis of all DEGs (genes up-regulated and down-regulated in leaves and roots of elephant grass subjected to Pi starvation; Supplementary Tables S6−S16). In the KEGG analysis, metabolic pathways (ko01100), glycerophospholipid metabolism (ko00564), and glycolysis/gluconeogenesis (ko00010) were significantly enriched (Figure S1; Supplementary Tables S6, S7, S9, and S10). Consistent with the KEGG results, the significantly enriched terms in GO analysis were also associated with Pi acquisition and transport, glycerophospholipid metabolism, and glycolysis metabolism (Figures 3A, 4A, and 6A; Supplementary Tables S12, S13, S15, and S16).
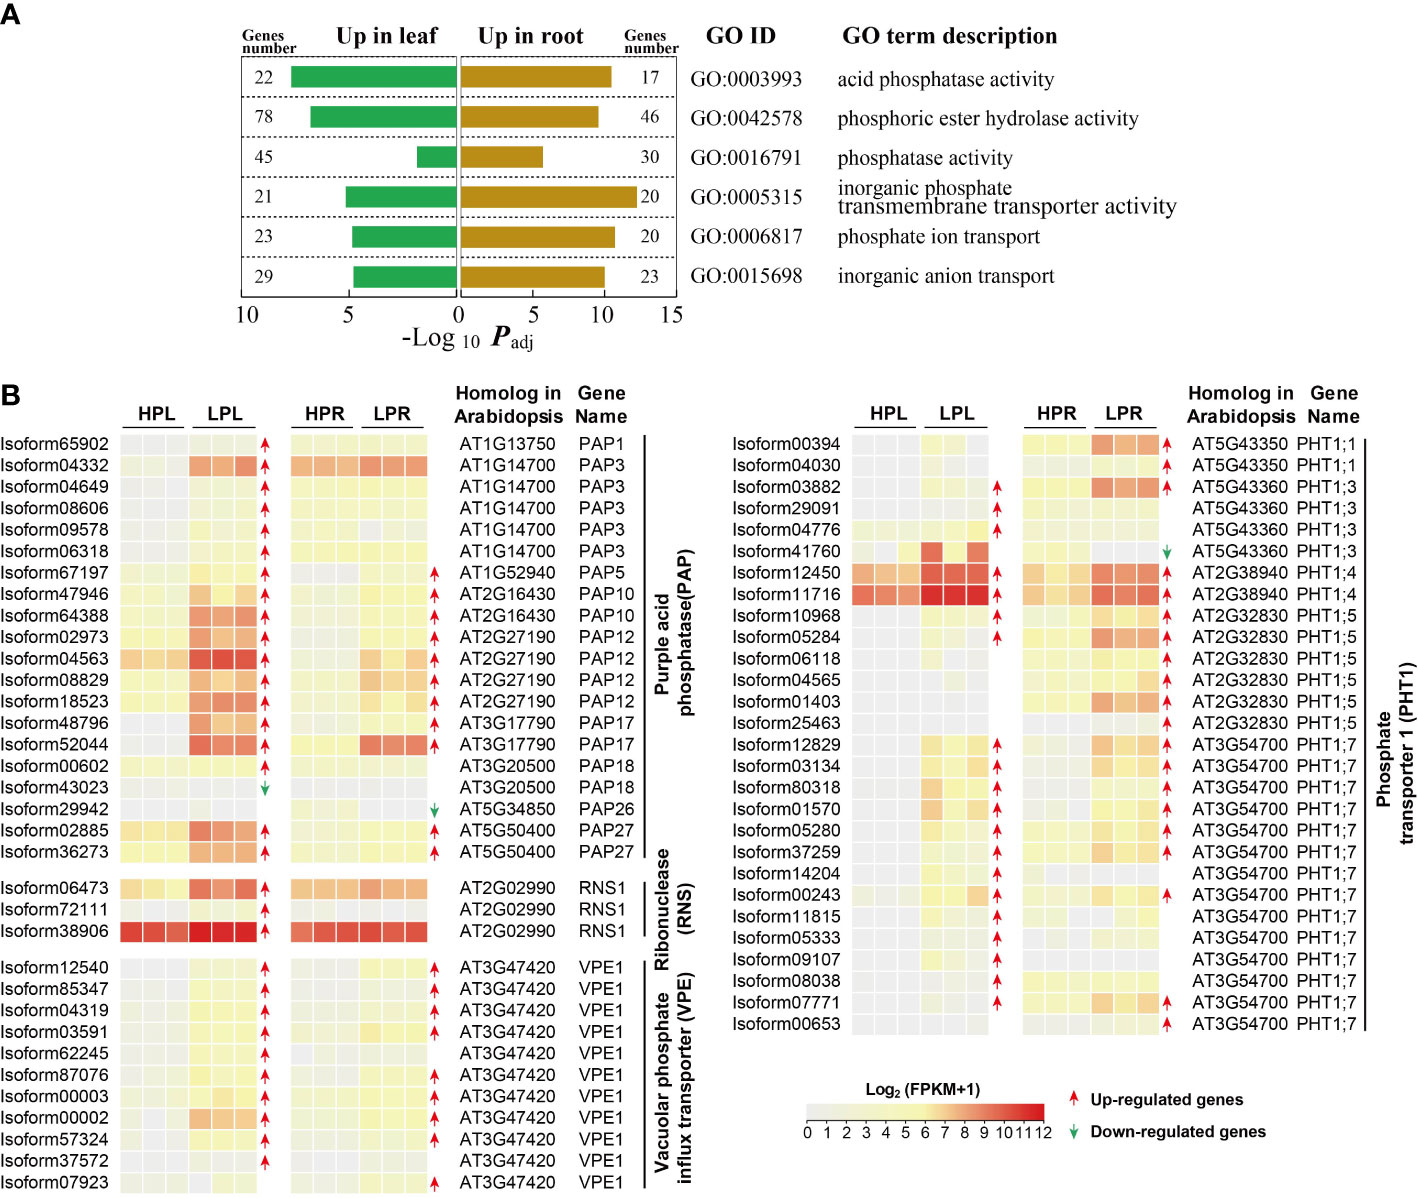
Figure 3 Expression changes of unigenes associated with Pi acquisition and transport in elephant grass upon Pi deprivation. (A) The significantly enriched KEGG pathways and GO terms associated with differentially expressed phosphate acquisition and transport-related unigenes. (B) Differentially expressed unigenes encoding purple acid phosphatase (PAP), ribonuclease (RNS), vacuolar phosphate influx transporter (VPE), and phosphate transporter 1 (PHT1) in leaves and roots of elephant grass under Pi starvation.
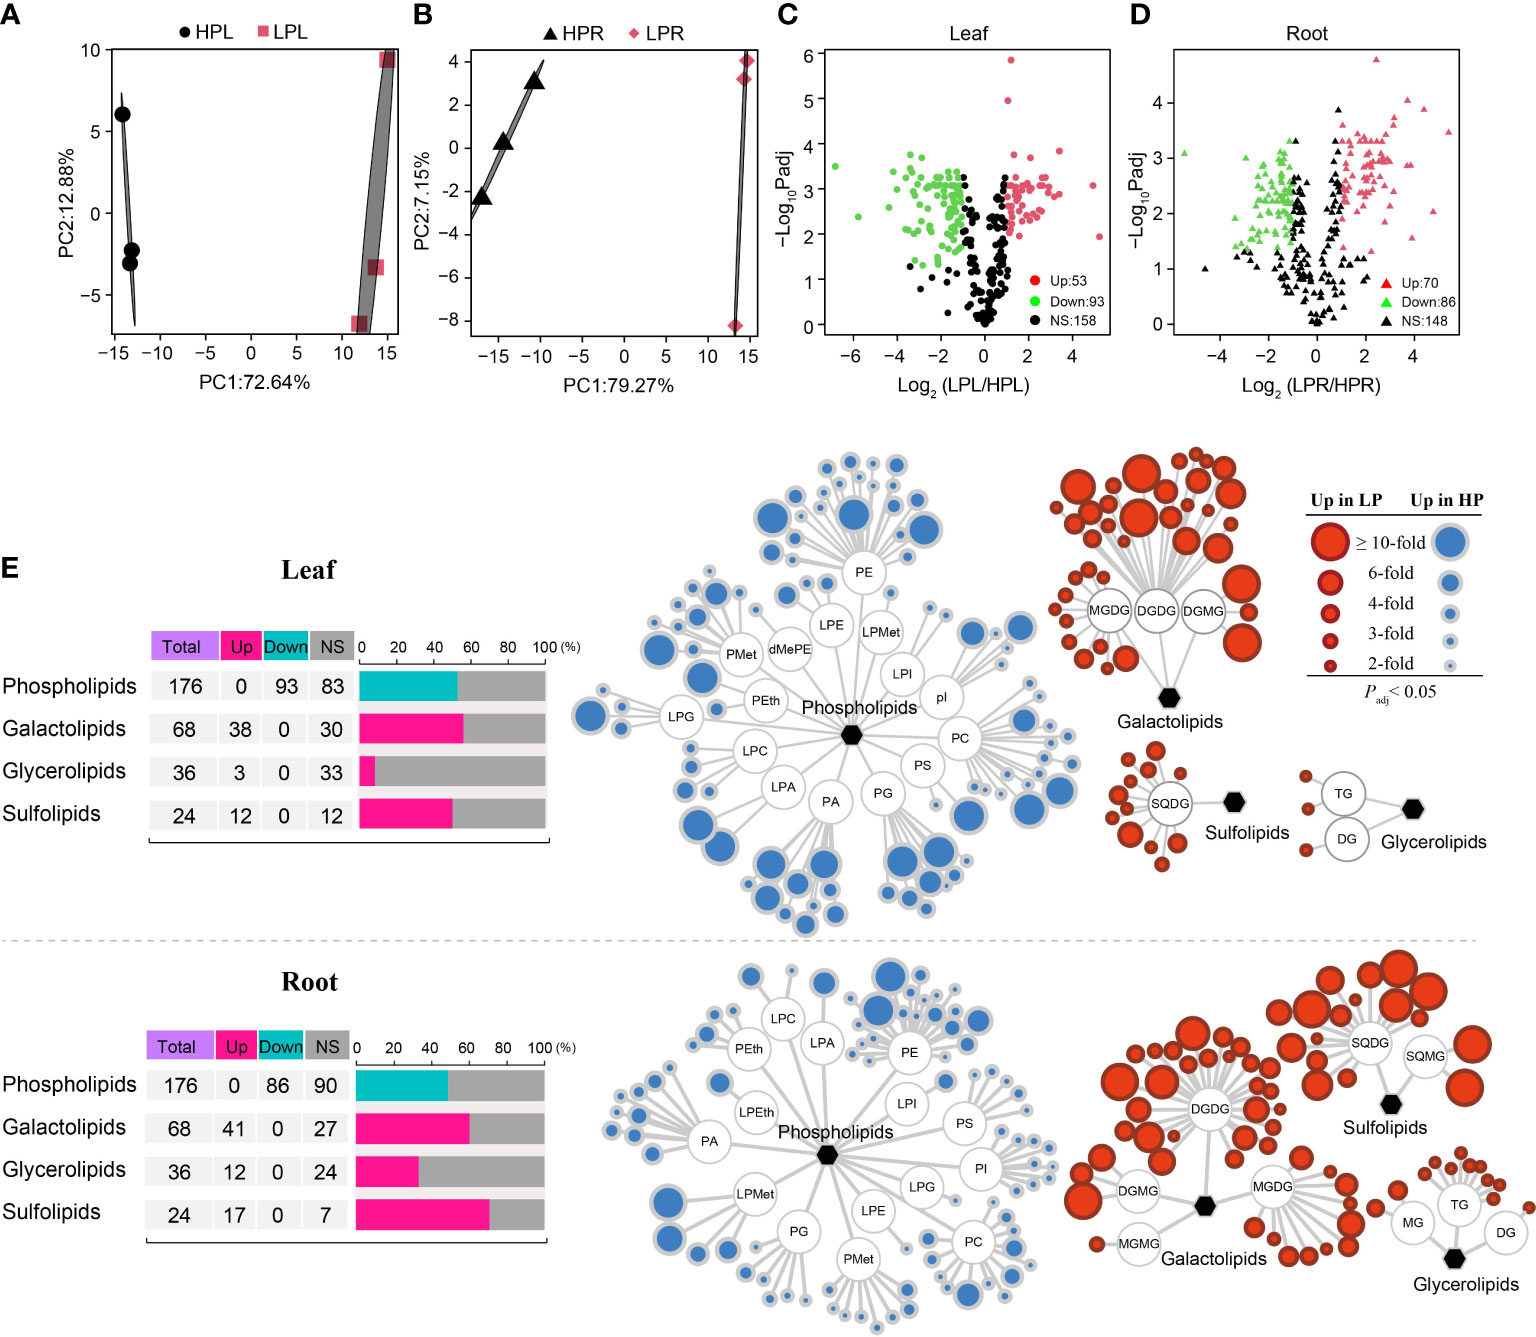
Figure 4 Analysis of lipid metabolome in elephant grass leaves and roots upon Pi starvation. (A, B) Principal component analysis of all lipid metabolites in elephant grass leaves (A) and roots (B). (C, D) Volcano diagrams of lipids in Pi-deficient leaves (C) and roots (D) of elephant grass. (E) Statistic classification and profile of differentially expressed lipids in Pi-deficient leaves and roots. DGDG, digalactosyldiacylglycerol; MGDG, monogalactosyldiacylglycerol; DGMG, digalactosylmonoacylglycerol; MGMG, monogalactosylmonoacylglycerol; SQDG, sulfoquinovosyldiacylglycerol; SQMG, sulfoquinovosylmonoacylglycerol; TG, triglyceride; DG, diglyceride; MG, monoglyceride; PG, phosphatidylglycerol; PI, phosphatidylinositol; PA, phosphatidic acid; PEth, phosphatidylethanol; PS, phosphatidylserine; LPMet, lyso-phosphatidylmethanol; LPG, lyso-phosphatidylglycerol; LPC, lyso-phosphatidylcholine; LPE, lyso-phosphatidylethanolamine; LPI, lyso-phosphatidylinositol; LPA, lyso-phosphatidic acid; LPEth, lyso-phosphatidylethanol; dMePE, dimethylphosphatidyethanolamine; PE, phosphatidylethanolamine; PC, phosphatidylcholine; PMet, phosphatidylmethanol.
GO enrichment analysis showed that all up-regulated unigenes in Pi-deprived leaves and roots were associated with Pi acquisition and transport (Figure 3A; Supplementary Tables S13 and S16). Subsequently, we identified PAPs, RNSs, VPEs and PHT1s in elephant grass, based genes of A. thaliana and O. sativa (Supplementary Table S18). A total of 48 PAP genes were identified, including 18 up-regulated genes and one down-regulated gene in leaves, and 11 up-regulated genes and one down-regulated gene in roots (Figure 3B; Supplementary Tables S19 and S20). There were 11 co-up-regulated PAP genes in leaves and roots under Pi deficiency, including one PAP5 unigene, two PAP10 unigenes, four PAP12 unigenes, two PAP17 unigenes, and two PAP27 unigenes (Figure 3B). Furthermore, we identified 12 RNS unigenes and three RNS unigenes up-regulated only in Pi-deficient leaves (Figure 3B; Supplementary Tables S19 and S20). Additionally, 18 VPE1 unigenes were identified, including 10 VPE1 and nine VPE1 unigenes up-regulated in leaves and roots, respectively, and eight VPE1 unigenes were co-up-regulated in leaves and roots under Pi starvation (Figure 3B; Supplementary Table S19, S20). Finally, 55 PHT1s were identified, including 20 up-regulated in leaves, 20 up-regulated in roots, and one down-regulated in roots (Figure 3B; Supplementary Tables S19 and S20). Thirteen co-up-regulated PHT1 unigenes in leaves and roots under Pi deficiency were identified: eight PHT1;7, two PHT1;5, two PHT1;4, and one PHT1;3 unigenes (Figure 3B).
Furthermore, 18 differentially expressed PpPAP genes (two shorter isoform67197 and isoform48796 genes were excluded), 29 AtPAP genes, and 26 OsPAP genes were used to construct a protein phylogenetic tree. The tree showed that six PpPAP genes, three PpPAP genes, seven PpPAP genes, and two PpPAP genes belonged to the IIIb, IIb, Ia-2, and Ib-2 subfamilies, respectively (Figure S3A). The protein phylogenetic tree of 28 differentially expressed PpPHT1 genes, nine AtPHT1 genes, and 13 OsPHT1 genes showed that two PpPHT1 unigenes, one PpPHT1, three PpPHT1s, four PpPHT1s, three PpPHT1 genes, and 15 PpPHT1 genes were closely related to OsPHT1;11, OsPHT1;6, OsPHT1;8, OsPHT1;3, OsPHT1;1, and OsPHT1;2, respectively (Figure S3B).
In order to evaluate changes in lipid metabolites in response to Pi starvation, we performed lipid metabolomics analysis on leaves and roots of elephant grass. A total of 304 metabolites were identified in elephant grass under Pi starvation (Supplementary Table S21). PCA revealed significant variation in metabolites between Pi-sufficient and Pi-deficient leaves (Figure 4A), as well as between Pi-sufficient and Pi-deficient roots (Figure 4B). Subsequently, we identified 146 DALs (53 up-regulated and 93 down-regulated) in Pi-deficient leaves and 156 DALs (70 up-regulated and 86 down-regulated) DALs in Pi-deficient roots (i.e., accumulated lipids that differed from those found in Pi-sufficient tissues) (Figures 4C, D). Furthermore, all DALs were classified into Pi-containing and Pi-free groups (Supplementary Table S21). We observed that all 93 down-regulated lipids in Pi-deficient leaves and 86 down-regulated lipids in Pi-deficient roots belonged to the Pi-containing group (phospholipids), mainly phosphatidylethanolamine (PE), phosphatidylcholine (PC), and phosphatidylglycerol (PG) (Figure 4E). A total of 53 and 70 lipids increased in abundance in Pi-deprived leaves and roots, respectively. These belonged mainly to the Pi-free group, and included the galactolipids digalactosyldiacylglycerol (DGDG), monogalactosyldiacylglycerol (MGDG),and digalactosylmonoacylglycerol (DGMG), the sulfolipids sulfoquinovosylmonoacylglycerol (SQDG), and sulfoquinovosylmonoacylglycerol (SQMG, and the glycerolipids triglyceride (TG), diglyceride (DG), and monoglyceride (MG), as shown in Figure 4E.
In KEGG and GO enrichment analyses, we identified several dominant pathways and terms associated with phospholipid metabolism (Figure 5A; Supplementary Tables S6, S7, S9, S10, S12, S13, S15, and S16), including glycerophospholipid metabolism (ko00564), glycerolipid metabolism (ko00561), and glycerophospholipid catabolic processes (GO:0046503). Subsequently, we identified genes involved in phospholipid metabolism in elephant grass, based on homologs in A. thaliana (Supplementary Tables S18 and S19). The results showed that some unigenes encoding phospholipid-hydrolyzing enzymes were up-regulated upon Pi starvation, including the PLA1, PLD, and NPC unigenes (Figure 5B; Supplementary Table S20). Moreover, we found some up-regulated unigenes associated with diacylglycerol (DAG) generation, including the lysophospholipase (LysoPL) and GDPD unigenes (Figure 5B; Supplementary Table S20). Furthermore, Pi starvation enhanced the expression levels of phosphomonoesterase genes, the protein products of which function in the hydrolysis of phosphate monoester bonds to produce Pi (Figure 5B; Supplementary Table S20), including the PAH, phosphoethanolamine/phosphocholine phosphatase (PECP), and PAP unigenes, which may be associated with the hydrolysis of glycerol 3-phosphate (G3P). Finally, we observed some up-regulated unigenes related to Pi-free lipid accumulation, such as the sulfoquinovosyldiacylglycerol 1 (SQD1) and sulfoquinovosyldiacylglycerol 2 (SQD2) unigenes, which play roles in sulfoquinovosyldiacylglycerol (SQDG) synthesis, and monogalactosyl diacylglycerol synthase (MGD) unigenes that are responsible for the generation of monogalactosyl diacylglycerol (MGDG). At the same time, five patatin-like protein (PLP) unigenes were down-regulated in leaves, and PLPs mainly function in the degradation of MGDG (Figure 5B; Supplementary Table S20). In addition, correlation analysis revealed that Pi-containing lipids (such as PC, PG, and PE) and Pi-free lipids (mainly MGDG, SQDG, and DGDG) were, respectively, significantly negatively and positively associated with unigenes related to phospholipid degradation (such as PLA, PLD, and GDPD) and Pi-free lipid synthesis (such as MGD, SQD1, and SQD2), and positively and negatively associated with PLP unigenes (Figure 5C). Among the top 10 unigenes PLA (isoform05552) was significantly correlated with the most lipids, and SQD1 (isoform39436) was significantly correlated with the fewest lipids. Thus, the top 10 DEGs might play important roles in the lipid remodeling pathway under low-Pi stress in elephant grass (Figure 5D).
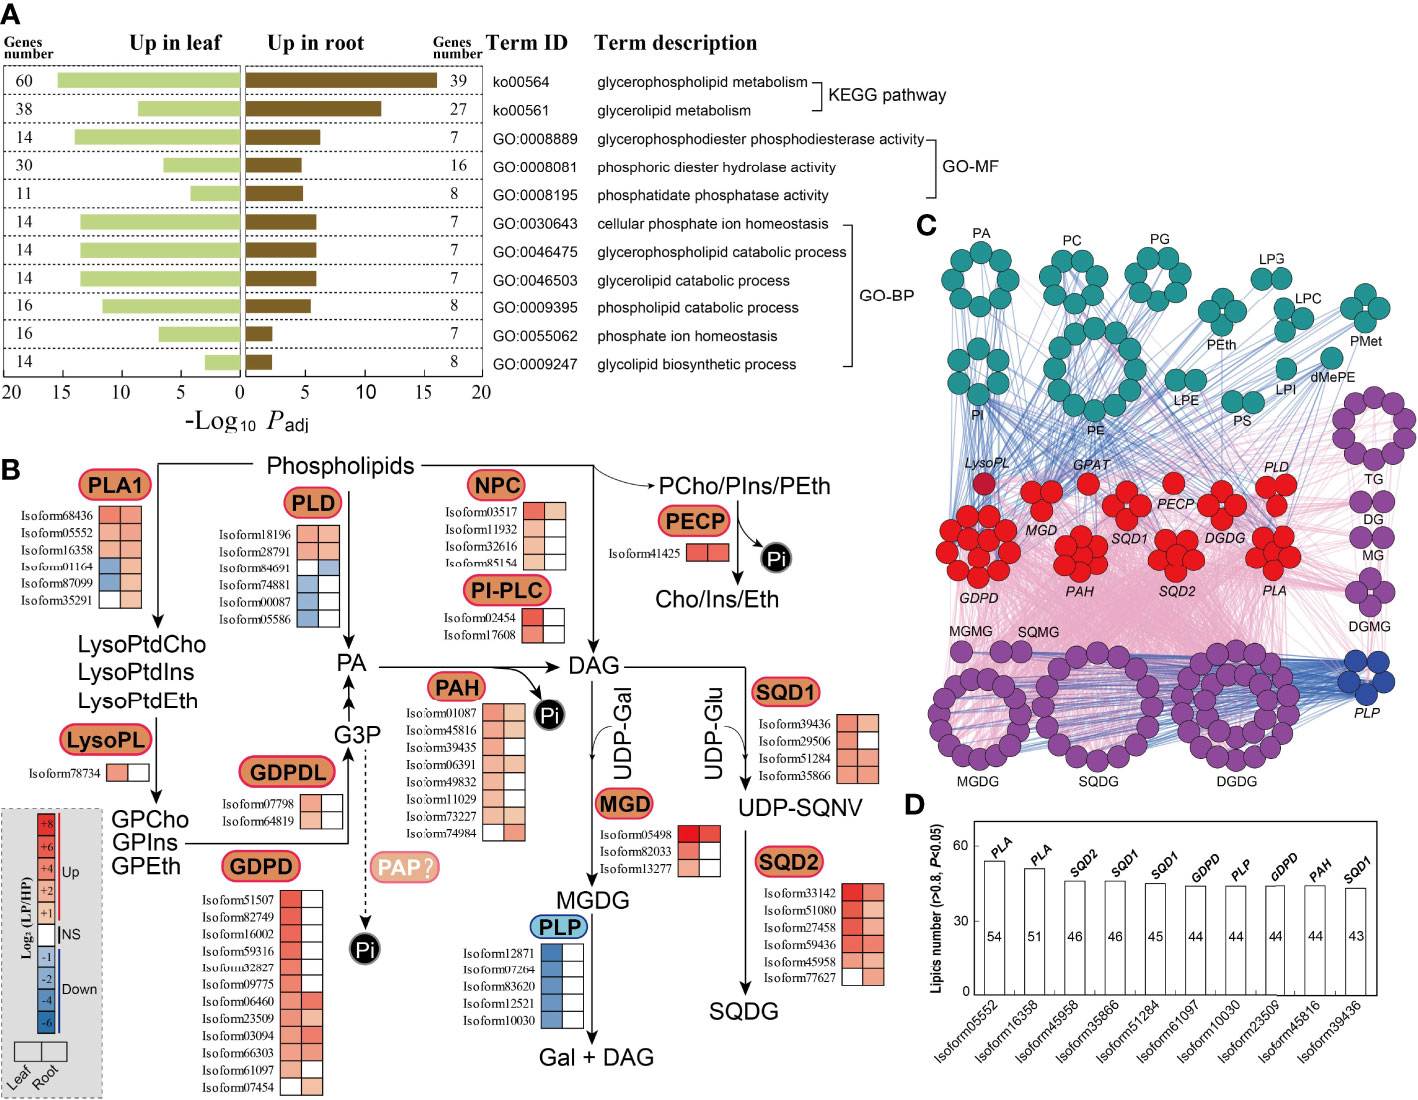
Figure 5 Phospholipid metabolism responding to Pi deficiency in elephant grass leaves and roots. (A) The significantly enriched KEGG pathways and GO categories associated with DEGs of phospholipid metabolites. (B) DEGs associated with phospholipid metabolism are shown; color intensity corresponds to expression levels standardized to log2(LP/HP) scales. (C) Association analysis of phospholipid metabolism DEGs and differentially expressed lipids (|r| >0.8, P <0.05). Dark-green, purple, red, and blue circles indicate decreased and increased lipids and up-regulated and down-regulated unigenes, respectively. Blue and pink lines indicate negative (r <–0.8, P <0.05) and positive (r >0.8, P <0.05) correlation, respectively. (D) The top 10 unigenes most correlated with lipids (data based on Figure 5C). PLA1, phospholipase A1; LysoPL, lysophospholipase; GDPD, glycerophosphodiester phosphodiesterase; GDPDL, glycerophosphodiester phosphodiesterase-like; PLD, phospholipase D; PAH, phosphatidate phosphatase; NPC, non-specific phospholipase C; PI-PLC, phosphoinositide phospholipase C; PECP, phosphoethanolamine/phosphocholine phosphatase; MGD, monogalactosyl diacylglycerol synthase; SQD1, sulfoquinovosyldiacylglycerol 1; SQD2, sulfoquinovosyldiacylglycerol 2.
In KEGG and GO enrichment analyses, we found that DEGs were grouped into several dominant pathways and terms associated with glycolysis metabolism in elephant grass leaves, but not in roots, such as glycolysis/gluconeogenesis (ko00010), pentose phosphate (ko00030), and glycolytic process (GO:0006096) pathways (Figure 6A; Figures S1 and S2; Supplementary Tables S6, S7, S12, and S13). Subsequently, Pi starvation-related genes involved in glycolysis metabolism were identified by homology comparison (Supplementary Tables S18 and S19).
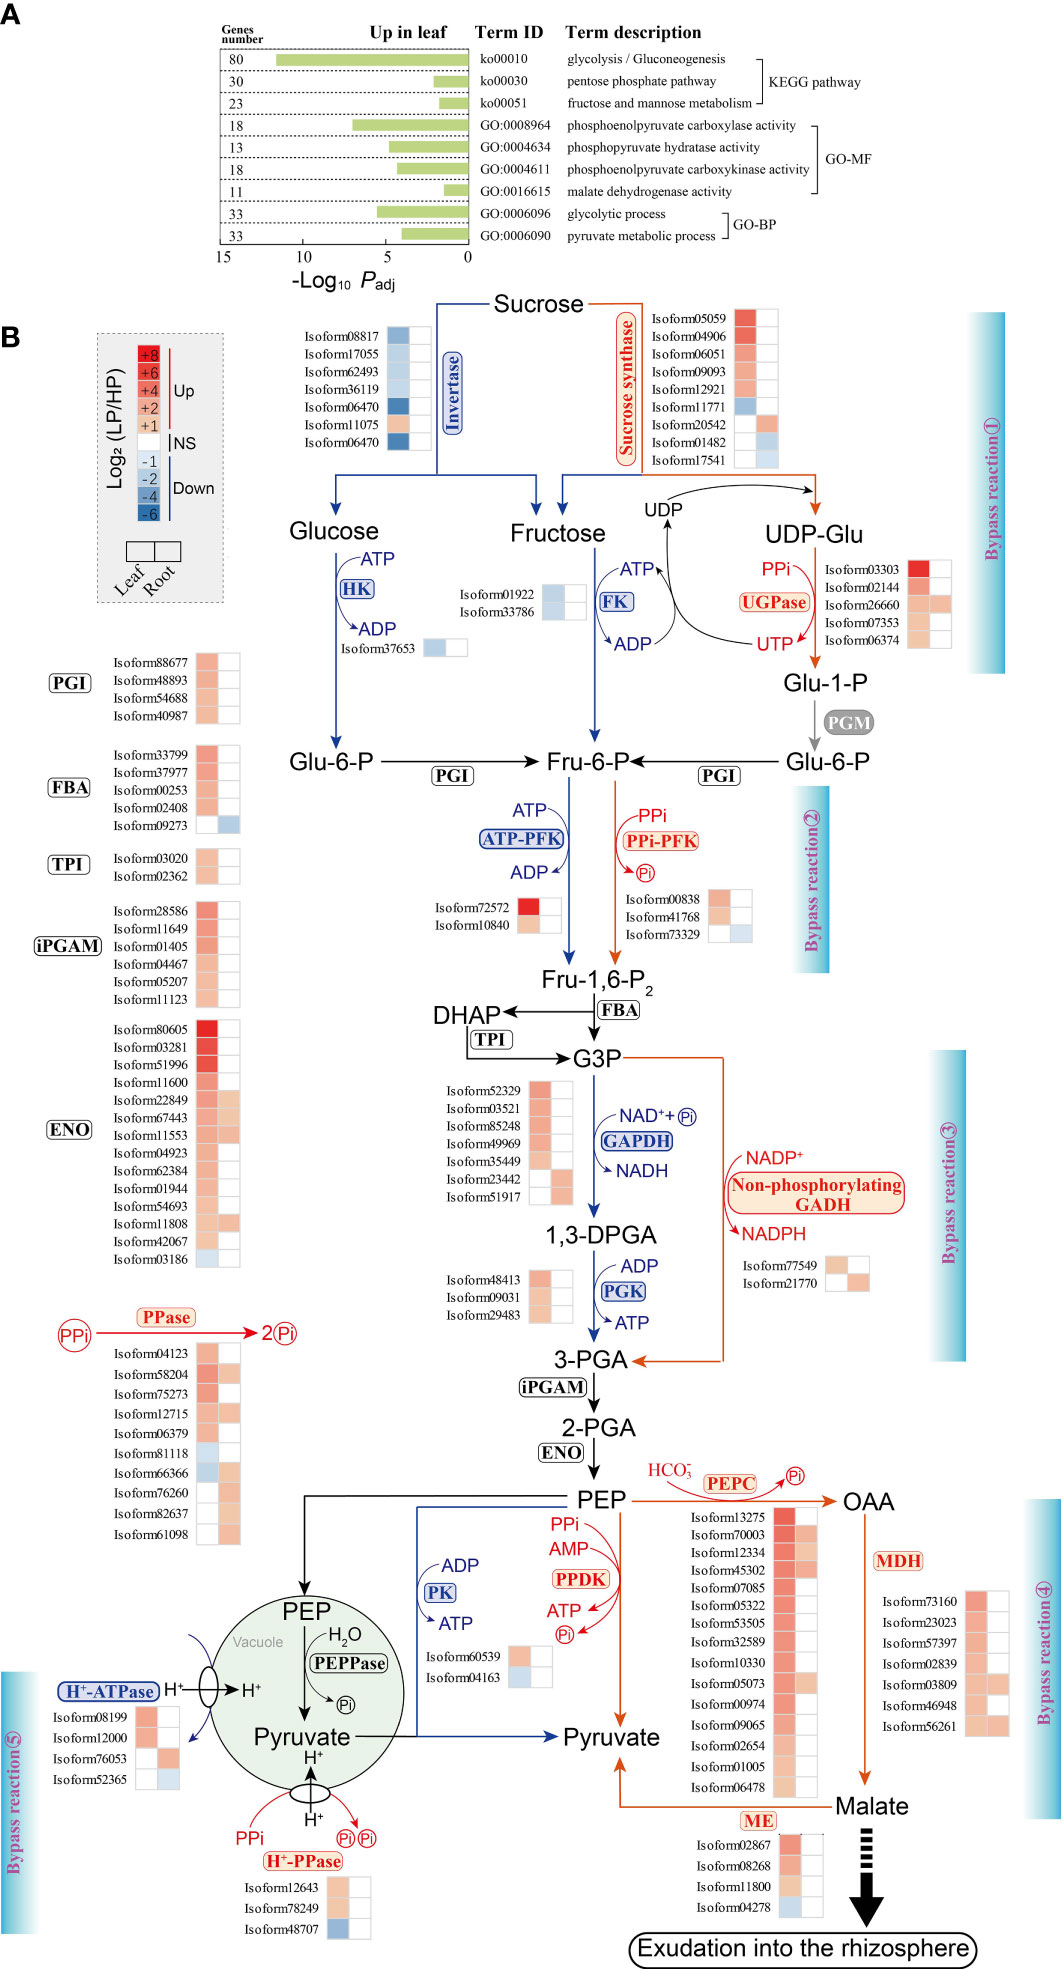
Figure 6 Changes in unigenes involved in glycolysis in elephant grass leaves and roots upon Pi deprivation. (A) The significantly enriched KEGG pathways and GO terms associated with DEGs of glycolysis metabolism. (B) DEGs associated with glycolysis metabolism are shown; color intensity corresponds to expression levels calculated using log2(LP/HP). The five bypass reactions performed by Pi-independent or PPi-dependent enzymes, are marked in red. UGPase, UDP-glucose pyrophosphorylase; FK, fructokinase; HK, hexokinase; PPi-PFK, PPi-dependent 6-phosphofructokinase; ATP-PFK, ATP-dependent 6-phosphofructokinase; FBA, fructose-bisphosphate aldolase; TPI, triosephosphate isomerase; GAPDH, NAD-dependent glyceraldehyde-3-phosphate dehydrogenase; PGK, phosphoglycerate kinase; non-phosphorylating GADH, NADP-dependent glyceraldehyde-3-phosphate dehydrogenase; iPGAM, 2,3-bisphosphoglycerate-independent phosphoglycerate mutase; ENO, enolase; PK, pyruvate kinase; PPDK, pyruvate orthophosphate dikinase; PEPC, phosphoenolpyruvate carboxylase; MDH, malate dehydrogenase; ME, malic enzyme; PEPPase, phosphoenolpyruvate phosphatase; H+-ATPase, H+-adenosine triphosphatase; H+-PPase, H+-pyrophosphatase; PPase, inorganic pyrophosphatase.
In this study, five bypass reactions were generated from ATP- and Pi-dependent glycolytic enzymes bypassed by PPi-dependent enzymes in Pi-deprived leaves (Figure 6B). The five bypass reactions were further evidenced by the up-regulation of bypass unigenes. We observed that five sucrose synthase and five UGPase unigenes were up-regulated in Pi-deprived leaves (Figure 6B; Supplementary Table S20). Conversely, six invertase, one hexokinase (HK), and two fructokinase (FK) unigenes were down-regulated in Pi-deprived leaves (Figure 6B; Supplementary Table S20).
In addition, the second, third, and fifth bypass reactions revealed, respectively, that expression levels of two PPi-PFK, one NADP-dependent glyceraldehyde-3-phosphate dehydrogenase (non-phosphorylating GADH), and two H+-pyrophosphatase (H+-PPase) unigenes in leaves were up-regulated during Pi starvation (Figure 6B; Supplementary Table S20). Four ATP-dependent unigenes (two ATP-dependent 6-phosphofructokinase and two H+-ATPase unigenes) in the second and fifth bypass reactions, as well as Pi-dependent unigenes (five NAD-dependent glyceraldehyde-4-phosphate dehydrogenase and three phosphoglycerate kinase unigenes) in the third bypass reaction, were found to be up-regulated in Pi-deficient leaves (Figure 6B; Supplementary Table S20).
Furthermore, as shown in the fourth bypass reaction, 25 bypass unigenes were significantly up-regulated in leaves under Pi starvation, including 15 PEPC, seven malate dehydrogenase (MDH), and three malic enzyme (ME) unigenes. In contrast to these bypass unigenes, one Pi-dependent unigene (pyruvate kinase, PK) was down-regulated in Pi-deficient leaves. However, the expression levels of PPi-dependent unigenes (pyruvate orthophosphate dikinase, PPDK) did not respond to Pi starvation (Figure 6B; Supplementary Table S20). Accordingly, five PPase unigenes were observed to be up-regulated in Pi-deficient leaves (Figure 6B; Supplementary Table S20).
According to KEGG enrichment analysis, phenylpropanoid biosynthesis (ko00940) and flavonoid biosynthesis (ko00941) were the most important pathways in elephant grass leaves and roots (Figure 7B; Figure S1A; Supplementary Tables S6, S7, S9, and S10). Subsequently, we identified eight critical gene families and analyzed their expression levels in response to Pi deficiency (Supplementary Tables S19 and S20). Under low-Pi stress, some members of the above eight gene families were up-regulated in Pi-deficient leaves and roots, including PAL, C4H, and CHS unigenes, compared with Pi-sufficient tissues (Figure 7A). The up-regulated unigenes were consistent with the accumulation of subsequent phenylpropanoid and flavonoid metabolites (Figure 7C; Supplementary Table S22).
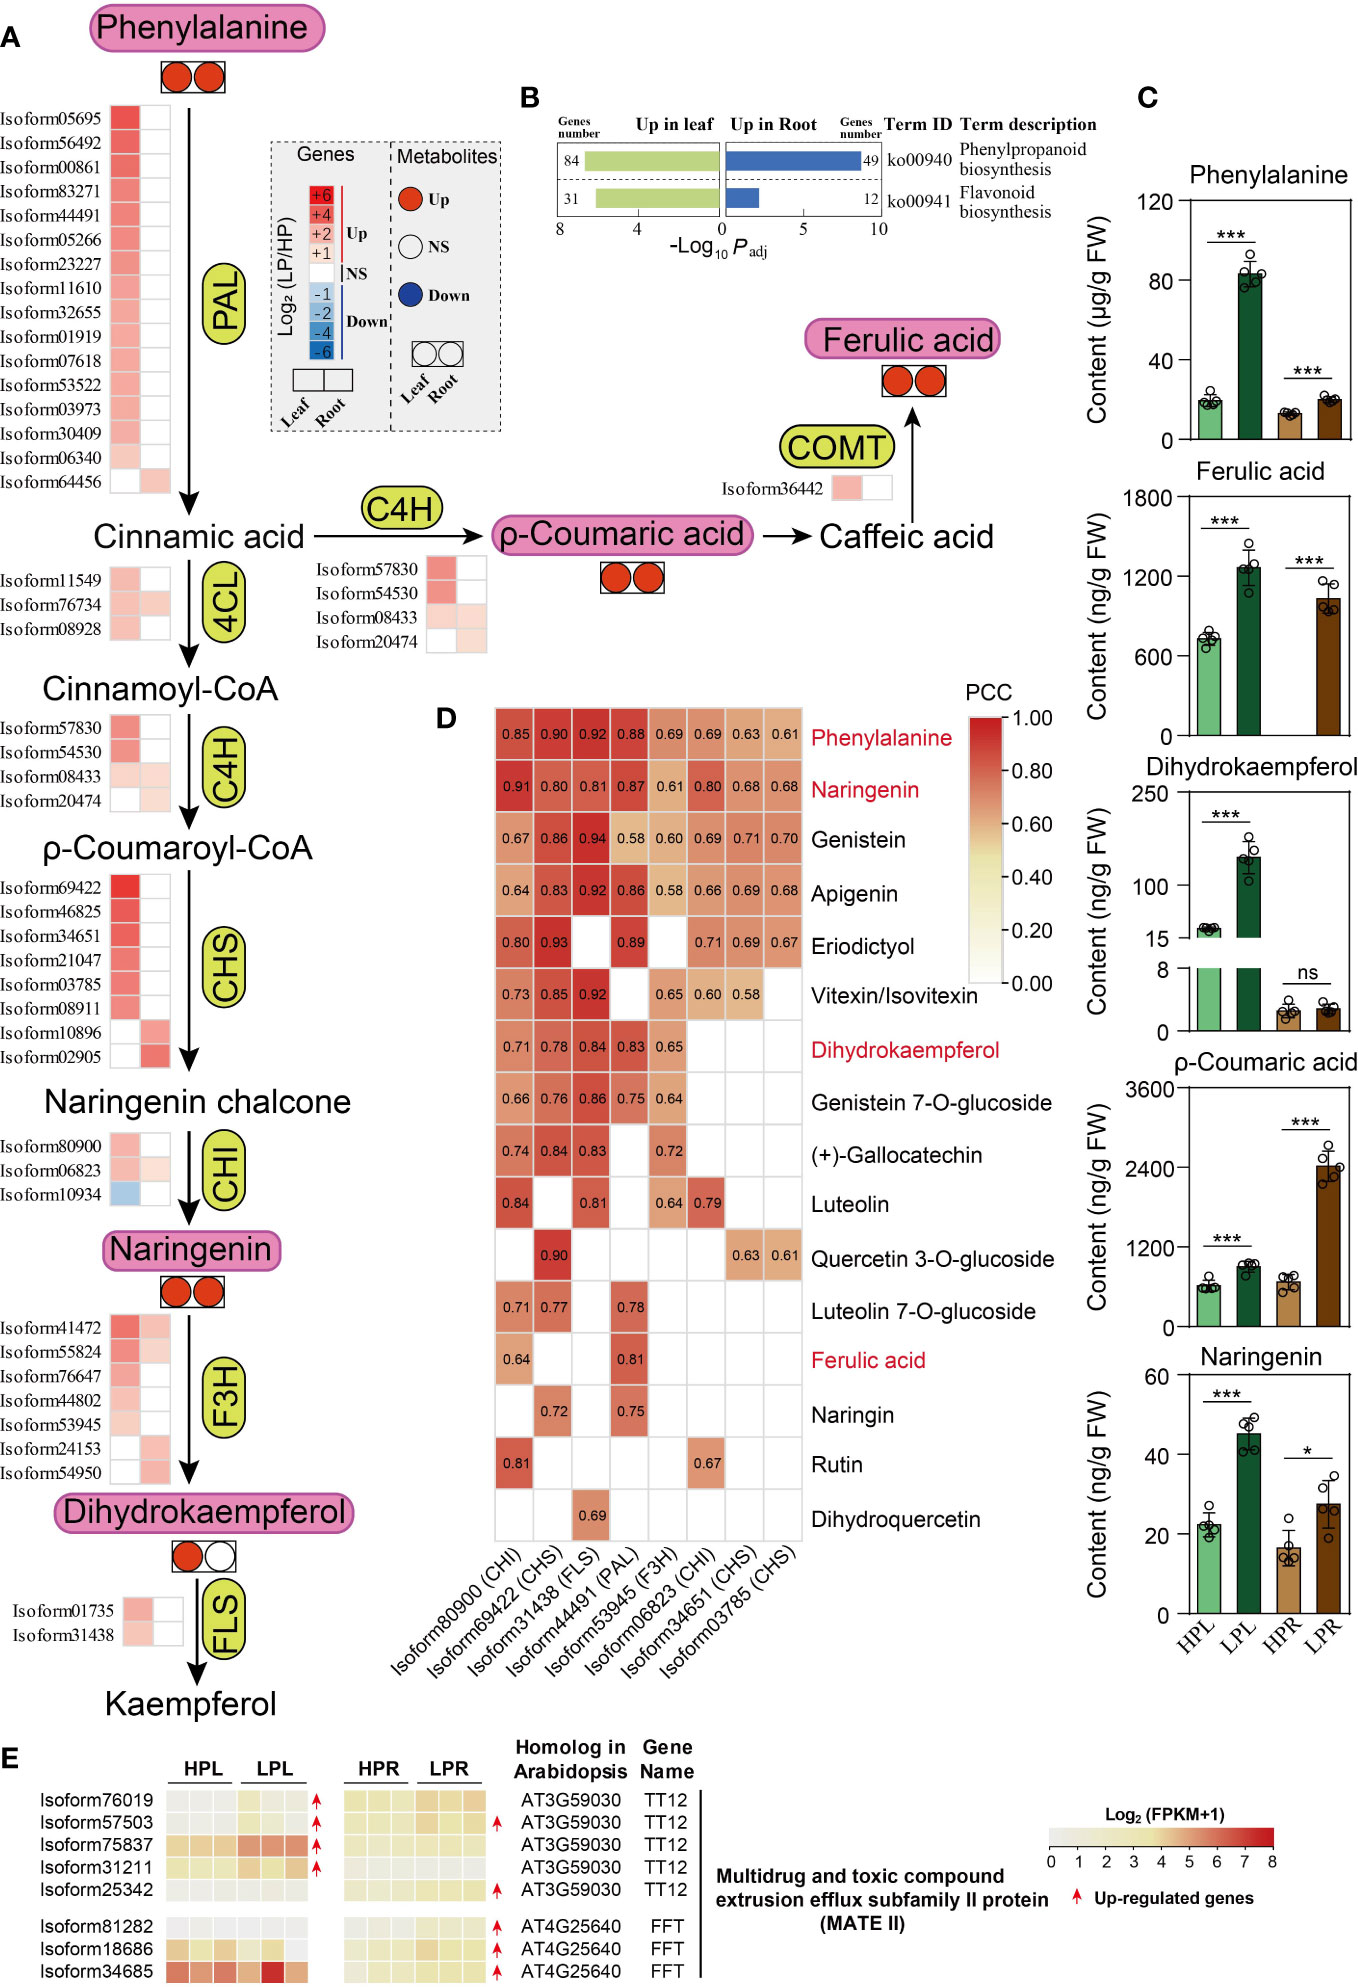
Figure 7 Phenylpropanoids and flavonoids metabolism in response to Pi deficiency in elephant grass leaves and roots. (A, C) Changes in the expression levels of critical unigenes (A) and the contents of five metabolites (C) in leaves and roots. (B) The significantly enriched KEGG pathways associated with DEGs of phenylpropanoid and flavonoid metabolism. (D) Significantly positive correlation between unigenes and metabolites (P <0.05). (E) DEGs encoding multidrug and toxic compound extrusion efflux subfamily II (MATE II) proteins in leaves and roots of elephant grass under Pi starvation. PAL, phenylalanine ammonia-lyase; C4H, trans-cinnamate 4-monooxygenase; COMT, flavone 3′-O-methyltransferase; 4CL, 4-coumarate-CoA ligase 3; CHS, chalcone synthase; CHI, chalcone-flavanone isomerase; F3H, naringenin,2-oxoglutarate 3-dioxygenase; FLS, flavonol synthase/flavanone 3-hydroxylase. Asterisks in (C) indicate significant differences using the Student’s t-test (*: 0.01 < P < 0.05, ***: P < 0.001), ns indicate non-significant differences (P > 0.05).
In total, we identified 19 DAMs in Pi-deficient leaves, including 17 increased (three phenylpropanoids, one flavanone, one flavonol, two isoflavones, one flavanone, five flavones, and four flavonols) and two decreased (one isoflavone and one flavone) metabolites, compared with Pi-sufficient leaves (Figure 7C; Figure S5; Supplementary Table S22). We also identified nine DAMs in Pi-deficient roots, eight increased (three phenylpropanoids, one flavanone, one isoflavone, two flavones, and one flavonol) and one decreased flavone, compared with Pi-sufficient roots (Figure 7C; Figure S5; Supplementary Table S22).
Correlation analysis between the identified eight gene families and DAMs showed that eight unigenes were significantly positively associated with numerous increased flavonoids, suggesting they might play critical roles in regulating flavonoids (Figure 7D). Finally, 37 MATE II subfamily genes were identified (Supplementary Table S19), of which four and five MATE unigenes were up-regulated in leaves and roots under Pi starvation, respectively (Figure 7E; Supplementary Table S20). Only one MATE unigene (isoform57503) was co-up-regulated in both leaves and roots upon Pi deficiency (Figure 7E; Supplementary Table S20).
To evaluate the reliability of comparative transcriptome results, the relative expression levels of 20 DEGs were verified by qRT-PCR analysis. The results showed that the log2FC(qRT-PCR) data and log2FC(RNA-seq) data from both leaf and root tissues displayed a significant positive correlation (P <0.001), with Pearson correlation coefficients (PCCs) of 0.845 and 0.883 in leaf and root tissues, respectively (Figure S4A). The relative expression levels of the 20 DEGs are shown in Figure S4B. In leaf tissues, the expression patterns of 19 DEGs detected by qRT-PCR and RNA-seq were consistent, with isoform36273 (PpPAP) the only exception (Figure S4B). In root tissues, the expression patterns of 19 unigenes were the same in both qRT-PCR and RNA-seq data, with isoform10030 (PpPLP) the only exception (Figure S4B). The apparent inconsistent expression patterns of the above two unigenes might be due to low basic expression levels. Overall, the results confirmed that the comparative transcriptome (RNA-seq) data were reliable.
In this study, the growth and P content of elephant grass declined in Pi-deficient leaves and roots, but the APase activities and PUE increased. The results allowed us to explore the mechanisms of efficient P use under Pi deficiency in elephant grass, which revealed associations with facilitating PAE and PUE, including four major aspects: Pi acquisition and transport; Pi recycling from membrane lipid remodeling; ATP saving and Pi recycling from bypassing the glycolytic pathway; and putative Pi mobilization and cell protection from phenylpropanoid and flavonoid metabolites.
PAPs are a unique class of APases, the most well-studied gene family contributing to Pi acquisition (Tran et al., 2010). Previous studies reported that 10 out of 26 OsPAP genes in O. sativa, 11 out of 33 ZmPAP genes in Z. mays, 23 out of 35 GmPAP genes in G. max, 20 out of 25 SlPAP genes in Solanum lycopersicum, and 21 out of 23 SgPAP genes in Stylosanthes guianensis were up-regulated upon low-Pi stress (Zhang et al., 2011; Li et al., 2012; González-Muñoz et al., 2015; Srivastava et al., 2020; Chen et al., 2021). Consistently, we found that 18 and 11 out of 48 PAP unigenes were up-regulated in leaves and roots, respectively, under Pi deficiency in elephant grass (Figure 3B). The expression levels of 11 PAP unigenes were co-up-regulated in leaves and roots, including two PAP10, four PAP12, and two PAP17 unigenes, homologs of OsPAP10a, OsPAP10c, and OsPAP3c in O. sativa (Figure 3B; Figure S3A; Supplementary Table S20). Previous studies have demonstrated that AtPAP10 is a primarily extracellular APase, while AtPAP12 is an intracellular and extracellular APase, and these two PAPs function in the utilization and mobilization of intracellular or extracellular organic P in A. thaliana (Wang et al., 2014). OsPAP10a and OsPAP10c of O. sativa, GmPAP7a and GmPAP7b of G. max, and PvPAP3 of Phaseolus vulgaris are involved in extracellular ATP utilization in Pi-deficient roots (Liang et al., 2010; Zhu et al., 2020; Bhadouria and Giri, 2022). Moreover, OsPAP3 is induced by Pi starvation in flag leaves, and might be involved in seed P loading (Jeong et al., 2017). AtPAP17 is markedly induced by Pi starvation to maintain Pi homeostasis by remobilizing Pi from phosphoesters in A. thaliana senescing leaves (Farhadi et al., 2020). Additionally, nucleic acids are a major source of organic P, particularly RNA, and Pi recycling/scavenging from exogenous or endogenous nucleic acids in response to low-Pi stress has been well documented (Dissanayaka et al., 2021). Pi is released from RNA by RNSs, and previous studies have reported that vacuole ribosome RNAs (rRNAs) were degraded by up-regulated RNSs to adapt low-Pi stress in plants (Yang et al., 2017; Dissanayaka et al., 2021). Consistent with this, we also identified three RNS unigenes that were up-regulated in elephant grass leaves by Pi deficiency (Figure 3B), and these might play roles in Pi recycling/scavenging from RNAs.
PHT1 family proteins are Pi influx transporters that mediate Pi uptake and translocation (López-Arredondo et al., 2014). Previous studies documented that most PHT1 genes were induced in several plant roots, including StPHT1;7 of potato (Solanum tuberosum) as well as OsPHT1;1, OsPHT1;2, and OsPHT1;3 of O. sativa (Roch et al., 2019; Zhang et al., 2021). In the present study, we identified 20 PHT1 unigenes that were up-regulated in elephant grass roots by Pi deprivation, including PHT1;7, PHT1;5, PHT1;4, PHT1;3, and PHT1;1 (Figure 3B). Therefore, these low-Pi up-regulated PHT1 genes might help facilitate Pi uptake in elephant grass roots.
Besides playing a role in Pi uptake, PHT1 proteins may be involved in Pi redistribution (Dai et al., 2022). For example, AtPHT1;5 of Arabidopsis, OsPHT1;3 of O. sativa, and HvPHT1;6 of barley (Hordeum vulgare) are mainly expressed in senescing or old leaves to mediate Pi redistribution (Preuss et al., 2010; Chang et al., 2019; Roch et al., 2019). OsPHT1;2 of O. sativa plays a role in Pi translocation in plants (Ai et al., 2009). In the present study, we identified 20 up-regulated PHT1 genes in Pi-deficient leaves of elephant grass, including 13 PHT1;7, two PHT1;5, two PHT1;4, and three PHT1;3 unigenes (Figure 3B). We predicted that these up-regulated PHT1 unigenes in leaves might play a significant role in Pi remobilization. In addition, we identified 13 co-up-regulated PHT1 unigenes in leaves and roots of elephant grass upon Pi deficiency, including one PHT1;3, two PHT1;4, two PHT1;5, and eight PHT1;7 unigenes (Figure 3B), and these unigenes might play a dual role in Pi uptake and redistribution. For example, OsPHT1;6 functions in Pi uptake and translocation throughout the plant (Ai et al., 2009). The plant cell vacuole is the main Pi storage pool, and VPEs are reported to export Pi from the vacuole to the cytosol; a previous study reported that VPEs mediate vacuolar Pi efflux in Pi-deprived O. sativa (Xu et al., 2019). Consistent with this, 10 VPE1 and nine VPE1 unigenes were found to be up-regulated in leaves and roots, respectively, and eight VPE1 unigenes were co-up-regulated in both leaves and roots in Pi-deficient elephant grass (Figure 3B).
Taken together, the results suggest that up-regulation of PAP, RNS, VPE, and PHT1 unigenes might enhance Pi acquisition and transport in elephant grass under Pi deficiency.
Membrane lipid remodeling, defined as the replacement of membrane phospholipids (Pi-containing lipids) by Pi-free lipids, is a common response to Pi starvation in various plants (Sun et al., 2020). Membrane lipid remodeling involves two processes: phospholipid degradation and Pi-free lipid synthesis (Dissanayaka et al., 2018). A previous study reported that phospholipase genes were significantly up-regulated by Pi deficiency, especially PLA, PLD, PAH, LysoPL, and GDPD genes (Dissanayaka et al., 2021). Similarly, we also found many up-regulated phospholipase unigenes under Pi deficiency in elephant grass, including PLA, PLD, and GDPD unigenes (Figure 5B). Moreover, phosphate ester enzymes (PAH and PECP unigenes) were up-regulated, and their protein products can directly release Pi. Consistent with this, numerous Pi-containing lipids (phospholipids) decreased, including PC, PE, PG, and phosphatidylserine (PS; Figure 4B). Correlation analysis revealed that phospholipase unigenes were negatively correlated with Pi-containing lipids (Figure 5C). Therefore, Pi recycling might be enhanced in membrane lipid remodeling of elephant grass by phospholipid degradation (Dissanayaka et al., 2021).
The synthesis of Pi-free lipids was subsequently coupled to the degradation of phospholipids to maintain membrane integrity (Dissanayaka et al., 2018). Sulfo- and galactolipids are the main Pi-free lipids, which are used to replace phospholipids under Pi deficiency (Jeong et al., 2017). In elephant grass, Pi deficiency resulted in great increases in Pi-free lipids in both leaves and roots, including galactolipids (DGDG, MGDG, and DGMG), sulfolipids (SQDG) and glycerolipids (TG; Figure 4B). Consistently, unigenes that contributed to Pi-free lipids accumulation were up- or down-regulated by Pi deficiency; for example MDG (synthesis of MGDG) as well as SQD1 and SQD2 (synthesis of SQDG) unigenes were up-regulated, while PLP (degradation of MGDG) unigenes were down-regulated (Figure 5B). Correlation analysis demonstrated that phospholipase unigenes were positively associated with Pi-free lipids, and PLP unigenes were negatively correlated with Pi-free lipids (Figure 5C). Finally, the top 10 unigenes might play critical roles in regulating membrane lipid remodeling of elephant grass (Figure 5D).
Collectively, our results suggest that membrane lipid remodeling, including phospholipid degradation and replacing phospholipids with Pi-free lipids, might ensure efficient P utilization in elephant grass under Pi deprivation.
In the cytosolic glycolysis pathway, some Pi- and adenylate-independent (such as PPi-dependent) reactions are employed to bypass reactions requiring Pi and/or adenylate under Pi deficiency conditions (Plaxton and Tran, 2011). Hydrolysis of PPi not only produces Pi, but also releases energy from high-energy phosphate ester bonds; hence PPi may help to conserve ATP and recycle Pi under Pi deprivation (Dissanayaka et al., 2021). In the present study, we identified five bypass reactions in elephant grass leaves under Pi deprivation, including up-regulated sucrose synthase and UGPase unigenes (PPi-dependent) were employed to bypass down-regulated invertase, HK, and FK unigenes (ATP-dependent); PPi-dependent unigenes (including PPi-PFK and H+-PPase unigenes) were recruited to bypass ATP-dependent bypassed unigenes (such as ATP-PFK and H+-ATPase unigenes) and up-regulated PEPC (involved in release of Pi), MDH, and ME unigenes were employed to replace down-regulated PK unigenes and non-significant PPDK unigenes (Figure 6B). Previous studies have reported that PPi can be used to release Pi by PPase hydrolysis (Dissanayaka et al., 2021). We also found that two PPase unigenes were up-regulated in Pi-deprived elephant grass leaves and roots (Figure 6B). These findings are in accordance with the results obtained in other Pi-deprived plants (Esfahani et al., 2020; Dissanayaka et al., 2021).
Overall, it is possible that PPi-dependent and Pi-independent bypass reactions are employed to replace adenylate- and/or Pi-dependent reactions in Pi-deprived leaves of elephant grass, thereby leading to conservation of ATP and recycling of Pi, and this strategy might achieve more efficient P utilization under Pi deficiency.
A large amount of phenylpropanoid and flavonoid metabolites was found to accumulate in response to Pi starvation in plants (Luo et al., 2020). These metabolites might influence root growth, enhance Pi availability, and perform antioxidant functions to adapt to low-Pi stress (Weston and Mathesius, 2013). For example, p-coumaric acid, ferulic acid, and naringenin were linked to the growth of roots (Weston and Mathesius, 2013). Genistein and quercetin were found to reduce and chelate iron, and thereby release Pi from iron phosphate (Tomasi et al., 2008; Cesco et al., 2010). Pi deficiency is expected to induce reactive oxygen species (ROS) accumulation and cause plants to suffer from oxidative stress, and flavonoids are reported to act as effective scavengers and inhibitors of ROS to protect plants (Agati et al., 2012). Consistent with earlier studies, several phenylpropanoids and flavonoids were observed to be remarkably elevated by Pi deficiency in elephant grass, such as phenylpropanoids (e.g. p-coumaric acid and ferulic acid) and flavonoids (e.g. naringenin and genistein 7-O-glucoside), in both Pi-deprived leaves and roots (Figure 7C, Figure S5). Consistent with these alterations, expression levels of unigenes (e.g., PAL, C4H, and CHS unigenes) involved in the biosynthesis of the aforementioned metabolites were largely up-regulated by Pi deficiency (Figure 7A). Furthermore, correlation analysis identified eight candidate unigenes positively associated with many phenylpropanoids and flavonoids, and these unigenes might play important roles in the accumulation of phenylpropanoids and flavonoids (Figure 7D). Importantly, MATE (subfamily II) members are known to transport flavonoids (Wang et al., 2016). In the present study, we detected eight MATE (subfamily II) unigenes that were up-regulated by Pi starvation in elephant grass leaves or roots (Figure 7E).
Overall, the phenylpropanoid and flavonoid metabolites markedly accumulated in Pi-deprived leaves and roots of elephant grass, and these metabolites might play an important role in root growth, rhizosphere Pi mobilization, and antioxidant activities under Pi starvation, but determining their specific roles requires further investigation.
In this study, integrated transcriptome and metabolome analyses were performed to investigate PSR unigenes and metabolites in leaves and roots of elephant grass. Numerous PSR unigenes involved in Pi acquisition and transport, Pi-containing lipid (phospholipid) degradation, Pi-free lipid biosynthesis, and phenylpropanoid and flavonoid metabolism were up-regulated in both Pi-deprived leaves and roots, and many Pi-independent and PPi-dependent unigenes were significantly increased in Pi-deficient leaves. Regarding metabolites, consistent with PSR unigenes, several phospholipids were decreased, and Pi-free lipids, phenylpropanoids, and flavonoids were increased in Pi-deficient leaves and roots. These findings suggest that facilitating Pi acquisition and transport, membrane lipid remodeling, Pi- and adenylate-independent bypassing reactions in glycolytic pathway, and phenylpropanoid and flavonoid accumulation may help to increase PAE and PUE in Pi-deficient elephant grass (Figure 8). Our findings will contribute to the development of more P-efficient elephant grass varieties.
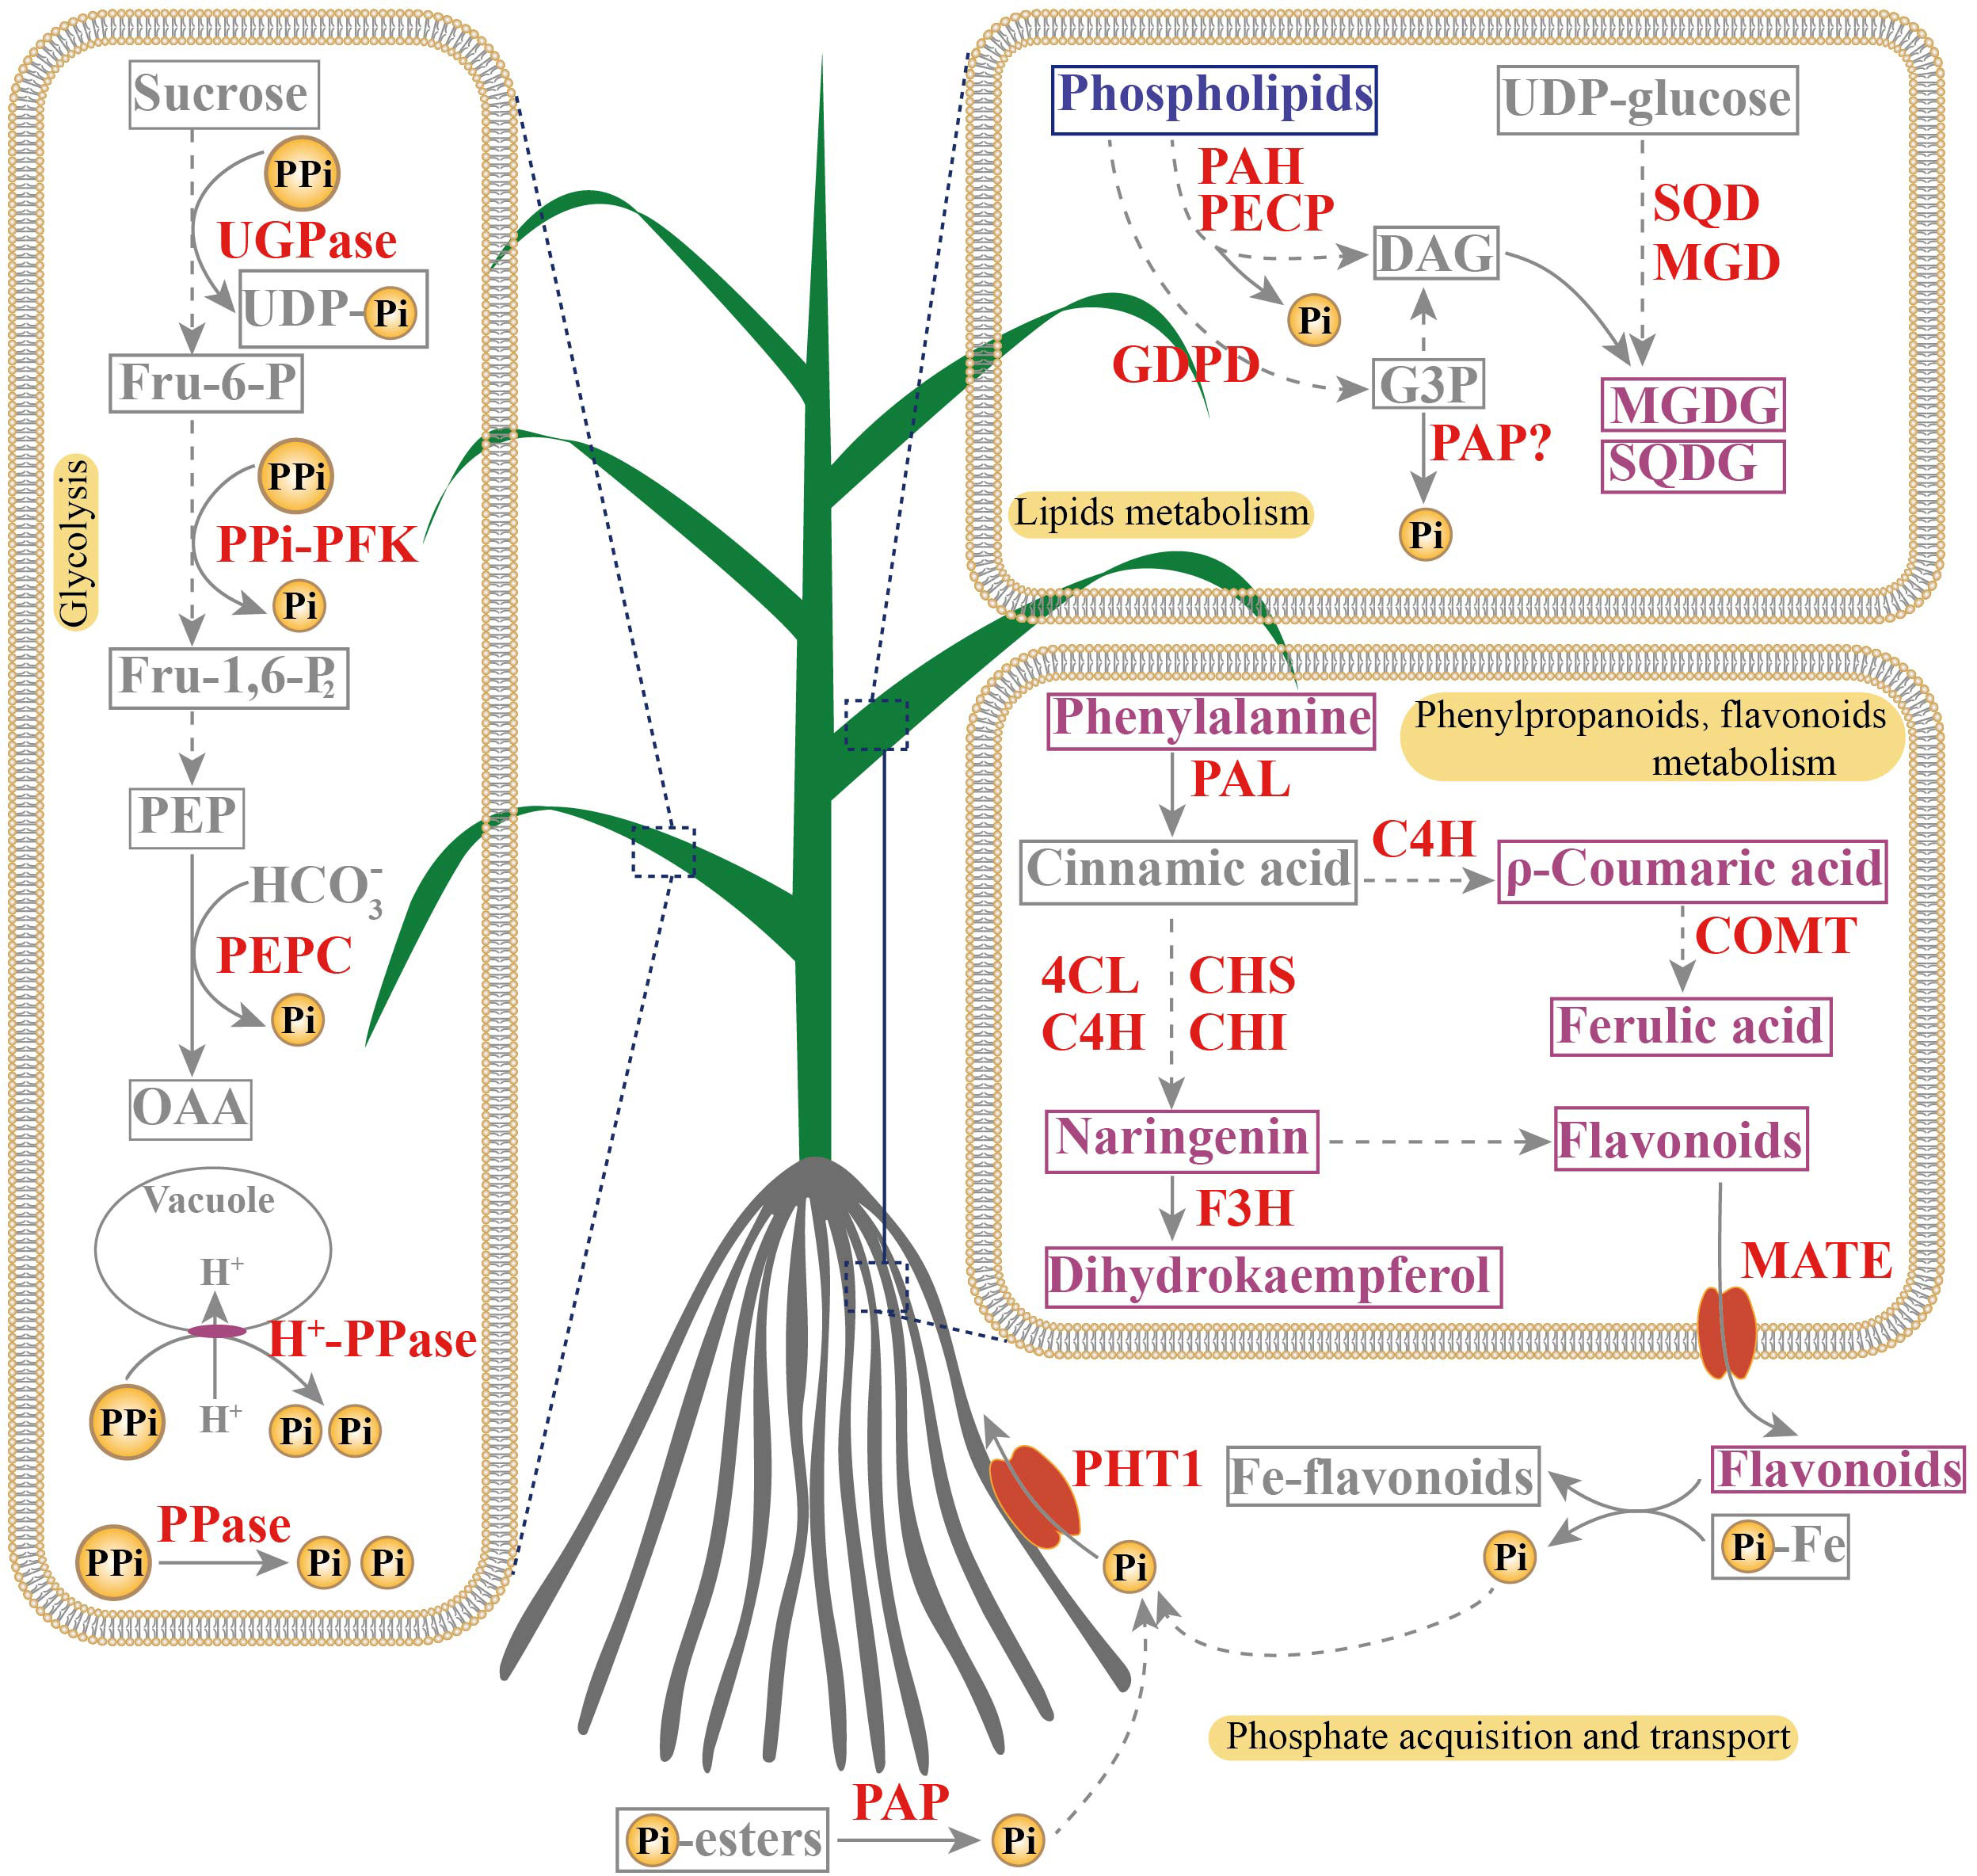
Figure 8 A proposed model of adaptive strategies to Pi deficiency in leaves and roots of elephant grass. Red indicate genes whose expression levels were up-regulated by Pi starvation. Purple and blue indicate metabolites whose accumulation increased (purple) or decreased (blue) in response to Pi deficiency.
The datasets presented in this study can be found in online repositories. The names of the repository/repositories and accession number(s) can be found in the article/Supplementary Material.
JL and ZC: conceptualization and writing. RH: software and editing. YW: methodology. CL: software. CH: validation. PL and GL: review and editing. RD: writing – review and editing. All authors contributed to the article and approved the submitted version.
This work was financially supported by the Natural Science Foundation of Hainan Province (grant numbers 321QN316 and 322RC772); the Central Public-interest Scientific Institution Basal Research Fund for Chinese Academy of Tropical Agricultural Sciences (grant numbers 1630032021016, 1630032020003, and 1630032022021); the Young Elite Scientists Sponsorship Program by CAST (grant number 2019QNRC001); the Agricultural Research Outstanding Talents and Innovation Team of MARA (grant number 13210268); and the China Agriculture Research System of MOF and MARA (grant number CARS-34).
The authors thank Liyun Yang and Xingkun Zhao for technical help.
The authors declare that the research was conducted in the absence of any commercial or financial relationships that could be construed as a potential conflict of interest.
All claims expressed in this article are solely those of the authors and do not necessarily represent those of their affiliated organizations, or those of the publisher, the editors and the reviewers. Any product that may be evaluated in this article, or claim that may be made by its manufacturer, is not guaranteed or endorsed by the publisher.
The Supplementary Material for this article can be found online at: https://www.frontiersin.org/articles/10.3389/fpls.2022.1069191/full#supplementary-material
Agati, G., Azzarello, E., Pollastri, S., Tattini, M. (2012). Flavonoids as antioxidants in plants: Location and functional significance. Plant Sci. 196, 67–76. doi: 10.1016/j.plantsci.2012.07.014
Ai, P., Sun, S., Zhao, J., Fan, X., Xin, W., Guo, Q. (2009). Two rice phosphate transporters, OsPht1;2 and OsPht1;6, have different functions and kinetic properties in uptake and translocation. Plant J. 57, 798–809. doi: 10.1111/j.1365-313X.2008.03726.x
Anderson, W. F., Dien, B. S., Brandon, S. K., Peterson, J. D. (2008). Assessment of bermudagrass and bunch grasses as feedstock for conversion to ethanol. Appl. Biochem. Biotechn. 145, 13–21. doi: 10.1007/s12010-007-8041-y
An, F., Xiao, X., Chen, T., Xue, J., Luo, X., Ou, W., et al. (2022). Systematic analysis of bHLH transcription factors in cassava uncovers their roles in postharvest physiological deterioration and cyanogenic glycosides biosynthesis. Front. Plant Sci. 13. doi: 10.3389/fpls.2022.901128
Bhadouria, J., Giri, J. (2022). Purple acid phosphatases: roles in phosphate utilization and new emerging functions. Plant Cell Rep. 41, 33–51. doi: 10.1007/s00299-021-02773-7
Bhadouria, J., Singh, A. P., Mehra, P., Verma, L., Srivastawa, R., Parida, S. K., et al. (2017). Identification of purple acid phosphatases in chickpea and potential roles of CaPAP7 in seed phytate accumulation. Sci. Rep. 7, 11012. doi: 10.1038/s41598-017-11490-9
Cesco, S., Neumann, G., Tomasi, N., Pinton, R., Weisskopf, L. (2010). Release of plant-borne flavonoids into the rhizosphere and their role in plant nutrition. Plant Soil 329, 1–25. doi: 10.1007/s11104-009-0266-9
Chang, M. X., Gu, M., Xia, Y. W., Dai, X. L., Dai, C. R., Zhang, J., et al. (2019). OsPHT1;3 mediates uptake, translocation, and remobilization of phosphate under extremely low phosphate regimes. Plant Physiol. 179, 656–670. doi: 10.1104/pp.18.01097
Chauhan, M. Z., Valencia, A. K., Piqueras, M. C., Enriquez-Algeciras, M., bhattacharya, S.K. (2019).Optic nerve lipidomics reveal impaired glucosylsphingosine lipids pathway in glaucoma. Biochem. Mol. Biol. 60, 1789–1798. doi: 10.1167/iovs.18-25802
Chen, Z., Song, J., Li, X., Arango, J., Cardoso, J. A., Rao, I., et al. (2021). Physiological responses and transcriptomic changes reveal the mechanisms underlying adaptation of Stylosanthes guianensis to phosphorus deficiency. BMC Plant Biol. 21, 466. doi: 10.1186/s12870-021-03249-2
Chowdhury, R. B., Moore, G. A., Weatherley, A. J., Arora, M. (2017). Key sustainability challenges for the global phosphorus resource, their implications for global food security, and options for mitigation. J. Clean Prod. 140, 945–963. doi: 10.1016/j.jclepro.2016.07.012
Cong, W. F., Suriyagoda, L. D. B., Lambers, H. (2020). Tightening the phosphorus cycle through phosphorus-efficient crop genotypes. Trends Plant Sci. 25, 967–975. doi: 10.1016/j.tplants.2020.04.013
Dai, C., Dai, X., Qu, H., Men, Q., Liu, J., Yu, L., et al. (2022). The rice phosphate transporter OsPHT1;7 plays a dual role in phosphorus redistribution and anther development. Plant Physio. 188, 2272–2288. doi: 10.1093/plphys/kiac030
Ding, N., Huertas, R., Torres-Jerez, I., Liu, W., Watson, B., Scheible, W. R., et al. (2020). Transcriptional, metabolic, physiological and developmental responses of switchgrass to phosphorus limitation. Plant Cell Environ. 44, 1–17. doi: 10.1111/pce.13872
Dissanayaka, D. M. S. B., Ghahremani, M., Siebers, M., Wasaki, J., Plaxton, W. C. (2021). Recent insights into the metabolic adaptations of phosphorus-deprived plants. J. Exp. Bot. 72, 199–223. doi: 10.1093/jxb/eraa482
Dissanayaka, D. M. S. B., Plaxton, W. C., Lambers, H., Siebers, M., Marambe, B., Wasaki, J. (2018). Molecular mechanisms underpinning phosphorus-use efficiency in rice. Plant Cell Environ. 41, 1483–1496. doi: 10.1111/pce.13191
Esfahani, M. N., Inoue, K., Nguyen, K. H., Chu, H., Watanabe, Y., Kanatani, A., et al. (2020). Phosphate or nitrate imbalance induces stronger molecular responses than combined nutrient deprivation in roots and leaves of chickpea plants. Plant Cell Environ. 44, 574–597. doi: 10.1111/pce.13935
Famoso, A. N., Clark, R. T., Shaff, J. E., Craft, E., McCouch, S. R., Kochian, L. V. (2010). Development of a novel aluminum tolerance phenotyping platform used for comparisons of cereal aluminum tolerance and investigations into rice aluminum tolerance mechanisms. Plant Physiol. 153, 1678–1691. doi: 10.1104/pp.110.156794
Farhadi, S., Sabet, M. S., Malboobi, M. A., Moieni, A. (2020). The critical role of AtPAP17 and AtPAP26 genes in Arabidopsis phosphate compensation network. Front. Plant Sci. 11. doi: 10.3389/fpls.2020.565865
Ferreira, F. M., Leite, R. V., Malikouski, R. G., Peixoto, M. A., Bernardeli, A., Alves, R. S., et al. (2022). Bioenergy elephant grass genotype selection leveraged by spatial modeling of conventional and high-throughput phenotyping data. J. Clean. Prod. 363, 132286. doi: 10.1016/j.jclepro.2022.132286
Fu, L., Niu, B., Zhu, Z., Wu, S., Li, W. (2012). CD-HIT: accelerated for clustering the next generation sequencing data. Bioinformatics 28, 3150–3152. doi: 10.1093/bioinformatics/bts565
González-Muñoz, E., Avendaño-Vázquez, A. O., Montes, R. A., de Folter, S., Andrés-Hernández, L., Abreu-Goodger, C., et al. (2015). The maize (Zea mays ssp. mays var. B73) genome encodes 33 members of the purple acid phosphatase family. Front. Plant Sci. 6. doi: 10.3389/fpls.2015.00341
Huang, R., Luo, J., Wu, Y., Liu, P., Liu, G. (2021). Molecular cloning of PpPAP genes and their expression responses to phosphorus deficiency in elephant grass (Pennisetum purpureum). Acta Agrestia Sin. 9, 425–433. doi: 10.11733/j.issn.1007-0435.2021.03.002
Jeong, K., Baten, A., Waters, D. L., Pantoja, O., Julia, C. C., Wissuwa, M., et al. (2017). Phosphorus remobilization from rice flag leaves during grain filling: an RNA-seq study. Plant Biotechnol. J. 15, 15–26. doi: 10.1111/pbi.12586
Lambers, H. (2021). Phosphorus acquisition and utilization in plants. Annu. Rev. Plant Biol. 8, 52. doi: 10.1146/annurev-arplant-102720-125738
Liang, C., Tian, J., Lam, H. M., Lim, B. L., Yan, X., Liao, H. (2010). Biochemical and molecular characterization of PvPAP3, a novel purple acid phosphatase isolated from common bean enhancing extracellular ATP utilization. Plant Physiol. 152, 854–865. doi: 10.1104/pp.109.147918
Li, C., Gui, S., Yang, T., Walk, T., Wang, X., Liao, H. (2012). Identification of soybean purple acid phosphatase genes and their expression responses to phosphorus availability and symbiosis. Ann. Bot. 109, 275–285. doi: 10.1093/aob/mcr246
Liu, C., Tai, Y., Luo, J., Wu, Y., Zhao, X., Dong, R., et al. (2022). Integrated multi-omics analysis provides insights into the genome evolution and phosphorus deficiency adaptation in pigeonpea (Cajanus cajan). Hortic. Res. 9, uhac 107. doi: 10.1093/hr/uhac107
López-Arredondo, D. L., Leyva-González, M. A., González-Morales, S. I., López-Bucio, J., Herrera-Estrella, L. (2014). Phosphate nutrition: Improving low-phosphate tolerance in crops. Annu. Rev. Plant Biol. 65, 95–123. doi: 10.1146/annurev-arplant-050213-035949
Lotfy, S. M., Mostafa, A. Z. (2014). Phytoremediation of contaminated soil with cobalt and chromium. J. Geochem. Explor. 144, 367–373. doi: 10.1016/j.gexplo.2013.07.003
Luo, J., Liu, Y., Zhang, H., Wang, J., Chen, Z., Luo, L., et al. (2020). Metabolic alterations provide insights into Stylosanthes roots responding to phosphorus deficiency. BMC Plant Biol. 20, 85. doi: 10.1186/s12870-020-2283-z
McLoughlin, F., Augustine, R. C., Marshall, R. S., Li, F., Kirkpatrick, L. D., Otegui, M. S., et al. (2018). Maize multi-omics reveal roles for autophagic recycling in proteome remodelling and lipid turnover. Nat. Plants 4, 1056–1070. doi: 10.1038/s41477-018-0299-2
Murphy, J., Riley, J. P. (1962). A modified single solution method for the determination of phosphate in natural waters. Anal. Chim. Acta 27, 31–36. doi: 10.1016/S0003-2670(00)88444-5
Norazhar, A. I., Lee, S. Y., Faudzi, S. M. M., Shaari, K. (2021). Metabolite profiling of Christia vespertilionis leaf metabolome via molecular network approach. Appl. Sci. 11, 3526. doi: 10.3390/app11083526
Plaxton, W. C., Tran, H. T. (2011). Metabolic adaptations of phosphate-starved plants. Plant Physiol. 156, 1006–1015. doi: 10.1104/pp.111.175281
Preuss, C. P., Huang, C. Y., Gilliham, M., Tyerman, S. D. (2010). Channel-like characteristics of the low-affinity barley phosphate transporter PHT1;6 when expressed in Xenopus oocytes. Plant Physiol. 152, 1431–1441. doi: 10.1104/pp.109.152009
Roch, G. V., Maharajan, T., Ceasar, S. A., Ignacimuthu, S. (2019). The role of PHT1 family transporters in the acquisition and redistribution of phosphorus in plants. Crit. Rev. Plant Sci. 38, 171–198. doi: 10.1080/07352689.2019.1645402
Srivastava, R., Akash Parida, A. P., Chauhan, P. K., Kumar, R. (2020). Identification, structure analysis, and transcript profiling of purple acid phosphatases under pi deficiency in tomato (Solanum lycopersicum l.) and its wild relatives. Int. J. Biol. Macromol. 165, 2253–2266. doi: 10.1016/j.ijbiomac.2020.10.08
Sun, Y., Jain, A., Xue, Y., Wang, X., Zhao, G., Liu, L., et al. (2020). OsSQD1 at the crossroads of phosphate and sulfur metabolism affects plant morphology and lipid composition in response to phosphate deprivation. Plant Cell Environ. 43, 1669–1690. doi: 10.1111/pce.13764
Tai, Y., Liu, C., Yu, S., Yang, H., Sun, J., Guo, C., et al. (2018). Gene co-expression network analysis reveals coordinated regulation of three characteristic secondary biosynthetic pathways in tea plant (Camellia sinensis). BMC Genomics 19, 616. doi: 10.1186/s12864-018-4999-9
Tomasi, N., Weisskopf, L., Renella, G., Landi, L., Pinton, R., Varanini, Z., et al. (2008). Flavonoids of white lupin roots participate in phosphorus mobilization from soil. Soil Biol. Biochem. 40, 1971–1974. doi: 10.1016/j.soilbio.2008.02.017
Tran, H. T., Hurley, B. A., Plaxton, W. C. (2010). Feeding hungry plants: the role of purple acid phosphatases in phosphate nutrition. Plant Sci. 179, 14–27. doi: 10.1016/j.plantsci.2010.04.005
Veneklaas, E. J., Lambers, H., Bragg, J., Finnegan, P. M., Lovelock, C. E., Plaxton, W. C., et al. (2012). Opportunities for improving phosphorus-use efficiency in crop plants. New Phytol. 195, 306–320. doi: 10.1111/j.1469-8137.2012.04190.x
Wang, L., Bei, X., Gao, J., Li, Y., Yan, Y., Hu, Y. (2016). The similar and different evolutionary trends of MATE family occurred between rice and Arabidopsis thaliana. BMC Plant Biol. 16, 207. doi: 10.1186/s12870-016-0895-0
Wang, L., Lu, S., Zhang, Y., Li, Z., Du, X., Liu, D. (2014). Comparative genetic analysis of arabidopsis purple acid phosphatases AtPAP10, AtPAP12, and AtPAP26 provides new insights into their roles in plant adaptation to phosphate deprivation. J. Integr. Plant Biol. 56, 299–314. doi: 10.1111/jipb.12184
Weston, L. A., Mathesius, U. (2013). Flavonoids: their structure, biosynthesis and role in the rhizosphere, including allelopathy. J. Chem. Ecol. 39, 283–297. doi: 10.1007/s10886-013-0248-5
Xu, L., Zhao, H., Wan, R., Liu, Y., Xu, Z., Tian, W., et al. (2019). Identification of vacuolar phosphate efflux transporters in land plants. Nat. Plants 5, 84–94. doi: 10.1038/s41477-018-0334-3
Yang, S. Y., Huang, T. K., Kuo, H. F., Chiou, T. J. (2017). Role of vacuoles in phosphorus storage and remobilization. J. Exp. Bot. 68, 3045–3055. doi: 10.1093/jxb/erw481
Yan, Q., Wu, F., Xu, P., Sun, Z., Li, J., Gao, L., et al. (2020). The elephant grass (Cenchrus purpureus) genome provides insights into anthocyanidin accumulation and fast growth. Mol. Ecol. Resour. 21, 526–542. doi: 10.1111/1755-0998.13271
Zhang, J., Gu, M., Liang, R. S. H., Shi, X. Y., Chen, L. L., Hu, X., et al. (2021). OsWRKY21 and OsWRKY108 function redundantly to promote phosphate accumulation through maintaining the constitutive expression of OsPHT1;1 under phosphate-replete conditions. New Phytol. 229, 1598–1161. doi: 10.1111/nph.16931
Zhang, Y., Wang, L., Guo, Z., Xu, L., Zhao, H., Zhao, P., et al. (2022). Revealing the underlying molecular basis of phosphorus recycling in the green manure crop Astragalus sinicus. J. Clean. Prod. 341, 130924. doi: 10.1016/j.jclepro.2022.130924
Zhang, Q., Wang, C., Tian, J., Li, K., Shou, H. (2011). Identification of rice purple acid phosphatases related to phosphate starvation signalling. Plant Biol. 13, 7–15. doi: 10.1111/j.1438-8677.2010.00346.x
Keywords: phosphate deficiency, pennisetum purpureum, transcriptome, metabolome, molecular mechanism
Citation: Luo J, Cai Z, Huang R, Wu Y, Liu C, Huang C, Liu P, Liu G and Dong R (2022) Integrated multi-omics reveals the molecular mechanisms underlying efficient phosphorus use under phosphate deficiency in elephant grass (Pennisetum purpureum). Front. Plant Sci. 13:1069191. doi: 10.3389/fpls.2022.1069191
Received: 13 October 2022; Accepted: 02 December 2022;
Published: 23 December 2022.
Edited by:
Rahul Kumar, University of Hyderabad, IndiaReviewed by:
Lingyun Cheng, China Agricultural University, ChinaCopyright © 2022 Luo, Cai, Huang, Wu, Liu, Huang, Liu, Liu and Dong. This is an open-access article distributed under the terms of the Creative Commons Attribution License (CC BY). The use, distribution or reproduction in other forums is permitted, provided the original author(s) and the copyright owner(s) are credited and that the original publication in this journal is cited, in accordance with accepted academic practice. No use, distribution or reproduction is permitted which does not comply with these terms.
*Correspondence: Rongshu Dong, ZG9uZ3JvbmdzaHVAMTI2LmNvbQ==
†These authors have contributed equally to this work
Disclaimer: All claims expressed in this article are solely those of the authors and do not necessarily represent those of their affiliated organizations, or those of the publisher, the editors and the reviewers. Any product that may be evaluated in this article or claim that may be made by its manufacturer is not guaranteed or endorsed by the publisher.
Research integrity at Frontiers
Learn more about the work of our research integrity team to safeguard the quality of each article we publish.