- 1Yanchi Research Station, School of Soil and Water Conservation, Beijing Forestry University, Beijing, China
- 2Key Laboratory for Soil and Water Conservation, State Forestry and Grassland Administration, Beijing Forestry University, Beijing, China
- 3Faculty of Forestry and Environmental Management, University of New Brunswick, Fredericton, NB, Canada
- 4School of Land Science and Space Planning, Hebei GEO University, Shijiazhuang, China
Acclimation strategies in xerophytic plants to stressed environmental conditions vary with temporal scales. Our understanding of environmentally-induced variation in photosystem II (PSII) processes as a function of temporal scales is limited, as most studies have thus far been based on short-term, laboratory-controlled experiments. In a study of PSII processes, we acquired near-continuous, field-based measurements of PSII-energy partitioning in a dominant desert-shrub species, namely Artemisia ordosica, over a six-year period from 2012–2017. Continuous-wavelet transformation (CWT) and wavelet coherence analyses (WTC) were employed to examine the role of environmental variables in controlling the variation in the three main PSII-energy allocation pathways, i.e., photochemical efficiency and regulated and non-regulated thermal dissipation, i.e., ΦPSII, ΦNPQ, and ΦNO, respectively, across a time-frequency domain from hours to years. Convergent cross mapping (CCM) was subsequently used to isolate cause-and-effect interactions in PSII-energy partitioning response. The CWT method revealed that the three PSII-energy allocation pathways all had distinct daily periodicities, oscillating abruptly at intermediate timescales from days to weeks. On a diurnal scale, WTC revealed that all three pathways were influenced by photosynthetically active radiation (PAR), air temperature (Ta), and vapor pressure deficit (VPD). By comparing associated time lags for the three forms of energy partitioning at diurnal scales, revealed that the sensitivity of response was more acutely influenced by PAR, declining thereafter with the other environmental variables, such that the order of influence was greatest for Ta, followed by VPD, and then soil water content (SWC). PSII-energy partitioning on a seasonal scale, in contrast, displayed greater variability among the different environmental variables, e.g., ΦPSII and ΦNO being more predisposed to changes in Ta, and ΦNPQ to changes in VPD. CCM confirmed the causal relationship between pairings of PSII-energy allocation pathways, according to shrub phenology. A. ordosica is shown to have an innate ability to (i) repair damaged PSII-photochemical apparatus (maximum quantum yield of PSII photochemistry, with Fv/Fm > 0.78), and (ii) acclimatize to excessive PAR, dry-air conditions, and prolonged drought. A. ordosica is relatively sensitive to extreme temperature and exhibits photoinhibition.
Introduction
Drylands, which make up almost half the earth’s continental area, have been expanding at an alarming rate as regional-to-global climate continues to deteriorate and human activity increases (Huang et al., 2017; Li et al., 2021). Consequently, plants in drylands (arid and semiarid lands) are frequently exposed to environmental stressors, triggered by excessive solar radiation, extreme temperature, drought, and other climatic anomalies (Jia et al., 2014; Tominaga et al., 2014). Consequently, understanding how dryland plants can cope with their harsh surroundings is of great importance to land managers and ecologists worldwide.
As a basis for maintaining energy and material flows in ecosystems, plant photosynthesis is particularly susceptible to environmental fluctuations, especially when representing extreme departures from favorable conditions (Schurr et al., 2006; Rodríguez-Calcerrada et al., 2008; Kalaji et al., 2012). Photosystem II (PSII) energy partitioning is considered the most sensitive element of photosynthesis (Quaas et al., 2015; Ni et al., 2019; Vilfan et al., 2019). Light energy collected by the light-trapping pigment in PSII is dissipated along three key energy-allocation pathways, i.e., (i) transfer to the photochemical reaction centers of photosynthesis, rated according to photochemical efficiency (ΦPSII), (ii) transfer as heat for thermal dissipation, and (iii) re-emission in the form of chlorophyll fluorescence (ChlF). Allocation along the three pathways is competitive. Heat avoidance in plants can occur by either regulatory or non-regulatory thermal dissipation, i.e., ФNPQ and ФNO, respectively. Variables ΦNPQ and ΦNO represent the ability of photoprotection regulation and the extent of photoinhibition or photodamage in plants (Genty et al., 1989; Sperdouli and Moustakas, 2012). PSII-energy partitioning pathways, by way of ΦPSII, ΦNPQ, and ΦNO, are themselves affected by abiotic and biotic factors (Figure 1). These factors modulate the spectral characteristics of PSII-energy partitioning over multiple timescales, i.e., from seconds to minutes, to seasons (Stoy et al., 2009; Han et al., 2018; Jia et al., 2018). At sub-hour, minute timescales, for example, the intensification of photosynthetically active radiation (PAR) affects the xanthophyll cycle, causing excess light energy to be dissipated (Genty et al., 1989; Ruban et al., 2012; Ware et al., 2015). At hourly scales, in response to the increase in water vapor pressure (VPD), photochemical efficiency (ФPSII) is lowered by stomatal closure (Nar et al., 2009; Zhou et al., 2013). At daily timescales, PSII-energy partitioning is largely driven by diel cycles of PAR, air temperature (Ta), and VPD (Jia et al., 2014; Ouyang et al., 2014). At scales of several days to months, weather events accompanied by precipitation (PPT), high radiation levels, heat waves, cold spells influence photochemistry in PSII (Zha et al., 2017; Wu et al., 2018). At seasonal and interannual scales, PSII-energy partitioning may be affected by plant phenological processes and annual environmental biophysical cycles, particularly in soil water content (SWC; Han et al., 2018; Ren et al., 2018). Despite this past understanding, most studies on PSII-energy partitioning in plants have been based on short-term, laboratory-controlled experiments (Georgieva et al., 2005). However, under natural outdoor-conditions, PSII-energy partitioning response to fluctuations in local environmental conditions may be quite different over the short-to-long term (Sperdouli and Moustakas, 2012).
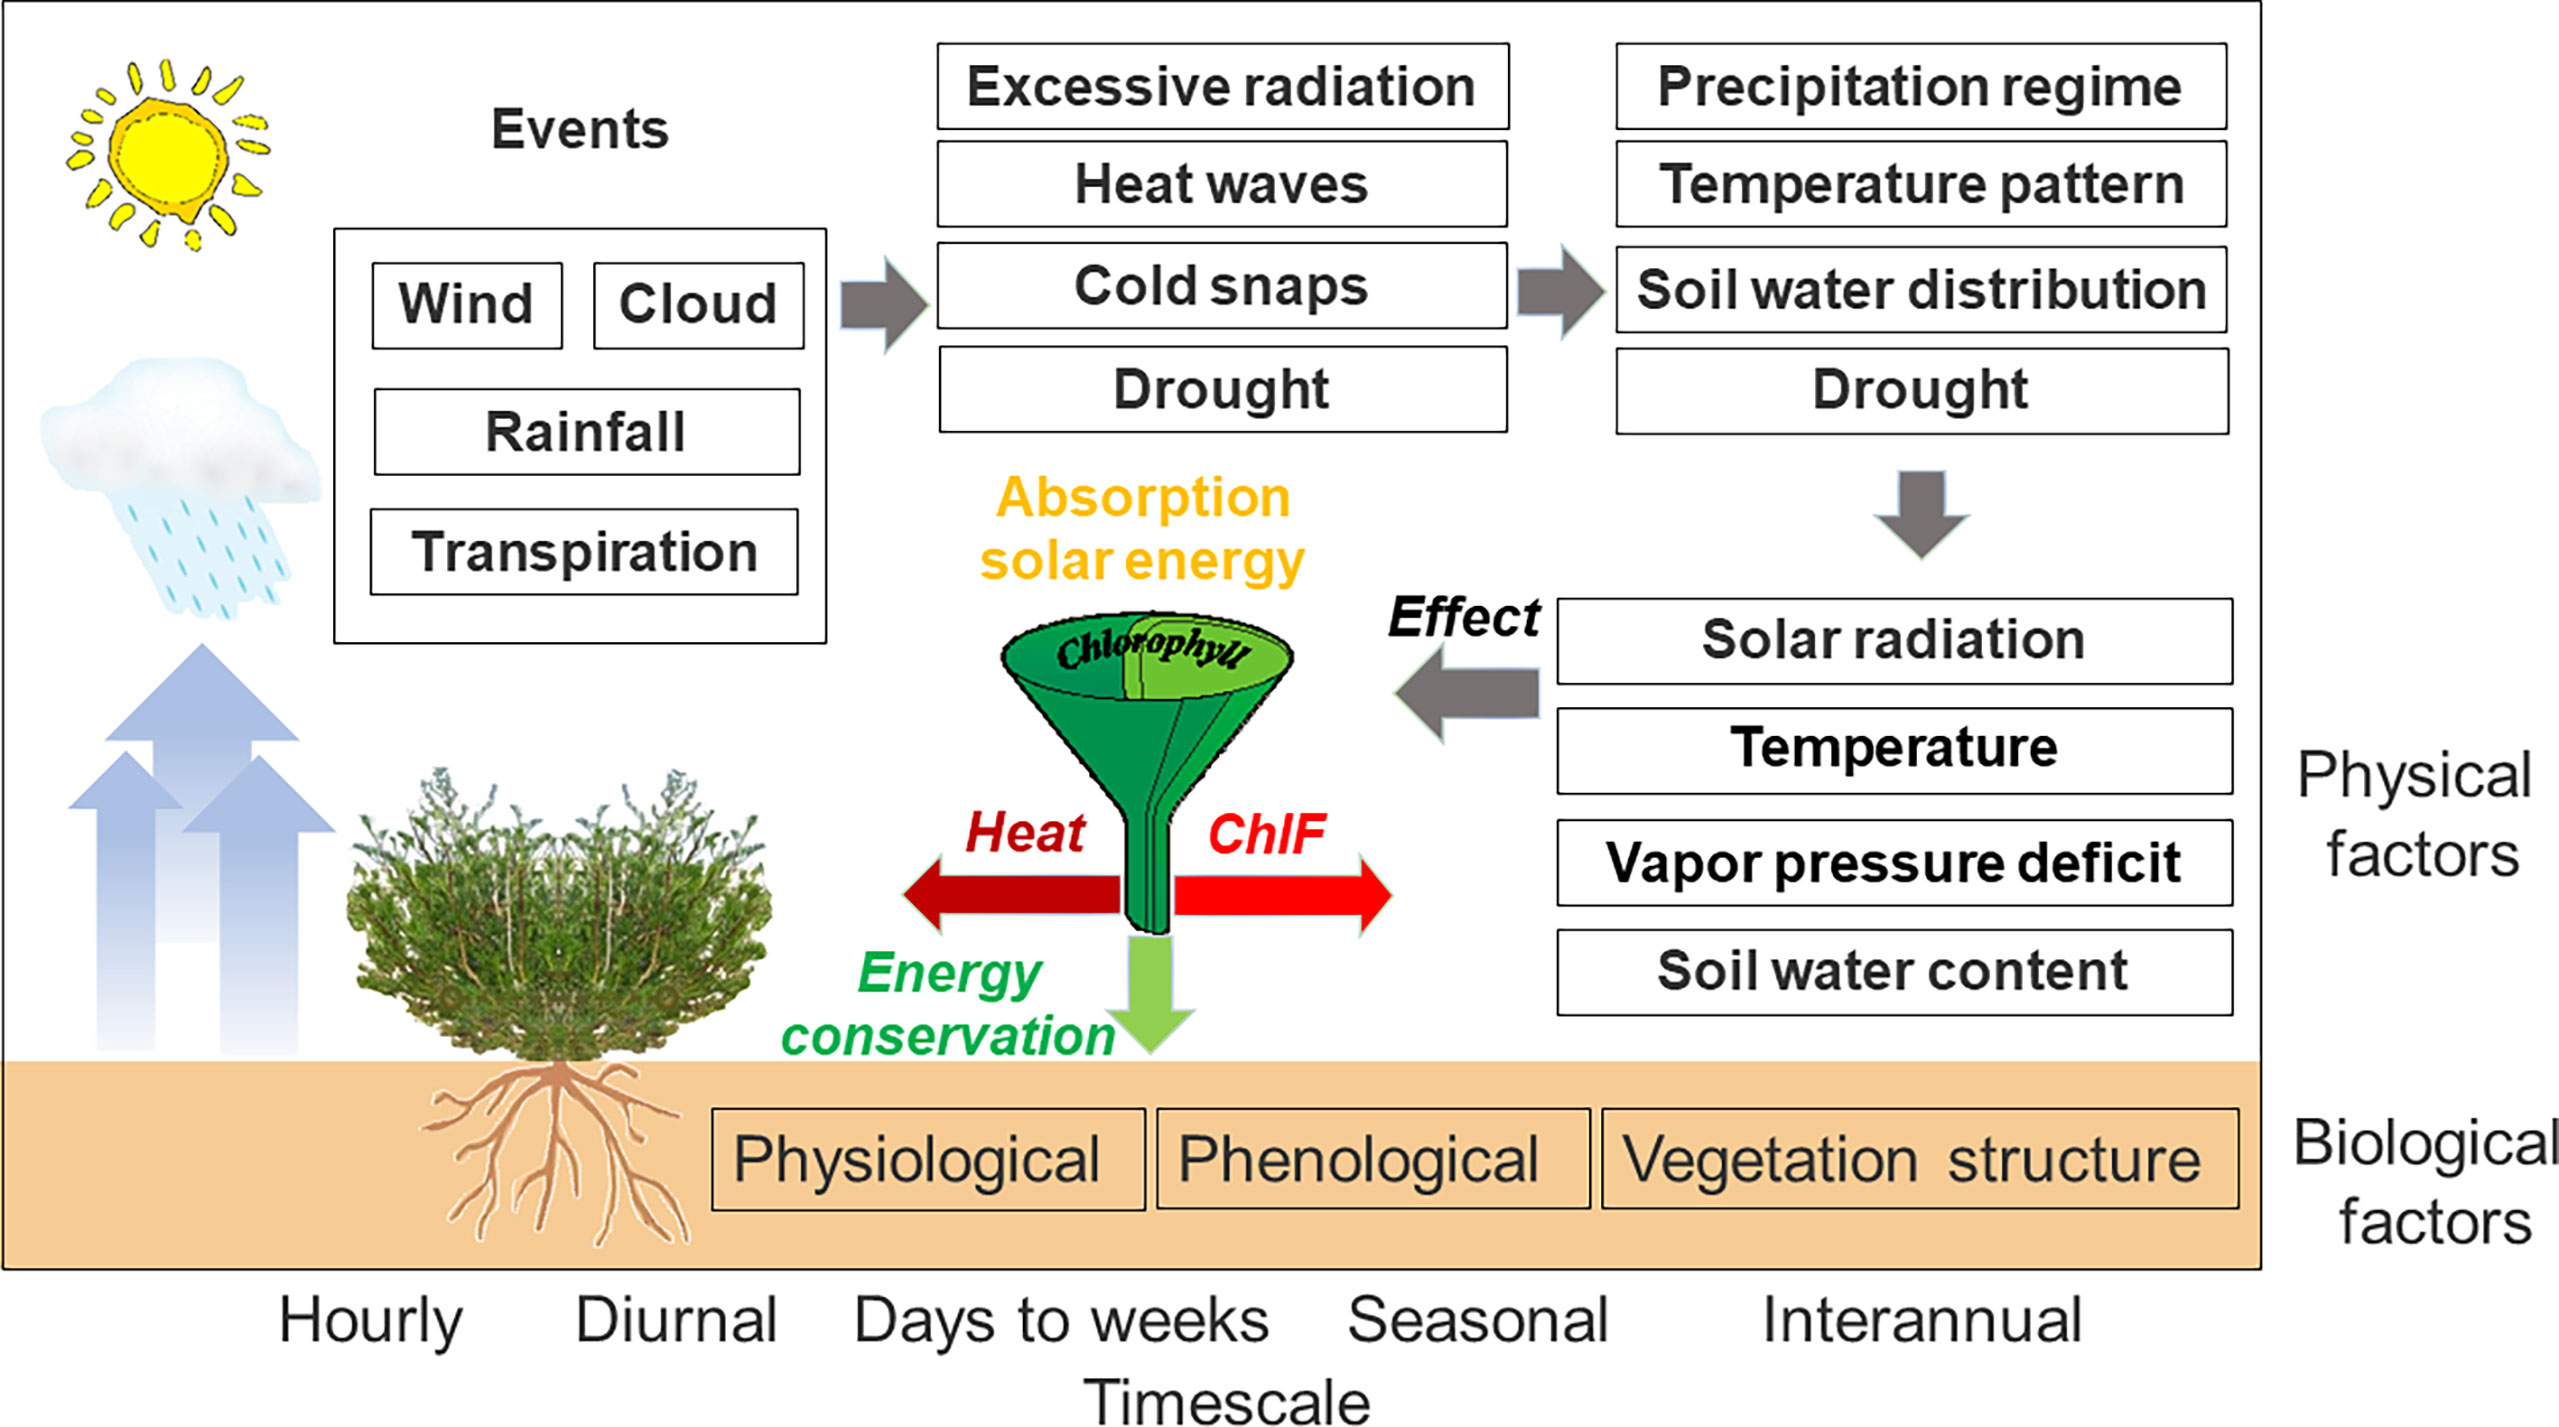
Figure 1 A conceptual description of biophysical factors that drive PSII-energy partitioning over multiple timescales. Drivers of PSII-energy partitioning included in this diagram are by no means comprehensive.
The pulse-amplitude modulation (PAM) technique facilitates the collection of near-continuous, in situ measurements of ChlF. Such measurements provide detailed information concerning the physiological state and performance of PSII in a rapid, non-destructive way (Ogawa et al., 2017; Stefanov et al., 2018). The method provides a direct assessment of the status of the three PSII-energy allocation pathways (Janka et al., 2015; Kalaji et al., 2017; Meacham et al., 2017). In general, interaction between fluctuating environmental and response variables is difficult to assess because of the presence of response delays (time lags) that may naturally differ across timescales. It is usually challenging to detect detailed information regarding time lags in covariances between PSII-energy partitioning and environmental variables by visual inspection of associated timeseries alone (Baldocchi et al., 2001; Zha et al., 2017). Although conventional methods of analysis, such as correlation analysis, can be used to quantify the contribution of environmental factors in controlling PSII-energy partitioning (Maseyk et al., 2019; Samson et al., 2019; Hikosaka, 2021; Sperdouli et al., 2021b), it is generally more difficult to untangle the multi-level interactions that naturally arise in complex systems. Spectral analysis, by means of wavelet analysis, for example, may yield valuable insights as to the temporal dynamics of PSII-energy partitioning and their biophysical forcing (Baldocchi et al., 2001; Qin et al., 2008; Ouyang et al., 2014). Compared to other spectral methods, wavelet analysis can exploit translation, expansion, and other functional operations in carrying out multi-scale analysis of several timeseries (Grinsted et al., 2004; Cazelles et al., 2008). Convergent cross mapping (CCM) is a nonparametric, statistical technique that helps to isolate cause-and-effect relationships in timeseries data (Sugihara et al., 2012; Chang et al., 2017). In contrast to simple linear correlation, CCM provides an improved explanation of nonlinear timeseries data, including detection of feedback, direction of causation, and linkages between dynamically-related variables (Chang et al., 2017). There are only a handful of scientific studies that apply both wavelet analysis and CCM to in situ ChlF-measured characteristics in desert-shrub ecosystems.
Artemisia ordosica is one of the most widespread shrub species in the Mu Us Desert of northwestern China. The species plays an important role in mitigating zones of quicksand and promoting community succession because of its deep rooting systems. The shrub species is particularly tolerant/resistant to being buried in sand for limited periods and to drought (Liu and Zhang, 2018). In this study, we applied continuous wavelet transform (CWT) and wavelet coherence (WTC) analyses on six years (2012–2017) of in situ measurements of ChlF and corresponding environmental variables (i.e., PAR, Ta, VPD, and SWC) sourced at the same site. Convergent cross mapping was subsequently used to infer presence/absence of causality between pairings of the three PSII-energy partitioning pathways across timescales. The aim of the study was to (i) isolate the key controlling variables of PSII-energy partitioning in A. ordosica across multiple timescales, and (ii) evaluate the resilience of PSII in the shrub to harsh desert conditions. We hypothesized that across timescales, PSII-energy partitioning in A. ordosica is affected differently by the prevailing site-environmental conditions.
Materials and methods
Site characteristics
This study was carried out at the Yanchi Desert Ecosystem Research Station (37°53’83’’N, 107°25’46’’E; 1,530 m above mean sea level, amsl), Ningxia Hui Autonomous Region of northwestern China. The study area lies at the ecotone between the arid and semiarid zones of the desert, with A. ordosica (relative cover of 45%), Salix psammophila (20%), and Hedysarum mongolicum (20%) being the more abundant shrub species throughout the area. The prevailing climate is continental monsoon, where rainfall is rare and episodic. The mean annual precipitation (PPT) is 287 mm, mainly falling during the June–September period of each year. The mean annual potential evapotranspiration is about 2,024 mm, nearly an order of magnitude greater than PPT. The mean annual temperature is 8.3°C. All meteorological summaries are based on data from the Yanchi Meteorological Station (1954–2014), about 20 km from the research station.
Long-term ChlF measurements and parameter calculation
Continuous ChlF measurements were acquired in situ during the growing seasons of 2012–2017 with a multi-channel PAM fluorometer (PAM 2000, Walz, Effeltrich, Germany). Five monitoring heads (MONI-head/485) connected to the fluorometer were installed on five different plants. A portion of healthy sun leaves were arranged in each MONI-head leaf clip. The sample branch was tied to an aluminum support inserted in the ground to ensure that the sample leaf clumps would not detach from the leaf clip or from the branch. The fluorometer used modulated blue LED light (450 nm wave peak and 18 nm bandwidth) to measure fluorescence emitted from the sample leaf clumps. The actinic light was based on natural sunlight. Positioning of the clipper heads were adjusted manually to avoid self-shading. The fluorometer measured fluorescence at the same frequency as modulated light (i.e., 5–25 Hz), so fluorescence could be measured across leaf-clump-physiological states, including during daytime conditions when sunlight was strongest. The two basic fluorescence parameters, namely real-time steady and maximal light-adapted fluorescence (Ft and Fm’) were recorded automatically every 30 minutes with modulated light pulses set at 0.9 and 3500 µmol m−2 s−1, respectively. Since measurements of minimal and maximal dark-adapted fluorescence (F0 and Fm) required absence of ambient light, we regarded nighttime Ft and Fm’ as F0 and Fm, respectively.
The maximum quantum yield of PSII photochemistry (Fv/Fm), photochemical efficiency (ΦPSII), and regulatory and non-regulatory thermal dissipation (ФNPQ and ФNO, respectively) were calculated as follows:
Raw ChlF-data were processed using the batch-file feature of the WinControl-3 software. Half-hourly values of Fm’< 100 (non-dimensional) were considered atypical and removed from the dataset.
Environmental measurements
Incident photosynthetically active radiation (PAR) and air temperature (Ta) were measured simultaneously with the fluorometer. Relative humidity (RH) was measured with a thermohygrometer (HMP155A, Vaisala, Vantaa, Finland) mounted on a 6-m tall, eddy-covariance flux tower situated approximately 100 m from the ChlF-measurement area. Vapor pressure deficit (VPD) was derived from Ta and RH as discussed in Wilhelm et al. (1977), i.e.,
Replicates of soil water content (SWC) were measured with moisture sensors placed at 30-cm depths (ECH2O-5TE, Decagon Devices, Pullman, WA, USA). PPT was quantified using a tipping-bucket raingauge installed 50 m from the ChlF-measurement area (TE525WS, Campbell Scientific Inc., Logan, UT, USA). All micrometeorological variables were averaged or summed every 30 minutes and stored on a datalogger.
Data analysis
We subsequently analyzed the field data by means of continuous wavelet transform (CWT), cross-wavelet transform (XWT), wavelet coherence (WTC), and CCM (addressed below). Detailed reviews of wavelet analysis can be found in Grinsted et al. (2004) and Vargas et al. (2010). CWT was used to distinguish the timescales (hourly, daily, and so on) at which variability in timeseries (i.e., independent vs. dependent variables) is expressed. The CWT of a discrete timeseries (i.e., xn, with n = 1,…,N) recorded at a uniform timestep, δt, is defined as the convolution integral of xn, with a scaled and normalized basis wavelet, ψ0(η). We write
where denotes the complex conjugate, and s is the set of wavelet scales applied (Cazelles et al., 2008). In this study, we chose a Morlet wavelet to serve as wavelet basis,
because it balances localization of frequency and time elapsed (Ouyang et al., 2014). From eqn. (6), we can define the wavelet power of xn (i.e., Sn) as
Similarly, to quantify the spectral relationship between two timeseries, i.e., xn (representative of PAR, Ta, VPD, or SWC) and yn (ΦPSII, ΦNPQ, and ΦNO), we defined the cross-wavelet power spectrum (Cn), phase angle spectrum (An), and WTC spectrum (), respectively, as
where S denotes a smoothing operation in both time and scale, which provides the minimal amount of smoothing necessary to include two independent points in both dimensions; denotes XWT, and and are the real and imaginary parts of (Grinsted et al., 2004). The global cross-wavelet power spectrum (i.e., the mean of Cn over time) quantifies the magnitude of covariance that occurs between two timeseries across the frequency spectrum. Phase angles in An can indicate the time-frequency domain in Cn or . Arrows pointing right or left denote two timeseries that vary either in-phase or anti-phase. If two timeseries variables, i.e., xn and yn, are positively correlated, phase arrows pointing upward indicate xn lags yn by a 1/4 period or leading yn by a 3/4 period, while phase arrows pointing downward indicate xn leads yn by a 1/4 period or lags yn by a 3/4 period. In this study, the interpretation of phase arrows related to the relationship between ΦPSII and PAR should be seen as having an opposite response (i.e., arrows pointing left means that the variables are in-phase). All timeseries were normalized to have means of zero (with zeroes in data gaps) and unit variances. The statistical significance of wavelet spectra between two timeseries at a 5% critical significance level was evaluated within the cone of influence (COI), as per Vargas et al. (2010). Because of incomplete time-locality across frequencies, the wavelet transforms resulted in edge effects or artefacts (e.g., see below). Rather than use 10,000 Monte Carlo simulations as was done by the authors, we implemented 1,000 simulations. We performed wavelet analysis in MATLAB (R2018b, The MathWorks, USA) with codes acquired from Grinsted et al. (2004) and Ng and Chan (2012).
To complement the information provided by wavelet analysis, we subsequently used CCM to determine the direction and strength of causality between pairings of the three PSII-energy partitioning. The procedure is based on open-source scripts written in R. The scripts consisted of multispatialCCM v. 1.0 (Sugihara et al., 2012; Chang et al., 2017) and pdc v. 1.0.3 (via subroutine entropyHeuristics). Input requirements to run multispatialCCM were the timeseries embedded dimensions (E) and time delay (τ) determined with pdc. For hourly data, we randomly extracted 40 individual days from each phenological period over the six-year study period, as 960 consecutive records. Calculation of the standard deviation was based on 1,000 bootstrapping iterations.
Results
Seasonal dynamics of environmental variables and ChlF parameters
Figure 2 reveals obvious seasonal patterns in PAR, Ta, VPD, SWC, and PPT across the 2012–2017 study period. Daily mean PAR had a maximum of about 762 µmol m−2 s−1 in summer (Figure 2A), whereas daily mean Ta ranged from about -9.9°C in winter to 27.2°C in summer. Daily mean VPD varied from near-zero to 2.1 kPa in summer (Figure 2C). Seasonally, SWC exhibited clear pulse variations and wetting-to-drying cycles with a lower and upper limit of 0.05 to 0.17 m3 m−3, increasing abruptly in response to intermittent rainfall. Distribution of PPT was uneven, mainly concentrated in summer, ranging from 278.4–362.7 mm annually. SWC decreased in winter and sharply increased during the frost-thaw period in early spring (Figure 2D).
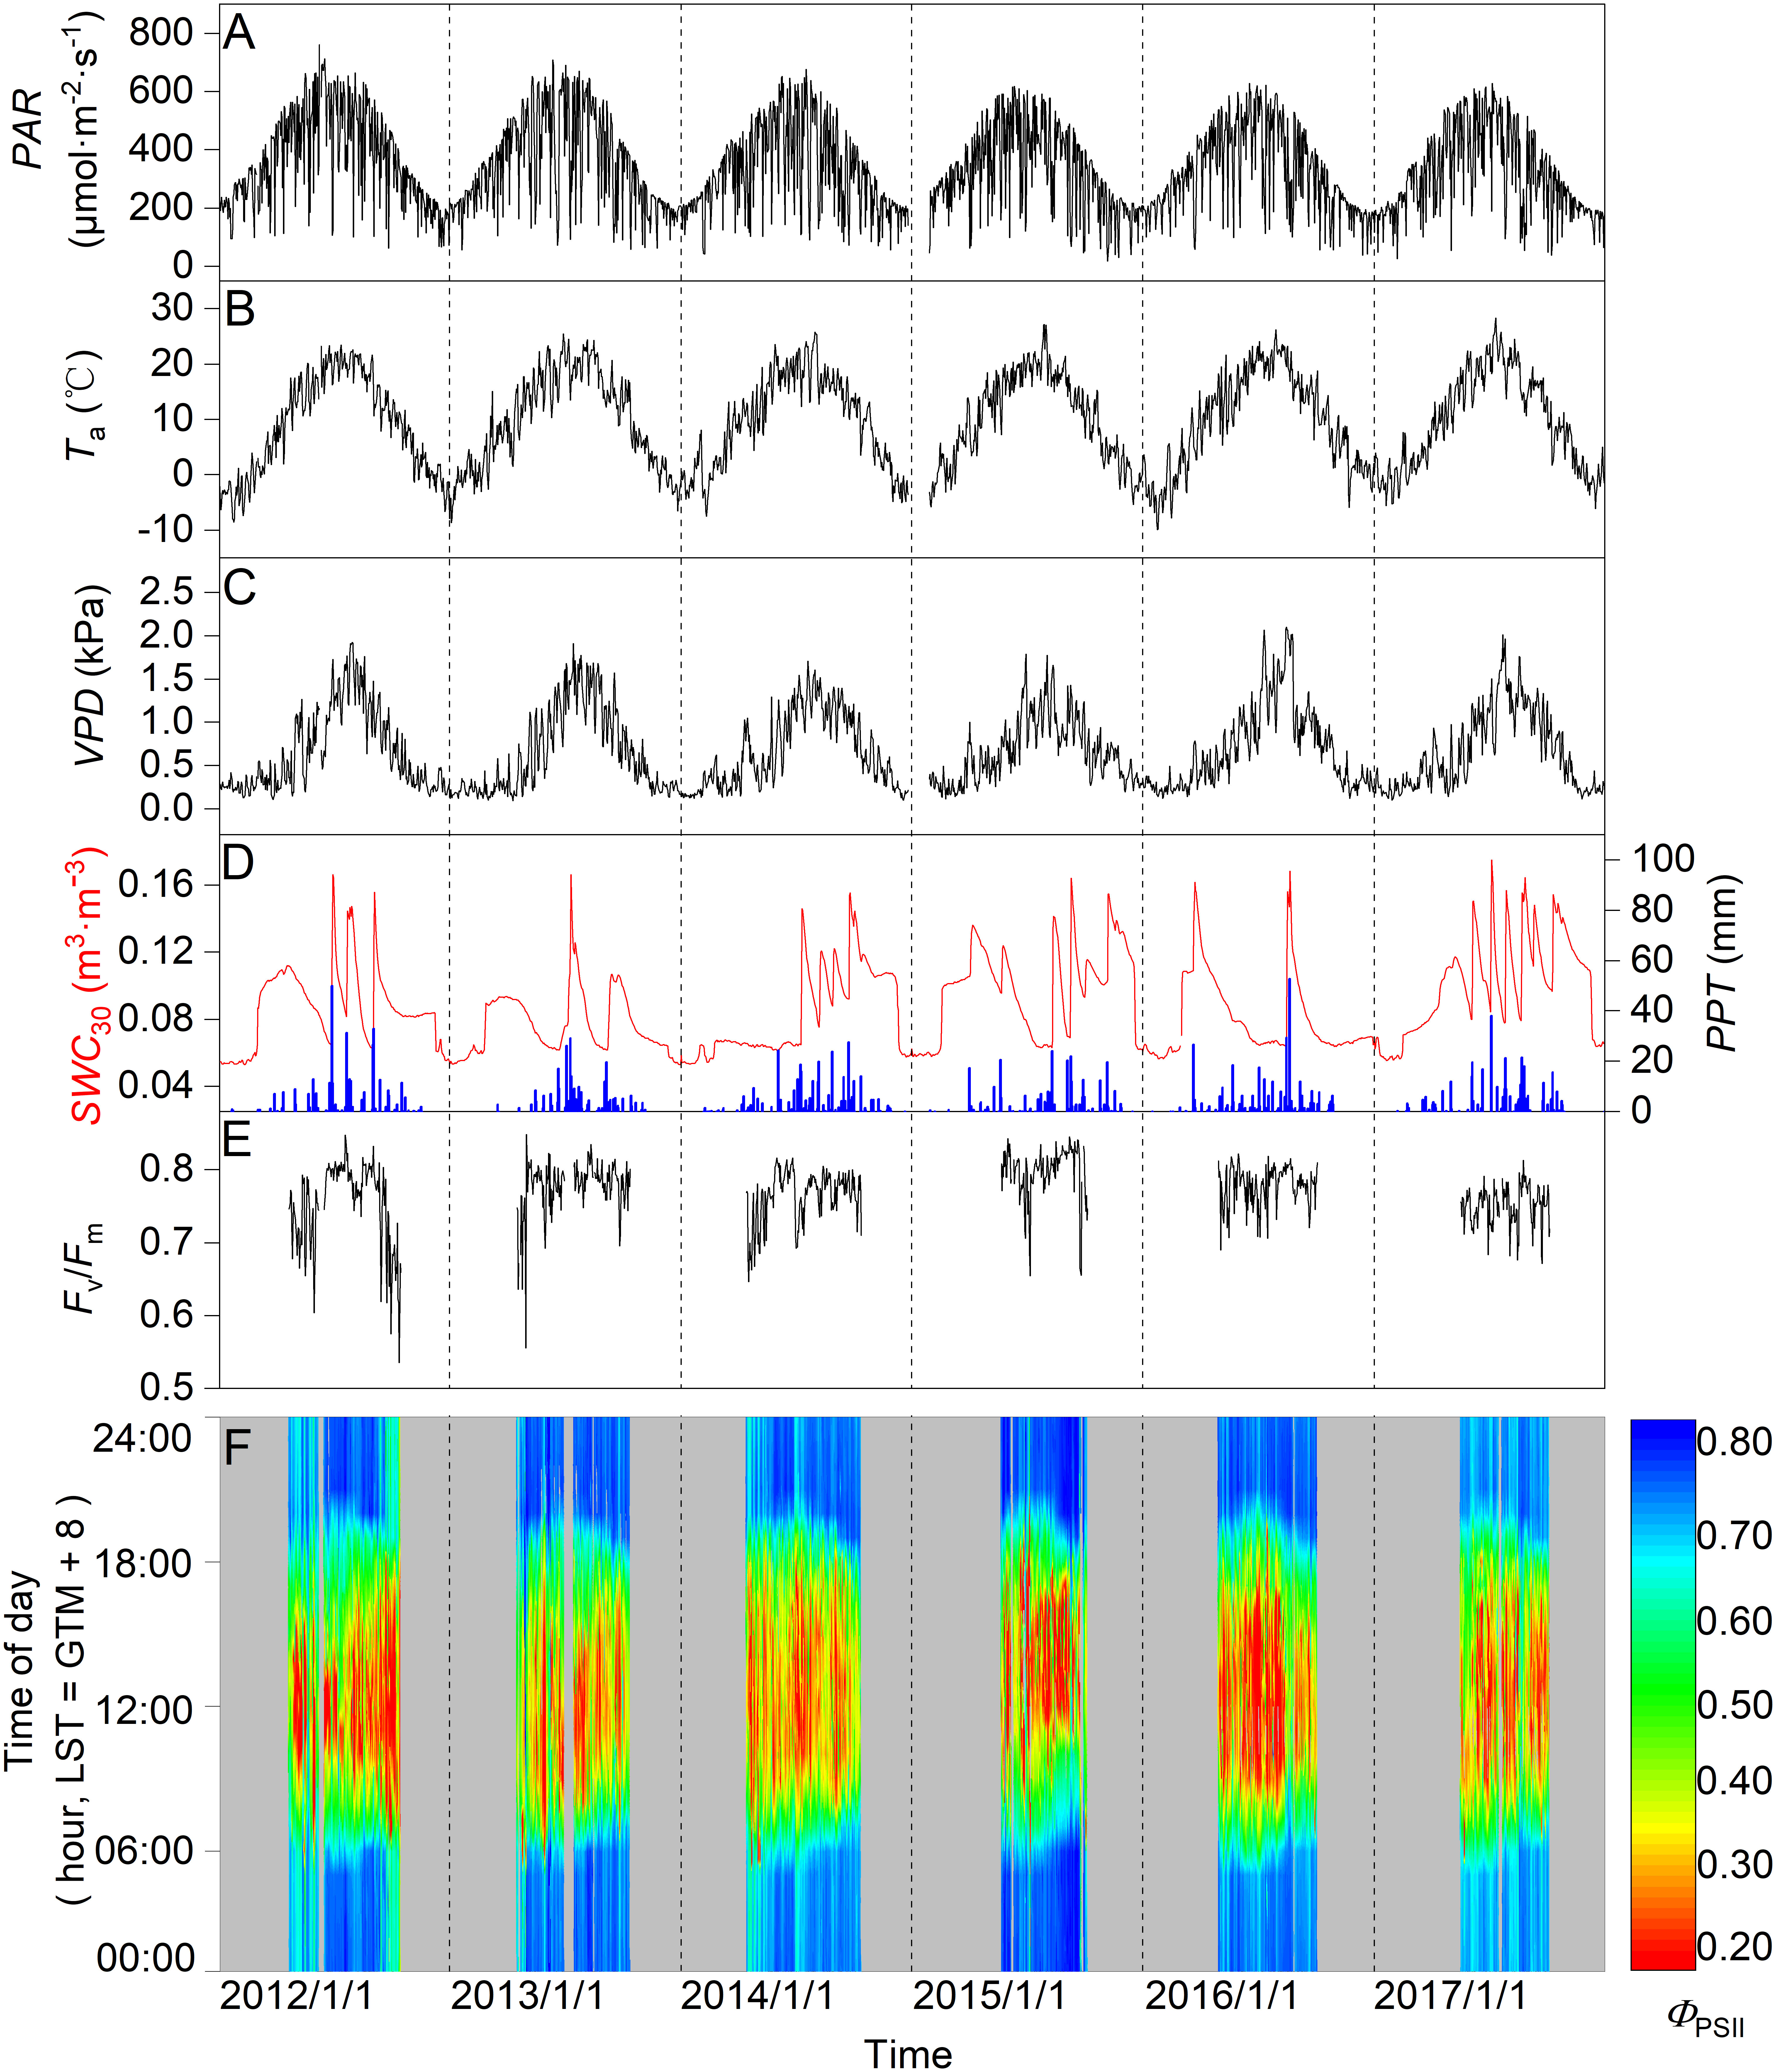
Figure 2 Seasonal variation in daily mean (A) photosynthetically active radiation (PAR), (B) air temperature (Ta), (C) vapor pressure deficit (VPD), (D) soil water content at a 0.3-m depth (SWC), and daily (D) total precipitation (PPT; column), (E) maximal quantum yield of PSII photochemistry (Fv/Fm), and (F) photochemical efficiency (ΦPSII) for the 2012–2017 study period.
Seasonal changes in Fv/Fm stabilized at around 0.77, with extremes (min-max) of 0.53 and 0.85, respectively (Figure 2E). Seasonally, the mode of diurnal ΦPSII differed during the six-year period, varying between 0.10–0.88 (Figure 2F). Depressions in nighttime Fv/Fm and ΦPSII were observed across some years, e.g., 2012, 2013, and 2015, with mid-season drought when SWC< 0.10 m3 m−3 (Figures 2D–F).
Diurnal variability in environmental variables and PSII-energy partitioning
Monthly mean variations in PAR, Ta, and VPD had obvious diurnal patterns, peaking at about 13:00 [Beijing Standard Time (BST) = Greenwich Mean Time (GMT) + 8 hours] for PAR and 16:00 for both Ta and VPD (Figures 3A–C). During the June–August period of each year, Ta and VPD attained their highest values relative to the other times of the year (Figures 3B, C). Diurnally, ΦPSII exhibited an opposite trend to that observed in PAR, producing a U-shaped curve, with its lowest value occurring at around 13:00 (Figures 3A, D). In contrast, temporal patterns in ΦNPQ tended to match those observed in PAR, with its highest value occurring when PAR reached its maximum (Figures 3A, E). Diurnal patterns in ΦNO were like those in ΦNPQ, having reached a plateau from 10:00–15:00 (Figures 3E, F). Daytime ΦPSII and ΦNO were generally lowest during the June–August period of the year, with ΦNPQ reaching its highest value during that time (Figures 3D–F).
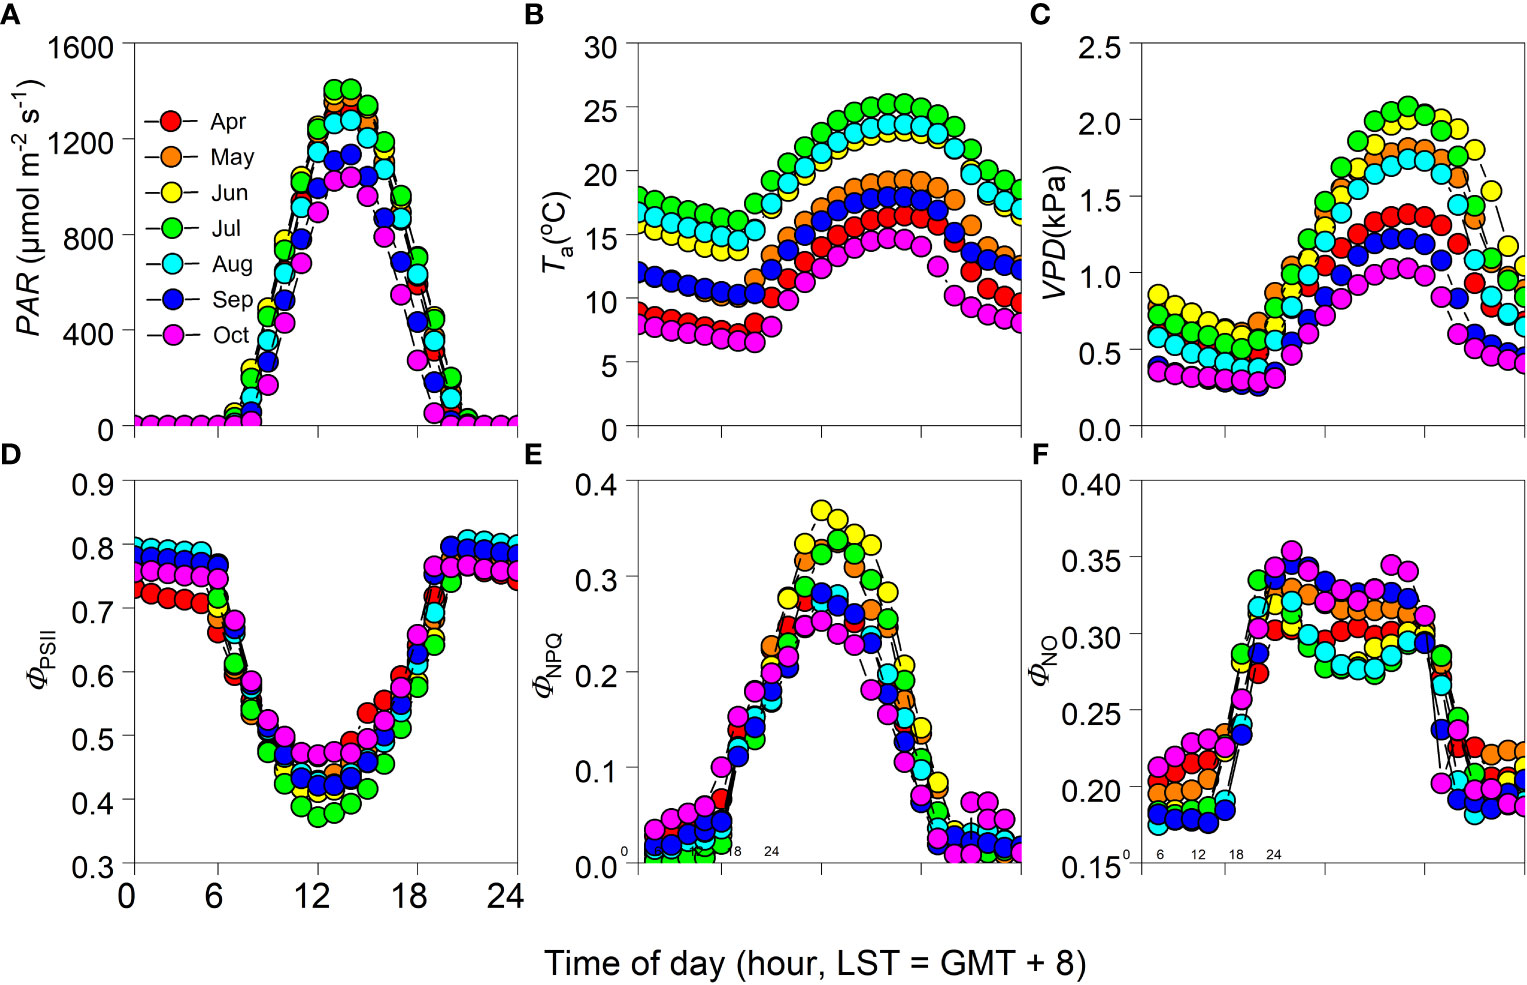
Figure 3 Monthly mean diurnal cycle of (A) photosynthetically active radiation (PAR), (B) air temperature (Ta), (C) vapor pressure deficit (VPD), (D) photochemical efficiency (ΦPSII), and (E) regulatory and (F) non-regulatory thermal dissipation (ΦNPQ and ΦNO, respectively) during the growing seasons of 2012–2017 (i.e., April–October period of each year).
Periodicity of environmental variables and PSII-energy partitioning
According to the global wavelet power spectra, as expected, all timeseries showed timescale characteristics of periodicity, with a peak in power spectra corresponding with timescales of one day (except SWC) and 365 days (Figure 4). Meanwhile, PAR, Ta, and ΦPSII displayed a level of periodicity at sub-daily timescales, with associated power spectra being lowest. All timeseries oscillated strongly at intermediate timescales (i.e., days to weeks; Figure 4). Consistent with peaks in the global power spectra, CWT revealed partial characteristics across the time-frequency domain (Figure S1).
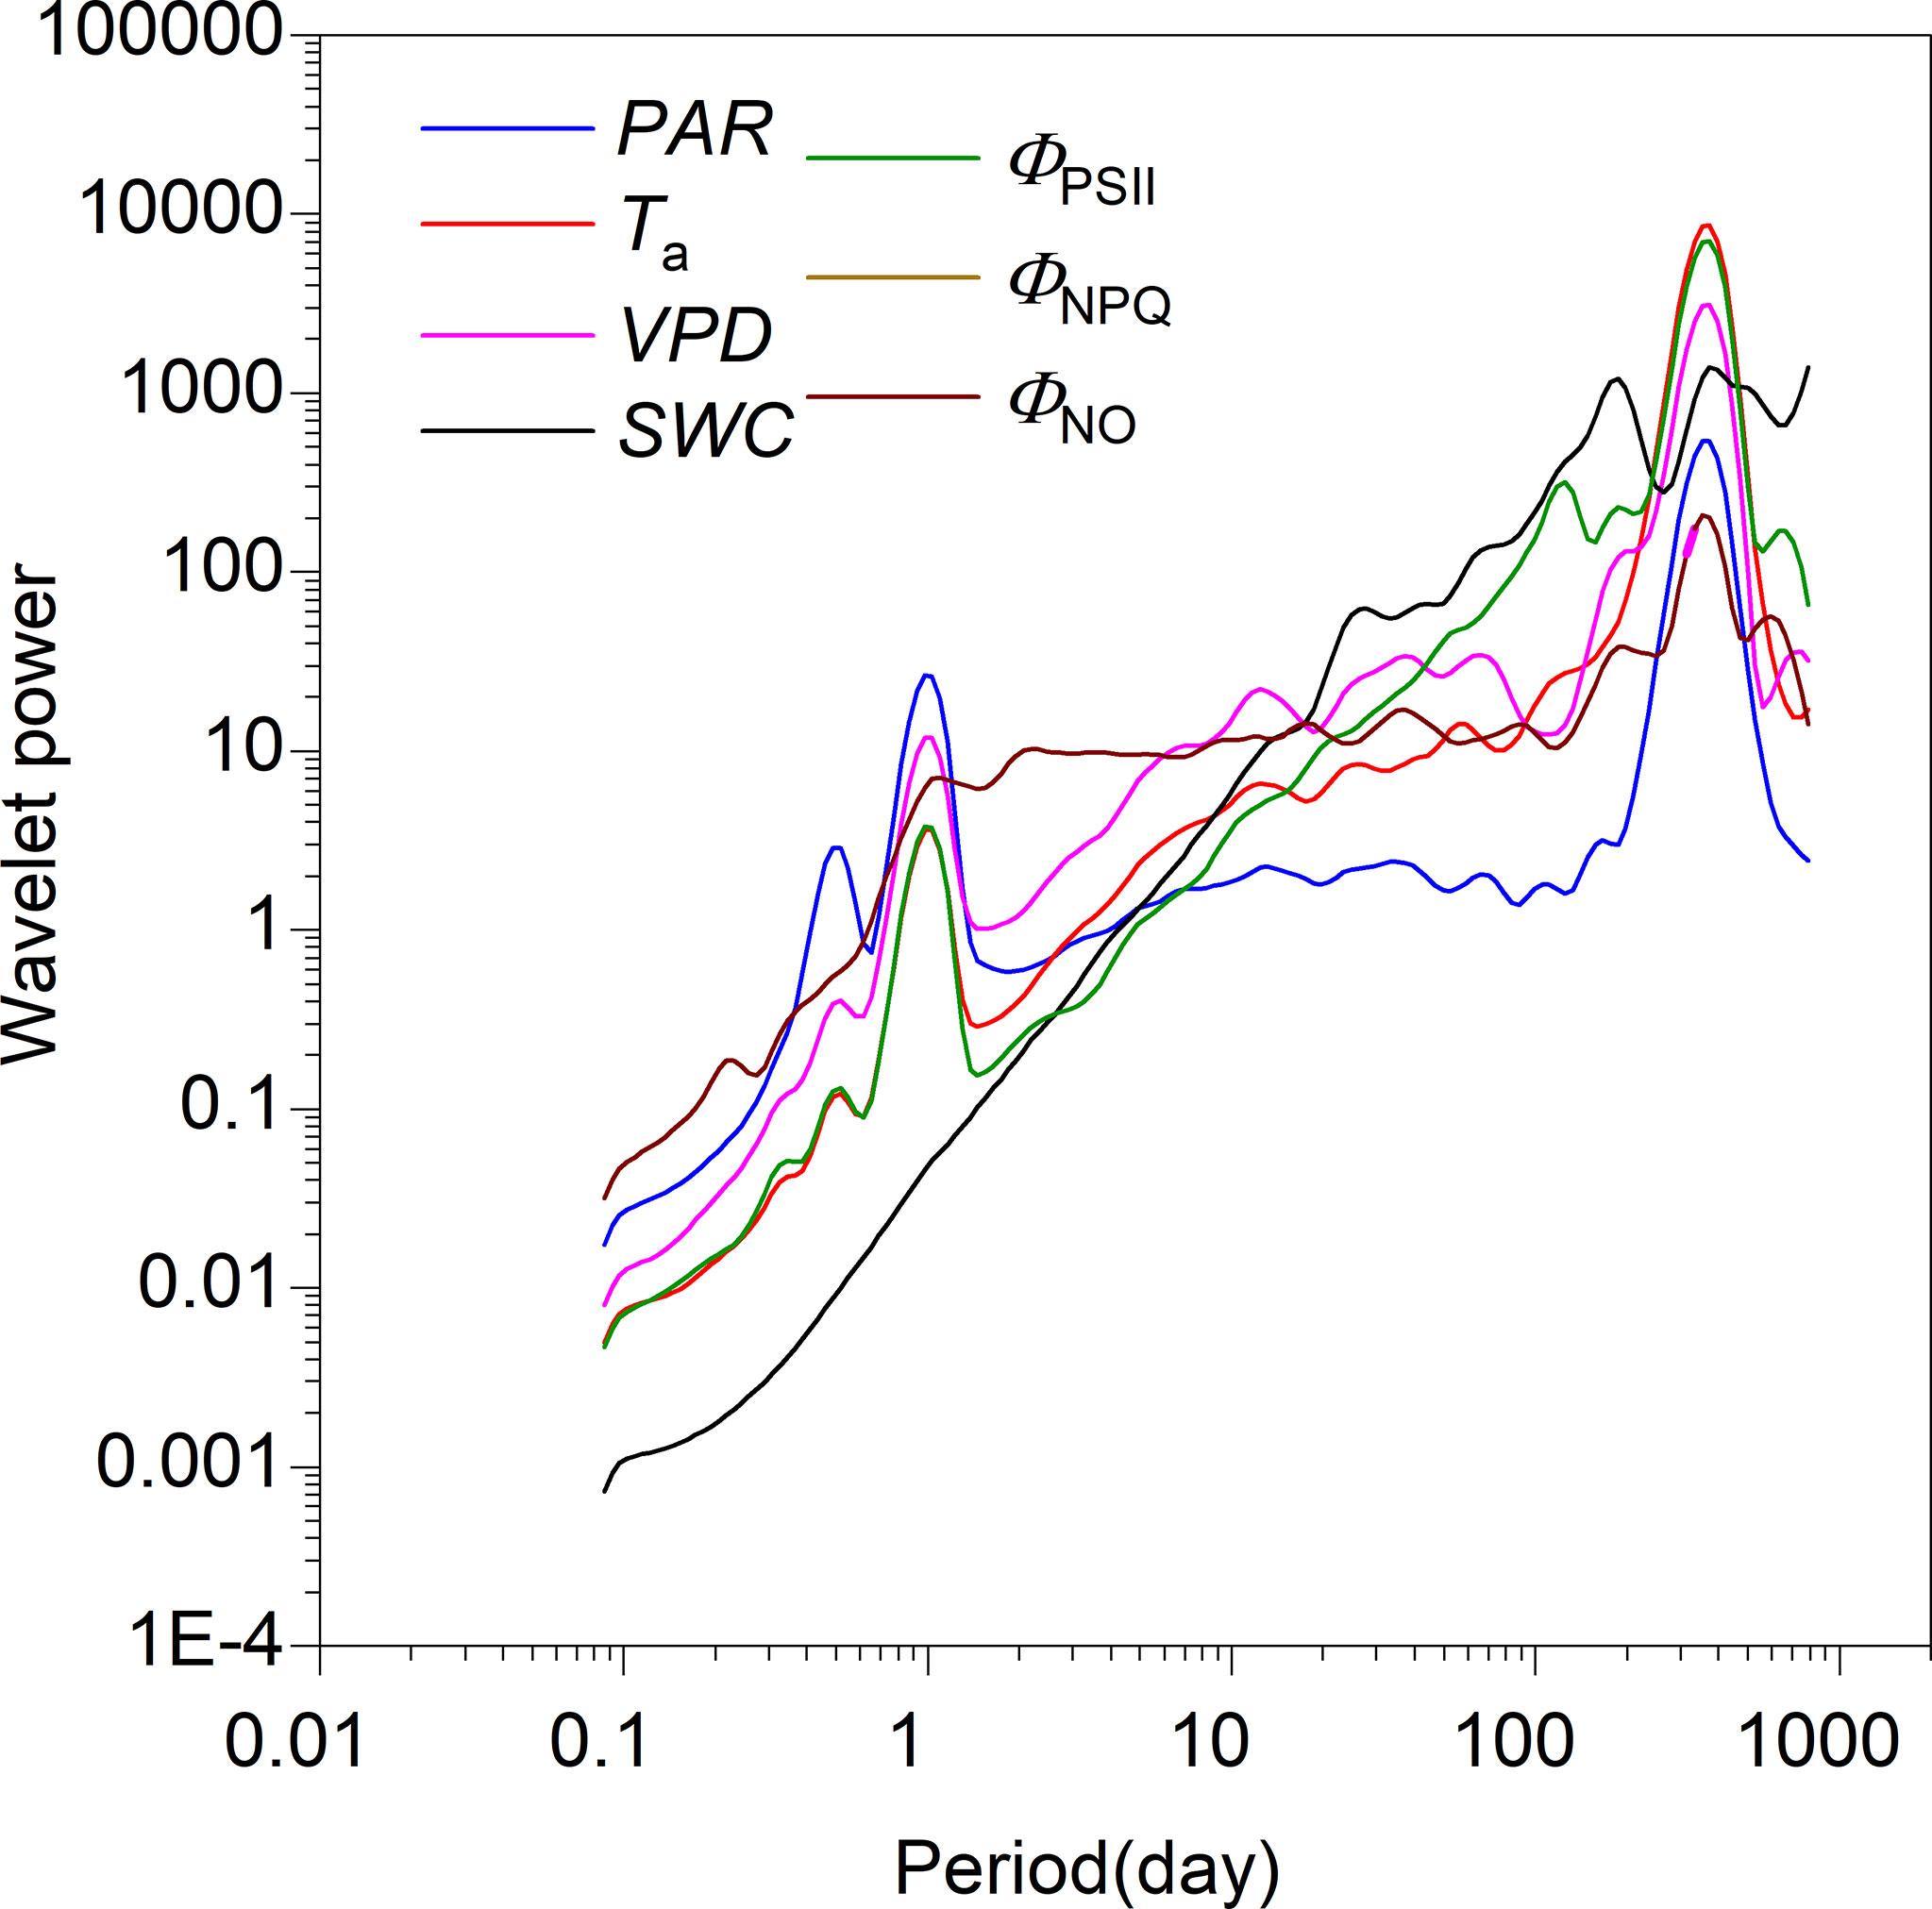
Figure 4 Global wavelet power spectra for photosynthetically active radiation (PAR), air temperature (Ta), vapor pressure deficit (VPD), soil water content at a 0.3-m depth (SWC), photochemical efficiency (ΦPSII), and regulatory and non-regulatory thermal dissipation (ΦNPQ and ΦNO, respectively).
Correlation at diurnal timescales
Significant wavelet coherence (i.e., WTC) was observed between PSII-energy partitioning and environmental factors at the diurnal scale throughout the growing seasons (Figures 5–7). Diurnal variations in ΦPSII were anti-phase with variations in PAR (i.e., arrows pointing left; Figure 5A). For example, the phase angle between ΦPSII and PAR was -11.28 ± 3.43° (mean ± standard deviation), with ΦPSII lagging PAR by 0.75 ± 0.23 h (Figure 5A; Table 1). For the same environmental variables, the time lags for the three PSII-energy partitioning pathways were roughly the same. The time lags in PAR were the shortest, about 40 minutes, followed by those of Ta and VPD at about 3.5 and 4 hours, respectively. The time lags in SWC were the longest at about 12 hours (Figure 8A).
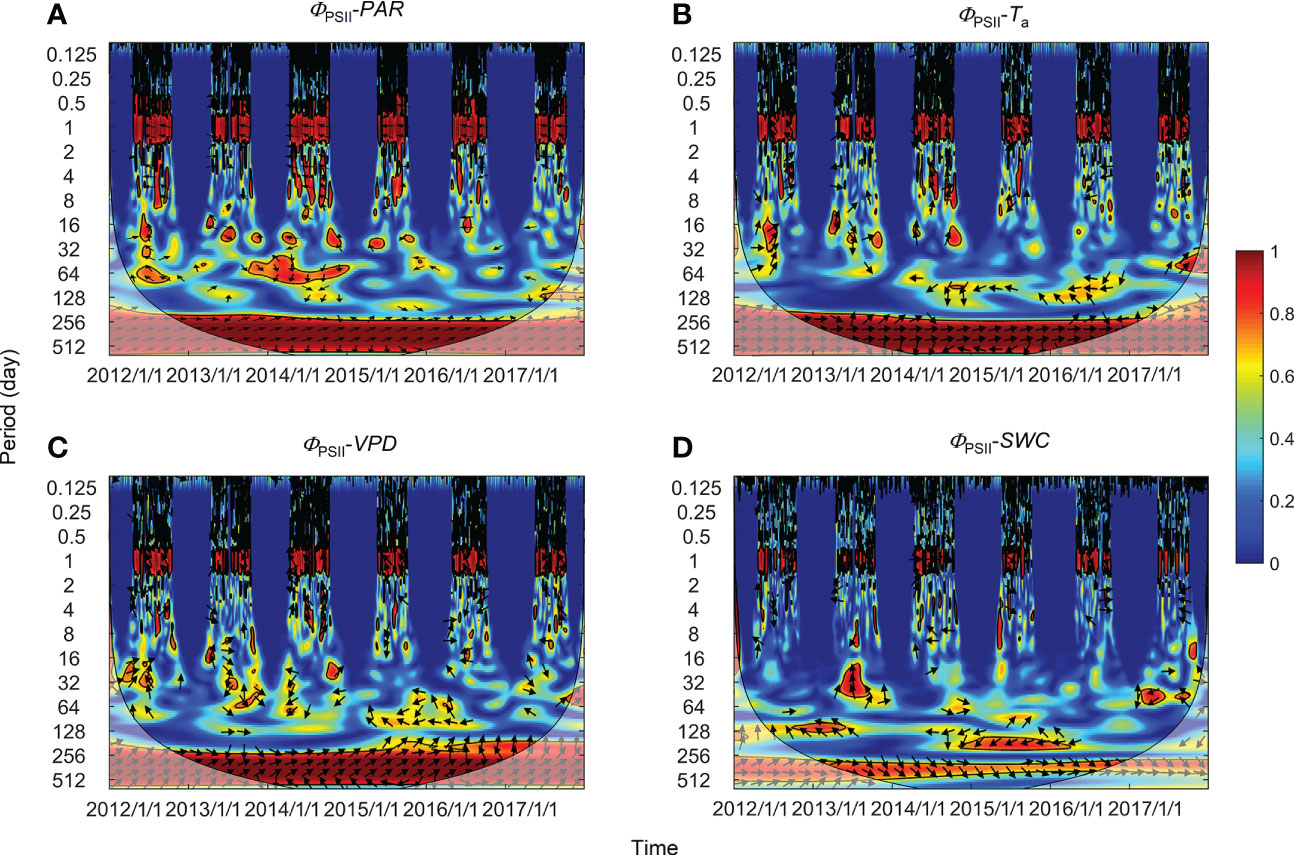
Figure 5 Wavelet coherence between photochemical efficiency (ΦPSII) and (A) photosynthetically active radiation (PAR), (B) air temperature (Ta), (C) vapor pressure deficit (VPD), and (D) soil water content at a 0.3-m depth (SWC). The phase difference is shown by arrows. Arrows pointing upward indicate environmental factors leading ΦPSII by 90°, whereas arrows pointing downward indicate environmental factors leading ΦPSII by 270°. Arrows pointing left (or right) indicate environmental factors and ΦPSII vary in-phase (or anti-phase). Black contour lines represent the 0.05 critical significance level. The thin arced lines denote the cone of influence (COI) that delimits the region not affected by edge artefacts.
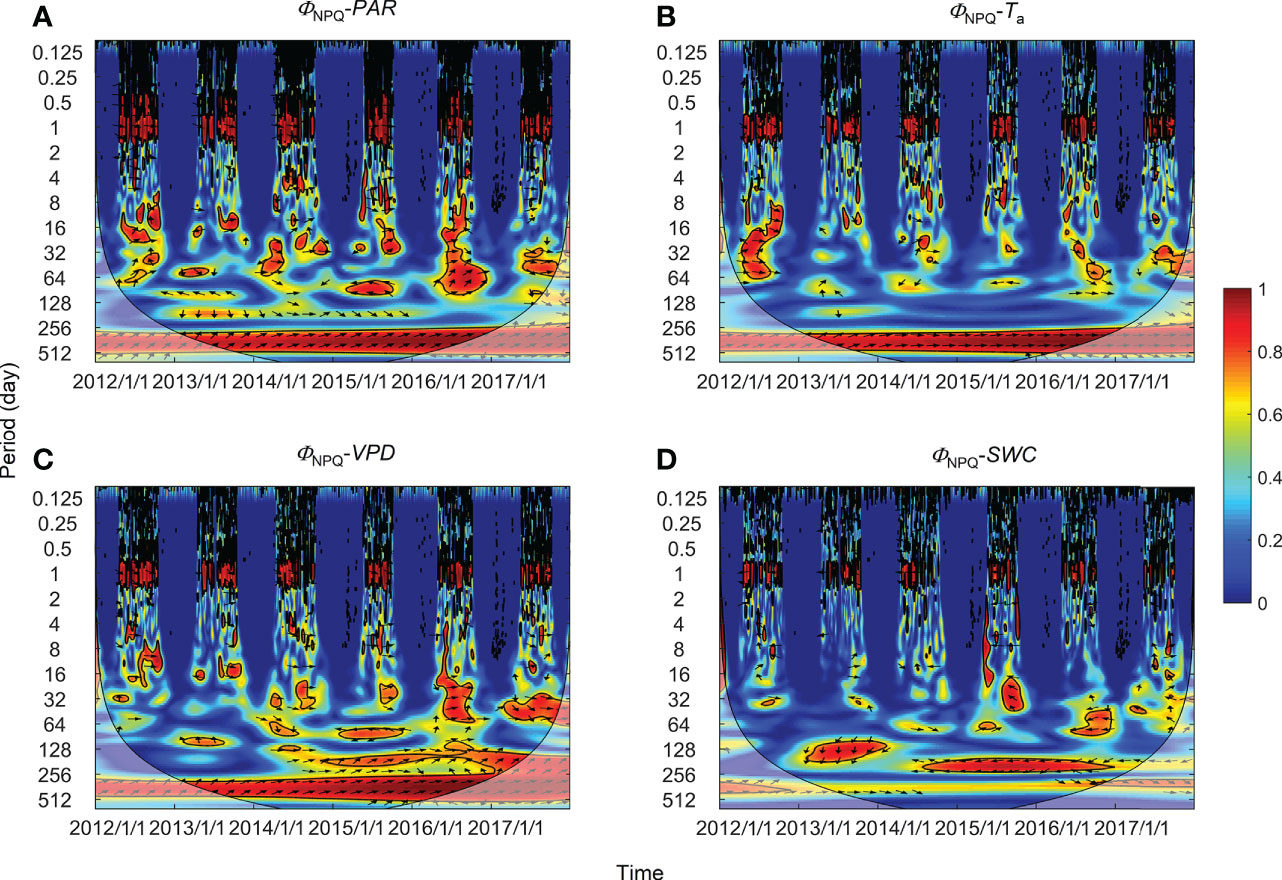
Figure 6 Wavelet coherence between non-regulatory thermal dissipation (ΦNO) and (A) photosynthetically active radiation (PAR), (B) air temperature (Ta), (C) vapor pressure deficit (VPD), and (D) soil water content at a 0.3-m depth (SWC). The phase difference is shown by arrows. Arrows pointing upward indicate environmental factors leading ΦNPQ by 90°, whereas arrows pointing downward indicate environmental factors leading ΦNPQ by 270°. Arrows pointing left (or right) indicate environmental factors and ΦNPQ vary in-phase (or anti-phase). Black contour lines represent the 0.05 critical significance level. The thin arced lines denote the cone of influence (COI) that delimits the region not affected by edge artefacts.

Table 1 Time lags between PSII-energy partitioning along the three pathways and environmental factors on a daily timescale [i.e., photosynthetically active radiation (PAR), air temperature (Ta), vapor pressure deficit (VPD), and soil water content at a 0.3-m depth (SWC)].
Correlation at intermediate and annual timescales
High global wavelet power was found between the PSII-energy partitioning pathways and environmental factors at periods between 10–100 days (see Figure S1). Intermittent areas of statistically significant WTC were observed at timescales between 16–128 days throughout the growing seasons (Figures 5–7). For instance, bands and hotspots in WTC were found in pairings of ΦPSII-to-PAR, ΦNO-to-PAR, and ΦNO-to-VPD at about 64 days over the 2015 growing season (Figures 5, 6). Both PAR and VPD showed strong WTC with their pairings with ΦNPQ at 64–128-day intervals during the 2016 growing season (Figure 7).
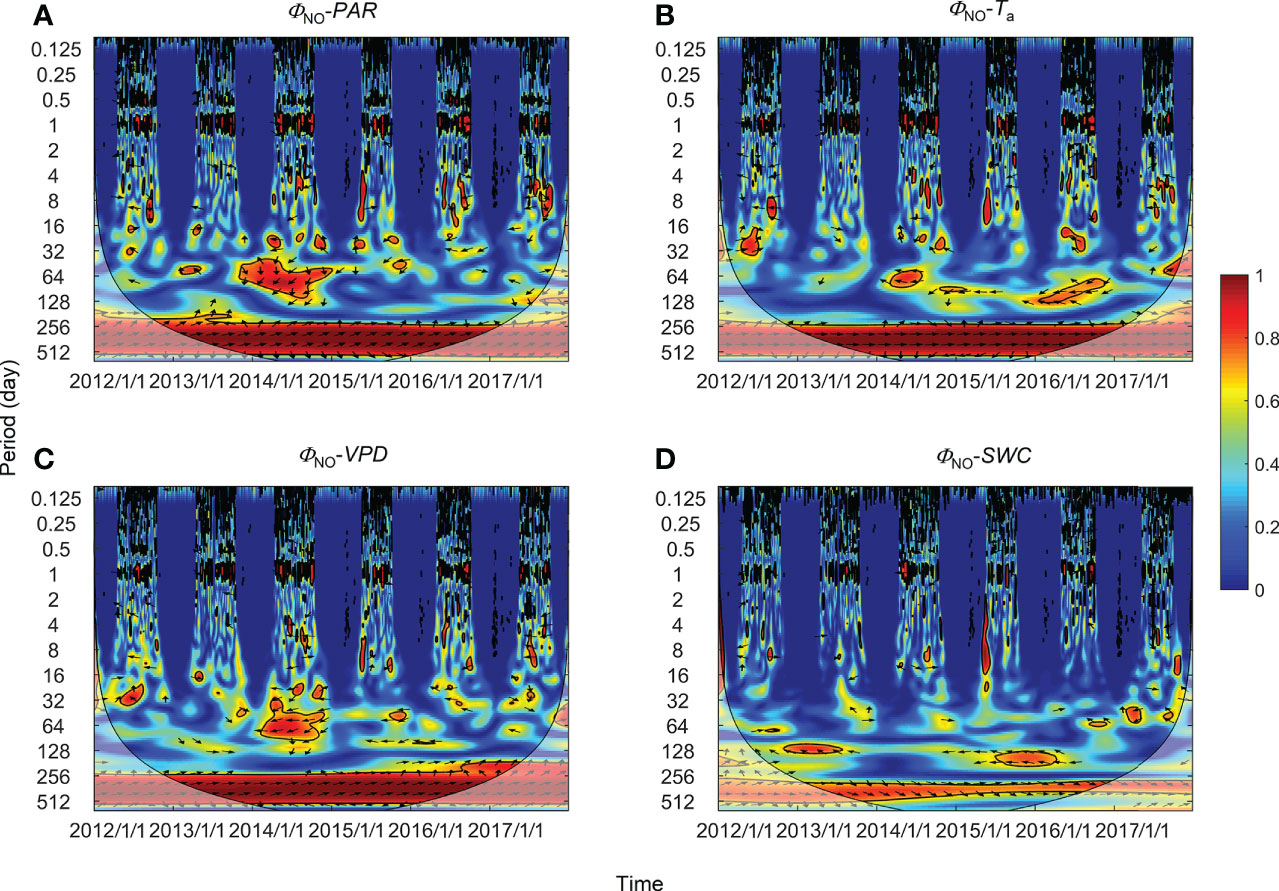
Figure 7 Wavelet coherence between regulatory thermal dissipation (ΦNPQ) and (A) photosynthetically active radiation (PAR), (B) air temperature (Ta), (C) vapor pressure deficit (VPD), and (D) soil water content at a 0.3-m depth (SWC). The phase difference is shown by arrows. Arrows pointing upward indicate environmental factors leading ΦNPQ by 90°, whereas arrows pointing downward indicate environmental factors leading ΦNPQ by 270°. Arrows pointing left (or right) indicate environmental factors and ΦNPQ vary in-phase (or anti-phase). Black contour lines represent the 0.05 critical significance level. The thin arced lines denote the cone of influence (COI) that delimits the region not affected by edge artefacts.
In comparison with diurnal timescales, the time lags between individual PSII-energy partitioning and environmental variables showed some level of discrepancy at intermediate timescales (Table 2). For PAR, time lag in ΦNPQ was significantly shorter than the time lags for both ΦNPQ and ΦNO (i.e., 8.23 vs. > 20 days), whereas for Ta, the time lags in ΦNO and ΦPSII were shorter than the time lag in ΦNPQ, i.e., 3.72 and 5.89 days, respectively, vs. 30.51 days. Again, in terms of VPD, the time lags in ΦNPQ and ΦPSII were shorter than the time lag in ΦNO, giving 3.01 and 8.67 days, respectively, vs. 25.29 days. The time lags for SWC were moderate, ranging between 9.43 and 20.18 days (Figure 8B).

Table 2 Time lags between PSII-energy partitioning pathways and environmental factors on a monthly timescale [i.e., photosynthetically active radiation (PAR), air temperature (Ta), vapor pressure deficit (VPD), and soil water content at a 0.3-m depth (SWC)].
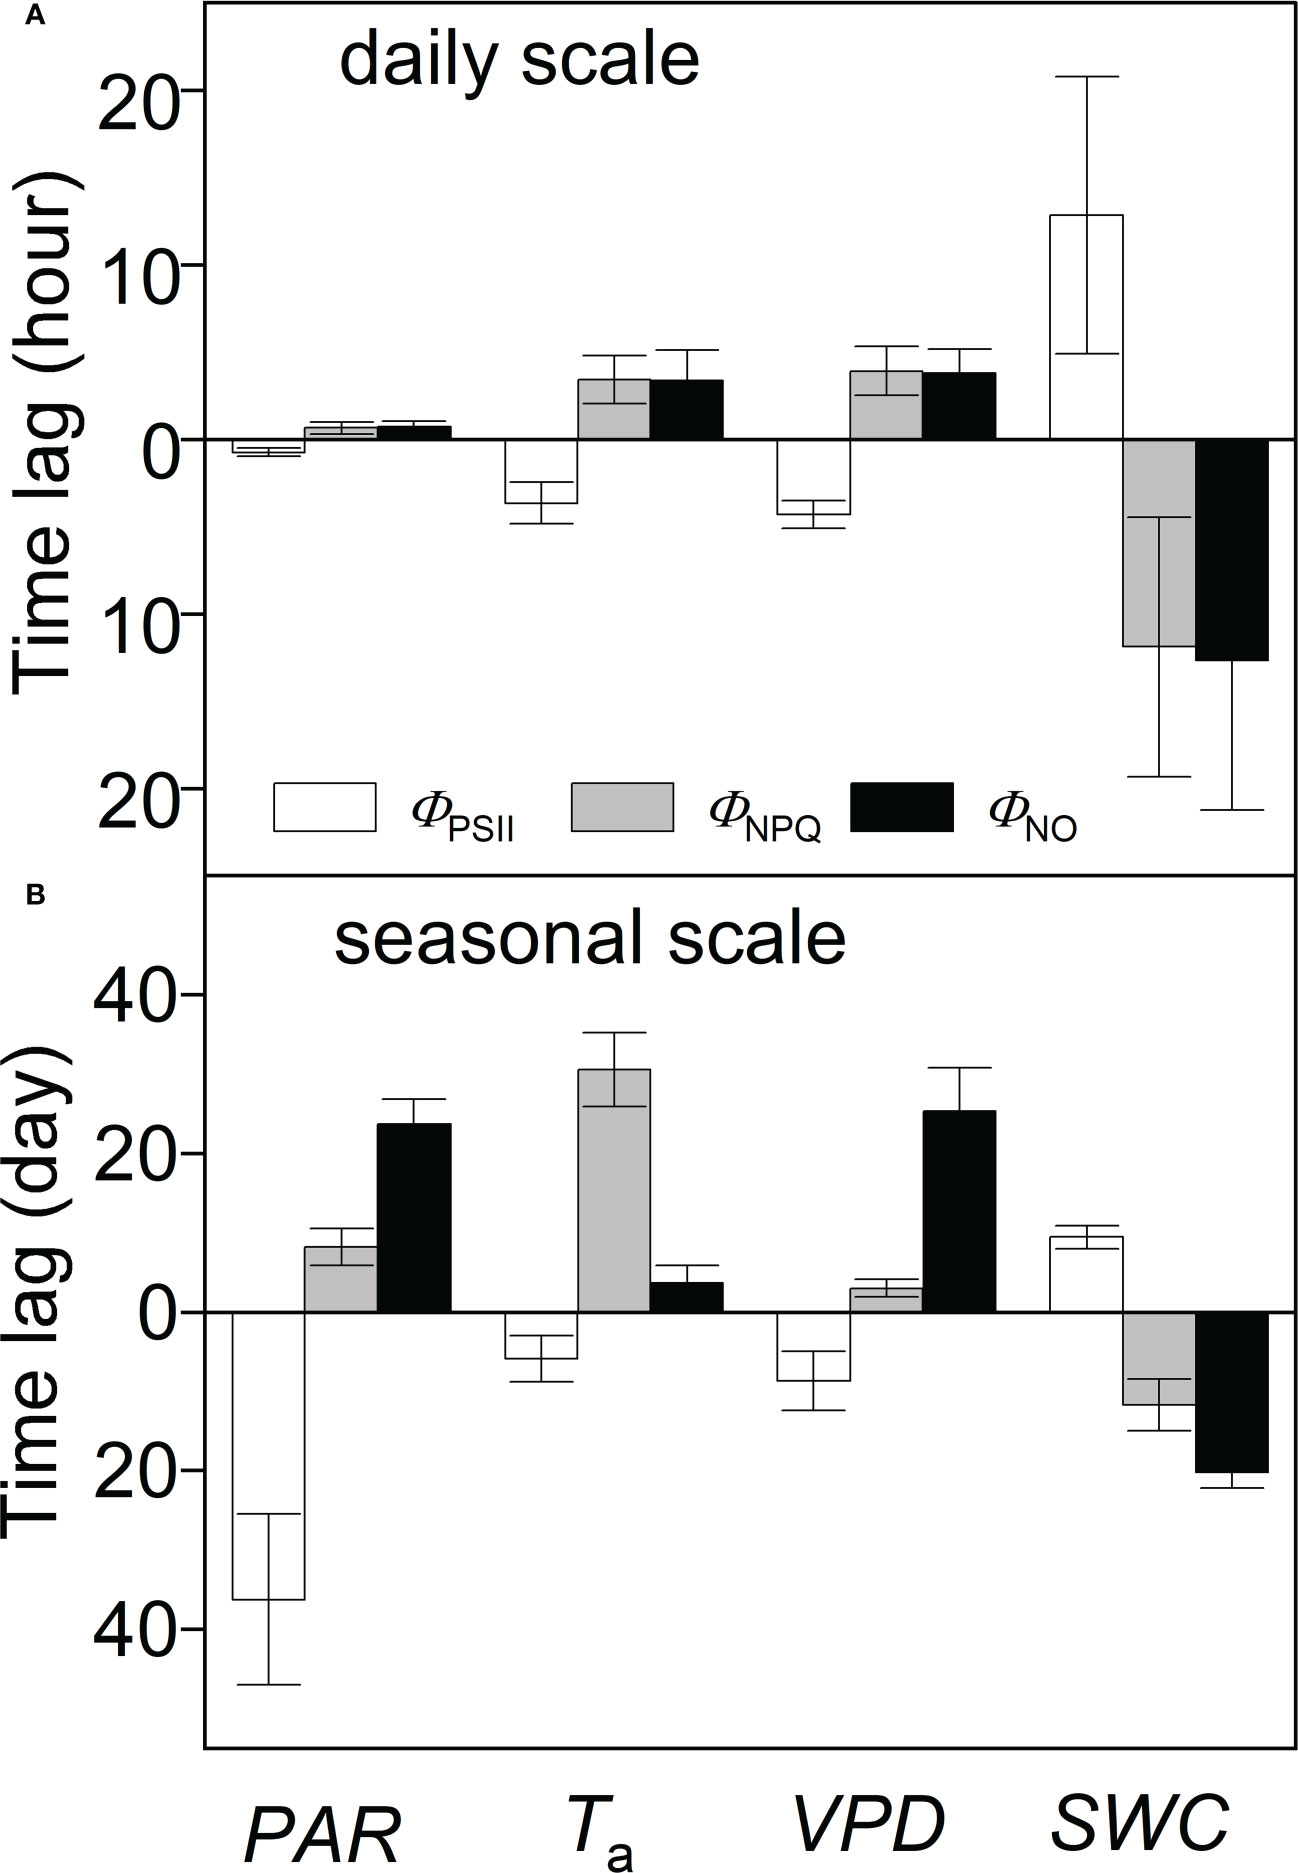
Figure 8 Time lags between PSII-energy partitioning measures and environmental factors at (A) daily and (B) seasonal timescales; ΦPSII = photochemical efficiency; ΦNPQ = regulatory thermal dissipation; ΦNO = non-regulatory thermal dissipation; PAR = photosynthetically active radiation; Ta = air temperature; VPD = vapor pressure deficit; and SWC = soil water content at a 0.3-m depth. Columns above the central line (at time lag = zero) indicate positive correlation, whereas columns below the line indicate negative correlation. Data represent mean ± standard deviation (error bars).
Causal inference at multiple timescales
Appearing in Table 3 are the results of CCM based on hourly PSII-energy partitioning as a function of shrub phenology. At the hour scale, causality among pairings of energy allocation measures was mostly in agreement across the various phenological periods. Parameter ΦPSII had a unidirectional causal relationship with ΦNPQ, with ΦPSII forcing ΦNPQ (case II). Except when ΦPSII-forcing-ΦNO was not statistically significant (p > 0.05) during the budding period, both ΦNPQ and ΦPSII had a bidirectional causal connection (feedback) with ΦNO (case III). In contrast, causal relationships among daily PSII-energy partitioning measures varied across phenological phases (Table 4); ΦPSII was shown not to be causally related to ΦNPQ (case I), whereas ΦNPQ was bidirectionally related to ΦNO (case III). The unidirectional causality between ΦPSII and ΦNO (case II) changed from ΦPSII forcing ΦNO during the budding and leaf-expanded phases to ΦNO forcing ΦPSII during the leaf-coloring phase.
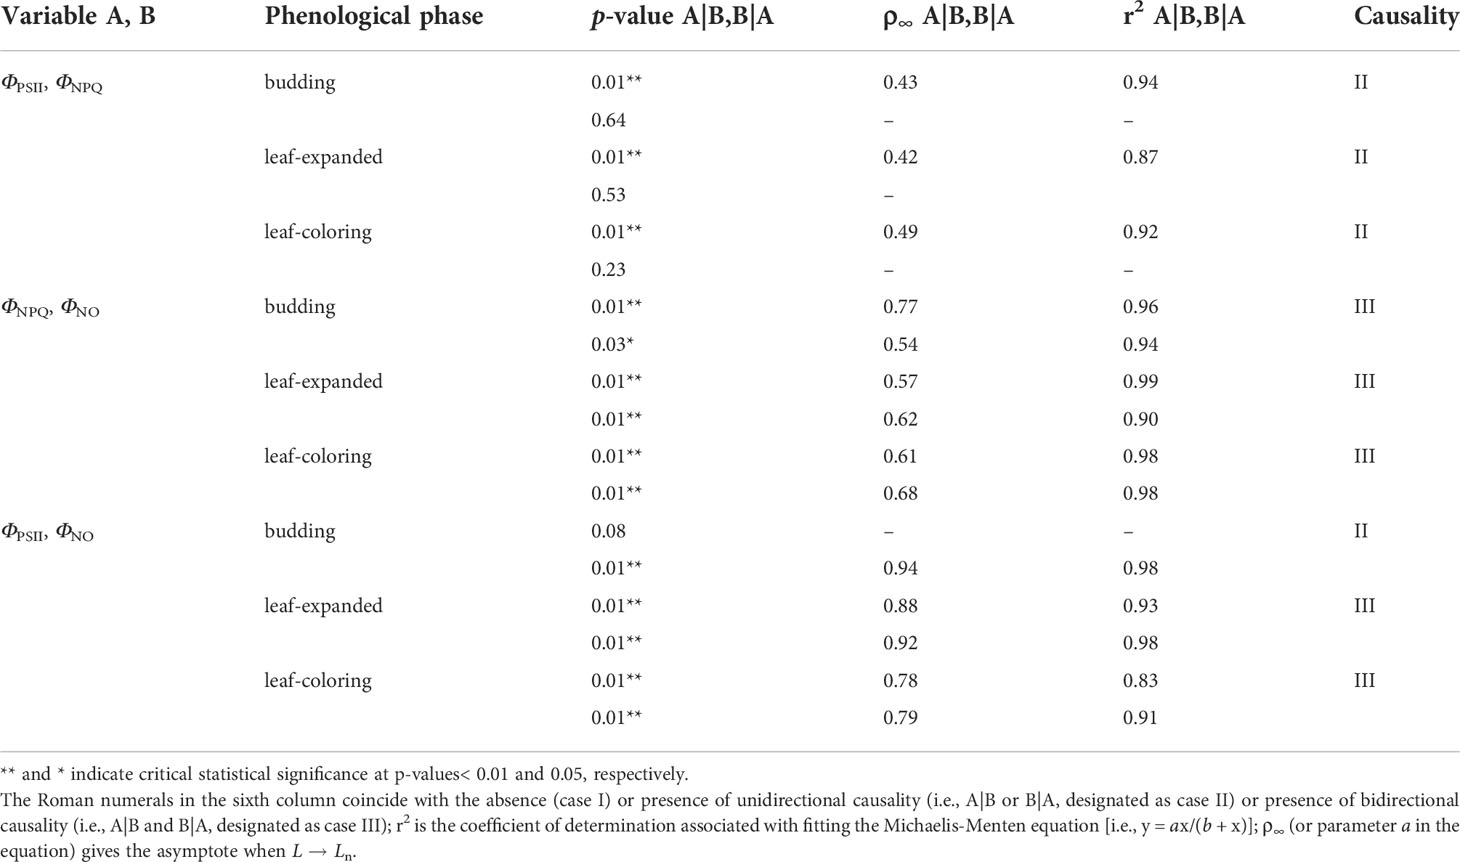
Table 3 Convergent cross mapping (CCM) with hourly data pairs relating three PSII-energy partitioning pathways for different phenological phases from 2012–2017 (Ln ~ 960 records); the number of bootstrapping iterations (n) = 1,000; and A|B and B|A stand for A forcing B and B forcing A, respectively.
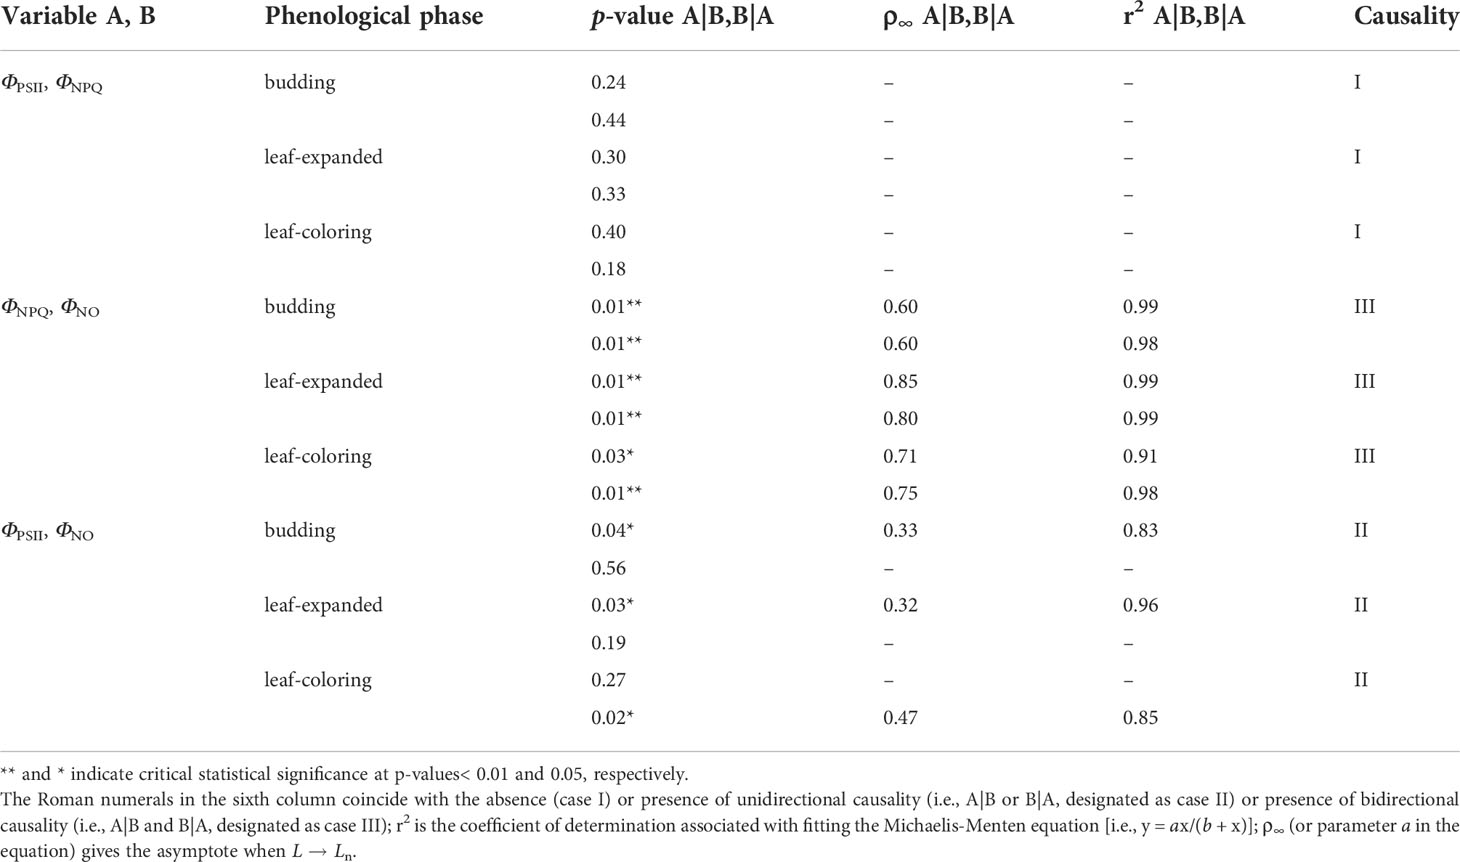
Table 4 Convergent cross mapping (CCM) with daily data pairs relating three PSII-energy partitioning pathways for different phenological phases from 2012–2017 (Ln ~ 202, 528, and 230 records); the number of bootstrapping iterations (n) = 1,000; and A|B and B|A stand for A forcing B and B forcing A, respectively.
Discussion
Environmental controls at diurnal timescales
The fate of excited states formed in PSII is variable and depends on the physiological history and state of the leaves. Events of extreme temperatures (Yan et al., 2011), drying (Ma et al., 2015), high rates of transpiration, and excessive solar radiation (Dai et al., 1992; Han et al., 2018), all have the potential to accelerate photoinhibition or photodamage in plants by affecting the energy absorbed and partitioned in PSII (Suzuki et al., 2014; Sacharz et al., 2017). Correspondingly, plants can dissipate a major part of this surplus light energy to offset the impact of reactive-oxygen-species accumulation to avoid photodamage (Wilhelm and Selmar, 2011; Zhang et al., 2021).
WTC-results suggested that responses (time lags) to variations in PAR were fastest among the PSII-energy partitioning pathways (Figure 8A). Solar radiation in the summer largely exceeded the photosynthetic needs of plants. Here, the photochemical process and the heat dissipation were modulated almost immediately (Jahns and Holzwarth, 2012). Even though most of the excessive excitation energy can be safely dissipated as thermal energy, an overproduction of reactive-oxygen-species (ROS) is still inevitable, which can lead to photodamage (Chen et al., 2016; Yamori, 2016; Sperdouli et al., 2021a). In this study, ΦPSII measured at night was equated as a reasonable substitute for Fv/Fm. Nonetheless, after the photochemical components recovered overnight, the measured expression of Fv/Fm, to some extent, was equivalent to the resilience in PSII (Zha et al., 2017). Variable ΦPSII reached its lowest value at about 12:00 local time and was restored to its original value at night (Figure 3D), indicating that photochemical reactions in A. ordosica were limited by high levels of solar radiation, but its PSII-reaction centers avoided photodamage (Zhang et al., 2021). However, studies on the same subject found that S. psammophila underwent severe photoinhibition due to disproportionate levels of solar radiation, resulting in irreversible leaf damage (Han et al., 2018).
The average time lags for Ta and VPD with PSII-energy partitioning in A. ordosica were 3.5 and 4.0 h, respectively (Table 1). Some studies have confirmed that cold temperatures can inhibit the activity of chloroplast protein import, thus impacting the photosynthetic state of PSII (Leheny and Theg, 1994; Savitch et al., 2009). During early morning, with the lowest Ta (PAR being close to zero), ΦPSII showed a slight decline (Figures 3B, D), indicating that low temperatures may inhibit PSII in A. ordosica. The study found that extreme daytime temperatures served as a direct threat to PSII by affecting the activity of antioxidants and Calvin-Benson cycle enzymes (Liu et al., 2012). Unfortunately, we do not have direct evidence to specify exactly how extreme temperatures affected PSII in A. ordosica. Dry and wet air circulation (causing fluctuations in VPD) can induce changes in stomatal aperture. Closure of stomates can limit photosynthetic electron transfer and potentially activate photoinhibition (Ghimire et al., 2018; Bambach et al., 2020). Meanwhile, inhibited water transport can increase the proton-gradient across thylakoid membranes, and eventually cause ΦPSII to decrease and ΦNPQ and ΦNO to increase (Johnson and Ruban, 2014).
Time lags in plant response to SWC were much longer than for the other environmental factors (Figure 8A), suggesting that A. ordosica is less sensitive to SWC during the short term (Wu et al., 2018). Overall, by comparing time lags, we propose that the sensitivity of PSII in A. ordosica at diurnal timescales is largely associated with variations in PAR, Ta, and then VPD (Table 1). This suggests that diurnal heat dissipation and the change in stomatal conductance during the day are the main processes that regulate PSII-energy partitioning in A. ordosica at daily timescales.
Environmental controls at intermediate scales
At seasonal timescales, harsh dryland environments are mainly characterized by excessive solar radiation and extreme temperatures lasting for several days to weeks, causing hydrological gradients to shift (Niinemets, 2010; Suzuki et al., 2014). Studies have shown that long-term adaptation mechanisms in PSII takes several days or even weeks to respond, which is achieved by adjusting photosynthetic pigment concentration and chlorophyll a-to-chlorophyll b ratios, or PSII-specific protein content (Müller et al., 2001; Savitch et al., 2009; Ren et al., 2018).
Our results show that time lags associated with each PSII-energy allocation pathway vary at seasonal timescales (Figure 8B). Short time lags of ΦNPQ-to-PAR pairings (8.23 days) indicate that A. ordosica has a regulatory PSII mechanism to respond to high levels of solar radiation. This is achieved by the shrub’s ability to actively increase rates of thermal dissipation (Wu et al., 2018; Samson et al., 2019). Excessive solar radiation breaks the stability between PSII-energy input and utilization, causing damage to the light-harvesting protein complexes (Stefanov et al., 2018). Time lags for the ΦPSII-to-PAR and ΦNO-to-PAR pairings can be up to 36.21 and 23.65 days, respectively (Table 2). This suggests that A. ordosica has a level of tolerance to surplus solar radiation. Morphologically, their needle-shaped leaves help to minimize excessive light capture (Liu and Zhang, 2018).
The seasonal temperature range in deserts is significant (Figure 2B). The short time lags associated with the ΦPSII-to-Ta and ΦNO-to-Ta pairings (i.e., 5.89 and 3.72 days, respectively) indicate that seasonal fluctuations in temperature threaten the stability of PSII, which can result in a decrease in photosynthetic capacity (Mathur et al., 2014). It is worth noting that ΦNPQ lagged Ta by 30.51 days (Table 2), which can be viewed as a rather slow adjustment. It has been reported that desert plants can adapt to extreme temperatures by increasing the osmotic pressure in cells, increasing the anti-coagulant properties of protoplasm and reducing their metabolic rate (Faik et al., 2016; Wu et al., 2018).
Our results show that VPD impacts ΦNPQ and ΦPSII rapidly (about 3–8 days), whereas it influences ΦNO much more slowly (~25 days). We conclude that under dry-air conditions, A. ordosica can tolerate the on-going conditions with their fully evolved stomatal structures and gelatinous mesophyll (Dai et al., 1992; Ghimire et al., 2018).
Under large hydraulic gradients, inactivation of PSII due to aridity stresses often alternates, causing reversible photodamage (Biederman et al., 2017; Wu et al., 2018). WTC-results show that during early drought (within ~10 days of its onset), A. ordosica can maintain a stable PSII with long-term regulatory capacity (Ghimire et al., 2018). Due to A. ordosica’s well-developed rooting system, with a thick taproot and dense lateral roots, uptake of soil water is maintained even under conditions of extended drought (Fan et al., 2017). Moreover, Fv/Fm fluctuates with long-term, low growing-season SWC, maintaining an average Fv/Fm-ratio of 0.78 (Figure 2E). Our study submits that A. ordosica can recover through PSII self-repair and regulation under long-term drought.
PSII-energy partitioning and its relationship to shrub phenology
One-way interactions between hourly ΦPSII and ΦNPQ identified with CCM, suggests that photosynthetic limitation in A. ordosica caused the shrub to mitigate pressure of excess light energy by regulating heat dissipation (Table 3). By contrast, the two-way interaction between hourly ΦPSII and ΦNO shows that inhibition of photosynthesis can result in photodamage. This photodamage, in turn, is expected to result in a simultaneous reduction in photosynthesis as a result of the variables’ mutual relationship in a negative feedback loop (Genty et al., 1989; Jahns and Holzwarth, 2012).
We also found that PSII-energy partitioning in A. ordosica was affected by its phenology. During budding, from April to early May of each year, daytime ΦNO was shown to increase (Figure 3F). Low chlorophyll content and photosynthesis activity during this phase promoted photoinhibition (Ren et al., 2018). During the leaf-expanded phase (June–August of each year), ΦNPQ was seen to increase and ΦPSII to decrease (Figures 3D, E). During this period, biomass and leaf functional traits had reached their optimum functioning. Bidirectional causal relationships identified with daily ΦNPQ and ΦNO (Table 4), suggested that PSII in A. ordosica was most likely in a cycle of constant injury and mending (Han et al., 2018). During the leaf-coloring phase (i.e., September–October), daytime ΦNO and Fv/Fm were seen to increase and decrease, respectively (Figures 2E, 3F), and the unidirectional causal relationship, i.e., ΦPSII forcing ΦNO, changed to ΦNO forcing ΦPSII (Table 4). During this period, shrub chlorophyll content and enzyme activity rapidly decreased, resulting in further cumulative photodamage, increasing PSII-photochemical suppression.
Conclusions
Functional dependencies between PSII-energy partitioning and environmental variables varied across timescales. These discrepancies reflect the adaptive strategies in A. ordosica to changing desert environments. Diurnally, all PSII-energy partitioning pathways were largely dominated by PAR, regulated to some extent by Ta and VPD, and exhibited low sensitivity to SWC. Seasonally, the PSII-energy partitioning in A. ordosica was affected by both physiological and phenological factors. Both ΦPSII and ΦNO were vulnerable to Ta, whereas ΦNPQ was most sensitive to VPD. Short-term drought (within< 10 days) had little effect on PSII-energy partitioning. A. ordosica was shown to have an ability to repair itself, with an Fv/Fm > 0.78. Our results suggested that A. ordosica can acclimate to excessive PAR, air aridity, and prolonged drought, exhibiting rapid response to variation in extreme temperatures by means of photoinhibition. Our findings have important implications for understanding the adaptation capacity in dryland shrub species in desert-plant communities under current climate change. Information from this study is beneficial to combatting desertification and restoring ecological function to drylands globally.
Data availability statement
The original contributions presented in the study are included in the article/Supplementary Material. Further inquiries can be directed to the corresponding author.
Author contributions
TZ and CJ conceived the study. CJ, ZG, MX and NW conducted the fieldwork. CJ, XG, XK and XHL analyzed the data. CJ wrote the manuscript with the assistance of TZ and PL. CP-AB helped revise/polish the manuscript. YT and XJ revised the manuscript. All authors contributed to and approved the final manuscript.
Funding
The research was supported by grants from the National Natural Science Foundation of China (NSFC: 32071842, 32101588, 31901366, 32071843), by the National Key Research and Development Program of China (No. 2020YFA0608100).
Acknowledgments
We thank TZ Wei, WJ Zhou, and RZ Yang for their assistance with field measurements and instrument maintenance. The U.S.-China Carbon Consortium (USCCC) supported this work by way of helpful discussion and the exchange of scientific ideas.
Conflict of interest
The authors declare that the research was conducted in the absence of any commercial or financial relationships that could be construed as a potential conflict of interest.
Publisher’s note
All claims expressed in this article are solely those of the authors and do not necessarily represent those of their affiliated organizations, or those of the publisher, the editors and the reviewers. Any product that may be evaluated in this article, or claim that may be made by its manufacturer, is not guaranteed or endorsed by the publisher.
Supplementary material
The Supplementary Material for this article can be found online at: https://www.frontiersin.org/articles/10.3389/fpls.2022.1057943/full#supplementary-material
Supplementary Figure 1 | Wavelet power spectra for daily mean (A) photosynthetically active radiation (PAR), (B) air temperature (Ta), (C) vapor pressure deficit (VPD), (D) soil water content at a 0.3-m depth (SWC), (E) photochemical efficiency (ΦPSII), and (F) ratio of regulatory to non-regulatory thermal dissipation (ΦNPQ and ΦNO, respectively) for the 2012–2017 study period. Black contour lines represent the 0.05 critical significance level. The thin arced lines denote the cone of influence (COI) that delimits the region not affected by edge artefacts. The color ranges from dark blue to dark red, coinciding with wavelet power spectra from low to high.
References
Baldocchi, D., Falge, E., Wilson, K. (2001). A spectral analysis of biosphere–atmosphere trace gas flux densities and meteorological variables across hour to multi-year time scales. Agric. For. Meteorology 107 (1), 1–27. doi: 10.1016/S0168-1923(00)00228-8
Bambach, N., Paw U, K. T., Gilbert, M. E. (2020). A dynamic model of RuBP-regeneration limited photosynthesis accounting for photoinhibition, heat and water stress. Agric. For. Meteorology 285–286, 107911. doi: 10.1016/j.agrformet.2020.107911
Biederman, J. A., Scott, R. L., Bell, T. W., Bowling, D. R., Dore, S., Garatuza-Payan, J., et al. (2017). CO2 exchange and evapotranspiration across dryland ecosystems of southwestern north America. Global Change Biol. 23 (10), 4204–4221. doi: 10.1111/gcb.13686
Cazelles, B., Chavez, M., Berteaux, D., Ménard, F., Vik, J. O., Jenouvrier, S., et al. (2008). Wavelet analysis of ecological time series. Oecologia 156 (2), 287–304. doi: 10.1007/s00442-008-0993-2
Chang, C.-W., Ushio, M., Hsieh, C.-H. (2017). Empirical dynamic modeling for beginners. Ecol. Res. 32 (6), 785–796. doi: 10.1007/s11284-017-1469-9
Chen, J.-W., Kuang, S.-B., Long, G.-Q., Yang, S.-C., Meng, Z.-G., Li, L.-G., et al. (2016). Photosynthesis, light energy partitioning, and photoprotection in the shade-demanding species panax notoginseng under high and low level of growth irradiance. Funct. Plant Biol. 43 (6), 479–491. doi: 10.1071/FP15283
Dai, Z., Edwards, G. E., Ku, M. S. (1992). Control of photosynthesis and stomatal conductance in Ricinus communis l. (castor bean) by leaf to air vapor pressure deficit. Plant Physiol. 99 (4), 1426–1434. doi: 10.1104/pp.99.4.1426
Faik, A., Popova, A. V., Velitchkova, M. (2016). Effects of long-term action of high temperature and high light on the activity and energy interaction of both photosystems in tomato plants. Photosynthetica 54 (4), 611–619. doi: 10.1007/s11099-016-0644-5
Fan, Y., Miguez-Macho, G., Jobbágy Esteban, G., Jackson Robert, B., Otero-Casal, C. (2017). Hydrologic regulation of plant rooting depth. Proc. Natl. Acad. Sci. 114 (40), 10572–10577. doi: 10.1073/pnas.1712381114
Genty, B., Briantais, J.-M., Baker, N. R. (1989). The relationship between the quantum yield of photosynthetic electron transport and quenching of chlorophyll fluorescence. Biochim. Biophys. Acta (BBA) - Gen. Subj. 990 (1), 87–92. doi: 10.1016/S0304-4165(89)80016-9
Georgieva, K., Maslenkova, L., Peeva, V., Markovska, Y., Stefanov, D., Tuba, Z. (2005). Comparative study on the changes in photosynthetic activity of the homoiochlorophyllous desiccation-tolerant Haberlea rhodopensis and desiccation-sensitive spinach leaves during desiccation and rehydration. Photosynthesis Res. 85 (2), 191–203. doi: 10.1007/s11120-005-2440-0
Ghimire, C. P., Bruijnzeel, L. A., Lubczynski, M. W., Zwartendijk, B. W., Odongo, V. O., Ravelona, M., et al. (2018). Transpiration and stomatal conductance in a young secondary tropical montane forest: contrasts between native trees and invasive understorey shrubs. Tree Physiol. 38 (7), 1053–1070. doi: 10.1093/treephys/tpy004
Grinsted, A., Moore, J. C., Jevrejeva, S. (2004). Application of the cross wavelet transform and wavelet coherence to geophysical time series. Nonlinear Processes Geophysical 11 (5/6), 561–566. doi: 10.5194/npg-11-561-2004
Han, Y., Wu, J., Tian, Y., Zha, T., Jia, X., Bourque, C. P.-A., et al. (2018). Light energy partitioning and photoprotection in an exotic species (Salix psammophila) grown in a semi-arid area of northwestern China. Forests 9 (6), 341. doi: 10.3390/f9060341
Hikosaka, K. (2021). Photosynthesis, chlorophyll fluorescence and photochemical reflectance index in photoinhibited leaves. Funct. Plant Biol. 48 (8), 815–826. doi: 10.1071/FP20365
Huang, J., Yu, H., Dai, A., Wei, Y., Kang, L. (2017). Drylands face potential threat under 2 °C global warming target. Nat. Climate Change 7 (6), 417–422. doi: 10.1038/nclimate3275
Jahns, P., Holzwarth, A. R. (2012). The role of the xanthophyll cycle and of lutein in photoprotection of photosystem II. Biochim. Biophys. Acta (BBA) - Bioenergetics 1817 (1), 182–193. doi: 10.1016/j.bbabio.2011.04.012
Janka, E., Körner, O., Rosenqvist, E., Ottosen, C.-O. (2015). Using the quantum yields of photosystem II and the rate of net photosynthesis to monitor high irradiance and temperature stress in chrysanthemum (Dendranthema grandiflora). Plant Physiol. Biochem. 90, 14–22. doi: 10.1016/j.plaphy.2015.02.019
Jia, X., Zha, T., Gong, J., Zhang, Y., Wu, B., Qin, S., et al. (2018). Multi-scale dynamics and environmental controls on net ecosystem CO2 exchange over a temperate semiarid shrubland. Agric. For. Meteorology 259, 250–259. doi: 10.1016/j.agrformet.2018.05.009
Jia, X., Zha, T. S., Wu, B., Zhang, Y. Q., Gong, J. N., Qin, S. G., et al. (2014). Biophysical controls on net ecosystem CO2 exchange over a semiarid shrubland in northwest China. Biogeosciences 11 (17), 4679–4693. doi: 10.5194/bg-11-4679-2014
Johnson, M. P., Ruban, A. V. (2014). Rethinking the existence of a steady-state Δψ component of the proton motive force across plant thylakoid membranes. Photosynthesis Res. 119 (1), 233–242. doi: 10.1007/s11120-013-9817-2
Kalaji, H. M., Carpentier, R., Allakhverdiev, S. I., Bosa, K. (2012). Fluorescence parameters as early indicators of light stress in barley. J. Photochem. Photobiol. B: Biol. 112, 1–6. doi: 10.1016/j.jphotobiol.2012.03.009
Kalaji, M. H., Goltsev, V. N., Żuk-Golaszewska, K., Zivcak, M., Brestic, M. (2017). Chlorophyll fluorescence understanding crop: Performance–basics and applications (Boca Raton, Florida, USA: CRC Press). doi: 10.1201/9781315153605
Leheny, E. A., Theg, S. M. (1994). Apparent inhibition of chloroplast protein import by cold temperatures is due to energetic considerations not membrane fluidity. Plant Cell 6 (3), 427–437. doi: 10.1105/tpc.6.3.427
Li, C., Fu, B., Wang, S., Stringer, L. C., Wang, Y., Li, Z., et al. (2021). Drivers and impacts of changes in china’s drylands. Nat. Rev. Earth Environ. 2 (12), 858–873. doi: 10.1038/s43017-021-00226-z
Liu, Y. F., Qi, M. F., Li, T. L. (2012). Photosynthesis, photoinhibition, and antioxidant system in tomato leaves stressed by low night temperature and their subsequent recovery. Plant Sci. 196, 8–17. doi: 10.1016/j.plantsci.2012.07.005
Liu, J., Zhang, K. (2018). Spatial pattern and population structure of Artemisia ordosica shrub in a desert grassland under enclosure, northwest China. Int. J. Environ. Res. Public Health 15 (5), 946. doi: 10.3390/ijerph15050946
Müller, P., Li, X.-P., Niyogi, K. K. (2001). Non-photochemical quenching. a response to excess light energy. Plant Physiol. 125 (4), 1558–1566. doi: 10.1104/pp.125.4.1558
Ma, P., Bai, T.-H., Ma, F.-W. (2015). Effects of progressive drought on photosynthesis and partitioning of absorbed light in apple trees. J. Integr. Agric. 14 (4), 681–690. doi: 10.1016/S2095-3119(14)60871-6
Maseyk, K., Lin, T., Cochavi, A., Schwartz, A., Yakir, D. (2019). Quantification of leaf-scale light energy allocation and photoprotection processes in a Mediterranean pine forest under extensive seasonal drought. Tree Physiol. 39 (10), 1767–1782. doi: 10.1093/treephys/tpz079
Mathur, S., Agrawal, D., Jajoo, A. (2014). Photosynthesis: Response to high temperature stress. J. Photochem. Photobiol. B: Biol. 137, 116–126. doi: 10.1016/j.jphotobiol.2014.01.010
Meacham, K., Sirault, X., Quick, W. P., von Caemmerer, S., Furbank, R. (2017). Diurnal solar energy conversion and photoprotection in rice canopies. Plant Physiol. 173 (1), 495–508. doi: 10.1104/pp.16.01585
Nar, H., Saglam, A., Terzi, R., Várkonyi, Z., Kadioglu, A. (2009). Leaf rolling and photosystem II efficiency in ctenanthe setosa exposed to drought stress. Photosynthetica 47 (3), 429–436. doi: 10.1007/s11099-009-0066-8
Ng, E. K. W., Chan, J. C. L. (2012). Geophysical applications of partial wavelet coherence and multiple wavelet coherence. J. Atmospheric Oceanic Technol. 29 (12), 1845–1853. doi: 10.1175/JTECH-D-12-00056.1
Niinemets, Ü. (2010). Responses of forest trees to single and multiple environmental stresses from seedlings to mature plants: Past stress history, stress interactions, tolerance and acclimation. For. Ecol. Manage. 260 (10), 1623–1639. doi: 10.1016/j.foreco.2010.07.054
Ni, Z., Lu, Q., Huo, H., Zhang, H. (2019). Estimation of chlorophyll fluorescence at different scales: a review. Sensors 19 (13), 3000. doi: 10.3390/s19133000
Ogawa, T., Misumi, M., Sonoike, K. (2017). Estimation of photosynthesis in cyanobacteria by pulse-amplitude modulation chlorophyll fluorescence: problems and solutions. Photosynthesis Res. 133 (1), 63–73. doi: 10.1007/s11120-017-0367-x
Ouyang, Z., Chen, J., Becker, R., Chu, H., Xie, J., Shao, C., et al. (2014). Disentangling the confounding effects of PAR and air temperature on net ecosystem exchange at multiple time scales. Ecol. Complexity 19, 46–58. doi: 10.1016/j.ecocom.2014.04.005
Qin, Z., Ouyang, Y., Su, G.-l., Yu, Q., Li, J., Zhang, J.-E., et al. (2008). Characterization of CO2 and water vapor fluxes in a summer maize field with wavelet analysis. Ecol. Inf. 3 (6), 397–409. doi: 10.1016/j.ecoinf.2008.09.002
Quaas, T., Berteotti, S., Ballottari, M., Flieger, K., Bassi, R., Wilhelm, C., et al. (2015). Non-photochemical quenching and xanthophyll cycle activities in six green algal species suggest mechanistic differences in the process of excess energy dissipation. J. Plant Physiol. 172, 92–103. doi: 10.1016/j.jplph.2014.07.023
Ren, C., Wu, Y., Zha, T., Jia, X., Tian, Y., Bai, Y., et al. (2018). Seasonal changes in photosynthetic energy utilization in a desert shrub (Artemisia ordosica krasch.) during its different phenophases. Forests 9 (4), 176. doi: 10.3390/f9040176
Rodríguez-Calcerrada, J., Pardos, J. A., Gil, L., Aranda, I. (2008). Ability to avoid water stress in seedlings of two oak species is lower in a dense forest understory than in a medium canopy gap. For. Ecol. Manage. 255 (3), 421–430. doi: 10.1016/j.foreco.2007.09.009
Ruban, A. V., Johnson, M. P., Duffy, C. D. P. (2012). The photoprotective molecular switch in the photosystem II antenna. Biochim. Biophys. Acta (BBA) - Bioenergetics 1817 (1), 167–181. doi: 10.1016/j.bbabio.2011.04.007
Sacharz, J., Giovagnetti, V., Ungerer, P., Mastroianni, G., Ruban, A. V. (2017). The xanthophyll cycle affects reversible interactions between PsbS and light-harvesting complex II to control non-photochemical quenching. Nat. Plants 3 (2), 16225. doi: 10.1038/nplants.2016.225
Samson, G., Bonin, L., Maire, V. (2019). Dynamics of regulated YNPQ and non-regulated YNO energy dissipation in sunflower leaves exposed to sinusoidal lights. Photosynthesis Res. 141 (3), 315–330. doi: 10.1007/s11120-019-00633-w
Savitch, L. V., Ivanov, A. G., Gudynaite-Savitch, L., Huner, N. P. A., Simmonds, J. (2009). Effects of low temperature stress on excitation energy partitioning and photoprotection in zea mays. Funct. Plant Biol. 36 (1), 37–49. doi: 10.1071/FP08093
Schurr, U., Walter, A., Rascher, U. (2006). Functional dynamics of plant growth and photosynthesis – from steady-state to dynamics – from homogeneity to heterogeneity. Plant Cell Environ. 29 (3), 340–352. doi: 10.1111/j.1365-3040.2005.01490.x
Sperdouli, I., Andreadis, S., Moustaka, J., Panteris, E., Tsaballa, A., Moustakas, M. (2021a). Changes in light energy utilization in photosystem II and reactive oxygen species generation in potato leaves by the pinworm tuta absoluta. Molecules 26 (10), 2984. doi: 10.3390/molecules26102984
Sperdouli, I., Moustaka, J., Ouzounidou, G., Moustakas, M. (2021b). Leaf age-dependent photosystem II photochemistry and oxidative stress responses to drought stress in Arabidopsis thaliana are modulated by flavonoid accumulation. Molecules 26 (14), 4157. doi: 10.3390/molecules26144157
Sperdouli, I., Moustakas, M. (2012). Spatio-temporal heterogeneity in Arabidopsis thaliana leaves under drought stress. Plant Biol. 14 (1), 118–128. doi: 10.1111/j.1438-8677.2011.00473.x
Stefanov, M., Yotsova, E., Markovska, Y., Apostolova, E. L. (2018). Effect of high light intensity on the photosynthetic apparatus of two hybrid lines of Paulownia grown on soils with different salinity. Photosynthetica 56 (3), 832–840. doi: 10.1007/s11099-017-0735-y
Stoy, P. C., Richardson, A. D., Baldocchi, D. D., Katul, G. G., Stanovick, J., Mahecha, M. D., et al. (2009). Biosphere-atmosphere exchange of CO2 in relation to climate: a cross-biome analysis across multiple time scales. Biogeosciences 6 (10), 2297–2312. doi: 10.5194/bg-6-2297-2009
Sugihara, G., May, R., Ye, H., Hsieh, C.-H., Deyle, E., Fogarty, M., et al. (2012). Detecting causality in complex ecosystems. Science 338 (6106), 496–500. doi: 10.1126/science.1227079
Suzuki, N., Rivero, R. M., Shulaev, V., Blumwald, E., Mittler, R. (2014). Abiotic and biotic stress combinations. New Phytol. 203 (1), 32–43. doi: 10.1111/nph.12797
Tominaga, J., Inafuku, S., Coetzee, T., Kawamitsu, Y. (2014). Diurnal regulation of photosynthesis in Jatropha curcas under drought during summer in a semi-arid region. Biomass Bioenergy 67, 279–287. doi: 10.1016/j.biombioe.2014.05.010
Vargas, R., Detto, M., Baldocchi, D. D., Allen, M. F. (2010). Multiscale analysis of temporal variability of soil CO2 production as influenced by weather and vegetation. Global Change Biol. 16 (5), 1589–1605. doi: 10.1111/j.1365-2486.2009.02111.x
Vilfan, N., van der Tol, C., Verhoef, W. (2019). Estimating photosynthetic capacity from leaf reflectance and chl fluorescence by coupling radiative transfer to a model for photosynthesis. New Phytol. 223 (1), 487–500. doi: 10.1111/nph.15782
Ware, M. A., Belgio, E., Ruban, A. V. (2015). Photoprotective capacity of non-photochemical quenching in plants acclimated to different light intensities. Photosynthesis Res. 126 (2), 261–274. doi: 10.1007/s11120-015-0102-4
Wilhelm, E., Battino, R., Wilcock, R. J. (1977). Low-pressure solubility of gases in liquid water. Chem. Rev. 77 (2), 219–262. doi: 10.1021/cr60306a003
Wilhelm, C., Selmar, D. (2011). Energy dissipation is an essential mechanism to sustain the viability of plants: The physiological limits of improved photosynthesis. J. Plant Physiol. 168 (2), 79–87. doi: 10.1016/j.jplph.2010.07.012
Wu, Y. J., Ren, C., Tian, Y., Zha, T. S., Liu, P., Bai, Y. J., et al. (2018). Photosynthetic gas-exchange and PSII photochemical acclimation to drought in a native and non-native xerophytic species (Artemisia ordosica and Salix psammophila). Ecol. Indic. 94, 130–138. doi: 10.1016/j.ecolind.2018.06.040
Yamori, W. (2016). Photosynthetic response to fluctuating environments and photoprotective strategies under abiotic stress. J. Plant Res. 129 (3), 379–395. doi: 10.1007/s10265-016-0816-1
Yan, K., Chen, P., Shao, H., Zhang, L., Xu, G. (2011). Effects of short-term high temperature on photosynthesis and photosystem II performance in sorghum. J. Agron. Crop Sci. 197 (5), 400–408. doi: 10.1111/j.1439-037X.2011.00469.x
Zhang, J., Xie, S., Yan, S., Xu, W., Chen, J. (2021). Light energy partitioning and photoprotection from excess light energy in shade-tolerant plant Amorphophallus xiei under steady-state and fluctuating high light. Acta Physiologiae Plantarum 43 (9), 125. doi: 10.1007/s11738-021-03298-y
Zha, T.-S., Wu, Y. J., Jia, X., Zhang, M. Y., Bai, Y. J., Liu, P., et al. (2017). Diurnal response of effective quantum yield of PSII photochemistry to irradiance as an indicator of photosynthetic acclimation to stressed environments revealed in a xerophytic species. Ecol. Indic. 74, 191–197. doi: 10.1016/j.ecolind.2016.11.027
Keywords: arid regions, chlorophyll fluorescence, desert plant, diurnal variation, seasonal fluctuations, wavelet analysis
Citation: Jin C, Zha T, Bourque CP-A, Jia X, Tian Y, Liu P, Li X, Liu X, Guo X, Xu M, Kang X, Guo Z and Wang N (2022) Temporal heterogeneity in photosystem II photochemistry in Artemisia ordosica under a fluctuating desert environment. Front. Plant Sci. 13:1057943. doi: 10.3389/fpls.2022.1057943
Received: 30 September 2022; Accepted: 19 October 2022;
Published: 03 November 2022.
Edited by:
Van Hien La, Chonnam National University, South KoreaCopyright © 2022 Jin, Zha, Bourque, Jia, Tian, Liu, Li, Liu, Guo, Xu, Kang, Guo and Wang. This is an open-access article distributed under the terms of the Creative Commons Attribution License (CC BY). The use, distribution or reproduction in other forums is permitted, provided the original author(s) and the copyright owner(s) are credited and that the original publication in this journal is cited, in accordance with accepted academic practice. No use, distribution or reproduction is permitted which does not comply with these terms.
*Correspondence: Tianshan Zha, dGlhbnNoYW56aGFAYmpmdS5lZHUuY24=
 Chuan Jin
 Tianshan Zha
 Charles P.-A. Bourque1,3
 Xin Jia
 Yun Tian
 Peng Liu
 Mingze Xu