
95% of researchers rate our articles as excellent or good
Learn more about the work of our research integrity team to safeguard the quality of each article we publish.
Find out more
ORIGINAL RESEARCH article
Front. Plant Sci. , 25 January 2023
Sec. Plant Breeding
Volume 13 - 2022 | https://doi.org/10.3389/fpls.2022.1047400
This article is part of the Research Topic Genetics and Molecular Breeding in Cereal Crops View all 29 articles
 Liu Yun1†
 Yan Zhang1†Shi Li1Jingyu Yang1Changyu Wang1Lanjie Zheng1Li Ji1
 Jiaheng Yang1Linhu Song1
 Yong Shi1
 Xu Zheng1*Zhiyong Zhang2*
 Jie Gao1,2*
The heat shock transcription factors (HSFs) family is widely present in eukaryotes including plants. Recent studies have indicated that HSF is a multifunctional group of genes involved in plant growth and development, as well as response to abiotic stresses. Here we combined the bioinformatic, molecular biology way to dissect the function of Hsf, specifically HsfB4 in wheat under abiotic stresses. In this study, we identified 78 TaHSF genes in wheat (Triticum aestivum) and analyzed their phylogenetic relationship and expression regulation motifs. Next, the expression profiles of TaHSFs and AtHSFs were analyzed in different tissues as well as in response to abiotic stress. Furthermore, to explore the role of HSFB4 in abiotic stress response, we cloned TaHSFB4-2B from the wheat variety, Chinese Spring. Subcellular localization analysis showed that TaHSFB4-2B was localized in the nucleus. In addition, We observed TaHSFB4-2B was highly expressed in the root and stem, its transcription was induced under long-term heat shock, cold, and salinity stress. Additionally, overexpression of TaHSFB4-2B suppressed seed germination and growth in Arabidopsis with salinity and mannitol treatment. It also modulated the expression of stress-responsive genes, including AtHSP17.8, AtHSP17.6A, AtHSP17.6C, CAT2, and SOS1, under both normal and stress conditions. From these finding, we propose that TaHSFB4-2B act as a negative regulator of abiotic stress response in the plant.
The abiotic stresses result in growth retardation, quality reduction, and yield loss of crop plants (Haider et al., 2022). For example, high temperature is found to significantly reduce crop yields (Schlenker and Roberts, 2009). Low temperature affects plant metabolism by directly inhibiting metabolic enzymes. Cold acclimation causes an increase in 75% of the 434 total metabolites detected in arabidopsis (Cook et al., 2004; Kaplan et al., 2004). Salinity leads to ionic toxicity, hypertonic stress, and oxidative damage (Zhu, 2002), while drought alters the growth and structure of plant roots, resulting in early flowering or growth retardation, and reduces yield (Gupta et al., 2020).
HSFs are the key regulators of heat stress response in plants. They specifically bind to highly conserved heat shock elements (HSE) to form transcriptional complexes that regulate the expression of downstream heat shock proteins (HSPs) (Lin et al., 2011). Based on the variations in the highly conserved functional domain, plant HSFs are categorized into three classes: HSFA, HSFB, and HSFC (Nover et al., 2001; Baniwal et al., 2004). HSFAs contain an AHA motif in the C-terminal activating peptide that participates in transcriptional activation (Czarnecka-Verner et al., 2004). Unlike HSFAs, HSFBs and HSFCs do not have an activation domain. As a result, they were presumed to be devoid of transcriptional activity (von Koskull-Doring et al., 2007).
In recent years, deducing the functions of HSFBs has become a research hotspot. In Arabidopsis, the HSFB subfamily is comprised of five members: AtHSFB1, AtHSFB2a, AtHSFB2b, AtHSFB3, and AtHSFB4. AtHSFB1 and AtHSFB2b are transcriptional inhibitors of heat-induced HSFs, which are involved in the positive regulation of acquired heat tolerance in the plant (Ikeda et al., 2011). AtHSFB4 primarily works in root stem cells and controls the development of cells in the surrounding layers. Arabidopsis scz, a mutant of AtHsfB4, showed an abnormal division of root peripheral cells, significantly increased root hair and shortened root length compared to wild-type (WT) plants (Mylona et al., 2002; Mylona et al., 2002; ten Hove et al., 2010; Begum et al., 2013). In rice, transgenic lines overexpressing OsHSFB4d showed enhanced disease resistance to bacterial leaf streak (BLS) and bacterial blight (BB) (Yang et al., 2020). In addition, heat, cold, and oxidative stress induced the transcription of OsHSFB4a, OsHSFB4b, and OsHSFB4d in rice (Mittal et al., 2009), indicating that the OsHSFB4 subfamily of genes is likely to be involved in heat and cold, as well as other stress responses.
In the current study, we analyzed the phylogenetic relationship among TaHSF proteins and the collinearity of TaHSF genes. The tissue-specific expression of TaHSFs and their responses to heat, cold, salinity, mannitol-induced drought stress, and exogenous ABA were investigated. Given the wide existence and diverse functions of HSFB4 genes, we cloned the closest ortholog of AtHSFB4 in wheat through homology-based cloning (http://plants.ensembl.org/index.html). The gene was designated TaHSFB4-2B based on its location on chromosome 2 of wheat subgenome B. We next analyzed the structural characteristics, subcellular localization, tissue-specific expression pattern, and expression profiles of TaHSFB4-2B under various abiotic stresses. Further, the transgenic lines overexpressing TaHSFB4-2B in arabidopsis were generated and their response to NaCl and mannitol-induced drought stress was evaluated. Taken together the findings, we concluded that TaHSFB4-2B acts as a negative regulator of heat and drought stress response in arabidopsis.
The amino acid sequences of HSF genes in arabidopsis (Arabidopsis thaliana), wheat (Triticum aestivum), soybean (Glycine max), tomato (Solanum lycopersicum), potato (Solanum tuberosum), rape (Brassica napus), rice (Oryza sativa), and corn (Zea mayz) were downloaded from Ensembl plants (http://plants.ensembl.org/index.html). MEGA-X (version 10.1.8) software was used for multiple sequence alignment and phylogenetic analysis was conducted using neighbor-joining method (Bootstrap test method was adopted and the replicate was set to 1000) (Tables S1, 2). Based on the information of wheat genome database, wheat HSF genes were mapped to different chromosomes, and the gene duplication events of HSF genes in wheat were visualized by TBtools (https://github.com/CJ-Chen/TBtools/releases). TaHSFB4-2B sequence was downloaded from Ensembl plants database. The TaHSFB4-2B protein domain was examined using the SMART online tool (http://smart.embl-heidelberg.de/). The TaHSFB4-2B gene structure was created using the GSDS website (http://gsds.cbi.pku.edu.cn/).
To further identify the putative induced abiotic stress cis-regulatory elements of the promoter regions of the AtHSFs and TaHSFs genes, 2-kb upstream sequences of AtHSFs and TaHSFs genes were obtained by using TBtools (https://github.com/CJ-Chen/TBtools/releases). The various putative cis-regulatory elements of these sequences were further analyzed using PlantCARE databases (http://bioinformatics.psb.ugent.be/webtools/plantcare/html/).
To further analyze the spatiotemporal expression patterns of AtHSF and TaHSF, the transcriptomic data were downloaded from the Wheat eFP Browser (http://bar.utoronto.ca/efp/cgi-bin/efpWeb.cgi) and ExpVIP (http://www.wheat-expression.com/), respectively. According to the expression databases of arabidopsis and wheat, we analyzed AtHSF and TaHSF expression patterns in different tissues, different developmental stages and under different abiotic stresses. The expression levels of AtHSF and TaHSF genes were then drawn into heatmaps by TBtools (https://github.com/CJ-Chen/TBtools/releases).
Total RNAs were isolated from young roots of 14-day-seedling wheat (Chinese Spring) and reversely transcribed into cDNA. Specific primers of TaHSFB4-2B were designed for its coding sequence amplication. Briefly, a 50 μL PCR reaction contained approximately 200 ng of cDNA, 25 μL of 2×PrimeSTAR HS (Premix), and 100 nM primers. The PCR programs were conducted following manufacturer’s instruction with an annealing temperature of 58°C for 30 seconds. The PCR products were purified from agarose gel, and then 35S::TaHSFB4-2B-GFP vector was transformed into Agrobacterium tumefaciens GV3101 strain, which was then used for transformation of arabidopsis (Col-0) by floral dip method. T0 transgenic lines were screened by 1/2 MS (Murashige and Skoog) medium with 50 mg/L Kan (Kanamycin) and green fluorescent protein signal was observed by fluorescence microscope. Homozygous T3 plants were obtained by successive self-crossing after screening for further research.
Wheat was cultured in the greenhouse at 25 ± 2°C with a light of 14-16 h/d for 2 weeks. Young leaves were detached from plants by a scissor and carefully sliced into 0.5-1 mm strips by sharp surgical blade. Then the sample strips were gently submerged into the 0.6 M mannitol for 10 min. After filtered, the samples were transferred into petri dish containing 50 ml enzyme buffer (1.5% cellulase R10, 0.75% macerozyme R10, 0.6 M mannitol, 10 mM MES, 10 mM CaCl2, 0.1% BSA, pH=5.7). Then the samples were penetrated under vacuum 15 Kpa for 30 min. The petri dish was fixed on a shaker at a speed of 10-20 RPM for 5 h. 30 ml W5 (150 mM NaCl, 125 mM CaCl2, 5 mM KCl, 2 mM MES, pH=5.7) were used for dilution of the protoplast and the solution were filtered by 75 um nylon membrane. Protoplast was collected by centrifuging at a speed of 100 rcf (g) for 3min. The protoplast was resuspended by 10 ml W5 and incubated on ice for 30 min. Supernatant was removed and MMG (0.4 M mannitol, 15 mM MgCl2, 4 mM MES) was used to dilute protoplast to a concentration of 2x10⁵/ml-1x106/ml. For transfection 100ul protoplasts were transfected with 10-20ug plasmid and incubated in dark at 25°C for 12-16h and used for further analysis.
Arabidopsis were cultured in chamber with the condition of 22°C and 16h/8h light/dark cycle until 4 weeks. Then fresh leaves were processed as stated above as wheat leaves. The experiment process and solution preparation referred to Barnes et al. (2019).
Either 35S::TaHSFB4-2B-GFP or 35S::GFP was co-transformed with nuclear marker 35S::mCherry-IMP4 into wheat protoplast; 35S::TaHSFB4-2B-GFP was co- transformed with either free 35S::mCherry or nuclear marker 35S::mCherry-IMP4 into arabidopsis protoplast. Then, a confocal microscope was used for imaging.
In addition, 35S::TaHSFB4-2B-eGFP and nuclear localization marker 35S::mCherry-IMP4 was co-transformed into 4-week-old Nicotiana benthamiana leaves mediated by Agrobacterium tumefaciens EHA105 strain. The Agrobacterium tumefaciens with plasmid vectors was cultured in 3 mL liquid LB medium with Kan and Rifampicin (Rif) antibiotics at 28°C and 250 RPM rotation for about 16 h until OD600 = 1-2, and then 5 uL of the culture was inoculated to 10 mL of fresh liquid LB medium (50 mg/L Kan, 50 mg/L Rif, 10 mm MES, 20 μM AS), which was followed by incubation at 28°C and 250 RPM for about 16 h until OD600 = 1. The culture medium was centrifugated at 4 000 RPM for 10 min. After the supernatant was removed, the pellets were resuspended in solution with solution containing 10 mM MES, 150 μM AS, and 10mM MgCl2, and adjusted OD600 to 1. Tobacco leaves were injected with the bacterial solution, and then set aside in the dark room with room temperature for 3 h. Then the tobacco plants were cultured in the dark for 1 d and then grown normally for another 1 d. Confocal microscopy was performed with laser-scanning confocal imaging system.
Wheat variety Chinese Spring was used in this study. Wheat seeds were selected with same size and full particles, then were disinfected them with 20% hypochlorous acid for 20 min, and rinsed with sterile water 5 times. The selected seeds were placed with the ventral groove downward in the petri dish, and covered by wet filter paper, and cultured in the incubator for 3 d in the dark. After germination, the seeds were wrapped in sponge and then cultured in the whole wheat culture medium [0.1 mM Ca(NO3)2, 0.2 mM KH2PO4, 1 mM MgSO4·7H2O, 1.5 mM KCl, 1.5 mM CaCl2, 1 μM H2BO3, 5 μM (NH4)6Mo7O2·H2O, 0.5 μM CuSO4·5H2O, 1 μM ZnSO4·7H2O, 1 μM MnSO4·H2O, 100 μM Fe(III)-EDTA, pH7.0] with a plant distance of 10 cm at 25°C, 12 h light/12 h dark for 14 days. The medium was changed once every three days. After that, the seedings were treated with high temperature (37°C) and low temperature (4°C). For mannitol-induced dehydration simulating drought or salinity stress, the seedlings were transferred into the whole wheat culture medium with 300 mM mannitol or 200 mM NaCl. Wheat leaves and roots were sampled at the time point of 0 h, 1 h, 2 h and 6 h after treatment and stored respectively at -80°C.
The homozygous seeds of T3 transgenic line were used for phenotypic analysis. Arabidopsis seeds were sterilized with 30% hypochlorous acid and 2‰ TritonX-100 for 10 min, and rinsed with sterile water for 5 times, then germinated in the dark at 4°C for 3 d. The germinated arabidopsis seeds were grown on 1/2 MS with additional 100 mM NaCl, 150 mM NaCl, 250 mM mannitol or 300 mM mannitol respectively, and were cultured at 22°C for 9 d (16 h light/8 h dark). Wild-type or over-expression seedlings treated by salinity or mannitol was phenotyped, and samples were harvested under stresses, and then frozen in liquid N2 for future processing.
The total RNA was extracted by Trizol (Tiangen, Beijing) following the manufacturer’s instructions with minor modification. The extracted RNA was reversely transcribed into cDNA according to the instructions of reverse transcription Kit (Takara, Dalian). The cDNA was diluted to a concentration of 400 ng/μL. Gene specific primers were designed for quantitative real-time PCR analysis (LC480, Roche, USA) and Actin was selected as the internal reference (Table S3). The PCR program was performed in three biological replicates and three technical replicates for each sample. Briefly, a 20-μL PCR reaction contained approximately 100 ng of cDNA, 10 μL of SYBR solution, and 200 nM primers. The 2−ΔΔCt method was used for statistical analysis.
In this study, the statistical analysis was reported as means ± SD with significance determined by Student’s t-test or ANOVA at least three replicates. Significance levels are marked as: *P<0.05, **P<0.01, non-significant (n.s.), P>0.05. Least Significant Difference (LSD) was used to compare TaHSFB4-2B tissue specific expression in wheat, letters (‘a-d’) indicate the statistical differences between different tissues determined by LSD (P<0.05) of variance (ANOVA) method. Same letters: no significant difference, and different letters: significant difference between the two groups.
We searched the Ensembl database (http://plants.ensembl.org/index.html) and found that there are 78 HSF genes in wheat, including 34 TaHSFAs, 18 TaHSFBs, and 26 TaHSFCs. To investigate their evolutionary relationships, the amino acid sequences of 78 TaHsfs were obtained, along with 31, 21, and 26 protein sequences of HSFs from widely cultivated monocotyledon maize (Zea mays) and dicotyledons Arabidopsis (Arabidopsis thaliana) and tomato (Solanum lycopersicum), respectively. Based on the phylogenetic analysis, HSF proteins from all four plants were classified into three subfamilies, viz. - HSFA-C, and the phylogenetic relationship between corresponding homologous proteins from each subfamily was more significant within monocotyledon crops or dicotyledon than between them (Figure 1A).
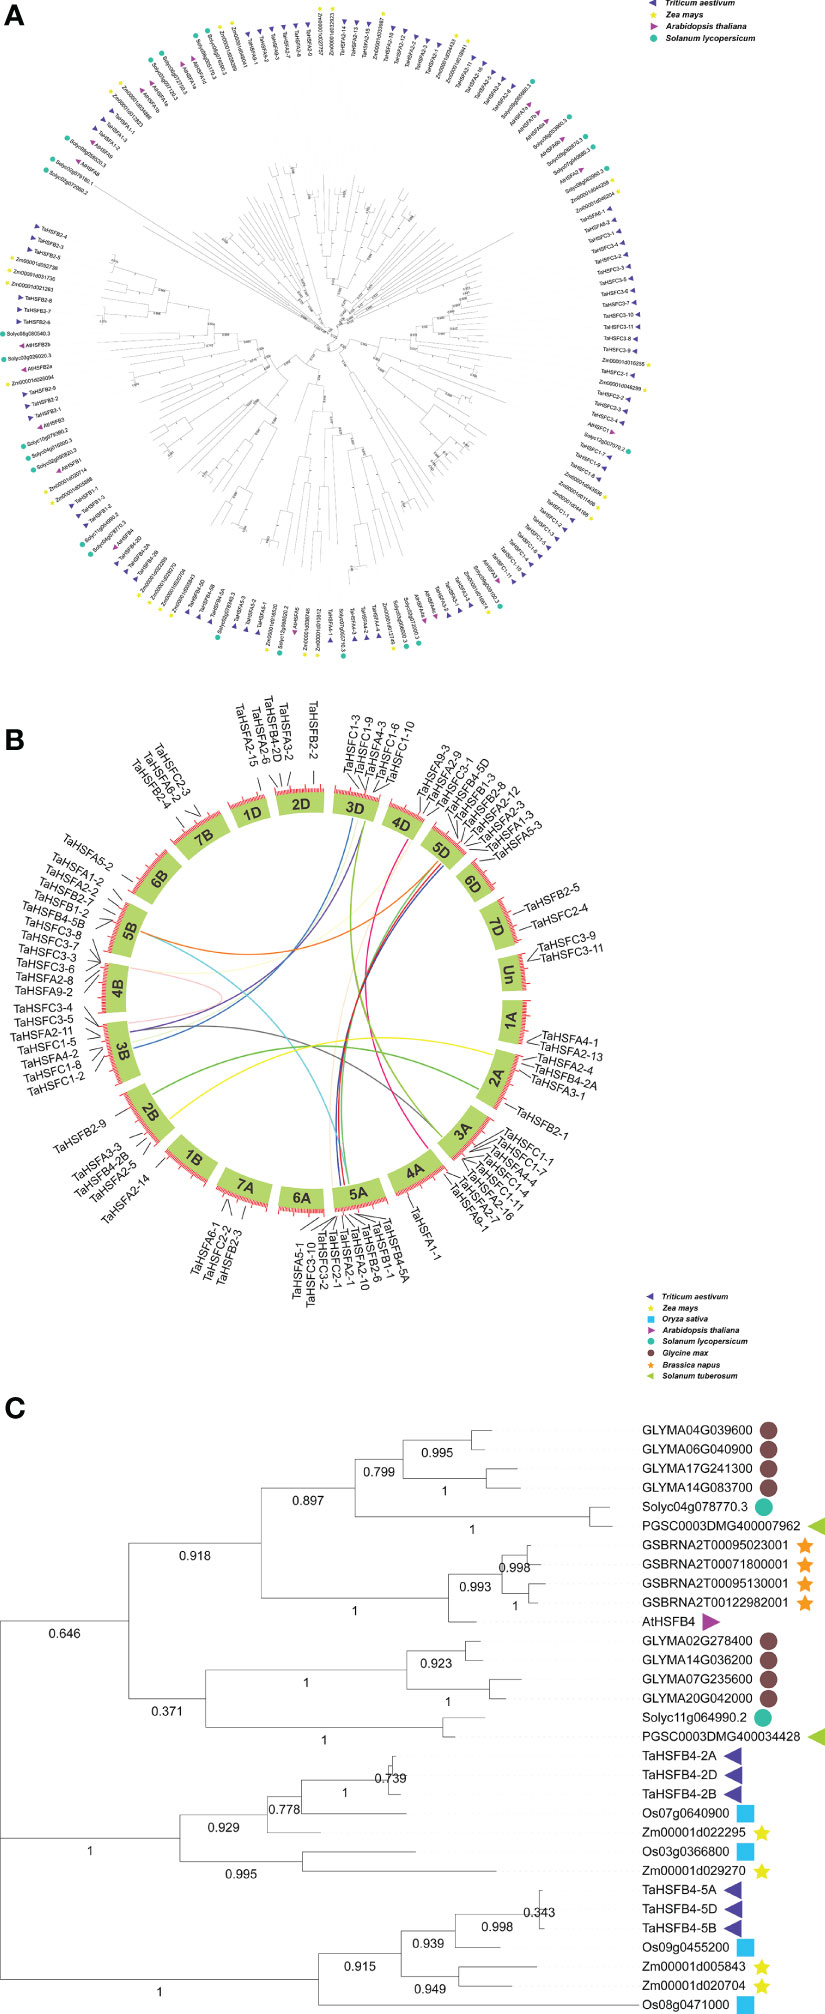
Figure 1 Neighbor-joining phylogenetic tree and synteny analysis of TaHSF families. (A) Neighbor-joining phylogenetic tree of Triticum aestivum (Ta), Arabidopsis thaliana (At), Zea mays (Zm) and Solanum lycopersicum (Sl) HSF families. TaHSFB4-2A, TaHSFB4-2B, and TaHSFB4-2D were marked in red. (B) Synteny analysis of TaHSF genes. (C) Phylogenetic analysis and amino acid sequence alignment of HSFB4s in Ta, At, Zm, Sl, Oryza sativa (Os), Glycine max (Gm), Solanum tuberosum (St) and Brassica napus (Bn).
Gene collinearity analysis is an important approach to understand the evolutionary history of a genome (Lynch and Conery, 2000; Wang et al., 2012). To elucidate the evolutionary history of wheat HSF genes, the collinearity map of TaHSFs was constructed using TBtools (https://github.com/CJ-Chen/TBtools/releases) (Figure 1B). The chromosomal locations were determined by aligning them to the wheat genome database (Ensembl Plants http://plants.ensembl.org/index.html). The results indicated that the TaHSF genes were scattered on all 21 chromosomes with the majority of them located at the terminals. These TaHSFs were not distributed evenly. While eight TaHSFs were located on chromosome 5A, only one was found on each of the chromosomes 1 B, 1 D, 6 A, 6 B, and 6 D. We further analyzed gene duplication events of TaHSFs which revealed that genes belonging to TaHSFA, TaHSFB, and TaHSFC subfamilies might have undergone varying degrees of duplication. Although TaHSFA is the largest subfamily among the three TaHSF subfamilies, only three gene duplication events were observed. TaHSFB and TaHSFC subfamilies had witnessed four and seven gene duplication events, respectively. TaHSFB-5A, 5B, and 5D of the TaHSFB subfamily, as well as TaHSFC1-4, C1-5, and C1-6 were individually derived from one common ancestor gene (Figure 1B).
In wheat, the TaHSFB4 subfamily is comprised of six members scattered on chromosomes 2 and 5 of subgenomes A, B, and D with one copy on each chromosome. Gene duplication event analysis indicated the duplication events within TaHsfB4-2 (TaHsfB4-2A and TaHsfB4-2B) and TaHsfB4-5 (TaHsfB4-5A, TaHsfB4-5B, and TaHsfB4-5D) genes, respectively (Figure 1B). To further explore the evolutionary relationship of TaHSFB4-2B, a phylogenetic tree was constructed using the amino acid sequences of HSFB4s from 8 different plant species, including Dicotyledons: Arabidopsis (Arabidopsis thaliana), soybean (Glycine max), tomato (Solanum lycopersicum), potato (Solanum tuberosum), and rape (Brassica napus) and Monocotyledons: wheat (Triticum aestivum), rice (Oryza sativa), and corn (Zea mayz) (Ensembl plants database, http://plants.ensembl.org/index.html). For the construction of a phylogenetic tree, the amino acid sequences were aligned using the multiple sequence alignment tool with MEGA-X software (Figure 1C). The results showed that TaHSFB4s were clustered in the monocotyledon group, while other HSFB4s were aggregated in the dicotyledon group, suggesting that the evolution of HSFB4s in monocotyledons and dicotyledons was discrepant. These findings were consistent with the results depicted in Figure 1A.
To further study the function of HSFs in Arabidopsis and wheat, the 2 kb region upstream of the start codon of all AtHSFs and TaHSFs genes was analyzed using the PlantCARE database (http://bioinformatics.psb.ugent.be/webtools/plantcare/html/). The following cis-elements responsive to abiotic stresses were chosen; ABA-responsive elements, drought-responsive elements, salt-responsive elements, cold-responsive elements, and heat shock elements (Figure 2). In arabidopsis, most of the AtHSFs promoters contained 1-4 abiotic stress-responsive elements, except AtHSFA8. Of these, AtHSFA1A, AtHSFA7B, AtHSFB2A, and AtHSFC1 contained most of the selected abiotic stress response elements, while AtHSFA1B, AtHSFA1E, AtHSFA6B, and AtHSFA7b contained the maximum element counts (≥10). Among these abiotic stress response elements, the ABA-responsive element was most abundantly found in many AtHSF promoters (Figure 2A).
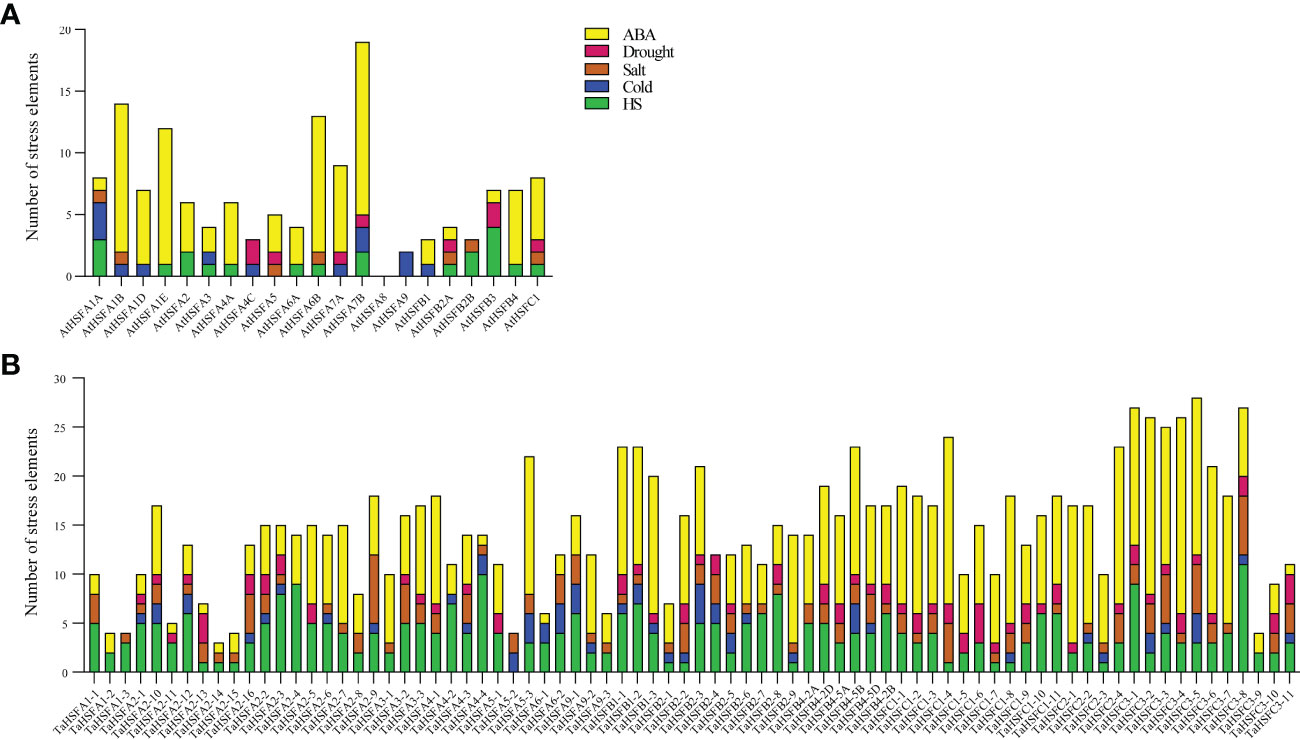
Figure 2 Abiotic stress cis-regulating element counts included in promoters of AtHSFs and TaHSFs. (A) The abiotic stress cis-element counts included in AtHSFs promoters. (B) The abiotic stress cis-element counts included in TaHSFs promoters.
In wheat, all TaHSF promoters contained two to five2 abiotic stress response elements. ABA-responsive elements, heat shock elements, and salt-responsive elements were presented in most of the TaHSF promoters. Of these, ABA-responsive elements and heat shock elements ranked the top two in terms of quantity of the five response elements (Figure 2B). Considering the importance of ABA as one of the major stress-responsive hormones (Mantyla et al., 1995), we speculated that both AtHSFs and TaHSFs might respond to various abiotic stresses through the pathways mediated by ABA-stress responsive elements along with other elements in plants.
To understand the role of HSFs in plant growth, development, and stress tolerance, we obtained their expression patterns in different tissues and response to abiotic stresses from the arabidopsis and wheat transcriptome data (Figures S1, 3). The arabidopsis expression patterns in response to abiotic stresses and wheat expression patterns were based on the public data (Figures S1, 3A) (http://plants.ensembl.org/index.html). The expression profiles of TaHSFs in response to different abiotic stress treatments were investigated in our laboratory (Figure 3B). The expression levels of AtHSFs varied greatly, both in case of one gene among different tissues and different genes in the same tissue in arabidopsis, with exceptions that AtHSF6A, AtHSF6B, and AtHSFB3 showed almost no expression in all tested tissues. While AtHSFA9 was highly expressed only in dry and stage 9 seeds, AtHSFA7B was transcribed moderately in dry seeds, imbibed seeds, and roots, indicating that AtHSFs may perform distinct functions in plant growth and development (Figure S1A). We next analyzed the expression of AtHSFs genes in response to heat shock, cold, NaCl, and mannitol-induced stress. Since ABA is a stress-responsive hormone, the expression analysis of AtHSFs in response to exogenous ABA was also investigated in our study. The expression of most AtHSFs was unaltered by cold, NaCl, or mannitol-induced stress, while transcription of the remaining AtHSFs was mildly suppressed. These observations suggested that only a few AtHSFs are involved in the pathways imparting tolerance to cold, salinity, and mannitol-induced stress in arabidopsis. After heat shock treatment, the expression of AtHSFA2, AtHSFA7A, and AtHSFA7B, especially AtHSFA7B, was significantly increased. In contrast, heat shock treatment repressed the transcription of AtHSFC1 and AtHSFA1A. Further, ABA strongly induced the expression of AtHSFA6A and AtHSFA6B but reduced the expression of AtHSFA3 and AtHSFA7B (Figure S1B). These results indicated that since the expression of AtHSFs varies in response to different abiotic stresses, their function might also have diverged.
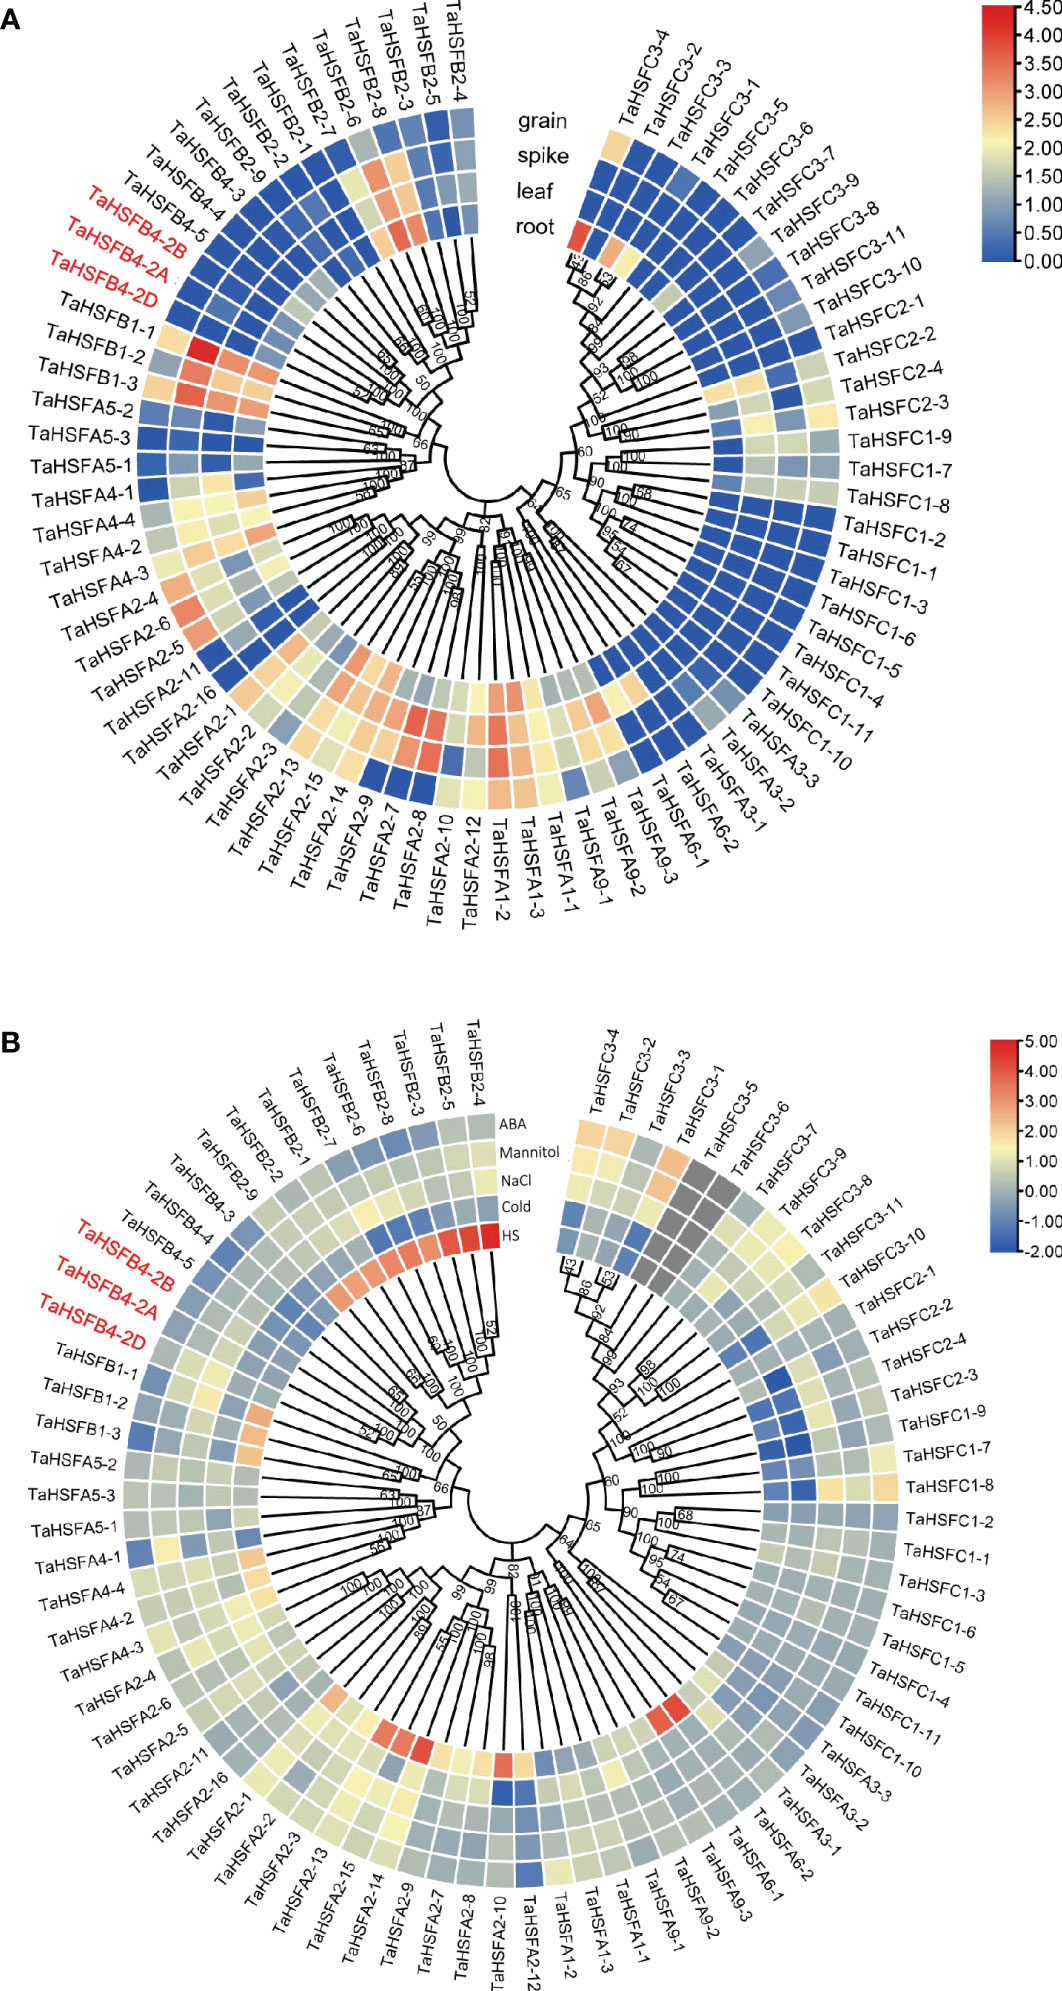
Figure 3 Expression analysis of TaHSFs genes in different tissues and stress treatments. (A) Expression analysis of TaHSFs genes in different tissues based on public data. Bar scale: log2TPM. (B) Expression analysis of TaHSFs genes under different abiotic stress treatments, including heat stress (HS), cold stress (cold), salinity induced stress (NaCl), mannitol-induced dehydration stimulating drought stress (mannitol), and ABA stress (Mittal et al.). Bar scale: log2FC, FC: fold change compared with the mock group.
Unlike AtHSFs, the tissue-specific expression analysis of 34 TaHSFAs indicated that the genes expressed at different levels in all investigated wheat tissues. As an exception, TaHSFA3-1, -2, -3, TaHSFA2, -16, and TaHSFA5-3 expressed at very low or almost non-detectable levels. Most TaHSFCs genes are expressed at low levels in these tissues. Precisely, TaHSFBs, TaHSFB1-1, -2, -3, and TaHSFB2-6, -7, -8 were robustly expressed in root, leaf, and spike. TaHSFB1-1 and -3 were also found to be expressed in grain. Other TaHSFBs did not show expression in the examined tissues (Figure 3A). Only heat shock-induced expression of some TaHSFA and TaHSFB genes, especially TaHSFA2-10, -13, -14, -15, TaHSFA6-1, -2, and TaHSFB2, was observed whose transcription levels were upregulated. On the contrary, cold, NaCl, and mannitol-induced stress and exogenous ABA treatment did not show a strong impact on TaHSFs expression (Figure 3B).
Among the six TaHSFB4s in wheat, including TaHSFB4-2A, TaHSFB4-2B, TaHSFB4-2D, TaHSFB4-5A, TaHSFB4-5B, and TaHSFB4-5D, TaHSFB4-2B exhibited the highest sequence homology with AtHSFB4. Therefore, TaHSFB4-2B was selected for further characterization, and the encoding gene sequence was cloned through homology-based cloning (Figure 4A). In addition, > 90% sequence homology was detected among the wheat homologs of TaHSFB4 on the ABD subgenomes, namely TaHSFB4-2A, TaHSFB4-2B, and TaHSFB4-2D. Moreover, the homology between TaHSFB4-2B and other TaHSFB4s, including TaHSFB4-5A, TaHSFB4-5B, and TaHSFB4-5D, was around 80%, indicating that the TaHSFB4 subfamily was highly conserved in wheat.
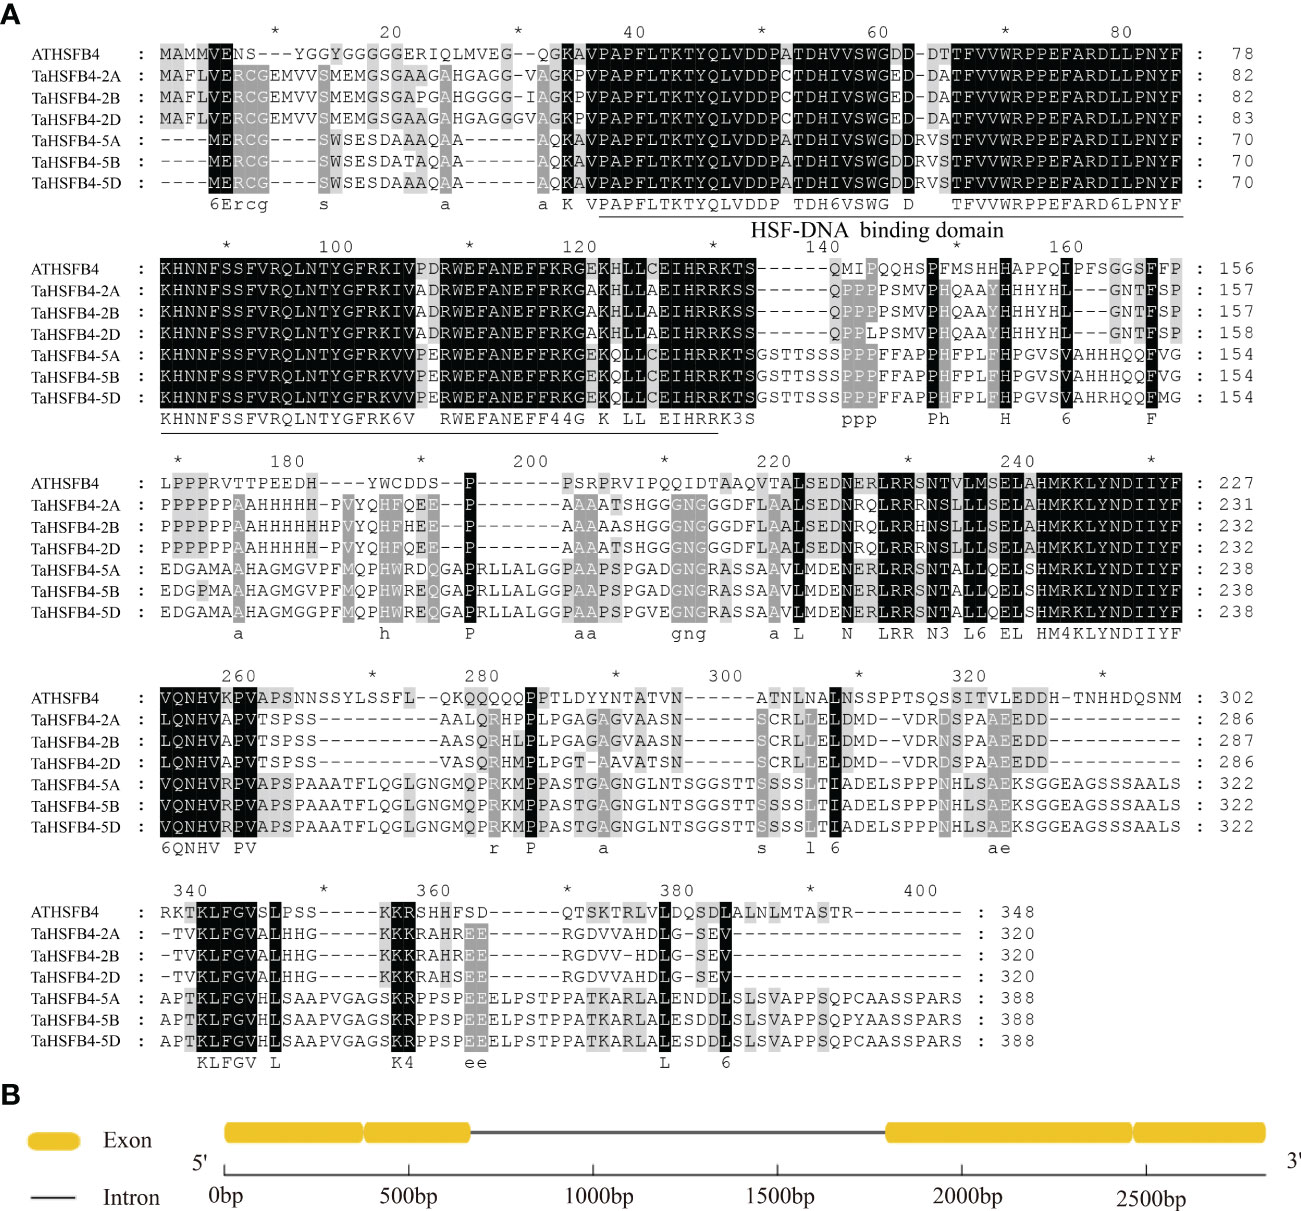
Figure 4 Amino acid sequence alignment of HSFB4s subfamily members. (A) Multiple sequence alignment of predicted amino acid sequence of TaHSFBs and AtHSFB4. Grey represents different degrees of conservation among sequences, black indicates identical residues, white indicates conservative changes. The conserved HSF-DNA binding domain was underlined. (B) TaHSFB4-2B gene sequence structure.
The structure of TaHSFB4-2B is comprised of two exons and one intron (Figure 4B). Coding sequence (CDS) of TaHSFB4-2B contains 963 base pairs (bp), which encodes 320 amino acids. The protein structure prediction indicated that the putative protein contains an HSF-DNA binding domain at the N-terminal (Figure 4A).
Previous studies have shown that TaHSFB4-2B is located in the nucleus (Li-Na et al., 2018). Protein domain prediction also indicated that TaHSFB4-2B is a transcription factor with an HSF-DNA binding domain, that is putatively localized in the nucleus. To investigate the subcellular localization of TaHSFB4-2B, the cassette encoding TaHSFB4-2B-Green Fluorescent protein (GFP) fusion protein driven by the CaMV 35S promoter (35S::TaHSFB4-2B-GFP) was transformed into wheat and Arabidopsis protoplast or Nicotiana benthamiana leaves, and the fluorescence was observed using the confocal microscope. Results indicated that TaHSFB4-2B-GFP was localized in the nucleus and showed co-localization with nuclear marker mChery-IMP4 (Figures 5A, S4). In addition, TaHSFB4-2B nuclear localization was also proved by visualization of TaHSFB4-2B-GFP in transgenic Arabidopsis seedlings (Figure S3).
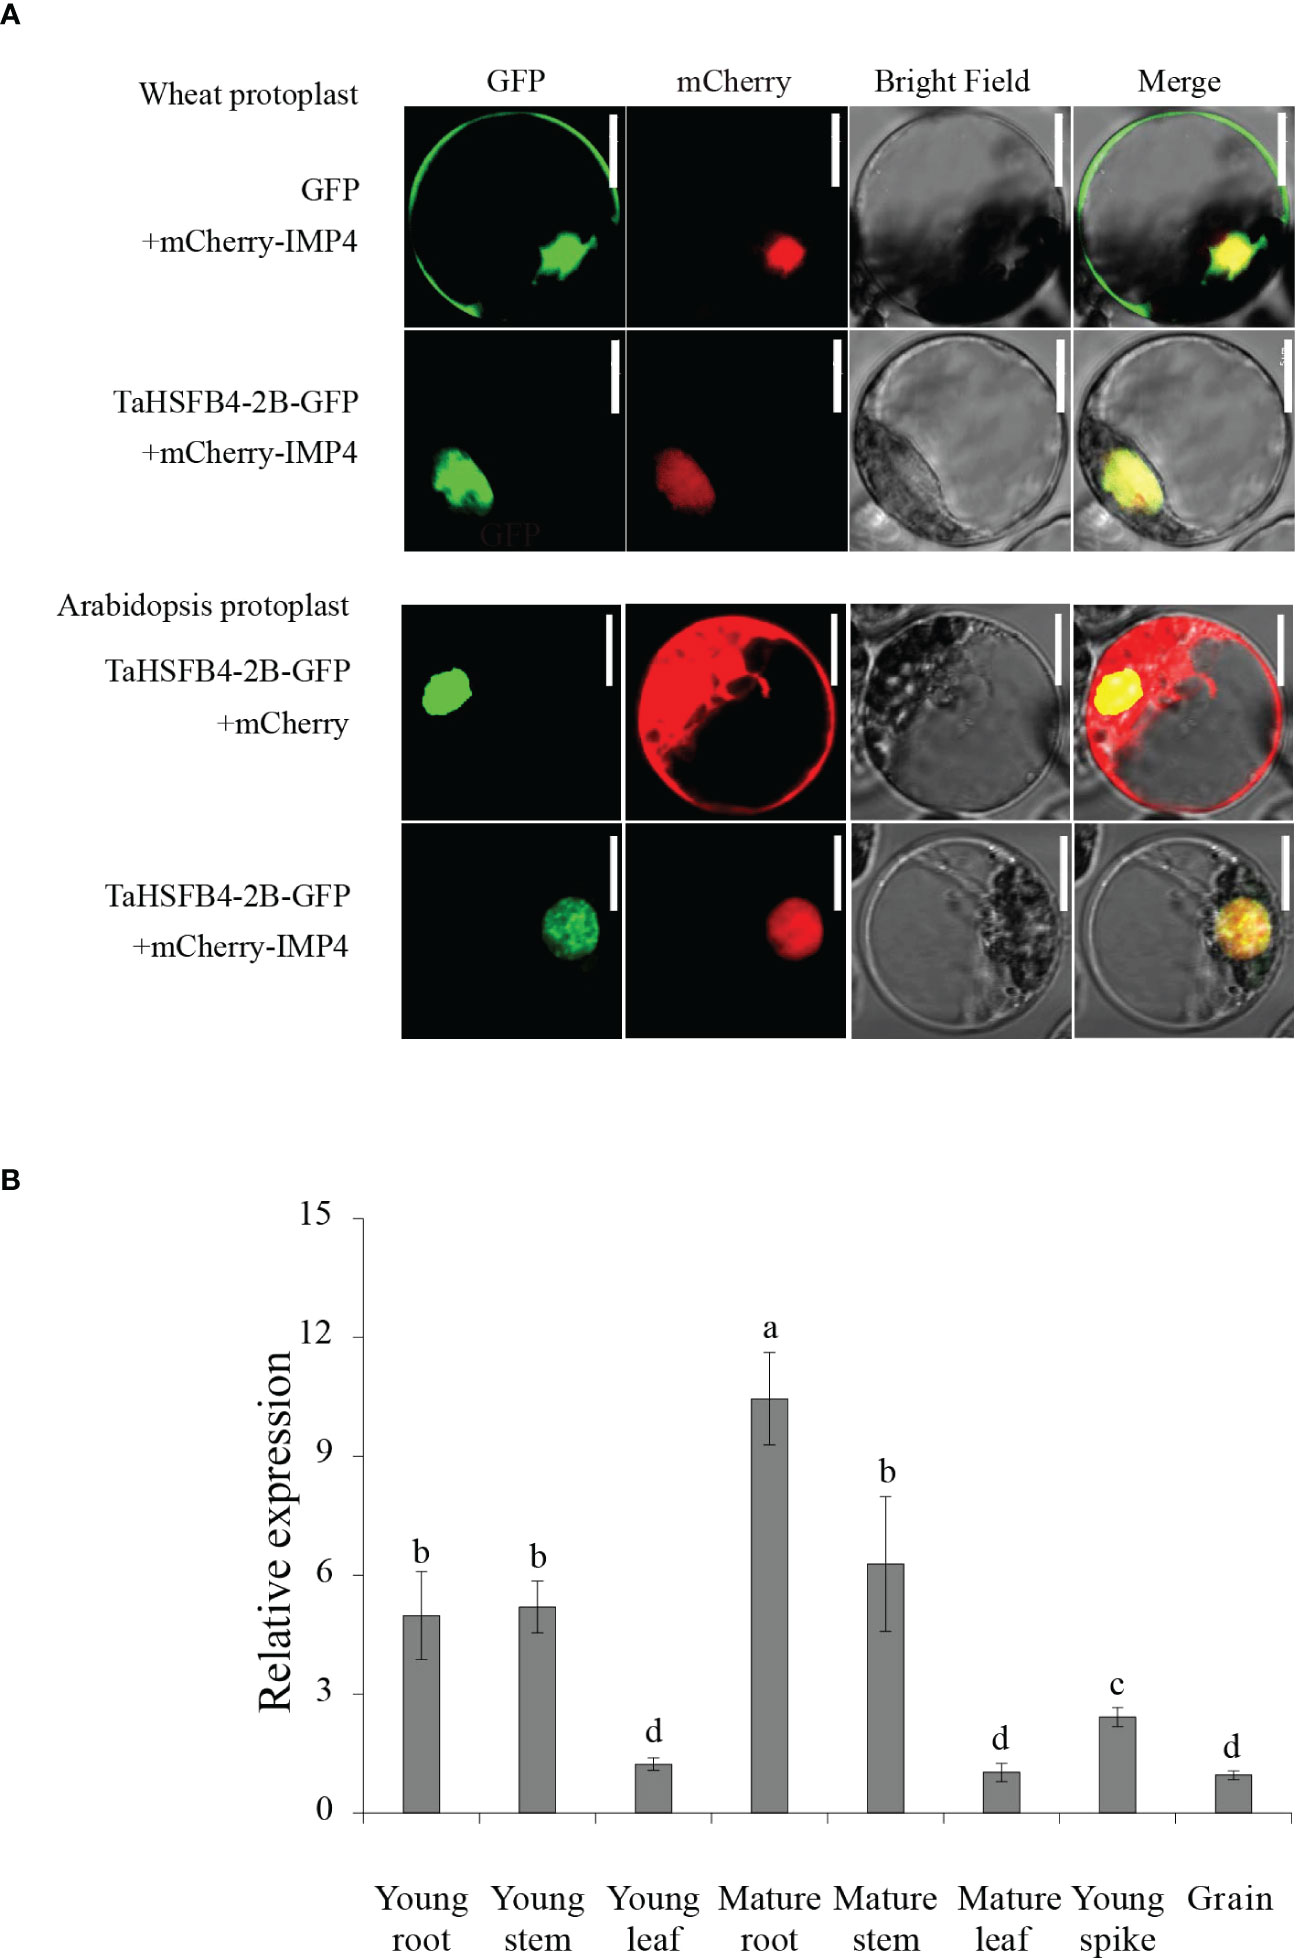
Figure 5 TaHSFB4-2B subcellular localization in Triticum aestivum and Arabidopsis thaliana protoplast and TaHSFB4-2B tissue specific expression profiles. (A) TaHSFB4-2B Subcellular localization in Triticum aestivum and Arabidopsis thaliana protoplast. mCherry-IMP4 was used as nuclear marker. Row 1: Free GFP and mCherry-IMP4 were transiently expressed in Triticum aestivum protoplast; Row 2: TaHSFB4-2B-GFP and mCherry-IMP4 were transiently expressed in Triticum aestivum protoplast; Row 3: TaHSFB4-2B-GFP and free mCherry were transiently expressed in Arabidopsis thaliana protoplast; Row 4: TaHSFB4-2B-GFP and mCherry-IMP4 were transiently expressed in Arabidopsis thaliana protoplast. Green channel: GFP fluorescence signals; Red channel: mCherry fluorescence signals; Scale bar: 10 μm. (B) TaHSFB4-2B tissue specific expression profiles in wheat. The young root, mature root, young stem, mature stem, young leaf, mature leaf, young spike and grain of wheat at different growth stages were sampled the transcription levels of TaHSFB4-2B were measured by RT-qPCR. The transcription level of TaHSFB4-2B was normalized with TaACTIN. Values are Mean ± SD, n=3. a, b, c and d indicate the statistical differences between different tissues determined by LSD (P < 0.05) of variance (ANOVA) method. Same letters: no significant difference, and different letters: significant difference between the two groups.
Gene function is largely affected by its specific location of expression in the whole plant. Depending on the tissue-specific expression analysis in wheat, TaHSFB4-2B was found to be moderately expressed in wheat roots but barely expressed in the leaf, spike, and grain (Figure 3A). To further validate and determine the tissue-specific expression of TaHSFB4-2B, samples of the young root, mature root, young stem, mature stem, young leaf, mature leaf, young spike, and young seed were collected, and the transcription levels of TaHSFB4-2B were measured by real-time quantitative reverse transcription PCR (RT-qPCR). TaHSFB4-2B transcript was expressed in all the tissues with various expression levels (Figure 5B). The highest transcription level was in the mature root, followed by the mature stem, young stem, and young root, and the lowest was found in the mature leaf. This was consistent with the results of the tissue-specific analysis (Figure 3A).
Wheat seedlings exposed to NaCl and mannitol showed increased transcription of TaHSFB4-2B, while heat shock, cold, and ABA treatment exerted little effect on TaHSFB4-2B expression (Figure 3B). To verify the results, we performed RT-qPCR analysis of TaHSFB4-2B in seedlings treated with heat shock (37°C), cold (4°C), salinity stress (200 mM NaCl), and mannitol treatment (300 mM mannitol). Heat shock and cold treatment induced the transcription of TaHSFB4-2B in both the young leaf and root (Figures 6A, B). Though the expression of TaHSFB4-2B was also induced by salinity stress in both leaves and roots, the time course reaching the peak level was discrepant (Figure 6C). After mannitol-induced drought treatment, the expression of TaHSFB4-2B was down-regulated in young leaf, but up-regulated in the young root (Figure 6D). In brief, our results indicated that Heat Shock, Cold, NaCl, and mannitol treatments induced the expression of TaHSFB4-2B in young root and the young leaf of wheat, while TaHSFB4-2B transcription level was repressed in young leaf with mannitol treatment.
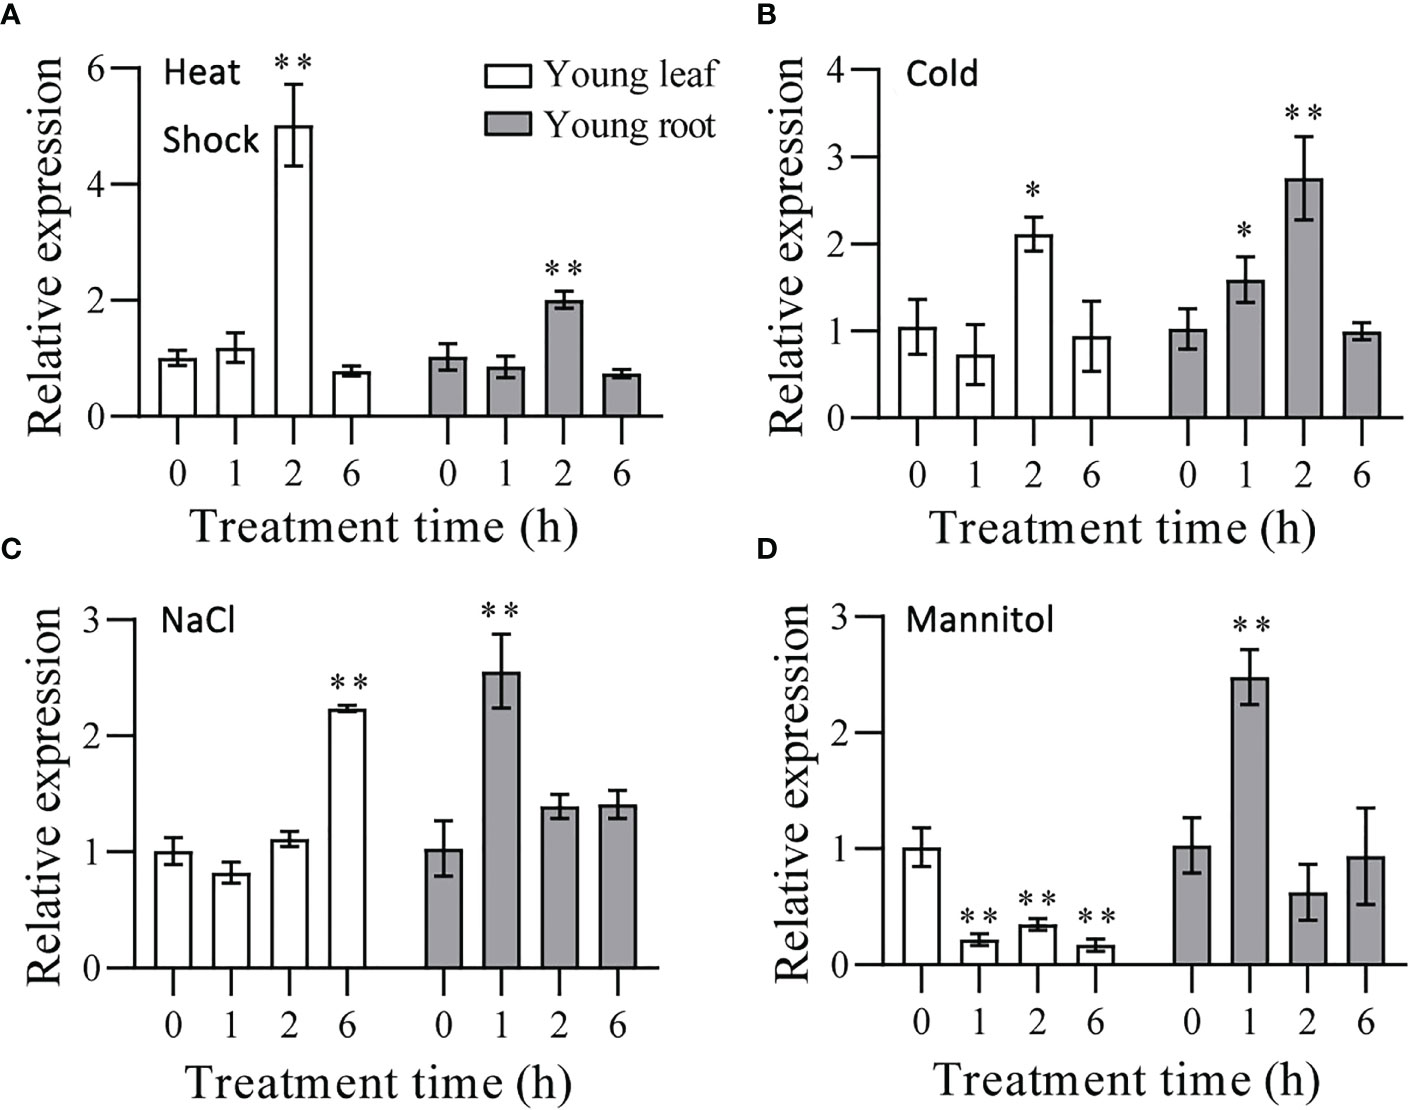
Figure 6 Expression levels of TaHSFB4-2B in wheat seedlings young leaf and young root of wheat under abiotic stress. (A) Wheat seedlings growing for 14 d after germination were treated under high temperature (37°C). (B) Cold stress (4°C). (C) NaCl induced stress (200 mM NaCl). (D) mannitol-induced dehydration stimulating drought stress (300 mM mannitol). Young leaf and young root were sampled after 0, 1, 2, and 6h of each treatment and the transcription levels of TaHSFB4-2B were quantified by RT-qPCR. The transcription level of TaHSFB4-2B was normalized with TaACTIN. Values are Mean ± SD, n=3. *P < 0.05 and **P < 0.01 (Student’s t-test).
To elucidate the biological function of TaHSFB4-2B in response to abiotic stresses, 35S::TaHSFB4-2B-GFP cascade was constructed and transformed into arabidopsis using Agrobacterium. Transgenic lines (TaHSFB4-2B-OEs) were genotyped by PCR amplification (Figure S2A) and the expression level of TaHSFB4-2B was quantified by RT-qPCR (Figure S2B). Subsequently, low (OE-1), medium (OE-3), and high (OE-5) expression lines were selected for further research. Visualization of GFP fusion protein signals under a confocal microscope verified the expression and nucleus localization of TaHSFB4-2B (Figure S3). The phenotyping results indicated that overexpression of TaHSFB4-2B had no discernible effect on plant growth and development under normal conditions (Figures 7A, G).
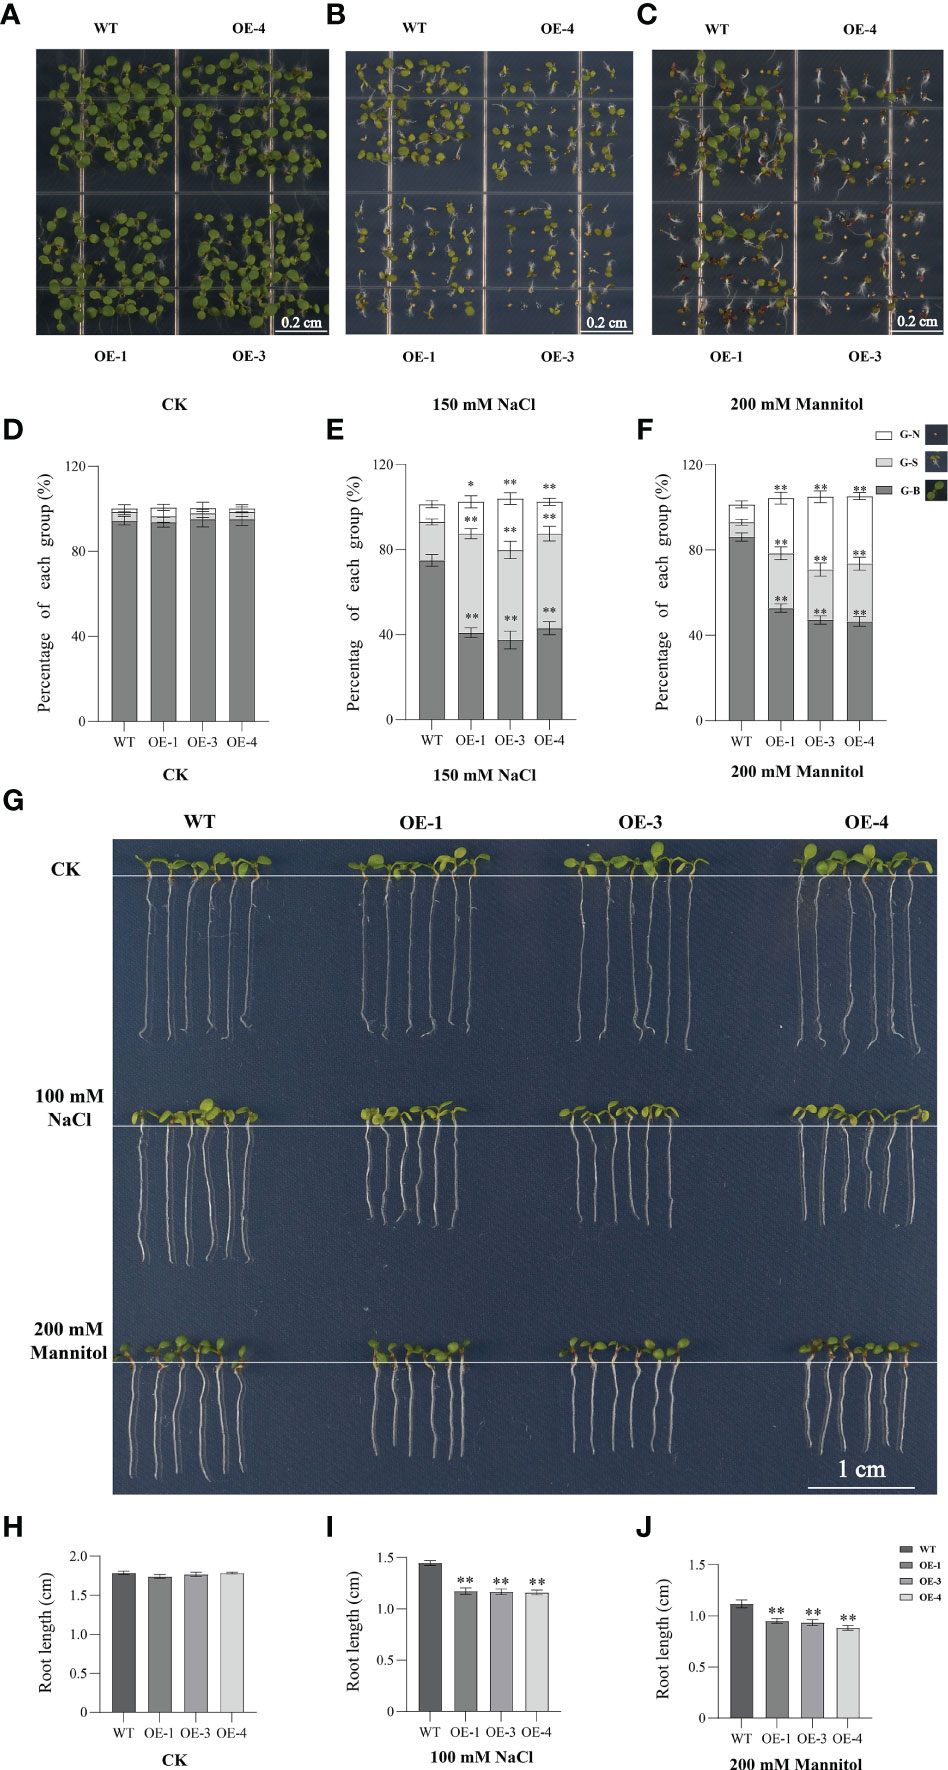
Figure 7 Overexpression of TaHSFB4-2B negatively regulates NaCl, and mannitol induced stress tolerance of arabidopsis. (A–C) Seeds of WT and TaHSFB4-2B overexpression lines of arabidopsis (OE-1, OE-3 and OE-4) were sterilized and plated on 1/2 Murashige and Skoog medium (1/2 MS) plates or with 150 mM NaCl or with 200 mM mannitol and growing for 10 days. (D, E) The seed germination rates and growth under corresponding treatment were quantified. (G–J) Root phenotypes of wild type and OE-1, OE-3 and OE-4 lines were shown and root length was measured and quantified. G-N、G-S and G-B represent ungerminated seeds, inhibited-growing seedlings and normal-growing seedlings respectively. Values are Mean ± SD, n=3. *P < 0.05 and **P < 0.01 (Student’s t-test).
To explore the function of TaHSFB4-2B under salinity and mannitol-induced drought stresses, WT and TaHSFB4-2B-OE seedlings were continuously grown on 1/2 MS plates with or without NaCl (150 mM) or mannitol (200 mM) for 10 days. Then the seed germination rates were calculated and root length was measured (Figure 7). Both NaCl and mannitol treatment decreased the seed germination and root length in WT as well as TaHSFB4-2B-OE lines. Moreover, TaHSFB4-2B-OE lines were more sensitive to NaCl and mannitol exposure than WT (Figure 7). Compared to the WT, NaCl treatment reduced seed germination in TaHSFB4-2B-OE lines by 18.1 to 42.4% (Figures 7A, B, D, E); while the root was decreased by 16.2 to 19.0% in the transgenic lines (Figures 7G–I). Similar phenotypes related to seed germination and root length were observed with mannitol treatment (Figures 7A, C, F–H, J). These results indicated that both NaCl and mannitol treatment negatively affect seed germination and root length in arabidopsis, and TaHSFB4-2B-OE lines were more sensitive to both NaCl and mannitol-induced stress than WT.
Since overexpression of TaHSFB4-2B repressed the tolerance of arabidopsis to mannitol and NaCl-induced stresses, RT-qPCR analysis was performed to quantify the transcription levels of abiotic stress-induced genes, including AtHSP17.8, AtHSP17.6A, AtHSP17.6B, AtHSP17.6C, SOS1, and CAT2. Since TaHSFB4-2B is a heat shock factor, expression analysis of small heat shock proteins, including AtHSP17.8, AtHSP17.6A, AtHSP17.6B, and AtHSP17.6C, was also performed. The results showed that the transcription of four small HSPs was down-regulated in TaHSFB4-2B-OE lines in mock groups (CK), but up-regulated with NaCl treatment (Figures 8A, B). With mannitol treatment, only the expression of AtHSP17.6B was increased in TaHSFB4-2B-OE lines compared to WT, while the expression levels of AtHSP17.8, AtHSP17.6A, and AtHSP17.6C were unaffected (Figure 8C). Overexpression of TaHSFB4-2B induced the expression of CAT2 and SOS1 genes in arabidopsis. In contrast, expression levels of CAT2 and SOS1 were reduced when exposed to NaCl or mannitol, except SOS1 expression with mannitol treatment (Figure 8).
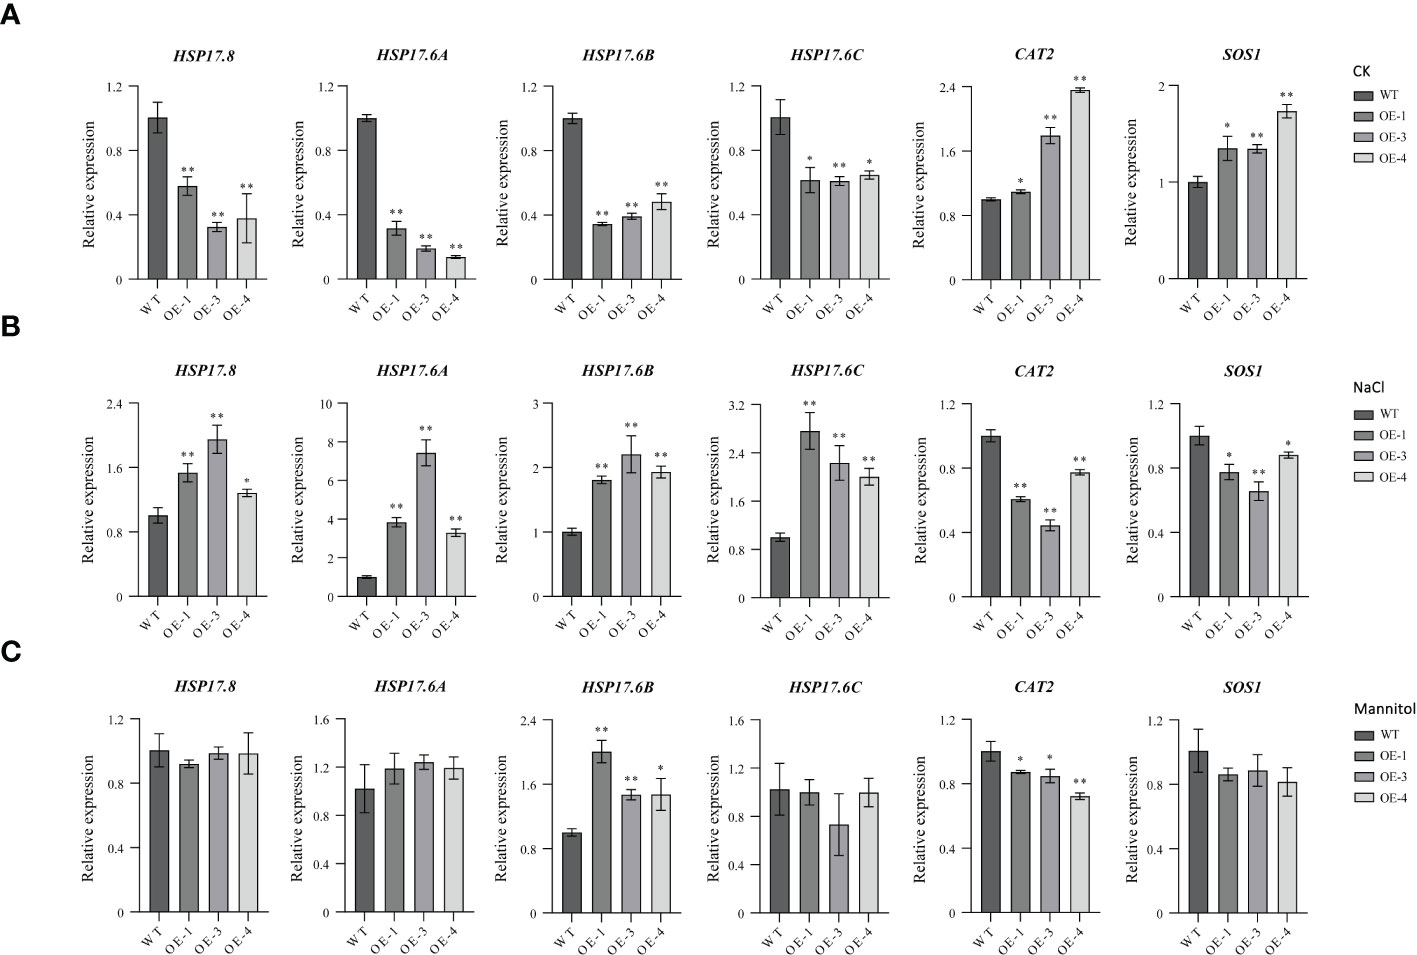
Figure 8 Expression analyses of abiotic stress related genes in WT and TaHSFB4-2B-OE lines under different abiotic stress. Seeds of WT and TaHSFB4-2B over expression lines of arabidopsis (OE-1, OE-3 and OE-4) were growing and treated and use method described in Figure 7. (A) Transcription levels of AtHSP17.8, AtHSP17.6A, AtHSP17.6B, AtHSP17.6C, CAT2 and SOS1 growing under normal condition (CK), (B) NaCl treatment (100 mM NaCl), (C) mannitol treatment (200 mM mannitol) were quantified by RT-qPCR. The transcription level of TaHSFB4-2B was normalized with AtACTIN2. Values are Mean ± SD, n=3. *P < 0.05 and **P < 0.01 (Student’s t-test).
Heat shock transcription factors (HSFAs, HSFBs, and HSFCs) are multifunctional genes engaged in plant growth and development as well as abiotic stress responses (Kotak et al., 2007; Lin et al., 2011; Scharf et al., 2012). The numbers of HSF gene family members showed a large variation with 78, 31, 21, and 26 in wheat, maize, arabidopsis and tomato, respectively. The phylogenetic relationship of corresponding homologous proteins within each subfamily was closer within monocotyledon or dicotyledon plants than between the both (Figure 1A). In different plants, HSF genes experienced extensive duplication and sequence variation during evolution, indicating that HSFs perform conserved and diverged functions in plants (Figure 1B). Analysis of abiotic stress-associated cis-elements in AtHSF and TaHSF promoters revealed the presence of one or more cis-elements responsive to ABA, NaCl, mannitol, cold, and/or heat shock. The ABA-responsive elements were present in most of the AtHSF and TaHSF promoters. Interestingly, TaHSF promoters contain heat shock and salt response elements at a higher proportion than those of AtHSFs (Figure 2). We speculate that regulation of HSFs in different plants shows certain conservation, and at the same time, variations have evolved. Therefore, the expression of HSF genes varies in different tissues or at developmental stages in both arabidopsis and wheat. The majority of both arabidopsis and wheat HSFA genes showed robust transcription in tested tissues at different stages. However, TaHSFBs and TaHSFCs exhibited very low expression in most of the conditions (Figures S1A, 3A). We infer that HSFAs function more extensively and actively compared to HSFBs and HSFCs in plant development and growth.
Phylogenetic analysis classified HSFB4s from monocotyledons and dicotyledons into different groups (Figure 1C). Sequence similarity analysis indicated that TaHSFB4s did not share significant similarity with ATHSFB4 (Figure 4A). We speculate that the biological function of these TaHSFB4s are conserved in wheat, but may differ from dicotyledons. Previous studies and our expression pattern analysis showed that AtHSFB4 and TaHSFB4s expressed extensively in different tissues (Figures S1A, 3A) (Xue et al., 2014). In this study, TaHSFB4-2B was cloned from the wheat variety Chinese Spring using a homology-based cloning method. Tissue-specific expression analysis using RT-qPCR showed that TaHSFB4-2B was expressed in the root, stem, leaf, young spike, and the young seed of wheat, and the transcription level varied in different tissues (Figure 5B). These observations highlighted that TaHSFB4-2B may function in the whole plant and at different stages throughout the wheat life cycle. TaHSFB4-2B was found to be localized in the nucleus (Figure 5A) and harbored an HSF-DNA binding domain (Figure 4A). However, TaHSFB4-2B lacks a transcriptional activation domain, therefore, we suspect that TaHSFB4-2B probably interacts with other proteins to regulate the transcription of downstream genes.
A big number of AtHSFs and TaHSFs were greatly induced by heat shock treatment. Heat shock, cold, NaCl, mannitol, and ABA treatment moderately induced the expression of AtHSFBs in arabidopsis, including AtHSFB4 (Figures S1B, 3B). Recent studies have also indicated that TaHSFs, including TaHSFB4, play a key role in enhancing tolerance to various abiotic stresses (Duan et al., 2019; Duan et al., 2019). Our results showed the upregulated transcription of TaHSFB4-2B under the above-mentioned abiotic stress treatments (except in leaf under mock drought stress), substantiating that TaHSFB4-2B is involved in abiotic stress responses (Figure 6).
Earlier, significant differences have been observed in the functions of HSFs in different plants. Overexpression of OsHSFB2b in transgenic arabidopsis reduces salt and drought tolerance, while overexpression of CarHSFB2 significantly improves heat and drought tolerance (Ma et al., 2015). Ectopic expression of wheat TaHSF3 in arabidopsis. improved heat and cold tolerance in transgenic plants (Zhang et al., 2012). In arabidopsis, AtHsfB4 was been reported in regulating root development, and had few effects in stress responses (Begum et al., 2013). In our research, we also found the AtHsfB4 expression was barely induced by stress treatment in arabidopsis (Figure S1). On the other hand, the wheat TaHsB4 expression was elevated by drought and salinity (Figure 3). Consist with this, our research indicated that the ectopic over expression of wheat TaHsfB4 showed no difference in root at normal condition (Figure 7). Then we tried to check the resistance of TaHSFB4-2B-GFP overexpression line in arabidopsis under mannitol and salinity condition. The seed germination rate of TaHSFB4-2B-OE lines was significantly reduced and the root length was shortened under NaCl and mannitol-induced stress (Figure 7). Taken together, overexpression of TaHSFB4-2B negatively regulates the salinity and mannitol-induced drought tolerance in arabidopsis.
The decreased transcription levels of CAT2 and SOS1 in TaHSFB4-2B-OE lines under salinity and mannitol-induced drought stress were consistent with the phenotypes (Figures 8B, C). HSPs are by far the most complex heat shock proteins in plants. Due to their abundance and diversity, HSPs play an important role in plant stress tolerance. Plant HSFs regulate the expression of HSPs in response to abiotic stress (Nover et al., 1996). Overexpression of Agrostis stolonifera HSP17 reduced NaCl and mannitol-induced dehydration stimulating drought tolerance in arabidopsis, suggesting that excessive AsHSP17 itself is a repressor of salt and drought stress response (Sun et al., 2016). Overexpression of AtHSP17.8 in arabidopsis and Lactuca sativa resulted in hypersensitivity to ABA and enhanced tolerance to mannitol and NaCl-induced stresses (Kim et al., 2013). In the current study, we found that in TaHSFB4-2B-OE lines, the transcription levels of AtHSP17.8, AtHSP17.6A, AtHSP17.6B, and AtHSP17.6C were significantly up-regulated under NaCl-induced salinity stress (Figure 8B). While, under mannitol-induced stress, only the expression of AtHSP17.6B was increased, transcription levels of AtHSP17.8, AtHSP17.6A, and AtHSP17.6C were unaffected (Figure 8C). These observations manifested that AtHSP17.8, AtHSP17.6A, and AtHSP17.6C participate in plant response to salinity stress, and AtHSP17.6B is involved in tolerance to both salinity and mannitol-induced stresses.
Surprisingly, the expression of AtHSP17.8, AtHSP17.6A, AtHSP17.6C, CAT2, and SOS1 in our study showed contrasting profiles between normal and stress conditions (Except for the expression of AtHSP17.8, AtHSP17.6A, and AtHSP17.6C under drought stress, which showed similar transcription level in both normal and drought stress conditions) (Figure 8). Considering the observation that TaHSFB4-2B is a transcription factor without the transcriptional activation activity, it should interact with other proteins to regulate the expression of downstream genes. It is speculated that TaHSFB4-2B combines different regulatory factors under different environmental stimuli to affect gene expression. It is interesting to further screen these regulatory factors and study the mechanism underlying gene expression regulation in the future.
The evolutionary analysis revealed that it is clustered in a group with monocotyledons. The results of the laser scanning confocal microscope showed that TaHSFB4-2B was located in the nucleus. Tissue-specific expression analysis indicated that the transcription level of TaHSFB4-2B was higher in roots and stems and relatively lower in leaves. Overall, our study demonstrated that the TaHSFB4-2B gene responds to high temperature, cold, salinity, and mannitol-induced drought stress. Overexpression of TaHSFB4-2B reduced the salinity and mannitol-induced drought stress tolerance in transgenic arabidopsis and affected the expression of abiotic stress-related genes. We propose that TaHSFB4-2B functions as a negative factor to abiotic stress tolerance in plants, especially to NaCl and mannitol-induced stresses. The biological function of TaHSFB4-2B in abiotic stress response and the underlying mechanism deserves detailed study.
The data presented in the study are deposited in the NCBI repository, accession numbers SAMN31092595 - SAMN31092606.
JG and XZ conceptualized the study. XZ, JG and ZZ designed the project and supervised the study. LY and YZ performed most of the experiment and material preparation. JyY and CW performed part of the experiment and offered help with manuscript revision. SL and LJ performed data analyses and interpretation. JhY and LS participated in some experiment. LZ and YS guided part of experiment and data analyses. LY prepared the draft of the manuscript, JG and XZ revised the manuscript and figures. All authors contributed to the article and approved the submitted version.
This research was supported by the 2022 International Training Program for high-level Talents of Henan Province (No. 30602056), the Henan Province Science and Technology Attack Project (No. 222102110465), Supported by Science and Technology Innovation Funds of Henan Agricultural University (No. KJCX2021A01)
The authors are grateful to all lab members for their useful suggestions, support, and encouragement. We thank Bullet Edits Limited for the linguistic editing and proofreading of the manuscript.
The authors declare that the research was conducted in the absence of any commercial or financial relationships that could be construed as a potential conflict of interest.
All claims expressed in this article are solely those of the authors and do not necessarily represent those of their affiliated organizations, or those of the publisher, the editors and the reviewers. Any product that may be evaluated in this article, or claim that may be made by its manufacturer, is not guaranteed or endorsed by the publisher.
The Supplementary Material for this article can be found online at: https://www.frontiersin.org/articles/10.3389/fpls.2022.1047400/full#supplementary-material
Supplementary Figure 1 | Expression analysis of AtHSFs genes in different tissues of different developmental stages and stress treatments based on public data. (A) Expression analysis of AtHSF genes in different tissues at different stages. Bar scale: log2TPM. (B) Expression analysis of AtHSF genes under different abiotic stress treatments, including heat shock stress (HS), cold stress (cold), NaCl induced stress (NaCl), mannitol induced stress (mannitol), and ABA stress (Mittal et al.). Bar scale: log2FC, FC: fold change compared with mock group.
Supplementary Figure 2 | Genotyping of TaHSFB4-2B overexpressing plants. (A) PCR genotyping of TaHSFB4-2B overexpressing lines with TaHSFB4-2B specific primers. (B) RT-qPCR analysis of TaHSFB4-2B transcription level in wild type and TaHSFB4-2B overexpressing lines of Arabidopsis. OE-1, OE-2, OE-3, OE-4, OE-5 indicate different transgenic lines overexpressing TaHSFB4-2B.
Supplementary Figure 3 | Fluorescence microscopic observation of root of five transgenic Arabidopsis lines. Scale: 20 μm.
Supplementary Figure 4 | TaHSFB4-2B subcellular localization in Nicotiana Benthamiana leaf. mCherry-IMP4 was used as nuclear marker. TaHSFB4-2B-GFP fusion protein driven by the CaMV35S promoter was transiently expressed in Nicotiana Benthamiana leaf. Green channel: GFP fluorescence signals. Red channel: mCherry fluorescence signals. Scale bar: 20 μm.
Baniwal, S. K., Bharti, K., Chan, K. Y., Fauth, M., Ganguli, A., Kotak, S., et al. (2004). Heat stress response in plants: a complex game with chaperones and more than twenty heat stress transcription factors. J. Biosci. 29, 471–487. doi: 10.1007/BF02712120
Barnes, A. C., Elowsky, C. G., Roston, R. L. (2019). An arabidopsis protoplast isolation method reduces cytosolic acidification and activation of the chloroplast stress sensor SENSITIVE TO FREEZING 2. Plant Signal Behav. 14, 1629270. doi: 10.1080/15592324.2019.1629270
Begum, T., Reuter, R., Schoffl, F. (2013). Overexpression of AtHsfB4 induces specific effects on root development of arabidopsis. Mech. Dev. 130, 54–60. doi: 10.1016/j.mod.2012.05.008
Cook, D., Fowler, S., Fiehn, O., Thomashow, M. F. (2004). A prominent role for the CBF cold response pathway in configuring the low-temperature metabolome of arabidopsis. Proc. Natl. Acad. Sci. U.S.A. 101, 15243–15248. doi: 10.1073/pnas.0406069101
Czarnecka-Verner, E., Pan, S., Salem, T., Gurley, W. B. (2004). Plant class b HSFs inhibit transcription and exhibit affinity for TFIIB and TBP. Plant Mol. Biol. 56, 57–75. doi: 10.1007/s11103-004-2307-3
Duan, S., Liu, B., Zhang, Y., Li, G., Guo, X. (2019). Genome-wide identification and abiotic stress-responsive pattern of heat shock transcription factor family in triticum aestivum l. BMC Genomics 20, 257. doi: 10.1186/s12864-019-5617-1
Gupta, A., Rico-Medina, A., Caño-Delgado, A. I. (2020). The physiology of plant responses to drought. Science 368, 266–269. doi: 10.1126/science.aaz7614
Haider, S., Raza, A., Iqbal, J., Shaukat, M., Mahmood, T. (2022). Analyzing the regulatory role of heat shock transcription factors in plant heat stress tolerance: a brief appraisal. Mol. Biol. Rep. 49, 5771–5785. doi: 10.1007/s11033-022-07190-x
Ikeda, M., Mitsuda, N., Ohme-Takagi, M. (2011). Arabidopsis HsfB1 and HsfB2b act as repressors of the expression of heat-inducible hsfs but positively regulate the acquired thermotolerance. Plant Physiol. 157, 1243–1254. doi: 10.1104/pp.111.179036
Kaplan, F., Kopka, J., Haskell, D. W., Zhao, W., Schiller, K. C., Gatzke, N., et al. (2004). Exploring the temperature-stress metabolome of arabidopsis. Plant Physiol. 136, 4159–4168. doi: 10.1104/pp.104.052142
Kim, D. H., Xu, Z. Y., Hwang, I. (2013). AtHSP17.8 overexpression in transgenic lettuce gives rise to dehydration and salt stress resistance phenotypes through modulation of ABA-mediated signaling. Plant Cell Rep. 32, 1953–1963. doi: 10.1007/s00299-013-1506-2
Kotak, S., Larkindale, J., Lee, U., von Koskull-Doring, P., Vierling, E., Scharf, K. D. (2007). Complexity of the heat stress response in plants. Curr. Opin. Plant Biol. 10, 310–316. doi: 10.1016/j.pbi.2007.04.011
Li-Na, Z., Zi-Hui, L., Shuo-Nan, D., Yuan-Yuan, Z., Guo-Liang, L., Xiu-Lin, G. (2018). Cloning and characterization of heat shock transcription factor gene TaHsfB2d and its regulating role in thermotolerance. Acta Agron. Sin. 44, 53–62. doi: 10.3724/SP.J.1006.2018.00053
Lin, Y. X., Jiang, H. Y., Chu, Z. X., Tang, X. L., Zhu, S. W., Cheng, B. J. (2011). Genome-wide identification, classification and analysis of heat shock transcription factor family in maize. BMC Genomics 12, 76–90. doi: 10.1186/1471-2164-12-76
Lynch, M., Conery, J. S. (2000). The evolutionary fate and consequences of duplicate genes. Science 290, 1151–1155. doi: 10.1126/science.290.5494.1151
Mantyla, E., Lang, V., Palva, E. T. (1995). Role of abscisic acid in drought-induced freezing tolerance, cold acclimation, and accumulation of LT178 and RAB18 proteins in arabidopsis thaliana. Plant Physiol. 107, 141–148. doi: 10.1104/pp.107.1.141
Ma, H., Wang, C., Yang, B., Cheng, H., Ma, L. (2015). CarHSFB2, a class b heat shock transcription factor, is involved in different developmental processes and various stress responses in chickpea (Cicer arietinum l.). Plant Mol. Biol. Rep. 34, 1–14. doi: 10.1007/s11105-015-0892-8
Mittal, D., Chakrabarti, S., Sarkar, A., Singh, A., Grover, A. (2009). Heat shock factor gene family in rice: genomic organization and transcript expression profiling in response to high temperature, low temperature and oxidative stresses. Plant Physiol. Biochem. 47, 785–795. doi: 10.1016/j.plaphy.2009.05.003
Mylona, P., Linstead, P., Martienssen, R., Dolan, L. (2002). SCHIZORIZA controls an asymmetric cell division and restricts epidermal identity in the arabidopsis root. Development 129, 4327–4334. doi: 10.1242/dev.129.18.4327
Nover, L., Bharti, K., Döring, P., Mishra, S. K., Ganguli, A., Scharf, K. D. (2001). Arabidopsis and the heat stress transcription factor world: how many heat stress transcription factors do we need? Cell Stress Chaperon 6, 177–189. doi: 10.1379/1466-1268(2001)006<0177:aathst>2.0.co;2
Nover, L., Scharf, K. D., Gagliardi, D., Vergne, P., Czarnecka-Verner, E., Gurley, W. B. (1996). The hsf world: classification and properties of plant heat stress transcription factors. Cell Stress Chaperones 1, 215–223. doi: 10.1379/1466-1268(1996)001<0215:thwcap>2.3.co;2
Scharf, K. D., Berberich, T., Ebersberger, I., Nover, L. (2012). The plant heat stress transcription factor (Hsf) family: structure, function and evolution. Biochim. Biophys. Acta 1819, 104–119. doi: 10.1016/j.bbagrm.2011.10.002
Schlenker, W., Roberts, M. J. (2009). Nonlinear temperature effects indicate severe damages to US crop yields under climate change. P Natl. Acad. Sci. U.S.A. 106, 15594–15598. doi: 10.1073/pnas.0906865106
Sun, X., Sun, C., Li, Z., Hu, Q., Han, L., Luo, H. (2016). AsHSP17, a creeping bentgrass small heat shock protein modulates plant photosynthesis and ABA-dependent and independent signalling to attenuate plant response to abiotic stress. Plant Cell Environ. 39, 1320–1337. doi: 10.1111/pce.12683
ten Hove, C. A., Willemsen, V., de Vries, W. J., van Dijken, A., Scheres, B., Heidstra, R. (2010). SCHIZORIZA encodes a nuclear factor regulating asymmetry of stem cell divisions in the arabidopsis root. Curr. Biol. 20, 452–457. doi: 10.1016/j.cub.2010.01.018
von Koskull-Doring, P., Scharf, K. D., Nover, L. (2007). The diversity of plant heat stress transcription factors. Trends Plant Sci. 12, 452–457. doi: 10.1016/j.tplants.2007.08.014
Wang, Y., Tang, H., Debarry, J. D., Tan, X., Li, J., Wang, X., et al. (2012). MCScanX: a toolkit for detection and evolutionary analysis of gene synteny and collinearity. Nucleic Acids Res. 40, e49. doi: 10.1093/nar/gkr1293
Xue, G. P., Sadat, S., Drenth, J., McIntyre, C. L. (2014). The heat shock factor family from triticum aestivum in response to heat and other major abiotic stresses and their role in regulation of heat shock protein genes. J. Exp. Bot. 65, 539–557. doi: 10.1093/jxb/ert399
Yang, W., Ju, Y., Zuo, L., Shang, L., Li, X., Li, X., et al. (2020). OsHsfB4d binds the promoter and regulates the expression of OsHsp18.0-CI to resistant against xanthomonas oryzae. Rice (N Y) 13, 28. doi: 10.1186/s12284-020-00388-2
Zhang, S., Xu, Z., Li, P., Yang, L., Wei, Y., Chen, M., et al. (2012). Overexpression of TaHSF3 in transgenic Arabidopsis enhances tolerance to extreme temperatures. Plant Mol. Biol. Rep. 31, 688–697. doi: 10.1007/s11105-012-0546-z
Keywords: HSF, TaHSFB4-2B, wheat, tissue specific expression, overexpression, abiotic stress
Citation: Yun L, Zhang Y, Li S, Yang J, Wang C, Zheng L, Ji L, Yang J, Song L, Shi Y, Zheng X, Zhang Z and Gao J (2023) Phylogenetic and expression analyses of HSF gene families in wheat (Triticum aestivum L.) and characterization of TaHSFB4-2B under abiotic stress. Front. Plant Sci. 13:1047400. doi: 10.3389/fpls.2022.1047400
Received: 18 September 2022; Accepted: 29 December 2022;
Published: 25 January 2023.
Edited by:
Colin W. Hiebert, Agriculture and Agri-Food Canada (AAFC), CanadaReviewed by:
Yuri Shavrukov, Flinders University, AustraliaCopyright © 2023 Yun, Zhang, Li, Yang, Wang, Zheng, Ji, Yang, Song, Shi, Zheng, Zhang and Gao. This is an open-access article distributed under the terms of the Creative Commons Attribution License (CC BY). The use, distribution or reproduction in other forums is permitted, provided the original author(s) and the copyright owner(s) are credited and that the original publication in this journal is cited, in accordance with accepted academic practice. No use, distribution or reproduction is permitted which does not comply with these terms.
*Correspondence: Xu Zheng, emhlbmd4dUBoZW5hdS5lZHUuY24=; Zhiyong Zhang, emhhbmd6eW9uZzIxOUAxMjYuY29t; Jie Gao, Z2FvaWplX2Jpb3NjaUBxcS5jb20=
†These authors have contributed equally to this work
Disclaimer: All claims expressed in this article are solely those of the authors and do not necessarily represent those of their affiliated organizations, or those of the publisher, the editors and the reviewers. Any product that may be evaluated in this article or claim that may be made by its manufacturer is not guaranteed or endorsed by the publisher.
Research integrity at Frontiers
Learn more about the work of our research integrity team to safeguard the quality of each article we publish.