
94% of researchers rate our articles as excellent or good
Learn more about the work of our research integrity team to safeguard the quality of each article we publish.
Find out more
ORIGINAL RESEARCH article
Front. Plant Sci., 18 October 2022
Sec. Plant Biotechnology
Volume 13 - 2022 | https://doi.org/10.3389/fpls.2022.1041068
This article is part of the Research TopicMulti-omics Strategies to Analyze Complex Agronomic Traits in PlantsView all 11 articles
 Chaoqun ChenHongxu ChenYuanfei ChenWenlong Yang
 Mengyao Li
 Bo SunHaiyan SongWenjing TangYao Zhang
 Ronggao Gong*
Gibberellin (GA) is an important phytohormone that can participate in various developmental processes of plants. The study found that application of GA3 can induce parthenocarpy fruit and improve fruit set. However, the use of GA3 affects endogenous hormones in fruits, thereby affecting fruit quality. This study mainly investigates the effect of exogenous GA3 on endogenous hormones in sweet cherries. The anabolic pathways of each hormone were analyzed by metabolome and transcriptome to identify key metabolites and genes that affect endogenous hormones in response to exogenous GA3 application. Results showed that exogenous GA3 led to a significant increase in the content of abscisic acid (ABA) and GA and affected jasmonic acid (JA) and auxin (IAA). At the same time, the key structural genes affecting the synthesis of various hormones were preliminarily determined. Combined with transcription factor family analysis, WRKY genes were found to be more sensitive to the use of exogenous GA3, especially the genes belonging to Group III (PaWRKY16, PaWRKY21, PaWRKY38, PaWRKY52, and PaWRKY53). These transcription factors can combine with the promoters of NCED, YUCCA, and other genes to regulate the content of endogenous hormones. These findings lay the foundation for the preliminary determination of the mechanism of GA3’s effect on endogenous hormones in sweet cherry and the biological function of WRKY transcription factors.
Sweet cherries (Prunus avium L.), belonging to the Rosaceae family, originated in Europe and Western Asia (Papapetros et al., 2018). Sweet cherries are rich in nutrients, such as flavonoids, ascorbic acid, and anthocyanins. These substances have beneficial effects on health, including preventive and regulatory effects on several chronic diseases (diabetes, cancer, cardiovascular, and other inflammatory diseases) (Faienza et al., 2020). Versatile and economical, sweet cherries are among the most popular fruits and are widely cultivated worldwide. However, sweet cherriy is a typical self-incompatible species controlled by the multi-allele expressed by a single gametophyte (Kivistik et al., 2022), and artificial pollination is often used to improve the fruit set. The workload of manual pollination is large and consumes considerable manpower and material resources. Therefore, people gradually adjust the program for higher efficiency, such as exogenous spraying of GA3 (Askarieh et al., 2021).
GA, an important plant hormone and signaling molecule, plays an important role in fruit reproductive development and stress response (Rachappanavar et al., 2022). Numerous studies have shown that GA affects fruit development and ripening, especially fruit-enhancing fruit sets. In pepper, exogenous use of GA3 can significantly increase yield (Tiwari et al., 2012). Treatment with GA3 during flowering stimulates cell division and ovary growth, thereby improving citrus fruit set, whereas paclobutrazol (GA3 biosynthesis inhibitor) inhibits cell division and reduces fruit set (Mesejo et al., 2016). Similarly, the use of GA3 before apple flowering can induce parthenocarpic fruit and increase the fruit setting rate (Watanabe et al., 2008). The accumulation of sucrose and organic acids in single-core pears induced by GA4+7 was lower than that in pollinated pears (Niu et al., 2015). Citrus carotenoids were significantly reduced after GA3 treatment (Zhang et al., 2012). Similarly, in sweet cherries, changes in fruit bioactivity and soluble sugars were found after the use of GA3 (Ozkan et al., 2016). Exogenous use of GA3 can improve the fruit set of sweet cherries, but the fruit quality changes (Kuhn et al., 2020).
Studies have shown that changes in endogenous hormones are one of the main reasons for the changes in fruit quality after GA3 is applied (Tijero et al., 2019). However, plant hormones do not play an independent role in the process of plant growth and development, but they interact with each other to form a complex multihormone regulatory network to jointly regulate the life activities of plants (Jaillais and Chory, 2010). Therefore, the relationship between hormones should be considered when studying the effect of exogenous GA3 on endogenous hormones. Studies have shown that GA3 and IAA induce cell wall expansion by activating the expression of EXP genes, the combination of which regulates stem formation (Kou et al., 2021). Meanwhile, GA and IAA regulated soybean lower ovule elongation under the interaction of low light and high-temperature stress (Bawa et al., 2020). Through the crosstalk between the ABA and GA signaling pathways, root growth and tillering can be maintained, and the plant structure can be regulated (Lin et al., 2020). GA, ABA, and IAA interact to regulate strawberry fruit development (Liao et al., 2018). ABA, JA, and SA together with ETH modulate some abiotic stress defense responses of trees exposed to sunlight during photooxidative and thermal stress (Torres et al., 2017). These findings further indicate a crosstalk mechanism between endogenous hormones to jointly regulate fruit growth, development, and quality.
At present, most studies on the effect of exogenous GA3 on the endogenous hormones in sweet cherry fruit focus on content determination, whereas systematic studies on the anabolic pathways of these hormones are limited. Therefore, in this study, the change patterns of endogenous hormones (ABA, GA3, GA4, IAA, and JA) were determined by spraying different concentrations of GA3. At the same time, by combining metabolome and transcriptome, the anabolic pathways of these hormones were analyzed to identify the differential metabolites (DEM) and differential genes (DEG) that affect endogenous hormones in response to exogenous GA3. In addition to this, we performed a comprehensive genome-wide analysis of the sweet cherry WRKY gene family. Gene identification, phylogenetic analysis, and analyses of gene structure, conserved motifs, promoter cis-elements, and protein-protein interactions were performed, respectively, to investigate the potential relevance of WRKY genes to the application of exogenous GA3. The results of this study will provide a reference for subsequent studies on the application of exogenous GA3 in sweet cherry production and lay a foundation for studying the biological function of sweet cherry WRKY transcription factors.
In this study, ‘Hongdeng’ sweet cherry was selected as the experimental material, and the experimental site was located in the sweet cherry experimental base of Hanyuan County, Ya’an City, Sichuan Province, China. A total of 24 sweet cherry fruit trees with good growing conditions and the same developmental period were selected for listing. One control (CK) and seven GA3 treatment concentration gradients were set up in the experiment: 10, 20, 30, 40, 60, 80, and 100 mg/L (Named A, B, C, D, E, F, G, respectively.), with three trees in each treatment. The entire tree was sprayed with GA3 meticulously at 9:00 a.m. in the early flowering period and one week after full bloom, and the control group was treated with clean water. Each sweet cherry fruit tree uses 5 liters of GA3 solution or water each time. Sampling was started after flowering, and then every three days until the fruit matured. A total of 12 periods of samples were collected (1, 2, 3, 4, 5, 6, 7, 8, 9, 10, 11, and 12). After harvesting, the fruits were brought back to the laboratory immediately, and then frozen in liquid nitrogen and stored in a −80°C refrigerator for subsequent experiments. Three biological replicates were prepared for each sample.
Endogenous GA3, GA4, IAA, ABA and JA levels were determined using an indirect ELISA method. A 0.5 g sample was homogenized in liquid nitrogen and extracted in cold 80% (v/v) methanol containing 1 mM 2-tert-butylated hydroxytoluene as an antioxidant. The extracts were incubated at 4°C for 1 hour and centrifuged at 3500r/min for 8 minutes at the same temperature. The supernatant was then filtered through a Chromoseq C18 column (C18 Sep-Pak Cartridge, Waters, Millford, Massachusetts, USA). The resulting eluate was concentrated to dryness in vacuo and dissolved in 1 mL of phosphate buffered saline (PBS) containing 0.1% (v/v) Tween-20 and 0.1% (w/v) gelatin (pH 7.5) for ELISA analyze.
The freeze-dried sample was pulverized to a powder, and 100 mg was extracted with 600 μL of 2-chlorophenylalanine (4 ppm) in methanol overnight at 4°C. The supernatant was then collected by centrifugation at 12,000 rpm for 10 minutes. For each experimental sample, an equal volume of samples was obtained and mixed as a quality control (QC) sample, which was inserted in the front, middle, and back of the sample to test the repeatability of the experiment. Subsequently, these extracts were absorbed, filtered, and analyzed by a UHPLC-MS/MS system. ACQUITY UPLC® HSS T3 1.8 μm (2.1 × 150 mm) columns were used in this study. Mobile phase A is positive and negative ion 0.1% formic acid-water solution, and mobile phase B is formic acid acetonitrile. Chromatographic gradient elution program: 0–1 min, 98% A, 2% B; 1–9 min, 74% A, 26% B; 9–12 min, 26% A, 74% B; 12–13.5 min, 2% A, 98% B; 13.5–14 min, 50% A, 50% B; 14–20 min, 98% A, 2% B. Raw data were processed using Compound Discoverer 3.1 (CD3.1). Functional and taxonomic annotations were performed on the metabolites to investigate the functional properties and taxonomy of the identified metabolites. The data were logarithmically transformed and centrally formatted using MetaX software (http://metax.genomics.cn/). Differential metabolites were screened by three parameters, variable importance in the projection (VIP), fold change (FC), and P-value. The thresholds were set as VIP > 1.0, FC > 1.2 or FC < 0.833, and P value < 0.05. Six independent replications were included for each sample. Finally, OmicShare tools (https://www.omicshare.com/tools/) were used to perform cluster heatmap, correlation, and metabolic pathway analysis of screened metabolites.
Total RNA was extracted with a total RNA kit (TIANGEN Biotech, Beijing, China). Using the polyA structure at the end of mRNA, the sample mRNA was separated from the total RNA by Oligo (dT) magnetic beads, and the obtained mRNA was randomly interrupted with divalent cations in NEB Fragmentation Buffer reagent. Using the fragmented mRNA as a template, the first strand of cDNA was synthesized with random oligonucleotide primers. Then, the second strand of cDNA was synthesized by using dNTPs as raw material and DNA polymerase I, and the double-stranded cDNA fragment was purified and recovered. The purified double-stranded cDNA is end-repaired and A is added to the end, and then the sequencing adapter is ligated to the double-stranded cDNA. Fragment selection was performed on the size of the cDNA using AMPure XP beads, and the 200 bp sequence was enriched. The enriched sequences were amplified by PCR, the PCR products were purified using AMPure XP beads, and the library was further constructed. Qubit2.0 Fluorometer was used for preliminary quantification, and Agilent 2100 Bioanalyzer was used for quality inspection of the constructed library. After pooling, as required, Illumina sequencing (TSINGKE, Beijing, China) was performed to generate 150 bp paired-end reads. Gene expression levels were analyzed by the fragments per kilobase per million reads (FPKM) method. DESeq2 v1.22.1 was used for differential expression analysis between sample groups, the original readcount was normalized, the significant P-value was corrected using the Benjamini and Hochberg methods, and finally, the corrected P-value (p-adjust), which is the false discovery rate value (FDR). |log2 (Fold Change)| > 2 and p-adjust ≤ 0.05 were used as the screening criteria for the significance of differentially expressed genes. Kyoto Encyclopedia of Genes and Genomes (KEGG) analysis was performed using the clusterProfiler R package to clarify the signaling pathways involved in differential genes. The PlantTFDB database (http://planttfdb.gao-lab.org) was used to screen and classify possible transcription factors. At the same time, the log2(FPKM) values of differential genes were used to draw a clustering heatmap. The clustering heatmap passed the TBtools software (http://www.tbtools.org) for drawing.
The WRKY family module sequence (PF03106) was downloaded from the Pfam database (http://pfam.xfam.org/), and then the sweet cherry protein sequence was downloaded from NCBI (https://www.ncbi.nlm.nih.gov). The HMMER software was used to retrieve WRKY protein sequences from the sweet cherry genome sequence. Candidate proteins were further submitted to NCBI-CDD and Pfam for WRKY domain confirmation. The ExPASy website (http://web.expasy.org/protparam/) was used to analyze the physicochemical properties of the confirmed WRKY protein sequence, such as protein molecular weight and isoelectric point, and WOLF PSORT (http://www.genscript.com/wolf -psort.html) was use for subcellular localization analysis. The WRKY gene sequence of Arabidopsisthalian was downloaded from the TAIR (https://www.arabidopsis.org/) website.
Clustal X (v.2.1) software was used to perform multiple sequence alignment of all WRKY protein sequences of sweet cherry and Arabidopsis thaliana, and MEGA 6.06 software was used to perform phylogenetic analysis on the results of the multiple sequence alignment using the neighbor-joining method. The parameter bootstrap repeated 1000 times was verified, and a phylogenetic tree was constructed. The phylogenetic tree was modified in Evolview (http://www.evolgenius.info/evolview/#/login).
The GSDS server (http://gsds.cbi.pku.edu.cn/) was accessed, and the structural pattern diagram of the introns and exons of the WRKY family genes was designed by comparing the coding sequence with the gene sequence information. The conserved motifs of the members of the sweet cherry WRKY family gene were analyzed using MEME (http://meme-suite.org/). The parameter size of the conserved motif is set to be 10-100 amino acids, and the maximum number of domains to be exported is 10. Finally, the visualization of the results is realized by using TBtools software. The analysis results of these exon–intron structures and conserved motifs were arranged in the order shown on the phylogenetic tree.
The Plant CARE (http://bioinformatics.psb.ugent.be/webtools/plantcare/html/) online software was used, considering the 2000 bp upstream of the start codon of the sweet cherry PaWRKY gene family as the sequence to predict and analyze the cis-acting elements of the gene family. Finally, the TBtools software was used to map.
All PaWRKY protein sequences were submitted to the STRING (https://cn.string-db.org) website, and Arabidopsis thaliana was selected as the reference organism. After blast analysis, the highest scoring Arabidopsis homolog (Bitscore) was used to construct the network. Genes that do not interact with any other genes are removed.
All the obtained DEMs and DEGs were mapped to the KEGG pathway database to obtain their common pathway enrichment information. The top 10 significantly enriched metabolic pathways in the three comparison groups were histogram plotted. The obtained DEM and DEG were analyzed based on the Pearson correlation coefficient, and the Cytoscape v3.9.1 software was used to make a correlation network diagram.
Total RNA from the four samples was extracted with an RNA extraction kit (TSINGKE, Beijing, China). Subsequently, cDNA was synthesized using the Goldenstar RT6 cDNA Synthesis Kit Ver.2 kit (Beijing TsingKe Biotech Co., Ltd.). qRT-PCR was performed using the CFX96TM real-time system (Bio-Rad, California, USA) and 2 × TSINGKE® Master qPCR Mix(SYBR Green I)(TSINGKE, Beijing, China) reagents. The amplification program was as follows: pre-denaturation at 95°C for 30 s, denaturation at 95°C for 0.05 s, annealing at 59°C for 30 s, and the number of amplification cycles was 39. Gene expression was normalized with ACTIN as an internal control. Gene expression was calculated using 2−ΔΔCt, and primers were designed using Primer Premier 6.0 software. Table S1 lists the primers for qRT-PCR.
The endogenous hormones in sweet cherry fruit changed after the use of exogenous GA3. The specific situation is shown in Figure 1. Among them, the GA3 content mainly showed a trend of initially decreasing and then increasing. The content of endogenous GA3 was significantly increased after exogenous GA3 treatment, and the change was most severe in the 5h to 6th period. In addition, the peak of GA3 in CK appeared in the 6th to 7th period, whereas the peak in each treatment group was advanced to the 4th to 6th period. GA4 generally showed an upward trend and reached its peak at maturity. After GA3 treatment, the content of endogenous GA4 was reduced in all periods except 1st, 6th, and 7th. ABA content, one of the most abundant hormones in sweet cherries, increased rapidly from stage 6, indicating that it may play a role mainly in the later stages of fruit growth. After treatment, the endogenous ABA content increased significantly, and the content increased the most in the 8th to 9th period, among which the E treatment group showed the greatest change, and the ABA content increased by approximately 80 ng/g FW. JA showed a trend of initially decreasing sharply to the 6th period and then increasing slightly. The lowest JA content in the seventh period was 20.71 ng/g FW. After GA3 treatment, the content of endogenous JA was down-regulated, and a slight difference was observed between the treatment groups. The overall IAA showed a trend of initially decreasing and then increasing, and reached a peak value at the mature stage, which was 74.15 ng/g FW. After treatment, except for E treatment, the other treatments reduced the content of endogenous IAA, and the effect was most severe in the 6th to 10th period.
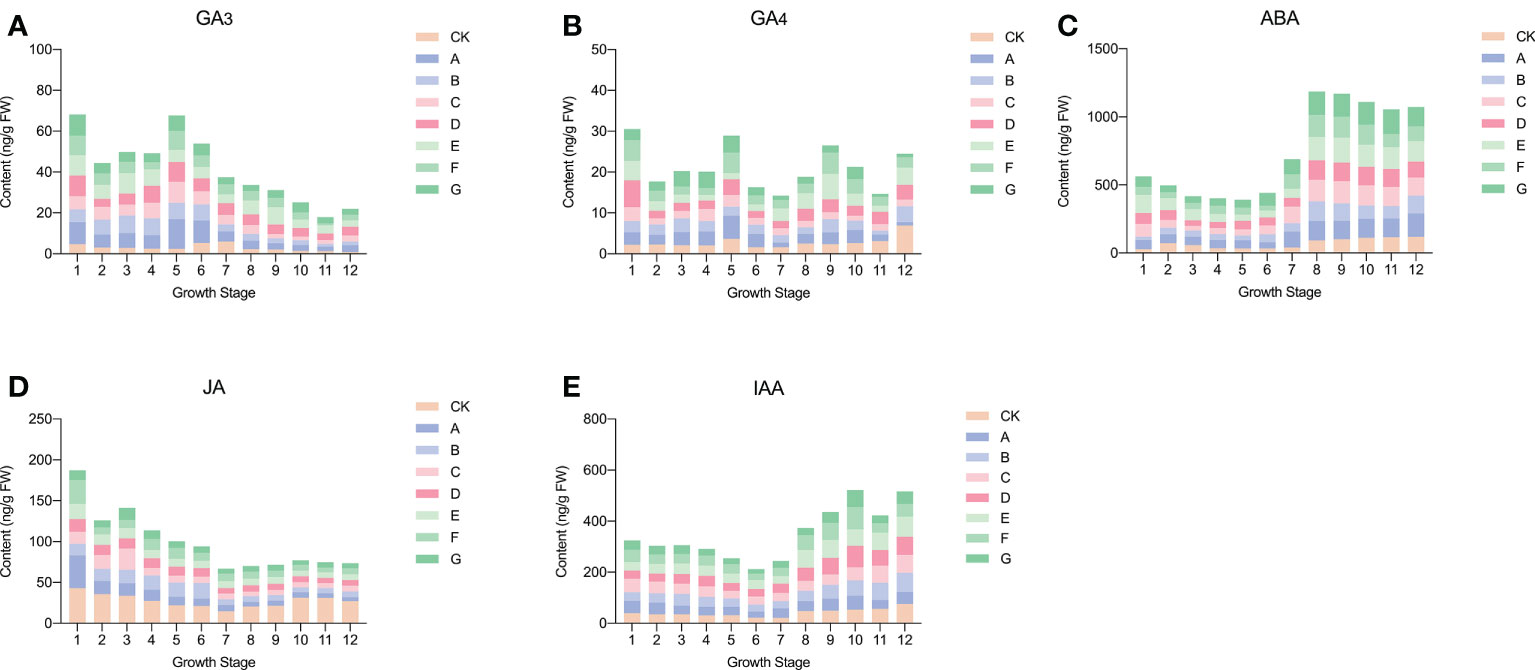
Figure 1 Changes of endogenous hormones in fruits after exogenous GA3 treatment. (A) Changes in endogenous GA3 after exogenous GA3 treatment. (B) Changes in endogenous GA4 after exogenous GA3 treatment. (C) Changes in endogenous ABA after exogenous GA3 treatment. (D) Changes in endogenous JA after exogenous GA3 treatment. (E) Changes in endogenous IAA after exogenous GA3 treatment.
These results showed that after exogenous use of GA3, the effects of endogenous hormones were more severe in the three periods of the sixth, ninth, and 12th, and treatment group E had the most significant effect on endogenous GA3, ABA, and IAA in the three periods. Therefore, CK6, CK9, CK12, E6, E9, and E12 were selected for metabolome and transcriptome analysis.
The PCA results of the metabolome profiles are shown in Figure 2A, the first two principal components could separate 36 samples, accounting for 17.23% and 12.18% of the total variability. On the PCA analysis chart, each group showed a separation trend, and each replicate was clustered, indicating that the data reproducibility was good during the experiment. Evident differences were observed among the six sweet cherry samples; CK6, E6, and CK9 were distributed in the positive end of PC1, whereas CK12, E9, and E12 were distributed in the negative end of PC1. In addition, in PC2, the CK group was distributed on the positive end, and the processing group E was distributed on the negative end. A total of 3011 metabolites were identified in the metabolome, including 2013 positive and 998 negative ions (Figure 2B). Through KEGG functional annotation, the identified metabolites were divided into seven categories, of which the metabolism group had the most metabolites, reaching 2486, accounting for 79.81%.
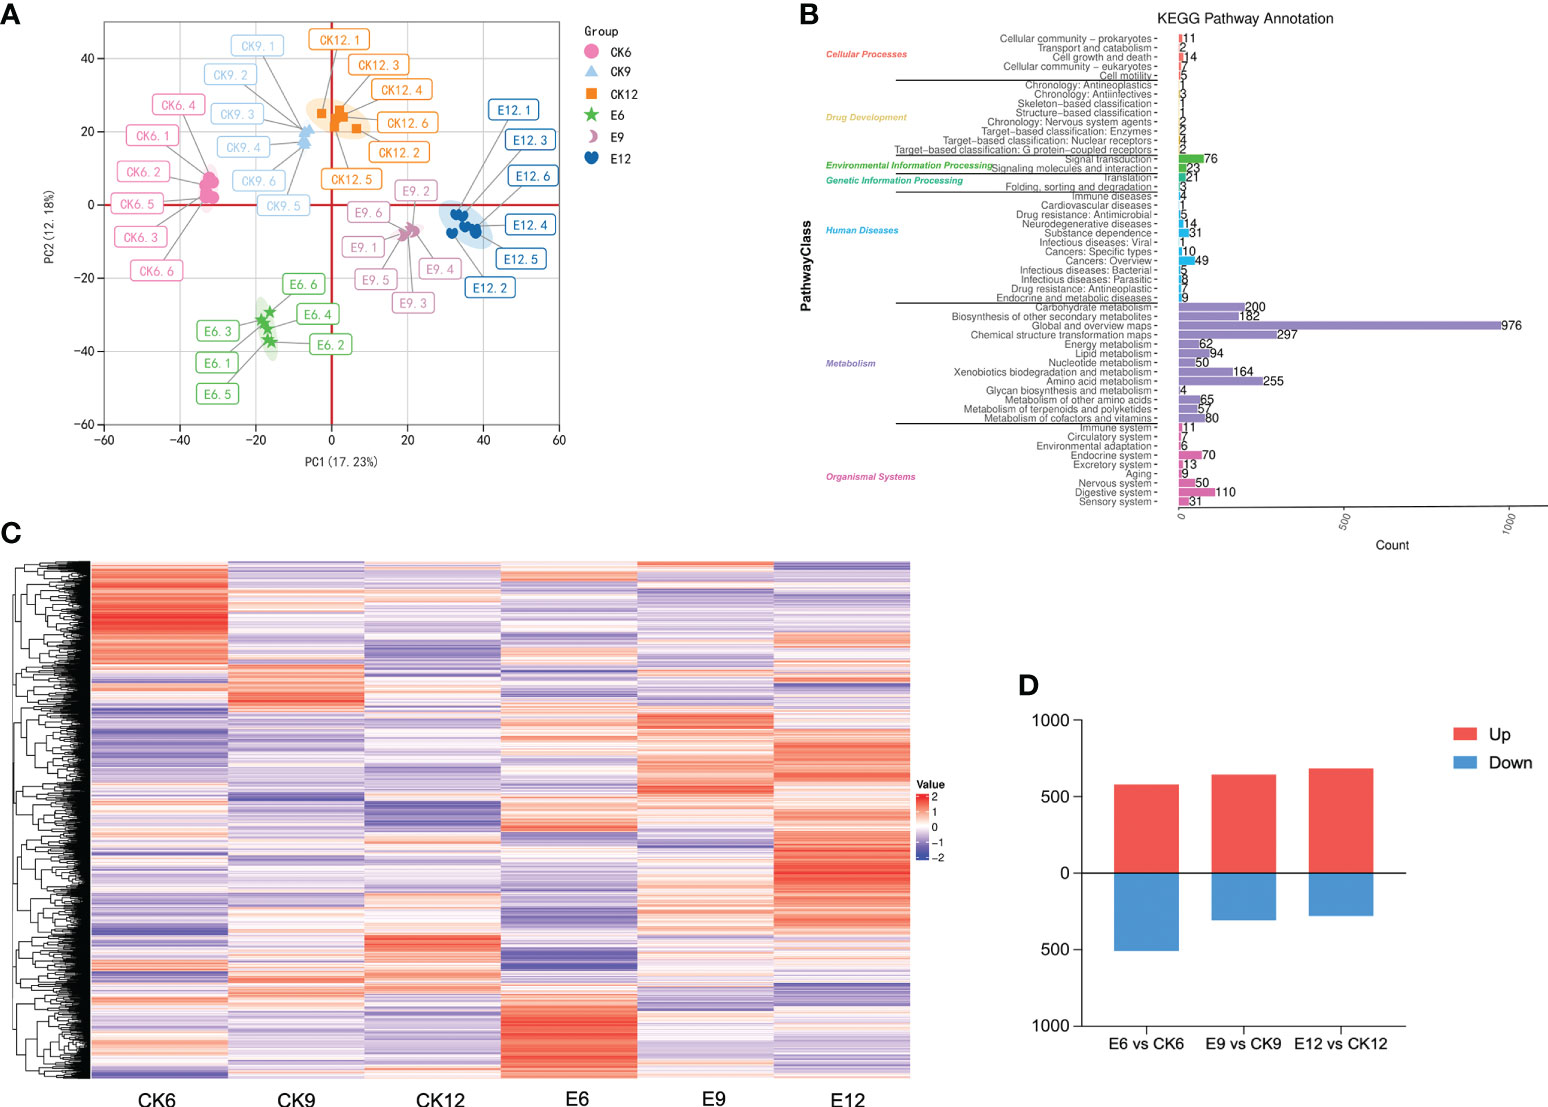
Figure 2 Metabolome analysis of fruits in three periods after gibberellin treatment. (A) PCA analysis of metabolites in different treatment groups. (B) KEGG Pathway classification annotation of metabolites. (C) DEMs expression heat map, color indicates the relative level content of each DEM, from low (purple) to high (red). (D) The number of DEMs in the treatment group and CK in the three periods, the number of up-regulated and down-regulated DEMs are represented by the bars above and below the x-axis, respectively.
Thresholds were set to VIP > 1.0, FC > 1.2 or FC < 0.833, and P-value < 0.05 to screen for DEM. A total of 2256 DEMs were identified, and their expression patterns are shown in Figure 2C. Significant differences were found among the groups, and the higher expression of many DEMs in the treatment groups may be the main substance causing the differences in endogenous hormones in fruits. Each CK was compared with group E at different times, as shown in Figure 2D. Among the combinations of different treatments, the combination with the most differential metabolites was E6 vs CK6 (1088 in total, 580 up-regulated, and 508 down-regulated). In summary, fruit metabolites were changed in multiple periods after the exogenous use of GA3 changed, and most expression levels showed an upward-regulated trend.
The samples of each treatment group were analyzed by RNA-seq technology. A total of 441,209,814 raw data were generated in three periods. After filtering out linker sequences, uncertain reads, and low-quality reads, 798,325,520 high-quality clean reads were obtained, and an average of 93.25% of the clean reads were mapped to the sweet cherry genome (Detailed results are shown in Table S2). The expression of transcript samples was analyzed by PCA, and the results are shown in Figure 3A. The figure shows that each sample can be clearly distinguished on the score map, and the resets are closely focused, indicating that the fruit transcripts are different after using exogenous GA3. Similar to metabolome, CK6 and E6 are at the minus end of PC1, and the remainder is at the plus end of PC2. Interestingly, the score map shows that the discrimination between CK12 and E9 on PC1 is weak, indicating that the two samples are similar. Moreover, the sample gene expression correlation between the replicates of each sample was the highest, indicating that the samples had good repeatability, and CK12 and E9 had a high degree of correlation (Figure 3B).
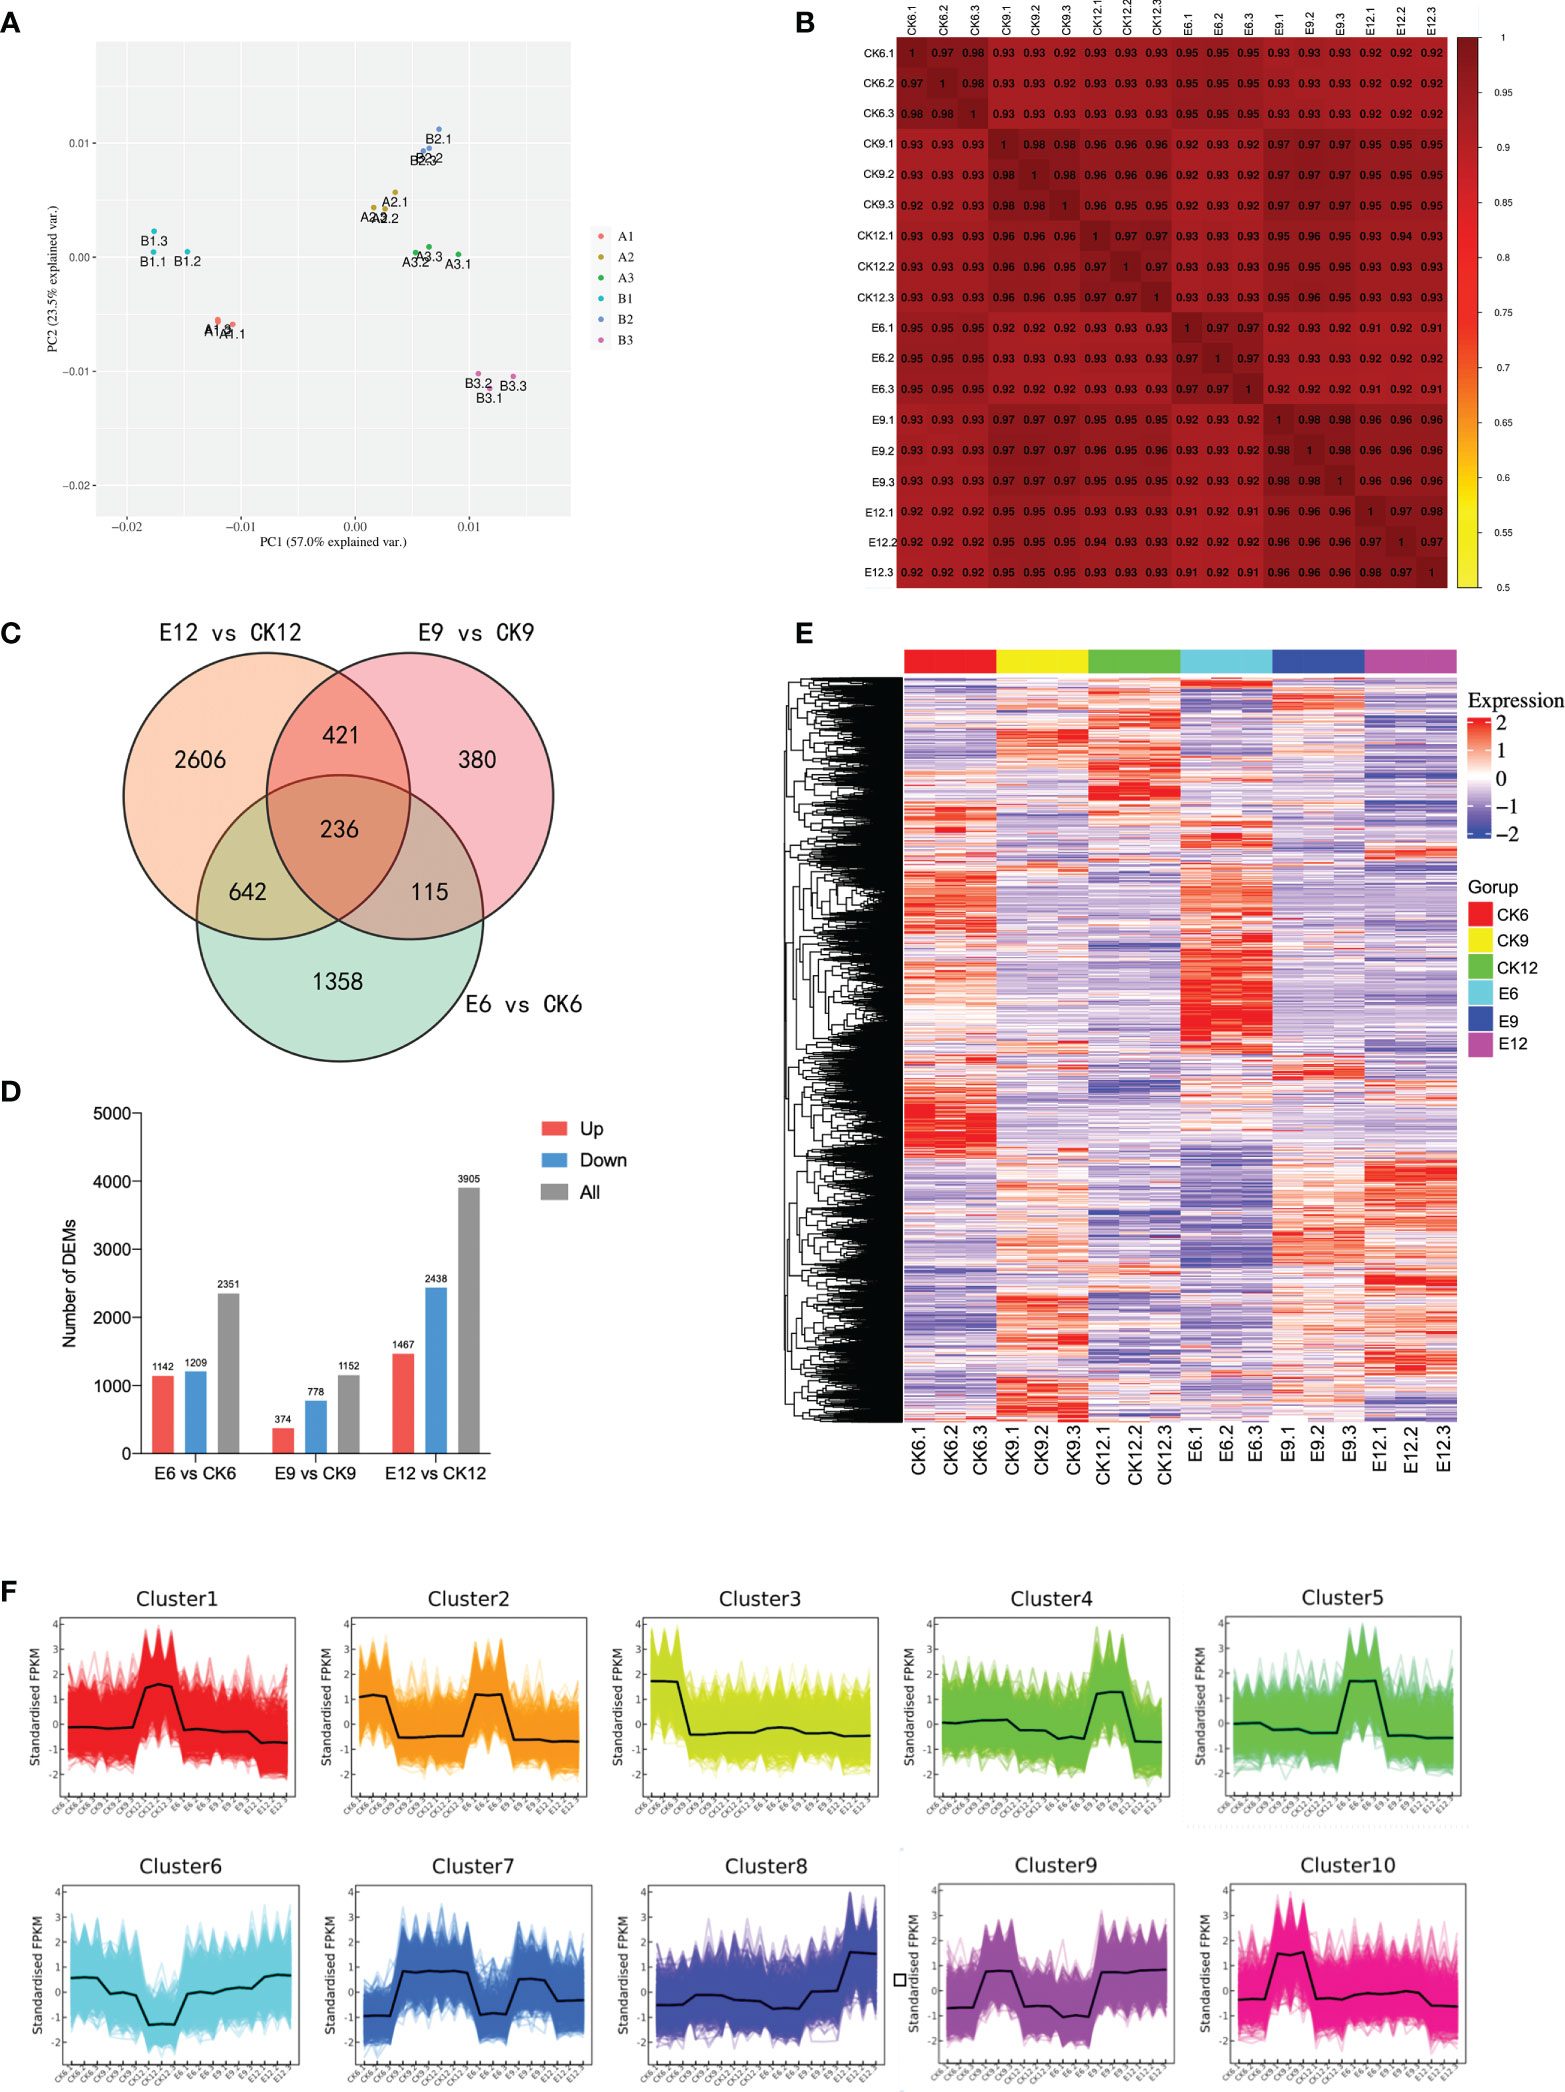
Figure 3 Transcriptome analysis of fruits in three periods after gibberellin treatment. (A) PCA analysis of gene expression under different treatments. (B) Spearman correlation coefficient of gene expression under different treatments. (C) Venn plot of commonly and exclusively expressed DEGs in the comparison of control and treatment groups at each developmental stage. (D) The number of DEGs compared at any two different developmental stages, the number of up-regulated and down-regulated genes is represented by the bars above and below the X-axis, respectively. (E) Hierarchical clustering of DEGs of all samples. (F) K-means clustering of DEGs expression trends, the expression profiles of genes in each cluster are represented by different colors, and the average expression profiles of all genes in each sample are represented by a black line.
Differential gene screening was performed with a threshold of P-value < 0.05 and |log2FoldChange|>2, and a total of 10,154 DEGs were identified. The results of DEGs compared between different developmental stages are shown in Figure 3C. Among the three groups, E12 vs CK12 had the most DEGs, reaching 3905. Different from the metabolome results, E12 vs CK12 had more differential genes than E9 vs CK9, and the number of up-regulated DEGs was less than that of down-regulated DEGs. The results of analyzing common or unique DEGs between the three comparison groups are shown in Figure 3D. The genes expressed in each sample were the least, only 236, and the genes expressed only in E12 vs CK12 were the greatest (2606).
Furthermore, a hierarchical clustering heatmap was drawn for the three developmental periods, with good repeatability of each treatment and large transcriptional differences between groups (Figure 3E). The expression patterns of all DEGs were divided into 10 groups, with more highly expressed genes in CK6, E6, and E12 (Figure 3F). Cluster2 contained the most DEGs, reaching 1593, mainly expressed in CK6 and E6. The expression levels of most DEGs were up-regulated in E12 vs CK12, mainly in Cluster8 and Cluster9.
A KEGG pathway analysis was performed to further determine the main biochemical pathways and signal transduction pathways jointly participated by DEGs and DEMs, and the results are shown in Figure 4. The figure shows the top 10 significantly enriched metabolic pathways for each comparison group, with a total of 21 different pathways. Among them, the pathways that were significantly enriched in the top 10 in the three comparison groups were sesquiterpenoid and triterpenoid biosynthesis and plant hormone signal transduction. In the comparison group of E12 vs CK12, plant hormone signal transduction had the smallest p-value and was the most significant pathway. Meanwhile, we found that pathways, such as flavonoid biosynthesis and phenylalanine metabolism, were significantly enriched in the E6 vs CK6 combination, suggesting the probable differences in fruit coloration after GA3 treatment. In addition, the enrichment of fructose and mannose metabolism pathways was higher in E12 vs CK12, indicating that the use of exogenous GAS may affect the sugar content of sweet cherries.
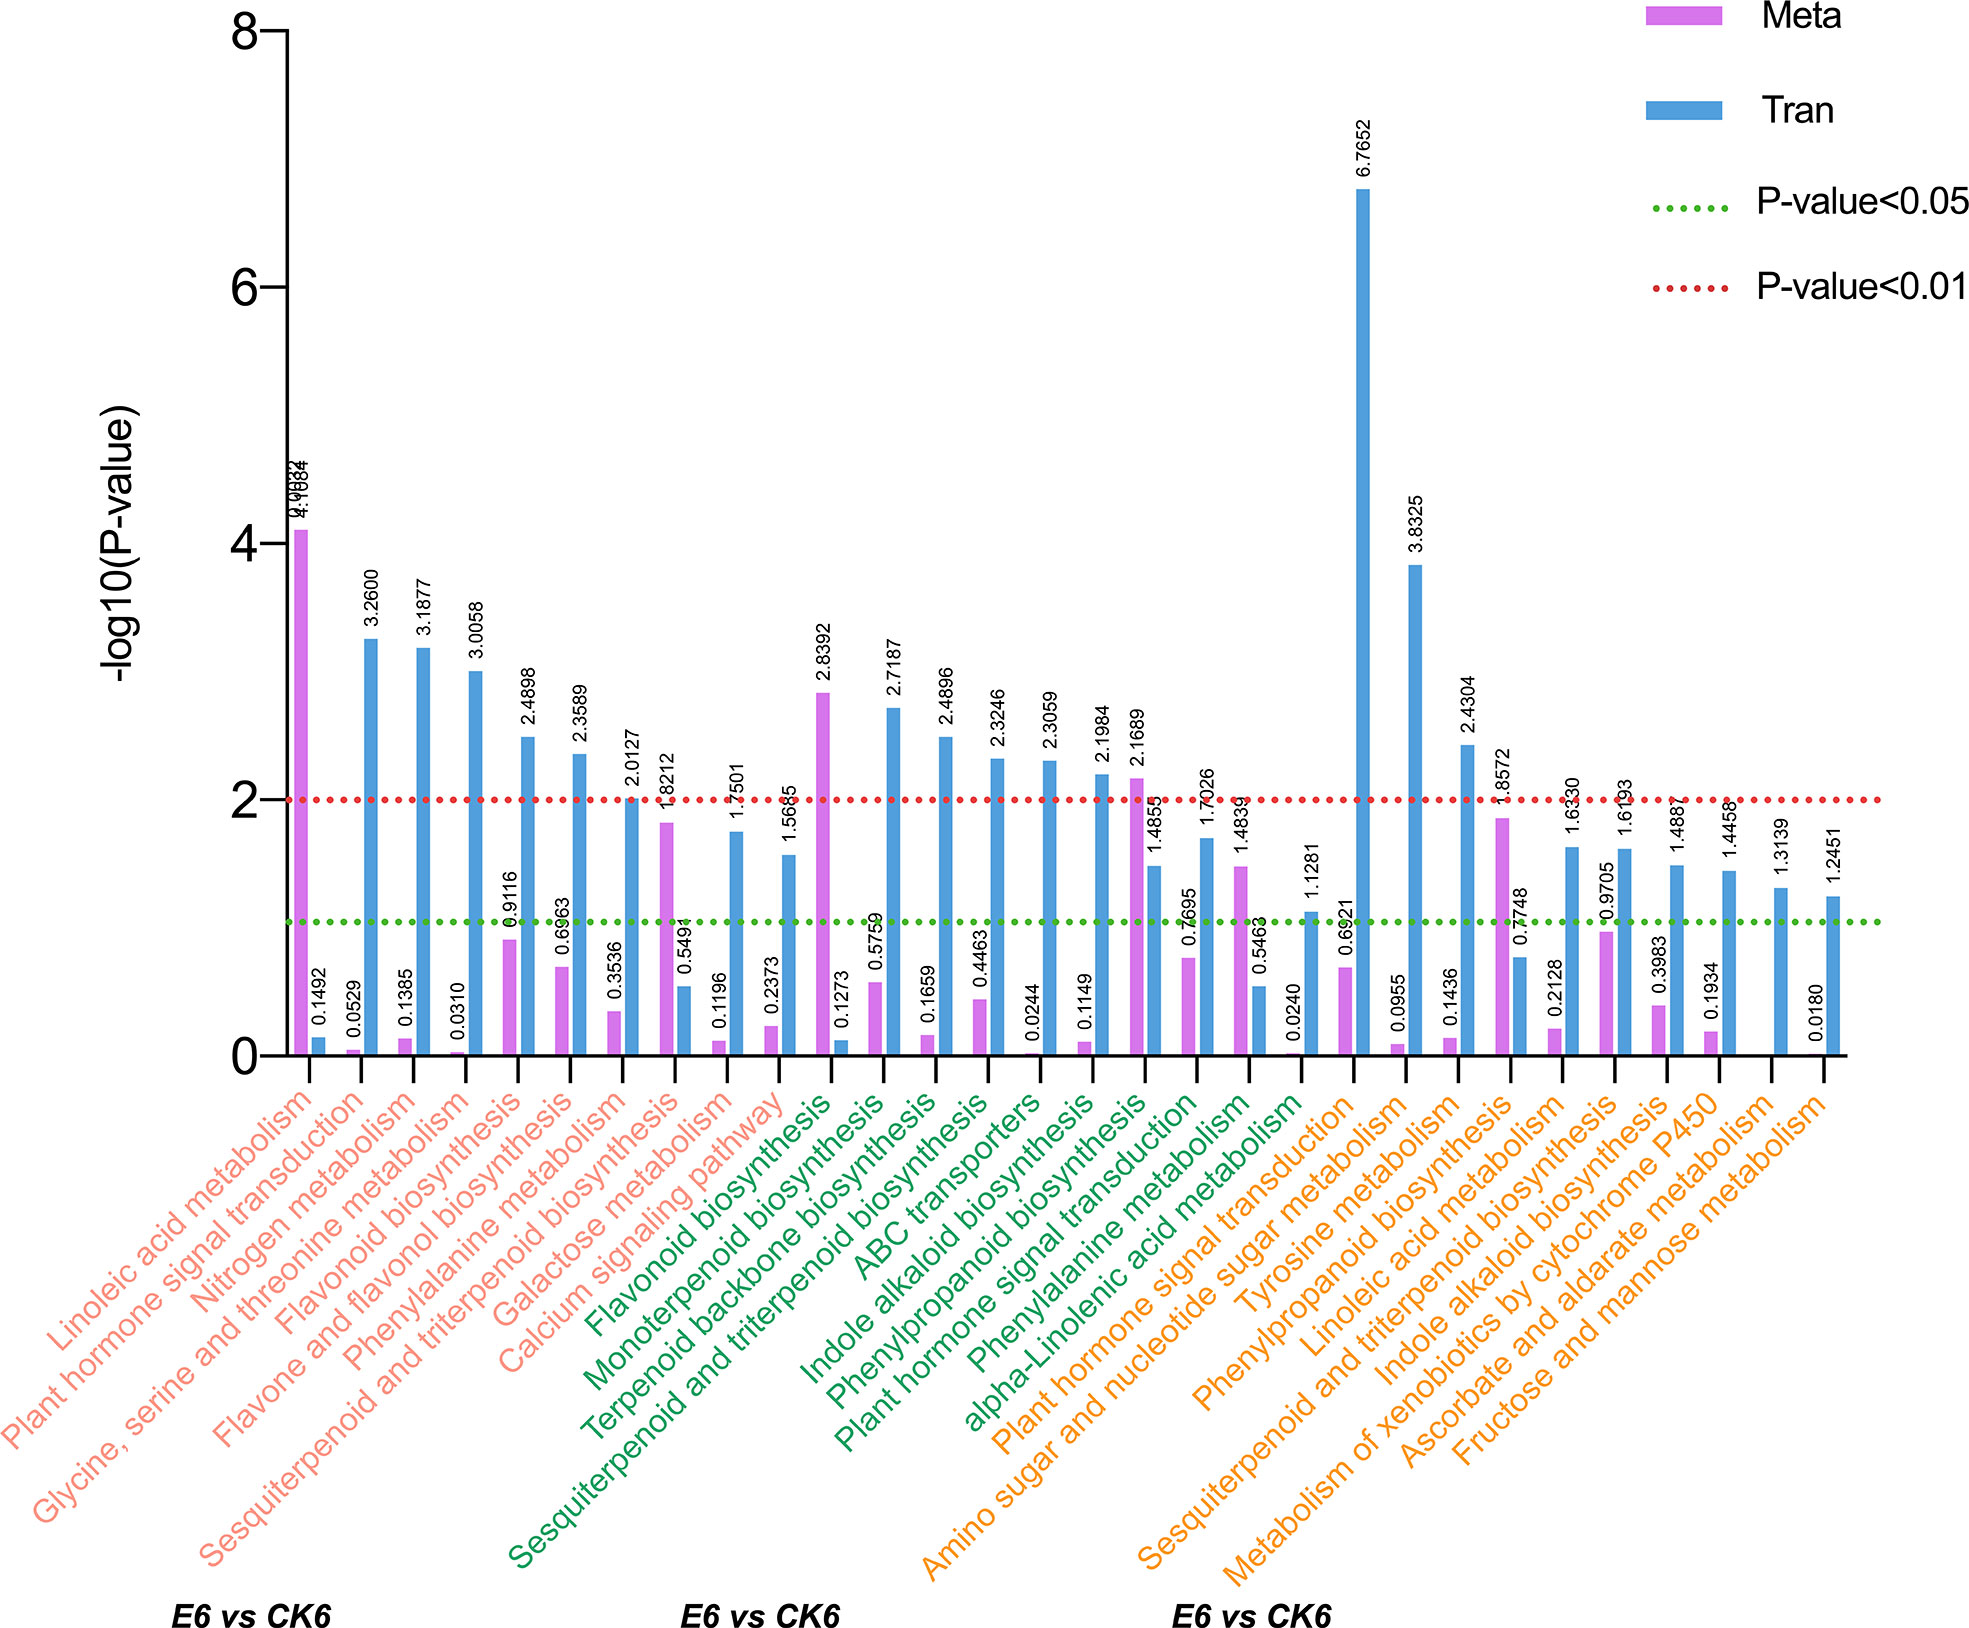
Figure 4 Annotation analysis of KEGG pathway in comparison groups of each period after gibberellin treatment. Select DEGs with P-value ≤ 0.5 for KEGG enrichment analysis.
Therefore, we carried out a detailed analysis of the anabolism of the five hormones, and the results are shown in Figure 5 and Table S3. In the ABA synthesis pathway, ABA is the only DEM, which gradually increases with fruit ripening. After the administration of exogenous GA3, the content of ABA was significantly changed, especially in the latter two periods. The ABA content of E9 was 3.79 times higher than that of CK9, whereas that of E12 was 7.42 times higher than that of CK12. The expression of two NCED genes and one ABA2 gene increased after the use of GA3, which promoted the synthesis of xanthoxin and abscisic aldehyde and established sufficient precursor substances for the accumulation of ABA. At the same time, the expression of two CYP707A genes was inhibited after treatment, resulting in the massive accumulation of ABA. Interestingly, we found that the expressions of lcyE and LUT1 genes were significantly up-regulated in E9 and E12 after GA3 treatment, indicating that the use of exogenous GA3 may affect the content of δ-Carotene and Lutein in fruits.
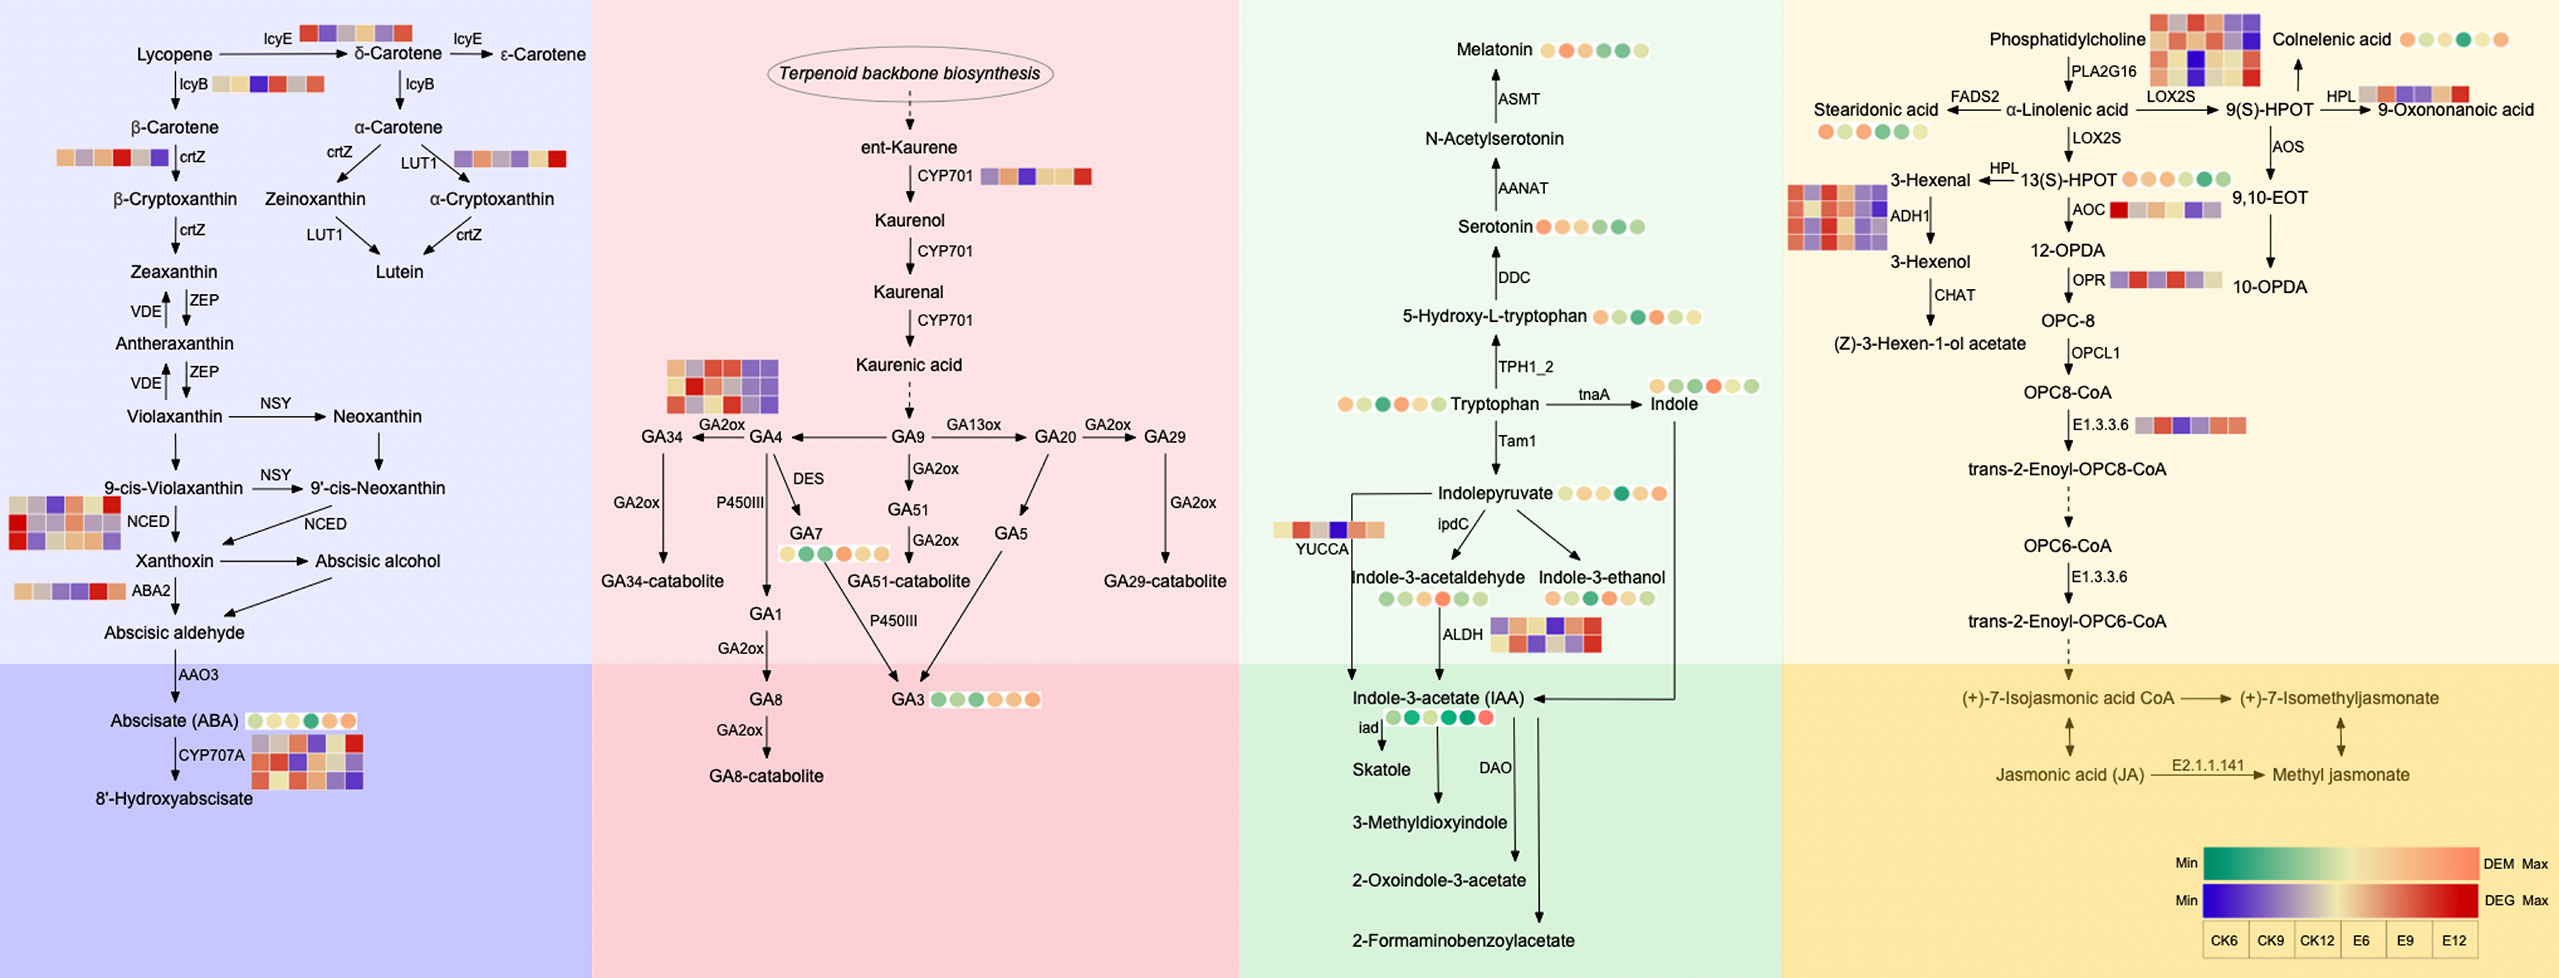
Figure 5 Analysis of each hormone anabolic pathway. The circle heatmap represents the expression of DEMs, and the square heatmap represents the expression of DEGs.
The metabolic pathway of GA indicates that exogenous GA3 has a greater impact on the content of endogenous GA3 than GA4. Similar to the previous results (Figure 1A), exogenous GA3 significantly increased the content of endogenous GA3 in the three periods. At maturity, the expression of endogenous GA3 in the treatment group increased by 39717583.24 compared with CK. At the same time, we found that the content of GA7 changed significantly, thereby providing a sufficient material basis for the increase in GA3. In this pathway, the expression of CYP701 and GA2ox genes was significantly up-regulated and down-regulated, respectively, after treatment, promoting the massive synthesis of GA7 and GA3.
The DEMs in the IAA synthesis pathway are more abundant. The use of exogenous GA3 decreased the content of Melatonin and Serotonin, but increased the contents of 5-Hydroxy-L-tryptophan, tryptophan, and indole, especially in E6. The accumulation of these substances lays a sufficient foundation for the synthesis of IAA. At the same time, the ALDH gene regulating IAA synthesis was highly expressed after treatment, especially the expression of E12 increased by 2.61 times compared with CK12. YUCCA gene expression was also up-regulated.
DEMs in the JA synthesis pathway are mainly concentrated in the anterior part. Exogenous GA3 decreased the contents of 13(S)-HPOT and stearidonic acid, and the expression of AOC and OPR genes was inhibited after treatment. Therefore, the repressed expression of these genes may be the main reason for the reduction of endogenous JA content.
In summary, the expression of NCED, ABA2, CYP701, ALDH, and other genes was affected after GA3 treatment; thus, the contents of endogenous ABA, GA3, and IAA changed.
In the transcription factor family analysis, 4986 DEGs were identified as transcription factors, belonging to 55 transcription factor families. The transcription factor family mainly includes bHLH, MYB, NAC, and WRKY. The specific transcription factor family is shown in Figure 6A. Among them, transcription factor families, such as bHLH and MYB, accounted for the highest proportion, that is, 11.53% and 11.52%, respectively. Moreover, the proportion of transcription factor families, such as NAC (8.92%), ERF (6.38%), WRKY (5.17%), and B3 (4.19%) was relatively high.
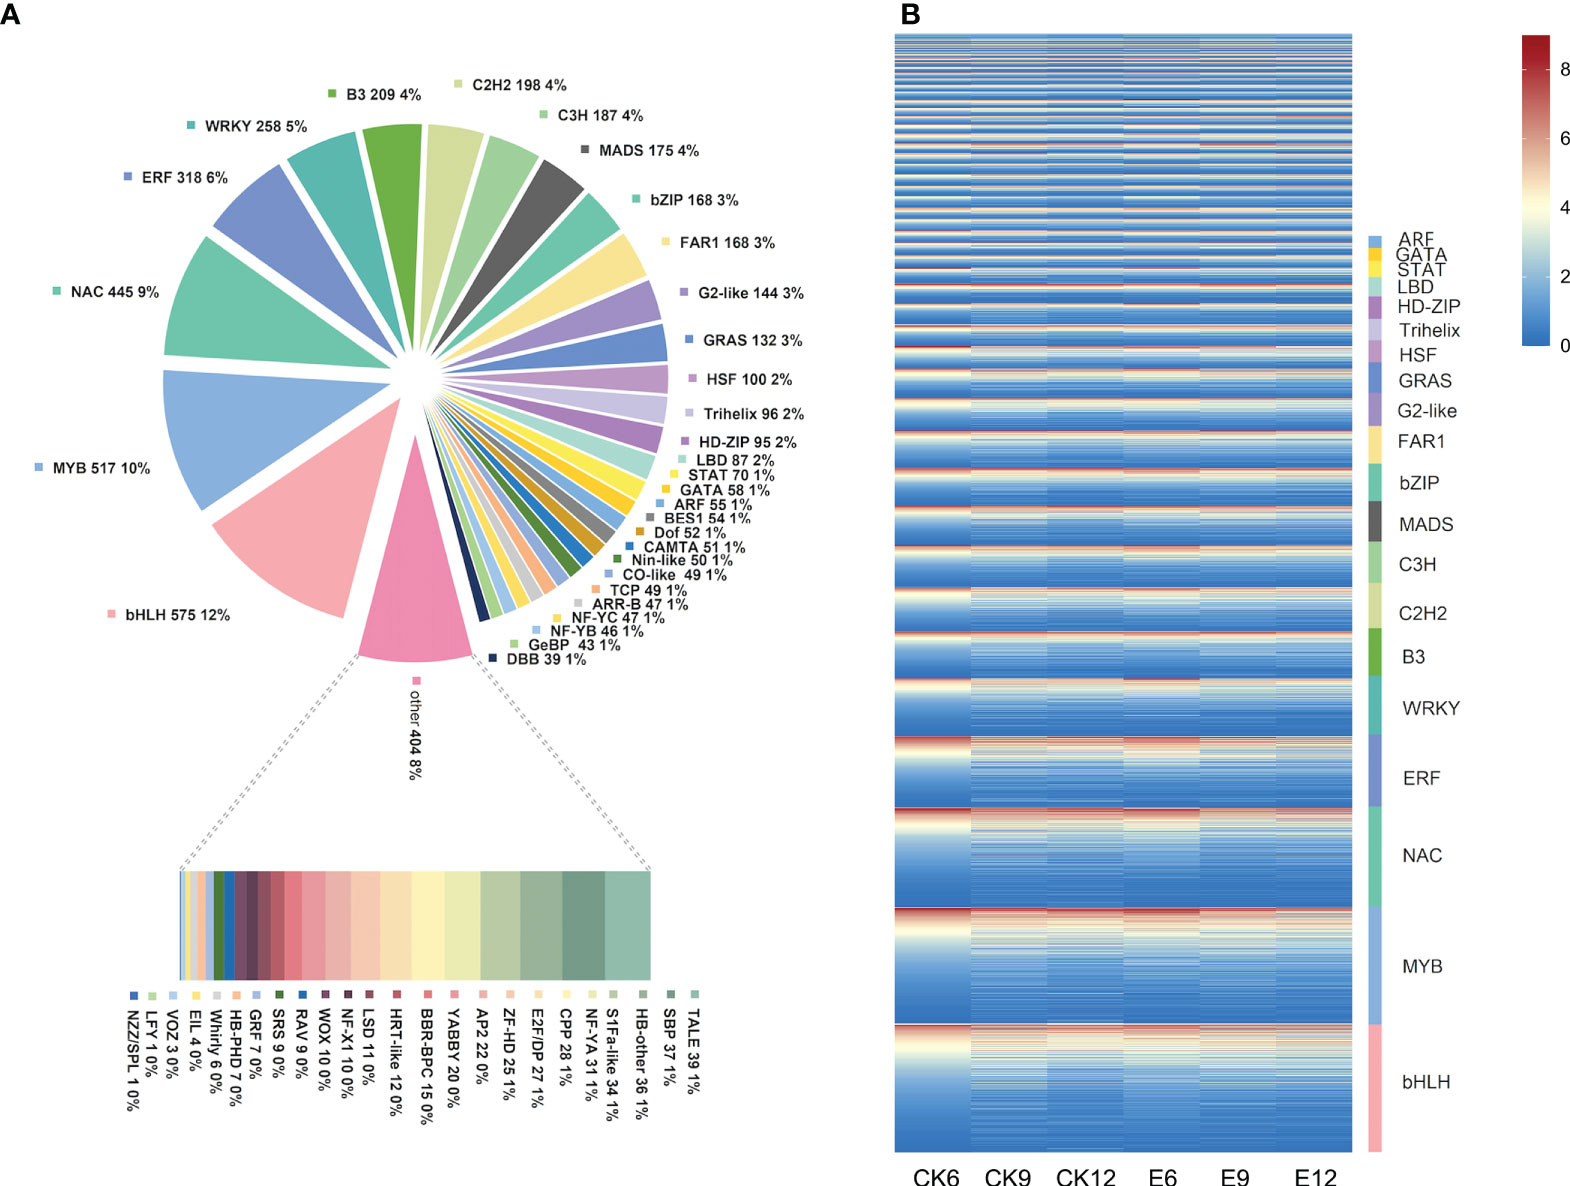
Figure 6 Transcription factor analysis. (A) Statistical summary of transcription factor families, the number and proportion of each transcription factor family are displayed in a pie chart. (B) Heat map of transcription factor expression patterns. The FPKM values of transcription factors were transformed according to log2, and heatmaps were constructed using Tbtools software.
Therefore, the expression patterns of these transcription factors were further analyzed, as shown in Figure 6B. Most transcription factors were expressed in each treatment, and their expression was affected by exogenous GA3. Among them, the expression of transcription factors, such as MYB and bZIP, showed a downward trend after treatment. However, transcription factors, such as MYB and bHLH, were closely related to the synthesis of anthocyanin in fruit, indicating that the use of exogenous GA3 may affect fruit color. Interestingly, the expression of most WRKY transcription factors was increased after exogenous GA3 treatment, and more genes were up-regulated in E6.
The results obtained show that the expression of genes related to the synthesis of hormones is up-regulated after exogenous use of GA3, thereby promoting the accumulation of these endogenous hormones. Therefore, according to the expression patterns of these genes, further screening was performed in cluster4, cluster5, cluster6, cluster8, and cluster9 to further identify the transcription factors that regulate these endogenous hormone synthesis genes. Among them, the genes of the WRKY family had the largest number of differential genes among the five groups, indicating that WRKY may be the main internal regulator in response to changes in exogenous GA3.
According to the HMMER search results, we finally obtained 58 sequences with typical WRKY domains, namely, PaWRKY1–PaWRKY58, using the Pfam tool to identify the domains. The physicochemical properties (gene name, gene ID, amino acid size, molecular weight, theoretical isoelectric point, and subcellular localization) were analyzed according to the sequence, and the results are shown in Table 1. The results showed that the amino acid size, molecular weight, and isoelectric point of these PaWRKY genes exhibited great differences. The protein encoded by the PaWRKY26 gene has the shortest amino acid length, containing only 97 amino acids, and its protein molecular mass is 11708.2 Da. The longest amino acid is PaWRKY8 protein, which contains 740 amino acids, its protein molecular mass is 79829.63 Da, and its theoretical isoelectric point is predicted to be 4.92–9.92. According to the subcellular localization analysis, most genes were mainly located in the nucleus, similar to the WRKY transcription factor genes reported in other species.
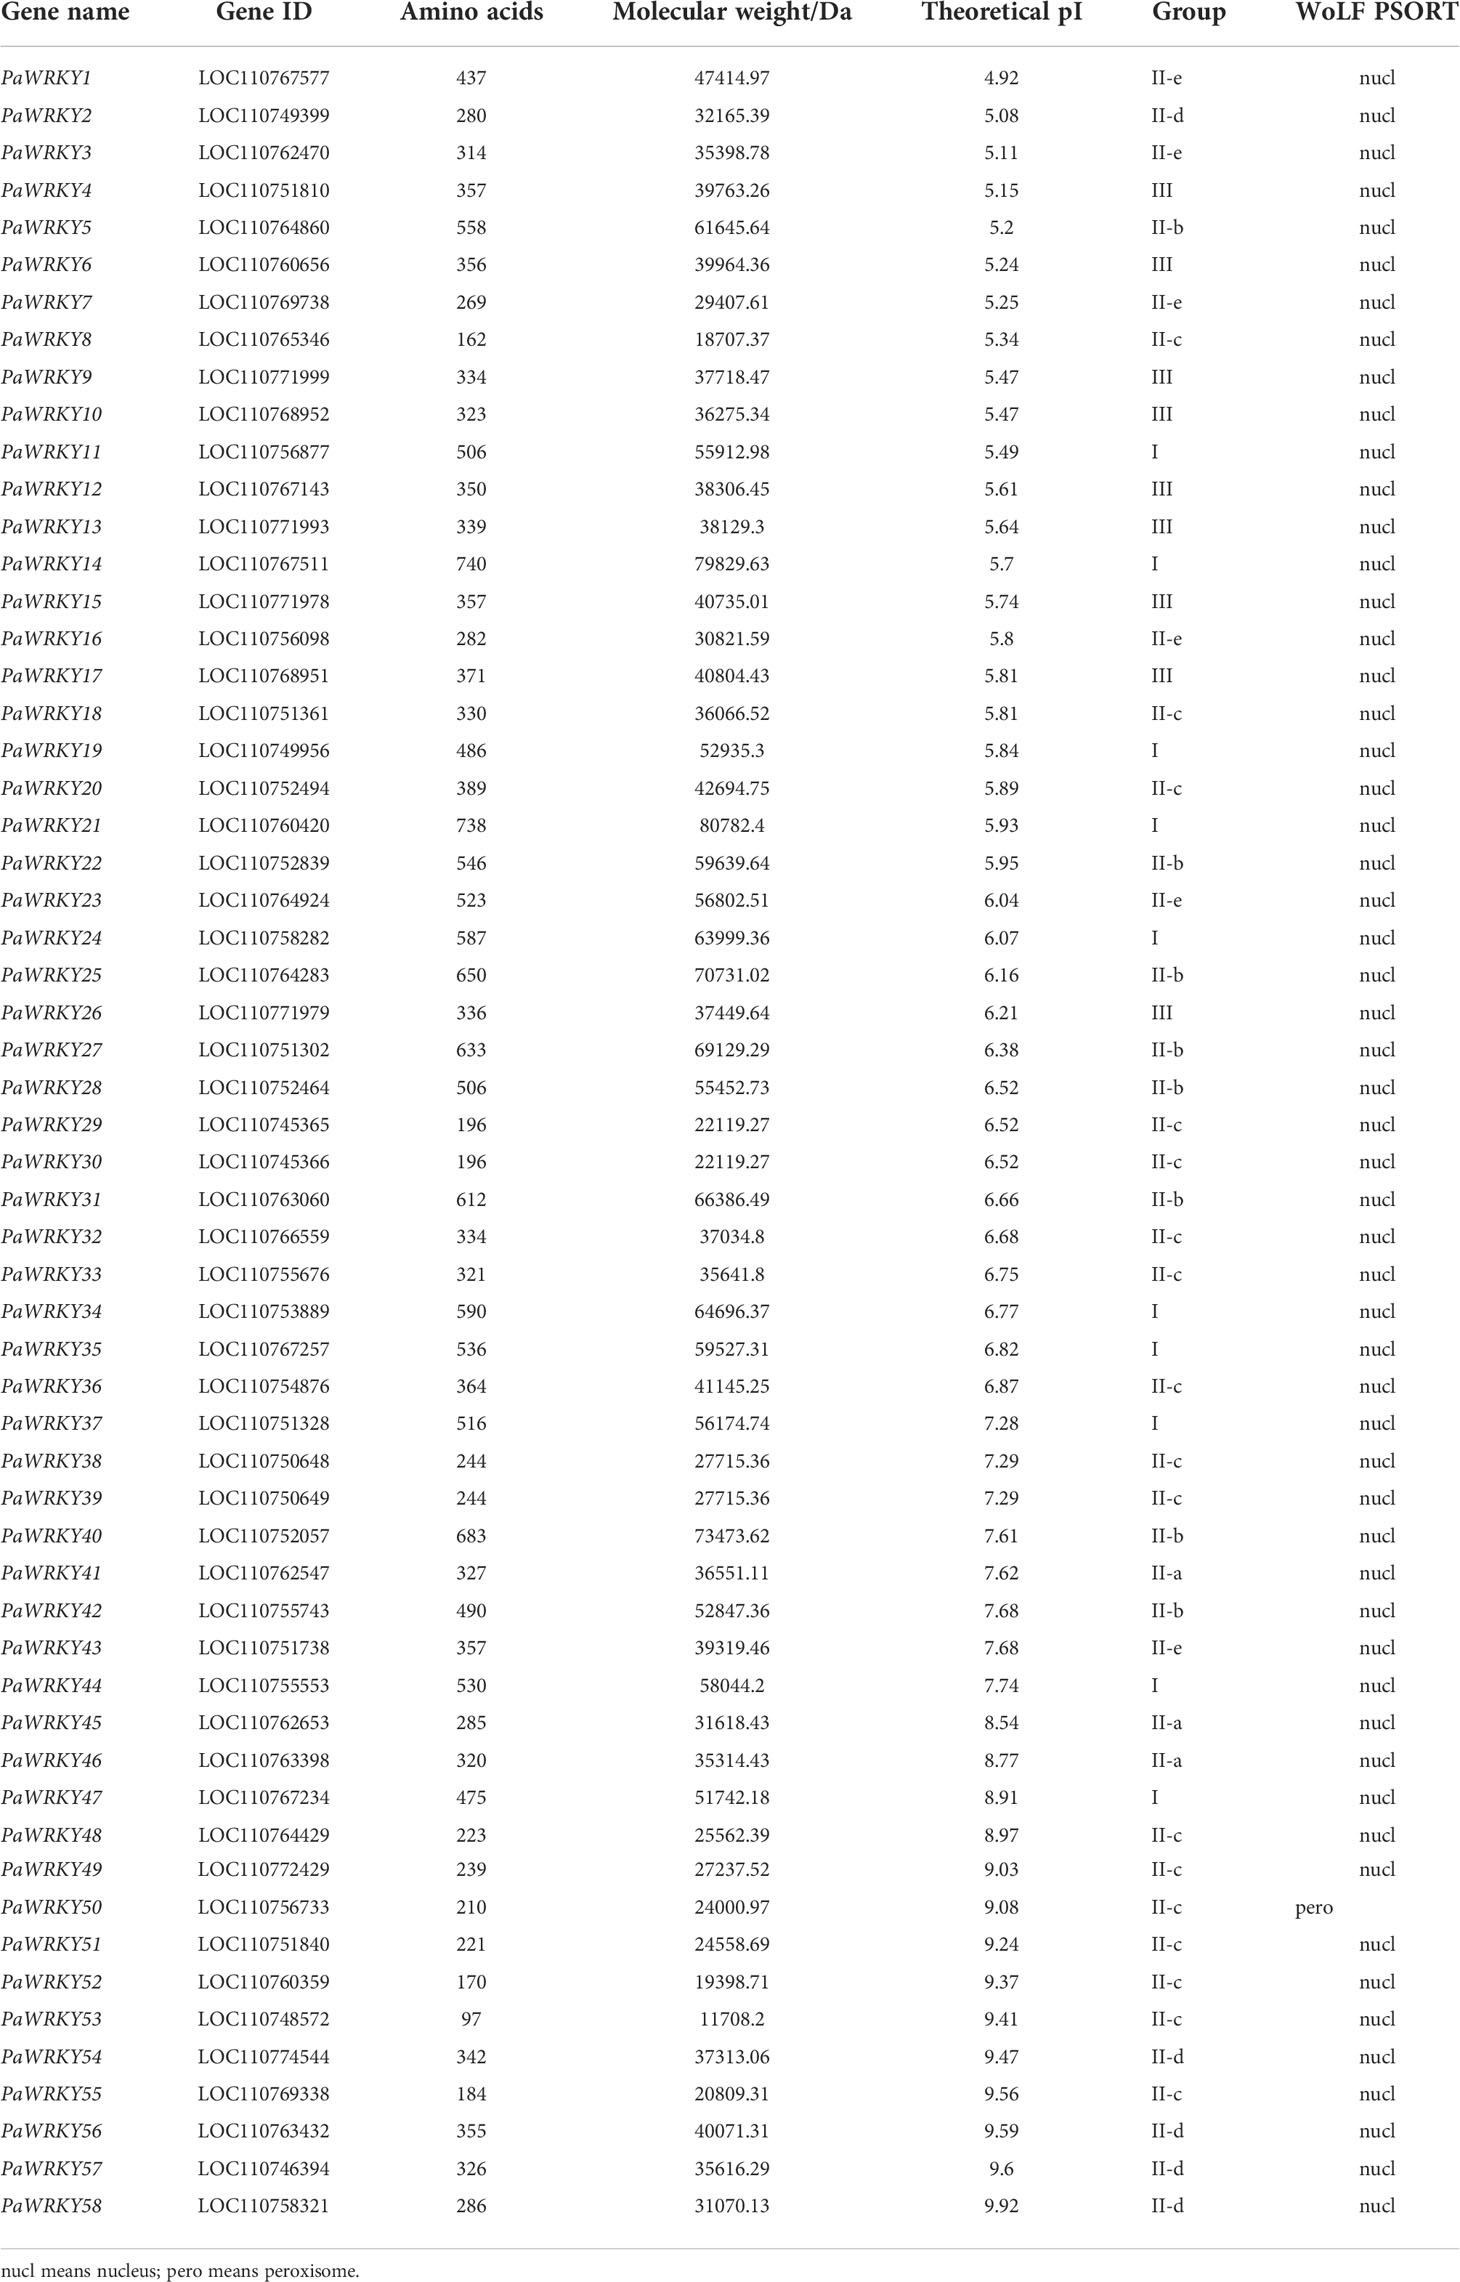
Table 1 Basic information of members of PaWRKYs gene family.
This study selected Arabidopsis thaliana and sweet cherry to construct a phylogenetic tree to analyze the evolutionary relationship of the PaWRKY gene family (Figure 7A). A total of 58 PaWRKY proteins and 70 ATWRKY proteins showed evident clustering in the phylogenetic tree. According to gene clustering, the PaWRKY gene family can be divided into three subfamilies, Group I, Group II, and Group III. The Group II subfamily can also be subdivided into five subfamilies: Group II-a, Group II-b, Group II-c, Group II-d, and Group II-e. Among the seven subgroups, Group II-a subgroup contains the least number of WRKY genes and only three in sweet cherry and Arabidopsis. The largest WRKY gene family is Group II-c, which contains 17 PaWRKY genes and 17 ATWRKY genes. The second groups containing more WRKY genes were Group I (10 PaWRKYs and 14 ATWRKYs) and Group III (9 PaWRKYs and 13 ATWRKYs). The number of WRKY transcription factor family members contained in each combination is shown in Figure 7B.
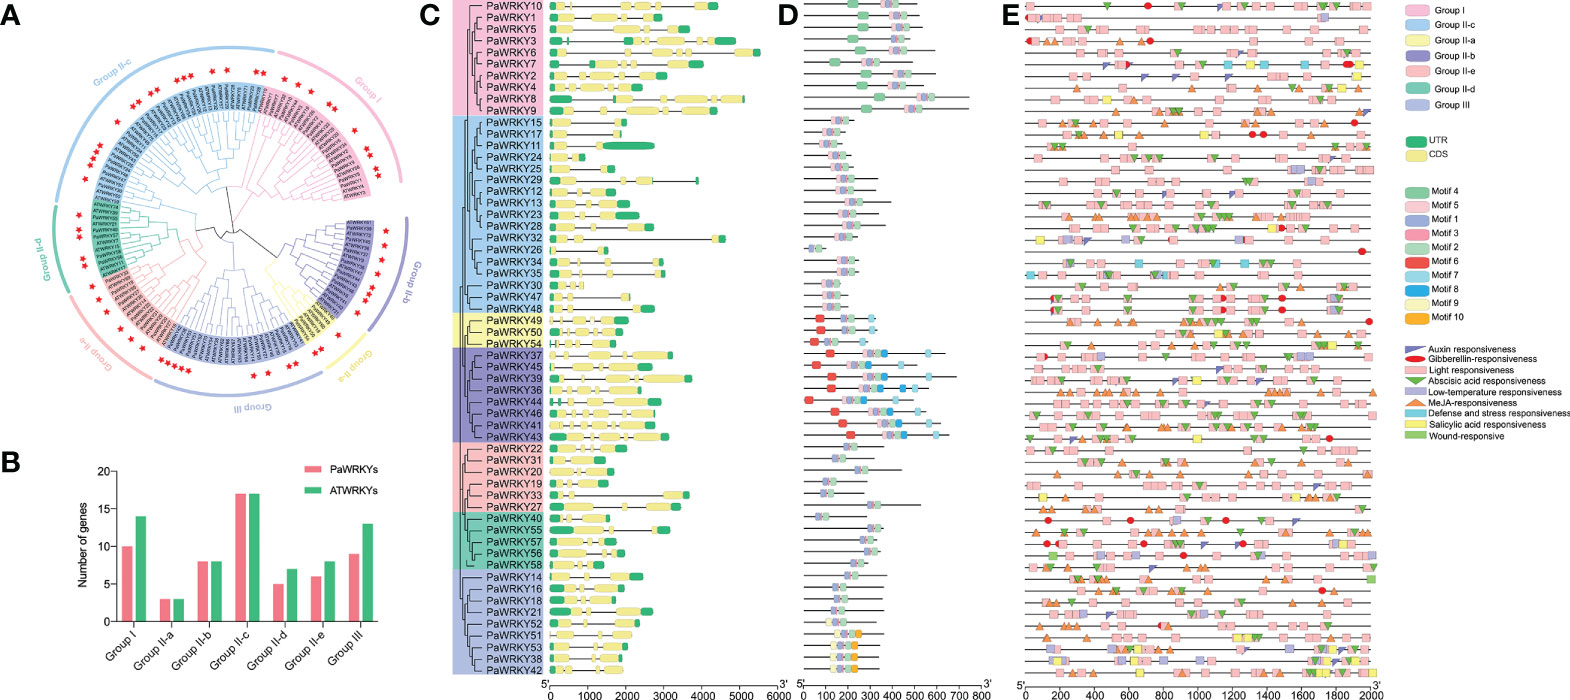
Figure 7 WRKY gene analysis of sweet cherry. (A) The phylogenetic relationship of the WRKY gene in sweet cherry. After aligning the sequences with Clustal W, a phylogenetic tree was constructed according to the neighbor-joining method. (B) The number statistics of PaWRKYs and AtWRKYs in each subfamily. (C) WRKY of sweet cherry Gene families were constructed based on the alignment of full-length amino acid sequences to construct a neighbor-joining tree and analyze gene structure. (D) Conserved motif analysis of the WRKY gene family in sweet cherry. (E) Analysis of functional elements in the promoter region of the WRKY gene family in sweet cherry.
According to the gene structure analysis (Figure 7C), all 58 members of the PaWRKY gene family have coding regions (CDS) and untranslated regions (UTR), of which the longer intron sequence is PaWRKY6. At the same time, PaWRKYs with higher sequence similarity are similar in structure; for example, the coding regions of PaWRKYs belonging to Group III are similar in length and structure. Among them, the gene structure of PaWRKYs in Group III is more conserved than that of other subfamilies.
In addition, to better understand the conserved structure in the PaWRKY protein sequence, MEME software was used to analyze the PaWRKY protein structure, and 10 different conserved motifs were identified (Figure 7D). Most PaWRKY members located in the same subfamily have similar conserved motifs, which are consistent with the grouping of the family phylogenetic tree, showing a certain arrangement. All PaWRKY genes contain the most basic family motif 1, motif 2, and motif 3. In addition, gene members of the Group I subfamily contain motif 4, Group III specifically motif 10, Group II-b specifically motif 8, and Groups II-a and II-b specifically motifs 6 and 7, respectively. This finding suggests that the reason why WRKY family members of different subfamilies are involved in coordinating specific processes of fruit growth and development may be that they have specific conserved structures.
To elucidate the possible regulatory mechanism of the conserved elements in the promoter region of the PaWRKY genes, cis-element analysis was performed on the 2000 bp upstream of the PaWRKYs gene family in sweet cherry. Nine cis-acting elements related to hormones and abiotic stresses were screened among the numerous response elements (Figure 7E). In terms of the number of elements, the light-responsive elements are the most, and they are distributed in the promoter regions of each PaWRKY gene. Every gene contains at least one hormone action element. Among them, ABA-acting and MeJA-acting elements are more abundant than other hormones.
The expression patterns of PaWRKY genes were analyzed according to the FPKM values determined by transcriptome analysis (Figure 8A and Table S4). Among them, except for PaWRKY11, PaWRKY24, PaWRKY26, PaWRKY34, PaWRKY35, PaWRKY47, and PaWRKY51, the expression of the remaining genes was detected in at least one group. The expression patterns of PaWRKY genes had high similarity in different subgroups. During sweet cherry development, the expression of most PaWRKY genes increased with fruit growth, such as PaWRKY5, PaWRKY15, and PaWRKY37. In CK, the expression of PaWRKYs was generally low, and after treatment, the expression of most genes was up-regulated.
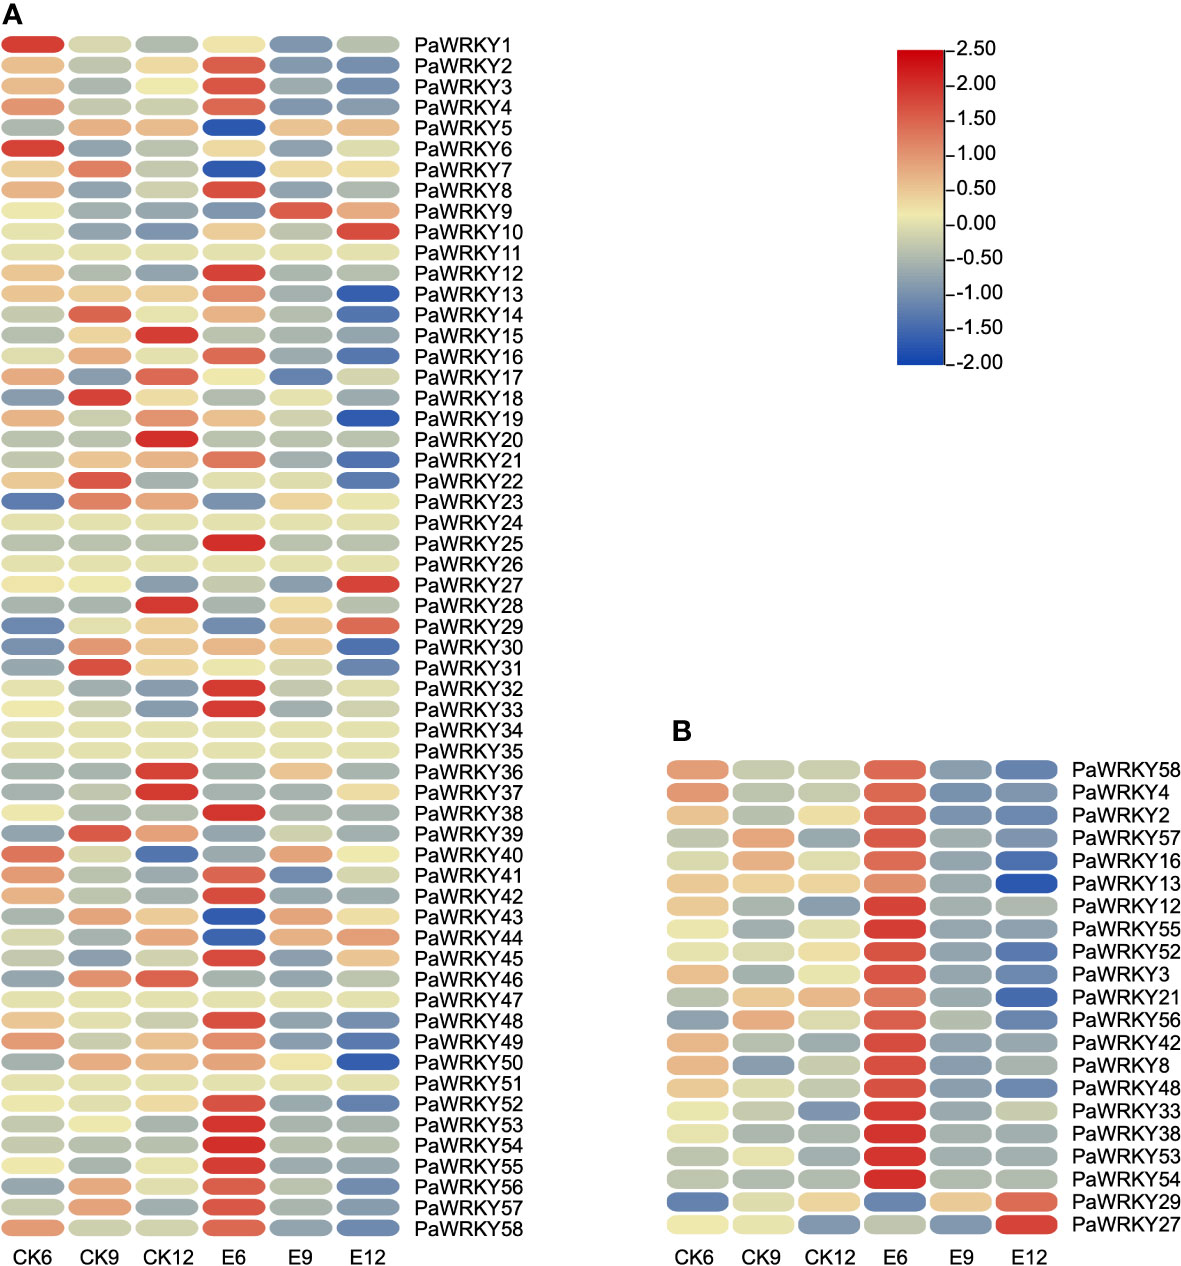
Figure 8 Expression profile of PaWRKYs genes. (A) The expression profile of PaWRKYs gene in three periods after treatment, and the FPKM values of transcription factors were transformed according to log2. (B) The relative expression levels of differentially expressed PaWRKYs family members after gibberellin treatment. The FPKM values of transcription factors were transformed and plotted according to log2.
The up-regulated expression of these genes may be positive regulators of endogenous hormone synthesis. The differentially expressed PaWRKY genes were screened in the transcriptome, and the results are shown in Figure 8B. The figure shows that exogenous use of GA3 generally up-regulated the expression level of the 6th stage and inhibited the expression of the 9th and 12th stages. On the contrary, we found that the high expression of PaWRKY27 and PaWRKY29 was at E12, consistent with the changing pattern of NCED, CYP701, and other genes.
The cognate WRKYs of Arabidopsis thaliana were used to predict the protein interaction network of PaWRKYs (Figure 9A, see the Tables S5 and S6 for detailed annotation information in the figure). The results showed that most PaWRKY proteins interact with multiple proteins, of which 15 proteins can interact with more than four other PaWRKY proteins. For example, PaWRKY2 and PaWRKY4 are expected to interact directly with 13 WRKY proteins, namely, PaWRKY58 (AT4G31550.1 ortholog), PaWRKY18 (AT4G23810.1 ortholog), PaWRKY16 (AT4G23810.1 ortholog), PaWRKY21 (AT2G46400.1 ortholog), and others.
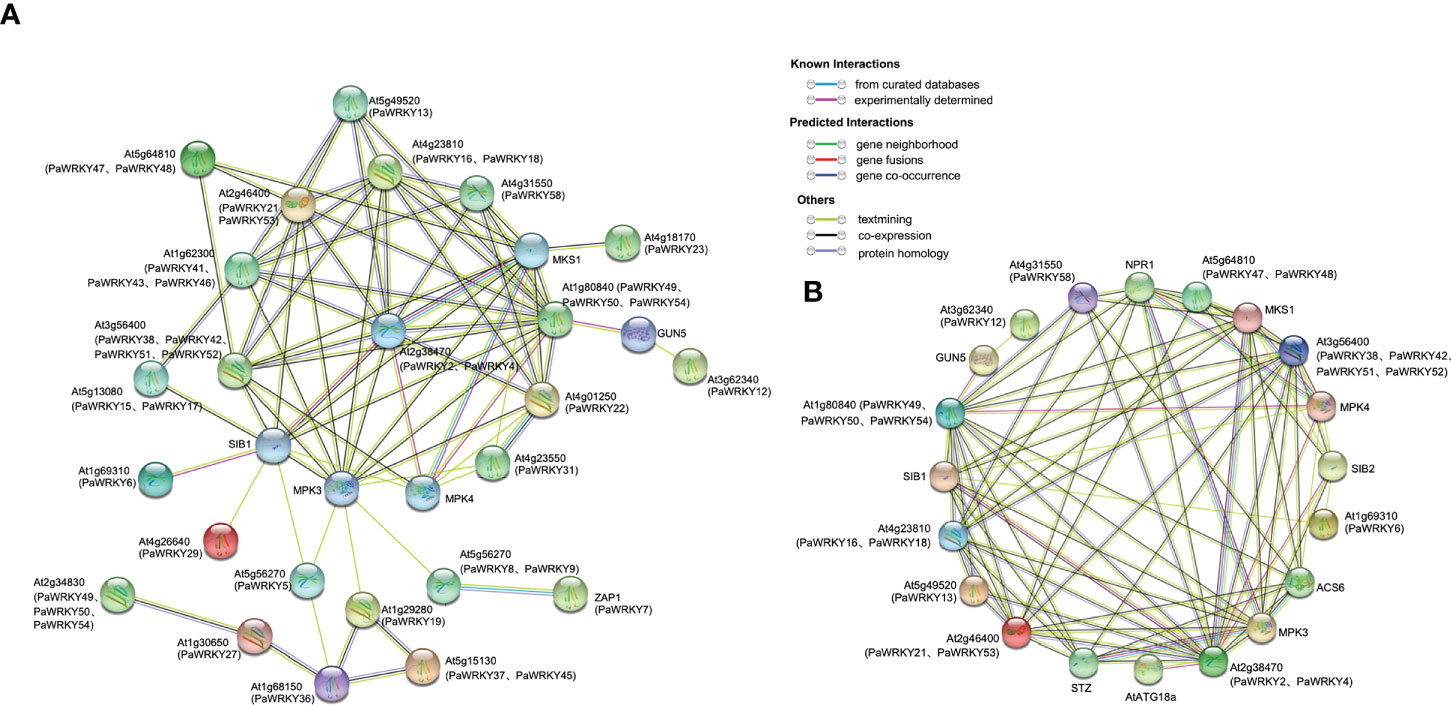
Figure 9 Protein interaction network. (A) Protein interaction network based on Arabidopsis homologous PaWRKYs. Abbreviated names are genes reported in Arabidopsis. The PaWRKYs proteins homologous to Arabidopsis are shown in parentheses. (B) PaWRKYs protein interaction network prediction based on differential expression of homology in Arabidopsis. Abbreviated names are genes reported in Arabidopsis. The PaWRKYs proteins homologous to Arabidopsis are shown in parentheses.
Figure 9A shows that differential genes have more complex relationships in protein interaction prediction. Therefore, we selected PaWRKYs with complex interactions in Figure 9A to further predict protein interaction networks (Figure 9B). These differential PaWRKYs (PaWRKY2, PaWRKY4, PaWRKY12, PaWRKY13, PaWRKY16, PaWRKY21, PaWRKY29, PaWRKY38, PaWRKY48, PaWRKY52, PaWRKY53, PaWRKY54, and PaWRKY58) can directly interact with various proteins, such as MKS1, SIB1, and ACS6. Among them, PaWRKY2 and PaWRKY4 (AT4G31550.1 ortholog) interact directly with 13 proteins, indicating that they may have important regulatory roles. In addition, PaWRKY21, PaWRKY16, PaWRKY53, and PaWRKY58 interact with stress-related proteins, such as MKS1 and MPK4, in response to growth and developmental changes. Overall, the predicted network provides an important reference for functional studies of PaWRKY proteins.
Based on these studies, the PaWRKY genes may play an important role in the growth of sweet cherries. Therefore, the correlation analysis of transcription factors, hormone synthesis-related genes, and related metabolites was performed using Cytoscape software, and the results are shown in Figure 10. The figure shows that these PaWRKYs are closely related to the structural genes involved in the synthesis of various hormones. Among them, PaWRKY29 has a significant positive correlation with ABA and Indolepyruvate and has a strong correlation with NCED. It is a potential positive regulator of ABA and IAA synthesis. Similarly, PaWRKY27 may have the same effect. In addition, PaWRKY38 was positively correlated with crtZ, and the expression of crtZ was inhibited by exogenous GA3, suggesting that PaWRKY38 may inhibit ABA synthesis. Moreover, PaWRKY38 was significantly negatively correlated with GA2ox2, which inhibited the decomposition of GA4 and promoted the accumulation of GA3. Interestingly, the differential genes belonging to Group III (PaWRKY16, PaWRKY21, PaWRKY38, PaWRKY52, and PaWRKY53) were significantly negatively correlated with indolepyruvate, and their correlations ranged from −0.87 to −0.75. These results suggest that genes within Group III are more sensitive to the use of exogenous GA3.
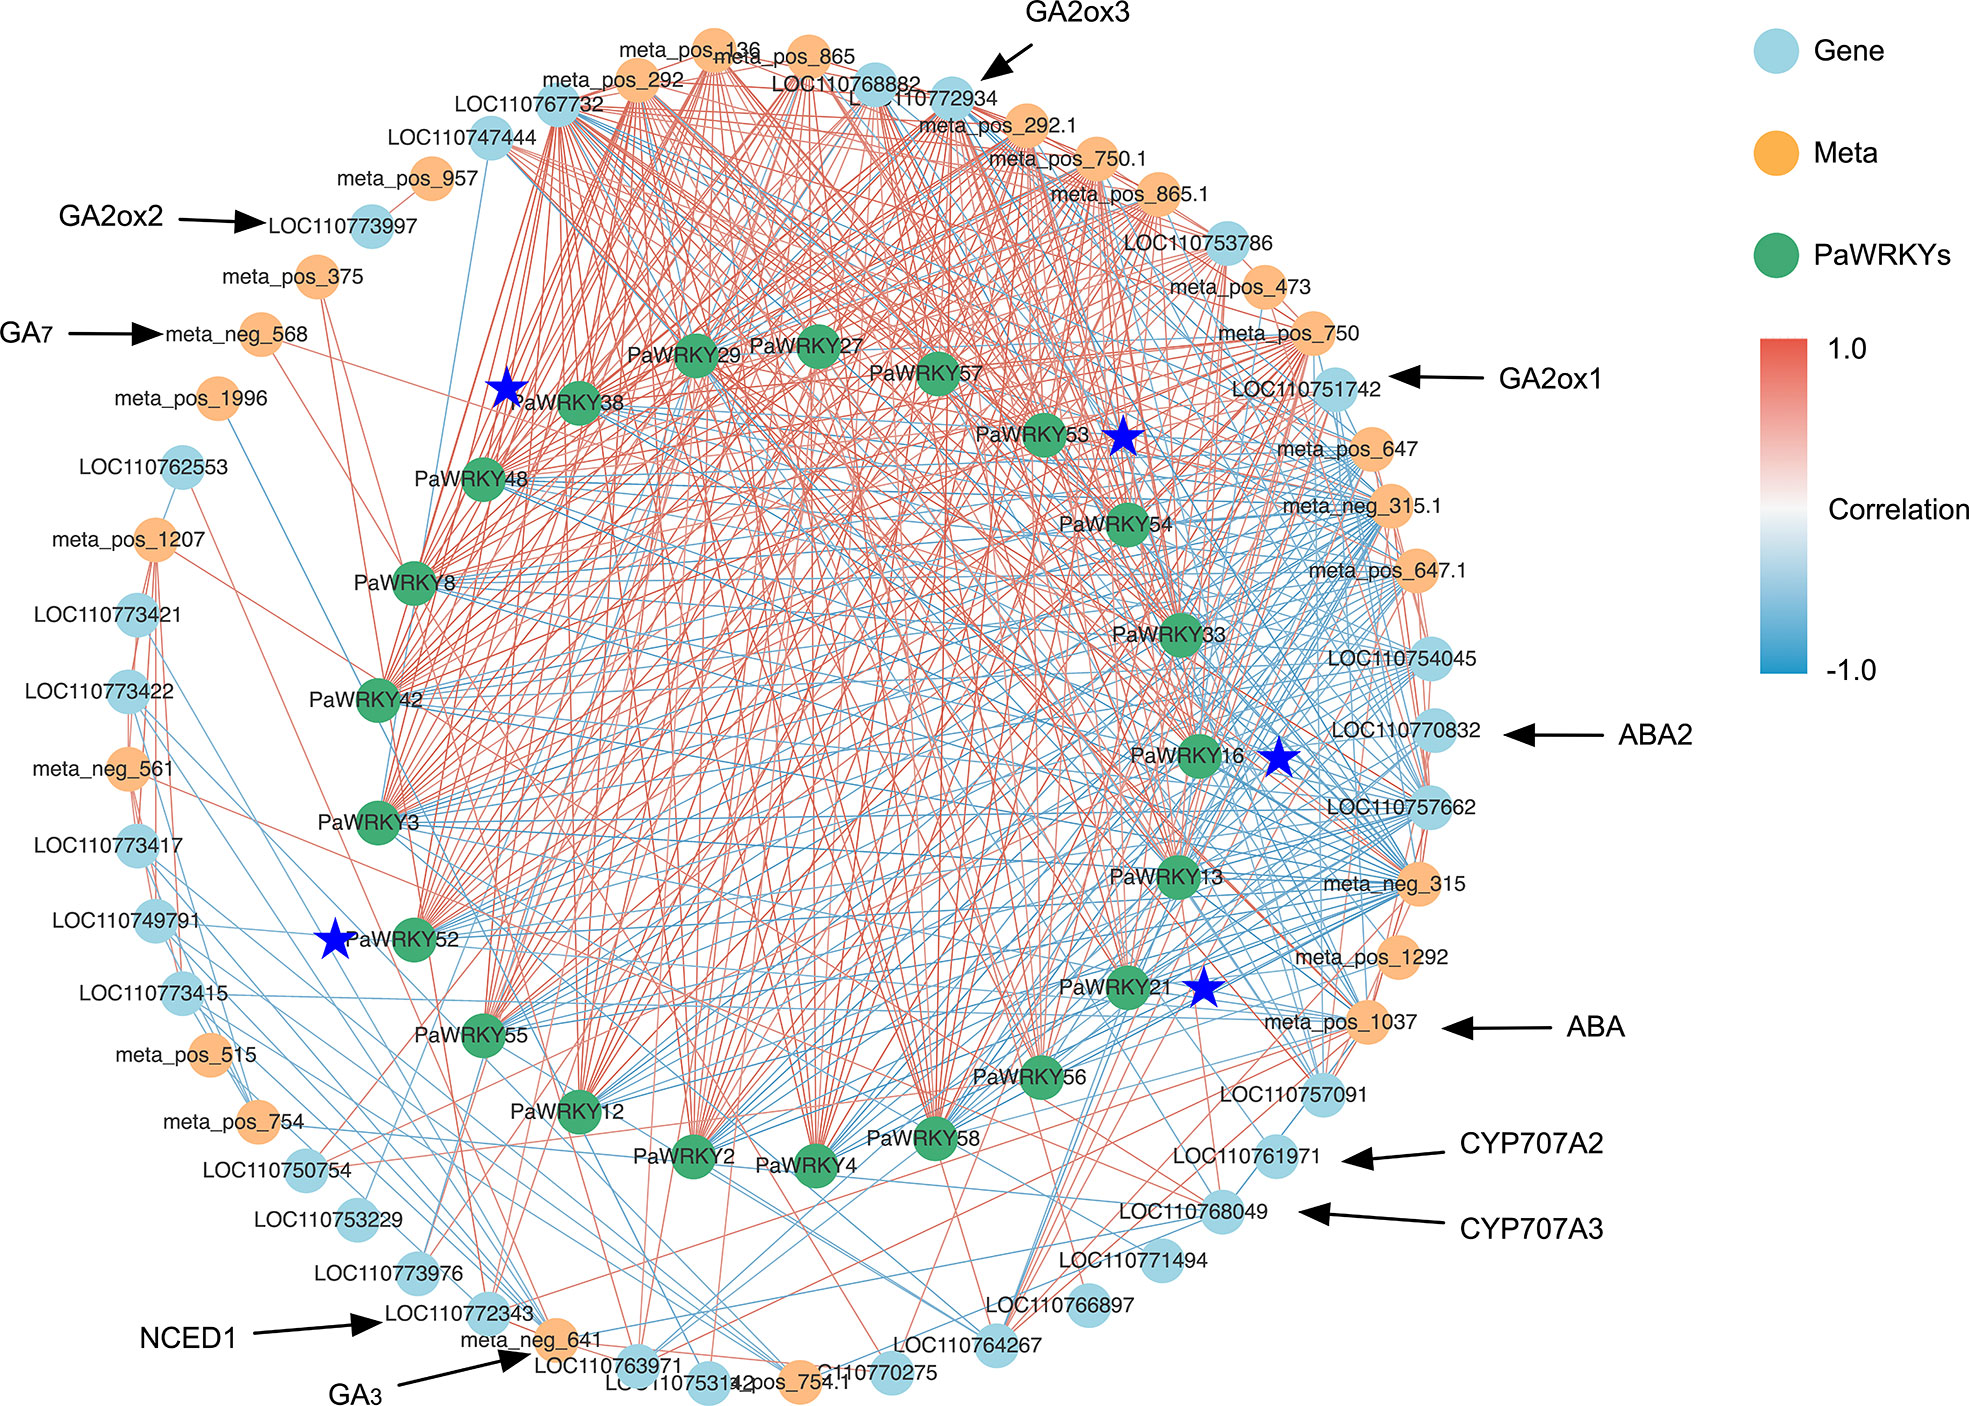
Figure 10 Correlation network analysis. The blue points represent genes, the yellow points represent metabolites, and the green points represent PaWRKYs; the red line represents positive correlation, the blue line represents negative correlation, and the darker the color, the higher the correlation; the genes marked with asterisk belong to PaWRKYs of Group III.
Key genes sensitive to exogenous GA3 were selected from each pathway for qRT-PCR analysis to verify the validity of the transcripts, and the results are shown in Figure 11. The use of exogenous GA3 increased the expression of NCED1 and ABA2, thereby increasing the synthesis of ABA. In addition, two CYP707A genes were inhibited, and the decomposition of ABA was inhibited. The significant decrease in the expression of GA2ox after treatment may be the main reason for the accumulation of GA3. The direct regulatory genes YUCCA and ALDH in the IAA synthesis pathway were highly expressed at E12, which in turn promoted the increase in IAA. JA synthesis-related genes were less sensitive to exogenous GA3, but were generally inhibited and showed low expression. At the same time, some WRKY genes of PaWRKY27, PaWRKY29, and Group III were selected for qRT-PCR verification. Overall, the qRT-PCR results for most structural genes and transcription factors were consistent with the transcriptome data, indicating a high level of confidence in the transcript data.
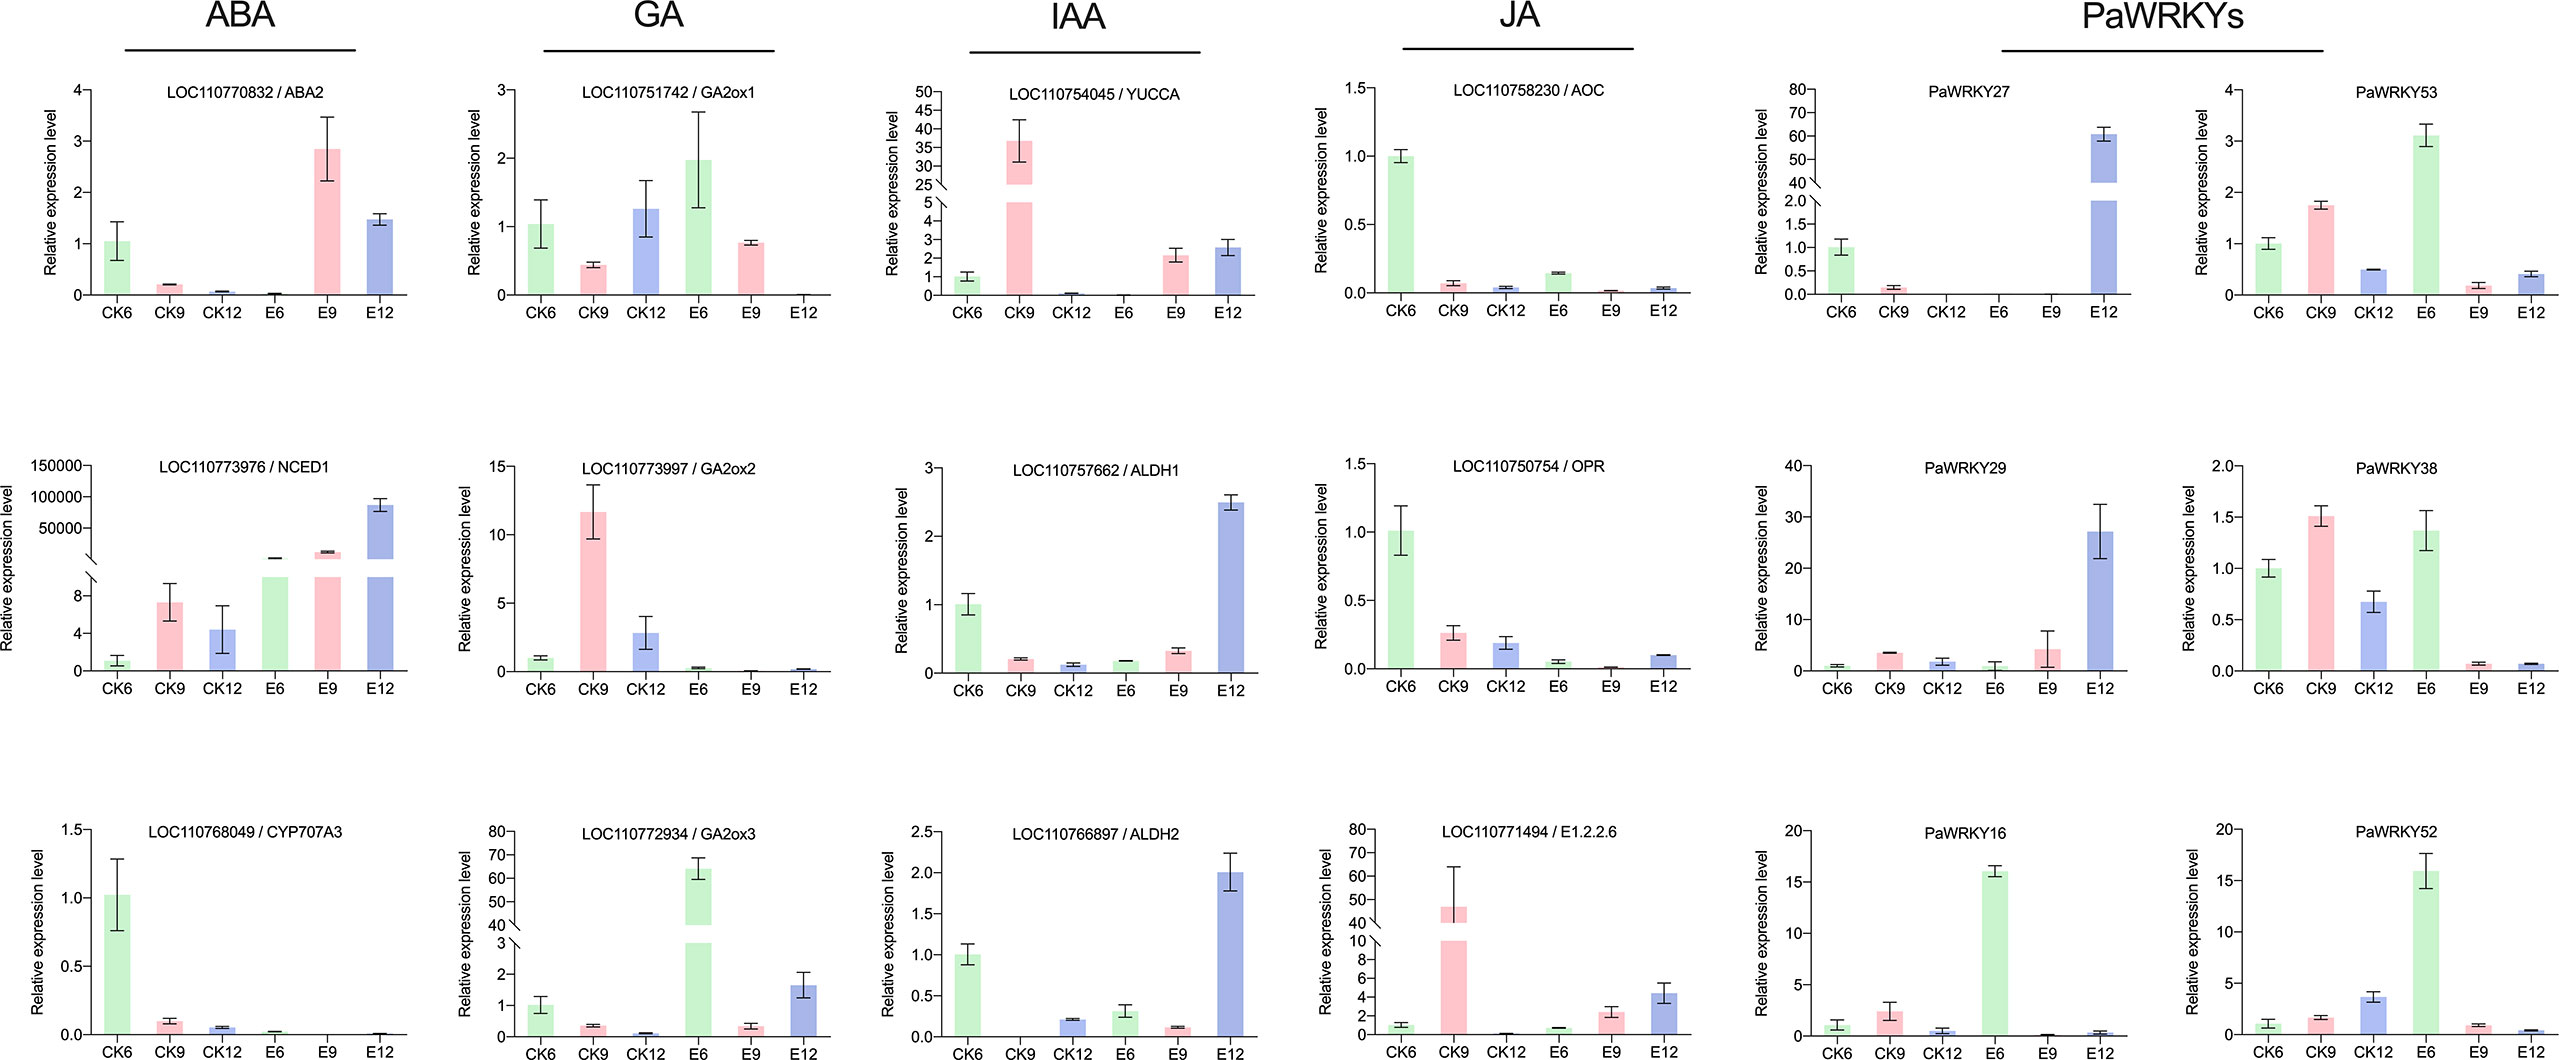
Figure 11 qRT-PCR analysis of genes and transcription factors related to hormone synthesis in sweet cherry after exogenous GA3 treatment.
Self-incompatibility is a serious problem in sweet cherry production, affecting fruit yield and restricting the development of the planting industry (Wu et al., 2013). Artificial pollination can solve this production problem, but the accompanying labor costs increase the cost of sweet cherry production. The study found that exogenous use of GA3 can improve fruit set, reduce labor costs, and effectively solve the cost problem of sweet cherry production (Devasirvatham and Tan, 2022). Aliyu et al. (2011) found that GA3 was the most effective phytohormone to improve fruit yield in cashew nuts treated with various phytohormones at the flowering stage. In addition, similar conclusions are found on sweet cherries. Exogenous use of GA3 can significantly promote parthenocarpic fruit and increase fruit yield (Wen et al., 2019). These results showed the importance of GA3 to the growth of sweet cherry fruit.
In plants, GA3 is a plant hormone with various biological functions. It can not only stimulate plant growth and development, but also mediate various stress responses (Hou et al., 2013). However, the fruit quality also changed after the exogenous use of GA3. When pineapples were treated with GA3 at the flowering stage, the higher concentration indicates higher volume of pulp cells, and the increase in fruit weight becomes more significant (Li et al., 2011). In citrus production, the method of spraying GA3 is often used to reduce the phenomenon of peeling and puffing of citrus, but it brings the problem of the delayed coloring of citrus (Ma et al., 2021). Liu et al. (2022) treated apples with exogenous GA to control cell growth at flowering and young fruit stages, thereby reducing asymmetric fruit. Chen et al. (2020) found that by regulating the level of GA3, the shape and ripening of tomato fruit can be affected. The study found that exogenous use of GA3 often affects fruit quality by affecting the content of endogenous hormones. For example, exogenous use of GA3 increased endogenous GA3 content in citrus and inhibited the rate of fruit browning (Cai et al., 2021). Liu et al. (2011) found that exogenous GA3 could regulate the growth of tiller buds by changing the endogenous ABA, IAA, and ZR contents of rice plants. Therefore, understanding the changing pattern of endogenous hormones after exogenous use of GA3 is greatly important to explore the mechanism of fruit quality changes after GA3 treatment. In this study, after exogenous use of GA3, the content of endogenous ABA, GA3, GA4, IAA, and JA changed with the concentration of use, and the hormone with the most drastic change was ABA. The contents of ABA and GA3 increased significantly after exogenous GA3 treatment, whereas the contents of GA4 and JA were inhibited. Only when the treatment concentration was 60 mg/L, did the content of IAA increase. These results indicated that the effect of exogenous GA3 on fruit yield and quality may be through changing the content of endogenous hormones. This is a systematic study on the changing pattern of endogenous hormones after administering exogenous GA3. This provides a theoretical reference for the application of GA3 in the production of sweet cherries and some ideas for further research on the effect of GA3 on the quality of stone fruit.
We further used the combined transcriptome and metabolome analysis to determine the relevant metabolites and genes in response to exogenous GA3 and identified a total of 2256 DEMs and 10154 DEGs. A large number of metabolites and genes jointly respond to the use of exogenous GA3 to regulate the content of endogenous hormones, thereby affecting the growth and development of sweet cherry fruit and changing fruit quality (Information on the differential metabolites related to the synthesis and metabolism of fruit sugars, acids and flavonoids is shown in Table S7. In this study, the expression levels of NCED and ABA2 were significantly up-regulated, thereby directly affecting the accumulation of endogenous ABA. Similar findings were also found in grapes, where NCED and ABA3 affect fruit quality by participating in ABA biosynthesis (Li et al., 2021). At the same time, the study found that exogenous use of allantoin (Moriyama et al., 2020), acetic acid (Sun et al., 2022), and synthetic strigolactone analogue (Ferrero et al., 2018) improved fruit quality by affecting the expression of the NCED gene. The finding indicates that NCED is highly sensitive to external conditions and is the main regulator of ABA synthesis. In the GA pathway, the expression of the three GA2ox genes that regulate GA4 breakdown was significantly inhibited during maturation, and the expression of the CYP701 gene was significantly upregulated after treatment, indicating that GA2ox and CYP701 cooperate to promote the massive accumulation of GA7 and GA3. In the study of alkaline stress, the authors found that alkaline stress also changed the content of endogenous GA3 by changing the expression of GA2ox (Ma et al., 2022). Bermejo et al. (2018) also made similar conclusions in the study of strawberry, the expression of GA2ox was significantly changed after exogenous use of IAA. Similarly, exogenous use of GA3 and paclobutrazol modulates anthocyanin accumulation in Arabidopsis by affecting GA2ox (Zhang et al., 2017). In tomatoes, specific overexpression of SlGA2ox1 reduced endogenous GA concentrations in the fruit (Chen et al., 2016). In the study of IAA synthesis, we found that after exogenous use of GA3, a large number of DEMs appeared, whereas DEGs were less, indicating the importance of YUCCA and ALDH genes. Similar findings were also found in loquat (Jiang et al., 2016). After exogenous use of GA3, the expression of the YUCCA gene was up-regulated, increasing the IAA content. Compared with the four other hormones, the content of JA was significantly inhibited and down-regulated. The use of exogenous GA3 mainly acts on the genes in front of the JA synthesis pathway, such as OPR, AOC, and E1.3.3.6. In Arabidopsis, AOC and OPR are also key regulatory genes for JA synthesis (Leon-Reyes et al., 2010).
Transcription factor family molecules indicated that WRKY transcription factors were greatly affected by exogenous GA3, and the difference ratio was higher. WRKY transcription factors play crucial roles in regulating various plant growth and developmental processes. However, the WRKY gene family of the sweet cherry has not been widely studied, and its role remains to be explored. Therefore, we systematically analyzed the WRKY gene family of sweet cherry. The 58 PaWRKY gene families were studied in detail by analyzing the phylogeny, gene structure, promoter region, and sequence characteristics. However, the number of WRKY genes in sweet cherries was less than that in apple (127) (Meng et al., 2016), kiwifruit (97) (Jing and Liu, 2018), and pear (103) (Huang et al., 2015), which may be caused by the differences between plant genomes. We classified the 58 PaWRKY proteins into seven subfamilies on the basis of phylogeny. Similar findings were also found in the study of strawberry FaWRKY protein, and the 47 FaWRKY genes were divided into seven subfamilies (Chen and Liu, 2019). Gene structure and conserved motif analysis of PaWRKYs showed that genes belonging to the same subfamily had similar exon and intron organization and similar conserved motifs. These results suggest that PaWRKYs of the same subfamily are closely related in evolution. Among the seven subgroups, Group II contained the largest number of subgroups and genes, indicating its variability. According to previous research results, Group III gene members have the highest activity and play an important role in plant evolution (Wu et al., 2005). In this study, although Group III genes had fewer members, most genes showed differences after the use of GA3, suggesting that it may be a potential regulator of fruit growth. In addition, the protein function prediction indicated that PaWRKY16, PaWRKY21, and PaWRKY53 could directly interact with multiple proteins to regulate fruit growth.
WRKY gene also plays an important role in regulating the content of plant endogenous hormones. Wang et al. (2016) isolated a new WRKY gene CsWRKY2 from Camellia, which can participate in the signaling pathway of ABA synthesis, regulate ABA synthesis, and further improve plant defense against cold and drought stress. CaWRKY40, found in pepper, can be induced by JA-mediated signaling mechanisms, coordinating call responses to heat stress (Dang et al., 2013). In tobacco, overexpression of NtWRKY50 resulted in altered JA levels and increased plant resistance (Liu et al., 2017). WRKY gene can cooperate with structural genes related to endogenous hormone synthesis to influence endogenous hormones. For example, Yan et al. (2014) found that the cotton transcription factor GhWRKY17 can reduce ABA levels by inhibiting the expression of the NCED gene, thereby regulating the sensitivity to drought. Similarly, GhWRKY1 was found to interact with the “W-box” cis-elements of the promoters of AtNCED2, AtNCED5, AtNCED6, and AtNCED9 in Arabidopsis to promote ABA biosynthesis (Hu et al., 2021). In Pyrus betulaefolia, PbrWRKY53 can bind to the W-box element in the promoter region of PbrNCED1 to promote the synthesis of vitamin C and ABA, thereby improving drought tolerance (Liu et al., 2019). In addition, WRKY was found to be involved in the IAA signaling process in plants (Jin et al., 2018). The correlation between the WRKY gene and IAA metabolites or genes in this study also indicates that the PaWRKY gene in sweet cherries may be involved in the IAA signaling process
In summary, the WRKY gene can participate in the signal response process of various plant hormones, such as ABA and JA, and is widely involved in the growth and development of plants. In this study, potential regulatory genes in response to exogenous GA3 changes were initially screened by a combination of transcription and metabolism methods, which laid the foundation for sweet cherry fruit production. However, the specific regulatory mechanism of WRKY transcription factor and endogenous hormone synthesis related structural genes is still unclear and requires further analysis.
The datasets presented in this study can be found in online repositories and Supplementary Material. The metabolome and transcriptome proposed in the study are deposited in the National Genomics Data Center database. You can query the metabolome data by visiting the link (https://ngdc.cncb.ac.cn/omix/release/OMIX001762) (BioProject: PRJCA010046; Accession number: OMI001762); You can query transcriptome data by visiting the link (https://ngdc.cncb.ac.cn/gsa/browse/CRA007287) (BioProject: PRJCA010046; accession number: CRA007287).
RG and CC: conceptualization. CC and HC: data curation. YC and WY: formal analysis. CC, WT, HS, and YZ: investigation. CC and HC: software. CC: writing–original draft. ML, BS, RG, and HS: writing–editing. RG: supervision. All authors read and approved the final manuscript.
This research was funded by the Sichuan Science and Technology Plan Project (Key R&D Project) (2021YFN0081, 2021YFN0082). The funders had no rolein the design of the study in the collection, analyses, or interpretation of data, in the writing of the manuscript, or in thedecision to publish the results.
The authors declare that the research was conducted in the absence of any commercial or financial relationships that could be construed as a potential conflict of interest.
All claims expressed in this article are solely those of the authors and do not necessarily represent those of their affiliated organizations, or those of the publisher, the editors and the reviewers. Any product that may be evaluated in this article, or claim that may be made by its manufacturer, is not guaranteed or endorsed by the publisher.
The Supplementary Material for this article can be found online at: https://www.frontiersin.org/articles/10.3389/fpls.2022.1041068/full#supplementary-material
Aliyu, O. M., Adeigbe, O. O., Awopetu, J. A. (2011). Foliar application of the exogenous plant hormones at pre-blooming stage improves flowering and fruiting in cashew (Anacardium occidentale l.). J. Crop Sci. Biotechnol. 14, 143–150. doi: 10.1007/s12892-010-0070-3
Askarieh, A., Suleiman, S., Tawakalna, M. (2021). Sweet cherry (Prunus avium l.) fruit drop reduction by plant growth regulators (Naphthalene acetic acid NAA and gibberellic acid GA3). Am. J. Plant Sci. 12, 1338–1346. doi: 10.4236/ajps.2021.129094
Bawa, G., Feng, L., Chen, G., Chen, H., Hu, Y., Pu, T., et al. (2020). Gibberellins and auxin regulate soybean hypocotyl elongation under low light and high-temperature interaction. Physiologia plantarum. 170, 345–356. doi: 10.1111/ppl.13158
Bermejo, A., Granero, B., Mesejo, C., Reig, C., Tejedo, V., Agustí, M., et al. (2018). Auxin and gibberellin interact in citrus fruit set. J. Plant Growth Regul. 37, 491–501. doi: 10.1007/s00344-017-9748-9
Cai, N., Chen, C., Wan, C., Chen, J. (2021). Effects of pre-harvest gibberellic acid spray on endogenous hormones and fruit quality of kumquat (Citrus japonica) fruits. New Z. J. Crop Hortic. Science. 49, 211–224. doi: 10.1080/01140671.2020.1806084
Chen, P., Liu, Q. (2019). Genome-wide characterization of the WRKY gene family in cultivated strawberry (Fragaria× ananassa duch.) and the importance of several group III members in continuous cropping. Sci. Rep. 9, 1–12. doi: 10.1038/s41598-019-44479-7
Chen, S., Wang, X. J., Tan, G. F., Zhou, W. Q., Wang, G. L. (2020). Gibberellin and the plant growth retardant paclobutrazol altered fruit shape and ripening in tomato. Protoplasma. 257, 853–861. doi: 10.1007/s00709-019-01471-2
Chen, S., Wang, X. J., Zhang, L. Y., Lin, S. S., Liu, D. C., Wang, Q. Z., et al. (2016). Identification and characterization of tomato gibberellin 2-oxidases (GA2oxs) and effects of fruit-specific SlGA2ox1 overexpression on fruit and seed growth and development. Horticulture Res. 3, 16059. doi: 10.1038/hortres.2016.59
Dang, F. F., Wang, Y. N., Yu, L., Eulgen, T., Lai, Y., Liu, Z. Q., et al. (2013). CaWRKY40, a WRKY protein of pepper, plays an important role in the regulation of tolerance to heat stress and resistance to ralstonia solanacearum infection. Plant Cell Environment. 36, 757–774. doi: 10.1111/pce.12011
Devasirvatham, V., Tan, D. K. Y. (2022). Key determinants of the physiological and fruit quality traits in sweet cherries and their importance in a breeding programme. Horticulturae. 8, 694. doi: 10.3390/horticulturae8080694
Faienza, M. F., Corbo, F., Carocci, A., Catalano, A., Clodoveo, M. L., Grano, M., et al. (2020). Novel insights in health-promoting properties of sweet cherries. J. Funct. foods. 69, 103945. doi: 10.1016/j.jff.2020.103945
Ferrero, M., Pagliarani, C., Novák, O., Ferrandino, A., Cardinale, F., Visentin, I., et al. (2018). Exogenous strigolactone interacts with abscisic acid-mediated accumulation of anthocyanins in grapevine berries. J. Exp. botany. 69, 2391–2401. doi: 10.1093/jxb/ery033
Hou, X., Ding, L., Yu, H. (2013). Crosstalk between GA and JA signaling mediates plant growth and defense. Plant Cell Rep. 32, 1067–1074. doi: 10.1007/s00299-013-1423-4
Huang, X., Li, K., Xu, X., Yao, Z., Jin, C., Zhang, S. (2015). Genome-wide analysis of WRKY transcription factors in white pear (Pyrus bretschneideri) reveals evolution and patterns under drought stress. BMC Genomics 16, 1–14. doi: 10.1186/s12864-015-2233-6
Hu, Q., Ao, C., Wang, X., Wu, Y., Du, X. (2021). GhWRKY1-like, a WRKY transcription factor, mediates drought tolerance in Arabidopsis via modulating ABA biosynthesis. BMC Plant Biol. 21, 458. doi: 10.1186/s12870-021-03238-5
Jaillais, Y., Chory, J. (2010). Unraveling the paradoxes of plant hormone signaling integration. Nat. Struct. Mol. Biol. 17, 642–645. doi: 10.1038/nsmb0610-642
Jiang, S., Luo, J., Xu, F., Zhang, X. (2016). Transcriptome analysis reveals candidate genes involved in gibberellin-induced fruit setting in triploid loquat (Eriobotrya japonica). Front. Plant science. 7. doi: 10.3389/fpls.2016.01924
Jing, Z., Liu, Z. (2018). Genome-wide identification of WRKY transcription factors in kiwifruit (Actinidia spp.) and analysis of WRKY expression in responses to biotic and abiotic stresses. Genes Genomics 40, 429–446. doi: 10.1007/s13258-017-0645-1
Jin, W., Zhou, Q., Wei, Y., Yang, J., Hao, F., Cheng, Z., et al. (2018). NtWRKY-R1, a novel transcription factor, integrates IAA and JA signal pathway under topping damage stress in Nicotiana tabacum. Front. Plant science. 8. doi: 10.3389/fpls.2017.02263
Kivistik, A., Jakobson, L., Kahu, K., Laanemets, K. (2022). Wild and rare self-incompatibility allele S17 found in 24 sweet cherry (Prunus avium l.) cultivars. Plant Mol. Biol. Reporter. 40, 376–388. doi: 10.1007/s11105-021-01327-1
Kou, E., Huang, X., Zhu, Y., Su, W., Liu, H., Sun, G., et al. (2021). Crosstalk between auxin and gibberellin during stalk elongation in flowering Chinese cabbage. Sci. Rep. 11, 1–9. doi: 10.1038/S41598-021-83519-Z
Kuhn, N., Ponce, C., Arellano, M., Time, A., Sagredo, B., Donoso, J. M., et al. (2020). Gibberellic acid modifies the transcript abundance of ABA pathway orthologs and modulates sweet cherry (Prunus avium) fruit ripening in early-and mid-season varieties. Plants. 9, 1796. doi: 10.3390/plants9121796
Leon-Reyes, A., van der Does, D., De, Lange, E. S., et al. (2010). Salicylate-mediated suppression of jasmonate-responsive gene expression in Arabidopsis is targeted downstream of the jasmonate biosynthesis pathway. Planta. 232, 1423–1432. doi: 10.1007/s00425-010-1265-z
Liao, X., Li, M., Liu, B., Yan, M., Yu, X., Zi, H., et al. (2018). Interlinked regulatory loops of ABA catabolism and biosynthesis coordinate fruit growth and ripening in woodland strawberry. Proc. Natl. Acad. Sci. 115, E11542–E11550. doi: 10.1073/pnas.1812575115
Lin, Q., Zhang, Z., Wu, F., Feng, M., Sun, Y., Chen, W., et al. (2020). The APC/CTE E3 ubiquitin ligase complex mediates the antagonistic regulation of root growth and tillering by ABA and GA. Plant Cell. 32, 1973–1987. doi: 10.1105/tpc.20.00101
Li, D., Pang, Y., Li, H., Wang, R., Ma, C. (2021). Comparative analysis of the gene expression profile under two cultivation methods reveals the critical role of ABA in grape quality promotion. Scientia Horticulturae. 281, 109924. doi: 10.1016/j.scienta.2021.109924
Liu, Y., Ding, Y. F., Wang, Q. S., Guo, D., Wang, R., Ma, C., et al. (2011). Effect of plant growth regulators on growth of rice tiller bud and changes of endogenous hormones. Acta Agronomica Sinica. 37, 670–676. doi: 10.1016/S1875-2780(11)60019-9
Liu, Q., Liu, Y., Tang, Y., Chen, J., Ding, W. (2017). Overexpression of NtWRKY50 increases resistance to ralstonia solanacearum and alters salicylic acid and jasmonic acid production in tobacco. Front. Plant science. 8. doi: 10.3389/fpls.2017.01710
Liu, C., Xiao, P., Jiang, F., Wang, S., Liu, Z., Song, G., et al. (2022). Exogenous gibberellin treatment improves fruit quality in self-pollinated apple. Plant Physiol. Biochem. 174, 11–21. doi: 10.1016/j.plaphy.2022.01.029
Liu, Y., Yang, T., Lin, Z., Gu, B., Xing, C., Zhao, L., et al. (2019). A WRKY transcription factor PbrWRKY53 from Pyrus betulaefolia is involved in drought tolerance and AsA accumulation. Plant Biotechnol. J. 17, 1770–1787. doi: 10.1111/pbi.13099
Li, Y. H., Wu, Y. J., Wu, B., Zou, M. H., Zhang, Z., Sun, G. M. (2011). Exogenous gibberellic acid increases the fruit weight of ‘Comte de paris’ pineapple by enlarging flesh cells without negative effects on fruit quality. Acta Physiol. Plant 33, 1715–1722. doi: 10.1007/s11738-010-0708-2
Ma, Q., Yuan, Y., Wu, E., Wang, H., Dang, K., Feng, Y., et al. (2022). Endogenous bioactive gibberellin/abscisic acids and enzyme activity synergistically promote the phytoremediation of alkaline soil by broomcorn millet (Panicum miliaceum l.). J. Environ. Management. 305, 114362. doi: 10.1016/j.jenvman.2021.114362
Ma, G., Zhang, L., Kudaka, R., Inaba, H., Furuya, T., Kitamura, M., et al. (2021). Exogenous application of ABA and NAA alleviates the delayed coloring caused by puffing inhibitor in citrus fruit. Cells. 10, 308. doi: 10.3390/cells10020308
Meng, D., Li, Y., Bai, Y., Li, M., Cheng, L. (2016). Genome-wide identification and characterization of WRKY transcriptional factor family in apple and analysis of their responses to waterlogging and drought stress. Plant Physiol. Biochem. 103, 71–83. doi: 10.1016/j.plaphy.2016.02.006
Mesejo, C., Yuste, R., Reig, C., Martínez-Fuentes, A., Iglesias, D. J., Muñoz-Fambuena, N., et al. (2016). Gibberellin reactivates and maintains ovary-wall cell division causing fruit set in parthenocarpic citrus species. Plant Science. 247, 13–24. doi: 10.1016/j.plantsci.2016.02.018
Moriyama, A., Nojiri, M., Watanabe, G., Enoki, S., Suzuki, S. (2020). Exogenous allantoin improves anthocyanin accumulation in grape berry skin at early stage of ripening. J. Plant Physiol. 253, 153253. doi: 10.1016/j.jplph.2020.153253
Niu, Q., Wang, T., Li, J., Yang, Q., Qian, M., Teng, Y. (2015). Effects of exogenous application of GA4+7 and n-(2-chloro-4-pyridyl)-N′-phenylurea on induced parthenocarpy and fruit quality in Pyrus pyrifolia ‘Cuiguan’. Plant Growth Regul. 76, 251–258. doi: 10.1007/s10725-014-9995-8
Ozkan, Y., Ucar, M., Yildiz, K., Ozturk, B. (2016). Pre-harvest gibberellic acid (GA3) treatments play an important role on bioactive compounds and fruit quality of sweet cherry cultivars. scientia. Horticulturae. 211, 358–362. doi: 10.1016/j.scienta.2016.09.019
Papapetros, S., Louppis, A., Kosma, I., Kontakos, S., Badeka, A., Kontominas, M. G. (2018). Characterization and differentiation of botanical and geographical origin of selected popular sweet cherry cultivars grown in Greece. J. Food Composition Analysis. 72, 48–56. doi: 10.1016/j.jfca.2018.06.006
Rachappanavar, V., Padiyal, A., Sharma, J. K., Gupta, S. K. (2022). Plant hormone-mediated stress regulation responses in fruit crops-a review. scientia. Horticulturae. 304, 111302. doi: 10.1016/j.scienta.2022.111302
Sun, T., Zhang, J., Zhang, Q., Li, X., Li, M., Yang, Y., et al. (2022). Exogenous application of acetic acid enhances drought tolerance by influencing the MAPK signaling pathway induced by ABA and JA in apple plants. Tree Physiol. 42, 1827–40. doi: 10.1093/treephys/tpac034
Tijero, V., Teribia, N., Munné-Bosch, S. (2019). Hormonal profiling reveals a hormonal cross-talk during fruit decay in sweet cherries. J. Plant Growth Regulation. 38, 431–437. doi: 10.1007/s00344-018-9852-5
Tiwari, A., Offringa, R., Heuvelink, E. (2012). Auxin-induced fruit set in Capsicum annuum l. requires downstream gibberellin biosynthesis. J. Plant Growth Regulation. 31, 570–578. doi: 10.1007/s00344-012-9267-7
Torres, C. A., Sepúlveda, G., Kahlaoui, B. (2017). Phytohormone interaction modulating fruit responses to photooxidative and heat stress on apple (Malus domestica borkh.). Front. Plant Sci. 8. doi: 10.3389/fpls.2017.02129
Wang, Y., Shu, Z., Wang, W., Jiang, X., Li, D., Pan, J., et al. (2016). CsWRKY2, a novel WRKY gene from Camellia sinensis, is involved in cold and drought stress responses. Biol. Plant 60, 443–451. doi: 10.1007/s10535-016-0618-2
Watanabe, M., Segawa, H., Murakami, M., Sagawa, S., Komori, S.. (2008). Effects of plant growth regulators on fruit set and fruit shape of parthenocarpic apple fruits. J. Japanese Soc. Hortic. Science. 77, 350–357. doi: 10.2503/jjshs1.77.350
Wen, B., Song, W., Sun, M., Chen, M., Mu, Q., Zhang, X., et al. (2019). Identification and characterization of cherry (Cerasus pseudocerasus g. don) genes responding to parthenocarpy induced by GA3 through transcriptome analysis. BMC Genet. 20, 65. doi: 10.1186/s12863-019-0746-8
Wu, J., Gu, C., Khan, M. A., Wu, J., Gao, Y., Wang, C., et al. (2013). Molecular determinants and mechanisms of gametophytic self-incompatibility in fruit trees of rosaceae. Crit. Rev. Plant Sci. 32, 53–68. doi: 10.1080/07352689.2012.715986
Wu, K. L., Guo, Z. J., Wang, H. H., Li, J., et al. (2005). The WRKY family of transcription factors in rice and arabidopsis and their origins. DNA Res. 12, 9–26. doi: 10.1093/dnares/12.1.9
Yan, H., Jia, H., Chen, X., Hao, L., An, H., Guo, X. (2014). The cotton WRKY transcription factor GhWRKY17 functions in drought and salt stress in transgenic Nicotiana benthamiana through ABA signaling and the modulation of reactive oxygen species production. Plant Cell Physiol. 55, 2060–2076. doi: 10.1093/pcp/pcu133
Zhang, Y., Liu, Z., Liu, J., Lin, S., Wang, J., Lin, W., et al. (2017). GA-DELLA pathway is involved in regulation of nitrogen deficiency-induced anthocyanin accumulation. Plant Cell Rep. 36 (4), 557–569. doi: 10.1007/s00299-017-2102-7
Keywords: sweet cherry, transcriptome, metabolome, endogenous hormones, wrky, gibberellin
Citation: Chen C, Chen H, Chen Y, Yang W, Li M, Sun B, Song H, Tang W, Zhang Y and Gong R (2022) Joint metabolome and transcriptome analysis of the effects of exogenous GA3 on endogenous hormones in sweet cherry and mining of potential regulatory genes. Front. Plant Sci. 13:1041068. doi: 10.3389/fpls.2022.1041068
Received: 10 September 2022; Accepted: 23 September 2022;
Published: 18 October 2022.
Edited by:
Lin Chen, Institute of Animal Sciences (CAAS), ChinaReviewed by:
Qinggang Zhu, Northwest A&F University, ChinaCopyright © 2022 Chen, Chen, Chen, Yang, Li, Sun, Song, Tang, Zhang and Gong. This is an open-access article distributed under the terms of the Creative Commons Attribution License (CC BY). The use, distribution or reproduction in other forums is permitted, provided the original author(s) and the copyright owner(s) are credited and that the original publication in this journal is cited, in accordance with accepted academic practice. No use, distribution or reproduction is permitted which does not comply with these terms.
*Correspondence: Ronggao Gong, Z29uZ3JvbmdnYW9Ac2ljYXUuZWR1LmNu
Disclaimer: All claims expressed in this article are solely those of the authors and do not necessarily represent those of their affiliated organizations, or those of the publisher, the editors and the reviewers. Any product that may be evaluated in this article or claim that may be made by its manufacturer is not guaranteed or endorsed by the publisher.
Research integrity at Frontiers
Learn more about the work of our research integrity team to safeguard the quality of each article we publish.