 Hongling Liu
 Xing Liu
 Xiaojun Chang4
 Fei Chen
 Zhenguo Lin
 Liangsheng Zhang
- 1Hainan Institute of Zhejiang University, Sanya, China
- 2Genomics and Genetic Engineering Laboratory of Ornamental Plants, College of Agriculture and Biotechnology, Zhejiang University, Hangzhou, China
- 3College of Life Science, Fujian Agriculture and Forestry University, Fuzhou, China
- 4Laboratory of Medicinal Plant Biotechnology, School of Pharmaceutical Sciences, Zhejiang Chinese Medical University, Hangzhou, China
- 5Hainan Key Laboratory for Sustainable Utilization of Tropical Bioresources, College of Tropical Crops, Hainan University, Haikou, China
- 6Department of Biology, Saint Louis University, St Louis, MO, United States
FLOWERING LOCUS T (FT) are well-known key genes for initiating flowering in plants. Delineating the evolutionary history and functional diversity of FT genes is important for understanding the diversification of flowering time and how plants adapt to the changing surroundings. We performed a comprehensive phylogenetic analysis of FT genes in 47 sequenced flowering plants and the 1,000 Plant Transcriptomes (1KP) database with a focus on monocots, especially cereals. We revealed the evolutionary history of FT genes. The FT genes in monocots can be divided into three clades (I, II, and III), whereas only one monophyletic group was detected in early angiosperms, magnoliids, and eudicots. Multiple rounds of whole-genome duplications (WGD) events followed by gene retention contributed to the expansion and variation of FT genes in monocots. Amino acid sites in the clade II and III genes were preferentially under high positive selection, and some sites located in vital domain regions are known to change functions when mutated. Clade II and clade III genes exhibited high variability in important regions and functional divergence compared with clade I genes; thus, clade I is more conserved than clade II and III. Genes in clade I displayed higher expression levels in studied organs and tissues than the clade II and III genes. The co-expression modules showed that some of the FT genes might have experienced neofunctionalization and subfunctionalization, such as the acquisition of environmental resistance. Overall, FT genes in monocots might form three clades by the ancient gene duplication, and each clade was subsequently subjected to different selection pressures and amino acid substitutions, which eventually led to different expression patterns and functional diversification. Our study provides a global picture of FT genes’ evolution in monocots, paving a road for investigating FT genes’ function in future.
Introduction
Flowering is the most important step from vegetative to reproductive growth in flowering plants (i.e., angiosperms), which is also a major innovation of plant evolution. In the early 1930s, florigen was postulated as a key factor to induce flowering without knowing its genetic identity (Chailakhyan, 1936). In the last two decades, numerous studies have demonstrated that the FLOWERING LOCUS T (FT) proteins are the main component of florigen and are crucial in regulating flowering times (Wang et al., 2015; Samad et al., 2017; Sun et al., 2017). The FT proteins initiate early flowering via interacting with other transcription factors. In Arabidopsis thaliana, under a long-day condition, the expression of FT is tightly upregulated by an upstream transcription factor CONSTANS (CO) and consequently accelerates flowering. While under a short-day condition, FT is weakly expressed and flowering is thus deferred (Kobayashi et al., 1999; Tiwari et al., 2010). In the photoperiod pathway, light signals are received by photoreceptors and coincide with circadian rhythms to regulate the expression of the CO gene (Valverde et al., 2004). FT protein is transported from leaf to shoot apical meristem (SAM), where it interacts with intercellular receptors 14-3-3 proteins, to form a complex (Taoka et al., 2011). The complex can bind FLOWERING LOCUS D (FD) protein and activate APETALA1 (AP1) and SUPPRESSOR OF OVEREXPRESSION OF CONSTANS1 (SOC1) in order to induce flowering.
The FT genes belong to the phosphatidylethanolamine binding protein (PEBP) family, which consists of three subfamilies, FT, TERMINAL FLOWER1 (TFL1), and MOTHER OF FT AND TFL1 (MFT), all being involved in regulation of flowering time (Wang et al., 2015; Ito-Inaba et al., 2016; Mao et al., 2016). There are six PEBP members in Arabidopsis, namely, FT, TFL1, MFT, TWIN SISTER OF FT (TSF), BROTHER OF FT AND TFL1 (BFT), and CENTRORADIALIS homolog (ATC) (Carmona et al., 2007; Hedman et al., 2009). MFT, which has weak activity in flowering induction, shares high sequence similarity with both FT and TFL1(Yoo et al., 2004), but it plays an important role in regulating seed germination (Xi et al., 2010). TSF, the closest FT homolog and functional redundant with FT, acts as a floral pathway integrator (Yamaguchi et al., 2005). BFT and ATC act as TFL1-like genes to inhibit floral initiation (Yoo et al., 2010; Huang et al., 2012). As for the FT subfamily, only one copy is present in the early angiosperm Amborella trichopoda (Wickland and Hanzawa, 2015; Drabešová et al., 2016), 2 in Arabidopsis thaliana, 13 in rice (Kojima et al., 2002; Komiya et al., 2008), 14 in maize (Danilevskaya et al., 2008), and 13 in sorghum (Wolabu et al., 2016). It is notable that the number of FT genes varies dramatically among flowering plants, particularly between monocots, magnoliids, and eudicots. However, the reason why Poaceae has more FT genes than other angiosperms is still unclear. More generally, the evolutionary history of the FT genes is unclear in monocots.
In this study, we focused on the evolutionary history and functional diversity of FT genes in monocots. Comparing early angiosperms, monocots, magnoliids, and eudicots, we found that the monocot FT genes were formed into three clades (I, II, and III), whereas only one clade was formed in magnoliids and eudicots. We also found that monocot clade II and III genes were subject to positive selection and some of them showed tissue-specific expression patterns, so they might be functionally different from the more conserved clade I. In addition, only FT genes in monocots were expressed highly under vernalization treatments but not eudicots. Our study paves a road for in-depth studies of FT gene functions in future and provides a good example of how gene duplication contributes to functional innovation.
Materials and methods
Identification of FT homolog genes in plant
To identify FT genes and their homologs in plants, we first downloaded all whole-genome sequenced species from the Phytozome database (https://phytozome.jgi.doe.gov/pz/portal.html); the data links are listed in Supplemental Table 1. Using the Arabidopsis FT gene (AT1G65480) as a query, BLASTp v2.10.0 (Camacho et al., 2009) was run against all protein sequences in each genome and the 1,000 Plant Transcriptome (1KP) database (Carpenter et al., 2019), with an E-value cutoff 10-5. Meanwhile, the PEBP domain (Pfam ID: PF01161) was searched in each genome using hmmer v3.0 (Mistry et al., 2013) with default parameters. All hits from BLAST and HMM searches were then combined and cleaned for eliminating redundancy.
Multiple-sequence alignment and phylogenetic tree construction
All amino acid sequences of the PEBP domain identified from BLAST and HMM were aligned using MAFFT v7.487 (Katoh et al., 2002) (http://www.ebi.ac.uk/Tools/msa/mafft/). Then, we manually examined protein alignments in MEGA 7.0 (Kumar et al., 2016) and removed gaps. Considering that the FT gene is only one group of the PEBP gene family and the candidate genes identified above may contain TFL1 and MFT genes, we adopted a step-by-step strategy for constructing a phylogenetic tree of FT genes in monocots. Firstly, we used all PEBP protein sequences to construct a PEBP phylogenetic tree using FastTree v2.0.0 (Price et al., 2009) software with default parameters. PEBP sequences were divided into three groups, and three Selaginella moellendorffii genes, Smo.235975, scaffold00114.23, and Smo.235975, were set as the outgroup separately in each gene tree (Supplementary Figure 1), coinciding with the three gene families, MFT, TFL1, and FT. Secondly, we used all sequences from early angiosperms, monocots, magnoliids, and eudicots in the FT family to construct another phylogenetic tree using FastTree (Figure 1). Knowing that the FT gene first emerged in angiosperms, a Nymphaea colorata FT-like gene was used as the outgroup. Finally, all monocots’ FT protein sequences were aligned together using MAFFT v7.487 and a Picea abies FT-like gene (JN039333) was set as the outgroup to construct a Bayes phylogenetic tree using the CIPRES web (https://www.phylo.org/portal2). We used MrBayes (Huelsenbeck and Ronquist, 2001; Huelsenbeck and Ronquist, 2001), setting 8,000,000 generations and four Markov chains, and the first 25% of the tree from all runs was discarded.
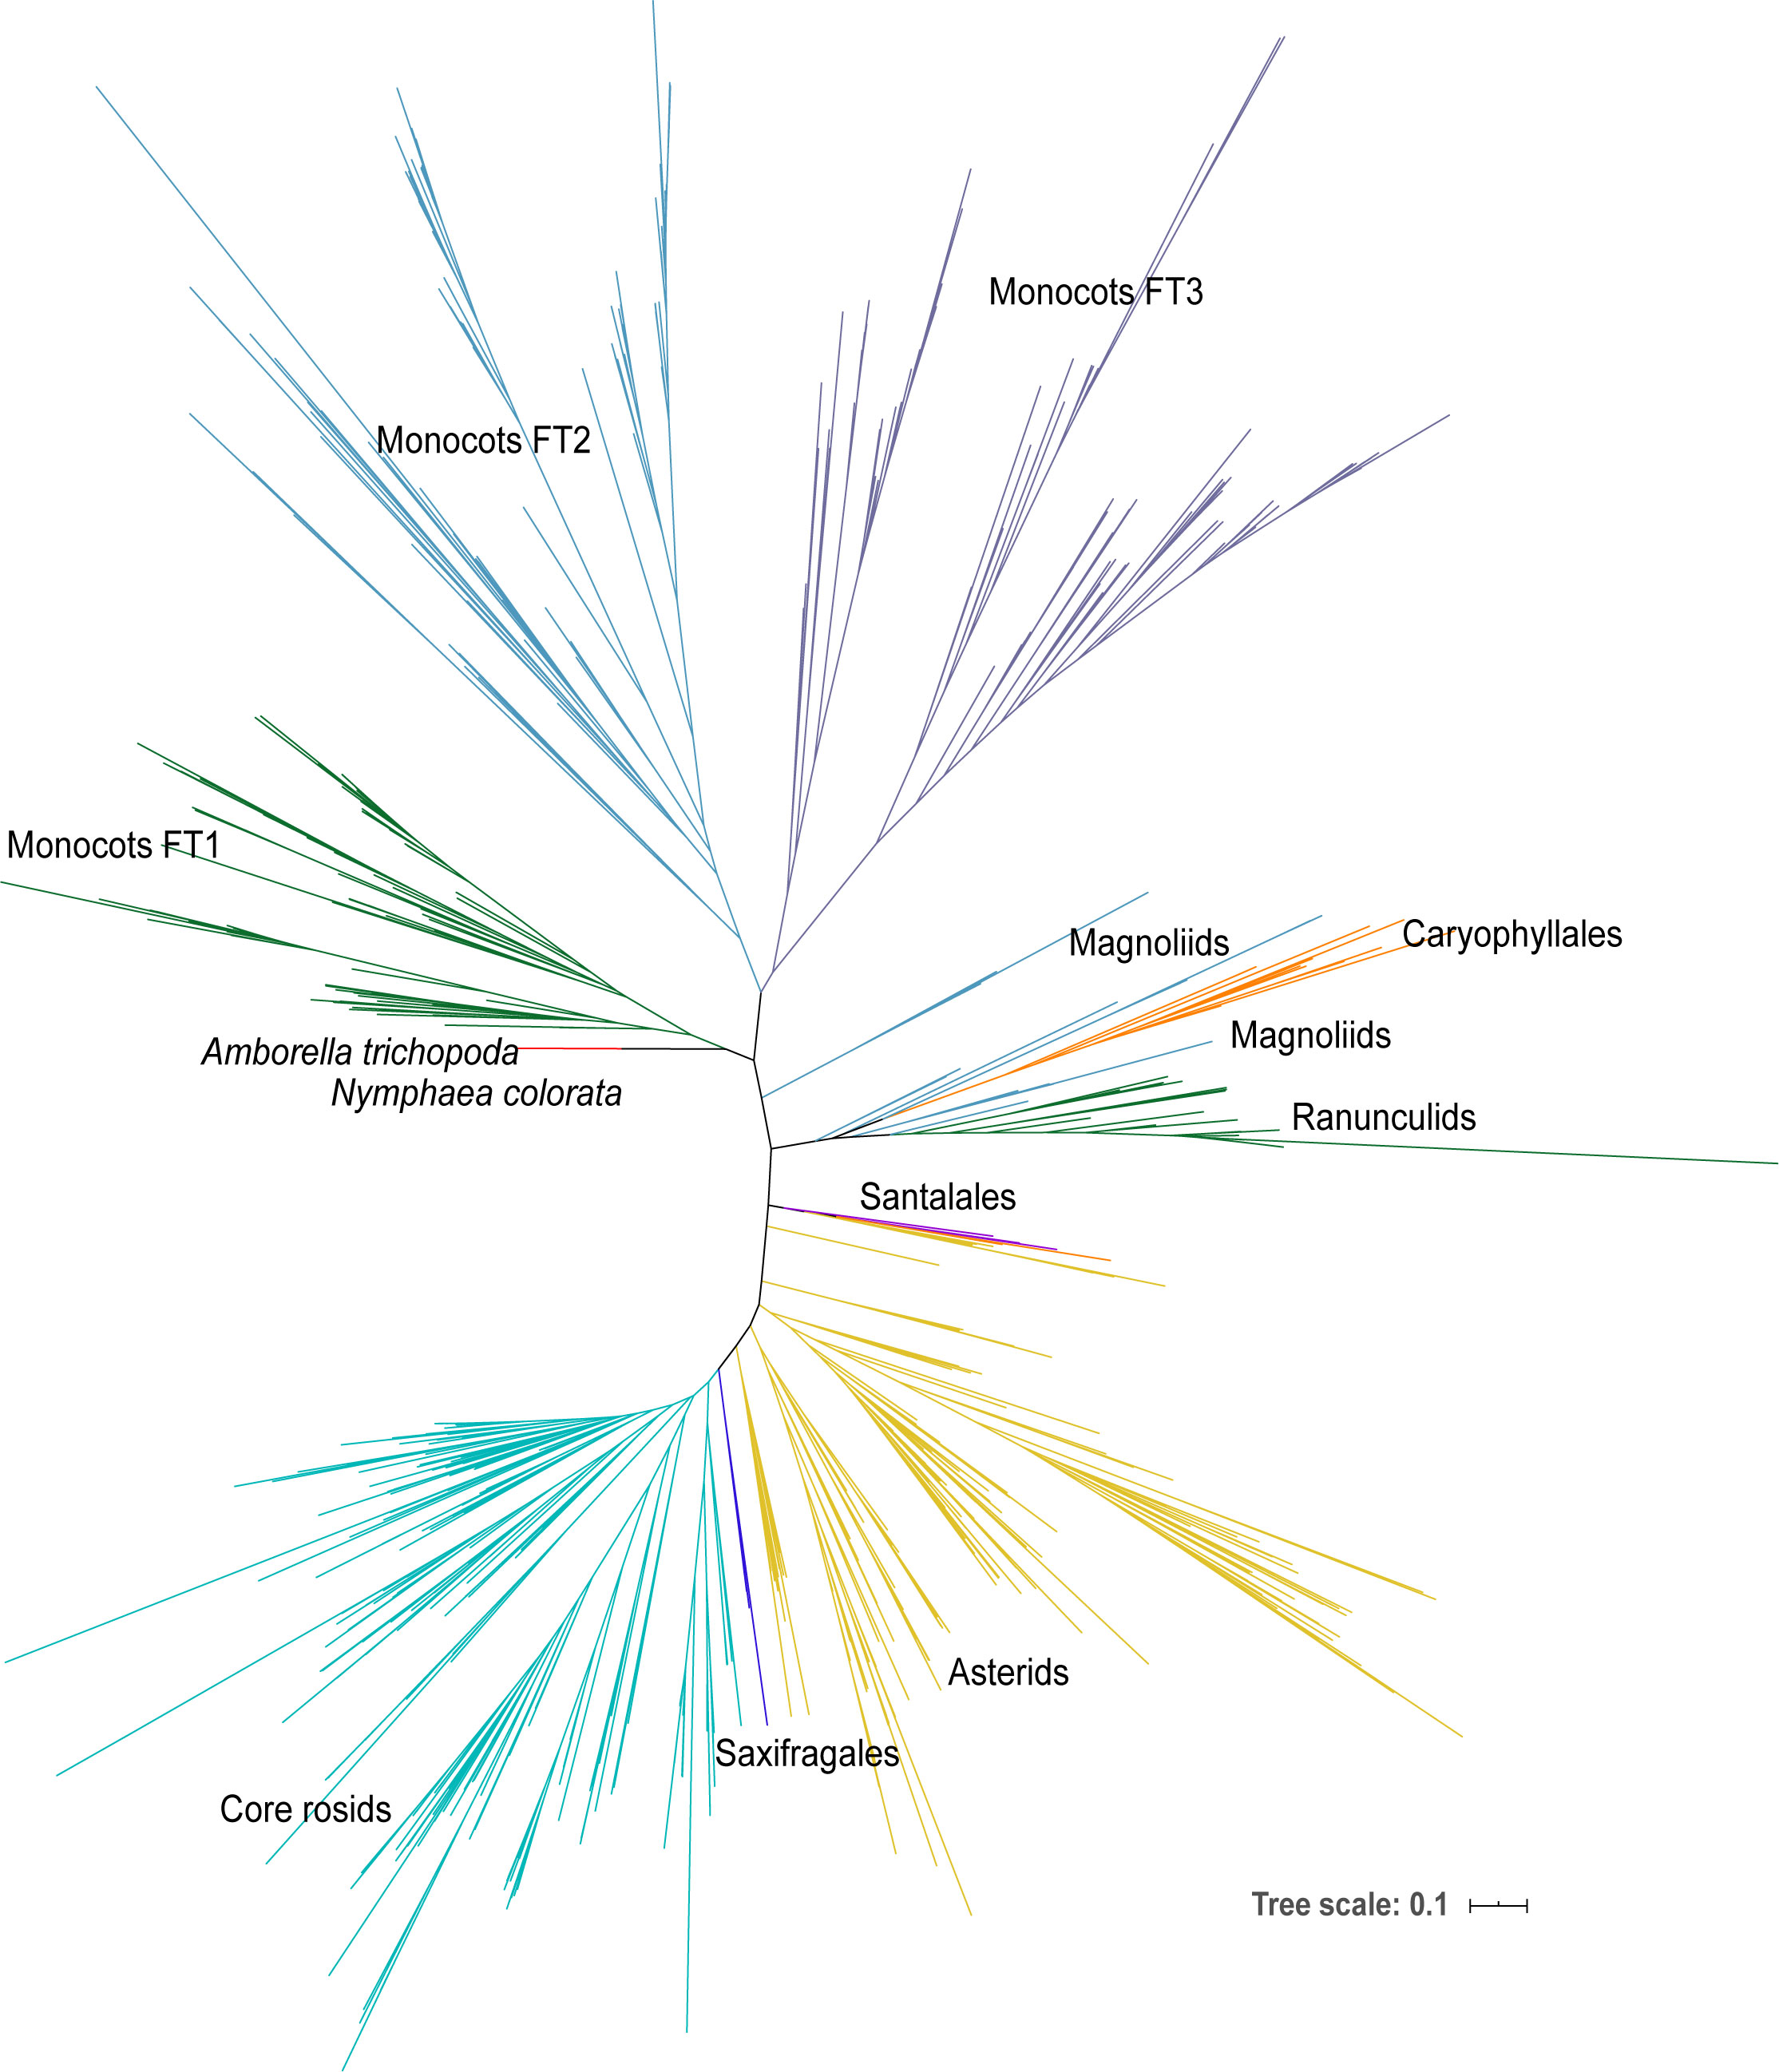
Figure 1 The phylogenetic tree of all FT genes in angiosperms. The phylogenetic tree was constructed using the ML method. The FT genes are from the 47-species-genome database (2 early angiosperms, 17 monocots, and 28 eudicots) and the 1KP database including early angiosperm, magnoliids, Caryophyllales, ranunculids, Santalales, Saxifragales, asterids, and core rosids.
Positive selection analysis
Analysis of the ratio (ω) of non-synonymous substitution (dN) and synonymous substitution (dS) is an efficient method to evaluate the type of selective pressure acting on protein-coding genes. In this study, we used PAML (Yang, 2007) to evaluate the positive selection that occurred in monocots. ω <1, = 1, and >1 indicate purifying selection, neutral evolution, and positive selection, respectively. To explore how positive selection has occurred on each clade in monocot FT genes, branch model was used to evaluate the ω value for the I, II, and III clades. The likelihood ratio test (LRT) was performed to compare the null model (model 0, only one ω value in the tree) and the alternative model (model 2, different ω values for foreground and background branch). The significance of the LRT was calculated by assuming that twice the difference in the log of maximum likelihoods was χ2 distributed, with the degrees of freedom (df) given by the difference in the number of parameters in the models (Bielawski and Yang, 2005). Positive selection was also detected using the branch site model. The test is based on the comparison between two models: a model (MA) that allows positive selection on one or more branches and a model (MA1) that does not allow positive selection on any branch. To test which amino acid residues might be under positive selection in different clades in monocots, two tests of branch site model were done; clade II was set as the foreground branch with clades I and II being the background, and clade III was set as the foreground with clades I and III being the background. The likelihood ratio test was used to compare the models, but in this case, the P-value obtained for the χ2 distribution of 2LRT was divided by 2 df. When the LRT suggested positive selection, the Bayes empirical Bayes (BEB) analysis was used to estimate posterior probabilities that each codon belongs to the site class of positive selection on the foreground branch. Furthermore, to check whether subclades generated in the same WGD events were under different selection pressures, we applied the branch model and branch site model for each subclade too.
Homology modeling and evolutionary conservation analysis across residues
The structures of all FT proteins were solved de novo using the I-TASSER server (https://zhanggroup.org/I-TASSER/) (Yang et al., 2015) and along with the rice Hd3a structure as a templates for the modeler. Top-scoring models were chosen, and all structures in the figures were visualized by PyMOL v1.1 (http://pymol.org/). The evolutionary conservation scores across amino acid residues were calculated on the ConSurf server (https://consurf.tau.ac.il/consurf_index.php) (Ashkenazy et al., 2016) using sequence alignment including three clades of FT members from monocot species. The AtFT homolog model (PDB ID: 1WKP) was used an input structure of the FT model, on which the variation and conservation were mapped, and all images were modified and represented using PyMOL software.
Functional divergence calculation
The analysis of functional divergence between different FT paralogous clades was conducted using DIVERGE 3.0 software (Gu et al., 2013). We used type I and type II models to calculate the functional divergence coefficient θ and SE value, based on the occurrence of altered selective constraints. The test also estimates the posterior probabilities of residues that might be responsible for functional divergence. A value of 0.6 was chosen as a cutoff to measure the degree of functional divergence at the amino acid residue level.
Gene expression analysis
Rice and maize FT genes’ expression data in different tissues and FT co-expression network information were downloaded from the Plant Public RNA-seq Database (PPRD, http://ipf.sustech.edu.cn/pub/plantrna/) (Yu et al., 2022). The number of libraries in different tissues has reached an order of magnitude difference, so for better presentation we have drawn the tissues with a large sample size in the main figures and drawn the tissues with a small sample size in the supplementary figures. To make the comparison more obvious, we discarded libraries as long as FPKM were all lower than 5 for genes in the heatmap. The co-expression module was collected from Yu Zhang study (2022).
Vernalization and non-vernalization RNA-seq data were downloaded from NCBI; Aquilegia coerulea was vernalized at 6°C (Sharma et al., 2019), Allium sativum vernalized at 4°C (Ben Michael et al., 2020), Arabidopsis thaliana vernalized at 4°C (Xi et al., 2010), Brachypodium distachyon vernalized at 5°C (Ream et al., 2014), Brassica rapa vernalized at 5°C (Jung et al., 2018), Camelina sativa (https://www.ncbi.nlm.nih.gov/sra/?term=SRP062374), Brassica napus vernalized at 5°C (Jones et al., 2018), Dactylis glomerata vernalized in natural environmental conditions (Feng et al., 2018), Hordeum vulgare (Deng et al., 2015), Mimulus guttatus vernalized at 4°C (Preston et al., 2016), and Triticum aestivum (https://genome.jgi.doe.gov/portal/?core=genome&query=1148146). Reads were mapped to the reference genome using Hisat2 v2.0.1 (Kim et al., 2015) then assembled and quantified using StringTie v1.2.2 software (Pertea et al., 2015). Gene expression levels were calculated as Transcripts Per Kilobase Million (TPM). Differentially expressed genes were analyzed with the R package of Ballgown (Frazee et al., 2015). Transcriptome analysis was performed according to a previously described transcriptome protocol (Pertea et al., 2016).
Results
Identification of FT genes in angiosperms
A genome-wide BLAST search for FT homologous genes was performed using the Arabidopsis thaliana FT (AT1G65480) protein sequence as a query against the database of 47 flowering plant transcriptomes, including two early angiosperms, 17 monocots, and 28 eudicots (Table 1). Considering that FT proteins share a high sequence similarity with other PEBP subfamilies, such as MFT and TFL1 all containing the typical PEBP domain (Pfam database accession: PF01161), the BLAST hits may include genes from all three PEBP subfamilies. We therefore kept all BLAST hits containing the PEBP domain and longer than 100 amino acids. In total, 572 PEBP genes were identified from 47 plant species (Table 1) (350 genes from the monocot species) and were used for phylogenetic tree reconstruction. The phylogenetic tree showed that sequences from each of the three PEBP subfamilies, MFT, TFL1, and FT, formed a monophyletic clade (Supplementary Figure 1). For the MFT and TFL1 subfamilies, there was no remarkable difference regarding gene numbers between monocot and eudicot species (Table 1, Supplementary Figure 1). However, the mean number of genes in the FT subfamily in each monocot genome is 14, whereas this number is only 3 in each eudicot genome.
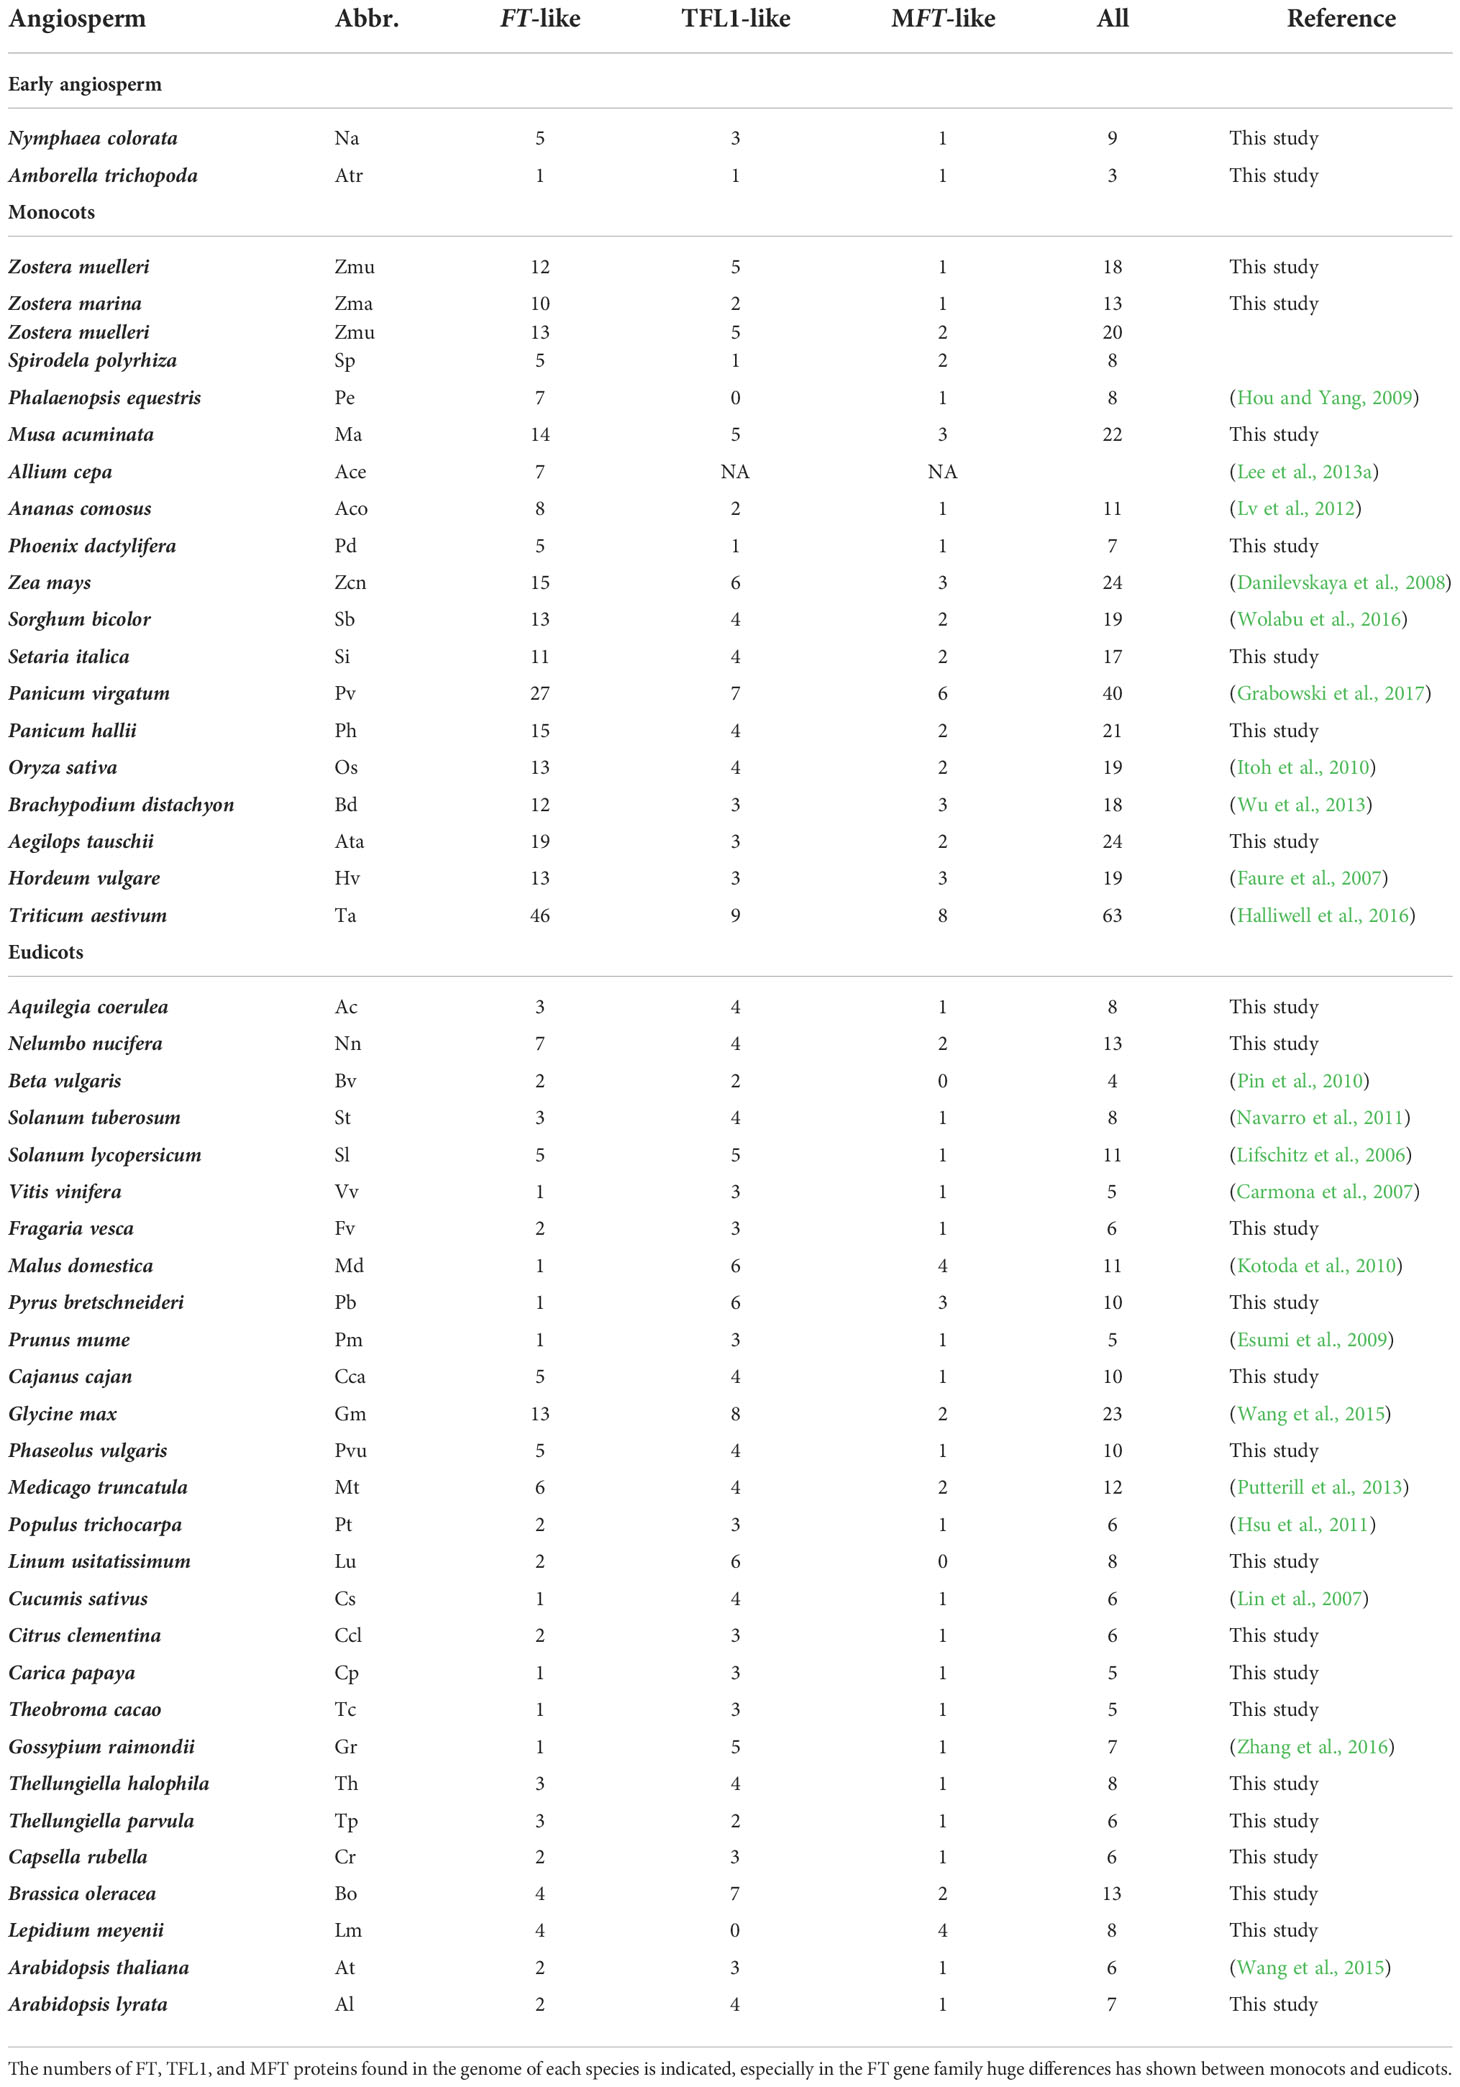
Table 1 Numbers of FT, TFL1, and MFT genes in each angiosperm species.
Monocot FT genes form three clades and exhibit a high retention rate after gene duplication in grass
To further explore the complex evolutionary history of the FT gene subfamily in angiosperms, all FT genes from the previous step and FT genes blasted from 1,000 plant transcriptomes were used to construct a maximum likelihood (ML) tree (Figure 1). Only one monophyletic group was identified in early angiosperms, magnoliids, Caryophyllales, ranunculids, Santalales, Saxifragales, asterids, and core rosids; however, there were three clades identified in monocots, suggesting that whole-genome duplication occurred in ancient monocots. Moreover, we constructed a Bayesian (Bayes) tree with all monocot FT protein sequences using the gymnosperm Picea abies FT-like gene as the outgroup (Supplemental Table 2, Figure 2). Based on the tree topology and posterior probability (> 0.8), the FT gene family in monocots could be classified into three clades, hereafter referred to as I, II, and III (Figure 2). Each monocot species examined, including early monocot seagrass (Zostera muelleri and Zostera marina) and Spirodela polyrhiza, and crown branches Phoenix dactylifera, Phalaenopsis equestris, pineapple, and all grass species, contained at least one FT copy in all three FT clades. In each of the three clades, seagrass and banana had more FT genes than the other monocots except Poaceae species. Triticum aestivum (N = 63) and Panicum virgatum (N = 40) had the largest number of FT genes among monocot species.
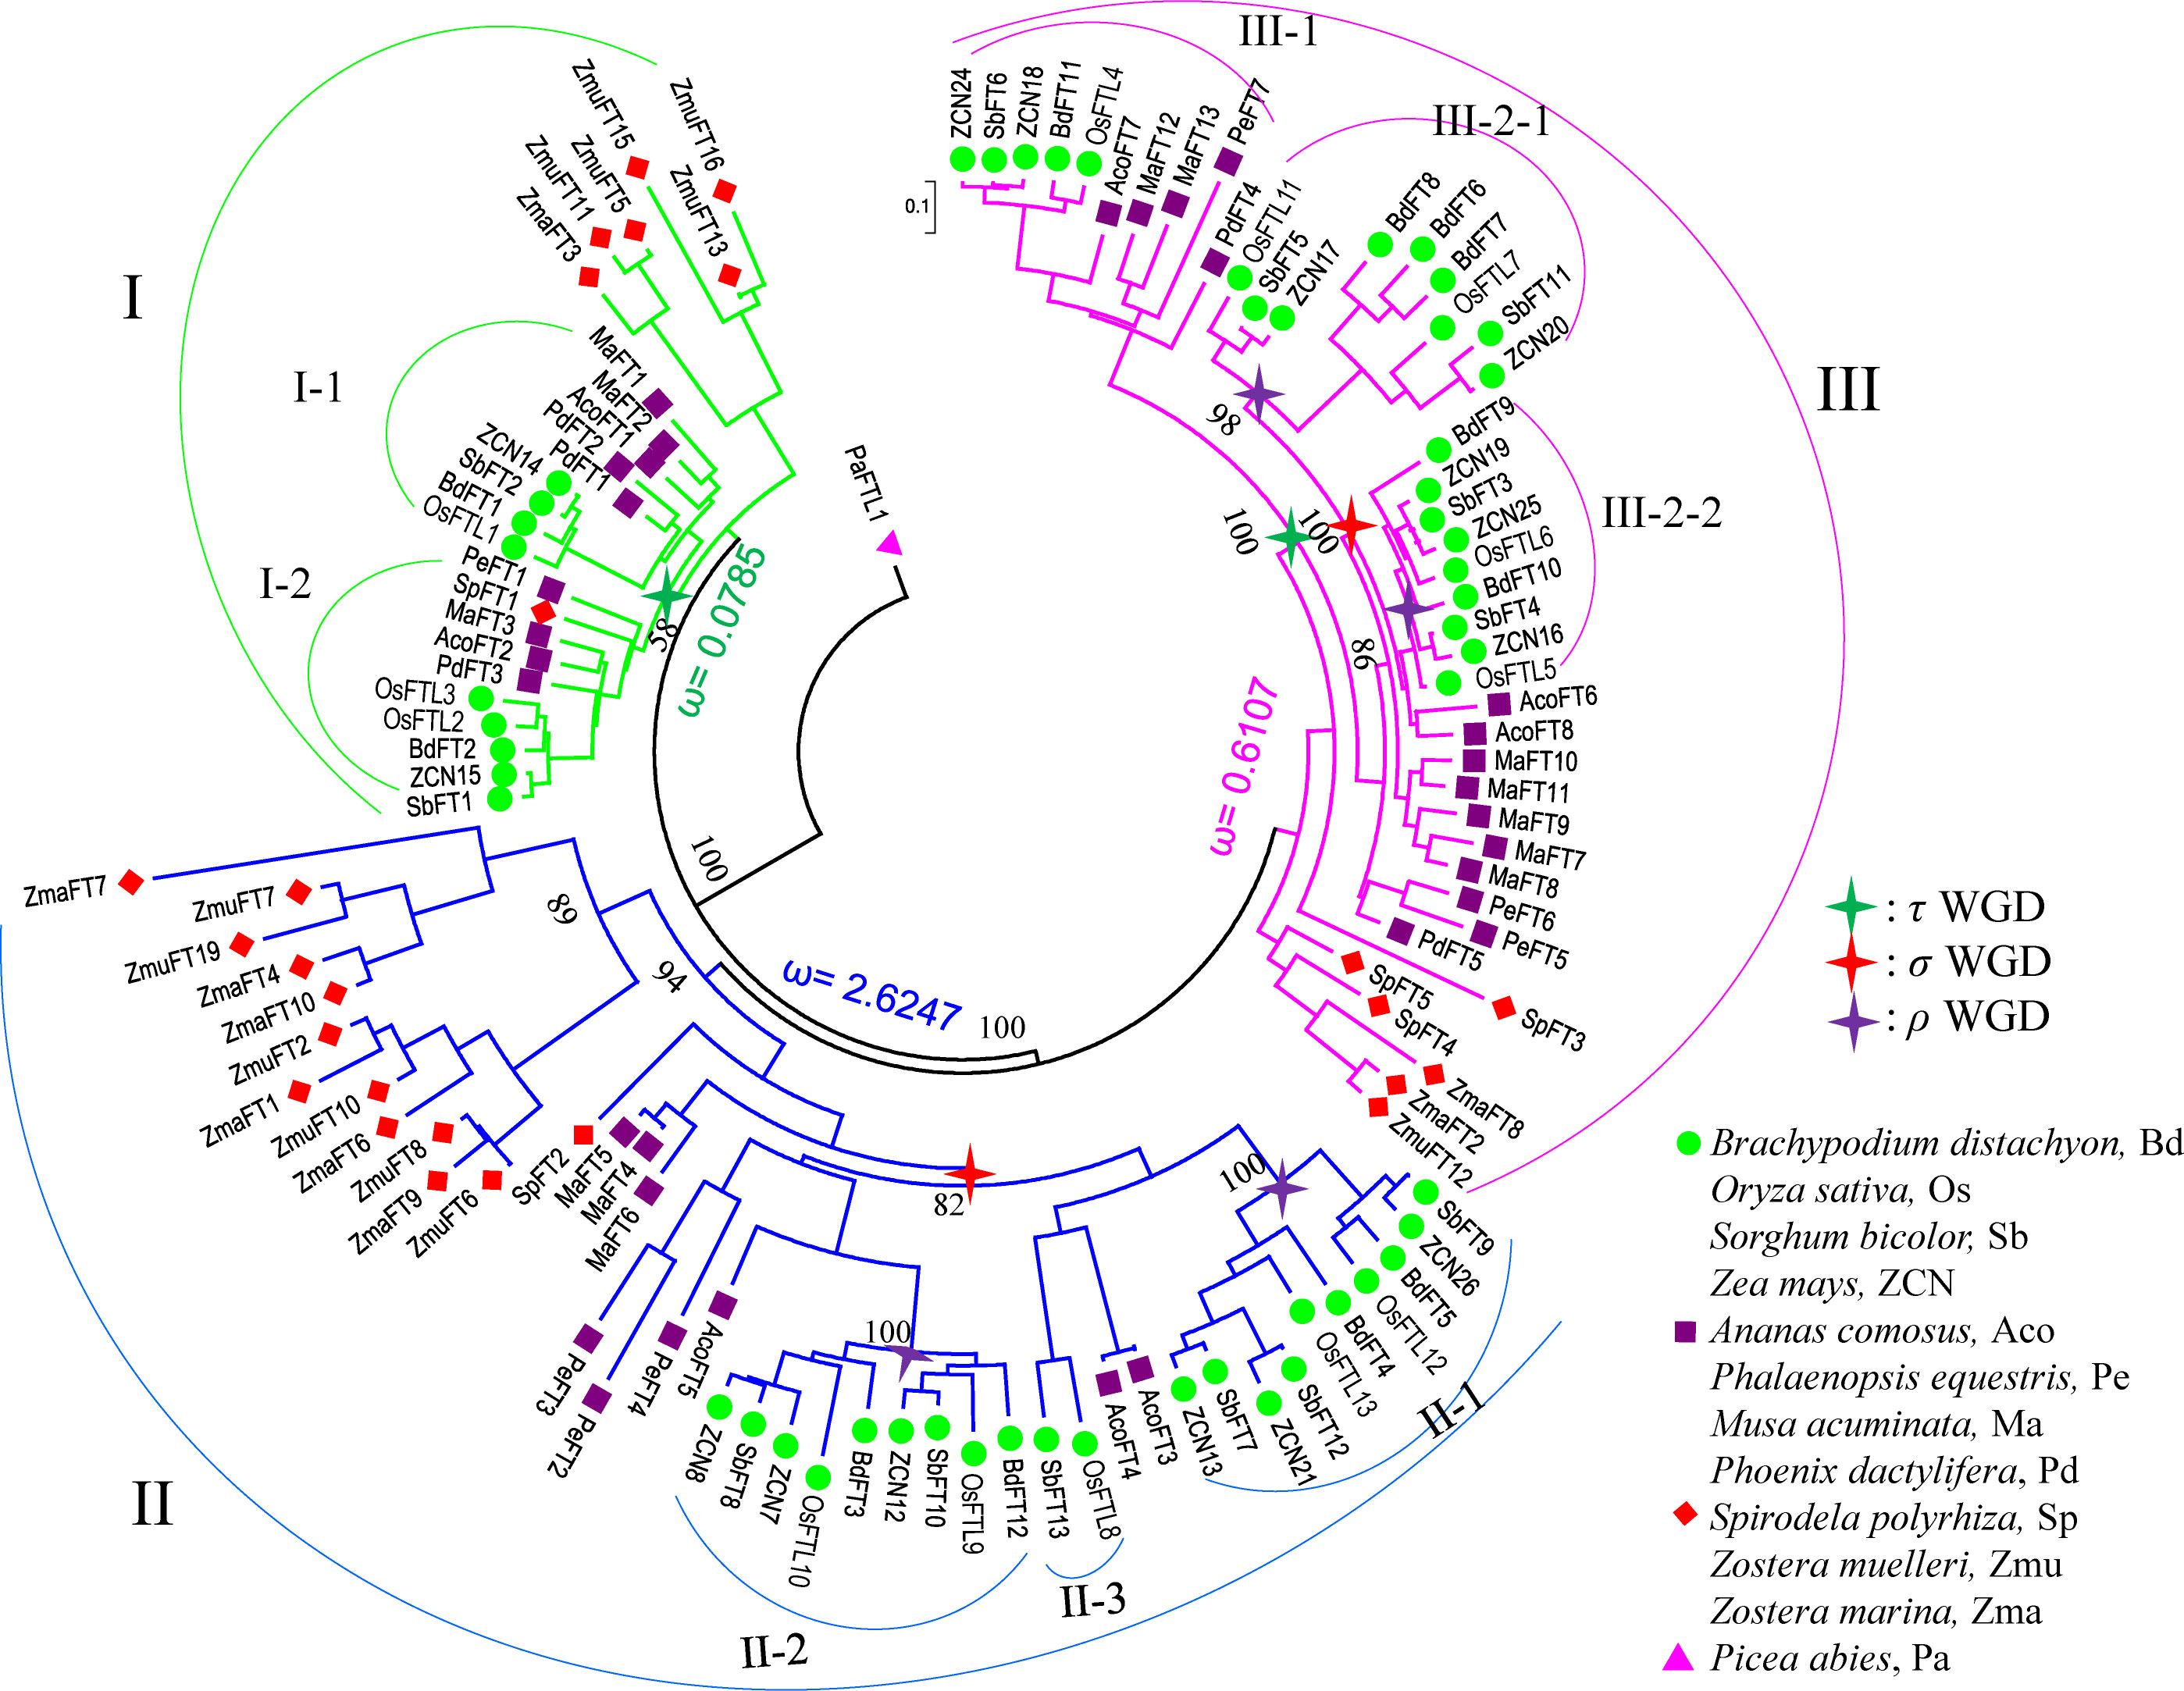
Figure 2 The phylogenetic relationship of the FT genes in monocots. The phylogenetic tree was constructed using the Bayes methods. The P. abies FT-like gene (JN039333) was set as the outgroup. The FT members from monocots are classified into three clades based on the tree; clade I is marked in green, II in blue, and III in pink. The stars mark the WGD event that occurred in monocots: green star, τ WGD; red star, ρ WGD; and purple star, σ WGD. Pa, P. abies; Zma, Zostera marina; Zmu, Zostera muelleri; Sp, Spirodela polyrhiza; Pd, Phoenix dactylifera; Ma, Musa acuminata; Pe, Phalaenopsis equestris; Aco, Ananas comosus; Bd, Brachypodium distachyon; Sb, Sorghum bicolor; Os, Oryza sativa; ZCN, Zea mays..
For clades I and III, all FT genes can be further divided into two subclades, I-1, I-2, and III-1, III-2, respectively, except the genes in early monocot seagrass (Figure 2). High confidence of the tree topology shown in Figure 2 revealed that those subclades generated from an ancient duplication, which occurred after the split of S. polyrhiza and the other core monocots. In FT clade II, using pineapple FTs as the outgroup, it could be further divided into three subclades II-1, II-2, and II-3. Subclade II-3 contained only rice and sorghum FT genes (Figure 2). At least one copy of FT genes from pineapple and grass species was present in each of the II-1 and II-2 groups, suggesting that the two groups could be resulted from the σ WGD, which occurred 95~115 million years ago (MYA) before the split between grasses and pineapple (Tang et al., 2010; Ming et al., 2015). We found that, for several gene pairs in the II-1 and II-2 groups, the paralogs were located in syntenic regions in the rice and sorghum genomes (Supplementary Figures 2A, B), further supporting that the duplicates probably resulted from the σ WGD in grasses. In monocots, after the σ WGD, another WGD named ρ occurred 50~70 MYA (Paterson et al., 2004). Genes in clades II-1 and II-2 were thus further expanded by the ρ WGD, resulting in II-1a and II-1b, and II-2c and II-2d, respectively. Syntenic regions were also visible for these subclades (Supplementary Figures 2C, D). A similar expansion (Supplementary Figures 2E, F) might have also occurred for clade III-2, where the σ WGD occurred firstly, followed by a grass-specific ρ WGD event, leading to four subclades III-2-1a, III-2-1b, III-2-2c, and III-2-2d.
Positive selection analysis
Given the possible functional divergence among the FT paralogs in the monocots identified above, we hypothesized that some of the FT (sub)clades might have undergone positive selection. To test this hypothesis, we used selection models implemented in the program codeml in the PAML package (Yang, 2007). Using branch models, our results showed that the three clades evolved under different selection pressures (P = 0.00398) (Table 2). Clades I and II had the lowest (0.0785) and highest (2.264) ω values (the ratio of non-synonymous to synonymous substitution rates), respectively, with clade III being in the middle (0.6107).
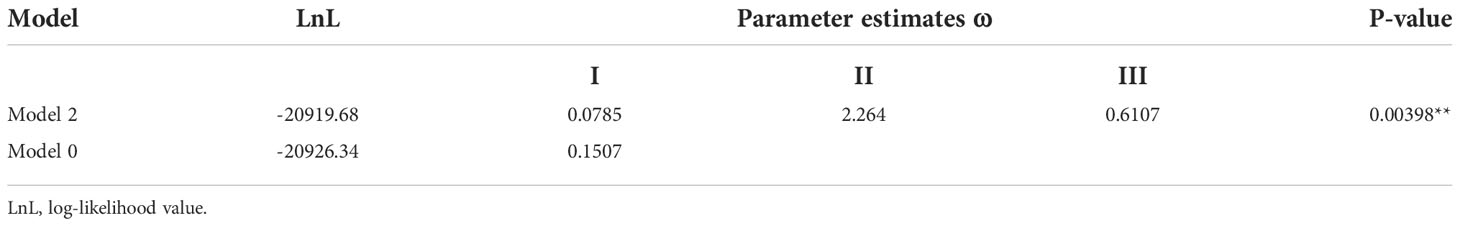
Table 2 Branch model tests for positive selection in monocots’ FT genes.
The branch site model is mainly used to detect the presence of positive selection sites on a clade. This method considers that the target branch has an omega value and all other branches share the same omega value. The branch model is mainly used to detect whether the omega value of the target branch is significantly higher than that of the background branch, that is, the gene evolution rate is accelerated on the target branch. Then, both branch and branch site models are employed to identify positively selected sites in each clade (Tables 3, 4, Figure 3). In Figure 3, when setting clade II as the foreground and I and II as the background, clade II showed a high ω value with 0.8837; branch site selective, i.e., model A (allowing some sites in the foreground with ω >1), and null models were statistically different (P = 0.0187). Between clades I and II, the posterior probabilities for sites Q34, M155, and W138 that experienced positive selection were 0.965*, 0.943, and 0.910, respectively. The branch model showed a ω value with 0.3994 in clade III, when setting I and III as background. Positively selected sites between I and III were also evaluated. However, the null and selective models were not significantly different (P = 0.0549), and site L82 with the posterior probability 0.966 was identified in clade III.
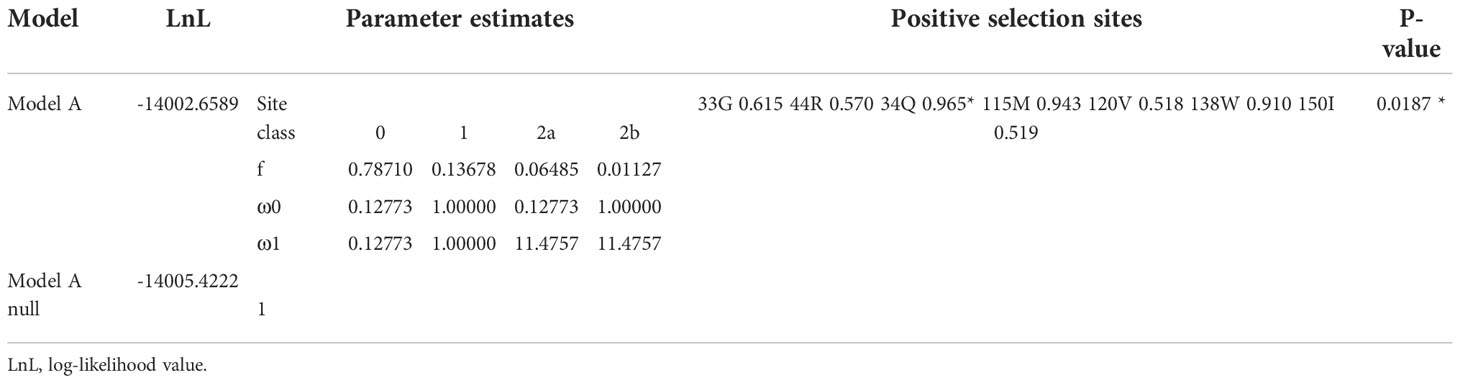
Table 3 Amino acid sites under positive selection shown in the Ⅱ clade, when Ⅰ and Ⅱ were set as background.
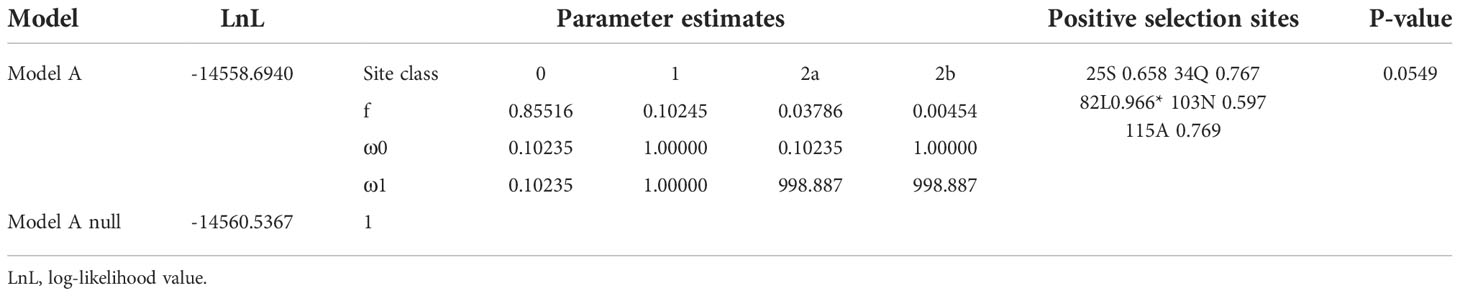
Table 4 Amino acid sites under positive selection shown in the Ⅲ clade, when Ⅰ and Ⅲ were set as background.
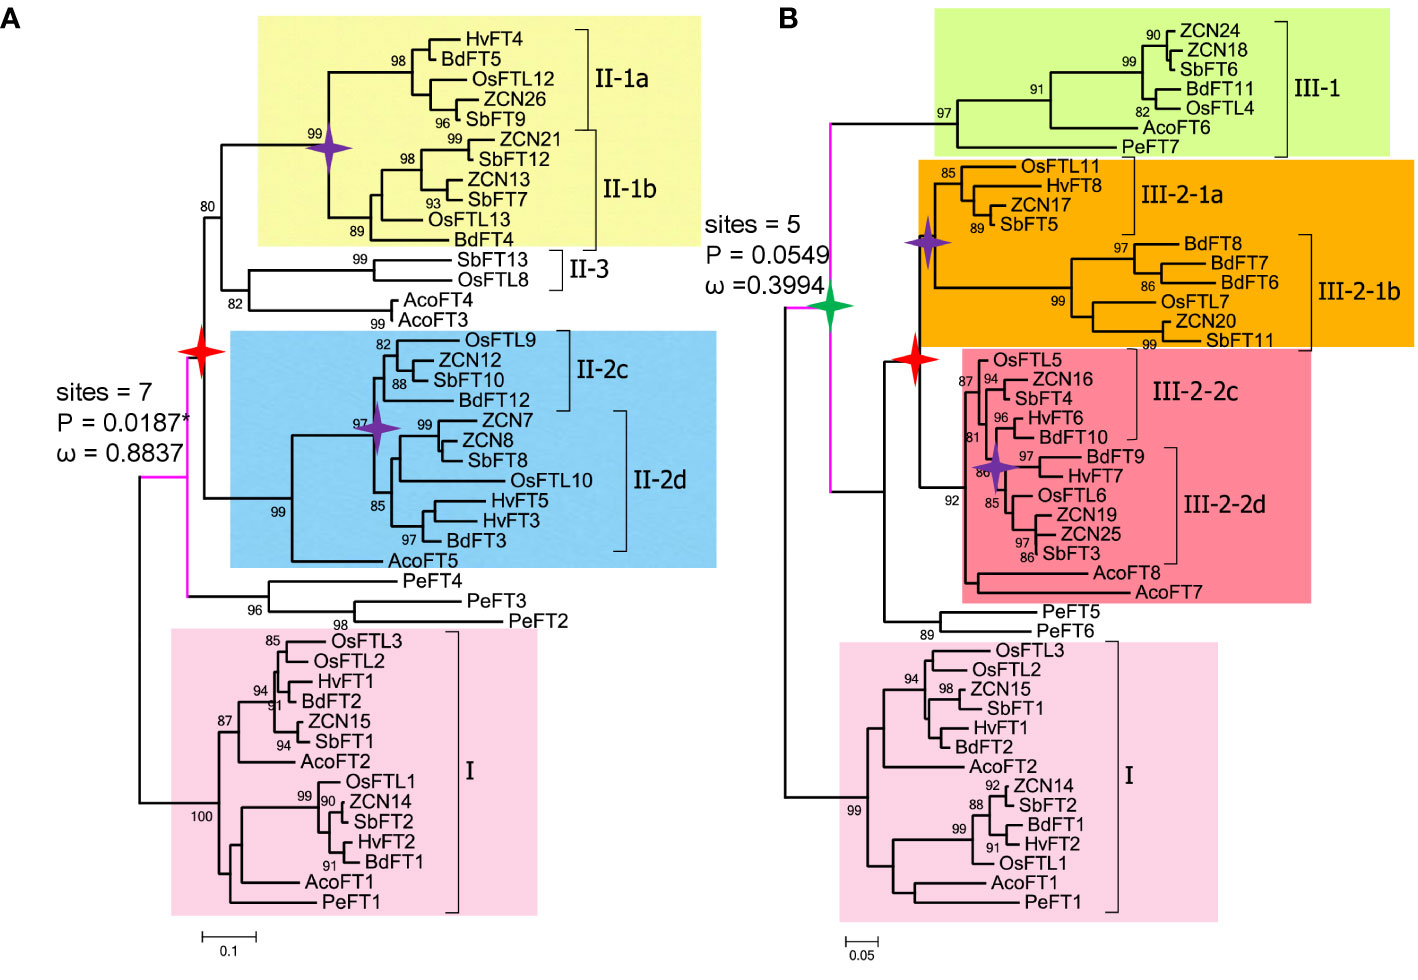
Figure 3 Pruned trees consisting of clade I and II (or III) and branch and branch site model tests. (A) Branch and branch site test using clade I as background and clade II as foreground. (B) Branch and branch site test using clade I as background and clade III as foreground. Green star, τ WGD; red star, ρ WGD; and purple star, σ WGD. ω denotes dN/dS values; sites indicate positive selection sites, P means p-value (probability). Digits in the branches are bootstrap values.
Within clades I and III, two subclades were generated from an ancient duplication. In clade I, using each of the two grass species as the foreground, we found relatively low ω values in each subclade by branch models (Supplementary Figure 3A). However, the branch site model showed that each subclade I-1 and I-2 had a highly statistically significant value and we identify five and six positively selected sites, respectively (Supplementary Figure 3A, Table 5). In clade III, each of two subclades III-1 and III-2 were set as the foreground separately, and we found no sites under positive selection (P = 1).
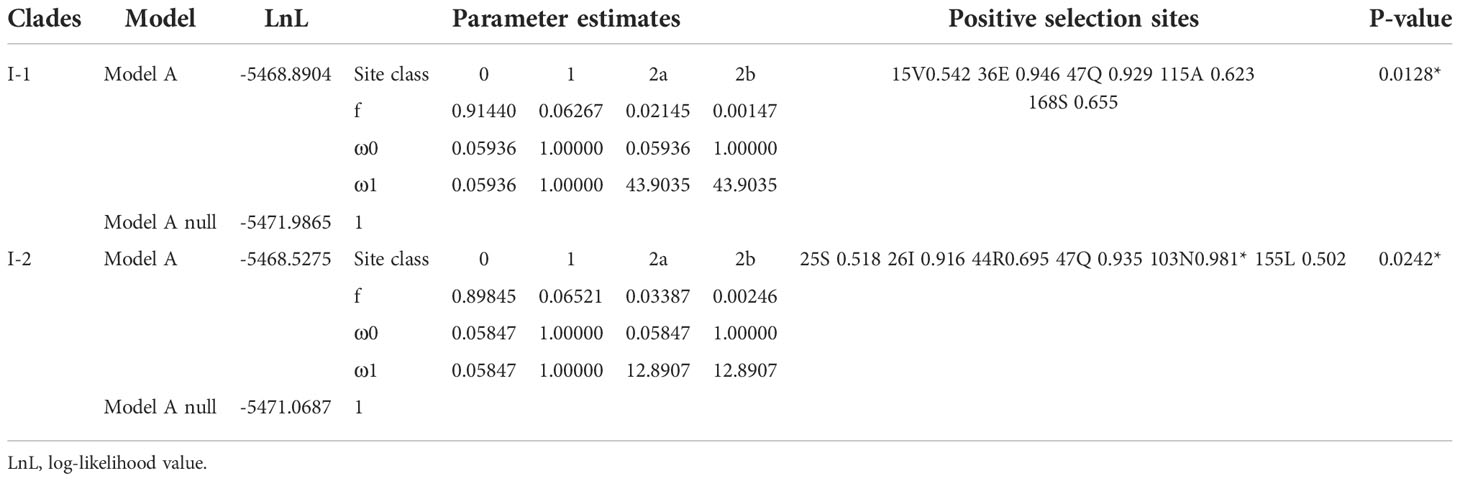
Table 5 Likelihood ratio test (LRT) of branch site models for the clade I.
Within clades II and III-2, σ WGD and ρ WGDs had occurred and formed four subclades. Clade II formed II-1a, II-1b, II-2c, and II-2d after experiencing σ WGD and ρ WGD events. Clade III-2 formed III-2-1a, III-2-1b, III-2-2c, and III-2-2d after experiencing σ WGD and ρ WGD events (Figures 3A, B). To determine selection types and identify corresponding sites in II and III-2 clades, two types of tests were used. Using each of the subclades in clade II as a foreground branch and the remaining subclades as the background, the ω values ranged from 0.1305 to 0.3727 (Supplemental Table 3), indicating that clade II was conserved. Positively selected sites were only identified in subclades II-1a (R107 and T144 with posterior probabilities being 0.609 and 0.938, respectively) and II-1b (T91 with probabilities being 0.552) (Supplementary Figure 3B, Supplemental Table 4). Subsequently, we tested the positive selection in the II-1a subclade. Six positively selected sites were identified in the II-1a subclade, indicating that the II-1a subclade had the fastest divergence rate in II (Supplemental Table 5). Similar tests were performed in the III-2 clade; the ω value varied among subclades: 0.0001 for III-2a, 0.1015 for III-2b, 0.0761 for III-2c, and 0.1514 for III-2d (Supplemental Table 6). Using the branch site model, only III-2-2d (four sites R35, L61, T96, and E160) and III-2-2c (two sites Q49 and E55) had positive selection sites, although not statistically significant (Supplementary Figure 3C, Supplemental Table 7).
Conservation and diversification in sequence composition
Based on the present model, the FT protein was induced by the photoperiod pathway and transported from leaf to the shoot apex, where it interacted with intracellular receptors, 14-3-3 proteins, to form a complex that can bind an FD transcription factor. They formed a “florigen activation complex” (FAC) to activate the expression of the floral-meristem genes (Taoka et al., 2011). There were three important regions for FT genes. The first was the region-binding 14-3-3 proteins (Taoka et al., 2011). The second was the region-binding chemical ligands (Y85) (Hanzawa et al., 2005). The third was a divergent external loop (Ahn et al., 2006). The latter two regions might be vital for the activity difference between FT and TFL1 genes in Arabidopsis thaliana. Our analysis focused on these regions as they were more likely to affect functions.
Based on the homolog model of Arabidopsis FT (PDB ID: 1WKP) and the multiple-sequence alignment of monocot FT proteins, we calculated the conservation score of each position using the ConSurf web server (Ashkenazy et al., 2016). We found that the region around the anion binding pocket and Y85 are highly conserved among the FT proteins (Figures 4, 5). However, segment B and the region interacting with the 14-3-3 protein were variable, suggesting that the FT genes in monocots might have undergone functional divergence. We also used ConSurf for each of the three clades. We found that segment B was highly conserved in clade I but were variable at some sites in clades II and III, especially W138 in the segment B region which was also a positive selective site for clade II. The region interacting with 14-3-3 proteins was highly variable in clade II but strictly conserved in clades I and III (Figure 5).
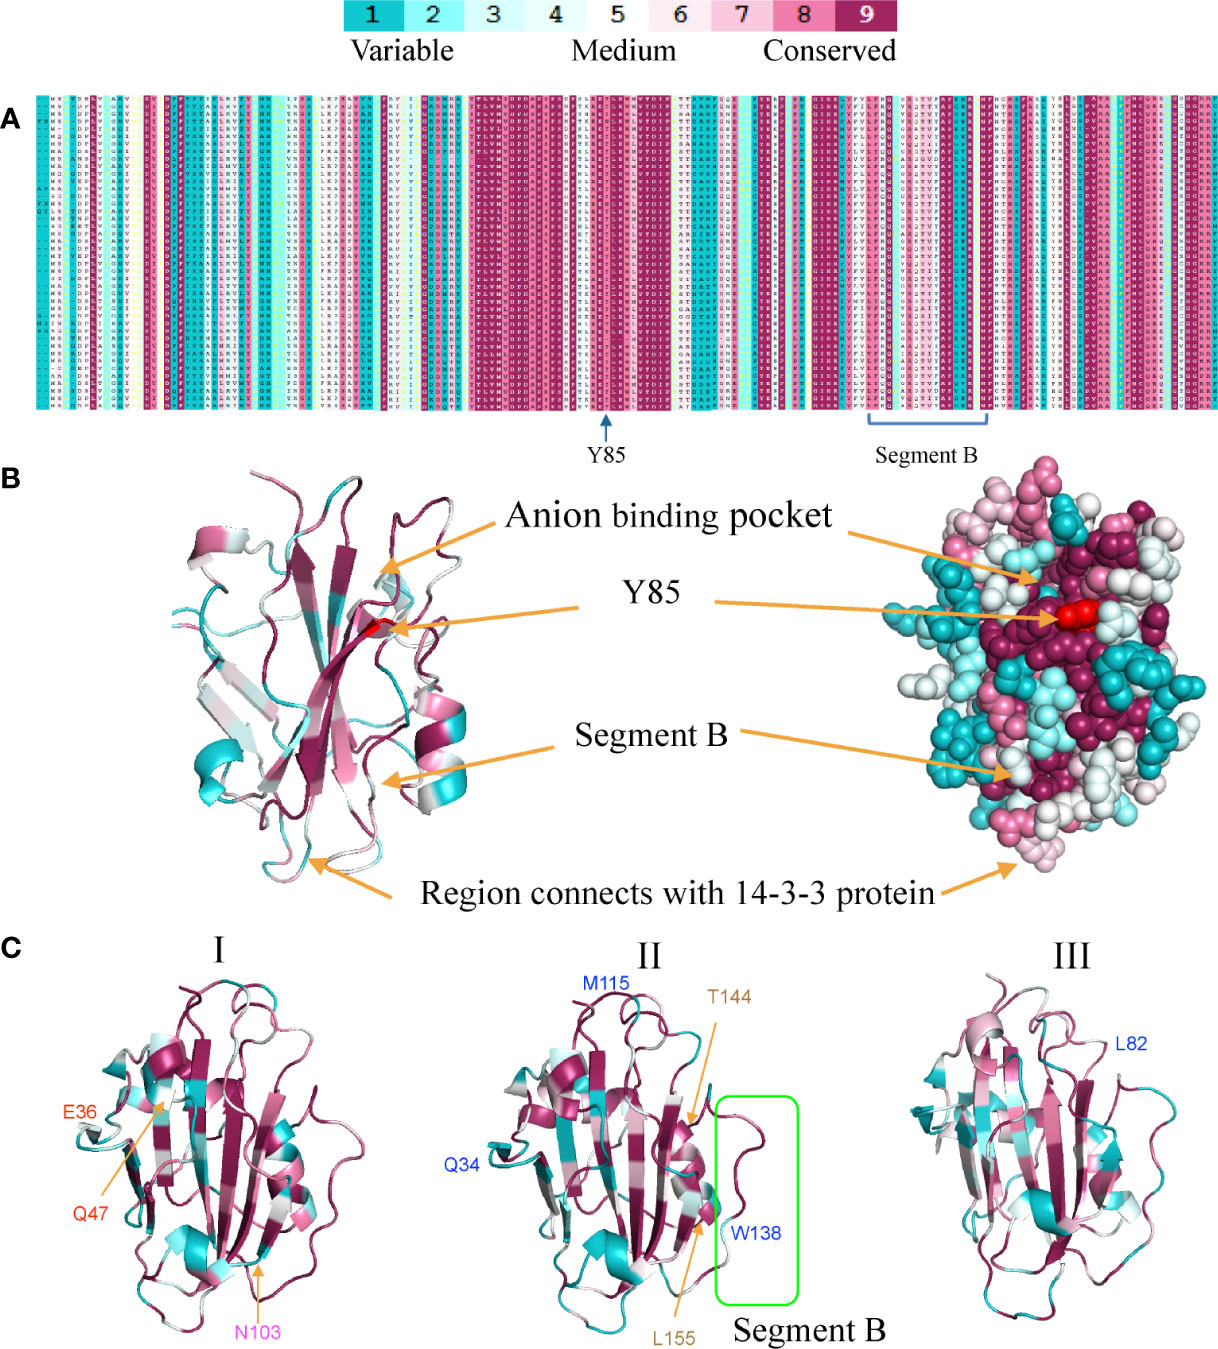
Figure 4 Sequence conservation and variation among three FT clades in monocots. (A). Multiple-sequence alignment of the FT gene family. (B) Homology modeling of the FT gene family shows the conservation degrees (displayed in different colors) of different regions. (C) Conservation differences among three monocot FT gene clades using ribbon diagrams. Positive selection sites (BEB value >0.9) also marked in three clades. All the figures were generated using the PyMol script with the output of ConSurf as input. Blue marks represent positive selection sites with clade I Red marks represent positive selection sites in clade I-1, magenta marks represent positive selection sites in clade I-2, and coffee marks represent positive selection sites in clade II-1a.
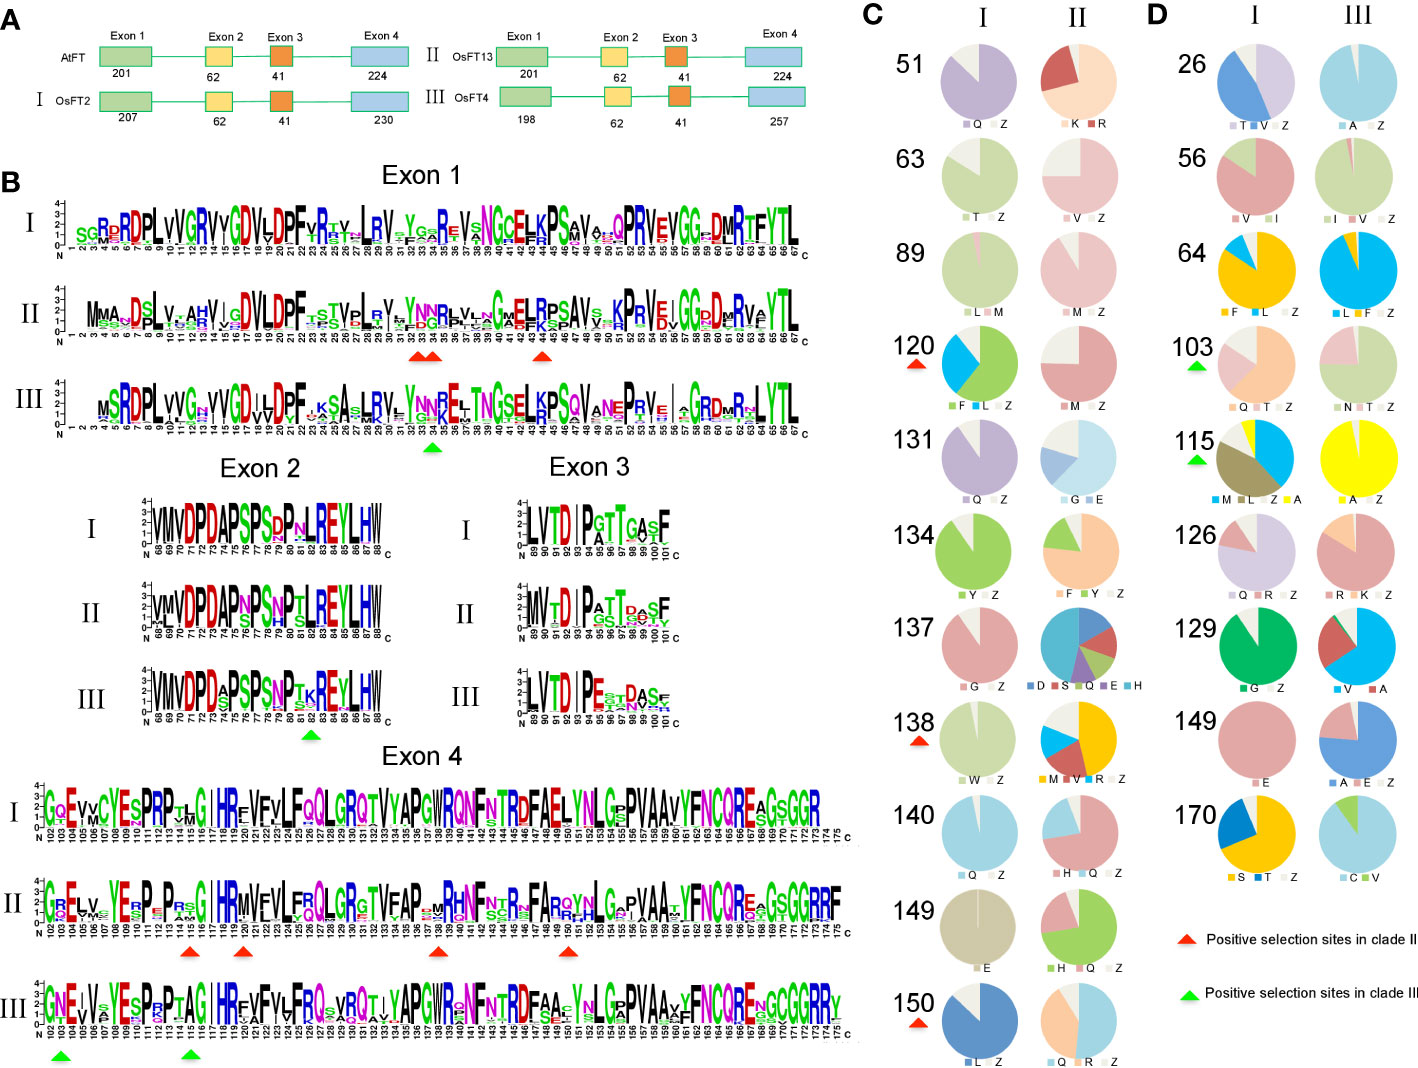
Figure 5 Characterization of sequences in three FT clades. (A) Exon and intron structures among three FT clades. (B) Logos representing motifs conserved within three clades. (C) Frequency of candidate amino acid residues responsible for function divergence between clade I vs. II. (D) Frequency of candidate amino acid residues responsible for function divergence between I vs. III. Red arrows represent positive selection sites in clade II, and green arrows represent positive selection sites in clade III.
Amino acid changes in the PEBP gene family could lead to important functional changes. For example, a change of one amino acid (Y85H) results in function conversion from FT to TFL1(Hanzawa et al., 2005). To identify important sequence changes that led to the function divergence of the FT genes in monocots, we checked amino acid substitutions in each clade. Using the rice gene Heading date 3a (OsFT2) as reference, we identified that 63 and 53 amino acids were highly variable between clades I and II and between clades I and III, respectively (Figures 4A, B). Based on a previous study about FT mutants in Arabidopsis (Ho and Weigel, 2014), about 50% of these amino acid changes were predicted to affect functions, suggesting that these variable sites might be important for the function diversification of monocot FT genes. In our study, 11 and 9 amino acid sites showed high difference between clades I and II and between I and III, respectively (Figures 4C, D). Among them, amino acid residues 120, 138, and 150 were positive selection sites in clade II and amino acid residues 103 and 115 were positive selection sites in clade III simultaneously.
To further estimate the functional diversification (FD) between two paralogs, we used the software DIVERGE 3.0 (Gu, 2006). Given amino acid sequence alignments, DIVERGE could predict functional changes among paralogs. The software includes two models, FD I and FD II, based on the evolutionary rates and biochemical properties of amino acids (Gu, 1999). Between clades I and II, seven putative sites (13, 16, 39, 53, 81, 138, and 149) responsible for FD were identified (Supplementary Tables 8, 9). These amino acid sites were highly conserved in clade I but different between clades I and II, particularly sites 81, 138, and 149. Meanwhile, sites 138 and 149 were also positive selection sites in clade II (Figure 4C, Supplementary Figure 4). Notably, site 138 was located in the segment B region. In addition, 18 and 31 sites were identified for the gene pairs in clades I and III and clades II and III, respectively. In clades I and III, sites 26 and 115 were also positive selection sites in clade III; at the same time, sites 97 and 141 were located in a region involving an interaction between 14-3-3 protein and segment B (Supplementary Figure 5). Next, we examined the paralog pairs generated from several duplications. In III-1 and III-2, we found that three sites (13, 25, and 45) might be responsible for functional divergence. In the σ WGDs, three (16, 45, 150) and two (132, 136) positions were identified when comparing II-1 and II-2 and comparing III-2-1 and III-2-2, respectively, including one (position: 150) that was functionally important in soybean FT genes and two (positions: 132 and 136) located in segment B.
Expression profiles of different clade FT genes in rice and maize
To further characterize whether different clade genes possess differential expression patterns in monocots, we investigated expression patterns in two representative monocot plants, Oryza sativa and Zea mays. Transcriptome data were downloaded from the Plant Public RNA-seq Database (PPRD, http://ipf.sustech.edu.cn/pub/plantrna/) (Yu et al., 2022), providing a large number of RNA-seq libraries, 19,664 and 11,726 for maize and rice, respectively. Generally, clade I genes in both rice and maize exhibited higher expression levels than clade II and III genes in all studied organs and tissues. For rice, OsFTL1, OsFTL2, and OsFTL3 displayed high expression patterns across tissues, including leaf, shoot, flower, anther, panicle, seed, and endosperm (Figure 6A and Supplementary Figure 6A). Although in the same clade OsFTL1 presented opposite expression patterns compared with OsFTL2 and OsFTL3, OsFTL2 and OsFTL3 showed high expression only in leaf but OsFTL1 presented high expression in all tissues except leaf and root. For clade II, three genes (OsFTL9, OsFTL10, and OsFTL12) in leaf and one gene (OsFTL12) in stem, shoot, and leaf were expressed at relatively high levels. OsFTL8 was in a low expression level of transcripts in all stages and tissues, and OsFTL13 expression was not detected in any organs. In clade III, it was likely that OsFTL11 was expressed preferentially high in root, whereas other FT genes in the same clade or two former clades were barely expressed in this tissue, so OsFTL11 was considered as a root-specific expressed gene. OsFTL4 could be observed expressed in leaf and shoot, and the rest of the FT genes in clade III were in a very low level of transcripts in all tissues. A similar phenomenon can be seen in maize, with ZCN14 and ZCN15 showing stronger expression levels than the other two clades’ FT genes (Figure 6B and Supplementary Figure 6B), especially ZCN14 which was expressed at a significantly higher level in all tissues and organs. ZCN15 was strongly expressed in leaf, flower, and stem but not the same as ZCN14 which was expressed in a wide range of tissues. In clade II, ZCN7, ZCN8, and ZCN12 presented a low level of transcripts only in leaf and nearly no expression in remaining tissues. More than that, ZCN13, ZCN21, and ZCN26 were hardly expressed in all tissues. All clade III genes showed little or merely no expression in any tissues, so we speculated that this clade’s genes may already lose functions. Overall, different clade genes showed differing expression patterns and genes belonging to the same clade did not always have the same expression patterns. Among FT members, clade I FT genes showed the strongest transcript level, followed by clade II, and clade III exhibited the weakest expression patterns in almost all tissues. In addition, all expressed FT genes kept relatively high expression levels in leaf, a primary site of FT protein synthesis, which is consistent with a previous study that FT is primarily expressed in the leaves and the resulting protein travels to the meristem where it initiates a transition of the vegetative meristem to the floral meristem (Wong et al., 2013). These data supported that clade I FT genes were the most likely candidates to be involved in the regulation of flowering time in monocots.
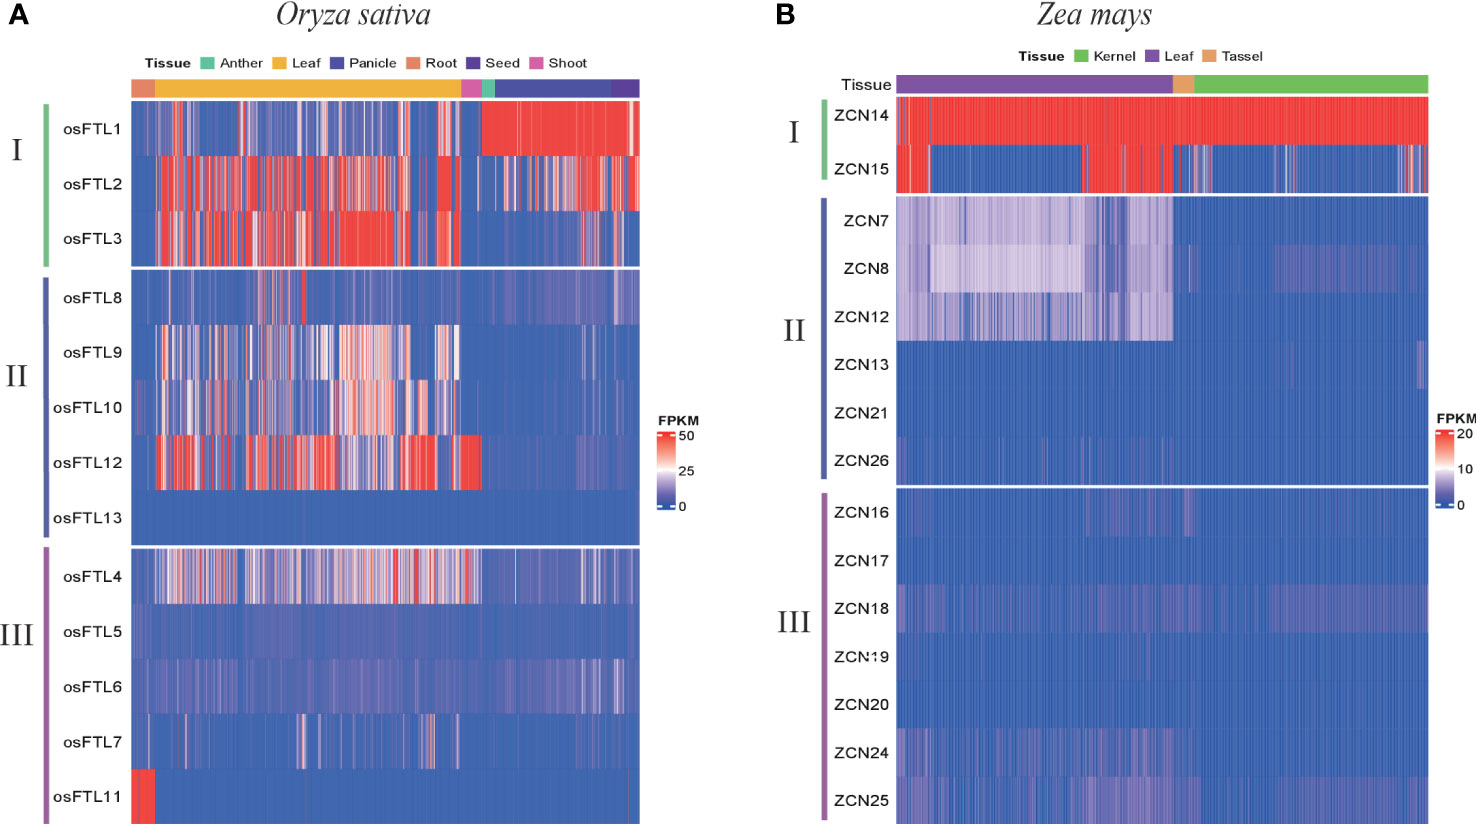
Figure 6 The expression patterns of the three clades’ FT gene in two monocot species including (A) Oryza sativa and (B) Zea mays.
To detect FT genes’ expression under vernalization treatment, RNA-seq was performed on 11 species including five monocots (Allium sativum, Brachypodium distachyon, Dactylis glomerate, Hordeum vulgare, and Triticum aestivum) and six eudicots (Aquilegia coerulea, Arabidopsis thaliana, Brassica napus, Brassica rapa, Camelina sativa, and Mimulus guttatus). During vernalization, higher FT gene transcripts were detected in monocots such as A. sativum (4.77 TPM), B. distachyon (33.03 TPM), D. glomerate (26.52 TPM), H. vulgare (23.25 TPM), and T. aestivum (4.08 TPM) but lower expression in eudicots A. coerulea (0.61 TPM), A. thaliana (0.12 TPM), B. napus (3.81 TPM), B. rapa (0.17 TPM), C. sativa (1.97 TPM), and M. guttatus (0.27 TPM) (Supplementary Figure 7A). Comparing vernalization and non-vernalization circumstances, one clade III FT gene in B. distachyon, one clade II FT gene in D. glomerate, two clade I FT genes in H. vulgare, and one clade II FT gene in T. aestivum showed a huge difference (Supplementary Figures 7B–E).
Co-expression analysis of FT genes in rice and maize
Duplicated genes generated from tandem and segmental duplications have multiple fates. Some genes maintain their ancestral functions, whereas others may be pseudogenized or neofunctionalized (Birchler and Yang, 2022). Combining the co-expression network from PPRD with rice co-expression modules that associated with agronomic traits (Yu et al., 2022; Zhang et al., 2022), we further surveyed FT genes’ function in different clades.
For rice, OsFTL1 in clade I was presented in M0166 whose module correlated with flower development traits (Table 6). Ten floral development-related MADS-box genes had similar expression patterns with OsFTL1, such as OsMADS15 (A-class genes), OsMADS4 (B-class genes), OsMADS13 (D-class genes), OsMADS1, OsMADS5, OsMADS6, OsMADS7, OsMADS8, OsMADS17, and OsMADS34 (E-class genes) (Figure 7A and Supplementary Figure 8A), and they were expressed in panicle, flower, anther, pistil, seed, and endosperm and especially highly in floral organs and tissues. Among these MADS-box genes, OsMADS7, OsMADS8, and OsMADS15 had been validated to regulate flowering time (Cui et al., 2010; Lu et al., 2012). These results indicated that OsFTL1 might modulate both floral organ development and flowering time in rice. OsFTL2, OsFTL3, OsFTL9, and OsFTL10 exhibited leaf-preferred expression patterns; these genes were in M0166 whose module is related to flowering time traits. OsFTL11 was expressed mainly in root and expressed hardly in other organs. Three NB-ARC genes (LOC_Os10g33440, LOC_Os08g14830, and LOC_Os08g14810), LOC_Os01g33810 (disease resistance protein RPM1), and OsCBL8 had similar co-expression patterns with OsFTL11; these genes were more or less associated with disease resistance, suggesting that OsFTL11 might acquire a new function of responding to stress (Figure 7B and Supplementary Figure 8B). OsFTL4 in clade III and FTL8 in clade III co-expression modules were correlated with aluminum sensitivity and stress resistance, respectively (Table 6). In addition to the FT genes mentioned above, other FT genes in rice either cannot elucidate a clear function or were in a low expression level.
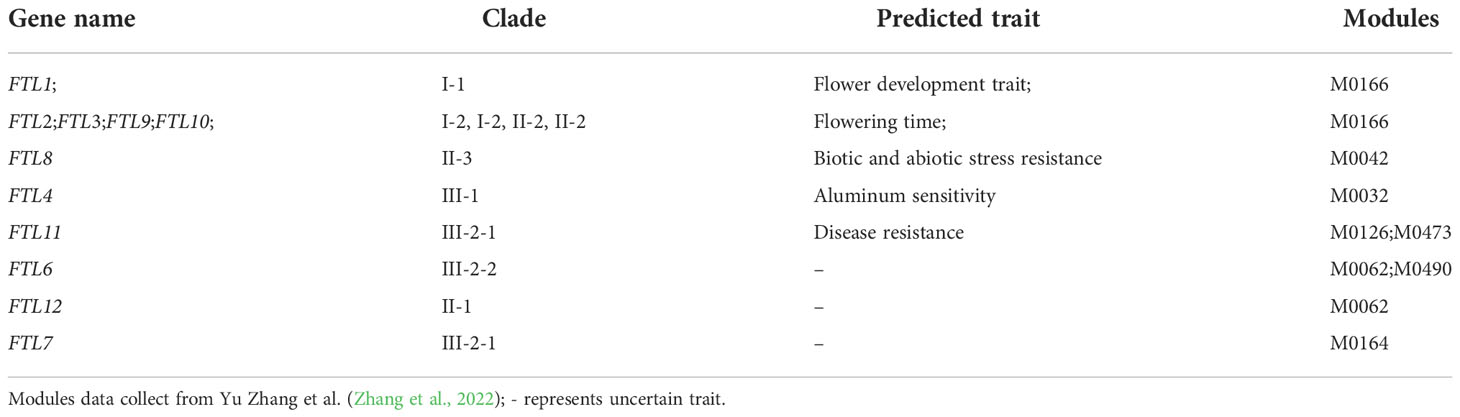
Table 6 Rice FT co-expression module information.
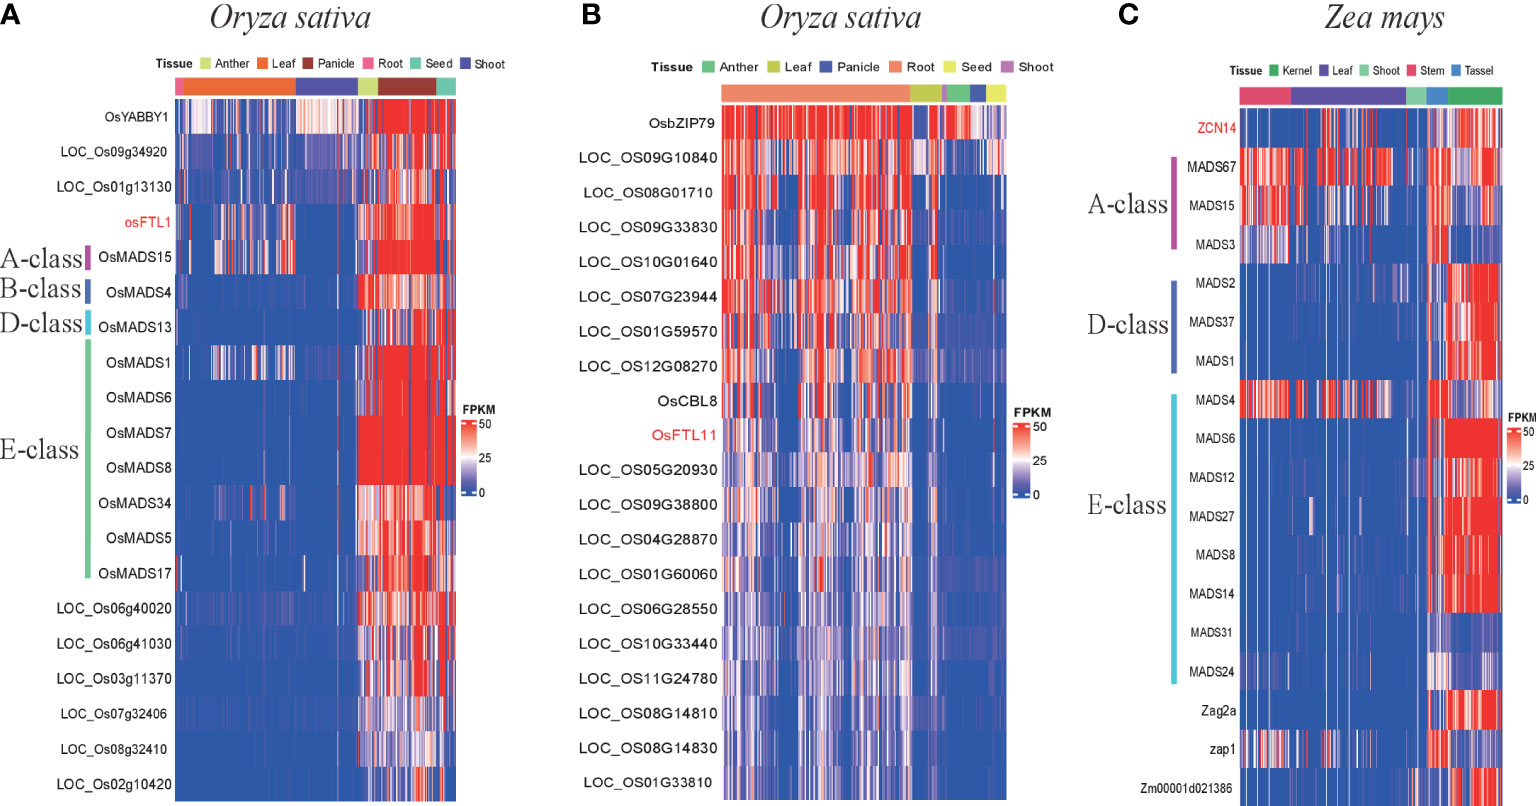
Figure 7 Expression patterns of FT and their co-expression genes in Oryza sativa and Zea mays. (A) Expression patterns of OsFTL1 and its co-expression genes in anther, leaf, panicle, root, seed, and shoot; different MADS-box classes labeled in different color lines. (B) Expression patterns of osFTL11 and its co-expression genes in anther, leaf, panicle, root, seed and shoot; different MADS-box class labeled in different color line. (C) Expression patterns of ZCN14 and its co-expression genes in kernel, leaf, shoot, stem, and tassel; different MADS-box classes labeled in different color lines.
In maize, ZCN14 was highly expressed in all tissues and was in the same co-expression network with 14 MADS-box genes, comprising three A-class genes (MADS3, MADS15, and MADS67), three D-class genes (MADS1, MADS2, MADS37) and eight E-class genes (MADS4, MADS6, MADS12, MADS27, MADS8, MADS14, MADS24, and MADS31) except B-class genes and C-class genes (Figure 7C and Supplementary Figure 8C). Similar to rice, those MADS-box genes were also expressed mainly in reproductive organs and tissues (flower, anther, pistil, and kernel). In addition, C-class MADS-box genes were absent in both the rice and maize clade I co-expression network, suggesting that OsFTL1 and ZCN14 might not have participated in pistil formation. ZCN17, a maize clade III-2-1 FT gene, was slightly and exclusively expressed in root. So far, we found that both ZCN17 and OsFTL11 presented root-specific expression patterns; moreover, they were all in clade III-2-1, so ZCN17 may also play roles in responding to disease. These results suggest that clade III-2-1 FT genes in Poaceae might already possess this function and their descendant genes inherited it.
These results indicated that FT genes in clade I might retain their ancestral function of activating flowering and some of clade I FT genes also played an essential role in regulating floral organ development. In clades II and III, FT genes had various probabilities: losing functions, acquiring new functions, or regulating flowering time.
Discussion
Evolutionary history of monocot FT genes
Studies on individual genomes suggested that the numbers of FT genes varied among species. For instance, only FT-like genes but not florigen-functioning FT genes were found in gymnosperms (Klintenäs et al., 2012). Only one FT gene was detected in Amborella trichopoda(Drabešová et al., 2016), two FT genes were found in Arabidopsis thaliana(Wang et al., 2015), and 13 FT genes were found in rice (Tamaki et al., 2007). Previous studies revealed that rice and other cereals contained eight common ancestors for FT-like genes (Chardon and Damerval, 2005). Adding more genomes and the 1KP database, our results extended the previous observations and revealed that the gene numbers were systematically different between monocots, eudicots, and magnoliids, only one clade for early angiosperm, magnoliids, and eudicots but three for monocots. This variation might be caused by a series of WGDs followed by differential gene retention and loss rates between eudicots and monocots, like the SET and JmjC domain gene families (Zhang and Ma, 2012; Qian et al., 2015). Although eudicots have also experienced a series of WGDs (e.g., α, β, and γ in Arabidopsis(Bowers et al., 2003)), most duplicated FTs were probably lost, except for soybean and Chenopodium quinoa(Supplementary Figure 6, Figure 7). Monocots had also experienced three WGD events: τ, σ, and ρ (Tang et al., 2010; Lee et al., 2013b; Jiao et al., 2014), but lots of FT genes had been retained, especially in grasses. Such as in clades I and III, FT genes were divided into two subclades, I-1, I-2, and III-1, III-2, respectively. Those subclades did not include genes from early monocots Z. marina and S. polyrhiza. High confidence of the tree topology in Figure 2 suggested that the subclades in I and III might be derived from the τ WGD (Jiao et al., 2014), which occurred after the split of S. polyrhiza and the other core monocots approximately 150 MYA. The other two WGDs σ and ρ occurred before and after the split between grasses and A. comosus(Tang et al., 2010; Ming et al., 2015). In our study using Picea abies FT-like (JN039333) as the outgroup, at least one copy of FT genes from pineapple and grass species were present in clades II-1 and II-2. Moreover, syntenic regions were identified in those clades, suggesting that the two groups could be resulted from the σ WGD, which occurred 95~115 MYA. Alternatively, syntenic regions of FT genes were found in II-1a and II-1b, and II-2c and II-2d, respectively, indicating further expansion by ρ WGD (Paterson et al., 2004). A similar expansion (one σ and two ρ WGDs) also happened in clade III-2, resulting in four subclades. All those results reveal that WGDs are the main reason for the FT gene expansion in monocots.
Functional diversification of FT genes in monocots
In total, lots of FT genes in monocots provided abundant genetic materials for function diversity to face complex circumstances. For example, three FT genes (SbFT1, SbFT8, and SbFT10) were identified as florigen in sorghum (Wolabu et al., 2016), whereas SbFT12 had the function to repress flowering (Cuevas et al., 2016). Under photoperiod and vernalization, HvFT3 and TaFT3 delayed flowering under short-day photoperiods in winter and induced flowering in long days in the spring (Halliwell et al., 2016). In our study, FT genes’ high expression in monocots but not eudicots repress flowering under vernalization. In Allium cepa, four FT genes with different functions including, repressing flower, bulbing, and bulb formation (Lee et al., 2013a).
Here, our results revealed that after the divergence of monocots and dicots, the common ancestor of monocots underwent ancient duplication events, giving rise to the three clades’ FT genes in monocots (Paterson et al., 2004; Tang et al., 2010; Ming et al., 2015), which we named clades I, II, and III. Subsequently in Poaceae, clade I FT genes were duplicated after experiencing τ WGD events and formed I-1 and I-2 subclades, clade II FT genes were duplicated twice after experiencing τ and σ WGD events, and duplicated FT gene pairs in clade III were retained after undergoing three rounds of WGD events (i.e., τ, σ, and ρ WGD events). FT genes in each clade evolved in its own way and thus probably functional differentiation arose during the subsequent evolutionary process.
Clade I FT genes are relatively conserved in terms of key amino acid sites and protein binding region, and large-scale transcriptome analysis of the rice and maize reveals that the clade I genes maintained high expression levels in almost all tissues, especially in leaves. We summarized almost all FTs with definite function in monocots (Table 7). These show that clade I might be the most conserved clade and represent the ancestral functions of FT, and the other two clades might have experienced functional diversification such as subfunctionalization, neofunctionalization, or loss of function. Based on the above results, we hypothesize that the clade I genes might be the most conserved genes to the ancestral FT genes, inheriting and maintaining the regulatory function of flowering time. Apart from that, some clade I genes were co-expressed with a large number of MADS-box genes, crucial genes for flower development, which suggested that clade I genes may also be involved in floral organ development in addition to mediating the flowering time in monocots.
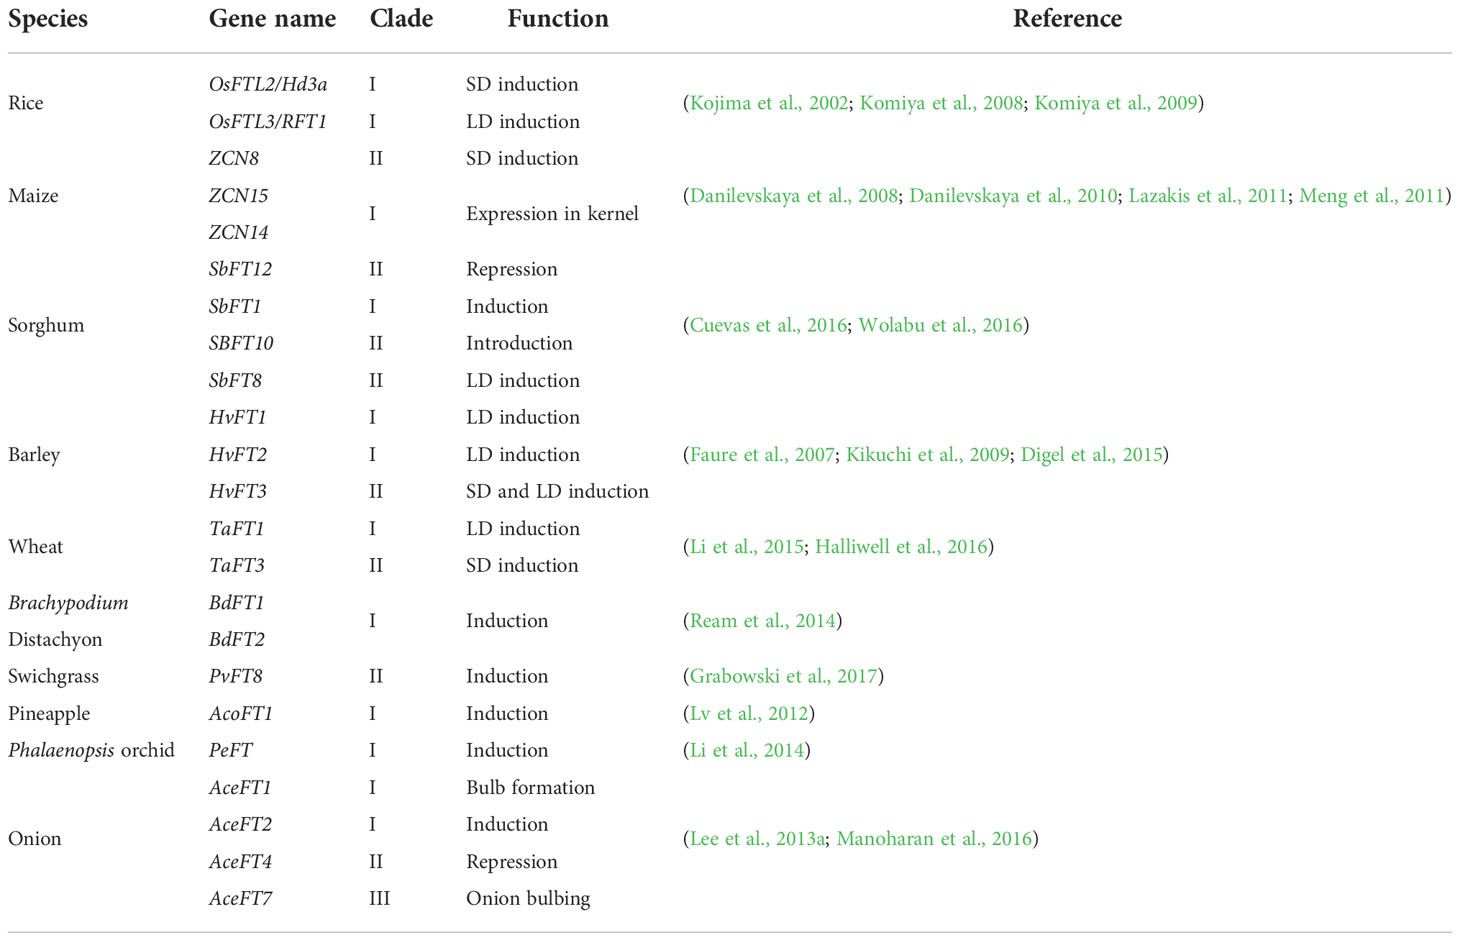
Table 7 FT gene in each monocot species.
Clade II genes experienced higher levels of positive selection pressure compared with the clade I gene. Seven positively selected sites (G33, Q34, R44, M115, V120, W138, and I150) were identified between clades I and II. Among those sites, three positive selection sites (W138, I150, and M115) were proved to be vital for florigen function in Arabidopsis, soybean, and other species, and notably W138 also acts as a functional divergence (FD) site which is an important site located at the segment B region (Ahn et al., 2006) and it has shown that flowering was repressed when W138 was mutated to R138 in Arabidopsis, sorghum, and onion (Lee et al., 2013a; Ho and Weigel, 2014; Cuevas et al., 2016). In addition, I150 has been replaced by R150, which is a vital site in soybean, in which I150 changed into E or Y with repression function (Ho and Weigel, 2014; Wang et al., 2015). Another substitution site 115, which induces weak florigen function in soybean (Wang et al., 2015), is also under positive selection. The region interacting with 14-3-3 proteins is also highly variable in clade II, with about half of the genes maintaining a low expression level and the other genes being largely unexpressed in all tested organs for rice and maize transcriptome analysis. Three clade II FT genes in B. distachyon, three clade II FT genes in D. glomerate, and one gene clade II FT in wheat showed high expression under vernalization circumstances to repress flowering in winter.
Similar to clade II, clade III had a relatively high positive selection pressure, segment B region was also variable, and only few genes lowly expressed or showed tissue-specific high expression patterns, which indicates that non-functionalization or neofunctionalization might have occurred in clade III. In Figure 2, clade III can be divided into two subclades III-1 and III-2. The expression of genes in III-1 had similar expression patterns with florigen functional genes but have extremely low expression in each tissue, which demonstrated that III-1 might keep a part of ancient FT gene function in controlling flowering time. Genes in III-2-2c have been replaced with a change from Y85 to N85 (Supplementary Figure 5). Given that Y85 is very important for florigen function (Hanzawa et al., 2005), the substitution in the subclade may result in acquisition of a new function or loss of the original function. Substitution in this site also occurred in some early monocot species changing from Y85 to H85 (Hanzawa et al., 2005), which have been proved in Arabidopsis to form TFL1 function. In clade III-2, four positively selected sites have been detected in III-2-2d, among which sites 61 and 96 were located at the region interacting with the 14-3-3 protein. In this subclade, L61 was replaced by R or G, and T96 was replaced by G, which suggests that those genes in this subclade could not interact with the 14-3-3 protein nor the FD protein to promote flowering and thus are functionally diverged (Taoka et al., 2011). Genes in III-2-1a (OsFTL11 in rice and ZCN17 in maize) were highly expressed only in roots and OsFTL11 was co-expressed with many disease-resistant R genes, so it is speculated that clade III genes may have diverged into a new function and be involved in disease resistance.
Our study revealed that after different rounds of WGD events, each clade or subclade gene underwent different levels of amino acid substitutions and were subjected to different selective pressures, which then led to functional divergence, so some genes maintained original functions, whereas other genes might have generated new functions or lost their original functions via the accumulation of amino acid mutations. The results from our study will provide highly valuable insights for future functional research of FTs.
Conclusion
In summary, compared with the monophyletic group identified in early angiosperms, magnoliids, and eudicots, more FT genes were present in monocots and divided into three clades (I, II, and III). The whole-genome duplication was probably the main driver for increasing gene numbers in the FT gene family. Most of florigen-functioning FT genes had been identified in clade I, and all of them are under purifying selection and had a high expression level compared with clade II and III genes, suggesting that clade I represents the ancestor of FT genes in monocots. We found that II and III FT genes might be subject to positive selection. Our study highlighted that the role of positive selection, particularly the positively selected site substitutions in the conserved functional domain, might be the reason for gene functional divergence in FT genes. Taken together, our results revealed that the sequences of FT genes in monocots were variable under positive selection, which provides new insights into the mechanism of gene duplication, gene retention, and functional divergence to adjust the rapid changing environment.
Data availability statement
The datasets presented in this study can be found in online repositories. The names of the repository/repositories and accession number(s) can be found in the article/Supplementary Material.
Author contributions
LZ conceived and designed the study. XL analyzed sequence data and performed phylogenetic reconstructions with FC. HL conducted transcriptome analysis. HL, XL, and LZ wrote the manuscript with input from all authors.
Funding
This work was supported by the National Natural Science Foundation of China (32272750) and a start-up fund from Zhejiang University to LZ.
Acknowledgments
The authors wish to thank Jing Hu of Hainan Institute of Zhejiang University, China for providing funding assistance in this project.
Conflict of interest
The authors declare that the research was conducted in the absence of any commercial or financial relationships that could be construed as a potential conflict of interest.
Publisher’s note
All claims expressed in this article are solely those of the authors and do not necessarily represent those of their affiliated organizations, or those of the publisher, the editors and the reviewers. Any product that may be evaluated in this article, or claim that may be made by its manufacturer, is not guaranteed or endorsed by the publisher.
Supplementary material
The Supplementary Material for this article can be found online at: https://www.frontiersin.org/articles/10.3389/fpls.2022.1039500/full#supplementary-material
References
Ahn, J. H., Miller, D., Winter, V. J., Banfield, M. J., Lee, J. H., Yoo, S. Y., et al. (2006). A divergent external loop confers antagonistic activity on floral regulators FT and TFL1. EMBO J. 25 (3), 605–614. doi: 10.1038/sj.emboj.7600950
Ashkenazy, H., Abadi, S., Martz, E., Chay, O., Mayrose, I., Pupko, T., et al. (2016). ConSurf 2016: An improved methodology to estimate and visualize evolutionary conservation in macromolecules. Nucleic Acids Res. 44 (W1), 344–350. doi: 10.1093/nar/gkw408
Ben Michael, T. E., Faigenboim, A., Shemesh-Mayer, E., Forer, I., Gershberg, C., Shafran, H., et al. (2020). Crosstalk in the darkness: bulb vernalization activates meristem transition via circadian rhythm and photoperiodic pathway. BMC Plant Biol. 20 (1), 77. doi: 10.1186/s12870-020-2269-x
Bielawski, J. P., Yang, Z. (2005). “Maximum likelihood methods for detecting adaptive protein evolution,” in Statistical methods in molecular evolution (New York: Springer Science), 103–124.
Birchler, J. A., Yang, H. (2022). The multiple fates of gene duplications: Deletion, hypofunctionalization, subfunctionalization, neofunctionalization, dosage balance constraints, and neutral variation. Plant Cell 34 (7), 2466–2474. doi: 10.1093/plcell/koac076
Bowers, J. E., Chapman, B. A., Rong, J., Paterson, A. H. (2003). Unravelling angiosperm genome evolution by phylogenetic analysis of chromosomal duplication events. Nature 422 (6930), 433–438. doi: 10.1038/nature01521
Camacho, C., Coulouris, G., Avagyan, V., Ma, N., Papadopoulos, J., Bealer, K., et al. (2009). BLAST+: Architecture and applications. BMC Bioinf. 10, 421. doi: 10.1186/1471-2105-10-421
Carmona, M. J., Calonje, M., Martínez-Zapater, J. M. (2007). The FT/TFL1 gene family in grapevine. Plant Mol. Biol. 63 (5), 637–650. doi: 10.1007/s11103-006-9113-z
Carpenter, E. J., Matasci, N., Ayyampalayam, S., Wu, S., Sun, J., Yu, J., et al. (2019). Access to RNA-sequencing data from 1,173 plant species: The 1000 plant transcriptomes initiative (1KP). Gigascience 8 (10), 1–7. doi: 10.1093/gigascience/giz126
Chailakhyan, M. (1936). New facts in support of the hormonal theory of plant development. Comptes Rendus Acad. Sci. URSS 12), 443–447.
Chardon, F., Damerval, C. (2005). Phylogenomic analysis of the PEBP gene family in cereals. J. Mol. Evol. 61 (5), 579–590. doi: 10.1007/s00239-004-0179-4
Cuevas, H. E., Zhou, C., Tang, H., Khadke, P. P., Das, S., Lin, Y.-R., et al. (2016). The evolution of photoperiod-insensitive flowering in sorghum, a genomic model for panicoid grasses. Mol. Biol. Evol. 33 (9), 2417–2428. doi: 10.1093/molbev/msw120
Cui, R., Han, J., Zhao, S., Su, K., Wu, F., Du, X., et al. (2010). Functional conservation and diversification of class e floral homeotic genes in rice (Oryza sativa). Plant J. 61 (5), 767–781. doi: 10.1111/j.1365-313X.2009.04101.x
Danilevskaya, O. N., Meng, X., Ananiev, E. V. (2010). Concerted modification of flowering time and inflorescence architecture by ectopic expression of TFL1-like genes in maize. Plant Physiol. 153 (1), 238–251. doi: 10.1104/pp.110.154211
Danilevskaya, O. N., Meng, X., Hou, Z., Ananiev, E. V., Simmons, C. R. (2008). A genomic and expression compendium of the expanded PEBP gene family from maize. Plant Physiol. 146 (1), 250–264. doi: 10.1104/pp.107.109538
Deng, W., Casao, M. C., Wang, P., Sato, K., Hayes, P. M., Finnegan, E. J., et al. (2015). Direct links between the vernalization response and other key traits of cereal crops. Nat. Commun. 6, 5882. doi: 10.1038/ncomms6882
Digel, B., Pankin, A., von Korff, M. (2015). Global transcriptome profiling of developing leaf and shoot apices reveals distinct genetic and environmental control of floral transition and inflorescence development in barley. Plant Cell 27 (9), 2318–2334. doi: 10.1105/tpc.15.00203
Drabešová, J., Černá, L., Mašterová, H., Koloušková, P., Potocký, M., Štorchová, H. (2016). The evolution of the FT/TFL1 genes in amaranthaceae and their expression patterns in the course of vegetative growth and flowering in chenopodium rubrum. G3 (Bethesda) 6 (10), 3065–3076. doi: 10.1534/g3.116.028639
Esumi, T., Hagihara, C., Kitamura, Y., Yamane, H., Tao, R. (2009). Identification of an FT ortholog in Japanese apricot (Prunus mume sieb. et zucc.). J. Hortic. Sci. Biotech. 84 (2), 149–154. doi: 10.1080/14620316.2009.11512496
Faure, S., Higgins, J., Turner, A., Laurie, D. A. (2007). The FLOWERING LOCUS T-like gene family in barley (Hordeum vulgare). Genetics 176 (1), 599–609. doi: 10.1534/genetics.106.069500
Feng, G., Xu, L., Wang, J., Nie, G., Bushman, B. S., Xie, W., et al. (2018). Integration of small RNAs and transcriptome sequencing uncovers a complex regulatory network during vernalization and heading stages of orchardgrass (Dactylis glomerata l.). BMC Genomics 19 (1), 727. doi: 10.1186/s12864-018-5104-0
Frazee, A. C., Pertea, G., Jaffe, A. E., Langmead, B., Salzberg, S. L., Leek, J. T. (2015). Ballgown bridges the gap between transcriptome assembly and expression analysis. Nat. Biotechnol. 33 (3), 243–246. doi: 10.1038/nbt.3172
Grabowski, P., Buckler, E., Casler, M. (2017). Genome-wide associations with flowering time in switchgrass. New Phytol. 213 (1), 154–169. doi: 10.1111/nph.14101
Gu, X. (1999). Statistical methods for testing functional divergence after gene duplication. Mol. Biol. Evol. 16 (12), 1664–1674. doi: 10.1093/oxfordjournals.molbev.a026080
Gu, X. (2006). A simple statistical method for estimating type-II (cluster-specific) functional divergence of protein sequences. Mol. Biol. Evol. 23 (10), 1937–1945. doi: 10.1093/molbev/msl056
Gu, X., Zou, Y., Su, Z., Huang, W., Zhou, Z., Arendsee, Z., et al. (2013). An update of DIVERGE software for functional divergence analysis of protein family. Mol. Biol. Evol. 30 (7), 1713–1719. doi: 10.1093/molbev/mst069
Halliwell, J., Borrill, P., Gordon, A., Kowalczyk, R., Pagano, M. L., Saccomanno, B., et al. (2016). Systematic investigation of FLOWERING LOCUS T-like poaceae gene families identifies the short-day expressed flowering pathway gene, TaFT3 in wheat (Triticum aestivum l.). Front. Plant Sci. 22 (7), 857. doi: 10.3389/fpls.2016.00857
Hanzawa, Y., Money, T., Bradley, D. (2005). A single amino acid converts a repressor to an activator of flowering. Proc. Natl. Acad. Sci. U.S.A. 102 (21), 7748–7753. doi: 10.1073/pnas.0500932102
Hedman, H., Källman, T., Lagercrantz, U. (2009). Early evolution of the MFT-like gene family in plants. Plant Mol. Biol. 70 (4), 359–369. doi: 10.1007/s11103-009-9478-x
Hou, C.-J., Yang, C.-H. (2009). Functional analysis of FT and TFL1 orthologs from orchid (Oncidium Gower ramsey) that regulate the vegetative to reproductive transition. Plant Cell Physiol. 50 (8), 1544–1557. doi: 10.1093/pcp/pcp099
Ho, W. W. H., Weigel, D. (2014). Structural features determining flower-promoting activity of arabidopsis FLOWERING LOCUS T. Plant Cell 26 (2), 552–564. doi: 10.1105/tpc.113.115220
Hsu, C.-Y., Adams, J. P., Kim, H., No, K., Ma, C., Strauss, S. H., et al. (2011). FLOWERING LOCUS T duplication coordinates reproductive and vegetative growth in perennial poplar. Proc. Natl. Acad. Sci. U.S.A. 108 (26), 10756–10761. doi: 10.1073/pnas.1104713108
Huang, N. C., Jane, W. N., Chen, J., Yu, T. S. (2012). Arabidopsis thaliana CENTRORADIALIS homologue (ATC) acts systemically to inhibit floral initiation in arabidopsis. Plant J. 72 (2), 175–184. doi: 10.1111/j.1365-313X.2012.05076.x
Huelsenbeck, J. P., Ronquist, F. (2001). MrBayes: Bayesian inference of phylogeny. Bioinformatics 17 (8), 754–755. doi: 10.1093/bioinformatics/17.8.754
Itoh, H., Nonoue, Y., Yano, M., Izawa, T. (2010). A pair of floral regulators sets critical day length for Hd3a florigen expression in rice. Nat. Genet. 42 (7), 635–638. doi: 10.1038/ng.606
Ito-Inaba, Y., Masuko-Suzuki, H., Maekawa, H., Watanabe, M., Inaba, T. (2016). Characterization of two PEBP genes, SrFT and SrMFT, in thermogenic skunk cabbage (Symplocarpus renifolius). Sci. Rep. 6, 29440. doi: 10.1038/srep29440
Jiao, Y., Li, J., Tang, H., Paterson, A. H. (2014). Integrated syntenic and phylogenomic analyses reveal an ancient genome duplication in monocots. Plant Cell 26 (7), 2792–2802. doi: 10.1105/tpc.114.127597
Jones, D. M., Wells, R., Pullen, N., Trick, M., Irwin, J. A., Morris, R. J. (2018). Spatio-temporal expression dynamics differ between homologues of flowering time genes in the allopolyploid brassica napus. Plant J. 96 (1), 103–118. doi: 10.1111/tpj.14020
Jung, W. Y., Lee, A., Moon, J. S., Kim, Y.-S., Cho, H. S. (2018). Genome-wide identification of flowering time genes associated with vernalization and the regulatory flowering networks in Chinese cabbage. Plant Biotechnol. Rep. 12 (5), 347–363. doi: 10.1007/s11816-018-0500-0
Katoh, K., Misawa, K., Kuma, K. I., Miyata, T. (2002). MAFFT: A novel method for rapid multiple sequence alignment based on fast Fourier transform. Nucleic Acids Res. 30 (14), 3059–3066. doi: 10.1093/nar/gkf436
Kim, D., Langmead, B., Salzberg, S. L. (2015). HISAT: A fast spliced aligner with low memory requirements. Nat. Methods 12 (4), 357–360. doi: 10.1038/nmeth.3317
Kikuchi, R., Kawahigashi, H., Ando, T., Tonooka, T., Handa, H. (2009). Molecular and functional characterization of PEBP genes in barley reveal the diversification of their roles in flpowering. Plant Physiol. 149 (3), 1341–1353. doi: 10.1104/pp.108.132134
Klintenäs, M., Pin, P. A., Benlloch, R., Ingvarsson, P. K., Nilsson, O. (2012). Analysis of conifer FLOWERING LOCUS T/TERMINAL FLOWER1-like genes provides evidence for dramatic biochemical evolution in the angiosperm FT lineage. New Phytol. 196 (4), 1260–1273. doi: 10.1111/j.1469-8137.2012.04332.x
Kobayashi, Y., Kaya, H., Goto, K., Iwabuchi, M., Araki, T. (1999). A pair of related genes with antagonistic roles in mediating flowering signals. Science 286, 1960–1962. doi: 10.1126/science.286.5446.1960
Kojima, S., Takahashi, Y., Kobayashi, Y., Monna, L., Sasaki, T., Araki, T., et al. (2002). Hd3a, a rice ortholog of the arabidopsis FT gene, promotes transition to flowering downstream of Hd1 under short-day conditions. Plant Cell Physiol. 43 (10), 1096–1105. doi: 10.1093/pcp/pcf156
Komiya, R., Ikegami, A., Tamaki, S., Yokoi, S., Shimamoto, K. (2008). Hd3a and RFT1 are essential for flowering in rice. Development 135 (4), 767–774. doi: 10.1242/dev.008631
Komiya, R., Yokoi, S., Shimamoto, K. (2009). A gene network for long-day flowering activates RFT1 encoding a mobile flowering signal in rice. Development 136 (20), 3443–3450. doi: 10.1242/dev.040170
Kotoda, N., Hayashi, H., Suzuki, M., Igarashi, M., Hatsuyama, Y., Kidou, S.-I., et al. (2010). Molecular characterization of FLOWERING LOCUS T-like genes of apple (Malus× domestica borkh.). Plant Cell Physiol. 51 (4), 561–575. doi: 10.1093/pcp/pcq021
Kumar, S., Stecher, G., Tamura, K. (2016). MEGA7: Molecular evolutionary genetics analysis version 7.0 for bigger datasets. Mol. Biol. Evol. 33 (7), 1870–1874. doi: 10.1093/molbev/msw054
Lazakis, C. M., Coneva, V., Colasanti, J. (2011). ZCN8 encodes a potential orthologue of arabidopsis FT florigen that integrates both endogenous and photoperiod flowering signals in maize. J. Exp. Bot. 62 (14), 4833–4842. doi: 10.1093/jxb/err129
Lee, R., Baldwin, S., Kenel, F., McCallum, J., Macknight, R. (2013a). FLOWERING LOCUS T genes control onion bulb formation and flowering. Nat. Commun. 4, 2884. doi: 10.1038/ncomms3884
Lee, T.-H., Tang, H., Wang, X., Paterson, A. H. (2013b). PGDD: A database of gene and genome duplication in plants. Nucleic Acids Res. 41 (D1), D1152–D1158. doi: 10.1093/nar/gks1104
Li, C., Lin, H., Dubcovsky, J. (2015). Factorial combinations of protein interactions generate a multiplicity of florigen activation complexes in wheat and barley. Plant J. 84 (1), 70–82. doi: 10.1111/tpj.12960
Li, D. M., L, F. B., Zhu, G. F., Sun, Y. B., Liu, H. L., Liu, J. W., et al. (2014). Molecular characterization and functional analysis of a flowering locus T homolog gene from a phalaenopsis orchid. Genet. Mol. Res. 13 (3), 5982–5994. doi: 10.4238/2014.August.7.14
Lifschitz, E., Eviatar, T., Rozman, A., Shalit, A., Goldshmidt, A., Amsellem, Z., et al. (2006). The tomato FT ortholog triggers systemic signals that regulate growth and flowering and substitute for diverse environmental stimuli. Proc. Natl. Acad. Sci. U.S.A. 103 (16), 6398–6403. doi: 10.1073/pnas.0601620103
Lin, M.-K., Belanger, H., Lee, Y.-J., Varkonyi-Gasic, E., Taoka, K.-I., Miura, E., et al. (2007). FLOWERING LOCUS T protein may act as the long-distance florigenic signal in the cucurbits. Plant Cell 19 (5), 1488–1506. doi: 10.1105/tpc.107.051920
Lu, S.-J., Wei, H., Wang, Y., Wang, H.-M., Yang, R.-F., Zhang, X.-B., et al. (2012). Overexpression of a transcription factor OsMADS15 modifies plant architecture and flowering time in rice (Oryza sativa l.). Plant Mol. Biol. Rep. 30 (6), 1461–1469. doi: 10.1007/s11105-012-0468-9
Lv, L., Duan, J., Xie, J., Wei, C., Liu, Y., Liu, S., et al. (2012). Isolation and characterization of a FLOWERING LOCUS T homolog from pineapple (Ananas comosus (L.) merr). Gene 505 (2), 368–373. doi: 10.1016/j.gene.2012.06.011
Manoharan, R. K., Han, J. S., Vijayakumar, H., Subramani, B., Thamilarasan, S. K., Park, J. I., et al. (2016). Molecular and functional characterization of FLOWERING LOCUS T homologs in allium cepa. Molecules 21, (2). doi: 10.3390/molecules21020217
Mao, Y., Sun, J., Cao, P., Zhang, R., Fu, Q., Chen, S., et al. (2016). Functional analysis of alternative splicing of the FLOWERING LOCUS T orthologous gene in chrysanthemum morifolium. Hortic. Res. 3, 16058. doi: 10.1038/hortres.2016.58
Meng, X., Muszynski, M. G., Danilevskaya, O. N. (2011). The FT-like ZCN8 gene functions as a floral activator and is involved in photoperiod sensitivity in maize. Plant Cell 23 (3), 942–960. doi: 10.1105/tpc.110.081406
Ming, R., VanBuren, R., Wai, C. M., Tang, H., Schatz, M. C., Bowers, J. E., et al. (2015). The pineapple genome and the evolution of CAM photosynthesis. Nat. Genet. 47 (12), 1435–1442. doi: 10.1038/ng.3435
Mistry, J., Finn, R. D., Eddy, S. R., Bateman, A., Punta, M. (2013). Challenges in homology search: HMMER3 and convergent evolution of coiled-coil regions. Nucleic Acids Res. 41 (12), e121. doi: 10.1093/nar/gkt263
Navarro, C., Abelenda, J. A., Cruz-Oró, E., Cuéllar, C. A., Tamaki, S., Silva, J., et al. (2011). Control of flowering and storage organ formation in potato by FLOWERING LOCUS T. Nature 478 (7367), 119–122. doi: 10.1038/nature10431
Paterson, A., Bowers, J., Chapman, B. (2004). Ancient polyploidization predating divergence of the cereals, and its consequences for comparative genomics. Proc. Natl. Acad. Sci. U.S.A. 101 (26), 9903–9908. doi: 10.1073/pnas.0307901101
Pertea, M., Kim, D., Pertea, G. M., Leek, J. T., Salzberg, S. L. (2016). Transcript-level expression analysis of RNA-seq experiments with HISAT, StringTie and ballgown. Nat. Protoc. 11 (9), 1650–1667. doi: 10.1038/nprot.2016.095
Pertea, M., Pertea, G. M., Antonescu, C. M., Chang, T. C., Mendell, J. T., Salzberg, S. L. (2015). StringTie enables improved reconstruction of a transcriptome from RNA-seq reads. Nat. Biotechnol. 33 (3), 290–295. doi: 10.1038/nbt.3122
Pin, P. A., Benlloch, R., Bonnet, D., Wremerth-Weich, E., Kraft, T., Gielen, J. J., et al. (2010). An antagonistic pair of FT homologs mediates the control of flowering time in sugar beet. Science 330 (6009), 1397–1400. doi: 10.1126/science.1197004
Preston, J. C., Zhong, J., McKeown, M., den Bakker, M., Friedman, J. (2016). Comparative transcriptomics indicates a role for SHORT VEGETATIVE PHASE (SVP) genes in mimulus guttatus vernalization response. G3 (Bethesda) 6 (5), 1239–1249. doi: 10.1534/g3.115.026468
Price, M. N., Dehal, P. S., Arkin, A. P. (2009). FastTree: Computing large minimum evolution trees with profiles instead of a distance matrix. Mol. Biol. Evol. 26 (7), 1641–1650. doi: 10.1093/molbev/msp077
Putterill, J., Zhang, L., Yeoh, C. C., Balcerowicz, M., Jaudal, M., Gasic, E. V. (2013). FT genes and regulation of flowering in the legume medicago truncatula. Funct. Plant Biol. 40 (12), 1199–1207. doi: 10.1071/FP13087
Qian, S., Wang, Y., Ma, H., Zhang, L. (2015). Expansion and functional divergence of the JmjC gene family: Significance of duplications in ancestral angiosperms and vertebrates. Plant Physiol. 168 (4), 1321–1337. doi: 10.1104/pp.15.00520
Ream, T. S., Woods, D. P., Schwartz, C. J., Sanabria, C. P., Mahoy, J. A., Walters, E. M., et al. (2014). Interaction of photoperiod and vernalization determines flowering time of brachypodium distachyon. Plant Physiol. 164 (2), 694–709. doi: 10.1104/pp.113.232678
Samad, S., Kurokura, T., Koskela, E., Toivainen, T., Patel, V., Mouhu, K., et al. (2017). Additive QTLs on three chromosomes control flowering time in woodland strawberry (Fragaria vesca l.). Hortic. Res. 4, 17020. doi: 10.1038/hortres.2017.20
Sharma, B., Batz, T. A., Kaundal, R., Kramer, E. M., Sanders, U. R., Mellano, V. J., et al. (2019). Developmental and molecular changes underlying the vernalization-induced transition to flowering in aquilegia coerulea (James). Genes (Basel) 10 (10), 1–18. doi: 10.3390/genes10100734
Sun, J., Wang, H., Ren, L., Chen, S., Chen, F., Jiang, J. (2017). CmFTL2 is involved in the photoperiod-and sucrose-mediated control of flowering time in chrysanthemum. Hortic. Res. 4, 17001. doi: 10.1038/hortres.2017.1
Tamaki, S., Matsuo, S., Wong, H. L., Yokoi, S., Shimamoto, K. (2007). Hd3a protein is a mobile flowering signal in rice. Science 316, 1033–1036. doi: 10.1126/science.1141753
Tang, H., Bowers, J. E., Wang, X., Paterson, A. H. (2010). Angiosperm genome comparisons reveal early polyploidy in the monocot lineage. Proc. Natl. Acad. Sci. U.S.A. 107 (1), 472–477. doi: 10.1073/pnas.0908007107
Taoka, K.-i., Ohki, I., Tsuji, H., Furuita, K., Hayashi, K., Yanase, T., et al. (2011). 14-3-3 proteins act as intracellular receptors for rice Hd3a florigen. Nature 476 (7360), 332–335. doi: 10.1038/nature10272
Tiwari, S. B., Shen, Y., Chang, H. C., Hou, Y., Harris, A., Ma, S. F., et al. (2010). The flowering time regulator CONSTANS is recruited to the FLOWERING LOCUS T promoter via a unique cis-element. New Phytol. 187 (1), 57–66. doi: 10.1111/j.1469-8137.2010.03251.x
Valverde, F., Mouradov, A., Soppe, W., Ravenscroft, D., Samach, A., Coupland, G. (2004). Photoreceptor regulation of CONSTANS protein in photoperiodic flowering. Science 303 (5660), 1003–1006. doi: 10.1126/science.1091761
Wang, Z., Zhou, Z., Liu, Y., Liu, T., Li, Q., Ji, Y., et al. (2015). Functional evolution of phosphatidylethanolamine binding proteins in soybean and arabidopsis. Plant Cell 27 (2), 323–336. doi: 10.1105/tpc.114.135103
Wickland, D. P., Hanzawa, Y. (2015). The FLOWERING LOCUS T/TERMINAL FLOWER 1 gene family: Functional evolution and molecular mechanisms. Mol. Plant 8 (7), 983–997. doi: 10.1016/j.molp.2015.01.007
Wolabu, T. W., Zhang, F., Niu, L., Kalve, S., Bhatnagar-Mathur, P., Muszynski, M. G., et al. (2016). Three FLOWERING LOCUS T-like genes function as potential florigens and mediate photoperiod response in sorghum. New Phytol. 210 (3), 946–959. doi: 10.1111/nph.13834
Wong, C. E., Singh, M. B., Bhalla, P. L. (2013). The dynamics of soybean leaf and shoot apical meristem transcriptome undergoing floral initiation process. PloS One 8 (6), e65319. doi: 10.1371/journal.pone.0065319
Wu, L., Liu, D., Wu, J., Zhang, R., Qin, Z., Liu, D., et al. (2013). Regulation of FLOWERING LOCUS T by a microRNA in brachypodium distachyon. Plant Cell 25 (11), 4363–4377. doi: 10.1105/tpc.113.118620
Xi, W., Liu, C., Hou, X., Yu, H. (2010). MOTHER OF FT AND TFL1 regulates seed germination through a negative feedback loop modulating ABA signaling in arabidopsis. Plant Cell 22 (6), 1733–1748. doi: 10.1105/tpc.109.073072
Yamaguchi, A., Kobayashi, Y., Goto, K., Abe, M., Araki, T. (2005). TWIN SISTER OF FT (TSF) acts as a floral pathway integrator redundantly with FT. Plant Cell Physiol. 46 (8), 1175–1189. doi: 10.1093/pcp/pci151
Yang, Z. (2007). PAML 4: Phylogenetic analysis by maximum likelihood. Mol. Biol. Evol. 24 (8), 1586–1591. doi: 10.1093/molbev/msm088
Yang, J., Yan, R., Roy, A., Xu, D., Poisson, J., Zhang, Y. (2015). The I-TASSER suite: Protein structure and function prediction. Nat. Methods 12 (1), 7–8. doi: 10.1038/nmeth.3213
Yoo, S. J., Chung, K. S., Jung, S. H., Yoo, S. Y., Lee, J. S., Ahn, J. H. (2010). BROTHER OF FT AND TFL1 (BFT) has TFL1-like activity and functions redundantly with TFL1 in inflorescence meristem development in arabidopsis. Plant J. 63 (2), 241–253. doi: 10.1111/j.1365-313X.2010.04234.x
Yoo, S. Y., Kardailsky, I., Lee, J. S., Weigel, D., Ahn, J. H. (2004). Acceleration of flowering by overexpression of MFT. Mol. Cells 17 (1), 95–101.
Yu, Y., Zhang, H., Long, Y., Shu, Y., Zhai, J. (2022). Plant public RNA-seq database: A comprehensive online database for expression analysis of ~45 000 plant public RNA-seq libraries. Plant Biotechnol. J. 20 (5), 806–808. doi: 10.1111/pbi.13798
Zhang, Y., Han, E., Peng, Y., Wang, Y., Wang, Y., Geng, Z., et al. (2022). Rice co-expression network analysis identifies gene modules associated with agronomic traits. Plant Physiol. 190 (2), 1526–1542. doi: 10.1093/plphys/kiac339
Zhang, L., Ma, H. (2012). Complex evolutionary history and diverse domain organization of SET proteins suggest divergent regulatory interactions. New Phytol. 195 (1), 248–263. doi: 10.1111/j.1469-8137.2012.04143.x
Keywords: Flowering locus T (FT), monocots, gene duplication, positive selection, functional divergence
Citation: Liu H, Liu X, Chang X, Chen F, Lin Z and Zhang L (2023) Large-scale analyses of angiosperm Flowering Locus T genes reveal duplication and functional divergence in monocots. Front. Plant Sci. 13:1039500. doi: 10.3389/fpls.2022.1039500
Received: 08 September 2022; Accepted: 29 November 2022;
Published: 04 January 2023.
Edited by:
Fanjiang Kong, Guangzhou University, ChinaReviewed by:
Maria Von Korff Schmising, Heinrich Heine University of Düsseldorf, GermanyTicao Zhang, Yunnan University of Traditional Chinese Medicine, China
Copyright © 2023 Liu, Liu, Chang, Chen, Lin and Zhang. This is an open-access article distributed under the terms of the Creative Commons Attribution License (CC BY). The use, distribution or reproduction in other forums is permitted, provided the original author(s) and the copyright owner(s) are credited and that the original publication in this journal is cited, in accordance with accepted academic practice. No use, distribution or reproduction is permitted which does not comply with these terms.
*Correspondence: Liangsheng Zhang, emxzODNAemp1LmVkdS5jbg==
†These authors have contributed equally to this work