
94% of researchers rate our articles as excellent or good
Learn more about the work of our research integrity team to safeguard the quality of each article we publish.
Find out more
ORIGINAL RESEARCH article
Front. Plant Sci., 25 October 2022
Sec. Plant Systematics and Evolution
Volume 13 - 2022 | https://doi.org/10.3389/fpls.2022.1038998
 Junaldo A. Mantiquilla1,2†
 Meng-Shin Shiao3†
 Hsueh-Yu Lu1Kitichate Sridith4Siti Nordahliawate M. Sidique5Wasantha Kumara Liyanage6
 Ya-Ling Chu1Huie-Chuan Shih7
 Yu-Chung Chiang1,8*
Nipa (Nypa fruticans Wurmb.) is an important mangrove palm species, but it is understudied due to lack of information on genetic patterns within its distribution range. In this study, we identified 18 informative microsatellite markers to assess genetic variations among local populations in the Indo-West Pacific (IWP). Results showed population stratification based on high genetic differentiation (FST = 0.22131) with the Mantel test indicating significance to isolation-by-distance. We found a pronounced differentiation between the west populations in Sri Lanka and east populations in Southeast Asia. The east populations around the South China Sea were more genetically similar than those along the Malacca Strait and Java Sea. These genetic clines were shaped by ocean circulations and seasonal monsoon reversals as plausible factors. The Malacca Strait was confirmed as both a genetic and a geographic barrier rather than a corridor according to the Monmonier plot. Simulations of directional migration indicated a statistically strong contemporary genetic connectivity from west to east where Sri Lankan immigrants were detected as far as central Philippines via long-distance dispersal. This is the first report on the recent migration patterns of nipa using microsatellites. Assignment of first-generation (F0) immigrants suggested Mainland Southeast Asia as a melting pot due to the admixture associated with excess of homozygosity. The western populations were recent expansions that emerged in rapid succession based on a phylogram as supported by footprints of genetic drift based on bottleneck tests.
Earth is a plant-oriented planet and underutilized plants are of special importance. Underutilized plants are adding value to earth’s diversity that is fundamental to all life. They have multiple uses such as food and beverages, landscape arranging, and decorative household items, among others, with significant economic contribution (Dogan et al., 2014; Hasanbegovic et al., 2021; Saran et al., 2021). Among the palms, nipa serves as a source of construction materials (primarily thatch), dessert, alcoholic beverage, and bioethanol, and holds great economic potential, but it remains understudied (Rasco, 2011).
The nipa palm (Nypa fruticans Wurmb.) is the only species in the genus Nypa and in the subfamily Nypoideae, which indicates the distinct morphological characteristics from other members of the family Arecaceae (Uhl, 1972; Dransfield et al., 2008). It has an underground rhizomatous stem that grows horizontally and exhibits dichotomous branching, which can produce several ramets in a population. Once the branch is cut off from the mother palm, it becomes a new plant by clonal propagation (Rasco, 2011). However, nipa reproduces primarily by outcrossing, because the anthesis of protogynous female flowers occurs ahead of the males (Henderson, 1986; Mantiquilla et al., 2013). This natural cross-pollination strategy is entomophilous, which results in a concomitant high degree of self-incompatibility (Mantiquilla et al., 2016).
Along with other true mangroves, nipa constitutes the wetlands as influenced by tides that distribute mostly in Southeast Asia. It is particularly found in the estuaries trapping suspended sediments, where it stands to serve as a transition belt between mangrove and freshwater swamps (Fong, 1992). The current distribution of nipa is confined within the tropical Indo-West Pacific Region that ranges from Sri Lanka through Southeast Asia to northern Australia and the western Pacific islands (Hossain and Islam, 2015). Nakanishi (1987) reported that nipa also occurs irregularly in Iriomote Island in Ryukyu, Japan, which is the northern limit of nipa distribution. However, the individual plants were found sporadically on the island and were not able to establish the population due to lower average temperatures.
The fruit of nipa is a woody drupe that forms a cluster compressed into a fruit head termed as “infructescence”. The mature infructescence disintegrates by incipient vivipary; i.e., the fruits initiate to germinate by a protruding plumule followed by pushing them to release from the head and dispersed by tide floating (Das and Ghose, 2003; Joshi et al., 2006). This buoyancy is secured by the transformation of the outer mesocarp of the drupe into aerenchyma after the fruit attains its final dimensions, allowing hydrochory dispersal (Bobrov et al., 2012).
The germinated seed may drift on water in motion by either the flowing river or surface currents caused by wind in oceanic circulations, which may result in long-distance dispersal. Nakanishi (1987) recovered 28 species of drift disseminules, including nipa, on the mainland coasts of Japan. These driftages, mostly of palaeotropical types, were washed up from the Japan Sea along the entire west coast, but limited on the east coast facing the Pacific Ocean (PO).
pt?>Different genetic markers have been used to estimate the levels of genetic diversity and the degree of differentiation between and among nipa populations. These genetic markers include random amplified polymorphic DNA (RAPD), amplified fragment length polymorphism (AFLP), inter simple sequence repeats (ISSR), and simple sequence repeats (SSR). However, different conclusions have been drawn in different geographic regions using different markers. Several studies reported no or low levels of genetic diversity within and between populations in different areas including West Bengal, India (Bandyopadhyay et al., 2005), Iriomote Island, Japan (Setoguchi et al., 1999; Sugai et al., 2015), and Hainan, China (He et al., 2015). By including samples from a larger geographic region, i.e., China, Vietnam, and Thailand, Jian et al. (2010) reported polymorphisms in 2 SSRs among a total of 17 SSRs. In contrast, two studies show relatively higher levels of genetic variation by examining more genetic markers and more populations around Southern Luzon, Philippines (Lapitan and Nicolas, 2015) and Peninsular Malaysia (Tsuji et al., 2016). The authors identified polymorphisms in 25 SSRs among a total of 31 SSRs using 163 collected accessions, and in 57 AFLP loci among a total of 242 AFLP loci based on 27 populations examined, respectively. The inconclusive evidence of genetic diversity and differentiations may be due to less informative markers and limited sampling sites in the distribution range, or it truly demonstrated the uneven population diversities in different geographic regions of nipa.
As the species disperses widely in IWP and the genetic variations of its populations are still inconclusive, we aim to elucidate the population differentiation of nipa by extensive collection of samples in IWP and apply SSR markers to answer the question. More specifically, we will measure the genetic diversity of the local populations, determine the population structure and the associated genetic clustering in IWP, and evaluate the biological processes shaping the phylogeography of nipa for future conservation strategies.
A total of 445 samples were collected from different geographic regions in IWP. Sample collection began in May 2018 to October 2019 that ranged from the Philippine Archipelago, mainland Southeast Asia (Vietnam, Thailand, Malaysia, and Singapore), Indonesia, and Sri Lanka. The sampling sites in the region are enumerated in Table 1.
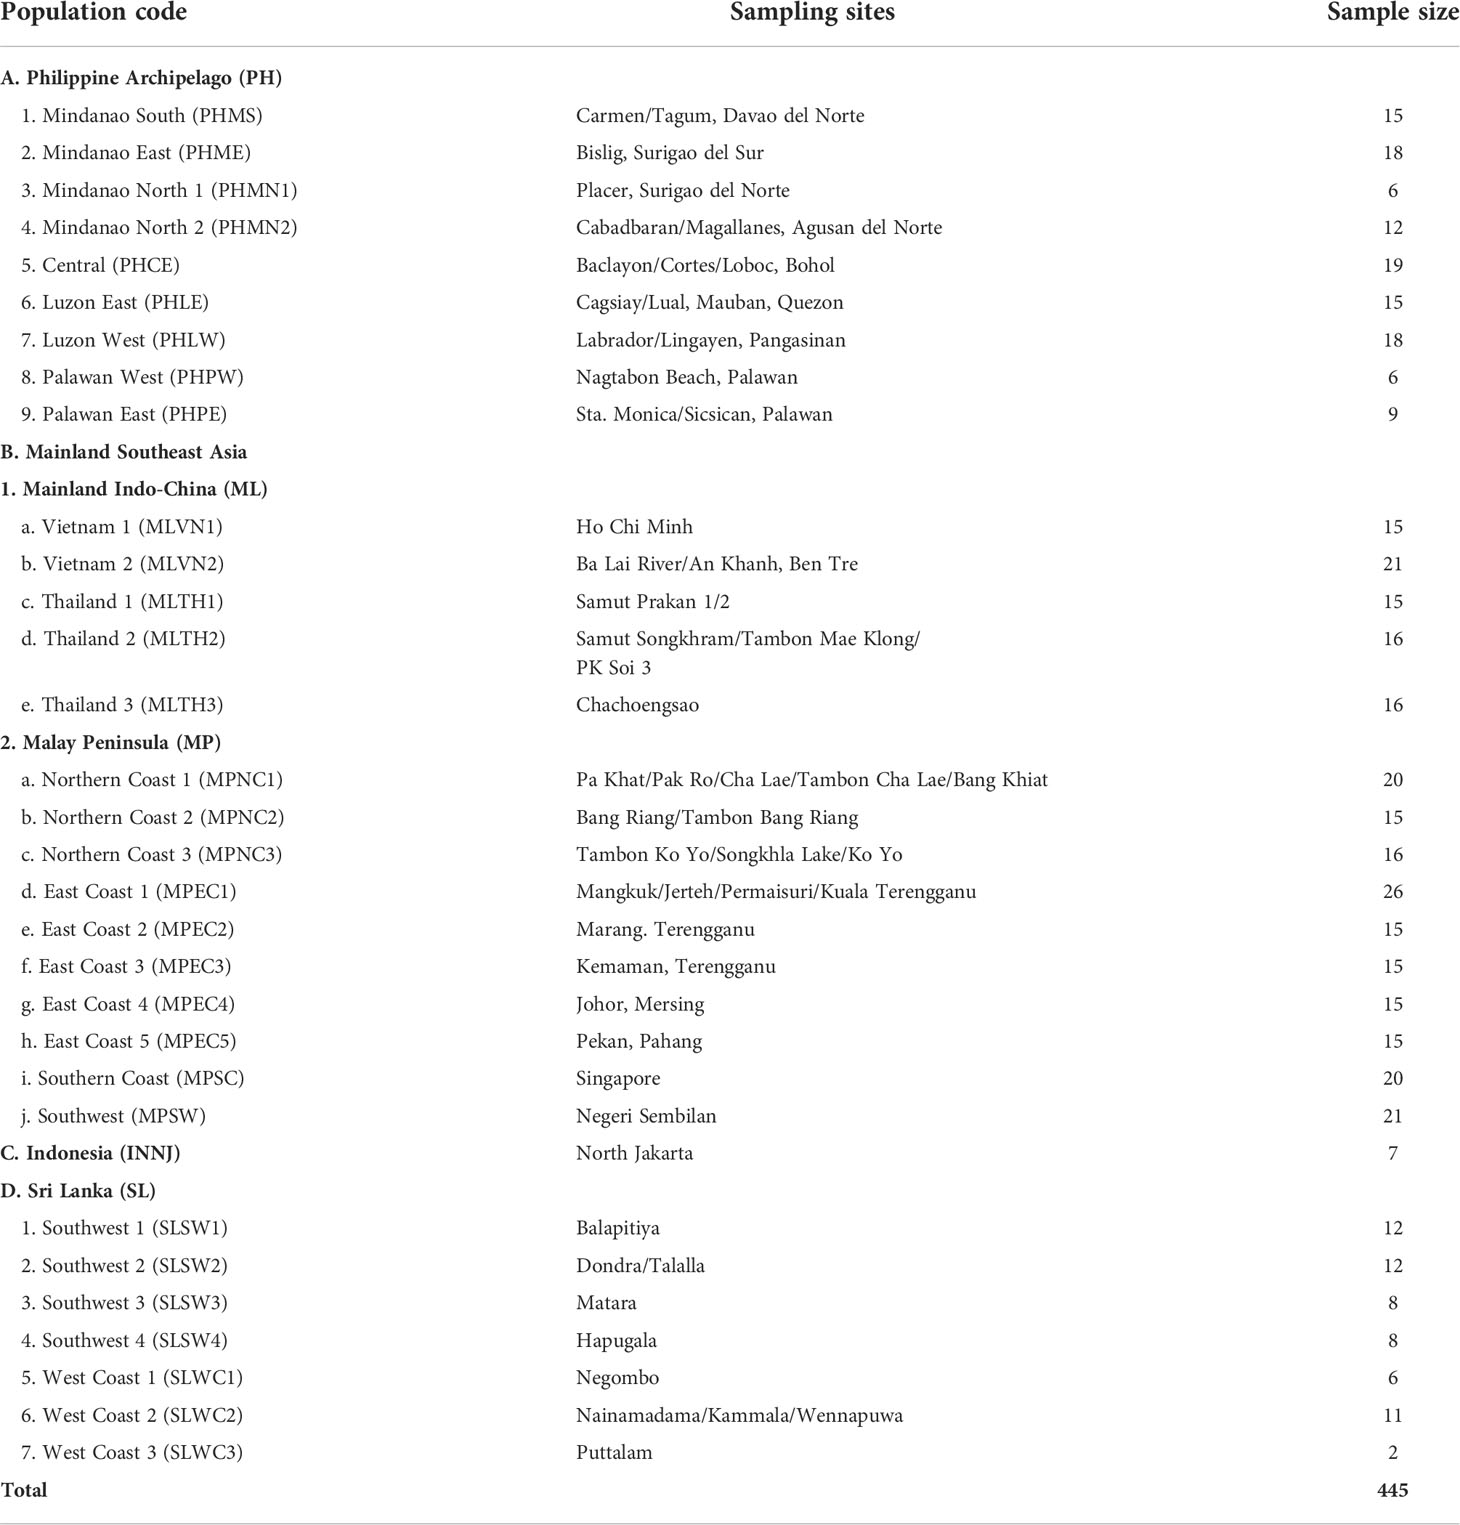
Table 1 The different sampling sites of nipa populations and their corresponding sampling sizes in the Indo-West Pacific.
The leaflet samples were kept refrigerated in tea bags with silica gel for desiccation prior to DNA isolation. The DNA was then extracted using a kit (RBC Real Genomics™ Box YGP 100) replicated three times followed by quality and quantity assessment: DNA quality and concentration were checked with the 1.5% agarose gel electrophoresis and Nano-300 Microspectrophotometer (Allsheng, Hangzhou, China), respectively. Samples with DNA absorbance ratio (A260/A280) larger than 1.8 were used for further analyses.
A total of 18 SSR loci identified as informative in the previous study was based on the whole genome sequencing of nipa by DNA amplification and polymorphic screening (Mantiquilla et al., 2021) intended for the 445 samples. Polymerase chain reactions (PCRs) were performed with a total of 20-µl volume containing 10.6 µl of double-distilled water, 2 µl of 10× buffer, 2 µl of dNTP, 2 µl of each of the forward and reverse primers, 0.4 µl of BSA, 0.5 µl of sample DNA, and 0.5 µl of Taq polymerase. Thermal cycles were performed in a Multigene Optimax Thermal Cycler (Applied Biosystems, CA, USA): initial denaturation at 94°C for 2 min, which was followed by 35 cycles of denaturation at 94°C for 45 s, temperature gradient between 50 and 60°C at 45 s, and extension at 72°C for 50 s. The final extension was set at 72°C for 7 min. The PCR products were then checked with 1.5% agarose gel electrophoresis prior to loading appropriate amount to polyacrylamide gel to read polymorphism.
Polymorphisms of 18 SSR loci were finally assessed by 10% polyacrylamide gel electrophoresis of PCR products mentioned above. The banding patterns were visualized by staining with ethidium bromide and by imaging with a digital camera. All markers were scored as co-dominant data based on the amplicon size using Quantity One ® software (Bio-Rad) to create a data matrix manually (Table S1).
All data analyses and visualization were conducted using R Stats Package (R Core Team, 2021) unless indicated otherwise. The genetic diversity and structure of nipa populations in IWP were analyzed for the following parameters (McDonald, 2008):
a. Variations at the population level were estimated by the number of alleles per locus, heterozygosity (observed and expected), population’s fixation index (F), and % polymorphic loci (P) in a population. Also, the analysis of multilocus genotype (MLG) diversity detects linkage disequilibrium (LD), a test for the departure from panmictic population by the standardized index of association, rbarD (r̄d), which accounts for the number of loci using poppr in R. Moreover, the identification of candidate loci under natural selection was determined using Bayescan based on reversible-jump Markov chain Monte Carlo (MCMC).
b. Variations at different levels among populations were assessed by the analysis of molecular variance (AMOVA), Wright’s fixation indices (FIS, FST, and FIT), and principal coordinates analysis (PCoA). Correlation between genetic distance and geographic distance was determined using Mantel tests (Diniz-Filho et al., 2013) for isolation by distance.
c. Population structure based on spatial patterns of genetic connectivity was analyzed by the spatial principal component analysis (sPCA) using adegenet in R. The genetic boundaries among georeferenced populations were detected by Monmonier’s algorithm. It finds the boundaries of maximum differences between continuous polygon of Voronoi tessellation to identify genetic barriers.
d. Population structure with assignment tests was evaluated by MCMC for genetic clusters based on the output summary of STRUCTURE HARVESTER implemented according to the Evanno method using STRUCTURE and Geneland (for georeferenced genotypes) that run under a Bayesian model, and the discriminant analysis of principal components (DAPC), using adegenet in R.
e. Directional migration patterns (east to west and vice versa) were tested according to relative migration network presented here based on Nm as determined by diveRsity, while the phylogenetic tree was constructed by a phylogram using the neighbor-joining method according to Nei’s distance by adegenet; both are implemented in R.
Previously, we reported that 18 out of 75 SSR loci were identified as highly polymorphic from 37 random samples (Mantiquilla et al., 2021). This initial screening indicated that the 18 SSRs are informative for genetic diversity analysis. Therefore, we expanded the samples to 445 from 32 populations in IWP to analyze the genetic diversities and differentiations across sampling locations (Table 1) using the 18 SSRs in this study. To correlate the results with the geographic regions, we further categorized the populations into five geographic regions: the Philippine Archipelago (9 populations), Mainland Indo-China (5 populations in Vietnam and Thailand), the Malay Peninsula (the rest of the 10 populations in mainland Southeast Asia), Indonesia (1 population), and Sri Lanka (7 populations).
The percentage of polymorphic loci (%P, Table 2) ranges from 94% to 100% in the populations of Philippine Archipelago, from 89% to 100% in Mainland Indo-China and the Malay Peninsula, and 100% in Indonesia. Lower percentages of polymorphic loci were observed in some of the populations of Sri Lanka, 55% in three populations, while the rest of the populations in the region still show high %P (>80%). The overall percentage reaches ~92% across IWP. This confirms that the 18 SSRs are highly polymorphic and informative across the populations in this study.
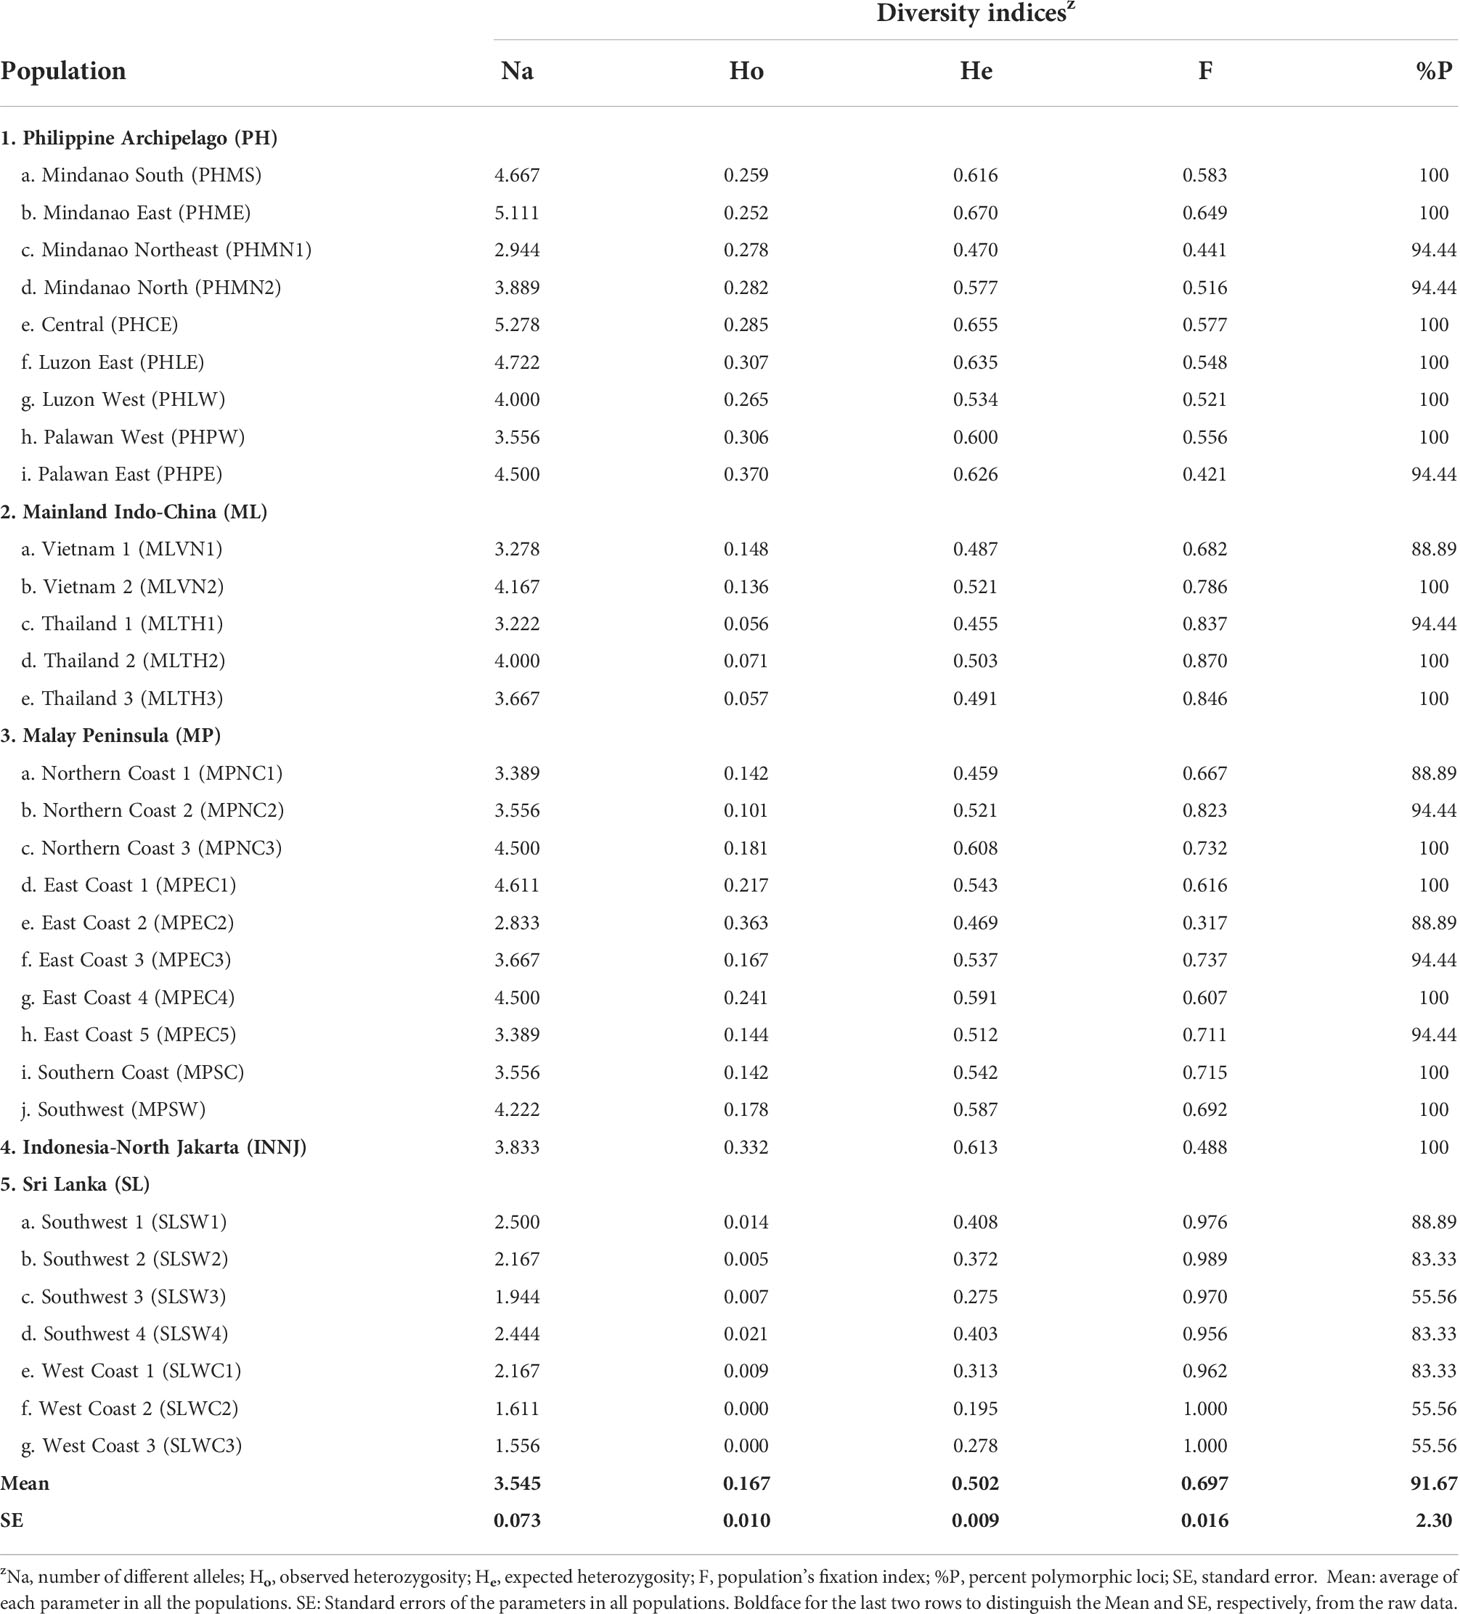
Table 2 Genetic diversity indices of 32 nipa populations in the Indo-West Pacific using 18 SSR loci.
Genetic diversity of nipa populations in IWP was thus estimated by the following parameters using 18 SSRs: number of alleles (Na), observed (Ho) and expected (He) heterozygosity, and fixation index (F) (Table 2). We found that the populations in the Philippine Archipelago are the most genetically diverse with the highest Na particularly the central (5.278) and Mindanao East (5.111). Other populations with Na ≥ 4.500 can also be found in the Philippine Archipelago including Luzon East, Palawan East, and Mindanao South, and in the Malay Peninsula including Ko Yo, Mersing, and Terengganu North. Half of the populations in Sri Lanka had the lowest number of alleles between 1.556 and 2.500. In general, populations with a higher number of alleles show a higher percentage of polymorphic loci as well.
Lower observed heterozygosity than the expected heterozygosity was identified in all populations with mean Ho and He at 0.167 and 0.502, respectively (Table 2). This suggests that the populations are highly structured and differentiated across IWP and even within local populations. The mean fixation index (F) of all the local populations is 0.697, which indicates high differentiation of populations as well. Extremely high F indices were observed in the populations in Sri Lanka (0.97 to 1.0), possibly due to limited genetic connectivity with other geographic regions, which resulted in genetically isolated groups. Based on the above evidence, we may conclude that the populations in IWP are genetically diverged without frequent interbreeding between populations.
We further analyzed the genetic variations within and across populations by performing the analysis of molecular variance (AMOVA). The results showed that more than half (53.5%) of genetic variations were contributed by the variations between individuals within populations, while 22.1% and 24.4% of variations are among populations and within individuals, respectively (Table 3).
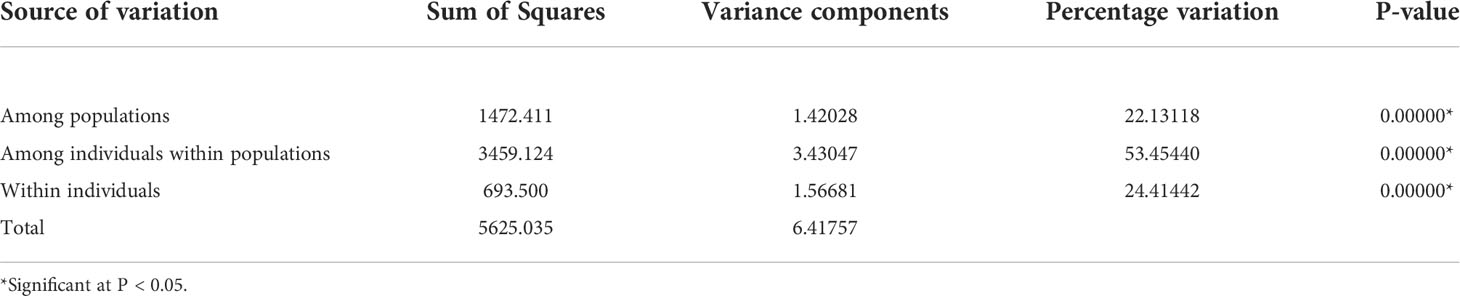
Table 3 Analysis of molecular variance (AMOVA) of nipa populations across the Indo-West Pacific using 18 SSR loci.
This genetic pattern was also reflected by F-statistics across all loci, which are the indices of population differentiation. The fixation indices serve as an expansion to describe population structure at different levels: inbreeding coefficient of individuals within subpopulation (FIS), inbreeding among subpopulation within the total population (FST), and overall inbreeding coefficient (FIT). The results show very high overall inbreeding coefficient with that of within population (FIT = 0.7559 and FIS = 0.6865), while lower inbreeding coefficient was detected between populations (FST = 0.2213) relative to other indices. This result confirmed much lower observed heterozygosity in all the populations mentioned above. Taken together, the results of AMOVA and F indices indicate that the excess of homozygosity shapes the populations in IWP.
The BayeScan results detected balancing selection signatures for most of these SSR loci as determined by a negative alpha value and a Q-value greater than 0.05. Eleven out of 18 were balancing loci, and 7 were considered neutral (Table S2). If critical level was set for Q-value = 0.05, then Nfr58, Nfr60, and Nfr69 had significantly strong balancing selection for local adaptation. Generally, population differentiation under balancing selection will be weaker than neutral loci as observed in self-incompatible plants (Fijarczyk and Babik, 2015). These loci obtained the lowest FST values (0.23093, 0.20837, and 0.18678, respectively) compared to neutral loci (0.335–0.362) (Table S2), which supported the balancing signal. Neutral loci include Nfr14, Nfr17, Nfr22, Nfr27, Nfr30, Nfr40, and Nfr56. There were no outliers for diversifying loci as an indication of positive selection. Among the signatures of balancing selection enumerated by Fijarczyk and Babik (2015) as temporal and may have significance for the sets of loci in this study include increased LD and differentiation among populations. We cannot rule out the so-called selective sweep as responsible for recent increases in homozygosity detected due to balancing selection signature.
The analysis of MLG showed that populations in Southeast Asia (ML and MP) were more genotypically diverse than those of Sri Lanka (Table S3). We observed higher MLG than expected (eMLG) in most of the populations in the Philippine Archipelago, Mainland Indo-China, and the Malay Peninsula. Almost equal number of MLG and eMLG were found in Indonesia and Sri Lanka. The result suggests a lower genetic diversity in the populations of Sri Lanka, which might be caused by several factors.
We further tested whether the populations were under LD [estimated by the values of rbarD (r̄d) in Table S3], which likely resulted from nonrandom mating (clonal reproduction) or genetic drift. Together with the index of association (IA), we can tell whether the clonal reproduction is the possible factor causing populations away from Hardy–Weinberg equilibrium. Among all the populations, only three of those showed evidence of Hardy–Weinberg equilibrium for the loci tested (p.rD > 0.05, Table S3). They are Mindanao-Northeast (PHMN1), Palawan East (PHPE), and Negombo (SLWC1) populations, two in the Philippine Archipelago and one in Sri Lanka. In addition, the three populations showed equal number of MLG with eMLG, indicating that they might be panmictic populations and putative centers of origin (Grünwald et al., 2017). Furthermore, nipa has clearly sexual populations since observed MLG counts are mostly equal to respective sample sizes (N) (Table S3). Clonal populations have greater N than MLGs because of duplicates (Kamvar et al., 2014).
The effect of isolation-by-distance (IBD, Mantel test) was statistically significantly detected (p < 0.001 in n = 1,000) with a positive correlation (r = 0.4199), which indicates a higher genetic divergence between two individuals when they are farther apart. A Mantel correlogram was generated to further analyze the relationship between genetic divergence and geographic distance (Figure 1 and Table S4). It shows the relationship between genetic divergence (represented by correlation, r) and geographic distances across geographic regions. We conducted Mantel correlogram tests. As an extension of the Mantel test, a correlogram can show the relationship between G and D matrices across geographic regions (Diniz-Filho et al., 2013).
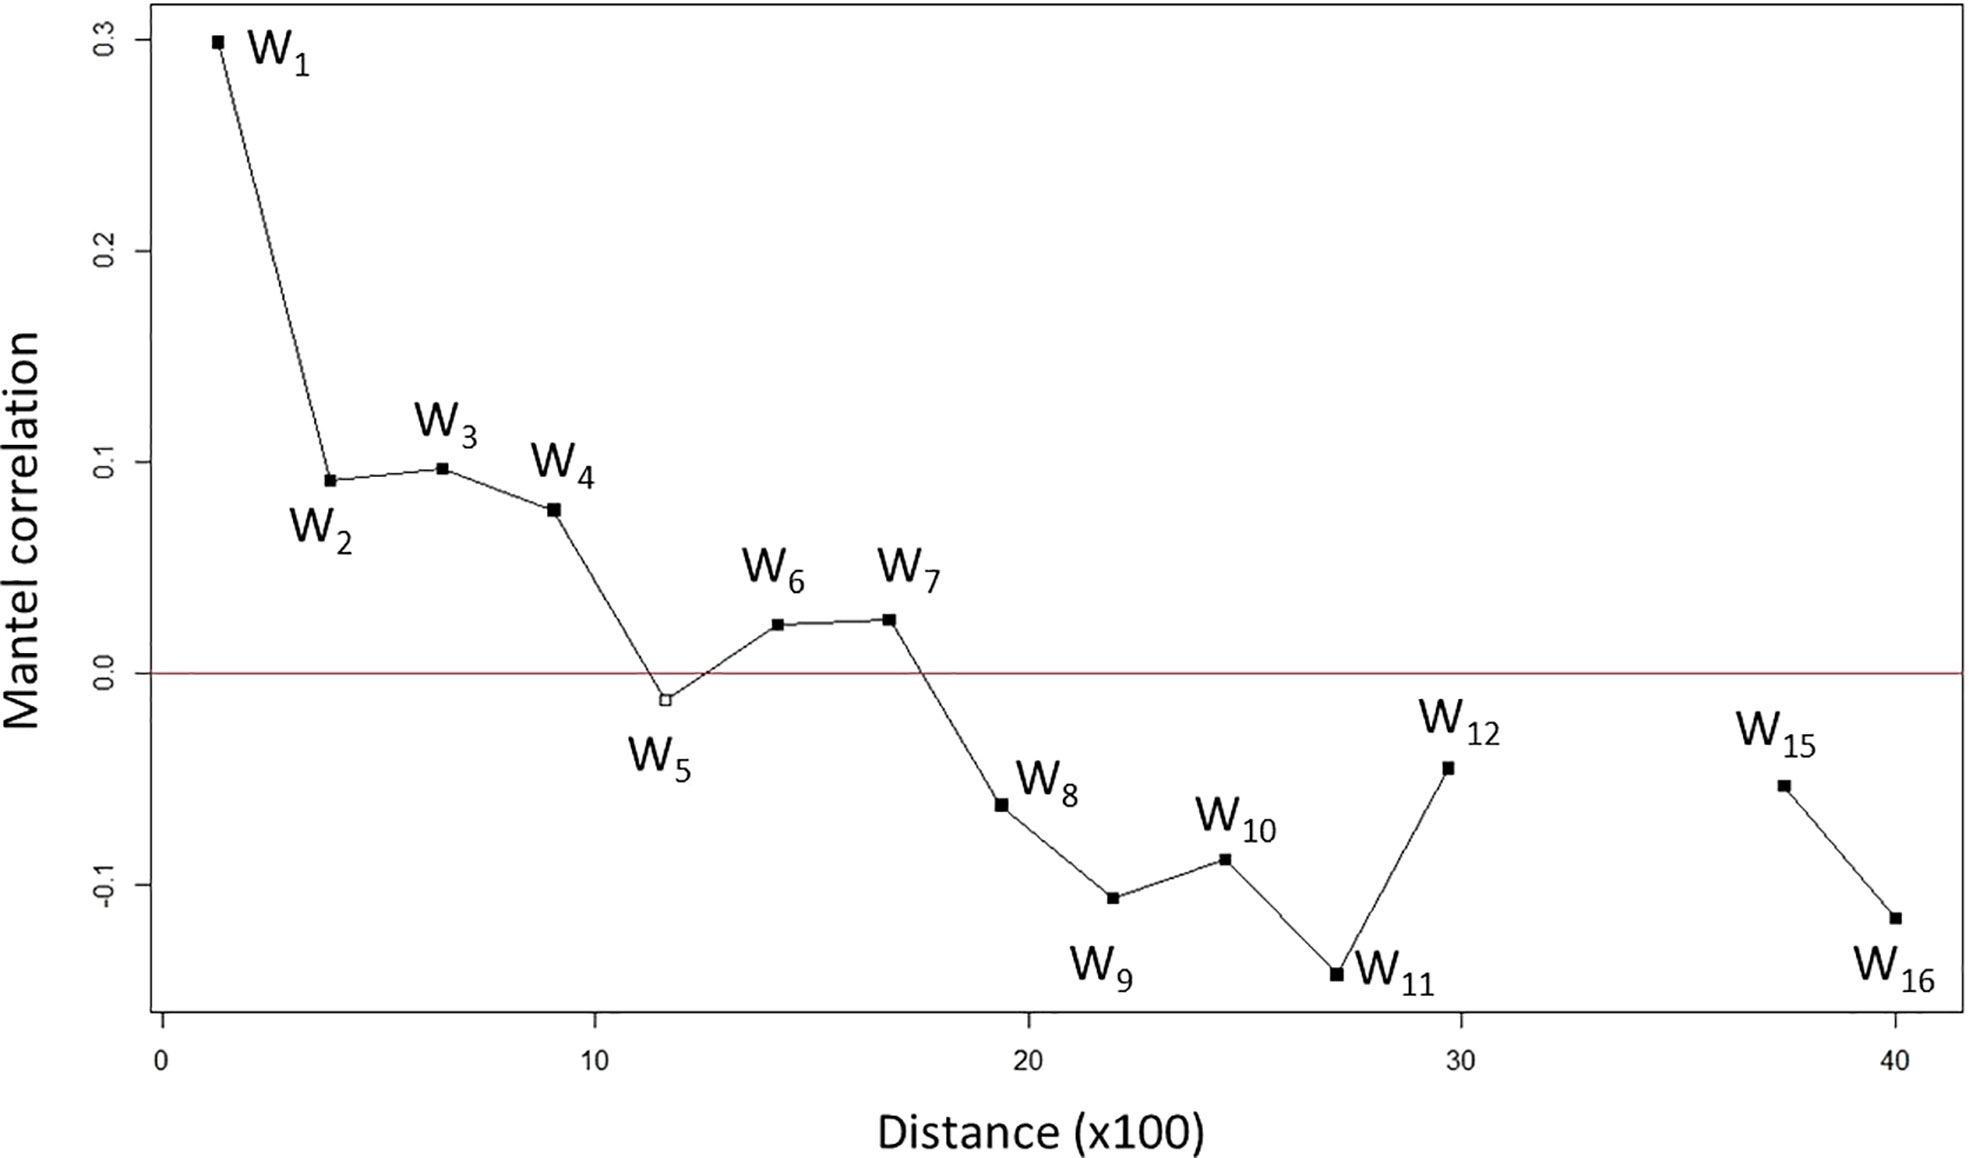
Figure 1 Genetic divergence increased (correlation decreased) along with the geographic distances of nipa populations across IWP. The plot is generated by a Mantel correlogram indicating distance (×100) in kilometers. For example, 10 means 1,000 km apart. Black solid squares show significant correlation while a white empty square shows no significance in correlation value. Each distance class is labeled as Wk (k = 1 to 16 with 13–14 no correlation).
We observed a decreasing correlation from the first to the fifth class, W1–W5 (about 1,000 km distance), where the correlation of W5 turned negative (Figure 1). This implies that a pair of samples has no genetic correlation when they are about 1,000 km apart. At W8 (about 2,000 km apart), a pair of samples was differentiated with significant negative correlation. Although an increase in correlation was observed in W12 (about 3,000 km apart), it is still negative. In fact, it was abruptly terminated beyond that point. There were no observations between W13 and W14 (within a 1,000-km range), indicating no spatial correlation. Taken together, the Mantel correlogram spatial analysis suggests a significant genetic divergence of individuals when they are more than 1,000 km apart geographically. This supports our previous observations, i.e., IBD and structured populations with geographical patches of nipa in IWP.
The distribution of the 445 nipa samples across 32 locations in IWP appeared to group into two clusters based on PCoA (Figure 2A). The major group includes the populations of mainland Southeast Asia and Indonesia, while the minor group includes populations of Sri Lanka. The multivariate DAPC, an alternative method to analyze genetic pattern, also showed similar clustering of samples (Figure 2B). Two major clusters from Southeast Asia were grouped in one cluster (cluster 1), while those from Sri Lanka were in a distinct separate cluster (cluster 2). Interestingly, we identified two individuals grouped with Sri Lanka from the Malay Peninsula (MPNC3 and MPSW), which were likely effective migrants or hybrids between the two regions.
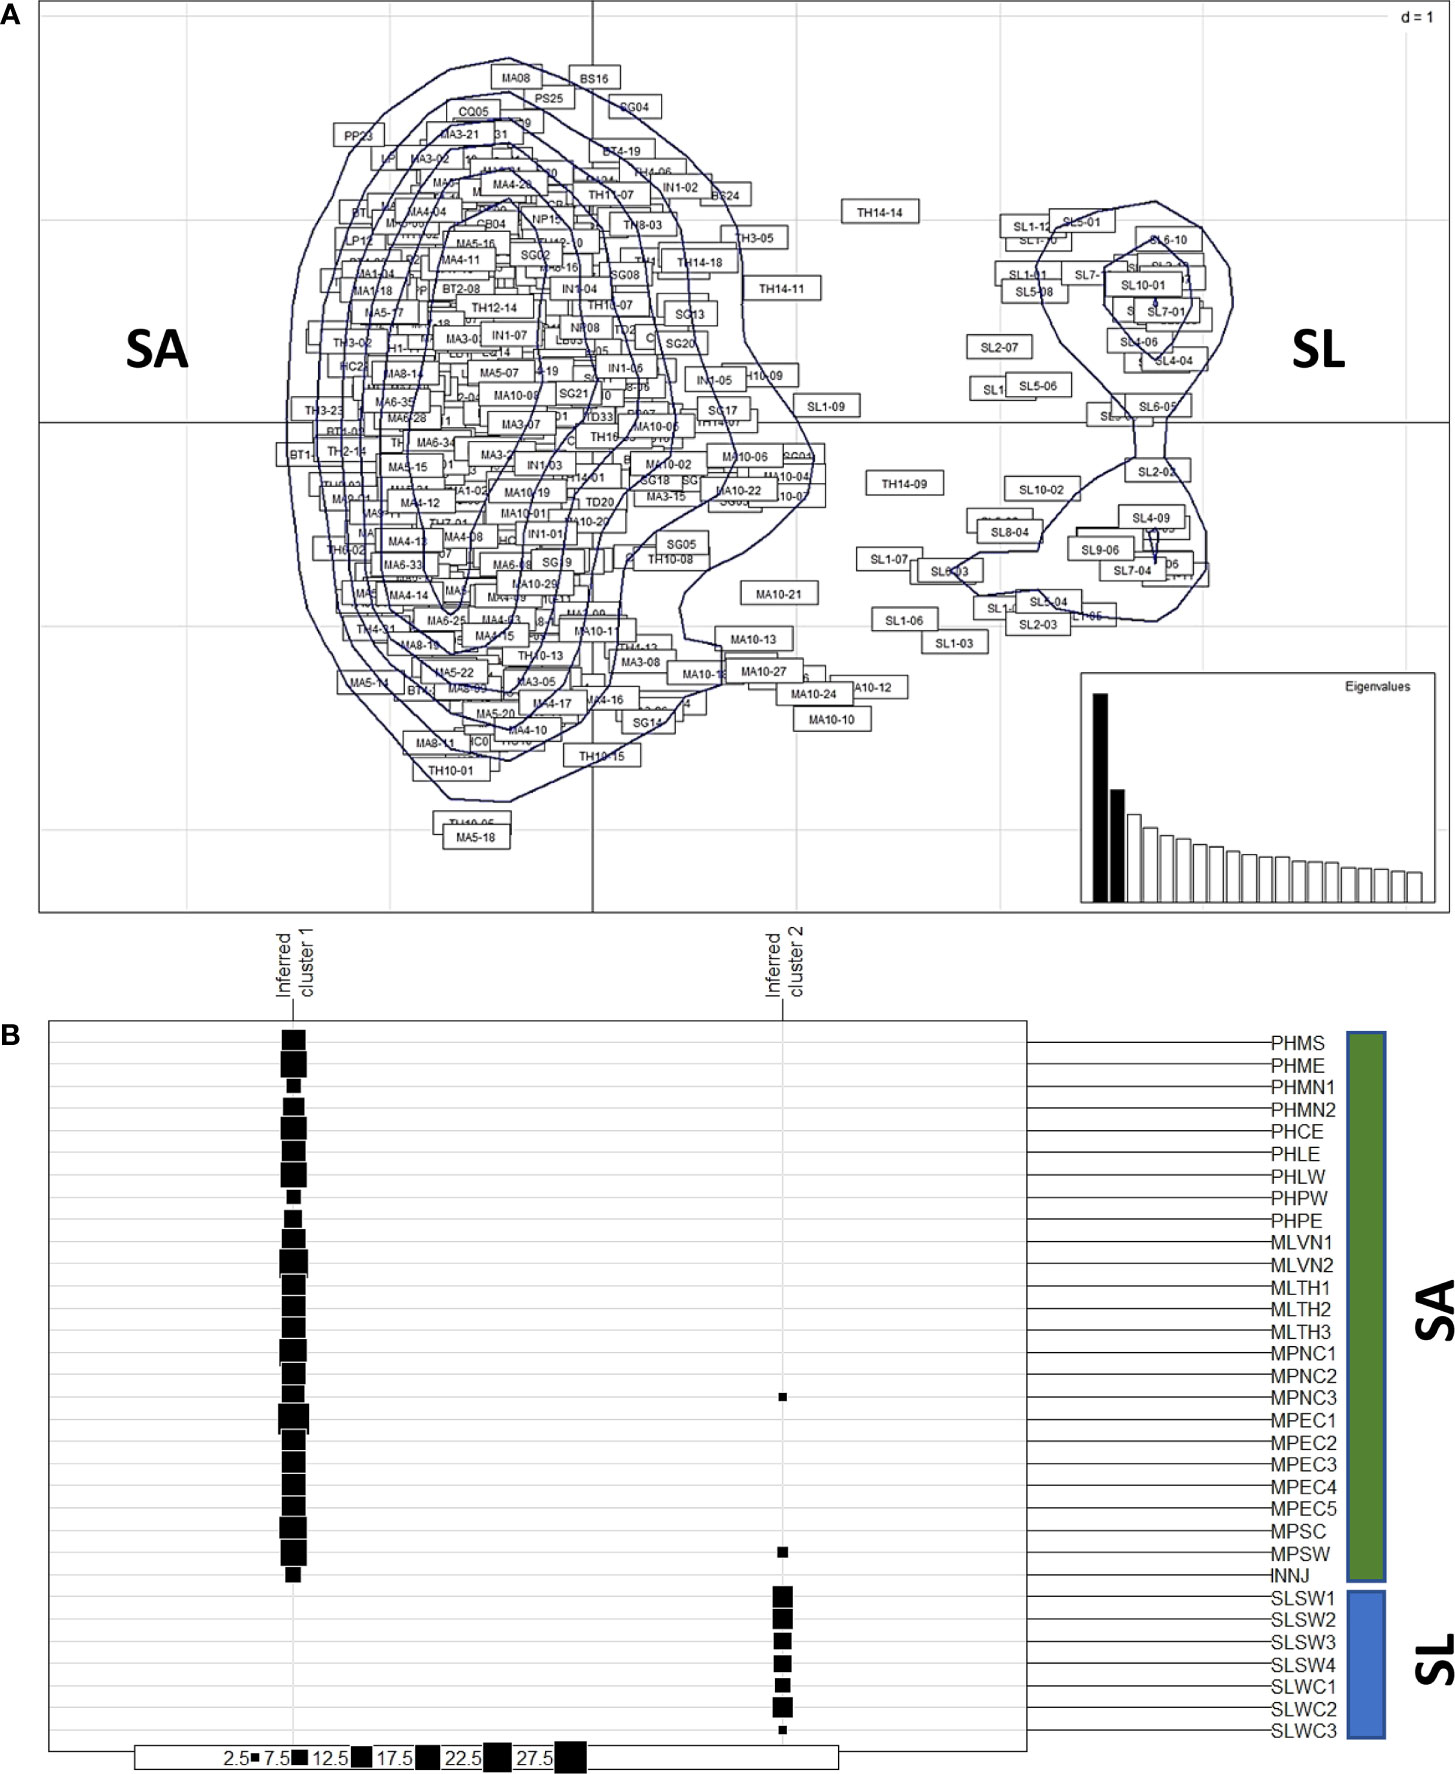
Figure 2 Clustering of populations from Southeast Asia (SA) and from Sri Lanka (SL). (A) The principal coordinates analysis (PCoA) of nipa samples from 32 populations in IWP showing the kernel density estimate of individuals, which can be clustered into two major groups: one larger group includes samples from SA and one smaller cluster includes samples from SL. (B) Discriminant analysis of principal components (DAPC) suggests two clusters (K = 2) of nipa populations in IWP according to inferred clusters. The group size of each location is indicated by solid boxes (from 2.5 to 27.5). The symbols of locations are according to Table 1.
Although principal component analysis (PCA) has been used as a common multivariate approach in population genetics, it does not explicitly account for spatial genetic patterns (Montano and Jombart, 2017). A novel approach, sPCA, determining the spatial structure as measured by Moran’s index and eigenvalue, was conducted to further examine the genetic patterns of nipa populations. The positive values of Moran’s index indicate the high similarities of allele frequencies in the neighboring regions and may indicate globally structured populations in distant regions. In contrast, the negative values indicate genetic divergence and locally structured populations.
Overall, a strong spatial connectivity was detected among populations in mainland Southeast Asia (Figure 3A). This connectivity is represented by a colored background based on the lagged scores of populations across landscape (Figure 3B). A strong connectivity network was observed around the South China Sea (SCS) based on a dark red background. Falling outside the red edges on yellow orange and orange background were the populations from the Southern Coast of the Malay Peninsula (MPSC) and the Southwest Coast of the Malay Peninsula (MPSW), along the Malacca Strait, and further south, Indonesia. This indicates that they were less associated with the rest of the populations around SCS with some degree of genetic divergence. The populations of Sri Lanka were distinctly separated from mainland Southeast Asia, plotted along the leftmost edge of the polygon, and are in shades of blue (Figure 3B).
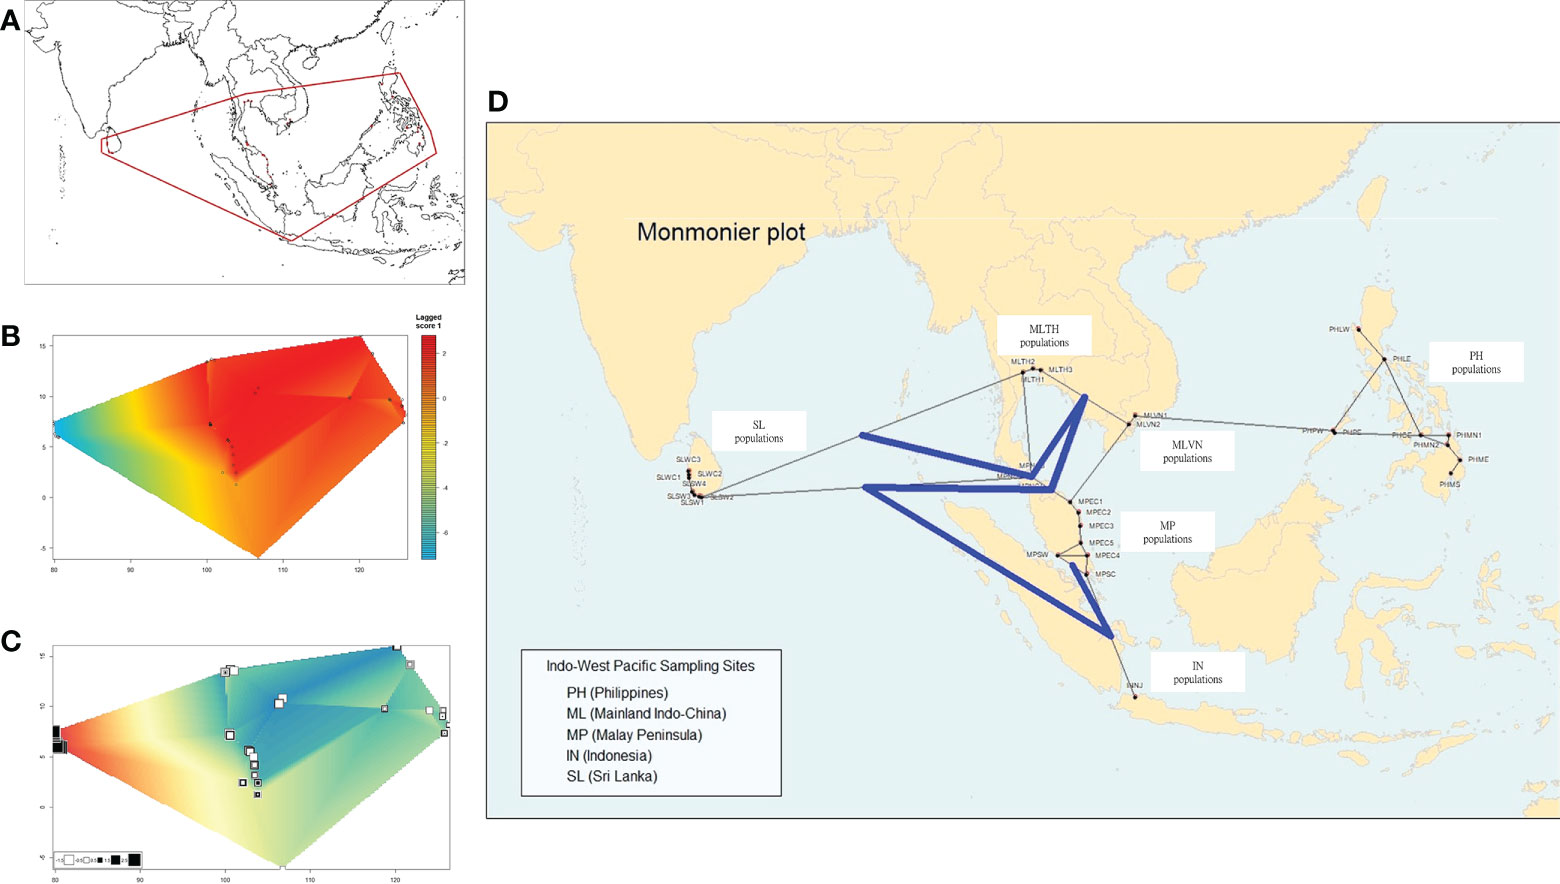
Figure 3 Spatial correlations and genetic differentiation of nipa populations based on the sPCA method. (A) Distribution of sampling locations, which serves as the range used in the following spatial analysis in B–D. (B) Overall genetic divergence and spatial connectivity of populations. The color bars on the right indicate the degree of population structure: the dark red means the populations are globally structured while the blue indicates no similarity between two individuals (extremely locally structured). (C) The first axis (PC) of the sPCA plot. (D) The Monmonier plot of genetic boundaries (solid blue line) shows that the Malay Peninsula is a genetic barrier among the connection network of nipa populations in IWP.
The first PC clearly shows the distinctions between the west (Sri Lanka) and the rest of the other populations (Southeast Asia group) on shades of green background (Figure 3C). The values, as represented in squares, indicate that the populations in Southeast Asia had subtle genetic divergence and likely a clue of a possible population differentiation. Moreover, Monmonier’s maximum difference algorithm was implemented to evaluate a genetic barrier (Figure 3D). It identifies boundaries in the areas where differences between a pair of populations are the greatest (Manni et al., 2004). The result showed that the Malay Peninsula is a genetic barrier as indicated by a solid blue line. It is worth mentioning that there were some individuals from the Malay Peninsula (MPNC3 and MPSW) grouped with the individuals from Sri Lanka based on DAPC (Figure 2B). These individuals might likely be effective migrants or hybrids between the two clusters. However, the hybridization between the two clusters was not detected further as the potential genetic barrier of the Malay Peninsula.
A more detailed genetic divergence can be analyzed using the package Geneland under the spatial model. The results show that the best clustering (K) was obtained in four genetic clusters (Figure 4A). The populations of the Philippine Archipelago belong to one group (dark green), while those in mainland Southeast Asia and part of the Malay Peninsula were grouped together (white). The populations from Negeri Sembilan (MPSW), the only west coast population in the Malay Peninsula, Singapore (MPSC), and Indonesia (INNJ), belonged to the same group (light green). Lastly, Sri Lankan populations were distinctly separated from the other genetic clusters (orange).
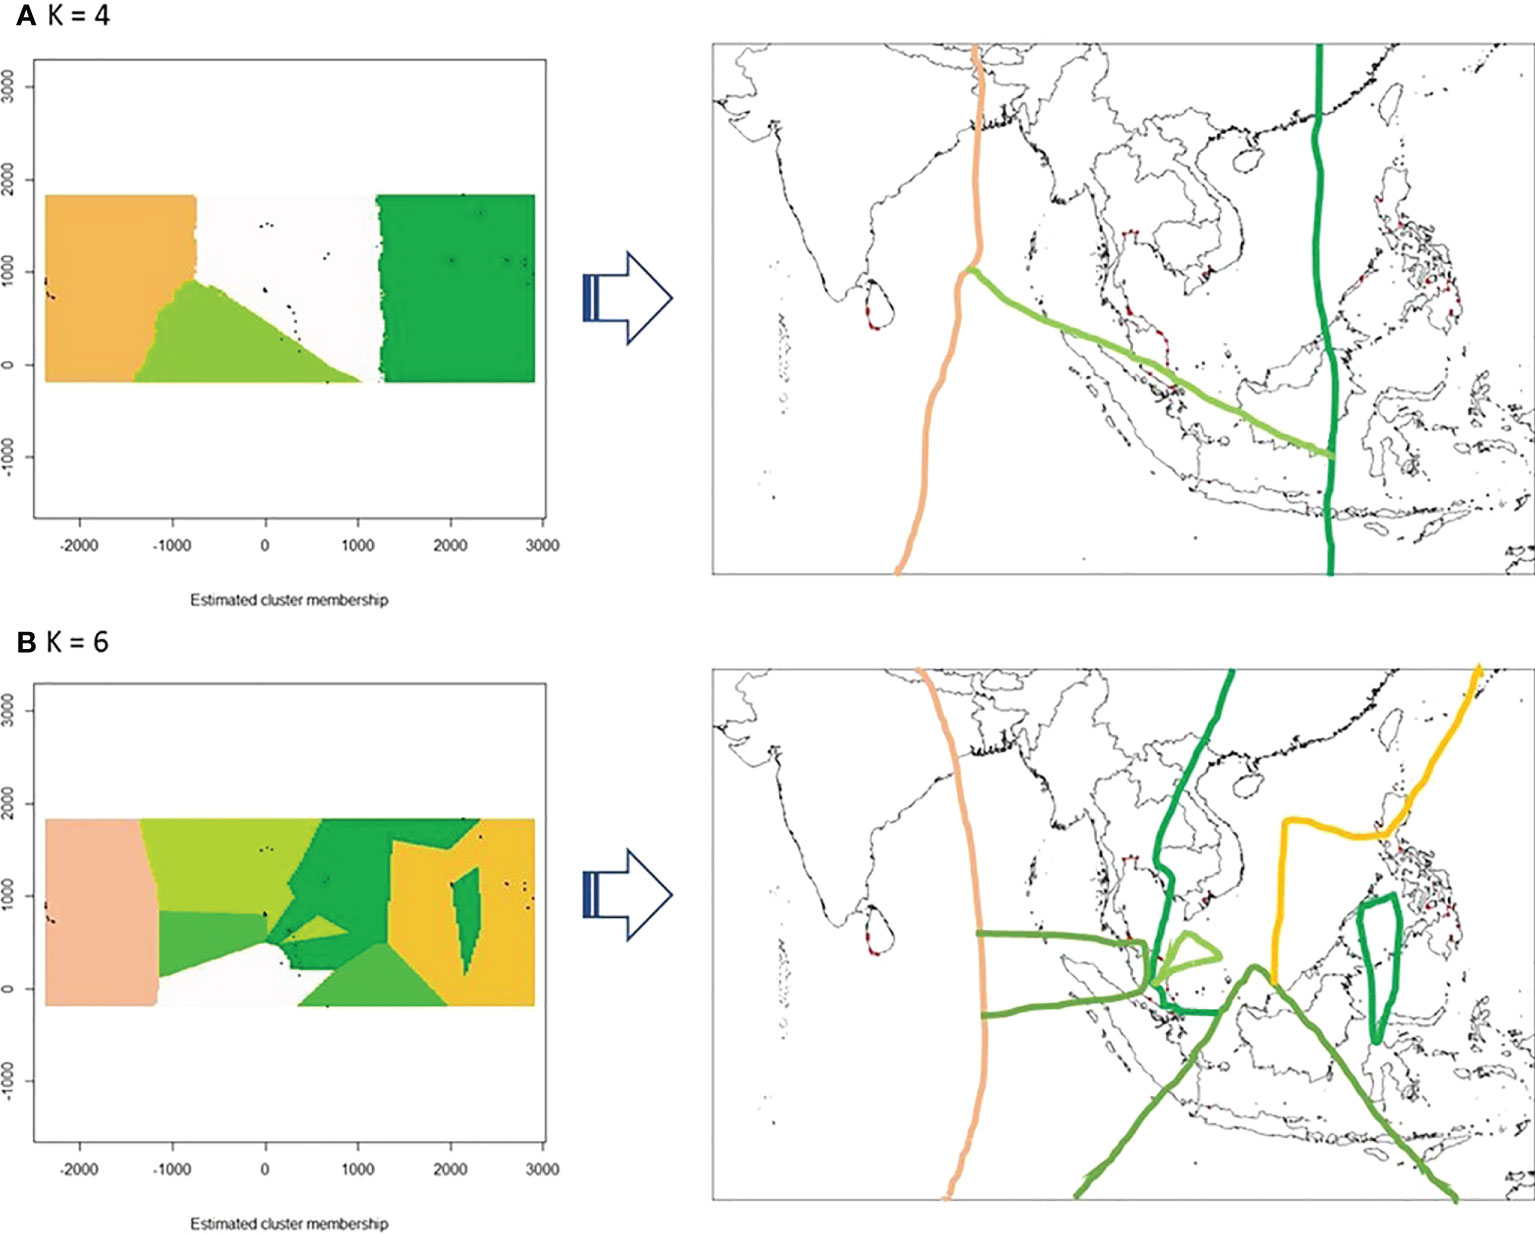
Figure 4 Population differentiations of nipa analyzed using the Geneland package (A) The spatial model (K = 4) and (B) nonspatial model (K = 6) for nipa populations in the Indo-West Pacific showing genetic discontinuities as interpreted geographically (arrow).
Under the nonspatial model, the best K was outright at 6 without the necessary convergence of MCMC iterations (Figure 4B). Some populations such as Luzon West (PHLW) and Palawan East (PHPE) in the Philippine Archipelago clustered with mainland Southeast Asia. Although the populations in Southeast Asia are more structured under this model, the populations in Sri Lanka remained genetically distinct.
Using the Evanno method in STRUCTURE, the best genetic clustering of all populations is 2 (K = 2): populations in Sri Lanka were distinctly separated from Southeast Asia (Figures 5A, B). When three clustering groups were set (K = 3), differentiations between populations in the Philippine Archipelago and mainland Southeast Asia were observed (red color in Figures 5C, D). We found that the populations in mainland Southeast Asia and the Philippine Archipelago can both further be grouped into several subclusters: the Philippine Archipelago, Mainland Indo-China (Vietnam and Thailand), the southern Malay Peninsula, and Sri Lanka (Figures 5E, F). In particular, the populations in mainland Southeast Asia showed differentiations to a certain degree under this clustering condition.
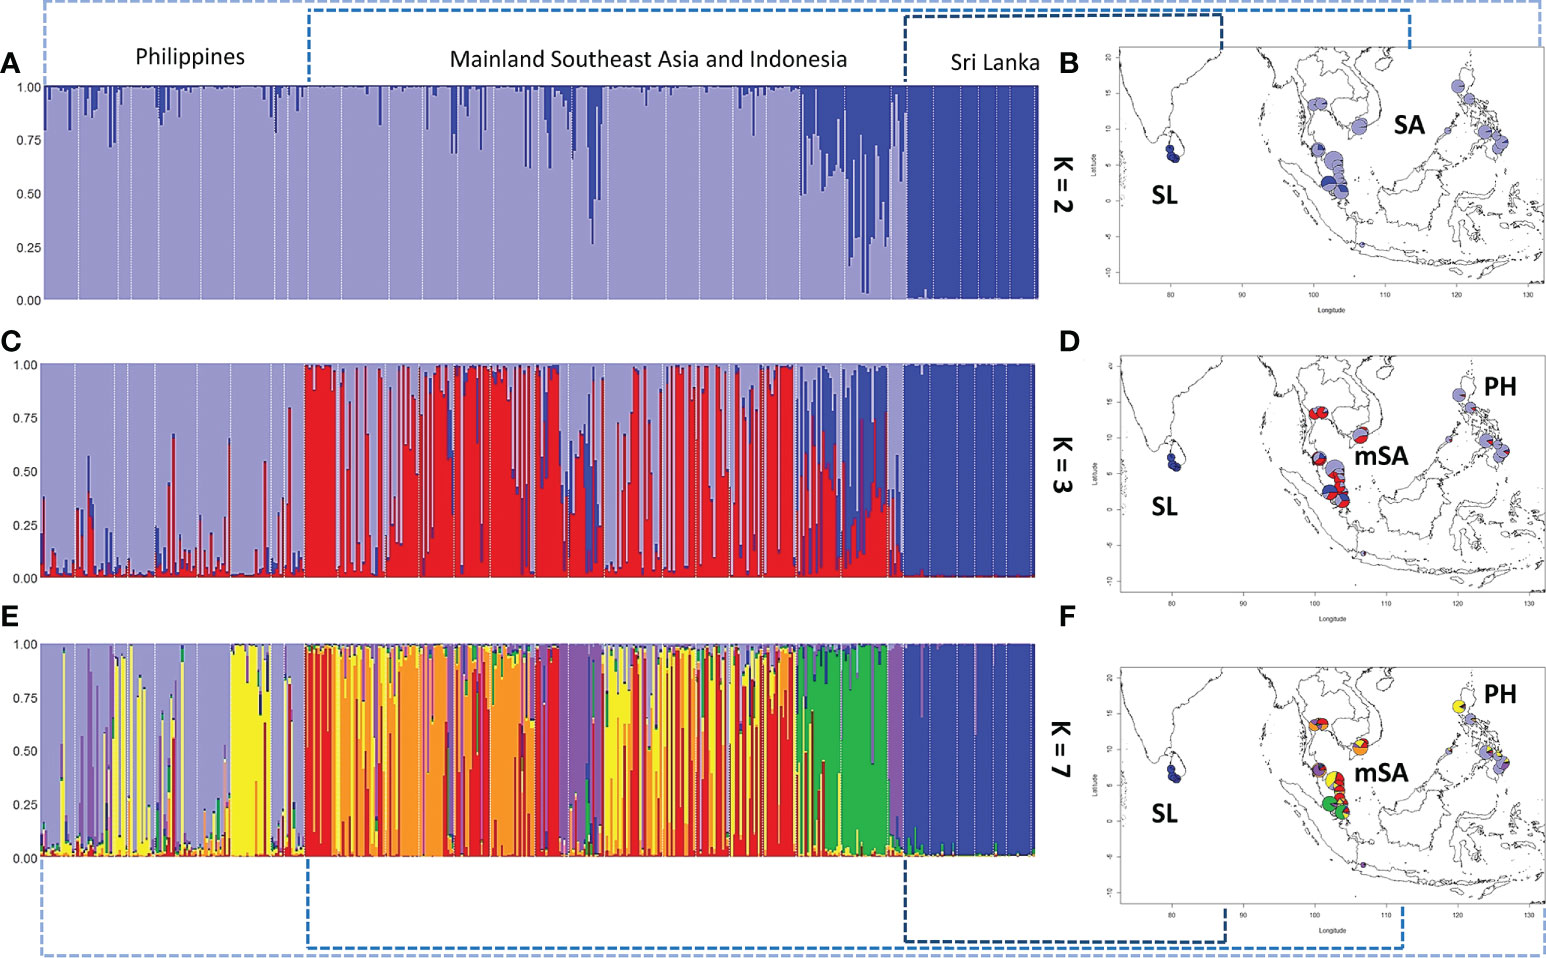
Figure 5 The population differentiation and genetic clustering using the Evanno method in STRUCTURE. Samples from different populations can be clustered into two, three, or seven groups. (A, B) Samples are clustered into two groups: SL represents Sri Lanka and SA represents Southeast Asia. (C, D) Samples are clustered into three groups. Under this condition, populations in SA show differentiation between mainland SA (mSA) and the Philippines (PH). (E, F) When seven groups were set, more detailed differentiations can be identified within mSA and PH.
Taken together, we conclude the two tiers of genetic differentiations: (1) all the analyses show the solid evidence of isolated and differentiated populations in Sri Lanka compared to other populations in Southeast Asia; (2) populations in the Philippine Archipelago are differentiated from those in mainland Southeast Asia.
We further investigated whether the connectivity of the populations between Sri Lanka and Southeast Asia exists despite the fact that they are geographically isolated without active breeding. The ancestry coefficient analysis showed that the genealogical lineages of nipa populations can be categorized into two clusters, i.e., Sri Lanka and Southeast Asia for K = 2 (Figure 6A). Populations in Southeast Asia can be further subdivided into mainland Southeast Asia and the Philippine Archipelago where Indonesia (INNJ) shared ancestry when K = 3. The island of Sumatra was projected to share similar ancestry with Sri Lanka (light orange in Figure 6B). Take one step further to set K = 7, we observed that the genetic divergence of populations from Luzon West (PHLW, blue in Figure 6C) and Vietnam 1 (MLVN1, orange in Figure 6C) shared putative ancestry with the populations in the southeastern coast of the Malay Peninsula (Figure 6C). Taken together, we proposed that migrations have happened in the following two trends: (1) between populations of Sri Lanka and Southeast Asia, particularly the island of Sumatra, and (2) between populations of the Malay Peninsula, mainland Southeast Asia, and the Philippine Archipelago. This also in line with evidence that the Malay Peninsula is the genetic barrier of nipa populations in IWP as mentioned above.
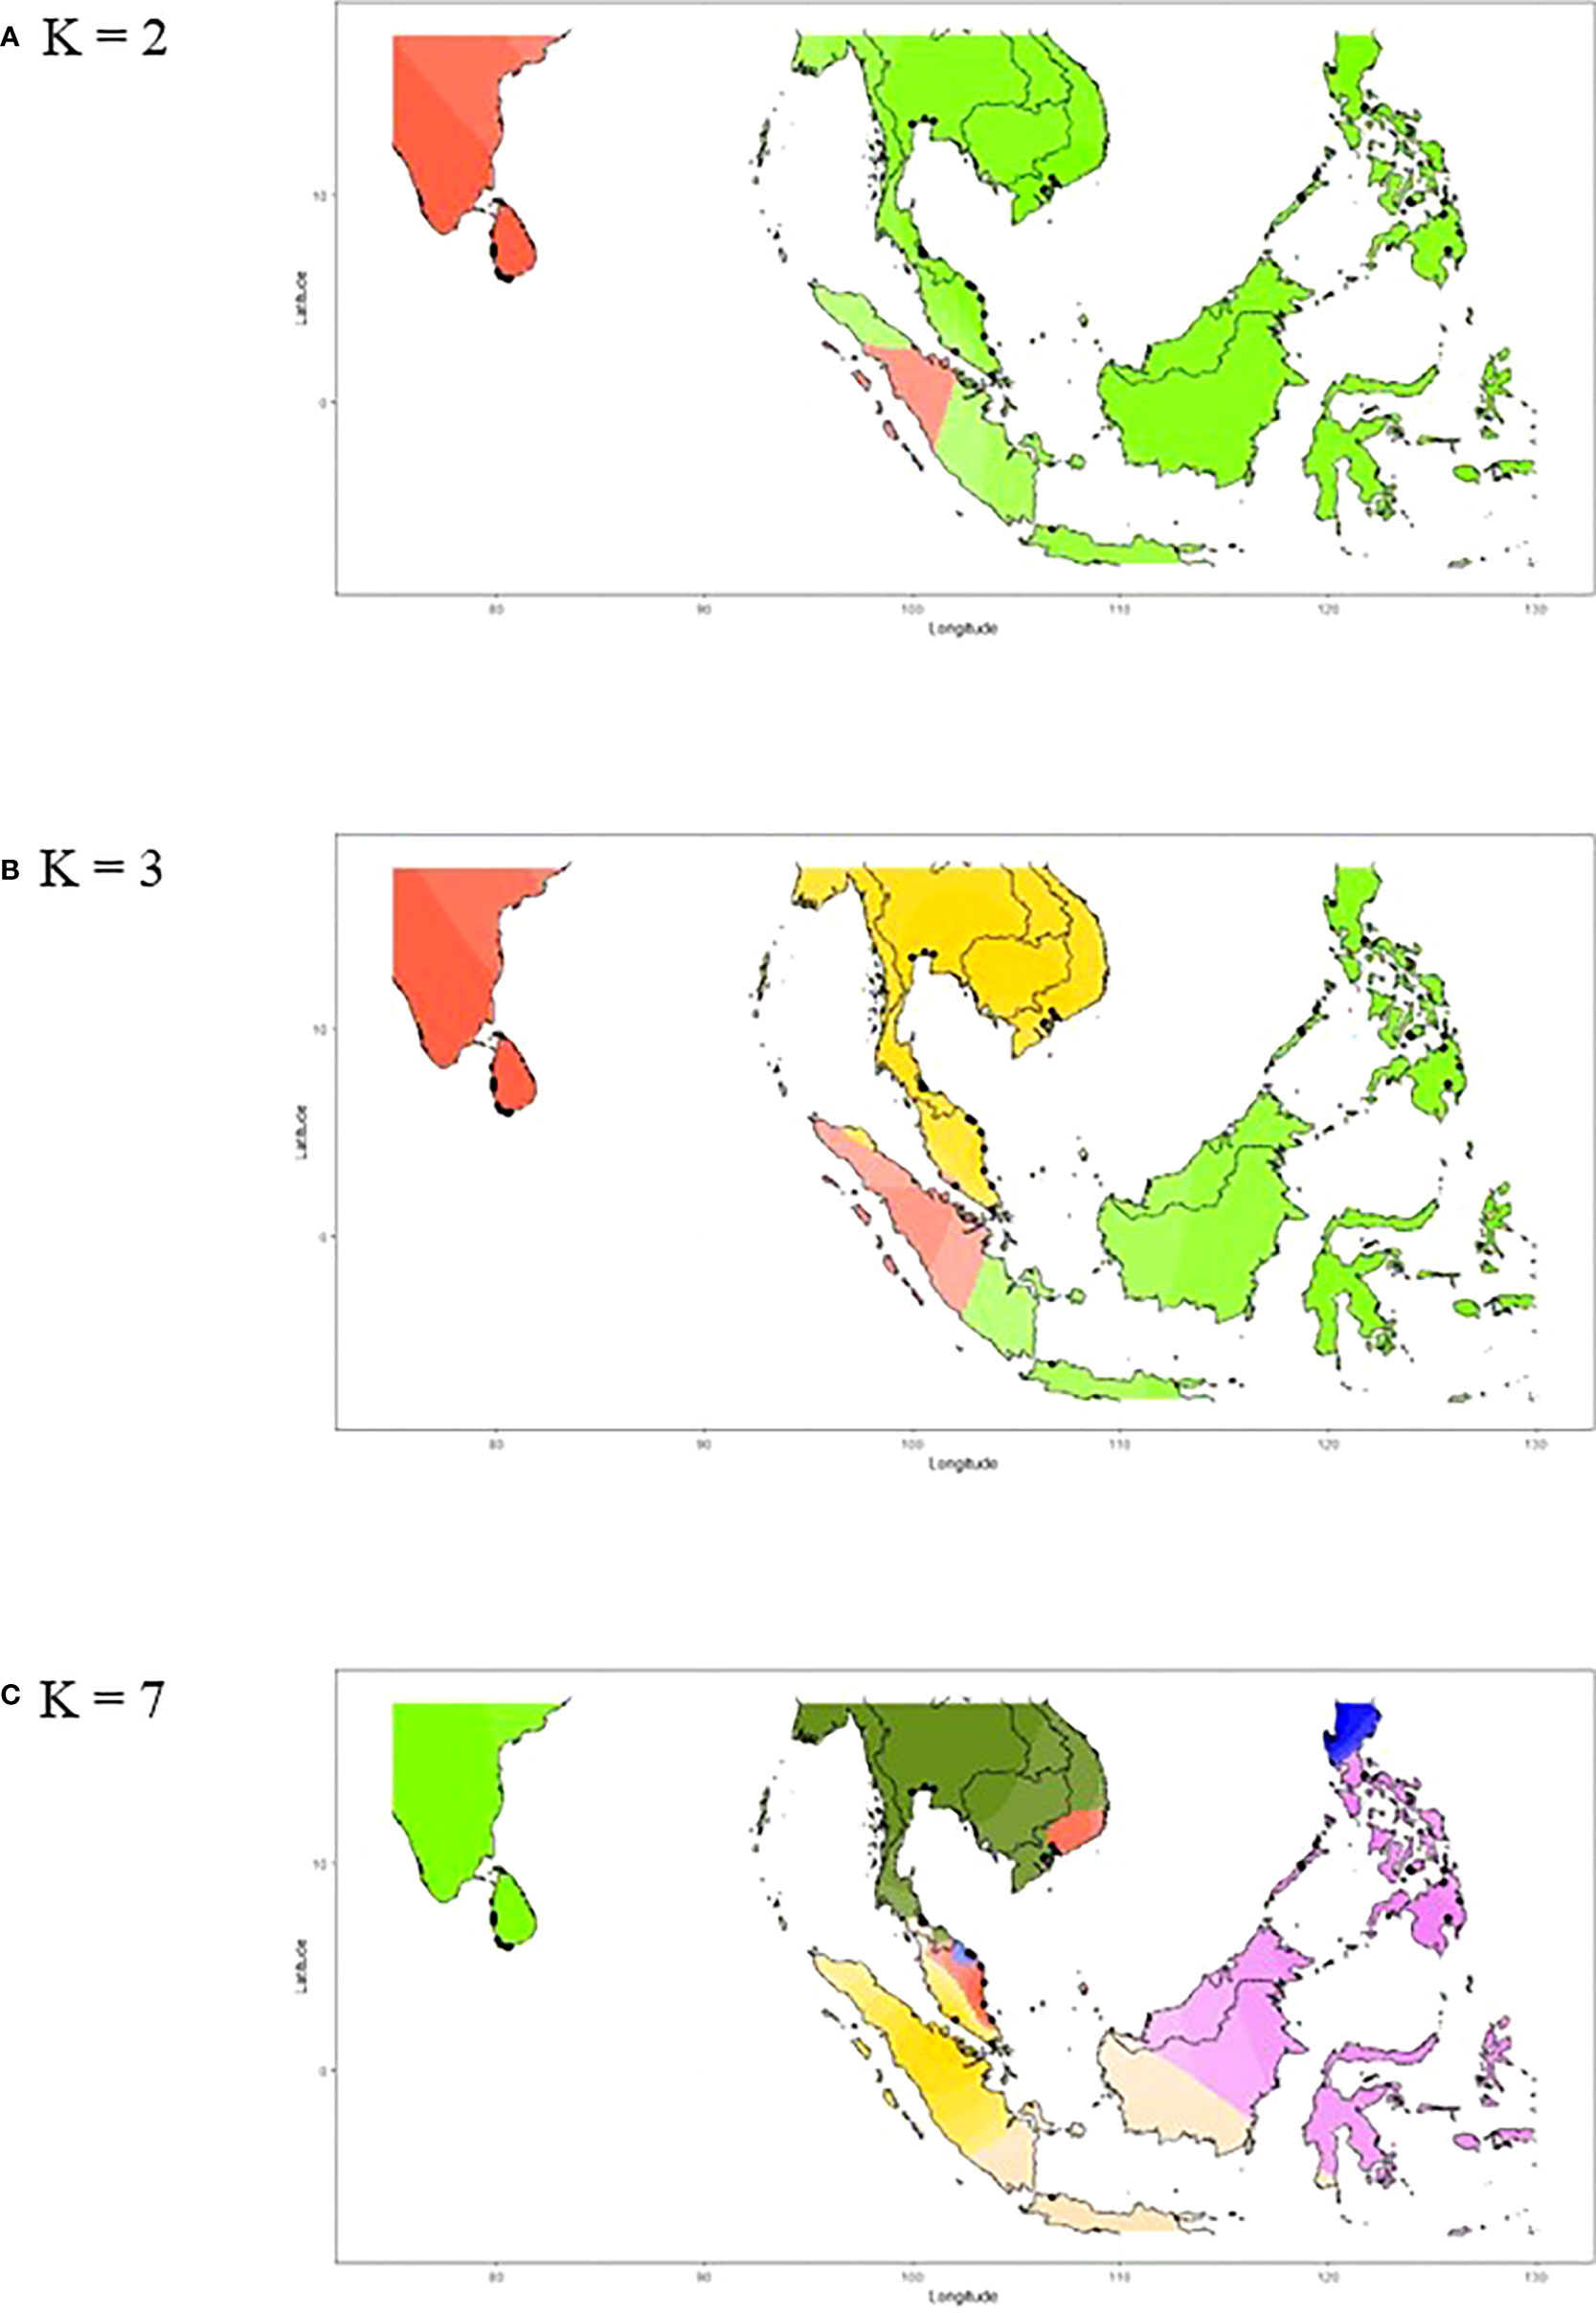
Figure 6 The ancestry coefficients of nipa individuals across the Indo-West Pacific. (A) K = 2, (B) K = 3, and (C) K = 7 based on the individual Q-matrix of STRUCTURE as interpolated by R using tess3r.
The founder effect is expected if the individuals migrated from mother populations, such as Southeast Asia, to a new niche further away. Therefore, the reduction of genetic diversity of new founders compared to the mother population due to genetic drift is expected. Based on the graphical descriptor, Sri Lankan populations were all “mode-shifted”, meaning these stands experienced bottleneck recently or sometime in the past (Table 5). Except for Balapitiya (SLSW1), all southern populations were detected significant for the one-tailed Wilcoxon’s test for heterozygosity excess indicating recent bottlenecks. For the west coast populations, only Puttalam (SLWC3), being depauperate, was tested to experience it recently. The so-called mode-shifted populations not significant to all Wilcoxon’s tests might have been bottlenecked in the distant past, likely a consequence of the founder effect.
To graphically evaluate the genetic clusters of nipa populations in the region, a phylogenetic tree was reconstructed by the neighbor-joining (NJ) method. The result again indicated the genetic distinctiveness of populations from Sri Lanka, which was further clustered with a population from the Malay Peninsula, MPSW. It is in line with the finding from DAPC (Figure 2B) where some individuals from MPNC3 and MPSW in the Malay Peninsula were clustered with Sri Lankan populations. This further confirms the genetic connectivity between Southeast Asia and Sri Lanka in certain populations. The tree is represented by the unrooted phylogram as shown in Figure 7B. Notably, the order of the clustering was uncertain because of extremely low bootstrap support at the deeper nodes.
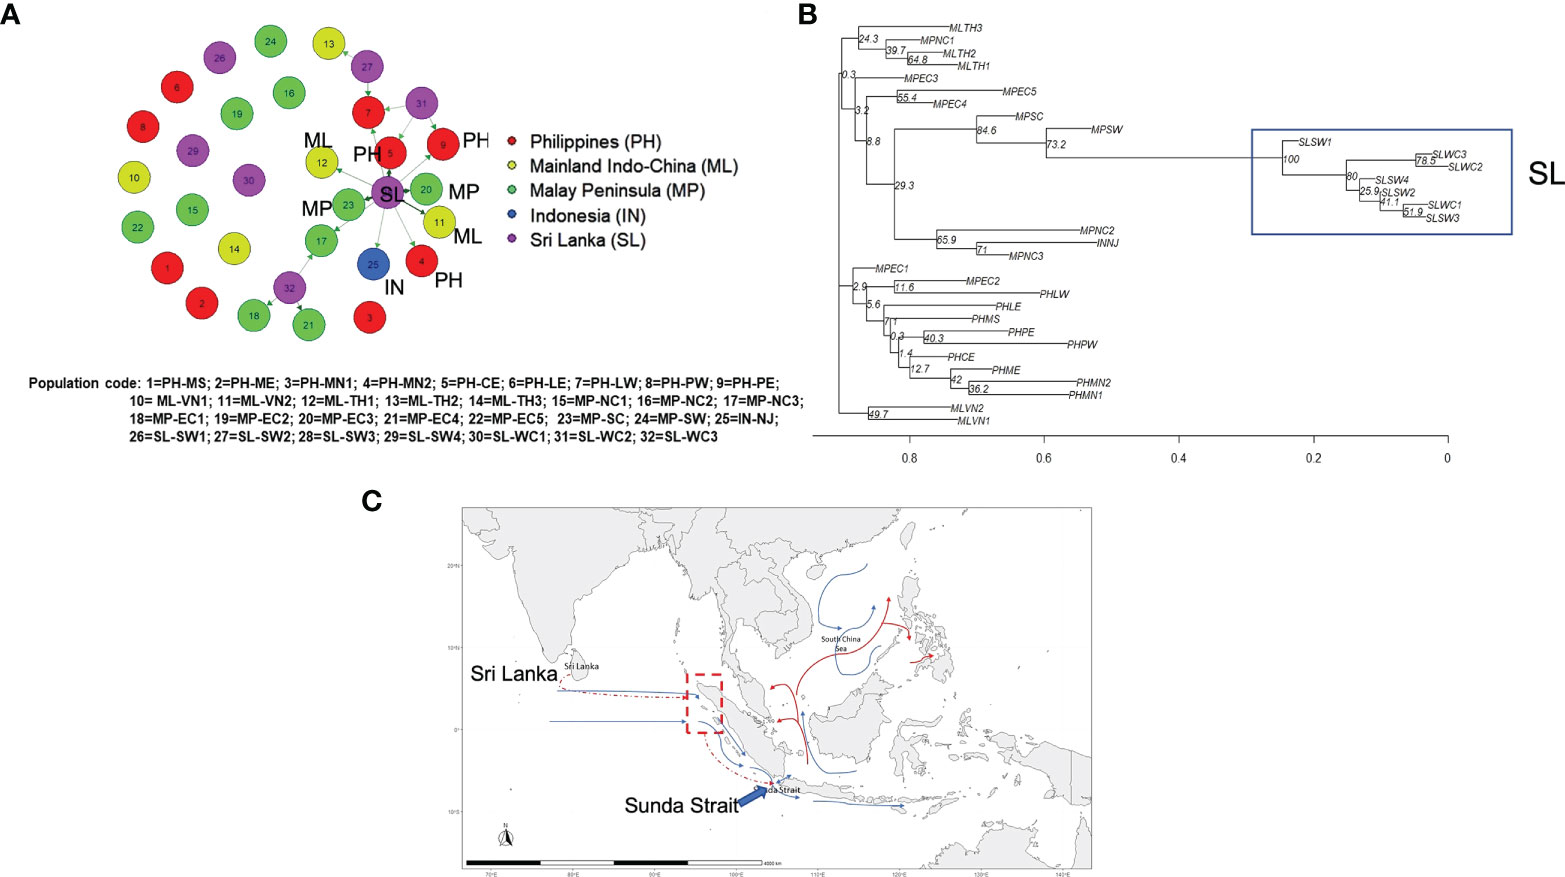
Figure 7 Migration and phylogeny of nipa populations in IWP. (A) The contemporary migration patterns of nipa populations in the Indo-West Pacific using the divMigrate function of diveRsity, an R statistical package, for the significant relative migration based on Nm using filter threshold at 0.12 for asymmetric values (bold and dark arrows have higher migration values than light colored arrows) (bootstrap = 1000). (B) Phylogenetic tree constructed with 18 microsatellite loci using the neighbor-joining (NJ) method (bootstrap = 1000). (C) The hypothesized migration pattern from Sri Lanka (dashed red arrow) via the hypothetical route to northwestern Sumatra nipa populations (red dashed line and dash-lined box) by long-distance dispersal to Southeast Asia through Sunda Strait as labeled accordingly. The blue arrow lines indicate the predominant surface current during the Southwest Monsoon (Schott and McCreary, 2001; Han et al., 2009; Wang and Li, 2009; Susanto et al., 2016) and the red arrows indicate the significantly strong patterns in migration network results.
Notwithstanding the lines of evidence of the founder events in Sri Lanka by oceanic circulations, there are indications of stronger genetic link eastward than westward, i.e., Matara (SLSW3) to the Southeast Asian populations based on the contemporary genetic diversity (Figure 7A and Table S5). We consider this pattern as recent migrations where interbreeding with local populations in Southeast Asia diminished their ancestral genetic lineage that resulted in low bootstrap support (Figure 7B). We, therefore, proposed the recent migration routes of nipa and hypothesized that their potential entry point from Sri Lanka to SCS might be the Sunda Strait (Figure 7C).
Nipa remains an understudied mangrove palm in spite of known economic and ecological benefits. It was considered as a potential bioenergy crop, but has no breeding program and agronomic practices in place. To fill in the gap of limited information on its population genetics, the evaluation of genetic diversity and structure was conducted in the IWP Region.
All populations in the region reflected a genetic pattern, suggesting some factors or biological processes acting on them. High discrepancies between observed heterozygosity (Ho) and expected heterozygosity (He), as supported by relatively high FST along with balancing selection signature, indicate an excess of homozygosity due to admixture. Test for linkage equilibrium using the standardized index of association (r̄d) was significant, indicating mostly non-panmictic populations resulting in LD. Also, lower expected multilocus genotype (eMLG) values compared to observed MLG were posited to be enforced by admixture. The mating pattern of nipa as outcrossing possibly resulted in this genetic pattern in the region from LD by migration. As a consequence, homozygosity was higher than expected with random mating. This is called the Wahlund’s principle (Hartl, 2020). This genetic pattern was observed across the local populations based on heterozygosity values, Ho and He, and F.
Genetic assignment of first-generation (F0) immigrants (Table S5) detected over half of them in mainland Southeast Asia, enriching these populations aside from genetic exchanges from nearby populations. These biological processes shaped the local populations to deviate from Hardy–Weinberg equilibrium that results in the population structure in the region. In addition, the Mantel test showed significance for IBD. The kernel density estimate indicates patches instead of an intact cloud, suggesting genetic discontinuity (figure not shown). A systematic change in allele frequency across a geographical gradient is called a cline (Hartl, 2020). These genetic differences are not merely affected by geographic cline, but by isolation. Apparently, there was a clear genetic differentiation between the west populations, i.e., Sri Lanka and Southeast Asia, due to limited genetic exchange, which unanimously attributed this population stratification in the region based on several tests.
Although genetic clines were also detected among the populations in Southeast Asia, the SCS remains a hotbed of genetic exchange among nipa populations. Those stands found along its coasts had stronger genetic exchanges where the southeast Malay Peninsula was thought to be a contact zone for admixture. As a melting pot, immigrants were shown to have their genetic ancestries coming from far-flung populations such as Sri Lanka, Indonesia, and the Philippines. Moreover, the spatial genetic pattern suggests that populations closer to each other consisted of individuals that are closely related too. Moreover, Singapore and Negeri Sembilan along the Malacca Strait showed signs of genetic differentiation as well as that of Indonesia at the coast of the Java Sea. The population stratification supports the biogeographic subregions of Wallace, which he proposed in 1876 (Woodruff, 2010) except that the boundary in the Malay Peninsula was pushed further south as likely shaped by contemporary physical processes. This was highly attributed to the predominant seasonal monsoon reversal along with the oceanic circulations as a means of seed dispersal.
In addition, evaluating genetic relationships among populations of species in its distribution range can be best understood by phylogeography. It has been a fast, emerging field involving the analyses of geographic distributions of genealogical lineages, especially those within species level. The statistical and mathematical aspects of phylogeography were a recent innovation of what is now called coalescent theory where genealogies are addressed through space and time (Avise, 1998). While tests are often conducted in tandem with matrilinear chloroplast (cp) DNA among plants, microsatellites can nevertheless serve as stand-alone markers. For instance, using microsatellites alone, Charrier et al. (2014) detected two lineages of the subalpine shrub, Rhododendron ferrugineum, that colonized Pyrenees from the Alps. This species survived in different refugia during glaciation events, resulting in a clustered genetic pattern. The Pyrenees, a mountain range between France and Spain, acted as a biogeographical barrier during the postglacial expansion. Among mangrove species, Wee et al. (2014) employed 10 microsatellite loci to assess the phylogeography of Rhizophora mucronata in Southeast Asia.
The so-called North Equatorial Current that dominates the Central Pacific has, first and foremost, an impact in the Philippines. It is brought about by trade winds that produce a primary current pushing the water from east to west. It partly flows down south to the Celebes Sea, but mostly flows north called the Kuroshio. Moreover, the flow of water around Southeast Asia and as far as Northern Australia is influenced largely by the monsoon wind. Around November to April, the cool continental air called the Northeast Monsoon flows to a relatively warmer Indian Ocean (IO). The flow in the SCS is predominantly southwest, then the direction reverses around May to October. The cool ocean air called the Southwest Monsoon flows mostly over the SCS in a northeast direction (Carpenter and Niem, 1998).
The surface currents in the IO follow the patterns of other oceans, but during Northern Hemisphere (boreal) summer, the westward North Equatorial Current is replaced and the weaker Equatorial Countercurrent merges with the Southwest Monsoon Current flowing eastward. It curves in a clockwise direction near Sumatra that flows westward, and circulates clockwise north of the IO. The Somali Current and Equatorial Jet influence northward and eastward surface circulations, respectively, during the seasonal monsoon changes (Bowditch, 2002). These monsoon reversals appeared to have influenced the migration patterns in Southeast Asia that allowed these genetic relationships between the local populations in spite of their distances.
The rates of gene flow can be estimated using Slatkin’s private allele method using the number of migrants (Nm) as the effective number of migrants per generation. It was assumed that the private alleles unique to a population are likely to attain high frequency only when Nm is low (Ellsworth and Hoelzer, 2006). In short, the presence of private allele in one population is indicative of no migration (Sundqvist et al., 2016). Nm was estimated from the frequencies of private alleles with correction for differences of samples sizes of populations. By the simplest migration island model, values of Nm greater than 1 indicate the homogenizing influence of gene flow, while a value as high as 6 can permit substantial divergence under the model IBD based on simulation studies (Ellsworth and Hoelzer, 2006). The overall migration rate of nipa populations in the region was considered marginal, Nm = 1.09272 (Table 4). For other mangroves, the overall Nm of Bruguiera gymnorrhiza and Kandelia obovata in Okinawa, Japan, were estimated to be 1.826 and 4.681, and the p (l) or mean frequency of private allele was 0.049 and 0.029, respectively (Basyuni et al., 2018).
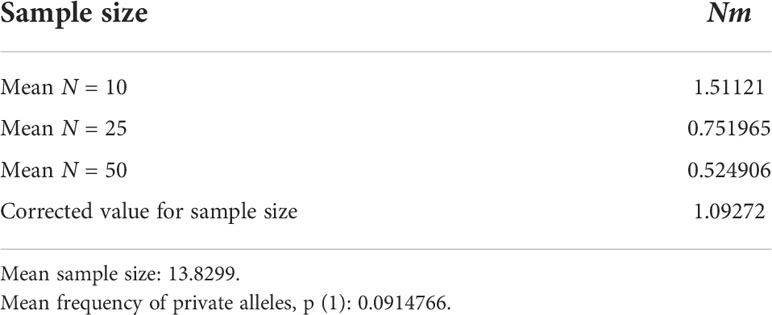
Table 4 Number of migrants (Nm) using private alleles.
Also, FST is an indirect measure of migration rate with the following expression: FST = 1/(1 + 4Nm). Nm is inversely related to FST, such that when Nm is large, FST is small and vice versa. However, Whitlock and McCauley (1999) dismissed this mathematical equation as FST can rarely estimate Nm accurately. Nevertheless, Yamamichi and Innan (2012) argued that when assumptions of island model, like neutrality, are violated, Nm is most sensitive to recent migration, while FST is most sensitive to migration that occurred over a relatively longer time as it involves common alleles. With highly variable markers like microsatellites, it is apparent that there was population subdivision at the level of FST = 0.22131 (Table 5) in conjunction with migration rather than population divergence. This must be validated further as to how dispersal affects genetic differentiation among subpopulations in the region.
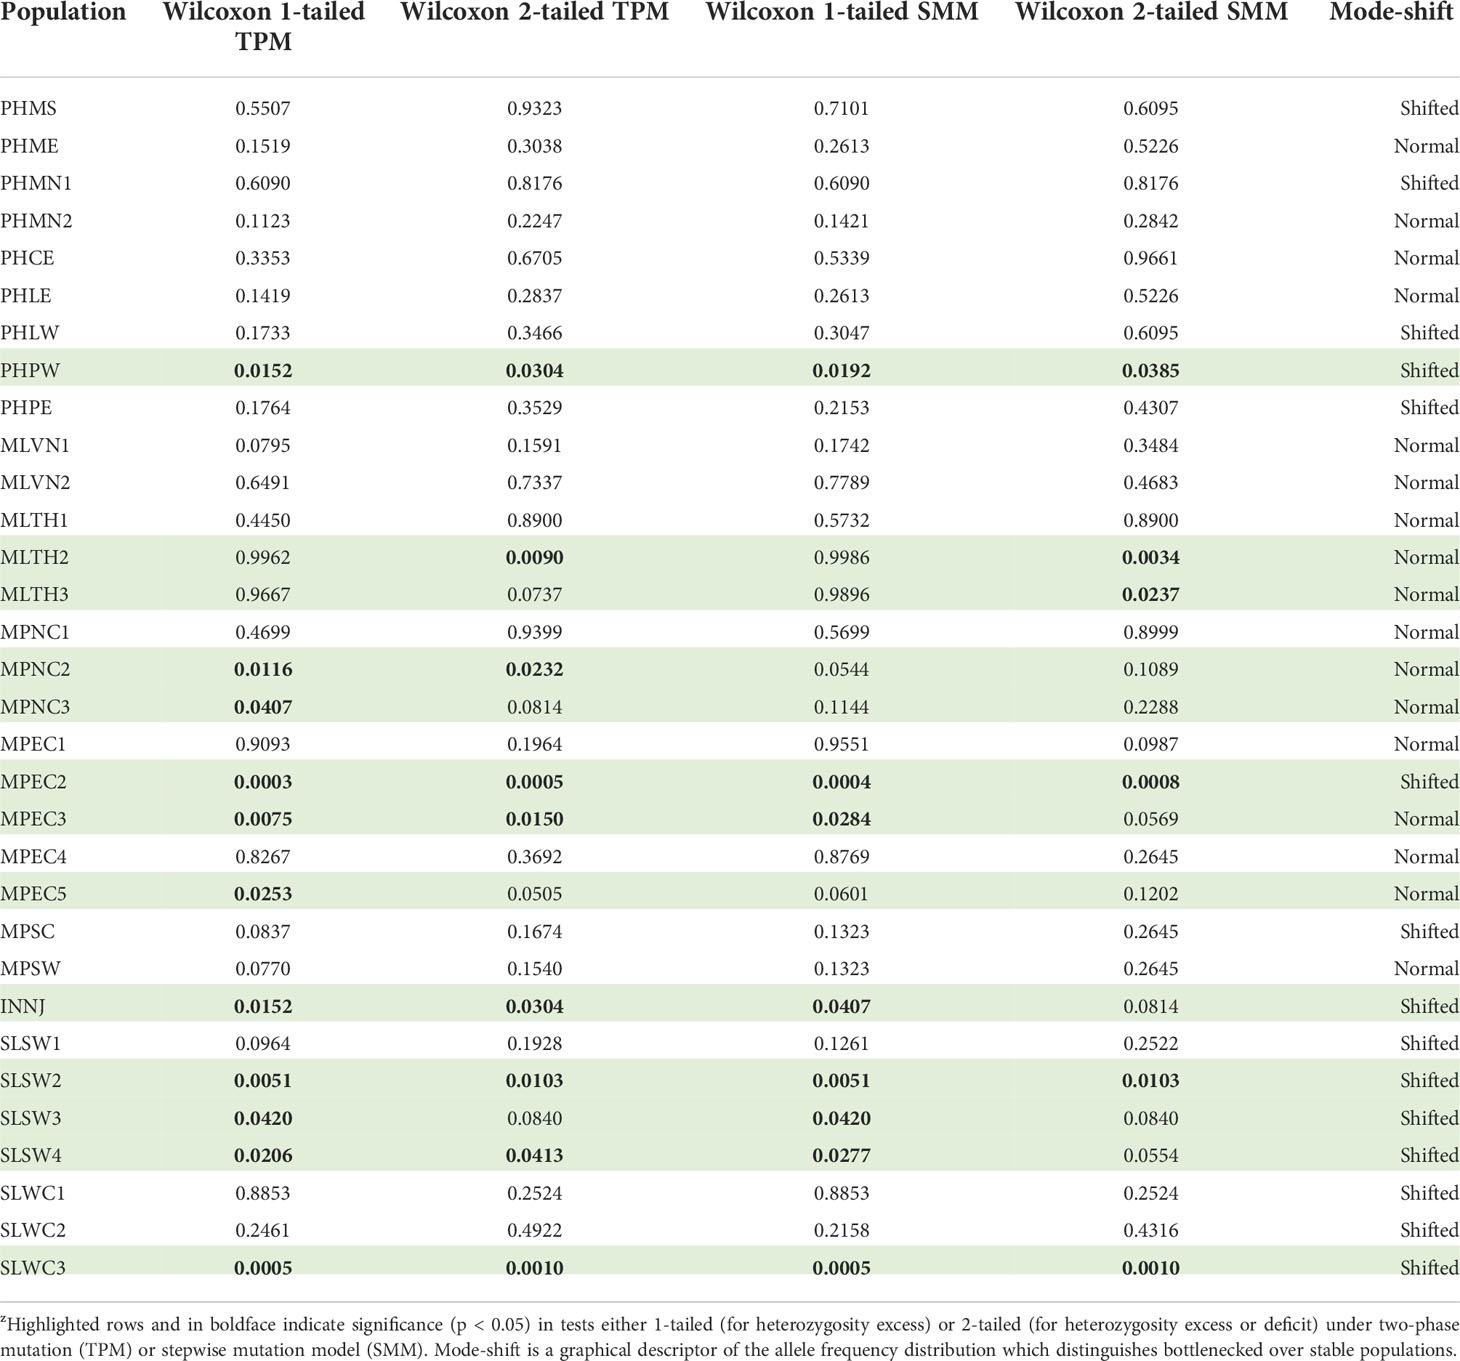
Table 5 All the p-value of Wilcoxon’s tests for bottleneck of nipa populations in the Indo-West Pacific across 18 microsatellite lociz.
The strong genetic connectivity from west to east does not necessarily indicate that Southeast Asia is not a corridor for migration. In fact, this dispersal to Sri Lanka was detected (Figure 4). It was likely a weak signal indicating non-significance in the network statistically. Bowditch (2002) pointed out that the eastern boundary of the IO was known to have limited interaction with the PO. By and large, this is acted upon by the SCS as an extension of the PO (Qiu et al., 2015). In fact, the Monmonier plot showed that the Malacca Strait is a genetic barrier (Figure 3D). Being a narrow sea passage between southwest of the Malay Peninsula and Sumatra, it limits, if not restricts, a southern migration route from the SCS to the IO. This confirms various reports that the Malacca Strait was not only a genetic but also a geographic barrier, among mangrove species (Mantiquilla et al., 2021). For nipa, this remains to be understood as the study had few sampling sites along the Malacca Strait, and particularly none in Sumatra, i.e., the island across the west coast of the peninsula. In this case, gene flow could also possibly occur somewhere else.
The SCS and the PO strongly influenced the water circulations within the Philippine Archipelago. The westward-flowing water current from western PO reverses direction with season. Interestingly, the Bohol Sea current reverses eastward during the Southwest Monsoon (Han et al., 2009). Those effective migrants may have taken along the routes of western inflows across the SCS, then to central Philippines by the direction reversal of the Bohol Sea. Other Sri Lankan populations that were detected to have a migration pattern throughout Southeast Asia, albeit moderately, include Dondra (SLSW2), Nainamadama (SLWC2), and Puttalam (SLWC3).
While directional gene flow showed that Sri Lanka as a source was more common in the migration network, it is instinctive to assume that many transoceanic dispersal events to this island might have occurred, but nevertheless unsuccessful. Voyages westward appeared to have propagules selected against time. In fact, recent data of the surface current of the Northeast Monsoon was observed to be always weaker than that of the Southwest Monsoon because of the weaker associated winds based on 2010–2012 data. The transport rate was measured in Sverdrup (Sv), a unit of flow equivalent to 1 × 10⁶ m3 s−1, as follows: Northeast Monsoon Current obtained a mean of 9.6 Sv with a range of 8.27–10.69 Sv compared to Southwest Monsoon Current estimated at 11.5 Sv (range: 10.25–12.78 Sv) (de Vos et al., 2014). Consequently, the time is ticking for these immigrants being washed ashore and settled in favorable habitats affecting their chances of survival. If so, then the test for bottleneck may provide some clues on the fate of these dispersals in the past.
Based on the constructed phylogenetic tree, all populations in the deeper nodes had extremely low bootstrap support. The first group, the largest and covered the widest geographically, consisted of Thailand and most of Malay Peninsula populations. Among the populations, Bang Riang (MPNC2) and Ko Yo (MPNC3) shared the same branch with Indonesia (INNJ), which was monophyletic with southern populations Singapore (MPSC) and Negeri Sembilan (MPSW). In particular, the sister branch of MPSW that bears the longest branch was the clade of Sri Lankan populations (Figure 7B). The length of this branch suggests a considerable time that elapsed prior to the emergence of this dichotomy. Nevertheless, the bootstrap support for the ancestral population of Sri Lanka clade was robust at 100%. At a bootstrap of 1,000, a score of 90% indicates pretty high confidence on the reliability of the clade (Hall, 2008). Indeed, this clade with Balapitiya (SLSW1) at the basal node was fairly recent relative to other populations in the region. This supports the tests for bottleneck that a founder event involving SLSW1 may have occurred sometime in the distant past. Another founder event might have occurred involving Nainamadama (SLWC2) or Puttalam (SLWC3) very recently as indicated by a node in the clade. The rest of the other nodes were seen as a range expansion at the distribution edge. Because of the complex oceanic circulation in the IO, the paucity of success among dispersal events likely caused genetic drift in these marginal populations.
The general circulations of the eastern boundary of the IO involve the northbound and southbound surface water masses that flow along the Andaman Sea in both monsoons. Particularly during the Northeast Monsoon, the southbound surface current flows down to Sumatra and then to the IO. At this time, Rizal et al. (2012) also observed that the presence of an anticlockwise gyre, and a northbound current during the Southwest Monsoon, consistently blocked the outflow of the Malacca Strait. Wee et al. (2014) attributed to these surface currents the genetic patterns of R. mucronata populations in Southeast Asia using 10 microsatellite loci. The north Sumatra populations, although closer to the populations along the Malacca Strait, were genetically clustered with the Myanmar population at the relatively distant northwest coast of the Malay Peninsula. Moreover, the ocean simulations of these findings also found out that the Malacca Strait was indeed a geographical barrier, confirming what was reported elsewhere.
Nipa populations in Sumatra, Indonesia, are unquestionably important, which may shed light on the link of the gene flow in east–west subdivision in the IWP. Inventory of the sampling sites on the post-tsunami (2004) impact on mangrove populations showed that nipa remained standing by sheer numbers both in the north (Banda Aceh) and along the west coast (Aceh Barat and Nias Barat) of Sumatra (Onrizal and Mansor, 2016).
All nipa populations in the Philippine Archipelago were paraphyletic to Terengganu Central (MPEC2) and polyphyletic to the more ancestral Terengganu North (MPEC1) population (Figure 7B). Again, bootstrap support for these populations was generally low, but their affinity provides a clue for dispersal. The ocean circulation serves as a corridor for emigrants from Luzon East to Terengganu by the intrusion of Kuroshio to the SCS. However, Sundqvist et al. (2016) reasoned that historical demography may influence the directional migration such that it may enhance or, in this case, diminish signs of recent migration. Consequently, the genetic footprints of these ancestral populations may have also been obscured by the admixture of recent genetic ancestry resulting in poor bootstrap support in the phylogram. This requires an alternative higher-resolution marker to elucidate the answer.
Given this information, Southeast Asia remains the center of diversity of nipa as this subregion is predominantly influenced by oceanic circulations in many directions. These physical processes continuously provide immigrants that enrich the local populations. The populations in Sri Lanka, on the other hand, were considered as recent expansion at the margin of the distribution range, estimated between 250 ka and 150 ka. Rapid succession of this expansion was observed during the LGM, and was consistent with the bottleneck signatures. Characterized as having low genetic variation with plausible genetic drift in the past, these peripheral populations will likely be pushed to extinction if not given proper attention.
The original contributions presented in the study are included in the article/Supplementary Material. Further inquiries can be directed to the corresponding author.
Conceived and designed the review: JM and Y-CC. Field sampling: JM, M-SS, H-YL, KS, SS, WL, Y-LC, and Y-CC. Writing and figures: JM, M-SS, H-CS, and Y-CC. Final proofreading and editing: JM, M-SS, and Y-CC. All authors contributed to the article and approved the submitted version.
This paper was supported by funding from the Ministry of Science and Technology, Taiwan (MOST 108-2621-B-110-003-MY3, MOST 109-2313-B-110-005, and MOST 111-2621-B-110-001) to Y-CC and by partial financing (the Higher Education Sprout Project) of NSYSU.
The authors declare that the research was conducted in the absence of any commercial or financial relationships that could be construed as a potential conflict of interest.
All claims expressed in this article are solely those of the authors and do not necessarily represent those of their affiliated organizations, or those of the publisher, the editors and the reviewers. Any product that may be evaluated in this article, or claim that may be made by its manufacturer, is not guaranteed or endorsed by the publisher.
The Supplementary Material for this article can be found online at: https://www.frontiersin.org/articles/10.3389/fpls.2022.1038998/full#supplementary-material
SCS, South China Sea; PO, Pacific Ocean; IO, Indian Ocean.
Avise, J. C. (1998). The history and purview of phylogeography: A personal reflection. Mol. Ecol. 7, 371–379. doi: 10.1046/j.1365-294x.1998.00391.x
Bandyopadhyay, T., Gangopadhyay, G., Roy, S. K., Datta, B. K., Mukherjee, K. K. (2005). Nypa fruticans of sundarban biosphere reserve, West Bengal India – its genetic diversity and an approach to conservation. Phytomorphology 55 (1&2), 39–47.
Basyuni, M., Baba, S., Oku, H. (2018). Microsatellite analysis of genetic diversity and structure of Bruguiera gymnorrhiza and Kandelia obovata. E3S Web Conferences 52, 27. doi: 10.150/e3sconf/20185200027
Bobrov, A., Lorence, D. H., Romanov, M. S., Romanova, E. S. (2012). Fruit development and pericarp structure of Nypa fruticans wurmb. (Arecaceae): A comparison with other palms. Int. J. Plant Sci. 173 (7), 751–766. doi: 10.1086/666668
Bowditch, N. (2002). The American practical navigator: An epitome of navigation (Bethesda, Maryland: National Imagery and Mapping Agency, US Government), 878.
Carpenter, K. E., Niem, V. H. (1998). The living marine resources of the Western central pacific (Rome, Italy: Food and Agriculture Organization of the United Nations), 1–17.
Charrier, O., Dupont, P., Pornon, A., Escaravage, N. (2014). Microsatellite marker analysis reveals the complex phylogeographic history of Rhododendron ferrugineum (Ericaceae) in pyrenees. PloS One 9 (3), e92976. doi: 10.1371/journal.pone.0092976
Das, S., Ghose, M. (2003). Seed structure and germination pattern of some Indian mangroves with taxonomic relevance. Taiwania 48 (4), 287–298. doi: 10.6165/tai.2003
de Vos, A., Pattiaratchi, C. B., Wijeratne, E. M. S. (2014). Surface circulation and upwelling patterns around Sri Lanka. Biogeosciences 11, 5909–5930. doi: 10.5194/bg-11-5909-2014
Diniz-Filho, J. A. F., Soares, T. N., Lima, J. S., Dobrovolski, R., Landeiro, V. L., Telles, M. P., et al. (2013). Review article: Mantel test in population genetics. Genet. Mol. Biol. 36 (4), 475–485. doi: 10.1590/S1415-47572013000400002
Dogan, H., Ercisli, S., Temim, E., Hadziabulic, A., Tosun, M., Yilmaz, S. O., et al. (2014). Diversity of chemical content and biological activity in flower buds of a wide number of wild grown caper (Capparis ovate desf.) genotypes from Turkey. Comptes Rendus L’Academie Bulgare Des. Sci. 67 (11), 1593–1600.
Dransfield, J., Uhl, N. W., Asmussen, C. B., Baker, W. J., Harley, M. M., Lewis, C. E. (2008). Genera palmarum: Evolution and classification of palms. 2nd ed (UK: Kew Publishing).
Ellsworth, J. A., Hoelzer, G. A. (2006). “Genetic evidence on the historical biogeography of central American howler monkeys,” in Primate biogeography: Progress and prospects. Eds. Lehman, S. M., Fleagle, J. G. (New York, USA: Springer Science+Business Media LLC), 81–103.
Fijarczyk, A., Babik, W. (2015). Detecting balancing selection in genomes: Limits and prospects. Mol. Ecol. 24, 3529–3545. doi: 10.1111/mec.13226
Fong, F. W. (1992). Perspectives for sustainable resource utilization and management of nipa vegetation. Economic Bot. 46 (1), 45–54. doi: 10.1007/BF02985253
Grünwald, N. J., Kamvar, Z. N., Everhart, S. E., Tabima, J. F., Knaus, B. J. (2017) Population genetics and genomics in r (Corvallis, Oregon, USA). Available at: https://grunwaldlab.github.io/Population_Genetics_in_R/ (Accessed 20 June 2022).
Hall, B. G. (2008). Phylogenetic trees made easy: A how-to manual. 3rd ed (Sunderland, Massachusetts, USA: Sinauer Associates, Inc.), 233.
Han, W., Moore, A. M., Levin, J., Zhang, B., Arango, H. G., Curchitser, E., et al. (2009). Seasonal surface ocean circulation and dynamics in the Philippine archipelago region during 2004-2008. Dynamics Atmosphere Oceans 47, 114–137. doi: 10.1016/j.dynatmoce.2008.10.007
Hartl, D. L. (2020). A primer of population genetics and genomics. 4th ed (UK: Oxford University Press), 296.
Hasanbegovic, J., Hadziabulic, S., Kurtovic, M., Gasi, F., Lazovic, B., Dorbic, B., et al. (2021). Genetic characterization of almond (Prunus amygdalus l.) using microsatellite markers in the area of Adriatic Sea. Turkish J. Agric. Forest. 45, 797–806. doi: 10.3906/tar-2103-82
Henderson, A. (1986). A review of pollination studies in the palmae. Botanical Rev. 52 (3), 221–259. doi: 10.1007/BF02860996
He, Z., Zhang, Z., Guo, W., Zhang, Y., Zhou, R., Shi, S. (2015). De novo assembly of coding sequences of the mangrove palm (Nypa fruticans) using RNA-seq and discovery of whole-genome duplications in ancestor of palms. PloS One 10 (12), e0145385. doi: 10.1371/journal.pone.0145385
Hossain, F., Islam, A. (2015). Utilization of mangrove forest plant: Nipa palm (Nypa fruticans wurmb.). Am. J. Agric. Forest. 3 (4), 156–160. doi: 10.11648/j.ajaf.20150304.16
Integrated DNA Technologies (2021) Whole genome sequencing (Singapore). Available at: https://sg.idtdna.com/pages/technology/next-generation-sequencing/dna-sequencing/whole-genome-sequencing#:~:text=Whole%20genome%20sequencing%20involves%20extracting,to%20interpret%20the%20sequencing%20results (Accessed 27 November 2021).
Jian, S., Ban, J., Ren, H., Yan, H. (2010). Low genetic variation detected within the widespread mangrove species Nypa fruticans (Palmae) from southeast Asia. Aquat. Bot. 92 (2010), 23–27. doi: 10.1016/j.aquabot.2009.09.003
Joshi, L., Kanagaratnam, U., Adhuri, D. (2006). “Nypa fruticans – useful but forgotten in mangrove reforestation programs?,” in Resilience, rights and resources: Two years of recovery in coastal zone aceh (Bogor Barat, West Java, Indonesia: World Agroforestry Center (ICRAF).
Kamvar, Z. N., Tabima, J. F., Grünwald, N. K. (2014). Poppr: An r package for genetic analysis of populations with clonal, partially clonal, and/or sexual reproduction. PeerJ 2, e281. doi: 10.7717/peerj.281
Lapitan, V. C., Nicolas, K. L. C. (2015). Collection and genetic diversity analysis of nipa palm (Nypa fruticans wurmb., arecaceae) germplasm 180. Philrice 2014 National Rice R&D Highlights. Philrice Midsayap.
Manni, F., Guerard, E., Heyer, E. (2004). Geographic patterns of (genetic, morphologic, linguistic) variation: How barriers can be detected using monmonier’s algorithm. Hum. Biol. 76 (2), 173–190. doi: 10.1353/hub.2004.0034
Mantiquilla, J. A., Abad, R. G., Barro, K. M. G., Basilio, J. A. M., Rivero, G. C., Silvosa, C. S. C. (2016). Potential pollinators of nipa palm (Nypa fruticans wurmb.). Asia Life Sci. 25 (1), 453–474.
Mantiquilla, J. A., Rasco, E. T., Jr., Mohammad Isa, A. M. M., Licup, K. W. P. (2013). The flowering habit of nipa (Nypa fruticans wurmb.) in semi-wild stands of the davao region, Philippines. Banwa 10 (1), 16–32.
Mantiquilla, J. A., Shiao, M. S., Shih, H. C., Chen, W. H., Chiang, Y. C. (2021). A review on the genetic structure of ecologically and economically important mangrove species in the indo-West pacific. Ecol. Genet. Genomics 18, 100078. doi: 10.1016/j.egg.2020.100078
McDonald, D. B. (2008) Genetic markers (University of Wyoming). Available at: http://www.uwyo.edu/dbmcd/molmark/index.html (Accessed 07 May 2019).
Montano, V., Jombart, T. (2017). An eigenvalue test for spatial principal component analysis. BMC Bioinf. 18, 562. doi: 10.1186/s12859-017-1988-y
Nakanishi, H. (1987). Stranded tropical seeds and fruits on the coast of the Japanese mainland. Micronesica 20 (1-2), 201–213.
Onrizal, Mansor, M. (2016). Status of coastal forests of the northern Sumatra in 2005 (after 2004’s tsunami catastrophe). Biodiversitas 17 (1), 44–54. doi: 10.13057/biodiv/d170107
Qiu, B., Rudnick, D. L., Cerovecki, I., Cornuelle, B. D., Chen, S., Schönau, M. C., et al. (2015). The pacific north equatorial current: New insights from the origins of the kuroshio and Mindanao currents (OKMC) project. Oceanography 28 (4), 24–33. doi: 10.5670/oceanog.2015.78
Rasco, E. T., Jr. (2011). The nypa palm: Nature’s gift from the age of dinosaurs (Taguig City, Philippines: NAST-DOST), 156.
R Core Team (2021). Hierarchical clustering. The R Stats Package (R 4.1.0). (Vienna, Austria:R Foundation for Statistical Computing).
Rizal, S., Damm, P., Wahid, M. A., Sundermann, J., Ilhamsyah, Y., Iskandar, T., et al. (2012). General circulations in the malacca strait and Andaman Sea: A numerical model study. Am. J. Environ. Sci. 8 (5), 479–488. doi: 10.3844/ajessp.2012.479.488
Saran, P. L., Singh, S., Solanki, V., Choudhary, R., Manivel, P. (2021). Evaluation of Asparagus adscendens accessions for root yield and shatavarin IV content in India. Turkish J. Agric. Forest. 45 (4), 475–483. doi: 10.3906/tar-2006-42
Schott, F. A., McCreary, J. P., Jr (2001). The monsoon circulation of the Indian Ocean. Progress in Oceanography 51, 1–123. doi: 10.1016/S0079-6611(01)00083-0
Setoguchi, H., Watanabe, K., Takaso, T., Nakazato, N., Tobe, H. (1999). Genetic diversity of the natural monument Nypa fruticans (Palmae) at fanaura, iriomote island. Acta Phytotaxonomica Geobotanica 50 (2), 201–205. doi: 10.18942/bunruichiri.KJ00001077426
Sugai, K., Watanabe, S., Kuishi, T., Imura, S., Ishigaki, K., Yokota, M., et al. (2015). Extremely low genetic diversity of the northern limit populations of Nypa fruticans (Arecaceae) on iriomote island, Japan. Conserv. Genet 17 (1), 221–228. doi: 10.1007/s10592-015-0773-6
Sundqvist, L., Keenan, K., Zackrisson, M., Prodöhl, P., Kleinhans, D. (2016). Directional genetic differentiation and relative migration. Ecol. Evol. 6 (11), 3461–3475. doi: 10.1002/ece3.2096
Susanto, R. D., Wei, Z., Adi, T. R., Zheng, Q., Fang, G., Fan, B., et al. (2016). Oceanography surrounding Krakatau Volcano in the Sunda Strait, Indonesia. Oceanography 29 (2), 264–272. doi: 10.5670/oceanog.2016.31
Tsuji, K., Ghazalli, M. N. F., Ariffin, Z., Nordin, M. S., Khaidizar, M. I., Dulloo, M. E., et al. (2016). Genetic diversity and geographical differentiation of nipa (Nypa fruticans wurmb.) populations in peninsular Malaysia based on AFLP. Japan Agric. Res. Q. 50 (1), 49–56. doi: 10.6090/jarq.50.49
Uhl, N. W. (1972). Inflorescence and flower structure in Nypa fruticans (Palmae). Am. J. Bot. 59 (7), 729–743. doi: 10.1002/j.1537-2197.1972.tb10146.x
Wang, P., Li, Q. (2009). The south China Sea: Developments in paleoenvironmental research (New York, USA: Springer Science+Business Media LLC), 25–73.
Wee, A. K. S., Takayama, K., Asakawa, T., Thompson, B., Onrizal, Sungkaew, S., et al. (2014). Oceanic current, not land masses, maintain the genetic structure of the mangrove Rhizophora mucronata lam. (Rhizophoraceae) in southeast Asia. J. Biogeography 41 (5), 954–964. doi: 10.1111/jbi.12263
Whitlock, M. C., McCauley, D. E. (1999). Indirect measures of gene flow and migration: FST ≠ 1/(4nM + 1). Heredity 82, 117–125. doi: 10.1038/sj.hdy.6884960
Woodruff, D. S. (2010). Biogeography and conservation in southeast Asia: how 2.7 million years of repeated environmental fluctuations affect today’s patterns and future of the remaining refugial-phase biodiversity. Biodivers. Conserv. 19, 919–941. doi: 10.1007/s10531-010-9783-3
Yamamichi, M., Innan, H. (2012). Estimating the migration rate from genetic variation data. Heredity 108, 362–363. doi: 10.1038/hdy.2011.83
Zeisek, V. (2021) Molecular data in r: Phylogeny, evolution and r. Available at: https://trapa.cz/sites/default/files/r_mol_data_phylogen_4.pdf (Accessed 11 August 2021).
Keywords: nipa, Indo-West Pacific, microsatellites, genetic diversity, population structure, migration
Citation: Mantiquilla JA, Shiao M-S, Lu H-Y, Sridith K, Sidique SNM, Liyanage WK, Chu Y-L, Shih H-C and Chiang Y-C (2022) Deep structured populations of geographically isolated nipa (Nypa fruticans Wurmb.) in the Indo-West Pacific revealed using microsatellite markers. Front. Plant Sci. 13:1038998. doi: 10.3389/fpls.2022.1038998
Received: 07 September 2022; Accepted: 28 September 2022;
Published: 25 October 2022.
Edited by:
Tingshuang Yi, Kunming Institute of Botany (CAS), ChinaReviewed by:
Cong Zeng, Shanghai Jiao Tong University, ChinaCopyright © 2022 Mantiquilla, Shiao, Lu, Sridith, Sidique, Liyanage, Chu, Shih and Chiang. This is an open-access article distributed under the terms of the Creative Commons Attribution License (CC BY). The use, distribution or reproduction in other forums is permitted, provided the original author(s) and the copyright owner(s) are credited and that the original publication in this journal is cited, in accordance with accepted academic practice. No use, distribution or reproduction is permitted which does not comply with these terms.
*Correspondence: Yu-Chung Chiang, eXVjaHVuZ0BtYWlsLm5zeXN1LmVkdS50dw==
†These authors have contributed equally to this work
Disclaimer: All claims expressed in this article are solely those of the authors and do not necessarily represent those of their affiliated organizations, or those of the publisher, the editors and the reviewers. Any product that may be evaluated in this article or claim that may be made by its manufacturer is not guaranteed or endorsed by the publisher.
Research integrity at Frontiers
Learn more about the work of our research integrity team to safeguard the quality of each article we publish.