 Félix Estrada1,2
 Jaume Flexas3
 Jose Luis Araus4
 Freddy Mora-Poblete5
 Jaime Gonzalez-Talice6
 Dalma Castillo7
 Ivan A. Matus7
 Ana Maria Méndez-Espinoza2
 Miguel Garriga8Carlos Araya-Riquelme1
 Cyril Douthe3Benjamin Castillo1
 Alejandro del Pozo1
 Gustavo A. Lobos1*
- 1Plant Breeding and Phenomics Center, Faculty of Agricultural Sciences, University of Talca, Talca, Chile
- 2Instituto de Investigaciones Agropecuarias INIA-Remehue, Osorno, Chile
- 3Research Group on Plant Biology Under Mediterranean Conditions, Departament de Biologia, Institute of Agro-Environmental Research and Water Economy, Universitat de les Illes Balears, Illes Balears, Spain
- 4Department of Evolutive Biology Ecology, and Environmental Sciences, University of Barcelona, Barcelona, Spain
- 5Institute of Biological Sciences, University of Talca, Talca, Chile
- 6Departamento de Producción Forestal y Tecnología de la Madera, Facultad de Agronomía, Universidad de la República, Montevideo, Uruguay
- 7Instituto de Investigaciones Agropecuarias INIA-Quilamapu, Chillán, Chile
- 8Departamento de Producción Vegetal, Facultad de Agronomía, Universidad de Concepción, Concepción, Chile
In this study, daily changes over a short period and diurnal progression of spectral reflectance at the leaf level were used to identify spring wheat genotypes (Triticum aestivum L.) susceptible to adverse conditions. Four genotypes were grown in pots experiments under semi-controlled conditions in Chile and Spain. Three treatments were applied: i) control (C), ii) water stress (WS), and iii) combined water and heat shock (WS+T). Spectral reflectance, gas exchange and chlorophyll fluorescence measurements were performed on flag leaves for three consecutive days at anthesis. High canopy temperature (HCT) genotypes showed less variability in their mean spectral reflectance signature and chlorophyll fluorescence, which was related to weaker responses to environmental fluctuations. While low canopy temperature (LCT) genotypes showed greater variability. The genotypes spectral signature changes, in accordance with environmental fluctuation, were associated with variations in their stomatal conductance under both stress conditions (WS and WS+T); LCT genotypes showed an anisohydric response compared that of HCT, which was isohydric. This approach could be used in breeding programs for screening a large number of genotypes through proximal or remote sensing tools and be a novel but simple way to identify groups of genotypes with contrasting performances.
1. Introduction
Climate change is intensifying local environmental constraints. For many areas, it is predicted that rainfall will progressively decrease, and extreme heat events will become increasingly common (Dixon et al., 2009; Rebetzke et al., 2012; Hernández-Barrera et al, 2017). In addition, the competition for water resources between human and industrial consumption will increase, affecting food security (e.g., grain production) in the coming decades (Trethowan et al., 2005; Tilman et al., 2011; Mohanty et al., 2020).
Bread wheat (Triticum aestivum L.) is one of the most important crops for the human diet, and one of the most widely cultivated in the world (Braun and Payne, 2013). In Mediterranean-climate areas, drought and heat have detrimental consequences during anthesis and grain filling, affecting grain yield (GY) and its components (Thomas and Ougham, 2014; Pinto et al., 2016; Velu et al., 2016; del Pozo et al., 2019). Breeding is one of the pillars for wheat adaptation to the threats imposed by climate change, with phenotyping being considered the bottleneck, in terms of the management of the huge information of the phenotype generated, limiting genetic advance (Araus and Kefauver, 2018; Yudina et al., 2020).
Plant phenotyping using different remote sensing approaches is receiving increasing interest among plant breeders and their users in agriculture. Among remote sensing methods, canopy, or even single leaf reflectance (represented graphically by the spectral signature) is closely related to the ability to absorb and transmit incident radiation under a particular environmental condition (Garbulsky et al., 2011), therefore a useful indicator of the plant physiological status (Peñuelas and Filella, 1998) and the Genotype by Environment (GxE) effect (Vilmus et al., 2014; Garriga et al., 2017). For instance, in a single scan, high-resolution field spectrometers acquire the reflectance of a wide range of wavelengths (350 – 2,500 nm), and this spectral signature can be related to various leaf, plant or crop traits using spectral reflectance indices (SRIs; relationships between particular wavelengths or spectrum bands), such as the normalized difference vegetation index (NDVI), which is related to leaf or canopy greenness (Babar et al, 2006a), and the photochemical reflectance index (PRI), associated to the xanthophyll’s activity (Gamon et al., 1992; Hernandéz-Clemente et al, 2011). Another approach to using reflectance information is through multivariate regression models to predict physiological or productive traits, that include part or the whole spectral signature (Graeff and Claupein, 2007; Sridhar et al., 2007; Winterhalter et al., 2011; Mullan, 2012; Fallon et al, 2020; Xie et al., 2020), and classification methods for direct identification of the elite genotype group (Garriga et al., 2017). Changes in the spectral signature have been associated with modifications in plant tissue properties like the hydration state or chemical composition of oak leaves (Quercus spp.) (Cavender-Bares et al., 2016), stomatal conductance of cotton plants (Gossypium hirsutum) (Vitrack-Tamam et al., 2020), or leaf photosynthetic traits (Peñuelas and Filella, 1998; Silva-Pérez et al., 2020) and carbon isotopic discrimination in the grains of wheat (Lobos et al., 2014; Garriga et al., 2021).
Nevertheless, the leafe spectral signature not only describes the biochemical an physiological state of a genotype at a certain or punctual moment, but it also integrates of environmental events throughout the growing season until the day of measurement (Marcińska et al., 2013; Lobos et al., 2019; Banerjee et al., 2020; Vitrack-Tamam et al., 2020); without ignoring the possible epigenetic effect of environmental characteristics that have impacted the seeds used for the crop (Crisp et al., 2016). Since both the uniqueness of each season’s environmental characteristics and the plasticity of the genotype are reflected in the morpho-physiological and physico-chemical traits (Elazab et al., 2012; Jäger et al., 2014; Petrov et al., 2018; Kanbar et al., 2020; Yan et al., 2020). Also, since the hydric state of the plant is closely associated with the ability to satisfy the atmospheric demand for evapotranspiration (Kudoyarova et al., 2011; Zhang et al., 2018), changes in the daily and diurnal vapor pressure deficit (VPD) should be accompanied by changes in the spectral signature (Magney et al., 2016). Thus, genotypes with contrasting tolerance to abiotic stresses should have different responses in their spectral signature to changing environmental conditions.
Thus, the aim of this work was to evaluate the daily changes (three consecutive days) in the leaf spectral reflectance, leaf gas exchange, chlorophyll fluorescence and pigment content, of spring wheat genotypes exposed to water stress (WS) and WS combined with heat stress (WS+T). It was hypothesized that genotypes more affected by environmental conditions should exhibit larger differences in spectral signature among the evaluated days. Furthermore, if the above is true, the analysis of its diurnal spectral signature should be consistent with the pattern observed in the day comparison, due to diurnal changes in air temperature and VPD.
2. Materials and methods
2.1. Selection of four genotypes for the study
Four spring wheat genotypes of contrasting canopy temperatures (CT) and GY under rainfed conditions (Table 1) were selected from a panel of 384 cultivars and advanced lines from CIMMYT Mexico, INIA Uruguay and INIA Chile. The panel was previously evaluated under rainfed (and high VPD) and irrigated (and reduced VPD) Mediterranean conditions, in 2011 and 2012 (del Pozo et al., 2016); the four genotypes were chosen among a subset of 104 genotypes, having a range of 80 – 83 d from sowing to earing, 4.3 – 5.6 of leaf area index at anthesis and 93 – 100 cm of plant height at anthesis.

Table 1 Original phenotypic characterization of the four genotypes studied (from a panel of 384 individuals under severe water deficit and high VPD conditions) grown under field conditions, during the 2011 and 2012 seasons.
2.2. Experimental setup
The four spring bread wheat genotypes were assessed in two controlled condition experiments, one in conventional glasshouses at the Universidad de Talca - Chile (UTALCA experiment: 35°24’20” S, 71°38’5” W) in 2018, and the second in plastic growth chambers placed outdoors at the Universidad de las Islas Baleares – Spain (UIB experiment: 39°38′ 17″ N, 2°38′54″ E) in 2019.
At UTALCA, two glasshouses were used (12 × 9 m and enclosed with alveolar polycarbonate sheets of 6 mm thickness and 86% solar transmission); one was open laterally (only the roof covered to shield plants from rain or fog), representing ambient temperature conditions (At), and the other was fully enclosed, and temperature controlled to ~8°C above At (At+8). At UIB growth chambers (1.7 × 5 m; transparent polyethylene film) were set up to provide both the At and At+8 conditions. Temperature and relative humidity (RH) were recorded with HOBO® Series H8 sensors (Onset Computer Corporation, MA, USA) at UTALCA and HOBO® UX100-003 sensors at UIB. Temperature and RH data were used to calculate VPD during the experiments (Table 2).
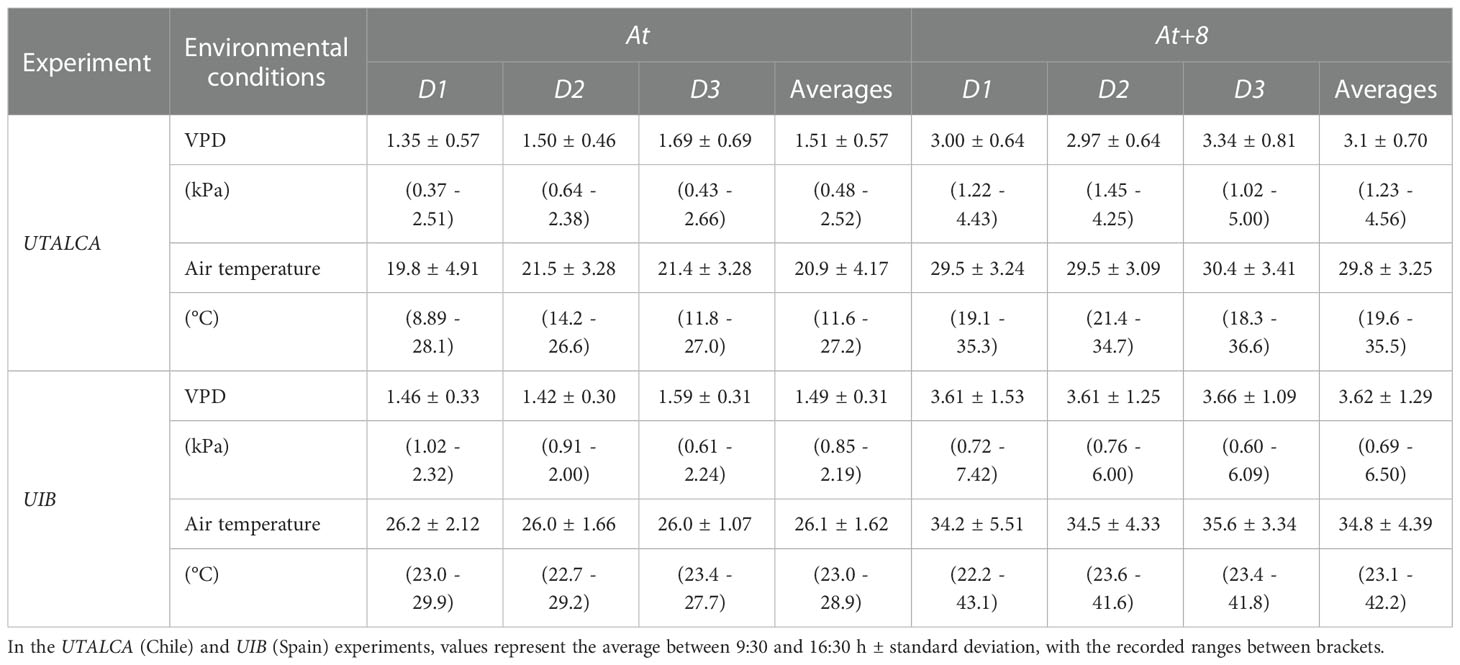
Table 2 Environmental vapor pressure deficit (VPD) and air temperature during the three days of evaluations (D1, D2, and D3) under controlled conditions at ambient temperature (At; only the glasshouse roof covered) and at increased ambient temperature of 8°C (At+8).
Genotypes were exposed to the following growing conditions during anthesis: i) control (C: substrate ~75% pot water capacity and ambient temperature); water stress (WS: under At, substrate ~30 and 50% of pot water capacity at UTALCA and UIB experiments, respectively); and iii) water and heat shock combined (WS+T: water deficit and ambient temperature increased by around 8°C).
For the UTALCA experiment, 40 seeds of each genotype were sown in 20 L plastic containers (radius: 15 cm; height: 50 cm), filled with a 6:1:1 mixture of river sand, organic soil and perlite. For the UIB experiment, 20 seeds of each genotype were sown in 10 L plastic containers (radius: 12.5 cm; height: 19.5 cm), filled with a 1:1 mixture of river sand and perlite. In both experiments, the seeds were distributed in concentric circles, sowing an outer ring to minimize edge effects at the root level (i.e., plants growing in contact with the wall of the pot; 10 and 5 seeds in UTALCA and UIB, respectively) and the inner rings with seeds of plants that were to be measured (30 and 15 seeds in UTALCA and UIB, respectively). Both in UTALCA and UIB, fertilizer was applied weekly, comprising 1,000 ml of full-strength Hoagland’s nutrient solution (Hoagland and Arnon, 1950).
2.3. Experimental design and measurements
The two trials were conducted as a completely randomized design, with three replicates (pots) per treatment and genotype. To determine the maximum water holding capacity, each pot was watered until saturation and weighed after 24 h of drainage to determine the amount of water required to reach 100% pot capacity. During the experiments, pots were weighed daily. All pots were treated as control plants (C) until flag leaf blades were fully unfolded (Z41; Zadoks et al., 1974). From Z41 to anthesis (Z68), plants of each genotype were divided in two groups: 1/3 were kept as C and 2/3 were exposed to WS conditions. At Z68, plants under WS were again divided in two groups, half continued in WS while the other plants were exposed to WS+T in the At+8 environment.
The leaf spectral signature and gas exchange was determined for each genotype and treatment. In the UTALCA and UIB experiments, once the combined stress (WS+T) was imposed, measurements were performed immediately on three consecutive days (D1, D2, and D3), at solar zenith, just before the plateau of the maximum daily atmospheric demand for water. In addition, to test whether genotypic differences within the day (diurnal progression) were consistent with those in reflectance observed between days, on D3 the spectral reflectance was evaluated at 10:00, 11:30, 13:00, 14:30, and 16:30 h (UTC - 4), in the UTALCA experiment. Spectral reflectance and gas exchange evaluations were carried out on the middle third of healthy and sun-exposed flag leaves. At UTALCA, three flag leaves per pot were selected for each assessment, while at UIB, two flag leaves were considered per replicate. Different leaves were considered in each evaluation for both progression between days and within the day.
2.3.1. Spectral reflectance
At UTALCA, the reflectance was recorded with a FieldSpec 3 Jr. portable spectrometer (Analytical Spectral Devices ASD Inc., Boulder, CO, USA) over a spectral range 350 – 2,500 nm, and a spectral resolution of 3 nm from 350 to 1,000 nm and 30 nm from 1,001 to 2,500 nm. The fiber was inserted into a contact probe device (ASD Inc., Boulder, CO, USA) equipped with a halogen light (5 W), generating a measuring spot of ~5 mm radius. The spectrometer was calibrated every 15 min with a white reference tile (Spectralon®, ASD Inc., Boulder, CO, USA). The equipment was configured to integrate three samples per scan, and ten scans per leaf (as described in Lobos and Poblete-Echeverría, 2017). The data were extracted using View Spec Pro 2008 software (ASD Inc., Boulder, CO, USA). The exploratory analysis of the spectral reflectance data was performed using SK-UTALCA software (Lobos and Poblete-Echeverría, 2017).
At UIB, reflectance measurements were performed with a Vis/NIR optical spectrometer (Jaz-EL350, Ocean optics, Dunedin, FL, USA) equipped with a halogen tungsten light source (4.75 W) and a QP600-1-SR-BX optical fiber (Ocean Optics, Inc., Dunedin, FL, USA; spectral range 400 – 900 nm), with 0.3 nm spectral resolution. The calibration parameters were adjusted to 10 ms for the integration time, with a light intensity of 2,500 (counts). Before measurement, the spectrometer was calibrated to 100% reflectance using a white reference panel (Ocean Optics, Dunedin, FL, USA), while the dark calibration was obtained with a black panel. The equipment was configured to integrate ten scans per leaf. Because there was not enough space to take measurements in the growth chambers, spectral reflectance was measured in a room (25°C) adjacent to the chambers.
2.3.2. Leaf gas exchange, chlorophyll fluorescence and pigment content
At UTALCA, leaf net CO2 assimilation (An), the stomatal conductance (gs) and the leaf temperature (Tl) were evaluated using a CIRAS 2 infrared gas analyzer (IRGA) (PP Systems, Amesbury, MA, USA), with a narrow-leaf cuvette (1.7 cm2) at a flow rate of 250 ml min-1, CO2 concentration of 400 ppm, cuvette temperature of 25°C, and photosynthetically active radiation (PAR) of 1,500 µmol m-2 s-1. At UIB, measurements were performed with a Li-6400xt portable photosynthesis system (LI-COR Inc., Lincoln, Nebraska, USA). The environmental parameters of the leaf chamber were adjusted to equal those of the UTALCA experiment, except for the temperature of the cuvette, which was set at room temperature.
In UTALCA experiment, chlorophyll fluorescence (Chlf) was assessed using a portable pulse amplitude modulated fluorometer (PAM-2500, Walz, Germany). The minimum and the maximum yield of fluorescence under dark conditions (Fo and Fm, respectively), were measured on leaves adapted to darkness for 20 minutes with a Leaf-Clip (Leaf-Clip Holder 2030- B, Walz, Germany). Then, a rapid light curve (RLC) was performed in the same leaf spot. For that, the equipment was programmed to emit 10 pulses of actinic light at different levels of photosynthetically active radiation (PAR), which increased from 0 to 1,982 μmol m-2 s-1 (the time between each PAR level was six seconds). At each PAR, the minimum calculated and the maximum yield of fluorescence under light conditions (~Fo´ and Fm´, respectively), were automatically recorded.
Anthocyanin content was estimated using a non-destructive portable chlorophyll meter (Dualex, Force A, France); values are given in relative absorbance units from 0 to 1.5.
2.4. Data analyses
The genotypic (G) variability of the spectral signature under each treatment (environment-E) was assessed through direct comparison (ANOVA and p-values < 0.05) of the spectral signatures at the wavelength level (Lobos et al., 2019). Thus, the first reflectance measurements (i.e., measurements of D1 compared with D2 and D3 in case of the daily analysis, and measurement at 10:00 h with each moment of measurement in the diurnal progression analysis) were compared (ANOVA, p-values < 0.05; n = 9 and 6 in UTALCA and UIB experiments, respectively) to the subsequent ones. When significant differences were found (Tukey’s multiple comparison test, p-values < 0.05) between the said spectral signatures, the percentage change with respect to the first measurement was calculated and plotted.
To establish statistical differences in the gas exchange performance of the genotypes and environments, multifactor ANOVA (p-values < 0.05; n = 9 and 6 in UTALCA and UIB experiments, respectively) was carried out on Tl, gs, and An. When significant differences were found, Tukey’s test (p-values < 0.05) was applied. To identify the genotypic variability of biochemical limitations of photosynthesis to the generated environmental conditions, the relationship between An and gs was studied through regression analysis (Medrano et al., 2002; Gago et al., 2020).
Finally, in the UTALCA experiment, the spectral reflectance was also used to calculate the normalized difference vegetation index (NDVI; [R780 - R670]/[R780 + R670], Babar et al., 2006a) and the photochemical index (PRI; [R570 - R531 - R670]/[R570 + R531 + R670], Hernández-Clemente et al., 2011). Pearson correlation analyses were performed using both SRI and vapor pressure deficit (VPD), relative humidity (RH), air temperature (Ta), anthocyanin content (Anth) and leaf temperature (Tl). These SRIs were also used to characterize the behavior of the genotypes, both between and within the day.
Statistical analysis was performed with RStudio v. 1.2.1335 (RStudio Inc.).
3. Results
3.1. Environmental conditions during the experiment
The average temperature and VPD was increased by 8°C and 1.6-2.3 kPa, respectively, at the elevated temperature regime, in both experiments (Table 2). However, temperature at At regime – and, consequently, at all other regimes – was higher in the UIB experiment compared to the UTALCA experiment. During D3 of the diurnal progression study (UTALCA), the ambient temperature and VPD gradient also increased from 09:00 h (At: 14.2°C and 0.65 kPa; At+8: 25.0°C and 2.85 kPa) to a peak between 14:00 and 16:00 h (At: 25.9°C and 2.41 kPa; At+8: 33.2°C and 4.1 kPa).
3.2. Determining spectral signature stability throughout daily progression analysis
The spectral reflectance signature of plants growing under C, WS, and WS+T treatments over time (D1 to D3) varied among genotypes according to the CT performance (Figure 1). The spectral reflectance of low CT genotypes (LCT-HGY and LCT-LGY) showed greater variation between days (Figures 1A–F) than did that of high CT genotypes (HCT-LGY and HCT-HGY) (Figures 1G–L). Although somewhat less evident than under stress conditions, this behavior was also reflected in the control condition. The major changes in high CT genotypes were observed on D2 (red lines in Figures 2G, J), while the greatest changes were found in the low CT genotypes in D3 (blue lines in Figures 2A, D). In addition, genotypes showed different patterns throughout the day according to their CT. The mean reflectance signatures of low CT genotypes continued to decrease from D2 to D3, with respect to D1 (Figures 2A–F), while in high CT genotypes, reflectance stopped changing or increased in the direction of their initial condition in D1 (Figures 2G–L). The effects of WS and WS+T treatments on the spectral signature performance was lower in low CT genotypes compared to high CT genotypes, particularly in the UTALCA experiment (Figure 2). In the case of HCT-HGY, greater differences were observed in the patterns of the spectral signature under WS and WS+T. Under WS treatment (Figure 2H), the reflectance in the VIS and the first part of the NIR increased during D2 and D3 with respect to D1 (negative differences), but at wavelength > 1,400 nm, the reflectance decreased compared to D1 (positive values). While under WS+T conditions, in almost the entire spectra, the reflectance during D2 and D3 increases, compared to D1 (Figure 2J). In the case of HCT-LGY under WS, the spectral reflectance was reduced on D2, compared to D1, but the opposite was observed in D3 (Figure 2K). The same tendency was observed for the WS+T treatment.
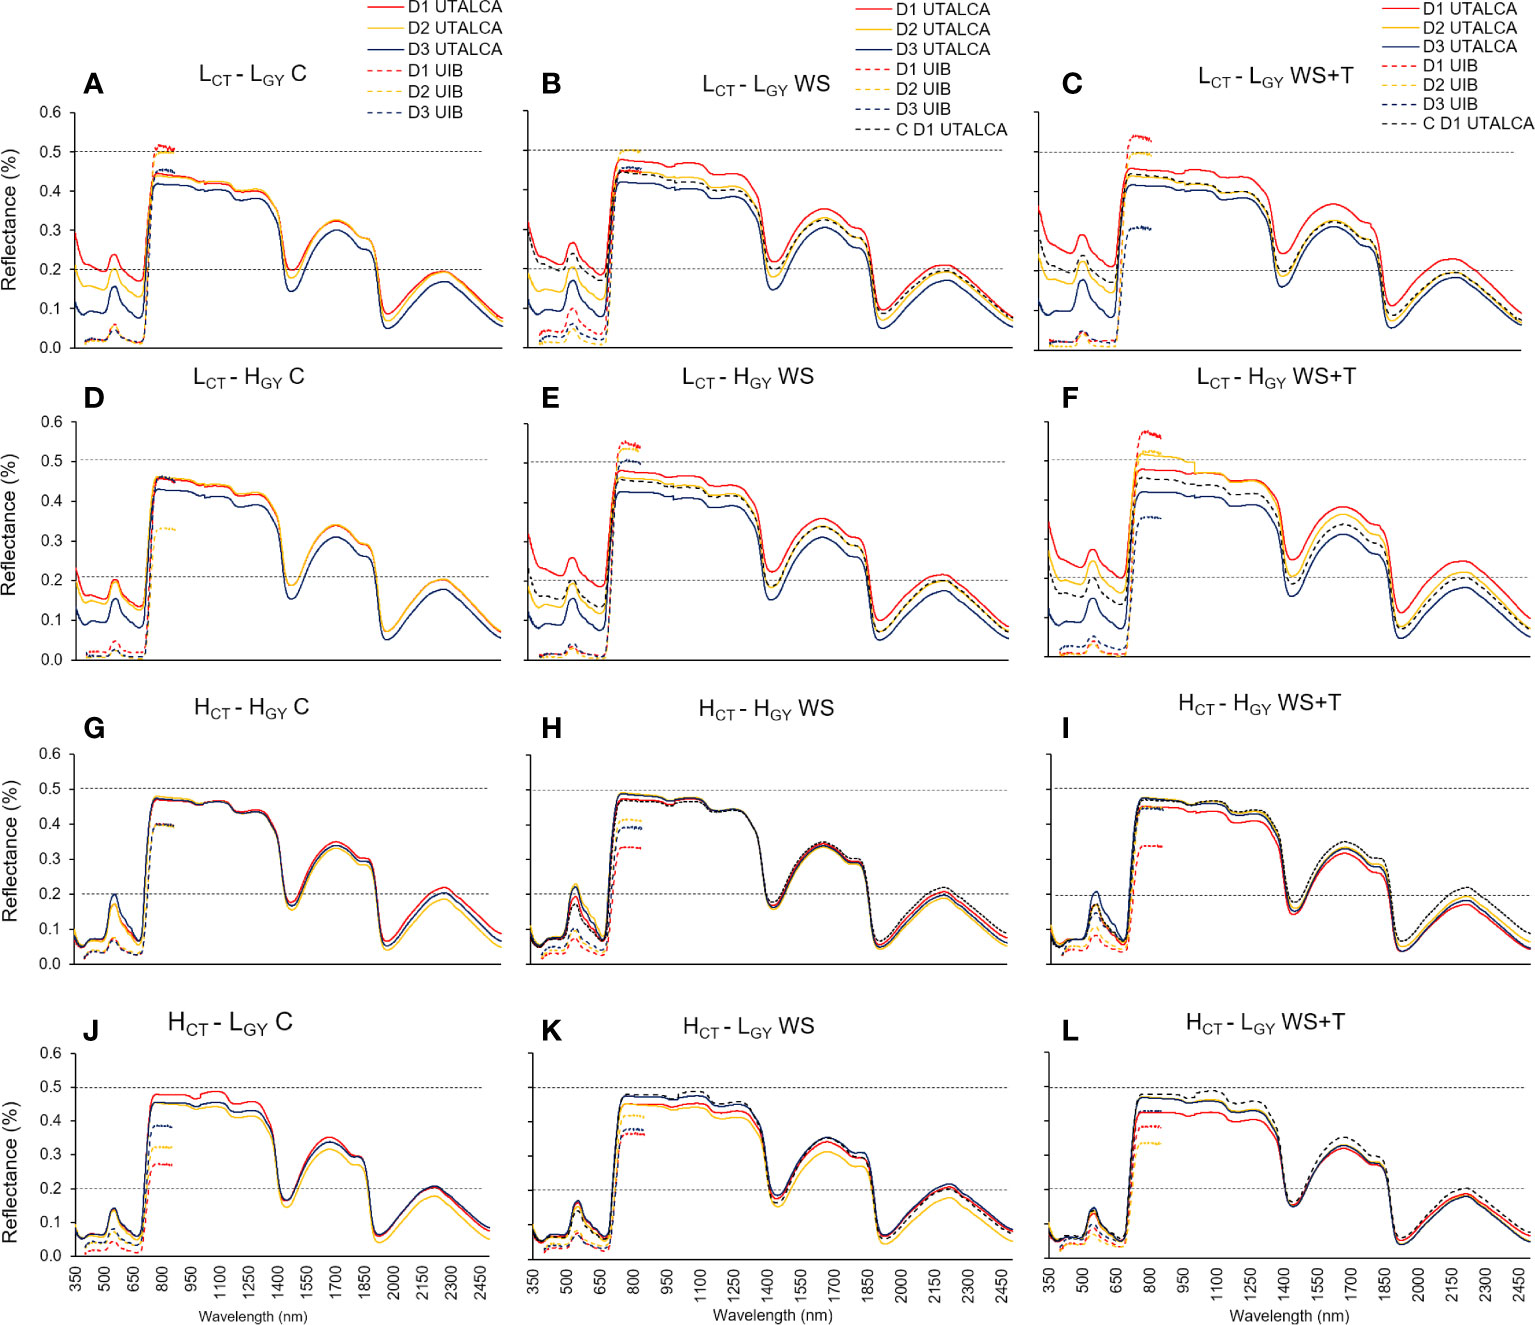
Figure 1 Leaf spectral signatures assessed on three days (D1; red line, D2; yellow line; and D3; blue line) in four spring bread wheat genotypes, growing under control conditions (C, substrate ~75% pot water capacity and ambient temperature) (A, D, G, J), soil water stress (WS, substrate of ~30 and 50% of the pot water capacity in the UTALCA and UIB experiments, respectively; ambient temperature) (B, E, H, K), and combined soil water and heat stress conditions (WS+T, substrate of ~30 and 50% of the pot water capacity in the UTALCA and UIB experiments, respectively; ambient temperature increased by around 5 – 7°C) (C, F, I, L). According to the canopy temperature (CT; high-H and low-L) and productivity (GY; high-H and low-L), genotypes were designated as: LCT-LGY, LCT-HGY, HCT-HGY, and HCT-LGY. Measurements were performed just before the plateau of the maximum daily atmospheric demand for water (13:00 h). Data from the UIB experiment ranges from 400 to 900 nm. For reference purposes only, the horizontal black dashed lines represent 20% and 50% of reflectance; the dashed red line on the WS and WS+T curves represents the D1 leaf spectral signature in C; n = 9 in the UTALCA experiment and n = 6 in the UIB experiment.
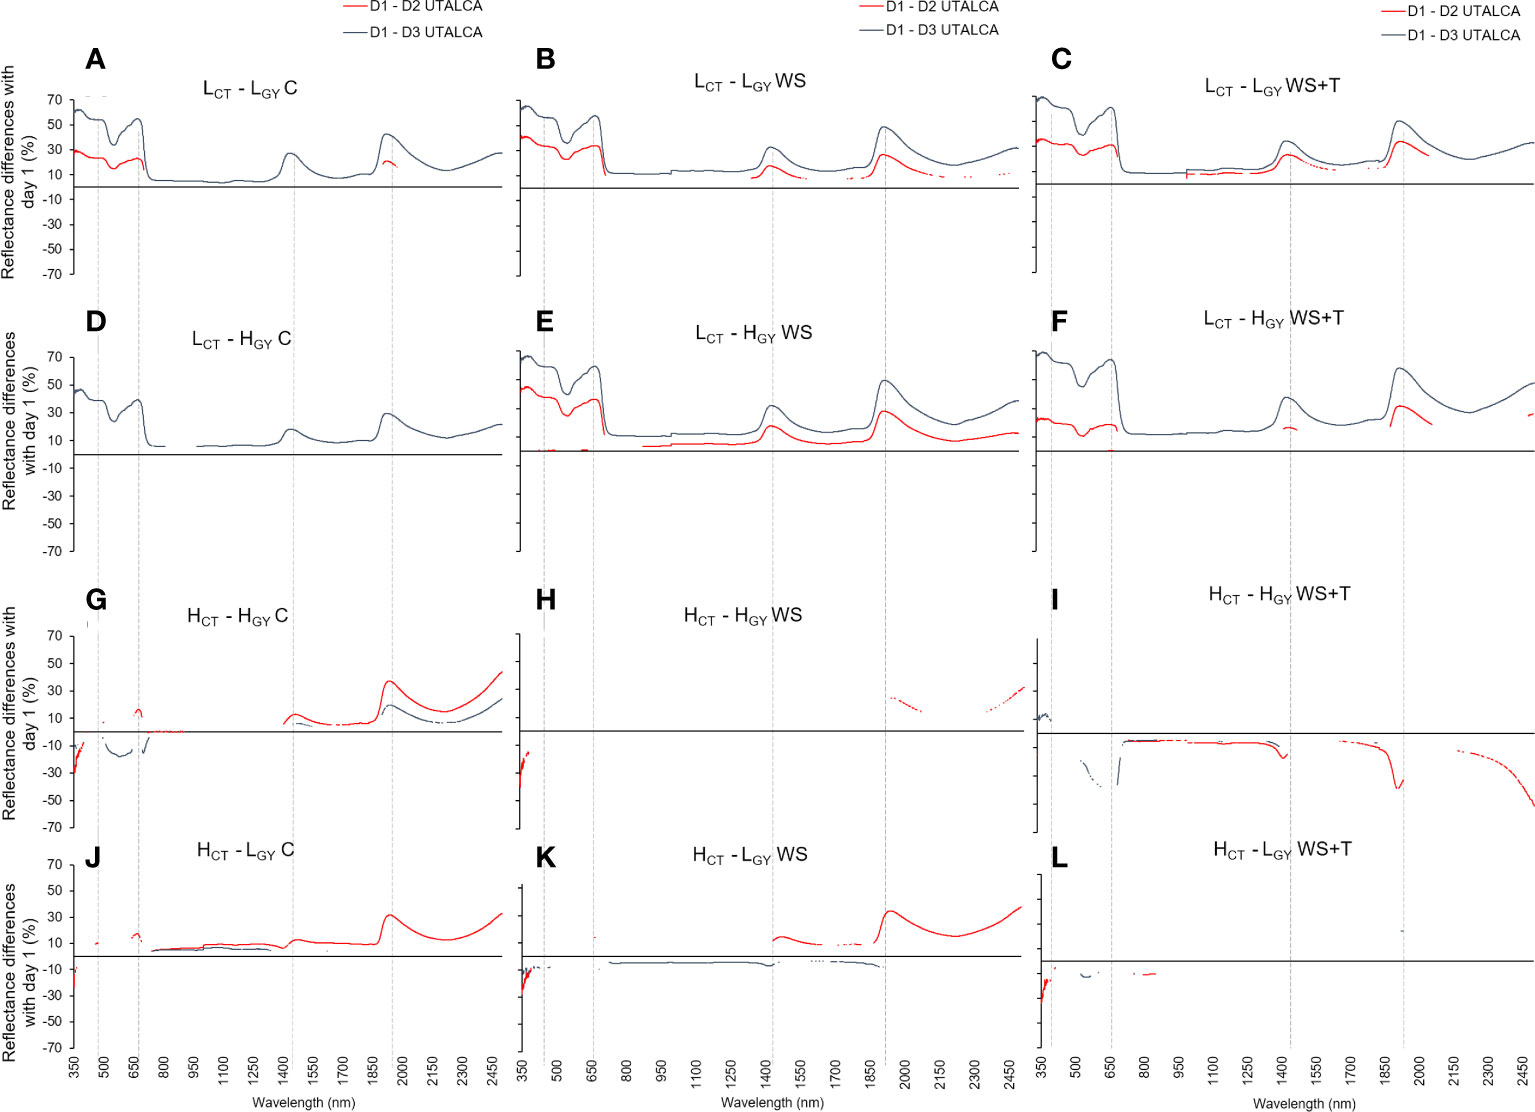
Figure 2 Statistical differences in spectral reflectance calculated as the percentage change in the wavelength level between days of assessment (D1 to D3: D1-D2 red line, and D1-D3 blue line; at each wavelength, interruptions in the lines indicate sections without statistical differences, p < 0.05) in four spring bread wheat. Genotypes and treatments are indicated in Figure 1. Measurements were performed just before the plateau of the maximum daily atmospheric demand for water (~13:00 h). n = 9. The dashed vertical lines indicate the peaks around 380, 680, 1450, and 1950 nm.
Unlike in the UTALCA experiment, where the differences between the reflectance were detected from 350 nm onwards, especially in low CT genotypes, in the UIB experiment, the divergences were evident at 700 – 900 nm. However, in both experiments the electromagnetic spectrum regions with the greatest percentage of change in relation to D1 were 350 – 740 nm (high CT: -33 – 15%; low CT: 2 – 70%), 1350 – 1600 nm (low CT: 8 – 36%; high CT: -17 – 12%), and 1850 – 2500 nm (low CT: 0 - 47%; high CT: -12 – 43%) (Figure 2). There were four peaks that differed in intensity between CT groups: 380, 680, 1,450, and 1,950 nm.
3.3. Determining spectral signature stability through diurnal progression analysis
Spectral signature changes recorded within the day (10:00 – 16:30 h) (Figures 3, 4) followed similar patterns to those described for the daily progression analysis. Low CT genotypes, also showed greater differences than high CT genotypes, when comparing the changes in spectral signatures recorded at 10:00 with those recorded later in the afternoon. The spectral signature performance at 12:30 and 16:30 h appears to be the same in the high CT genotypes (Figures 4H, I, K, L); also, under the control conditions in the four genotypes (Figures 4A, D, G, J).
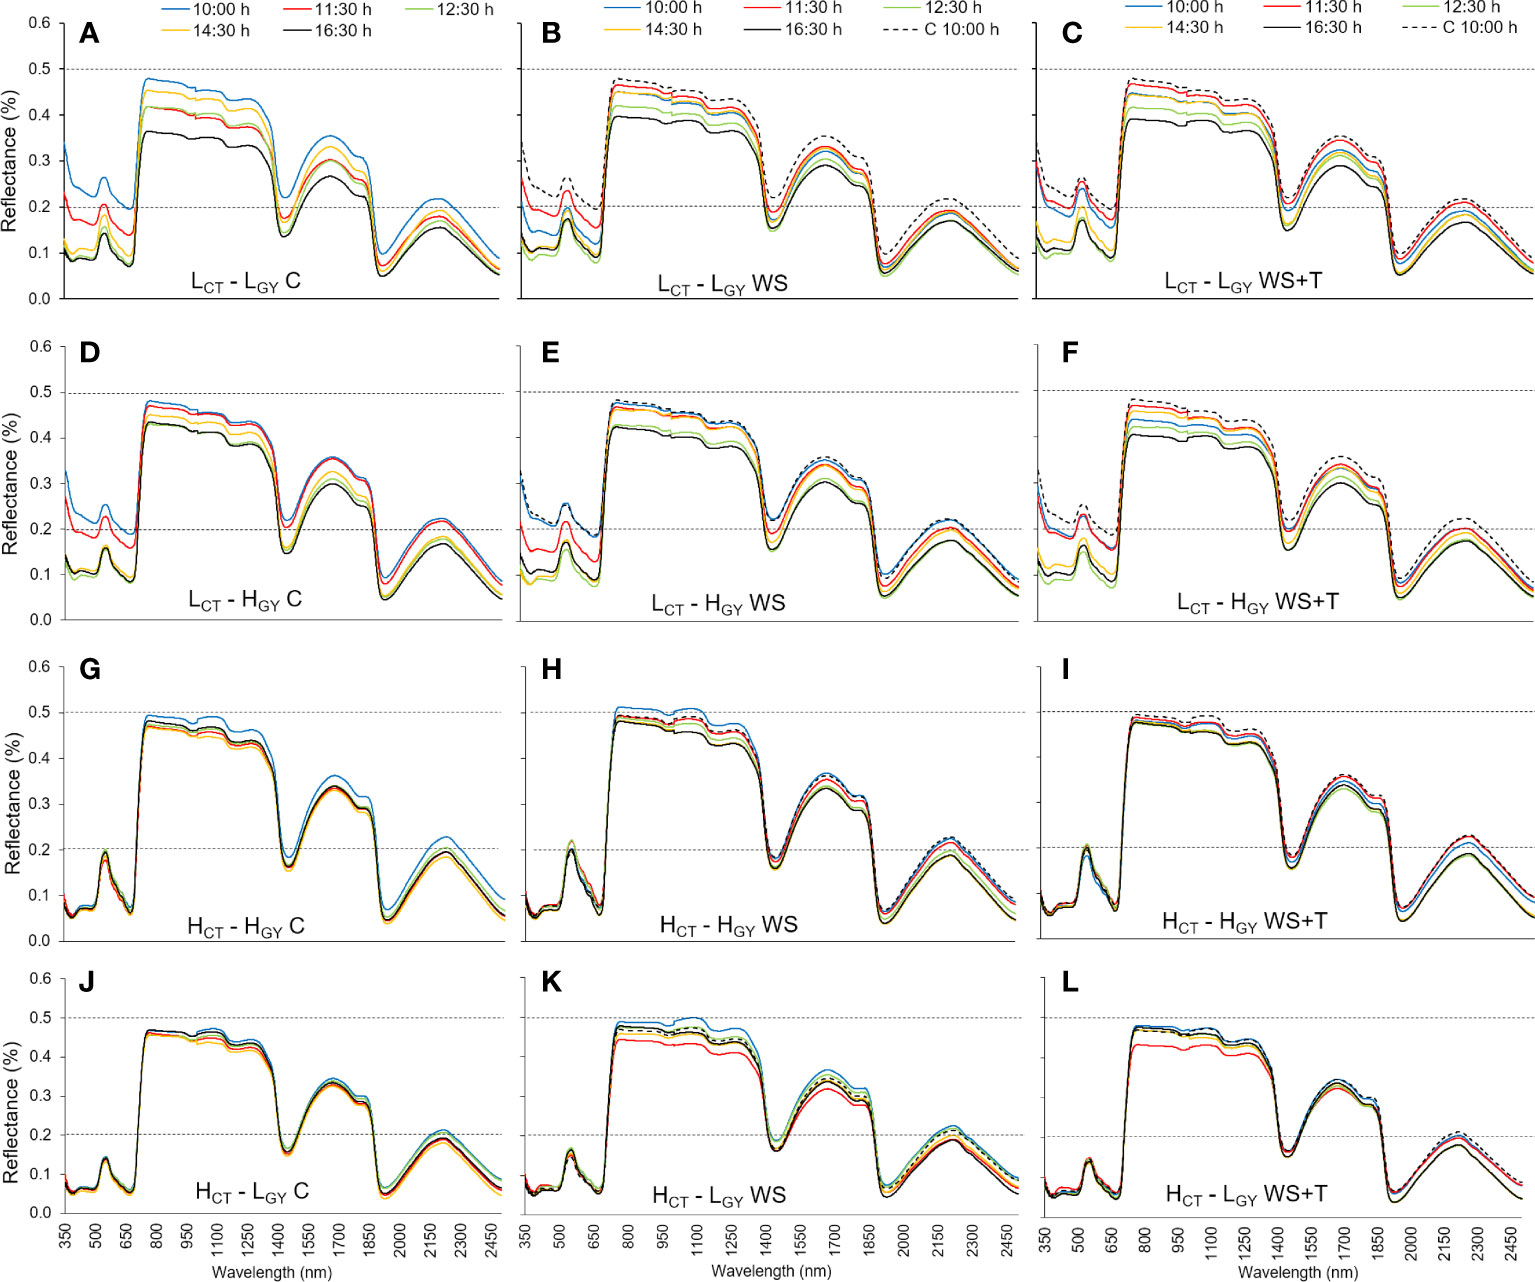
Figure 3 Leaf spectral signatures throughout the third day of evaluation (10:00 h: blue line, 11:30 h: red line, 12:30 h: green line, 14:30 h: orange line, and 16:30 h: black line) of four spring bread wheat genotypes. Genotypes and treatments are indicated in Figure 1. For reference purposes only, the horizontal black dashed lines represent 20% and 50% reflectance; the 10:00 h C measurements of each genotype are represented as dashed blue lines on the WS and WS+T signatures; n = 9.
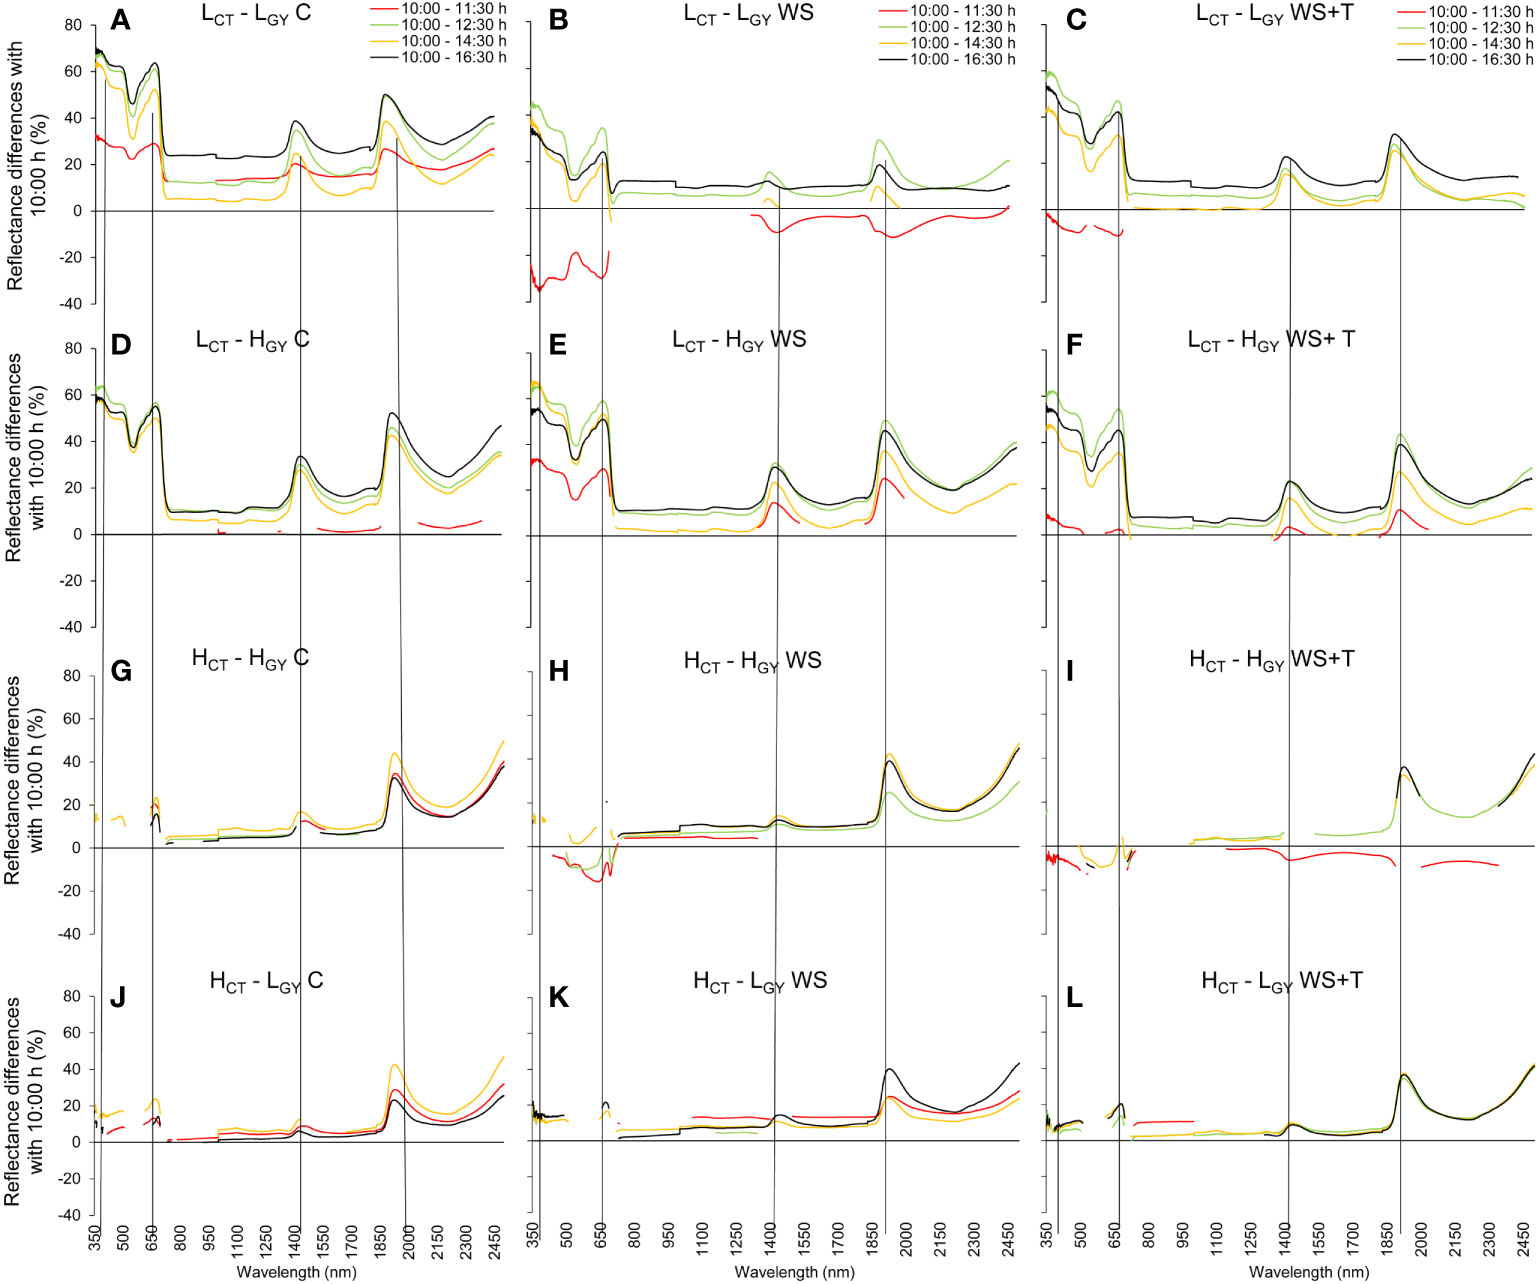
Figure 4 Statistical differences in the spectral reflectance calculated as the percentage change in wavelength level during the day (10:00/11:30 h red line, 10:00/12:30 h green line, 10:00/14:30 h yellow line, and 10:00/16:30 h black line; at each wavelength, interruptions in the lines indicate sections without statistical differences, p < 0.05) of four spring bread wheat genotypes. Genotypes and treatments are indicated in Figure 1. n = 9. The dashed vertical lines indicate the peaks around 380, 680, 1450, and 1950 nm.
3.4. Gas exchange assessments
Regarding the initial selection of the genotypes by leaf temperature (Table 1), the results show that these CT characteristics were maintained in the present study when analyzing the gas exchange performance of the genotypes (Figures 5A–C). The ANOVA performed for each day of evaluation, at UTALCA experiment, shows statistical differences between genotypes in gs, An, Fm, Fm´, Fo and ~Fo´ during the three days, meanwhile Tl just on D3. In the case of the treatments, each day shows significant differences among them. For the interaction between genotype and treatment, we found significant differences for the gs and the fluorescence variables (Supplementary Table 2). In the case of the UIB experiment, the genotypes showed statistical differences in An on the three days. During D2, both low CT genotypes showed lower Tl (4°C minus) than high CT genotypes. in terms of the treatments, similar to UTALCA, showed statistical differences at each day. In D1, the three variables have significative interactions (Supplementary Table 2). In general terms, the high CT genotypes had lower gs and An values across both experiments (Figures 5D–I), than the low CT. In consequence, the leaf temperature of both high CT genotypes was higher compared to low CT genotypes. In all genotypes, gs and An were strongly reduced under WS and WS+T (Figures 5 D–I). The two genotypes with lower CT tend to had higher fluorescence level during D1 and D3. Genotypes under C conditions in the UTALCA experiment showed similar gs and An levels during the three days of the experiments (Figures 5D–I).
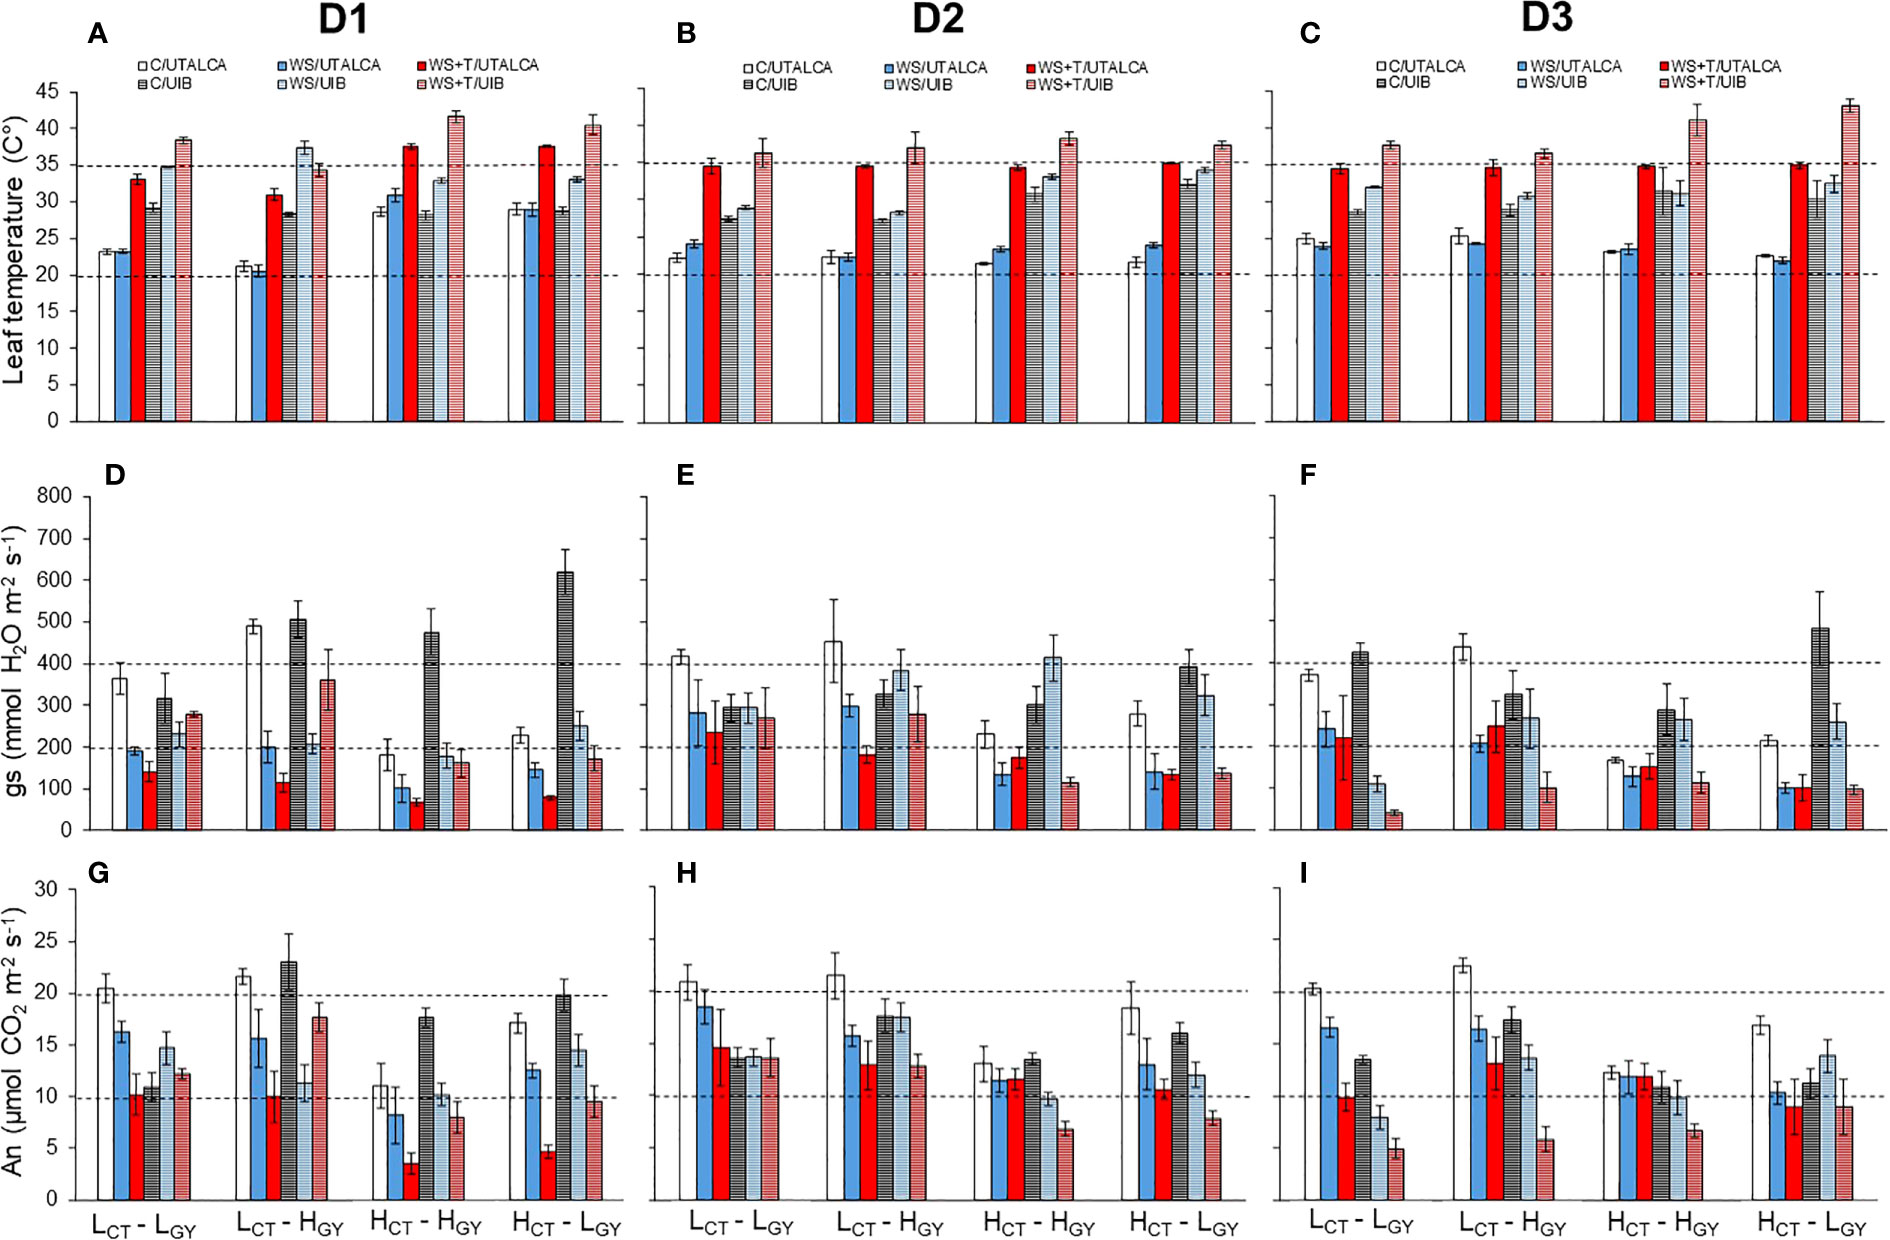
Figure 5 Leaf temperature (Tl) (A–C), stomatal conductance (gs) (D–F), and leaf net CO2 assimilation (An) (G–I) of four genotypes evaluated at three days: D1 (A, D, G), D2 (B, E, H), and D3 (C, F, I). Genotypes and treatments are indicated in Figure 1. Fully shaded columns represent data collected in the UTALCA experiment, while partly shaded columns are data collected in the UIB experiment. The genotypes in each figure are ordered from highest to lowest gs according to C in the UTALCA experiment. Values are averages ± standard error (n = 3).
The high CT genotypes were the most affected by the combined stress conditions on D1, however gs and An progressively reached the same values of WS conditions on D3 (Figures 5E, F, H, I). In both trials, HCT-HGY show the greater capacity to overcome the WS+T condition than HCT-LGY, which in the case of the UTALCA experiment achieves almost similar gs values than under C.
The relationship between An and gs indicated that for a given value of gs, An was higher in the UTALCA experiment, in all genotypes (Figure S3). Although with different IRGAs, it is interesting to note that at the same gs level, the differences in An between experiments were lesser in the high-yielding genotypes (Figures S3A, C) than in the low-yielding genotypes (LCT-LGY and HCT-LGY) (Figures S3B, D). Greater genotypic differences were found at values of gs above 150 mmol H2O m-2 s-1 in the UTALCA experiment, while at UIB, genotypic variability was evident at lower gs levels (Figures. S3E, F). In these sense, two groups were identified according to CT (i.e., Lower and High). Despite the dissimilarities associated with experiment location, the HCT-HGY genotype always had a lower ratio An/gs (Figures S3E, F).
3.5. Relationship between spectral reflectance indices with environmental and physiological variables
The results of the correlation analysis between the studied SRIs and both the environmental (VPD, HR, air temperature) and foliar (temperature and anthocyanins) characteristics varied according to the index (Table 3). Thus, at compare NDVI and PRI, the first one showed a wide and significance association in LCT-LGY and LCT-HGY. On the other hand, correlations with the same genotypes showed higher variability with PRI.
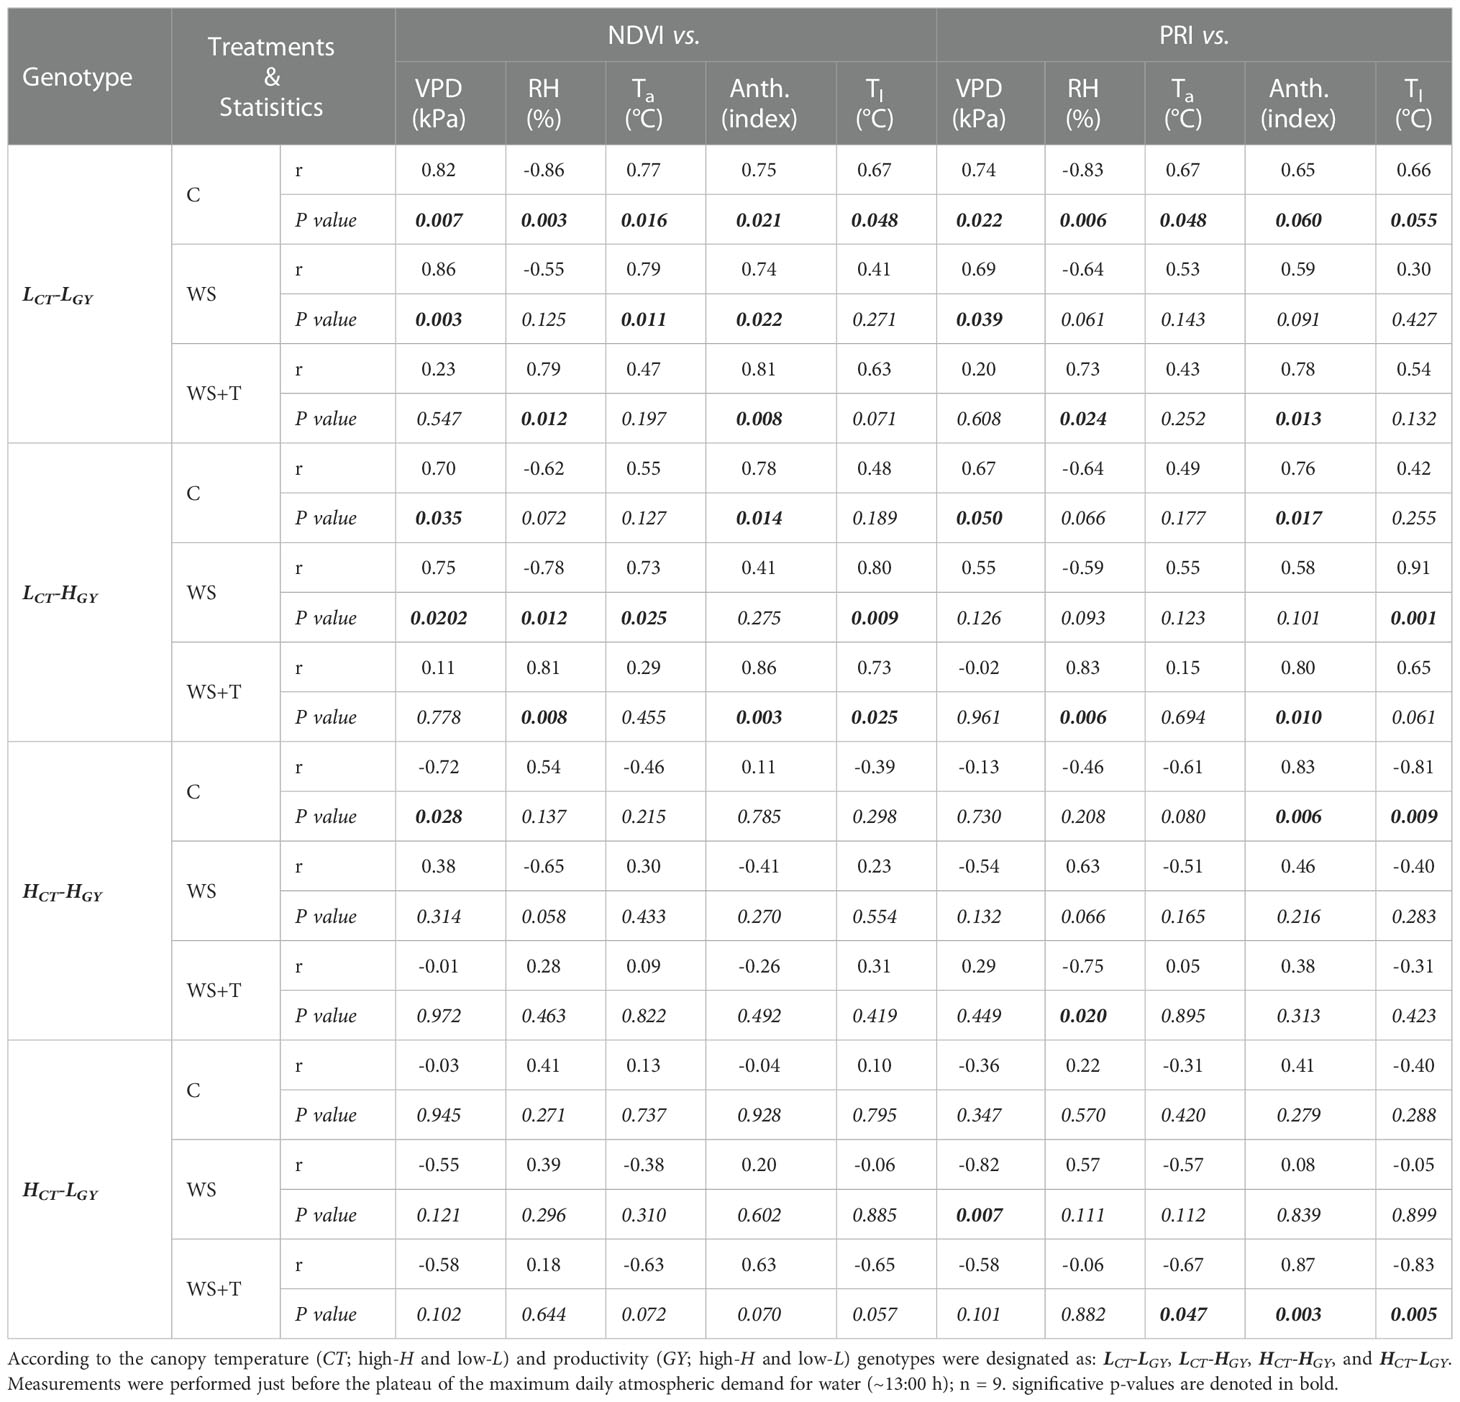
Table 3 Pearson correlation analyses (r and p-values) of the relationships between spectral reflectance indexes (normalized difference vegetation index; NDVI and photochemical index; PRI), with the vapor pressure deficit (VPD), relative humidity (RH), air temperature (Ta), anthocyanins content (Anth), and leaf temperature (Tl) in the UTALCA experiment during the 2018 season, for four spring bread wheat genotypes on three days of evaluation for plants growing under control conditions (C), soil water stress (WS) and combined soil water and heat stress conditions (WS+T).
3.6. Consistency between reflectance and fluorescence assessments
A similar trend of changes was observed when comparing daily mean values of reflectance at 380, 680, 1,450 and 1,950 nm (where differences were most evident when comparing D1 versus D2 and D3), with daily mean values of chlorophyll fluorescence variables. In other words, the low TC genotypes showed greater variability at wavelengths 380, 680, 1,450, 1,950 nm and in Fo, ~Fo’, Fm and Fm’, from D1 to D3 (Figures 6A–D), whereas in the high TC genotypes smaller changes were observed between days. In fact, HCT-HGY had no change in Fm and Fm’ between days, whereas HCT-LGY had the same performance in Fo and ~Fo’ (Figures 6E–H). Also, higher and significative correlations of gas exchange (Tl, gs and An) and fluorescence variables with the wavelength’s reflectance (at 380, 680, 1,450 and 1,950 nm) were found (Supplementary Table 1). During D1, the gas exchange and fluorescence variables have higher correlations with the reflectance of the wavelengths especially under WS and WS+T. The physiological traits correlate better with the 380 and 680 nm; gs and An, correlate better with 380 nm, while fluorescence variables with the four wavelengths.
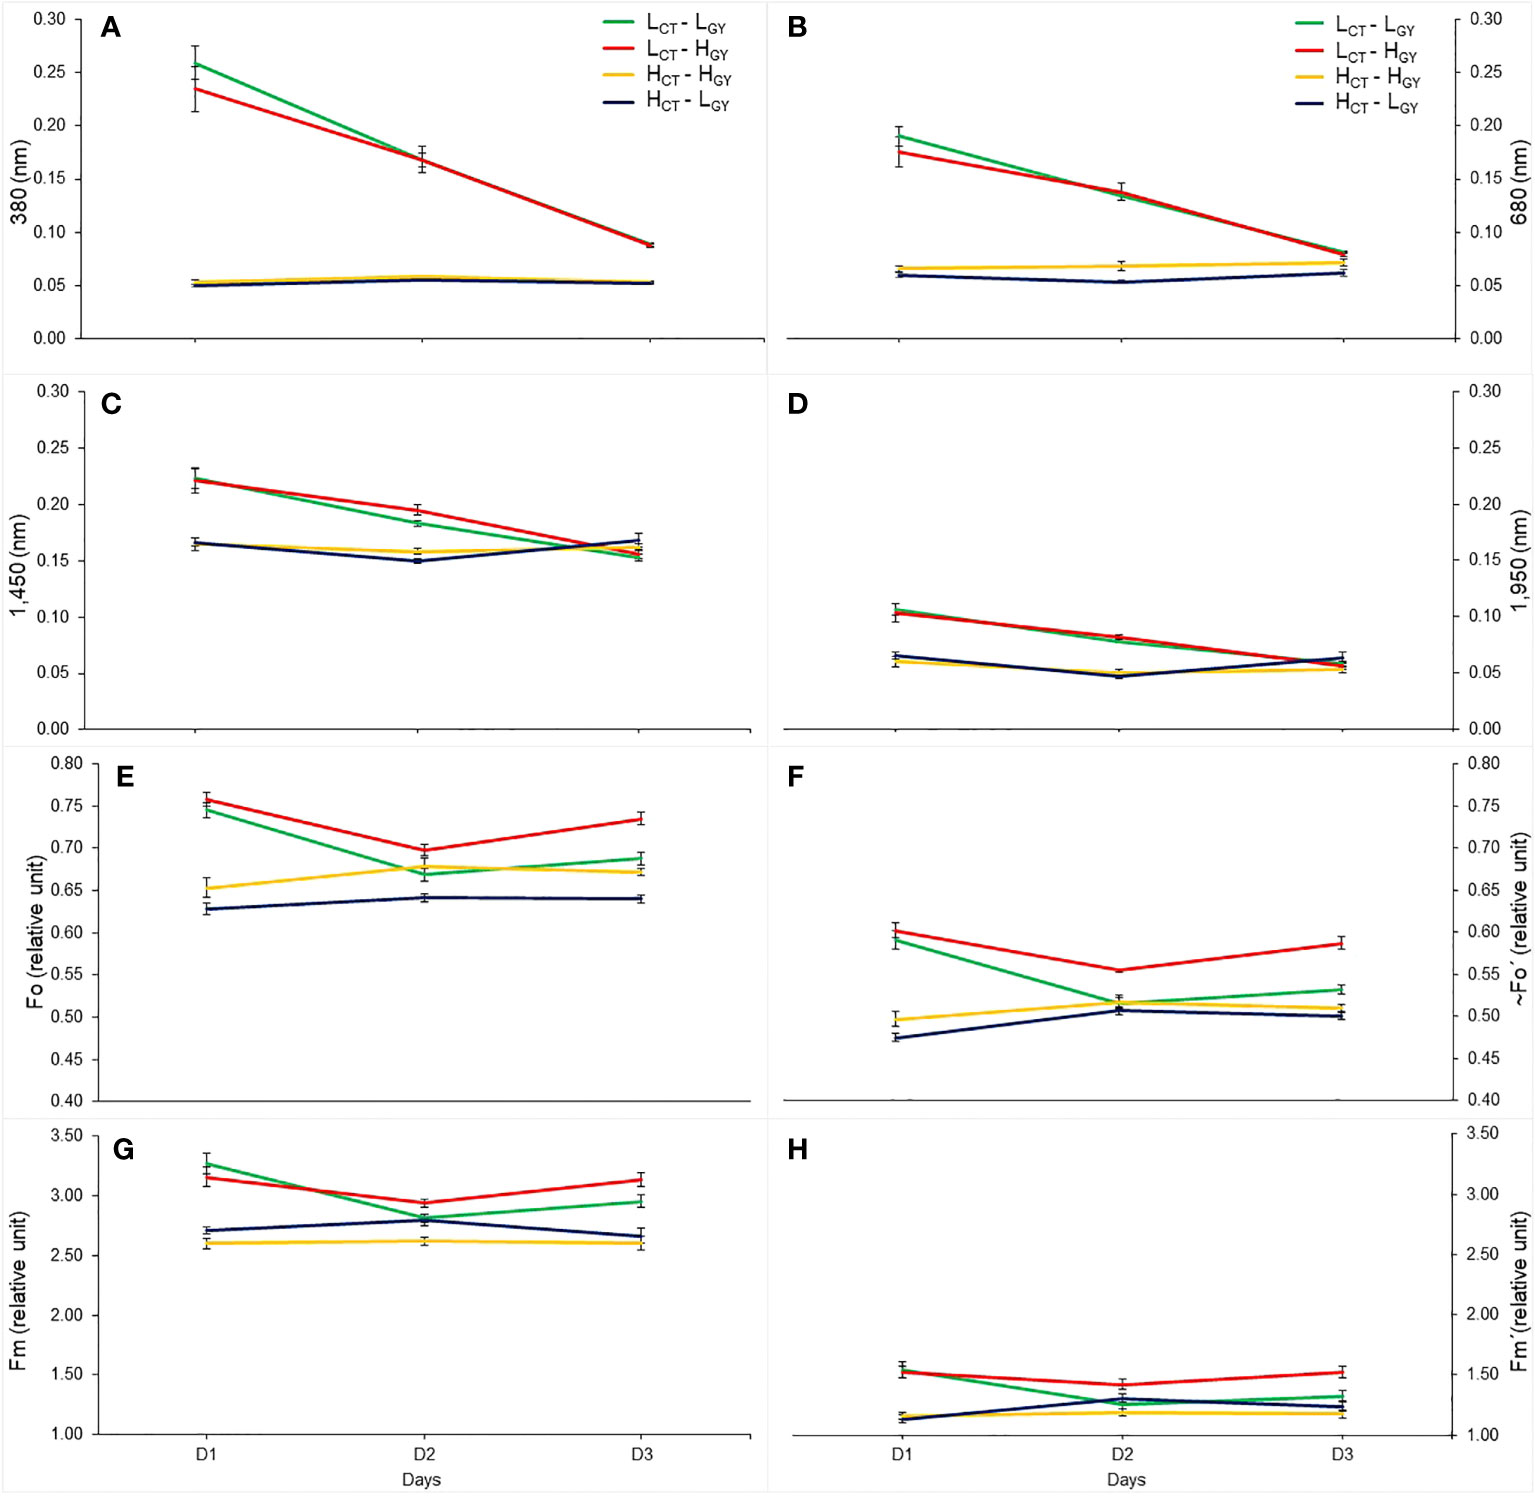
Figure 6 The mean value, considering the three treatments, of the selected wavelength reflectance (380 nm; (A), 680 nm; (B), 1,450 nm; (C), 1,950 nm; (D), and chlorophyll fluorescence variables (Fo; E, ~Fo´; F, Fm; G, Fm´; H), at UTALCA experiment, measured in each genotype (LCT-LGY; green, LCT-HGY, red; HCT-HGY; orange, HCT-LGY, blue), on the three days of evaluations (D1, D2, and D3). Values are averages ± standard error per day (n = 9).
4. Discussion
The environmental data (Table 2), and specifically the range of ambient temperatures and VPD, suggest that plants at UTALCA under WS+T were subjected to a moderate atmospheric demand (i.e., 1.5 KPa) and moderate heat stress (i.e., 32°C) (Lizana and Calderini, 2013). It has been reported that gas exchange, specifically gs, is reduced by around 17% in anthesis when plants are subject to an environment with heat shock of 32°C and full irrigation (Djanaguiraman et al., 2020). The results of this study showed a reduction of gs and An higher than 30% due to the plants being subjected to two stressor factors (water and heat shock). In the UIB experiment, in addition to higher VPD (> 3.5 KPa) in WS+T condition, the high night temperatures (night mean of 24°C at UIB, versus 13°C at UTALCA, data not shown) were also involved in the plant response to stress environment (i.e., spectral reflectance and gas exchange variables) (Fleitas et al., 2020; Fakhet et al., 2021). Furthermore, plants were exposed to severe environmental stress than in the UTALCA experiment.
Different studies report an anisohydric and isohydric performance of wheat genotypes, although early works classified mainly as anisohydric species (Henson et al., 1989; Tardieu and Simonneau, 1998), both types of stomatal control have been described in wheat genotypes. The anisohydric stomatal response is related to a less conservative water strategy in terms of transpiration (De Boeck et al., 2011; De Boeck et al., 2016). Genotypes with this type of response have higher rates of transpiration and gs, until drought becomes severe and stomatal closure occurs (Gallé et al., 2013; Liu et al., 2018). Different mechanisms are associated with this response such as ABA synthesis at root level (Gallé et al., 2013; Saradadevi et al., 2014; Saradadevi et al., 2016; Giusti et al., 2017), osmotic adjustment, the increase of osmoprotective compounds (Smirnov et al., 2020) and the increase of antioxidant capacity (Gallé et al., 2008) at leaf level (Smirnov et al., 2020). On the contrary, the isohydric stomatal response has the opposite behavior, more conservative water losses by faster stomatal closure under water stress conditions, due to a higher sensitivity to abscisic acid signals (Blum, 2015). In this study, low CT genotypes maintained higher gs levels in both stress environments, representing a nearly anisohydric stomatal response (Supplementary Figures S4E, F). On the other hand, the high CT genotypes in the WS+T condition, showed an isohydric stomatal regulation, based on a stronger reduction of gs and An at D1, reflecting a greater sensitivity to abscisic acid signals (Blum, 2015). With such stomatal control the dispersion of gs and An across days remains low and constant (Figures S4E, F); a more conservative strategy to maintain tissues water status, at the cost of low CO2 assimilation due to stomatal closure (Davies and Pereira, 1992; Maroco et al., 1997; Negin and Moshelion, 2017; Fallon et al., 2020). As in this study, Bayoumi et al. (2015) compared the plant CT of wheat genotypes at zenith, and were able to recognize the most contrasting isohydric and anisohydric material.
Spectral reflectance performance can be related to anisohydric or isohydric performance. For example, measuring at zenith the PRI and NDVI, Vaz et al. (2016) was able to differentiate between anisohydric and isohydric grapevines cultivars under drought conditions. As in this work, isohydric cultivar did not showed significant variations in their spectral reflectance signatures or in the NDVI and PRI pattern compared to the anisohydric cultivar. Similar results were reported by Sobejano-Paz et al. (2020) comparing species with different stomatal control under water deficit; maize (anisohydric) and soybean (isohydric).
In particular, the changes in the PRI are associated with xanthophyll activity which increase under stress (Gamon et al., 1992). Hence, the change of PRI reflects the variation of photosynthetic activity in a certain period (i.e., through the days and hours), as a response to the stomatal and xanthophylls activity under different environments (Gerhards et al., 2018). Likewise, changes in NDVI could be related to tissue hydric status, the photosynthetic activity considering the total canopy green area, or at the leaves level (chlorophylls content) (Gamon et al., 2015; Duan et al., 2017) and also, by stomatal control. In the present work, the low CT genotypes presented higher correlations of SRIs (NDVI higher than PRI) with both the anthocyanin content and the recorded environmental variables, compared to high CT genotypes (Table 3); nevertheless, the interpretation of NDVI is far from easy, and changes in the NDVI could occur by mechanisms other than chlorophylls loss (Atherton et al., 2020).
In addition, the daily behavior of the spectral signature (Figure 2) and the calculated SRIs (Supplementary Figure S1) were consistent with the pattern during the day (Figure 4 and Supplementary Figure S2); in all tested environmental conditions, increase in VPD and environmental temperature throughout the day resulted in changes in the spectral signature, greater in the low CT genotypes than in high CT ones, mainly in the VIS-NIR region. In fact, Weksler et al. (2020) report the association between changes in the transpiration rate and the spectral signature in pepper plants under different levels of potassium fertilization, evaluated every hour from 07:00 to 17:00 h; leaf spectral reflectance in the morning differed from those in the noon or afternoon, in the VIS-NIR region, as was observed in our results. In the case of the reflectance in the NIR region (700–1300 nm), it has been related to morphological characteristics of the leaf, such as cuticle, intercellular air space, the ratio between palisade mesophyll and spongy mesophyll (Peñuelas and Filella, 1998). In this sense, Willick et al. (2018) determined that, a drought tolerant wheat genotype differs from a susceptible in epidermal characteristics like, higher epicuticular wax density on the adaxial flag leaf surfaces and larger bulliform cells (Uddin and Marshall, 1988). We speculate that the evaluated genotypes in the present work may differ in these types of features, which may partly explain the differences in spectral responses, considering that they originated in different environments (breeding programs Table 1). These structural features have been associated with leaf water status and with several SRIs based on NIR wavelengths (El-Hendawy et al., 2019).
Significant peaks were found in the shortwave‐infrared range (SWIR, ~1,300 – 2,500 nm) that allow to differentiate the genotypes according to their CT (Supplementary Figures S4A−E, S5). The dynamics changes of reflectance peaks at 1,450 and 1,950 nm in the UTALCA experiment (daily and the diurnal progression analysis), could be explained by changes in tissue water content because that wavelength has been reported for estimating plant water status (Curcio and Petty, 1951; Palmer and Williams, 1974; Ihuoma and Madramootoo, 2019; Chandel et al., 2020). For example, El-Hendawy et al. (2019) identified wavelengths associated with changes in relative water content, developing a set of new SRIs for estimating leaf water status and grain yield of spring wheat grown under different irrigation regimes. Nevertheless, they also discuss about the low prediction capacity of SRIs when changes in the traits to be evaluated are slight to moderate (Lobos et al., 2014; Romero-Bravo et al., 2019).
It is well established that plants that maintain gs and An, under mild to moderate drought conditions (i.e., anisohydric stomatal control) have greater CO2 fixation, thus is usually associated with a greater tolerance to abiotic stress (Drew, 2006; Sade et al., 2009; Gallé et al., 2013; Rashid et al., 2018; Pawłowicz and Masajada, 2019). Nevertheless, the result of this work also suggests that the selection of higher CT (HCT-HGY) material not always will turn into a low GY genotype.
New sources of genotypic variability for GY improvement are difficult to find, and this may compromise food security (Ray et al., 2013). If an isohydric genotype is selected in a high GY-based breeding program for tolerance to drought, the genotype might have the capability to mobilize a higher proportion of carbohydrates to the grain; as in the case of HCT-HGY, probably due to an improved harvest index (HI; Carmo-Silva et al., 2017). Nevertheless, according to this study, it appears that GY would be more associated with differences in the intrinsic water use efficiency between locations (UTALCA vs. UIB) than with the CT pattern; high GY genotypes showed a smaller distance between both An/gs regressions (Supplementary Figures S3A, C) compared to the low GY genotypes (Supplementary Figures S3B, D). A similar tendency of lower dispersion in spectral signature and gas exchange parameters (gs and An) was found in both high CT genotypes (isohydrics), which could be associated with their lower response to environmental fluctuation (Supplementary Figures S4 , S5).
Finally, the present methodology, based on daily or diurnal progression analysis of spectral signature, appears to be a simple and consistent alternative to evaluate genotypic variability for a particular environmental condition (G x E), with the ability to discriminate between isohydric and anisohydric material; which is a trait used as selection criteria and for planning new crosses (Medina et al., 2019; Feng et al., 2020). This affirmation is reinforced when comparing the change in the daily and the diurnal progression of spectral signature (Figures 2, 4). In particular, the selected wavelengths (380, 680, 1,450 and 1,950 nm, Figures 6A–D), that allow to differentiate the genotypes performance better than Chlf variables (Fo, ~Fo´, Fm and Fm´) (Figures 6E–H). Also, the wavelengths showed higher and significant correlations with the chlorophyll fluorescence and gas exchange variables (Supplementary Table 1). Chlorophyll fluorescence and gas exchange parameters are widely used for genotype or cultivar selection under abiotic condition in different species (Flexas et al., 2000; Flexas et al., 2002; Estrada et al., 2015), however both measurements, at leaf level, are time consuming and therefore the number of measurements that can be performed is limited. In case of the Chlf measurements, methodologies have been developed to estimate sun-induced Chlf through spectral reflectance (proximally or remotely), to solve the time-consuming problem of measurements made at leaf level (Ni et al., 2019), increasing the number of genotypes evaluated in breeding programs (Azam et al., 2015; Bai et al., 2016; Song et al., 2018). Also, the two peaks of Chlf, centered at 685 nm and 740 nm (Corp et al., 2003; Meroni et al., 2009), have similar trends with Chlfvariables, especially the one at 740 nm (Supplementary Figure S6). It is interesting to note the shape of Fm and Fm´ of HCT-HGY across days, that could be an indicative of PSII photo-activity stability, through a constant capacity for harvesting and transfer of light energy in the mesophyll cells, which is reflected in Fm and Fm´ behavior. On the contrary, gas exchange measurements still to be performed at leaf level, for what they are time consuming evaluation. In this sense, different approximation has been probed through modeling procedures using spectral reflectance information, to predict the stomatal conduce, the net CO2 assimilation and other variables (Garriga et al., 2017; Sexton et al., 2021). One of the advantages of the spectral reflectance measurements it’s that they are faster (seconds per leaf or at canopy level), and the protocols of measurements at the field are easy to implement, at the difference of gas exchange, Chlf and leaf or canopy temperature. In the particular case of the last type of measurement, different works have been developed to predict the canopy temperature by spectral reflectance information under abiotic stress conditions (Babar et al., 2006b; Kumagai et al., 2022); these arguments highlight that the methodology presented in this works, based on the interpretation of spectral signature patterns in a particular environment, is valuable to be used in the genotype selection with desirable characteristics, such as the transpiration regulation.
5. Conclusion
Spectral reflectance analysis showed the possibility of using the spectral signature to differentiate the contrasting responses of wheat genotypes to VPD fluctuations across days and hours. The low CT genotypes were more responsive to the environmental conditions, showing greater differences in their spectral signatures (mainly in the VIS-NIR region) in each environment, when comparing measurements between days and between hours, than the high CT genotypes. Four wavelengths, two in the VIS (380 and 680 nm) and two in the SWIR (1,450 and 1,950 nm) were identified as revealing the highest differences in the low CT genotypes. Spectral reflectance indices were also effective at evaluating the genotype sensitivity to stress conditions. Higher and significant correlations between NDVI and PRI with VPD and RH were obtained in the more sensible low CT genotypes. The spectral signature differences in low CT genotypes were associated with an anisohydric response to WS and WS+T due to higher gs and lower Tl, while the higher CT showed an isohydric response.
This study highlights some perspectives in the use of spectral reflectance data for evaluating the plant response regarding to the changes in environmental conditions within a short period of time: i) the simple interpretation of the changes in the spectral signature by itself, due to environmental fluctuation, is a powerful tool for contrasting genotype performance (Lobos et al., 2019) related to isohydric or anisohydric responses, and ii) the wavelengths identified (380, 680, 1,450 and 1,950 nm) are interesting candidates to develop new spectral indices that allow evaluating genotypic sensibility to environmental changes.
The methodology used in this work reveals results that can be subsequently validated as a methodology using remote sensing tools in a large number of genotypes, to perform the first evaluations and segregation of genotypes in breeding programs.
Data availability statement
The raw data supporting the conclusions of this article will be made available by the authors, without undue reservation.
Author contributions
GL and FE contributed to the conception and design of the work. BC, CA-R, JG-T, JF, CD, FM-P, DC, IM, AM-E, MG, JA, and AP performed the analysis, and interpretation of data for the work. CD contributed to the experimental design, build of chambers, and measurements performed in UIB experiment in Spain. GL, JF, JA, AP, and FE collaborated to generate and validate the version to be published. All authors contributed to the article and approved the submitted version.
Funding
This work was funded by the National Commission for Scientific and Technological Research CONICYT/ANID (FONDECYT 1180252; FONDEF ID18I10214; FONDEQUIP EQM130073 and EQM190124) Anillo 2022 (ATE220001) and PID2019-106650RB-C21, MICINN, Spain.
Conflict of interest
The authors declare that the research was conducted in the absence of any commercial or financial relationships that could be construed as a potential conflict of interest.
Publisher’s note
All claims expressed in this article are solely those of the authors and do not necessarily represent those of their affiliated organizations, or those of the publisher, the editors and the reviewers. Any product that may be evaluated in this article, or claim that may be made by its manufacturer, is not guaranteed or endorsed by the publisher.
Supplementary material
The Supplementary Material for this article can be found online at: https://www.frontiersin.org/articles/10.3389/fpls.2022.1026323/full#supplementary-material
References
Araus, J. L., Kefauver, S. C. (2018). Breeding to adapt agriculture to climate change: affordable phenotyping solutions. Curr. Opin. Plant Biol. 45, 237–247. doi: 10.1016/j.pbi.2018.05.003
Atherton, J., Zhang, C., Oivukkamäki, J., Kulmala, L., Xu, S., Hakala, T., et al. (2020). “What does the NDVI really tell us about crops? insight from proximal spectral field sensors,” in Information and communication technologies for agriculture, theme I: Sensors. Eds. Bochtis, D. D., Lampridi, M., Petropoulos, G. P., Ampatzidis, Y., Pardalos, P. (Cham: Springer), 251–265.
Azam, F., Chang, X., Jing, R. (2015). Mapping QTL for chlorophyll fluorescence kinetics parameters at seedling stage as indicators of heat tolerance in wheat. Euphytica 202, 245–258. doi: 10.1007/s10681-014-1283-1
Babar, M. A., Reynolds, M. P., van Ginkel, M., Klatt, A. R., Raun, W. R., Stone, M. L. (2006a). Spectral reflectance indices as a potential indirect selection criteria for wheat yield under irrigation. Crop Sci. 46, 578–588. doi: 10.2135/cropsci2005.0059
Babar, M. A., Reynolds, M. P., van Ginkel, M., Klatt, A. R., Raun, W. R., Stone, M. L. (2006b). Spectral reflectance to estimate genetic variation for in-season biomass, leaf chlorophyll, and canopy temperature in wheat. Crop Sci. 46, 1046–1057. doi: 10.2135/cropsci2005.0211
Bai, G., Ge, Y., Hussain, W., Baenziger, P. S., Graef, G. (2016). A multi-sensor system for high throughput field phenotyping in soybean and wheat breeding. Comput. Electron. Agric. 128, 181–192. doi: 10.1016/j.compag.2016.08.021
Banerjee, K., Krishnan, P., Das, B. (2020). Thermal imaging and multivariate techniques for characterizing and screening wheat genotypes under water stress condition. Ecol. Indic 119, 106829. doi: 10.1016/j.ecolind.2020.106829
Bayoumi, T. Y., Abd EL-Mageed, A. M., Ibrahim, E. S., Mahmoud, S. A. (2015). Infrared thermal imaging as inno vative techniques with eco-physiological traits for monitoring water stress in wheat. J. Plant Prod. Sci. 4, 39–47. doi: 10.21608/JPPS.2015.7397
Blum, A. (2015). Towards a conceptual ABA ideotype in plant breeding for water limited environments. Funct. Plant Biol. 42, 502–513. doi: 10.1071/FP14334
Braun, H. J., Payne, T. (2013). “Fitomejoramiento en mega-ambientes,” in Fitomejoramiento fisiologico I: enfoques interdisciplinarios para mejorar la adaptación del cultivo. Eds. Reynolds, M. P., Pask, A. J. D., Mullan, D. M., Chavez-Dulanto, P. N. (CDMX: CIMMYT), 6–17.
Carmo-Silva, E., Andralojc, P. J., Scales, J. C., Driever, S. M., Mead, A., Lawson, T., et al. (2017). Phenotyping of field-grown wheat in the UK highlights contribution of light response of photosynthesis and flag leaf longevity to grain yield. J. Exp. Bot. 68, 3473–3486. doi: 10.1093/jxb/erx169
Cavender-Bares, J., Meireles, J. E., Couture, J. J., Kaproth, M. A., Kingdon, C. C., Singh, A., et al. (2016). Associations of leaf spectra with genetic and phylogenetic variation in oaks: prospects for remote detection of biodiversity. Remote Sens 8, 3. doi: 10.3390/rs8030221
Chandel, N. S., Rajwade, Y. A., Golhani, K., Tiwari, P. S., Dubey, K., Jat, D. (2020). Canopy spectral reflectance for crop water stress assessment in wheat (Triticum aestivum, l.). Irrig. Drain. 70, 321–331. doi: 10.1002/ird.2546
Corp, L. A., McMurtrey, J. E., Middleton, E. M., Mulchi, C. L., Chappelle, E. W., Daughtry, C. S. (2003). Fluorescence sensing systems: In vivo detection of biophysical variations in field corn due to nitrogen supply. Remote Sens. Environ. 86, 470–479. doi: 10.1016/S0034-4257(03)00125-1
Crisp, P. A., Ganguly, D., Eichten, S. R., Borevitz, J. O., Pogson, B. J. (2016). Reconsidering plant memory: intersections between stress recovery, RNA turnover, and epigenetics. Sci. Adv. 2, e1501340. doi: 10.1126/sciadv.1501340
Curcio, J. A., Petty, C. C. (1951). The near infrared absorption spectrum of liquid water. J. Opt. Soc Am. 41, 302–304. doi: 10.1364/JOSA.41.000302
Davies, W. J., Pereira, J. S. (1992). “Plant growth and water use efficiency,” in Crop photosynthesis: spatial and temporal determinants. Eds. Baker, N. R., Thomas, H. (New York: Elsevier), 213–233.
De Boeck, H. J., Bassin, S., Verlinden, M., Zeiter, M., Hiltbrunner, E. (2016). Simulated heat waves affected alpine grassland only in combination with drought. New Phytol. 209, 531–541. doi: 10.1111/nph.13601
De Boeck, H. J., Dreesen, F. E., Janssens, I. A., Nijs, I. (2011). Whole-system responses of experimental plant communities to climate extremes imposed in different seasons. New Phytol. 189, 806–817. doi: 10.1111/j.1469-8137.2010.03515.x
del Pozo, A., Brunel-Saldias, N., Engler, A., Ortega-Farias, S., Acevedo-Opazo, C., Lobos, G. A., et al. (2019). Climate change impacts and adaptation strategies of agriculture in Mediterranean-climate regions (MCRs). Sustainability 11, 2769. doi: 10.3390/su11102769
del Pozo, A., Yáñez, A., Matus, I. A., Tapia, G., Castillo, D., Sanchez-Jardón, L., et al. (2016). Physiological traits associated with wheat yield potential and performance under water-stress in a Mediterranean environment. Front. Plant Sci. 7. doi: 10.3389/fpls.2016.00987
Dixon, J., Braun, H. J., Crouch, J. (2009). “Overview: transitioning Wheat research to serve the future needs of the developing world,” in Wheat facts and futures. Eds. Dixon, J., Braun, H. J., Kosina, P., Crouch, J. (CDMX: CIMMYT), 1–19.
Djanaguiraman, M., Narayanan, S., Erdayan, E., Prasad, P. V. (2020). Effects of high temperature stress during anthesis and grain filling periods on photosynthesis, lipids and grain yield in wheat. BMC Plant Biol. 20, 12. doi: 10.1186/s12870-020-02479-0
Drew, M. C. (2006). “Stress physiology,” in Plant physiology. Eds. Taiz, L., Zeiger, E. (Sunderland: Sinauer Associates), 591–623.
Duan, T., Chapman, S. C., Guo, Y., Zheng, B. (2017). Dynamic monitoring of NDVI in wheat agronomy and breeding trials using an unmanned aerial vehicle. Field. Crops. Res. 210, 71–80. doi: 10.1016/j.fcr.2017.05.025
Elazab, A., Molero, G., Serret, M. D., Araus, J. L. (2012). Root traits and δ13C and δ18O of durum wheat under different water regimes. Funct. Plant Biol. 39, 379–393. doi: 10.1071/FP11237
El-Hendawy, S. E., Al-Suhaibani, N. A., Elsayed, S., Hassan, W. M., Dewir, Y. H., Refay, Y., et al. (2019). Potential of the existing and novel spectral reflectance indices for estimating the leaf water status and grain yield of spring wheat exposed to different irrigation rates. Agric. Water Manage. 217, 356–373. doi: 10.1016/j.agwat.2019.03.006
Estrada, F., Escobar, A., Romero-Bravo, S., González-Talice, J., Poblete-Echeverría, C., Caligari, P. D., et al. (2015). Fluorescence phenotyping in blueberry breeding for genotype selection under drought conditions, with or without heat stress. Sci. Hortic. 181, 147–161. doi: 10.1016/j.scienta.2014.11.004
Fakhet, D., Morales, F., Jauregui, I., Erice, G., Aparicio-Tejo, P. M., González-Murua, C., et al. (2021). Short-term exposure to high atmospheric vapor pressure deficit (VPD) severely impacts durum wheat carbon and nitrogen metabolism in the absence of edaphic water stress. Plants 10, 120. doi: 10.1016/10.3390/plants10010120
Fallon, B., Yang, A., Lapadat, C., Armour, I., Juzwik, J., Montgomery, R. A., et al. (2020). Spectral differentiation of oak wilt from foliar fungal disease and drought is correlated with physiological changes. Tree Physiol. 40, 377–390. doi: 10.1093/treephys/tpaa005
Feng, X., Zhan, Y., Wang, Q., Yang, X., Yu, C., Wang, H., et al. (2020). Hyperspectral imaging combined with machine learning as a tool to obtain high-throughput plant salt-stress phenotyping. Plant J. 101, 1448–1461. doi: 10.1111/tpj.14597
Fleitas, M. C., Mondal, S., Gerard, G. S., Hernández-Espinosa, N., Singh, R. P., Crossa, J., et al. (2020). Identification of CIMMYT spring bread wheat germplasm maintaining superior grain yield and quality under heat-stress. J. Cereal Sci. 93, 102981. doi: 10.1016/j.jcs.2020.102981
Flexas, J., Briantais, J. M., Cerovic, Z., Medrano, H., Moya, I. (2000). Steady-state and maximum chlorophyll fluorescence responses to water stress in grapevine leaves: a new remote sensing system. Remote Sens. Environ. 73, 283–297. doi: 10.1016/S0034-4257(00)00104-8
Flexas, J., Escalona, J. M., Evain, S., Gulías, J., Moya, I., Osmond, C. B., et al. (2002). Steady-state chlorophyll fluorescence (Fs) measurements as a tool to follow variations of net CO2 assimilation and stomatal conductance during water-stress in C3 plants. Physiol. Plant 114, 231–240. doi: 10.1034/j.1399-3054.2002.1140209.x
Gago, J., Daloso, D. M., Carriquí, M., Nadal, M., Morales, M., Araújo, W. L., et al. (2020). Mesophyll conductance: the leaf corridors for photosynthesis. Biochem. Soc Trans. 48, 429–439. doi: 10.1042/BST20190312
Gallé, Á., Csiszár, J., Benyó, D., Laskay, G., Leviczky, T., Erdei, L., et al. (2013). Isohydric and anisohydric strategies of wheat genotypes under osmotic stress: biosynthesis and function of ABA in stress responses. J. Plant Physiol. 170, 1389–1399. doi: 10.1016/j.jplph.2013.04.010
Gallé, A., Csiszar, J., Seceji, M., Tari, I., Guoth, A., Gyorgyey, J., et al. (2008). Monitoring the levels of phi and tau group GST genes in wheat cultivars under osmotic stress. Acta Biol. Szeged. 52, 95–96
Gamon, J. A., Kovalchuck, O., Wong, C., Harris, A., Garrity, S. R. (2015). Monitoring seasonal and diurnal changes in photosynthetic pigments with automated PRI and NDVI sensors. Biogeosciences 12, 4149–4159. doi: 10.5194/bg-12-4149-2015
Gamon, J. A., Penuelas, J., Field, C. B. (1992). A narrow-waveband spectral index that tracks diurnal changes in photosynthetic efficiency. Remote Sens. Environ. 41, 35–44. doi: 10.1016/0034-4257(92)90059-S
Garbulsky, M. F., Peñuelas, J., Gamon, J., Inoue, Y., Filella, I. (2011). The photochemical reflectance index (PRI) and the remote sensing of leaf, canopy and ecosystem radiation use efficiencies: a review and meta-analysis. Remote Sens. Environ. 115, 281–297. doi: 10.1016/j.rse.2010.08.023
Garriga, M., Romero-Bravo, S., Estrada, F., Escobar, A., Matus, I. A., del Pozo, A., et al. (2017). Assessing wheat traits by spectral reflectance: do we really need to focus on predicted trait-values or directly identify the elite genotypes group? Front. Plant Sci. 8. doi: 10.3389/fpls.2017.00280
Garriga, M., Romero-Bravo, S., Estrada, F., Méndez-Espinoza, A. M., González-Martínez, L., Matus, I., et al. (2021). Estimating carbon isotope discrimination and grain yield of bread wheat grown under water-limited and full irrigation conditions by hyperspectral canopy reflectance and multilinear regression analysis. Int. J. Remote Sens. 42, 2848–2871. doi: 10.1080/01431161.2020.1854888
Gerhards, M., Schlerf, M., Rascher, U., Udelhoven, T., Juszczak, R., Alberti, G., et al. (2018). Analysis of airborne optical and thermal imagery for detection of water stress symptoms. Remote Sens 10, 1139. doi: 10.3390/rs10071139
Giusti, L., Mica, E., Bertolini, E., De Leonardis, A. M., Faccioli, P., Cattivelli, L., et al. (2017). Micro RNAs differentially modulated in response to heat and drought stress in durum wheat cultivars with contrasting water use efficiency. Funct. Integr. Genomics 17, 293–309. doi: 10.1007/s10142-016-0527-7
Graeff, S., Claupein, W. (2007). Identification and discrimination of water stress in wheat leaves (Triticum aestivum l.) by means of reflectance measurements. Irrig. Sci. 26, 61–70. doi: 10.1007/s00271-007-0072-1
Henson, I. E., Jensen, C. R., Turner, N. C. (1989). Leaf gas exchange and water relations of lupins and wheat. i. shoot responses to soil water deficits. Func. Plant Biol. 16, 401–413. doi: 10.1071/PP9890401
Hernández-Barrera, S., Rodríguez-Puebla, C., Challinor, A. J. (2017). Effects of diurnal temperature range and drought on wheat yield in Spain. Theor. Appl. Climatol. 129, 503–519. doi: 10.1007/s00704-016-1779-9
Hernández-Clemente, R., Navarro-Cerrillo, R. M., Suárez, L., Morales, F., Zarco-Tejada, P. J. (2011). Assessing structural effects on PRI for stress detection in conifer forests. Remote Sens. Environ. 115, 360–2375. doi: 10.1016/j.rse.2011.04.036
Hoagland, D. R., Arnon, D. I. (1950). The water-culture method for growing plants without soil. California Agric. Exp. Stat. Circular 347, 1–32.
Ihuoma, S. O., Madramootoo, C. A. (2019). Sensitivity of spectral vegetation indices for monitoring water stress in tomato plants. Comput. Electron. Agric. 163, 104860. doi: 10.1016/j.compag.2019.104860
Jäger, K., Fábián, A., Eitel, G., Szabó, L., Deák, C., Barnabás, B., et al. (2014). A morpho-physiological approach differentiates bread wheat cultivars of contrasting tolerance under cyclic water stress. J. Plant Physiol. 171, 1256–1266. doi: 10.1016/j.jplph.2014.04.013
Kanbar, A., Shakeri, E., Alhajturki, D., Horn, T., Emam, Y., Tabatabaei, S. A., et al. (2020). Morphological and molecular characterization of sweet, grain and forage sorghum (Sorghum bicolor l.) genotypes grown under temperate climatic conditions. Plant Biosyst. Int. J. Deal. All. Asp. Plant Biol. 154, 49–58. doi: 10.1080/11263504.2019.1569568
Kudoyarova, G., Veselova, S., Hartung, W., Farhutdinov, R., Veselov, D., Sharipova, G. (2011). Involvement of root ABA and hydraulic conductivity in the control of water relations in wheat plants exposed to increased evaporative demand. Planta 233, 87–94. doi: 10.1007/s00425-010-1286-7
Kumagai, E., Burroughs, C. H., Pederson, T. L., Montes, C. M., Peng, B., Kimm, H., et al. (2022). Predicting biochemical acclimation of leaf photosynthesis in soybean under in-field canopy warming using hyperspectral reflectance. Plant Cell Environ. 45, 80–94. doi: 10.1111/pce.14204
Liu, L., Yang, X., Zhou, H., Liu, S., Zhou, L., Li, X., et al. (2018). Evaluating the utility of solar-induced chlorophyll fluorescence for drought monitoring by comparison with NDVI derived from wheat canopy. Sci. Total Environ. 625, 1208–1217. doi: 10.1016/j.scitotenv.2017.12.268
Lizana, X. C., Calderini, D. F. (2013). Yield and grain quality of wheat in response to increased temperatures at key periods for grain number and grain weight determination: considerations for the climatic change scenarios of Chile. J. Agric. Sci. 151, 209–221. doi: 10.1017/S0021859612000639
Lobos, G. A., Escobar-Opazo, A., Estrada, F., Romero-Bravo, S., Garriga, M., del Pozo, A., et al. (2019). Spectral reflectance modeling by wavelength selection: studying the scope for blueberry physiological breeding under contrasting water supply and heat conditions. Remote Sens. 11, 329. doi: 10.3390/rs11030329
Lobos, G. A., Poblete-Echeverría, C. (2017). Spectral knowledge (SK-UTALCA): software for exploratory analysis of high-resolution spectral reflectance data on plant breeding. Front. Plant Sci. 7. doi: 10.3389/fpls.2016.01996
Lobos, G. A., Poblete-Echeverría, C., Ahumada, L., Zúñiga, M., Romero, S., Escobar, A., et al. (2014). Fast and non-destructive prediction of gas exchange in olive orchards (Olea europaea l.) under different soil water conditions. Acta Hortic. 1057, 329–334. doi: 10.17660/ActaHortic.2014.1057.38
Magney, T. S., Vierling, L. A., Eitel, J. U., Huggins, D. R., Garrity, S. R. (2016). Response of high frequency Photochemical Reflectance Index (PRI) measurements to environmental conditions in wheat. Remote Sens. Environ. 173, 84–97. doi: 10.1016/j.rse.2015.11.013
Marcińska, I., Czyczyło-Mysza, I., Skrzypek, E., Filek, M., Grzesiak, S., Grzesiak, M. T., et al. (2013). Impact of osmotic stress on physiological and biochemical characteristics in drought-susceptible and drought-resistant wheat genotypes. Acta Physiol. Plant 35, 451–461. doi: 10.1007/s11738-012-1088-6
Maroco, J. P., Pereira, J. S., Chaves, M. M. (1997). Stomatal responses to leaf-to-air vapour pressure deficit in sahelian species. Funct. Plant Biol. 24, 381–387. doi: 10.1016/j.rse.2013.08.002
Medina, S., Vicente, R., Nieto-Taladriz, M. T., Aparicio, N., Chairi, F., Vergara-Diaz, O., et al. (2019). The plant-transpiration response to vapor pressure deficit (VPD) in durum wheat is associated with differential yield performance and specific expression of genes involved in primary metabolism and water transport. Front. Plant Sci. 9. doi: 10.3389/fpls.2018.01994
Medrano, H., Escalona, J. M., Bota, J., Gulías, J., Flexas, J. (2002). Regulation of photosynthesis of C3 plants in response to progressive drought: stomatal conductance as a reference parameter. Ann. Bot. 89, 895–905. doi: 10.1093/aob/mcf079
Meroni, M., Rossini, M., Guanter, L., Alonso, L., Rascher, U., Colombo, R., et al. (2009). Remote sensing of solar-induced chlorophyll fluorescence: Review of methods and applications. Remote Sens. Environ. 113, 2037–2051. doi: 10.1016/j.rse.2009.05.003
Mohanty, T. A., Singh, U. K., Singh, S. K., Singh, D., Kushwaha, N. (2020). Assessment of genetic diversity in sesame (Sesamum indicum l.) based on agro-morphological traits. Curr. Appl. Sci. Technol. 39, 100–107. doi: 10.9734/CJAST/2020/v39i2530890
Mullan, D. (2012). “Spectral radiometry,” in Physiological breeding I: interdisciplinary approaches to improve crop adaptation. Eds. Reynolds, M. P., Pask, A. J. D., Mullan, D. M. (CDMX: CIMMYT), 69–80.
Negin, B., Moshelion, M. (2017). The advantages of functional phenotyping in pre-field screening for drought-tolerant crops. Funct. Plant Biol. 44, 107–118. doi: 10.1071/FP16156
Ni, Z., Lu, Q., Huo, H., Zhang, H. (2019). Estimation of chlorophyll fluorescence at different scales: a review. Sensors 19, 3000. doi: 10.3390/s19133000
Ober, E. S., Clark, C. J., Le Bloa, M., Royal, A., Jaggard, K. W., Pidgeon, J. D. (2004). Assessing the genetic resources to improve drought tolerance in sugar beet: agronomic traits of diverse genotypes under droughted and irrigated conditions. Field Crops Res. 90, 213–234. doi: 10.1016/j.fcr.2004.03.004
Palmer, K. F., Williams, D. (1974). Optical properties of water in the near infrared. J. Opt. Soc Am. 64, 1107–1110. doi: 10.1364/JOSA.64.001107
Pawłowicz, I., Masajada, K. (2019). Aquaporins as a link between water relations and photosynthetic pathway in abiotic stress tolerance in plants. Gene 687, 166–172. doi: 10.1016/j.gene.2018.11.031
Peñuelas, J., Filella, I. (1998). Visible and near-infrared reflectance techniques for diagnosing plant physiological status. Trends Plant Sci. 3, 151–156. doi: 10.1016/S1360-1385(98)01213-8
Petrov, P., Petrova, A., Dimitrov, I., Tashev, T., Olsovska, K., Brestic, M., et al. (2018). Relationships between leaf morpho-anatomy, water status and cell membrane stability in leaves of wheat seedlings subjected to severe soil drought. J. Agron. Crop Sci. 204, 219–227. doi: 10.1111/jac.12255
Pinto, R. S., Lopes, M. S., Collins, N. C., Reynolds, M. P. (2016). Modelling and genetic dissection of staygreen under heat stress. Theor. Appl. Genet. 129, 2055–2074. doi: 10.1007/s00122-016-2757-4
Rashid, M. A., Andersen, M. N., Wollenweber, B., Kørup, K., Zhang, X., Olesen, J. E. (2018). Impact of heat-wave at high and low VPD on photosynthetic components of wheat and their recovery. Environ. Exp. Bot. 147, 138–146. doi: 10.1016/j.envexpbot.2017.12.009
Ray, D. K., Mueller, N. D., West, P. C., Foley, J. A. (2013). Yield trends are insufficient to double global crop production by 2050. PloS One 8, e66428. doi: 10.1371/journal.pone.0066428
Rebetzke, G. J., Rattey, A. R., Farquhar, G. D., Richards, R. A., Condon, A. T. G. (2012). Genomic regions for canopy temperature and their genetic association with stomatal conductance and grain yield in wheat. Funct. Plant Biol. 40, 14–33. doi: 10.1071/FP12184
Romero-Bravo, S., Méndez-Espinoza, A. M., Garriga, M., Estrada, F., Escobar, A., González-Martinez, L., et al. (2019). Thermal imaging reliability for estimating grain yield and carbon isotope discrimination in wheat genotypes: Importance of the environmental conditions. Sensors 19, 2676. doi: 10.3390/s19122676
Sade, N., Vinocur, B. J., Diber, A., Shatil, A., Ronen, G., Nissan, H., et al. (2009). Improving plant stress tolerance and yield production: is the tonoplast aquaporin SlTIP2; 2 a key to isohydric to anisohydric conversion? New Phytol. 181, 651–661. doi: 10.1111/j.1469-8137.2008.02689.x
Saradadevi, R., Bramley, H., Palta, J. A., Edwards, E., Siddique, K. H. (2016). Root biomass in the upper layer of the soil profile is related to the stomatal response of wheat as the soil dries. Funct. Plant Biol. 43, 62–74. doi: 10.1071/FP15216
Saradadevi, R., Bramley, H., Siddique, K. H., Edwards, E., Palta, J. A. (2014). Reprint of “Contrasting stomatal regulation and leaf ABA concentrations in wheat genotypes when split root systems were exposed to terminal drought”. Field Crops Res. 165, 5–14. doi: 10.1016/j.fcr.2014.06.025
Sexton, T., Sankaran, S., Cousins, A. B. (2021). Predicting photosynthetic capacity in tobacco using shortwave infrared spectral reflectance. J. Exp. Bot. 72, 4373–4383. doi: 10.1093/jxb/erab118
Silva-Pérez, V., De Faveri, J., Molero, G., Deery, D. M., Condon, A. G., Reynolds, M. P., et al. (2020). Genetic variation for photosynthetic capacity and efficiency in spring wheat. J. Exp. Bot. 71, 2299–2311. doi: 10.1093/jxb/erz439
Smirnov, O., Zinchenko, A., Karpets, L.А., Kovalenko, M., Taran, N. (2020). Changes of compatible solutes content in Triticum aestivum and Triticum dicoccum seedlings in response to drought stress. J. Agric. Sci. 2, 208–211. doi: 10.15159/jas.20.19
Sobejano-Paz, V., Mikkelsen, T. N., Baum, A., Mo, X., Liu, S., Köppl, C. K., et al. (2020). Hyperspectral and thermal sensing of stomatal conductance, transpiration, and photosynthesis for soybean and maize under drought. Remote Sens. 12, 3182. doi: 10.3390/rs12193182
Song, L., Guanter, L., Guan, K., You, L., Huete, A., Ju, W., et al. (2018). Satellite sun-induced chlorophyll fluorescence detects early response of winter wheat to heat stress in the Indian indo-gangetic plains. Glob. Change Biol. 24, 4023–4037. doi: 10.1111/gcb.14302
Sridhar, B. M., Han, F. X., Diehl, S. V., Monts, D. L., Su, Y. (2007). Spectral reflectance and leaf internal structure changes of barley plants due to phytoextraction of zinc and cadmium. Int. J. Remote Sens. 28, 1041–1054. doi: 10.1080/01431160500075832
Tardieu, F., Simonneau, T. (1998). Variability among species of stomatal control under fluctuating soil water status and evaporative demand: modelling isohydric and anisohydric behaviours. J. Exp. Bot. 49, 419–432.
Thomas, H., Ougham, H. (2014). The stay-green trait. J. Exp. Bot. 65, 3889–3900. doi: 10.1093/jxb/eru037
Tilman, D., Balzer, C., Hill, J., Befort, B. L. (2011). Global food demand and the sustainable intensification of agriculture. Proc. Natl. Acad. Sci. U.S.A. 108, 20260–20264. doi: 10.1073/pnas.1116437108
Trethowan, R. M., Reynolds, M., Sayre, K., Ortiz-Monasterio, I. (2005). Adapting wheat cultivars to resource conserving farming practices and human nutritional needs. Ann. Appl. Biol. 146, 405–413. doi: 10.1111/j.1744-7348.2005.040137.x
Uddin, M. N., Marshall, D. R. (1988). Variation in epicuticular wax content in wheat. Euphytica 38, 3–9. doi: 10.1007/BF00024805
Vaz, M., Coelho, R., Rato, A., Samara-Lima, R., Silva, L. L., Campostrini, E., et al. (2016). Adaptive strategies of two Mediterranean grapevines varieties (Aragonez syn. Tempranillo and Trincadeira) face drought: physiological and structural responses. Theor. Exp. Plant Physiol. 28, 205–220. doi: 10.1007/s40626-016-0074-6
Velu, G., Guzman, C., Mondal, S., Autrique, J. E., Huerta, J., Sing, R. P. (2016). Effect of drought and elevated temperature on grain zinc and iron concentrations in CIMMYT spring wheat. J. Cereal Sci. 69, 182–186. doi: 10.1016/j.jcs.2016.03.006
Vilmus, I., Ecarnot, M., Verzelen, N., Roumet, P. (2014). Monitoring nitrogen leaf resorption kinetics by near-infrared spectroscopy during grain filling in durum wheat in different nitrogen availability conditions. Crop Sci. 54, 284–296. doi: 10.2135/cropsci2013.02.0099
Vitrack-Tamam, S., Holtzman, L., Dagan, R., Levi, S., Tadmor, Y., Azizi, T., et al. (2020). Random forest algorithm improves detection of physiological activity embedded within reflectance spectra using stomatal conductance as a test case. Remote Sens. 12, 2213. doi: 10.3390/rs12142213
Weksler, S., Rozenstein, O., Haish, N., Moshelion, M., Walach, R., Ben-Dor, E. (2020). A hyperspectral-physiological phenomics system: measuring diurnal transpiration rates and diurnal reflectance. Remote Sens. 12, 1493. doi: 10.3390/rs12091493
Willick, I. R., Lahlali, R., Vijayan, P., Muir, D., Karunakaran, C., Tanino, K. K. (2018). Wheat flag leaf epicuticular wax morphology and composition in response to moderate drought stress are revealed by SEM, FTIR-ATR and synchrotron X-ray spectroscopy. Physiol. Plant 162, 316–332. doi: 10.1111/ppl.12637
Winterhalter, L., Mistele, B., Jampatong, S., Schmidhalter, U. (2011). High throughput phenotyping of canopy water mass and canopy temperature in well-watered and drought stressed tropical maize hybrids in the vegetative stage. Eur. J. Agron. 35, 22–32. doi: 10.1111/ppl.12637
Xie, Y., Wang, C., Yang, W., Feng, M., Qiao, X., Song, J. (2020). Canopy hyperspectral characteristics and yield estimation of winter wheat (Triticum aestivum) under low temperature injury. Sci. Rep. 10, 1–10. doi: 10.1038/s41598-019-57100-8
Yan, C., Song, S., Wang, W., Wang, C., Li, H., Wang, F., et al. (2020). Screening diverse soybean genotypes for drought tolerance by membership function value based on multiple traits and drought-tolerant coefficient of yield. BMC Plant Biol. 20, 1–15. doi: 10.1186/s12870-020-02519-9
Yudina, L., Sukhova, E., Gromova, E., Nerush, V., Vodeneev, V., Sukhov, V. (2020). A light-induced decrease in the photochemical reflectance index (PRI) can be used to estimate the energy-dependent component of non-photochemical quenching under heat stress and soil drought in pea, wheat, and pumpkin. Photosynth. Res. 146, 175–187. doi: 10.1007/s11120-020-00718-x
Zadoks, J. C., Chang, T. T., Konzak, C. F. (1974). Decimal code for the growth stages of cereals. Weed Res. 14, 415–421. doi: 10.1111/j.1365-3180.1974.tb01084.x
Zhang, D., Jiao, X., Du, Q., Song, X., Li, J. (2018). Reducing the excessive evaporative demand improved photosynthesis capacity at low costs of irrigation via regulating water driving force and moderating plant water stress of two tomato cultivars. Agric. Water Manage. 199, 22–33. doi: 10.1016/j.agwat.2017.11.014
Keywords: high-throughput plant phenotyping, spectroscopy, spectrometer, spectroradiometer, phenotype, physiological breeding
Citation: Estrada F, Flexas J, Araus JL, Mora-Poblete F, Gonzalez-Talice J, Castillo D, Matus IA, Méndez-Espinoza AM, Garriga M, Araya-Riquelme C, Douthe C, Castillo B, del Pozo A and Lobos GA (2023) Exploring plant responses to abiotic stress by contrasting spectral signature changes. Front. Plant Sci. 13:1026323. doi: 10.3389/fpls.2022.1026323
Received: 23 August 2022; Accepted: 23 December 2022;
Published: 20 January 2023.
Edited by:
Mukhtar Ahmed, Pir Mehr Ali Shah Arid Agriculture University, PakistanReviewed by:
Alexander Gallé, BASF (Belgium), BelgiumWeverton Pereira Rodrigues, Universidade Estadual da Região Tocantina do Maranhão (UEMASUL), Brazil
Copyright © 2023 Estrada, Flexas, Araus, Mora-Poblete, Gonzalez-Talice, Castillo, Matus, Méndez-Espinoza, Garriga, Araya-Riquelme, Douthe, Castillo, del Pozo and Lobos. This is an open-access article distributed under the terms of the Creative Commons Attribution License (CC BY). The use, distribution or reproduction in other forums is permitted, provided the original author(s) and the copyright owner(s) are credited and that the original publication in this journal is cited, in accordance with accepted academic practice. No use, distribution or reproduction is permitted which does not comply with these terms.
*Correspondence: Gustavo A. Lobos, Z2xvYm9zcEB1dGFsY2EuY2w=