 Hongyan Su1
 Mengfei Li
 Paul W. Paré
- 1State Key Laboratory of Arid Land Crop Science, Gansu Agricultural University, Lanzhou, China
- 2College of Pharmacy, Gansu University of Chinese Medicine, Lanzhou, China
- 3Department of Chemistry and Biochemistry, Texas Tech University, Lubbuck, TX, United States
Hypericum perforatum, commonly known as St John’s wort, is a perennial herb that produces the anti-depression compounds hypericin (Hyp) and hyperforin. While cool temperatures increase plant growth, Hyp accumulation as well as changes transcript profiles, alterations in leaf structure and genes expression specifically related to Hyp biosynthesis are still unresolved. Here, leaf micro- and ultra-structure is examined, and candidate genes encoding for photosynthesis, energy metabolism and Hyp biosynthesis are reported based on transcriptomic data collected from H. perforatum seedlings grown at 15 and 22°C. Plants grown at a cooler temperature exhibited changes in macro- and micro-leaf anatomy including thicker leaves, an increased number of secretory cell, chloroplasts, mitochondria, starch grains, thylakoid grana, osmiophilic granules and hemispherical droplets. Moreover, genes encoding for photosynthesis (64-genes) and energy (35-genes) as well as Hyp biosynthesis (29-genes) were differentially regulated with an altered growing temperature. The anatomical changes and genes expression are consistent with the plant’s ability to accumulate enhanced Hyp levels at low temperatures.
1 Introduction
Hypericum perforatum L. (St John’s wort) is a perennial herb widely distributed in Europe, Asia, Northern Africa and Northern America (Bagdonaitė et al., 2010). Aerial parts contain the metabolites hypericin (Hyp) and hyperforin that are used in traditional medicine as anti-depression, anti-viral, anti-microbial and anti-tumor agents, as well as other plant constituents such as flavonoids, tannins and volatile oils (Barnes et al., 2001; Napoli et al., 2018).
St John’s wort has traditionally been used as an external anti-infammatory and healing remedy for the treatment of swellings, wounds and burns. It is of interest recently due to new and important therapeutic applications (Bombardelli and Morazzoni, 1995; Nahrstedt and Butterweck, 1997; Erdelmeier, 1998). The species is characterized by the presence of different types of secretory structure: translucent glands or cavities, black nodules and secretory canals (Ciccarelli et al., 2001). The frequency and diversity of these secretory structures is evidence of the intense secretory activity of the species. Previous studies have found that H. perforatum growth and Hyp accumulation are affected by the germplasm source (Couceiro et al., 2006; Soták et al., 2016; Zhang et al., 2021) as well as environmental factors such as light quality (Germ et al., 2010; Najafabadi et al., 2019; Tavakoli et al., 2020; Karimi et al., 2022), drought (Gray et al., 2003), and temperature (Zobayed et al., 2005; Couceiro et al., 2006; Yao et al., 2019; Tavakoli et al., 2020; Kaundal et al., 2021). Lower temperatures can enhance plant growth and Hyp accumulation; indeed cooler growth conditions can significantly increase plant biomass by inducing gene expression that favor growth (Brunáková et al., 2015; Yao et al., 2019; Tavakoli et al., 2020). Previous studies have found that ca. 750 genes are differentially expressed and 150 genes are involved in plant growth, Hyp biosynthesis and/or environmental responses in H. perforatum seedlings at different temperatures (Su et al., 2021). Based on this previous study, St John’s wort expression levels for low-level gene candidates have been quantified by qRT-PCR (real time quantitative PCR), to further probe the mechanism of seedlings performance under a cool temperature. Secretory structures associated with leaf metabolite accumulation were also monitored under reduced temperature conditions.
2 Materials and methods
2.1 Plant materials
H. perforatum seedlings were grown from seed [collected Kangxian county (33°16′20″N, 105°31′50″E; 1050 m a.s.l.) located in Gansu province, China] and acclimated to defined temperatures according to previously published protocols (Yao et al., 2019; Su et al., 2021). Specifically, seeds were successively disinfected with 70% ethanol (v/v) and 0.1% HgCl2 (w/v), and then the sterilized seeds were inoculated on Murashige and Skoog (MS) + 20.0 g/L sucrose + 4.0 g/L agar (pH 5.8) and germinated at 22°C (24 h/d photoperiod, white light, 500 µmol·m−2·s−1 Flux; 50 ± 5% relative humidity). After 25 days of germination at 22°C, seedlings (Figure S1) were transplanted to a new MS medium with 0.5 mg/L 1-Naphthylacetic acid (NAA) + 1.0 mg/L 6-Benzylaminopurine (6-BA). After 20 days of growth, half of the healthy seedlings were kept at 22°C and the other half was moved to 15°C (24 h/d photoperiod, white light, 500 µmol·m−2·s−1 Flux; 50 ± 5% relative humidity) in illuminated incubators (PDX-600A, KunCheng Scientific Instruments Co., Ltd., Shanghai, China). After 20 days growth at 15 and 22°C, the treated seedlings (Figure S2) were collected for seedlings dry weight (DW), Hyp quantification, anatomical observation and qRT-PCR validation. Herein, each treatment had 40 flasks with 3 seedlings per flask. Additionally, the criteria for choosing the temperatures is based on our previous findings that the aerial parts biomass and Hyp accumulation in H. perforatum are greater at 15°C compared with 22 and 30°C (Yao et al., 2019).
2.2 Measurement of chlorophyll and carotenoid contents
Chlorophyll and carotenoid contents were measured according to a previous protocol (Li et al., 2009; Yang et al., 2014). Briefly, fresh whole leaves (0.1 g) were finely ground in 80% acetone (v/v, 5 mL) and centrifuged at 5000 r/min and 4°C for 10 min. The supernatant was diluted to 25 mL with 80% acetone (v/v). Absorbance was taken at 662, 646 and 470 nm using a spectrophotometer (UV-6100, Shanghai, China). The specific calculations are as follows:
where “A662”, “A646” and “A470” represent the absorbance at 662, 646 and 470 nm, as well as “C”, “V” and “M” represent the concentration of pigment (mg/L), volume of extract (L) and sample fresh weight (FW, g), respectively.
2.3 HPLC quantification of Hyp content
Hyp content was quantified according to previous protocols (Couceiro et al., 2006; Yao et al., 2019). Briefly, air-dried aerial parts of seedlings were finely powdered, samples (0.1 g) were soaked in 95% ethanol (v/v; 20 mL) and agitated in the dark at 22°C for 72 h, and centrifuged at 8000 r/min and 4°C for 10 min. The supernatant was evaporated and concentrated using a vacuum in a rotary evaporator at 60°C, and then the concentrated residue was re-dissolved in methanol (10 mL, chromatography grade). After filtered with a durapore membrane (0.22 μm; Millipore, Sigma, USA), extracts (10 µL) were analyzed at 590 nm by HPLC (Eclipse Plus C18, 250 mm × 4.6 mm, 5 μm; Column temperature 30°C; Agilent 1100 series, Santa Clara, California, USA) and mobile phase with acetonitrile: 50 mmol/L triethylamine (70:30, v/v) at a flow rate of 1.0 mL/min. Hyp content was evaluated on peak area comparison with a reference standard (hypericin, 56690; Sigma Chemical Co., St. Louis, MO, USA). The specific calculations are as follows:
where “Ω”, “Y0”, “Y”, “V”, “M1” represent the standard concentration of Hyp (µg/mL), standard peak area of Hyp (mAU×s), sample peak area (mAU×s), volume of extract (L) and sample DW (g), respectively.
2.4 Leaf micro-structure observations
The middle adaxial leaf of 20 day-old plants was paraffin sectioned based on Li and Zhang, 2016. Briefly, fresh leaves were fixed with a formaldehyde-alcohol-acetic acid (FAA) solution at 4°C for 12 h; fixed samples were then washed with 70% ethanol (v/v) at 22°C for 10 min (thrice), and sequentially dehydrated in 30% ethanol (2 h), 50% (2 h), 70% (12 h), 85% (1 h), 95% (1 h), and 100% (0.5 h) (twice, v/v); dehydrated samples were then sequentially transparentized in the mixture of ethanol and dimethylbenzene (2:1, 1:1, 1:2 and 0:1, v/v) for 30 min. Samples were sequentially immersed in a mixture of dimethylbenzene-paraffin (1:1 and 2:1, v/v) at 56°C for 12 h, and immersed in paraffin at 58°C for 12 h (thrice), and then embedded in paraffin cubes (2 cm); finally, the samples were sliced (7 µm) (KD-2258, Cody, China) and stained (S8020 and F8130, Solarbio, China). Sample imaging was by fluorescence, brightfield and phase contrast microscopy (Revolve RVL-100-G, ECHO, USA).
2.5 Leaf ultra-structure analysis
Leaf ultra-structure was observed by transmission electron microscopy (Kornfeld et al., 2007), specific protocols and instrumentation followed previously published literature (Li et al., 2020). Briefly, small pieces (4 mm × 2 mm) of the middle adaxial leaf without mainly veins were firstly immersed into glutaraldehyde (2.5%, v/v) at 4°C for 12 h, then washed with 0.2 M sodium phosphate buffer (pH 7.4) at 22°C for 15 min (thrice), and then fixed with osmium tetroxide (1%, w/v) at 4°C for 5 h; secondly, the fixed samples were washed with the above buffer and then extracted sequentially in 50% ethanol (15 min), 70% (12 h), 80% (15 min), 90% (15 min), 100% (15 min), and acetone (100%) for 15 min (twice, v/v), the mixture agent of acetone and embedding (v/v, 1:1) for 7 h, and embedding medium (Epoxy resin, composed of MNA, EPon-812, DDSA and DMP-30) at 22°C for 12 h; thirdly, the treated leaves were transferred to a embedding plate and immersed in a embedding medium, and then dried sequentially at 35°C for 10 h, 45°C for 12 h and 68°C for 48 h; finally, the embedded samples were sliced (75 nm) with an ultra-microtome (EM UC6, Leica, Germany) and stained with uranyl acetate and lead citrate, and then ultra-structure was observed by a transmission electron microscope (JEM-1230, JEOL Ltd., Japan).
2.6 Gene excavation
RNA sequencing was by unigene expression analysis and basic annotation was conducted; 1584 high-level expressed genes with 749 characterized genes and 150 genes involved in plant growth, Hyp biosynthesis and environmental response have been identified with |log2(fold-change)| > 1 in previously published article (Su et al., 2021). In this study, low-level genes were identified according to a criteria of 0.2< |log2(fold-change)|< 1.0 (Robinson et al., 2009; Love et al., 2014), since low-level genes also play important roles in many biological processes (Maia et al., 2007; Gotor et al., 2010). Differentially Expressed Genes (DEGs) were annotated against the Swiss-Prot database (https://www.uniprot.org/), and 64 candidate genes (Table S1 and Table 1) involved in photosynthesis, energy and Hyp biosynthesis were dug out based on the biological functions.
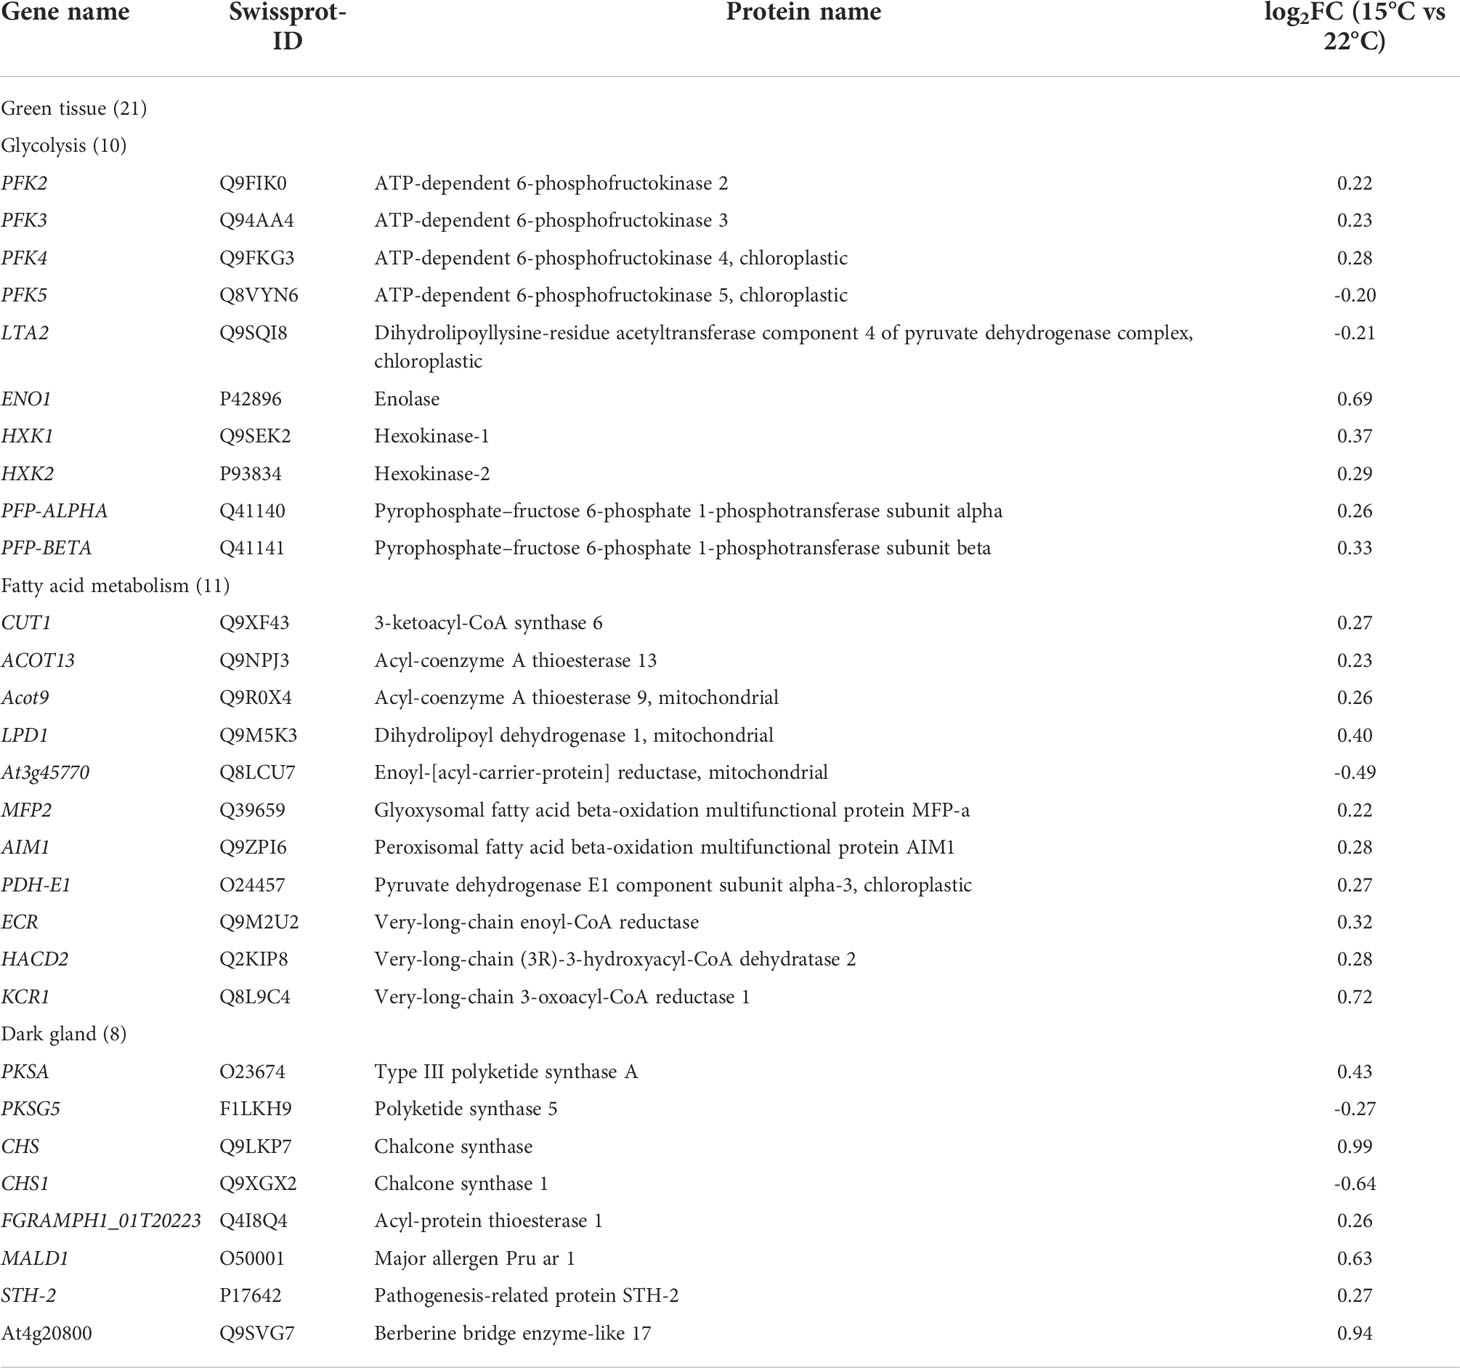
Table 1 Twenty nine genes involved in Hyp biosynthesis in green tissue and dark gland.
2.7 qRT-PCR quantification
Primer sequences of the selected 32 candidate genes (Table S2) were designed using a Primer-BLAST tool in NCBI. The coding sequences (CDS) of the 32 genes are shown in Table S3. Actin (ACT) was selected as a reference gene. The extraction of total RNA, synthesis of first-strand cDNA and PCR amplification were performed using RNA kit, RT kit and SuperReal PreMix, respectively. The RNA quality was assessed using an Ultramicro spectrophotometer (Micro Drop, BIO-DL, Shanghai, China) (Table S4) and the integrity was evaluated by 1.0% (w/v) agarose gel electrophoresis (Figure S3), reverse transcription was performed to generate cDNA on the following protocol: 42°C for 15 min and then 95°C for 3 min, one cycle, PCR amplification was performed on the following protocol: one cycle at 95°C for 15 min, and 35 cycles at 95°C for 10 s, 60°C for 20 s and 72°C for 30 s, and melting curve analysis was performed after a 34 s incubation at 72°C (Yao et al., 2019). The concentrations of cDNA and primer were respectively diluted to 100 ng/μL (2 μL) and 10 μM (1.2 μL) for gene expression analysis. Gene expression was quantified using a LightCycler 96 (Roche, Switzerland). Relative expression level (REL) of gene at 15°C compared with 22°C (Control) was valuated based on a 2-△△Ct method according to the following formula (Willems et al., 2008):
2.8 Statistical analysis
Three biological replicates were performed; SPSS 22.0 software was used for a t-test analysis with P<0.05 for differences.
3 Results and discussion
3.1 Low temperature increases chlorophyll and carotenoid content
To probe physical and physiological changes in leaves with a change in median growth temperature, a series of growth parameters were monitored. A 1.1- and 1.2-fold increase of chlorophyll (a + b) and carotenoid contents was observed at 15 compared with 22°C, respectively (Figure S4). These results were consistent with previous reports that low temperature can significantly increase chlorophyll content, plant growth and subsequently enhance biomass accumulation in comparison with high temperatures (22 and 30°C) (Yao et al., 2019; Su et al., 2021). Five photosynthetic encoded genes (i.e. psbA, psbC, ycf4, ycf5 and matK) were up-regulated at 15°C compared with 22 and 30°C (Yao et al., 2019); and nine genes encoding chlorophyll a-b binding proteins (i.e. CAB, CAB1, CAB1B, CAB3, CAB3C, CAB96, ELI_PEA, OHP2 and RBCS-C) were up-regulated at 15°C compared with 22 (Su et al., 2021). The up-regulation of these genes encoding chlorophyll a-b binding, light-induced and light-harvesting complexes proteins indirectly indicate that lower temperatures can improve the accumulation of chlorophyll pigments, which successively enhance photosynthesis and plant growth.
3.2 Low temperature increases biomass and Hyp content
As shown in Figure 1, there were greater biomass and Hyp content at lower temperature, with a 1.2-fold increase of the whole seedlings DW (Figure 1A) and 4.5-fold increase of Hyp content in aerial parts at 15 compared with 22°C (Figure 1B). The representative chromatograms of reference standard (50 μg/mL, injection volume 10 µL) as well as the extracts (10 mL, injection volume 10 µL) of aerial parts of seedlings at 15 and 22°C were shown in Figure 1C. Previous studies on H. perforatum have found that cooler temperatures can enhance Hyp accumulation. Specifically, there was a 1.4-fold increase of Hyp content on a DW basis at 15 compared with 22°C after the seedlings treated for 45 days (Yao et al., 2019); a maximum Hyp content on a DW basis at 4 and 8°C compared with 16 and 25°C, with about 10-fold increase at 4 compared with 25°C after the seedlings treated for 7 days (Tavakoli et al., 2020). These findings further demonstrate that Hyp accumulation in H. perforatum can be significantly enhanced by cooler temperatures. In fact, extensive experiments have demonstrated that bioactive compounds can be improved at cooler temperatures, such as podophyllotoxin content in Sinopodophyllum hexandrum at 15 compared with 22°C (Li et al., 2020), ferulic acid content in Angelica sinensis at 15 compared with 22°C (Dong et al., 2022), and total ginsenosides content in Panax ginseng at 10 compared with 25°C (Wang et al., 2019).
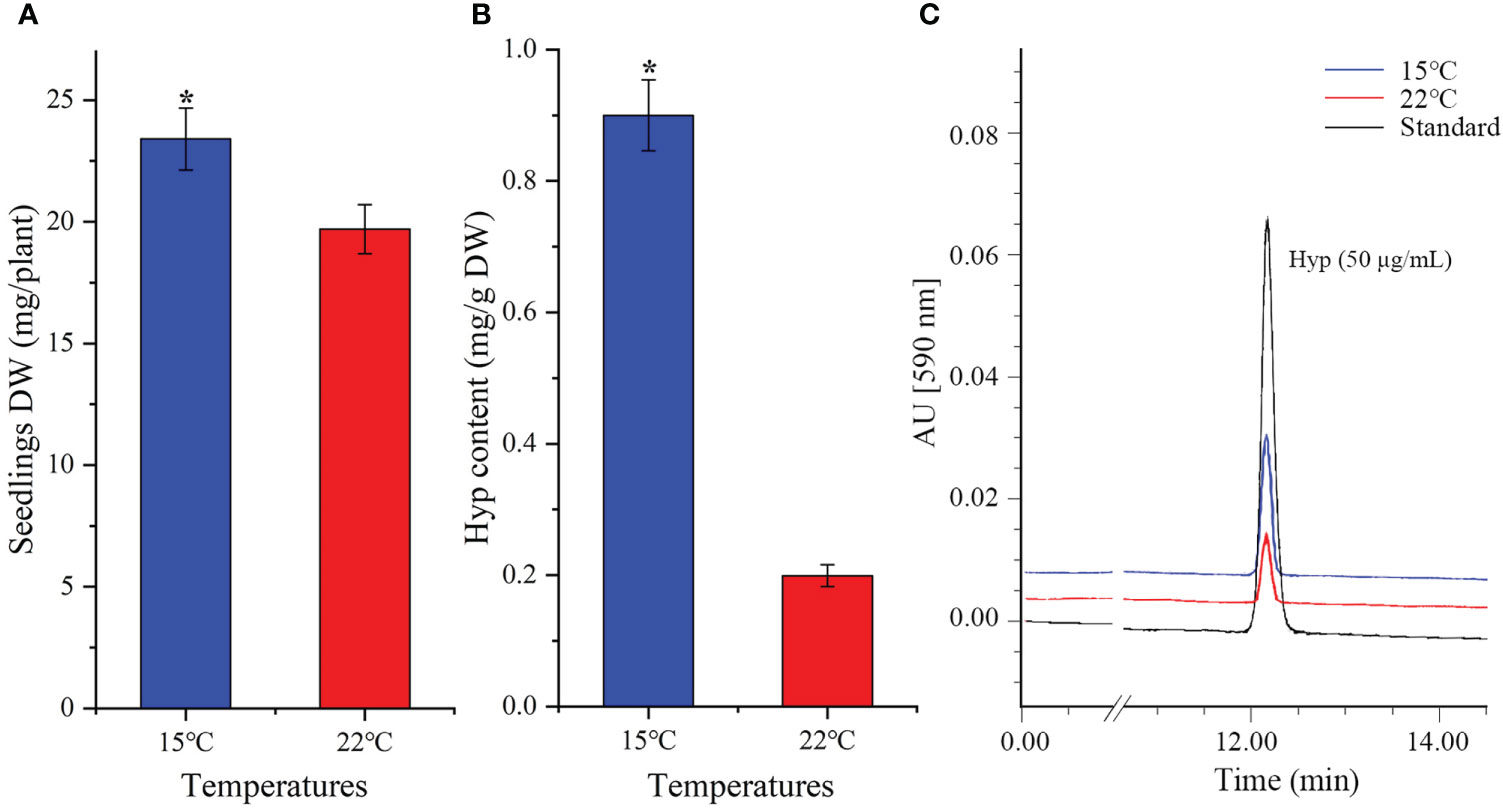
Figure 1 Seedlings DW (A), Hyp content (B) and representative chromatograms of HPLC (C) in H perforatum grown at 15 and 22°C. Values of DW are average with their standard deviations (n = 25), and values of Hyp content are average with their standard deviations (n = 3). The “*” represents a significant difference (P< 0.05) between 15 and 22°C.
3.3 Low temperature changes leaf cell micro-structure
Leaf tissue structure alterations [i.e. lower epidermis (LE), upper epidermis (UE), palisade cell (PC), spongy tissue (ST) and leaf veins (LV)] as well as organelle density [i.e. chloroplast (Ch), dark gland (DG) and secretory cell (SC)] were observed based on growing temperatures (Figure 2). A 1.1-fold increase in leaf thickness was detected (Figure 3A). Previous studies have found that H. perforatum leaf morphology (e.g. leaf length/width, stem height and DG) are significantly affected by species, geographic, light and temperature conditions (Briskin and Gawienowski, 2001; Walker et al., 2001; Cirak et al., 2007; Stoyanova-Koleva et al., 2015; Su et al., 2021). Since Hyp biosynthesis occurs in dark glands (DG) and secretory cells (SC) is associated with Hyp accumulation (Lv and Hu, 2001; Zobayed et al., 2006; Kornfeld et al., 2007; Rizzo et al., 2019), these organelles were monitored. Increases in DG size and SC number of 1.2-fold and 1.9-fold, respectively for plants growing at the lower temperature was observed (Figures 3B, C). Studies with Camellia oleifera grown at 15 compared with 16°C exhibited an increased leaf thickness, of 1.2-fold (Hu et al., 2016). Previous studies on H. perforatum have found that the number of DG is more at 15°C compared with 22°C (Su et al., 2021). Thus, larger size of DG and more number of SC in this study further confirm previous studies that higher Hyp accumulates to a greater level at 15°C than 22°C (Su et al., 2021).
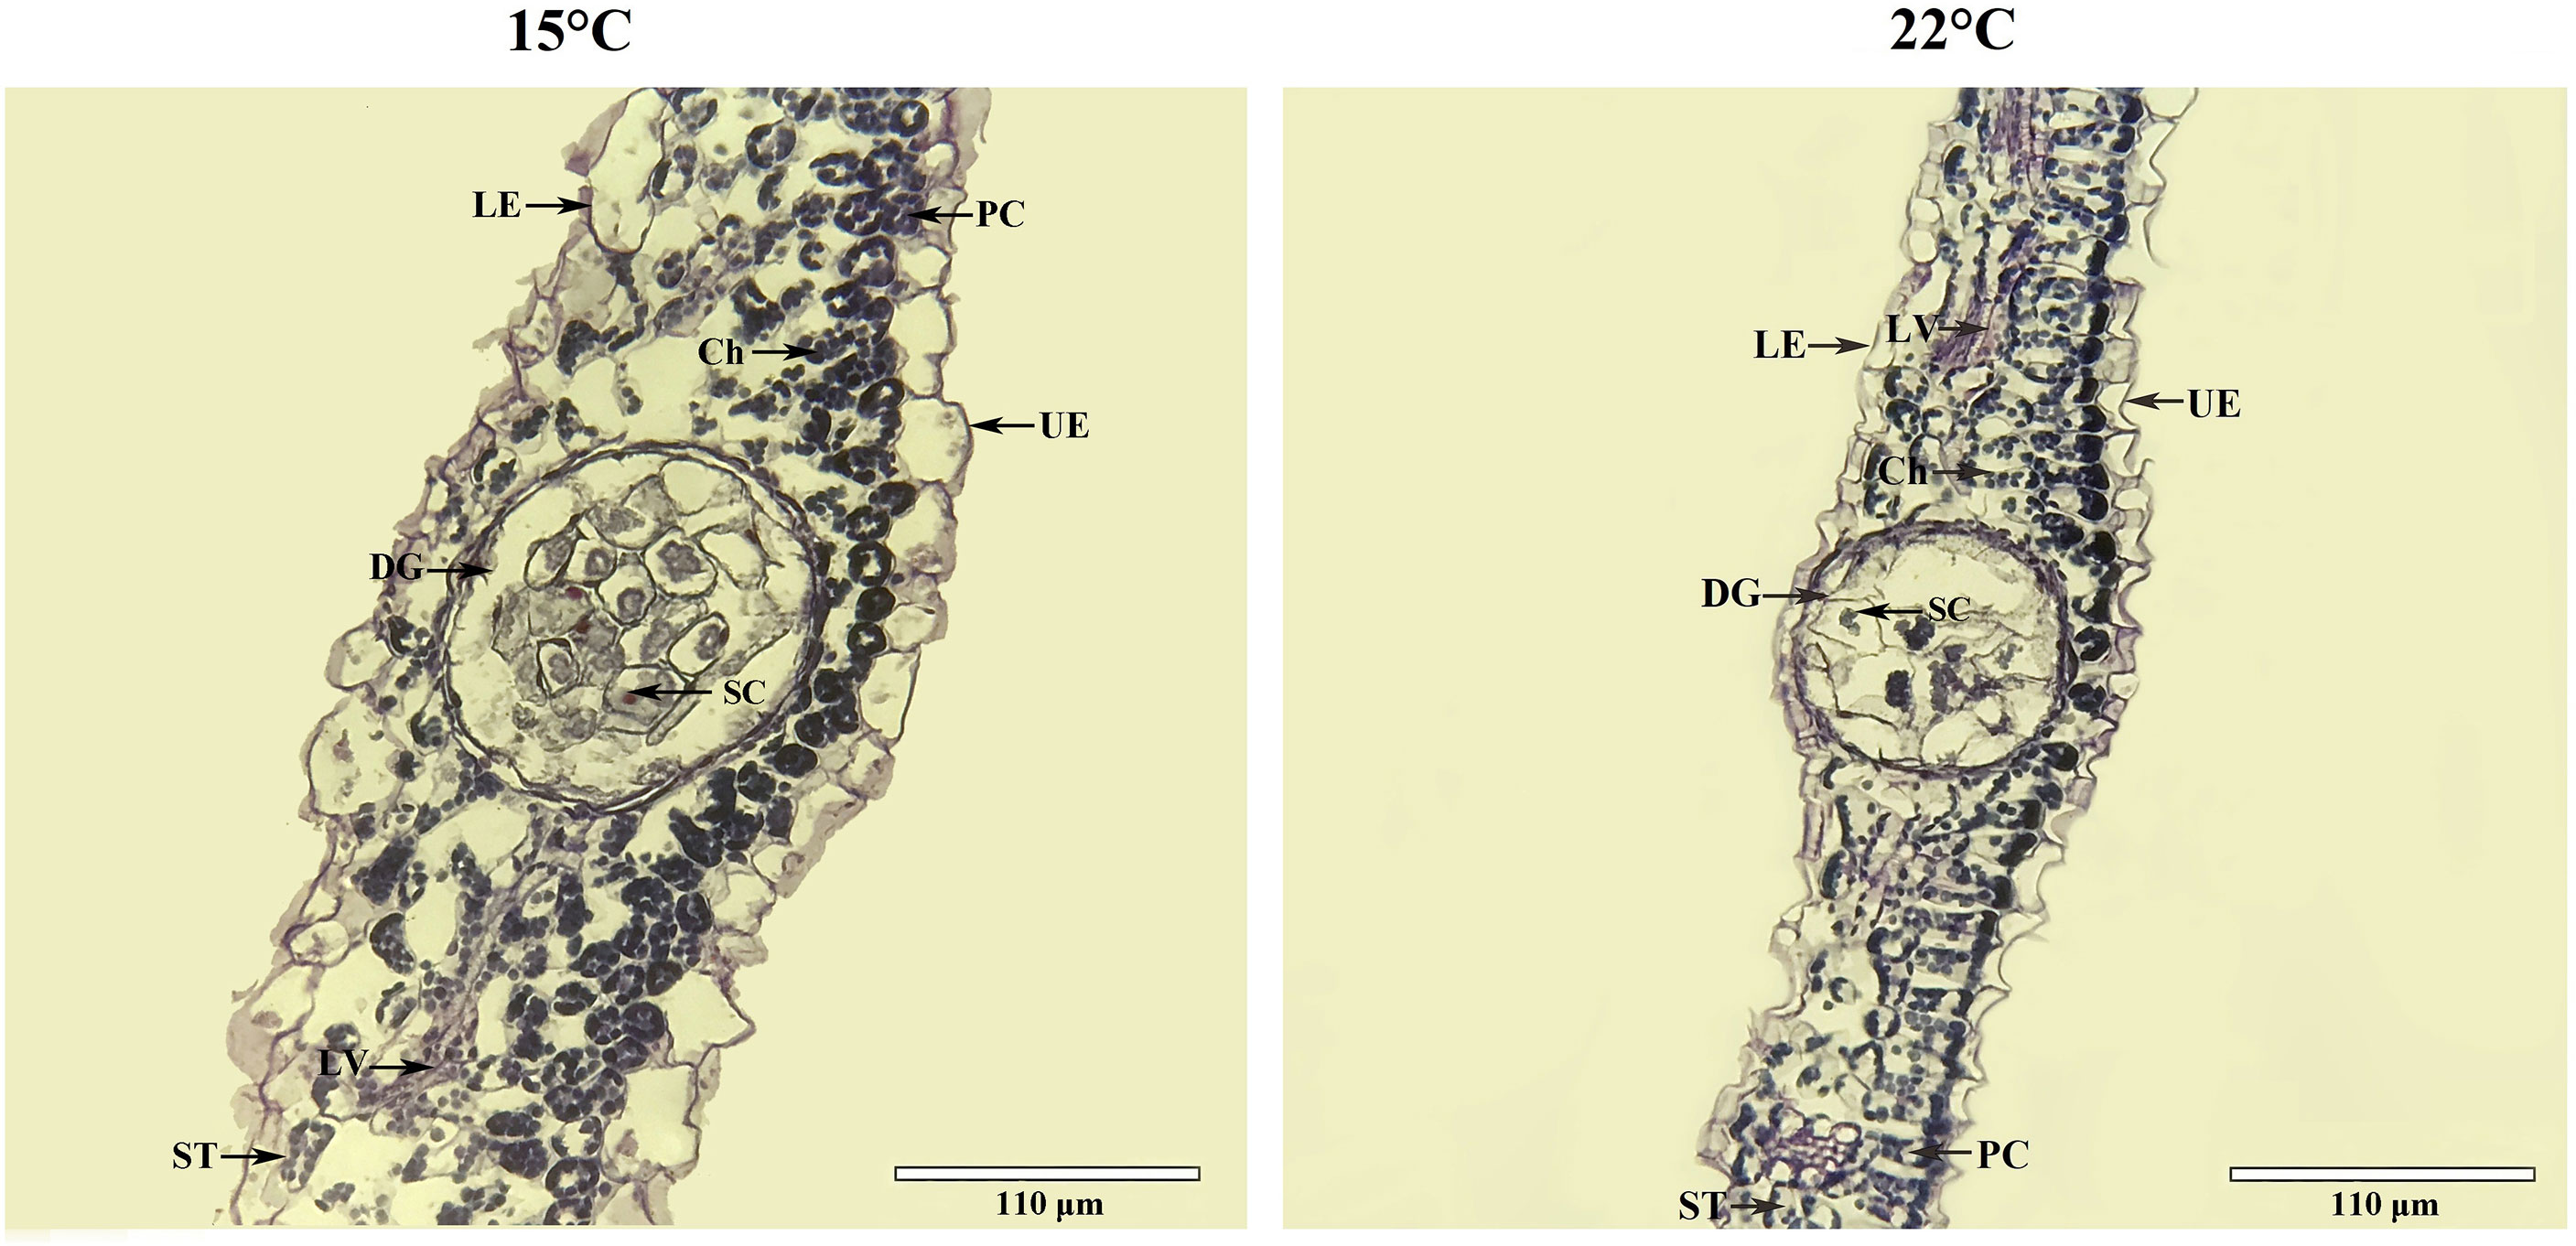
Figure 2 Cross-sectional micro-structure for leaves of seedlings grown at 15 and 22°C. Ch, chloroplast, DG, dark gland, LE, lower epidermis, LV, leaf veins, PC, palisade cell, SC, secretory cell, ST, spongy tissue, UE, upper epidermis.
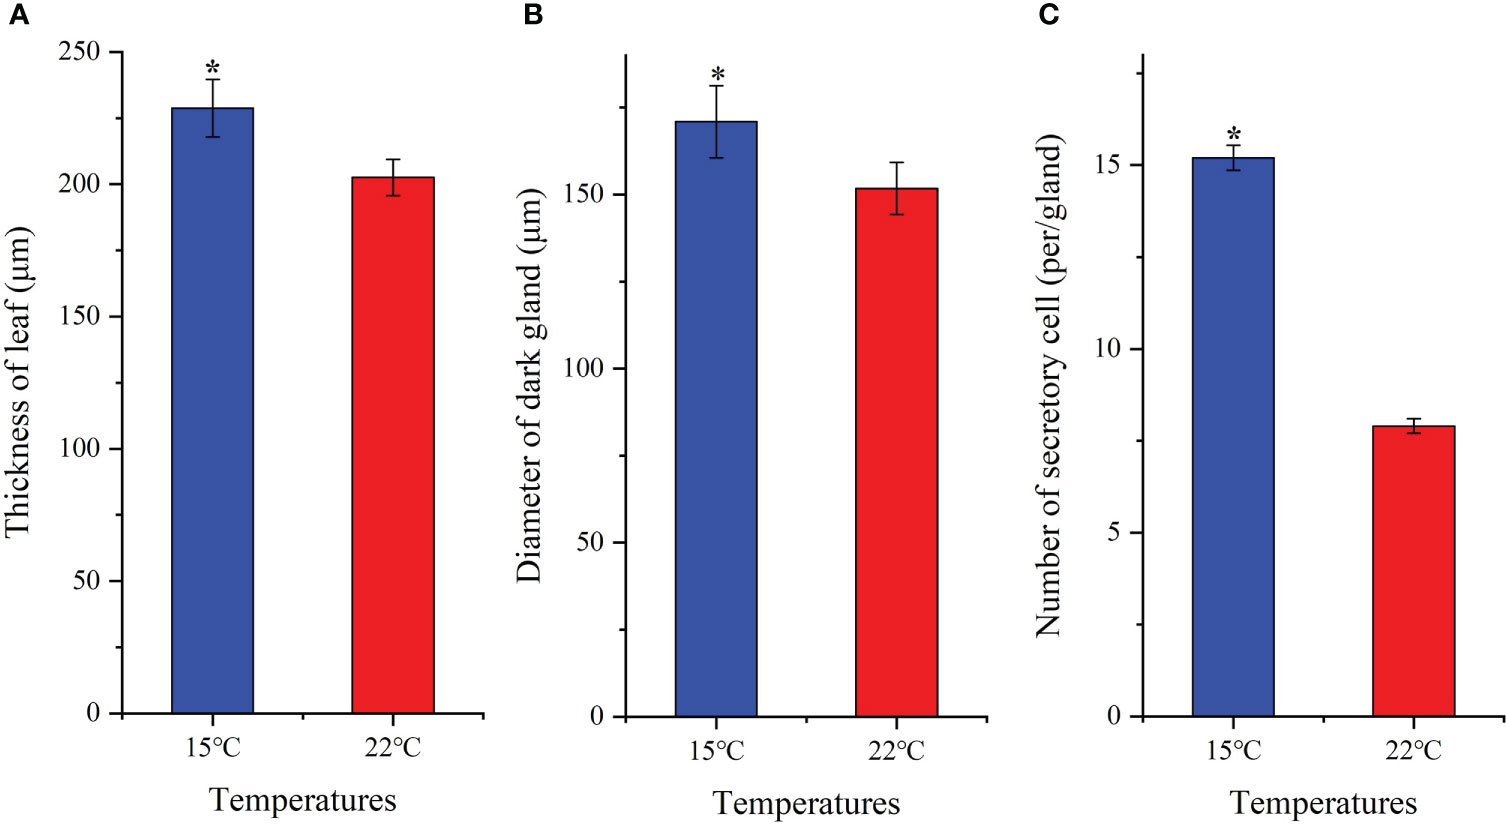
Figure 3 Changes of leaf thickness (A), diameter of dark-gland (B) and number of secretory cell (C) for seedlings grown at 15 and 22°C. All the values are average with their standard deviations (n = 10). The “*” represents a significant difference (P< 0.05) between 15 and 22°C.
3.4 Low temperature changes leaf cell ultra-structure
Vacuole (V) occupied most of the space of whole cell, and chloroplasts (Ch) were near to the cell wall (CW) (Figure 4A, F); mitochondria (Mi) were near to the Ch (Figures 4B, G); starch grains (S) (Figures 4C, H), thylakoid grana (TG) and osmiophilic granules (OG) (Figures 4D, I) presented in the Ch; and hemispherical droplets (HD) (Figures 4E, J) appeared in the epidermal cell. Based on the observations (n=10), the number of Ch, Mi, S, TG and OG appeared to be greater and the size of HD was significantly larger at 15°C compared with 22°C (Figure 4). The number of Ch, Mi, S, TG and OG affected by abiotic stresses such as temperatures has been observed in other plants (Zhang et al., 2005; Li et al., 2020). Here, an increase in the number of Ch, Mi, S, TG and OG may be a low-temperature response for energy acquisition and utilization, since previously studying H. perforatum have reported that cooler temperature can enhance plant growth (Yao et al., 2019; Su et al., 2021). The HD, which seems to adhere to membranes or is somehow trapped in a hemispherical shape, may be associated with Hyp biosynthesis (Kornfeld et al., 2007). Here, an increase in the size of HD may play a certain role in enhancing Hyp biosynthesis at lower temperature.
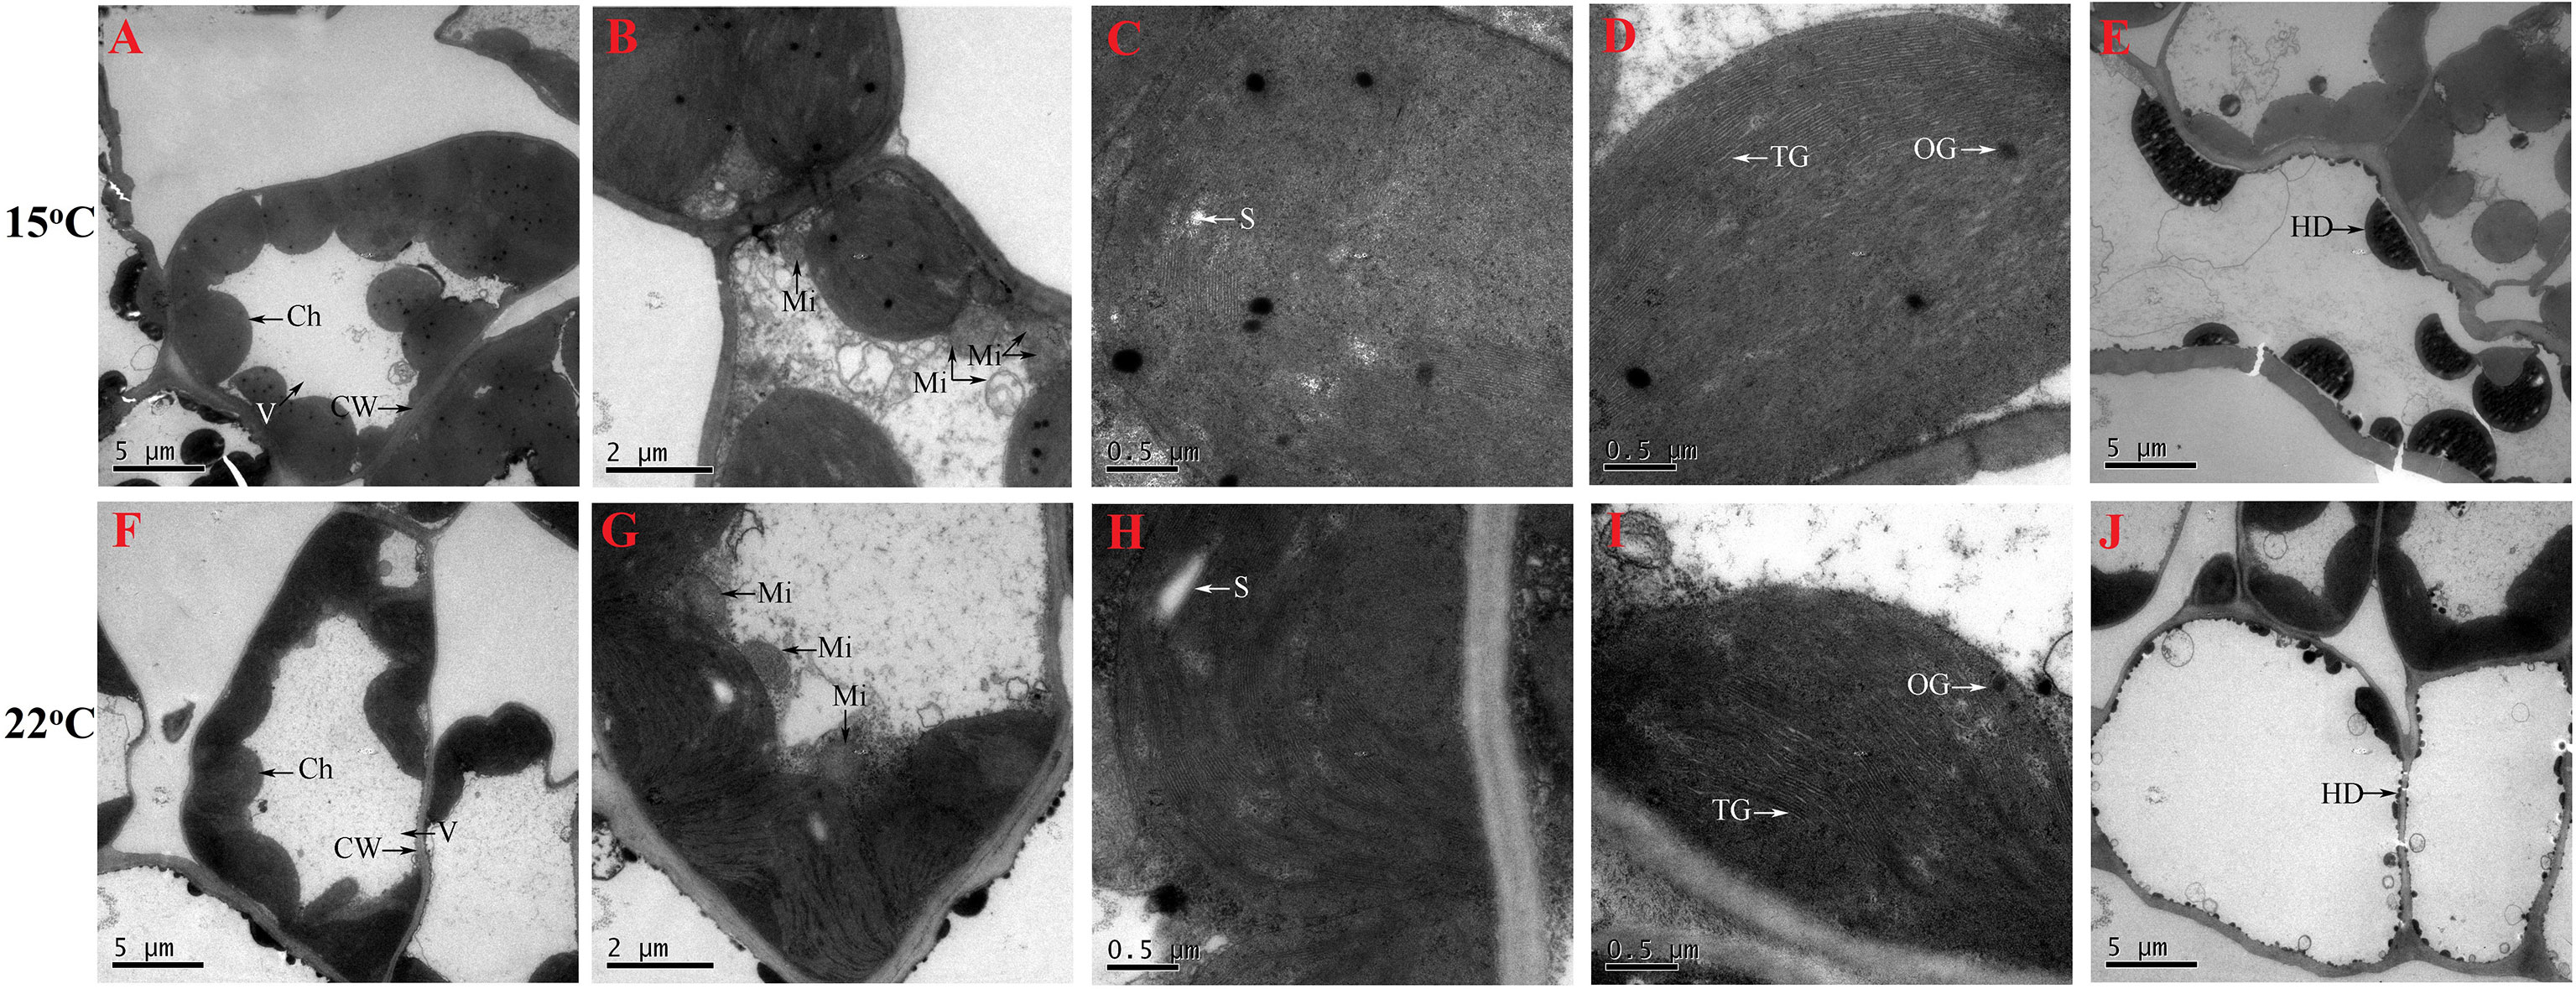
Figure 4 Cell ultra-structure for seedlings grown at 15 (A–E) and 22°C (F–J). Ch, chloroplast, CW, cell wall; Mi, mitochondria; HD, hemispherical droplets; OG, osmiophilic granule; S, starch grain; TM, thylakoid grana; V, vacuole.
3.5 Low temperature regulates gene expression related to photosynthesis and energy
Thirty-five genes related to photosynthesis and energy (Taiz and Zeiger, 2010) was observed to be differentially regulated with temperature (Table S1), and 16 genes were selected to validate the expression levels. Fifteen genes (i.e. CAB13, CAB2R, LHCB1.2, CAP10A, PGRL1A, Os01g0913000, TRM1, CURT1B, THF1, At3g63540, TERC, NMAT1, NMAT2, SPS3 and EMB2247) presented a 1.4 to 9.3-fold up-regulation, while PGR5 presented a 0.9-fold down-regulation at 15°C compared with 22°C (Figure 5). In previous studies, 12 high-level genes (i.e. six CABs, ELI_PEA, ELIP2, OHP2, RBCS-C, RCA and RBCS-8B) related to photosynthesis were differentially expressed at 15°C compared with 22°C (Su et al., 2021).
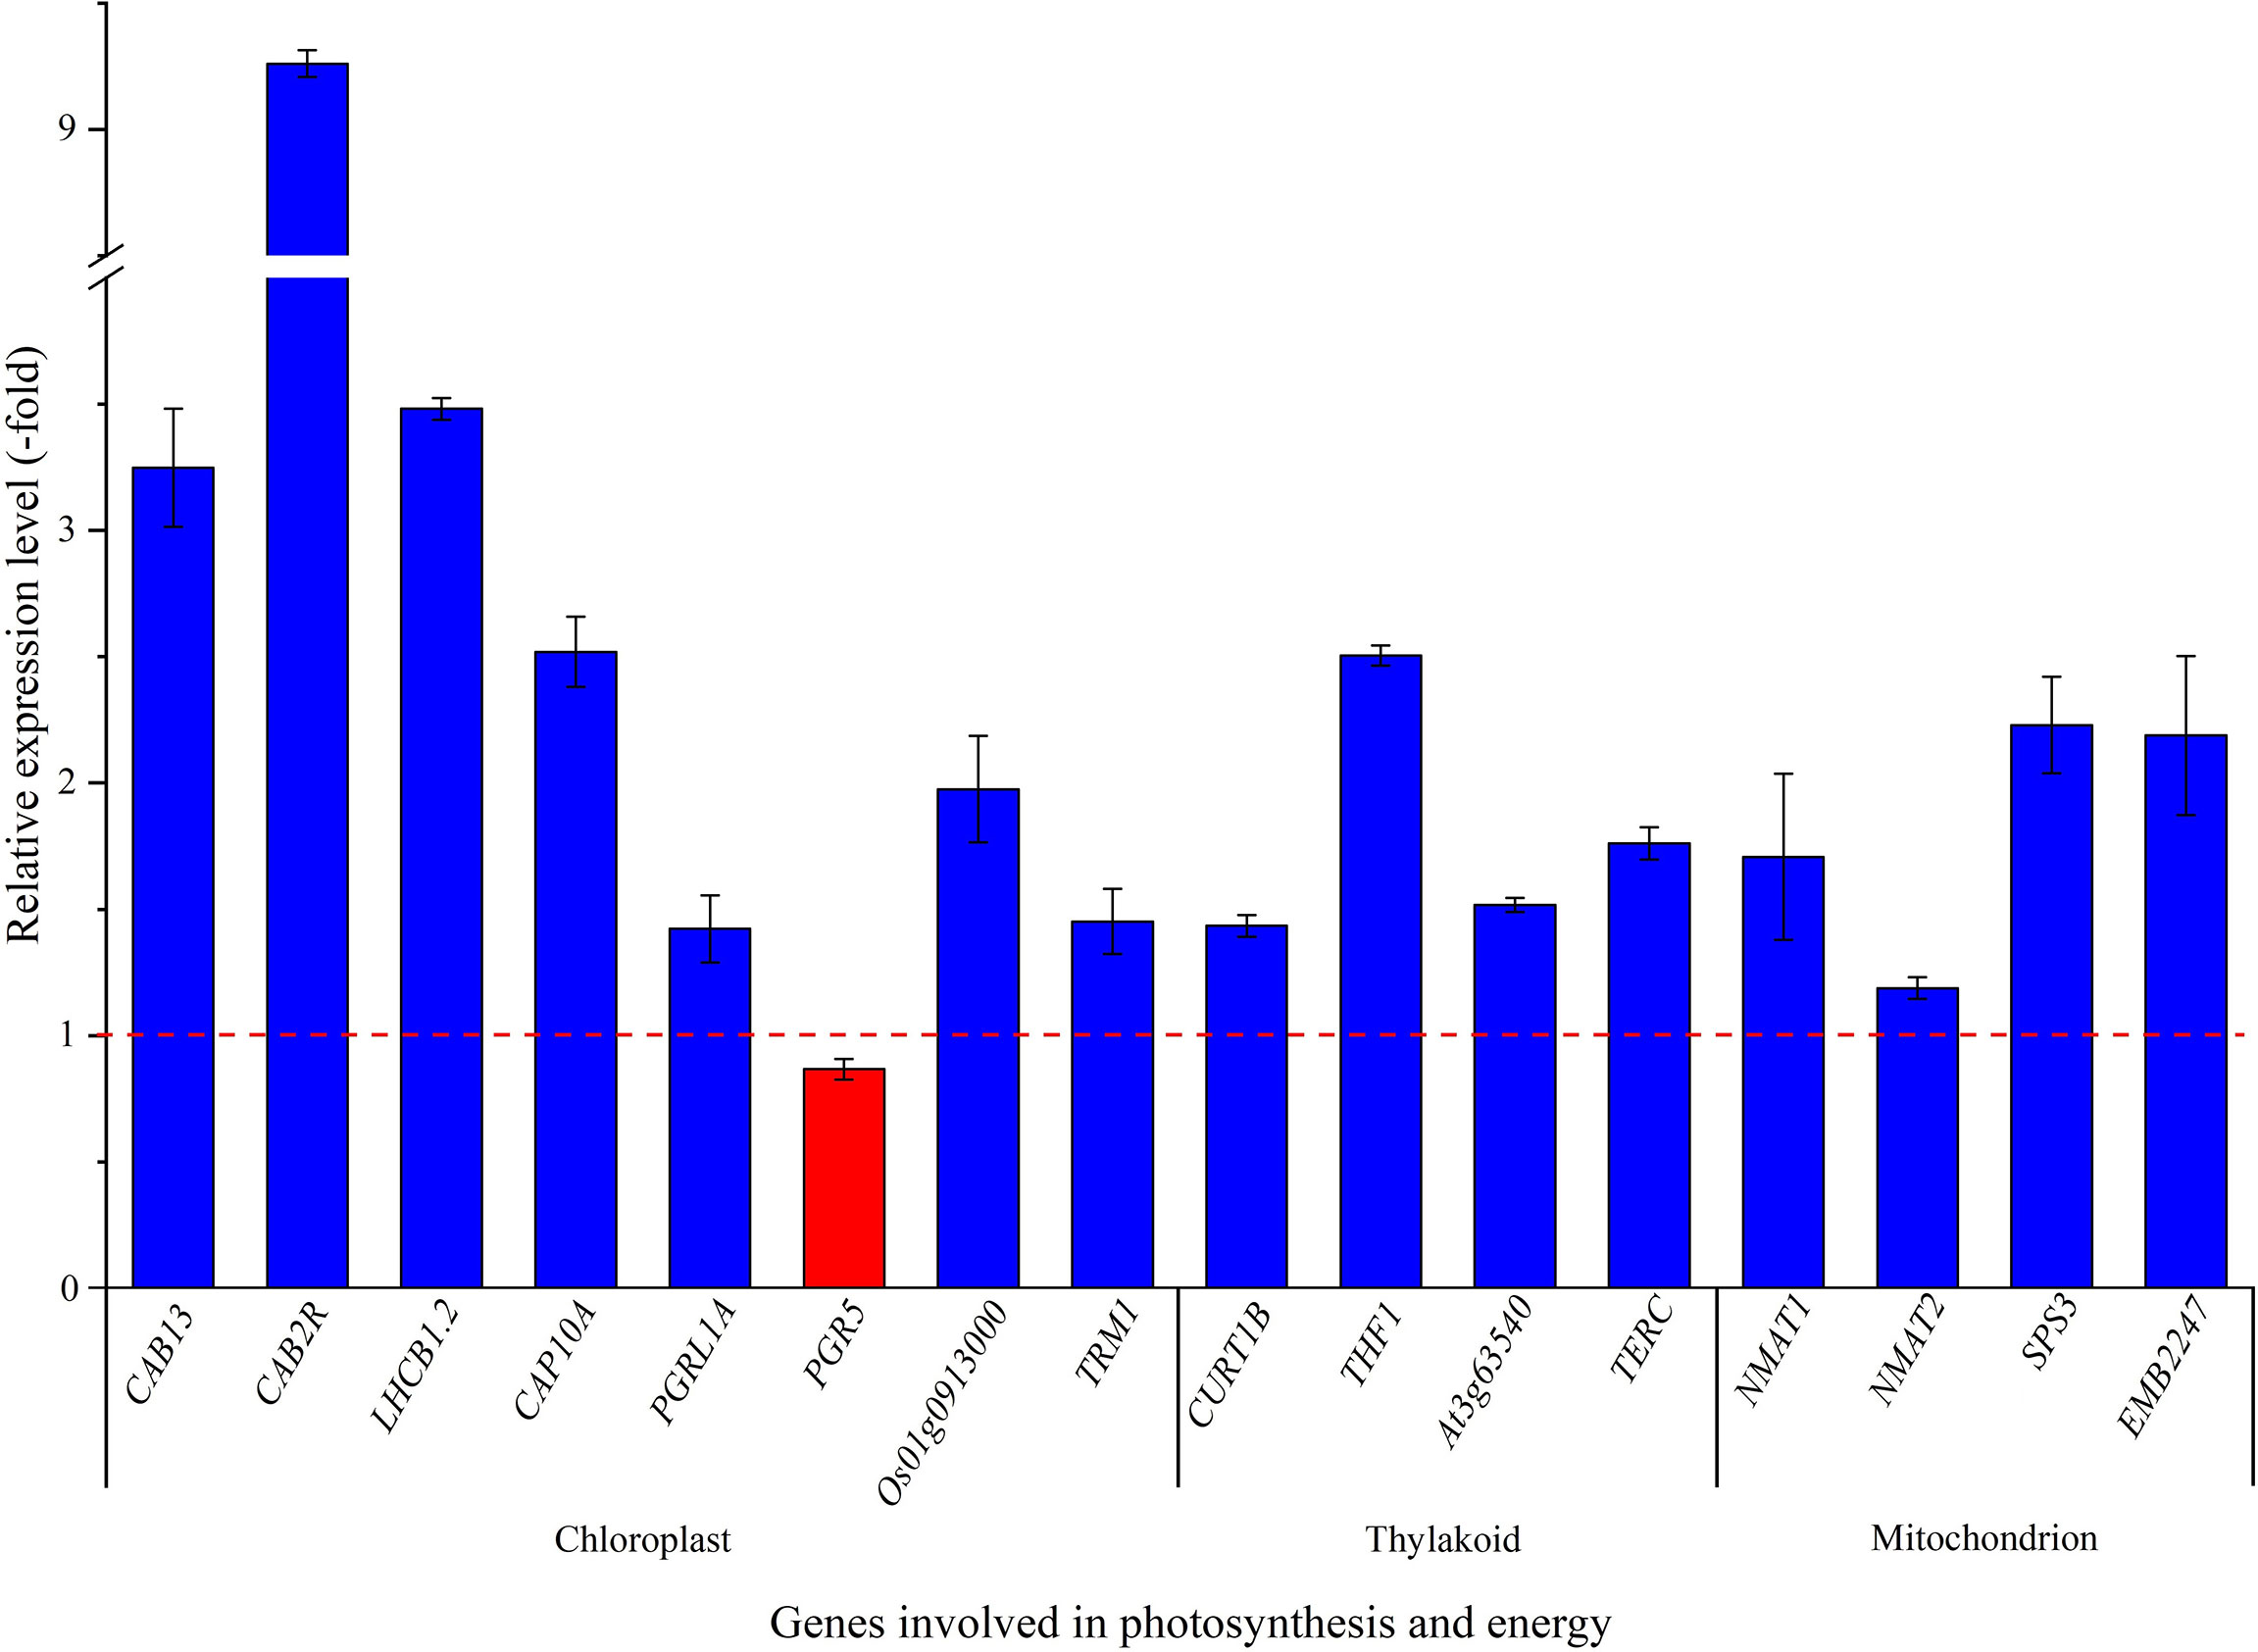
Figure 5 The expression level of genes involved in chloroplast, thylakoid and mitochondrion for seedlings grown at 15 versus 22°C, as determined by qRT-PCR (n=3). Column highlighted in blue represents gene up-regulation and red represents gene down-regulation. The red dotted line in the image differentiates up-regulation (>1) and down-regulation (<1) at 15°C compared with 22°C (Control), respectively.
For the specific biological functions of the selected 8 genes related to chloroplast, CAB13, CAB2R, LHCB1.2 and CAP10A encode light-harvesting chlorophyll a-b binding proteins (LHCs) that functions as a light receptor and play indispensable roles in capturing and delivering excitation energy to photo systems (Zou et al., 2020), PGRL1A and PGR5 are involved in electron flow (Munekage et al., 2002; Hertle et al., 2013), Os01g0913000 and TRM1 are involved in various redox reactions (Capitani et al., 2000; Glauser et al., 2004). For selected genes associated with the thylakoid membrane, CURT1B determines thylakoid architecture by inducing membrane curvature (Armbruster et al., 2013), THF1 is required for the formation of mature thylakoid stacks from the normal vesicles (Wang et al., 2004), At3g63540 is involved in the folding and proteolysis of thylakoid proteins (Peltier et al., 2002), and TERC is involved in the thylakoid formation (Kwon and Cho, 2008; Schneider et al., 2014). For these four genes related to mitochondrion, NMAT1 and NMAT2 are required for mitochondrial biogenesis and the regulation of fundamental metabolic pathways during early developmental stages (Nakagawa and Sakurai, 2006), SPS3 is involved in the ubiquinone-9 biosynthesis from solanesyl diphosphate (Ducluzeau et al., 2012), and EMB2247 is involved in the formation of carbon-oxygen bonds in aminoacyl-tRNA (Berg et al., 2005). The up-regulation of these genes involved in photosynthesis and energy will confer H. perforatum seedlings to grow robust and adapt cooler temperatures compared with higher temperatures.
3.6 Low temperature regulates gene expression related to Hyp biosynthesis
3.6.1 Mapping genes related to Hyp biosynthesis
While previous studies have revealed that Hyp is biosynthesized in two separated tissues including: (1) green tissue from glucose to acetyl- and malonyl-CoA, and (2) dark gland from octa-β-ketoacyl chain to Hyp (Zobayed et al., 2006; Rizzo et al., 2019; Yao et al., 2019; Rizzo et al., 2020; Su et al., 2021), Hyp biosynthetic has not been fully elucidated and some genes have still not been identified. In this study, twenty-nine genes participating in Hyp biosynthesis were identified, with 21 genes in green tissue including in glycolysis (10 genes, 8 up-regulated and 2 down-regulated) and fatty acid metabolism (11 genes, 10 up-regulated and 1 down-regulated), and 8 genes in dark gland (6 up-regulated and 2 down-regulated) (Table 1). In the green tissue, acetyl-CoA is formed through photosynthesis, glycolysis (i.e. PFK2, PFK3, PFK4, PFK5, LTA2, ENO1, HXK1, HXK2, PFP-ALPHA and PFP-BETA) and pyruvate dehydrogenase (i.e. PDH-E1), malonyl-CoA is formed from acetyl-CoA via acetyl-CoA carboxylase, meanwhile, fatty acid metabolism (i.e. CUT1, ACOT13, Acot9, LPD1, At3g45770, MFP2, AIM1, ECR, HACD2 and KCR1) is involved in the biosynthesis of the acetyl-CoA and malonyl-CoA. For the biosynthetic pathway in the dark gland, an octa-β-ketoacyl chain is formed with one acetyl-CoA and seven malonyl-CoAs by the PKS (i.e. PKSA and PKSG5), emodin anthrone is formed through a series of aldolic condensation, thioesterase (TER) (i.e. FGRAMPH1_01T20223), decarboxylic and dehydration reactions, then emodin dianthrone is produced by the oxidation of emodin anthrone as well as the coupling of emodin with emodin anthrone by the phenoloxidative coupling protein (POCP) (i.e. MALD1 and STH-2); finally, Hyp is generated by POCP or berberine bridge enzyme (BBE) (i.e. At4g20800) as well as light, oxidation and dehydration reactions (Figure 6). While there is a competitive relationship between the PKS and octaketide synthase (OKS) (i.e. CHS and CHS1) in this study, because the OKS can catalyze the 4-coumaroyl-CoA and malonyl-CoA precursors into flavonoids (i.e. 2’,4,4’,6’-tetrahydroxychalcone) (Ferrer et al., 1999).
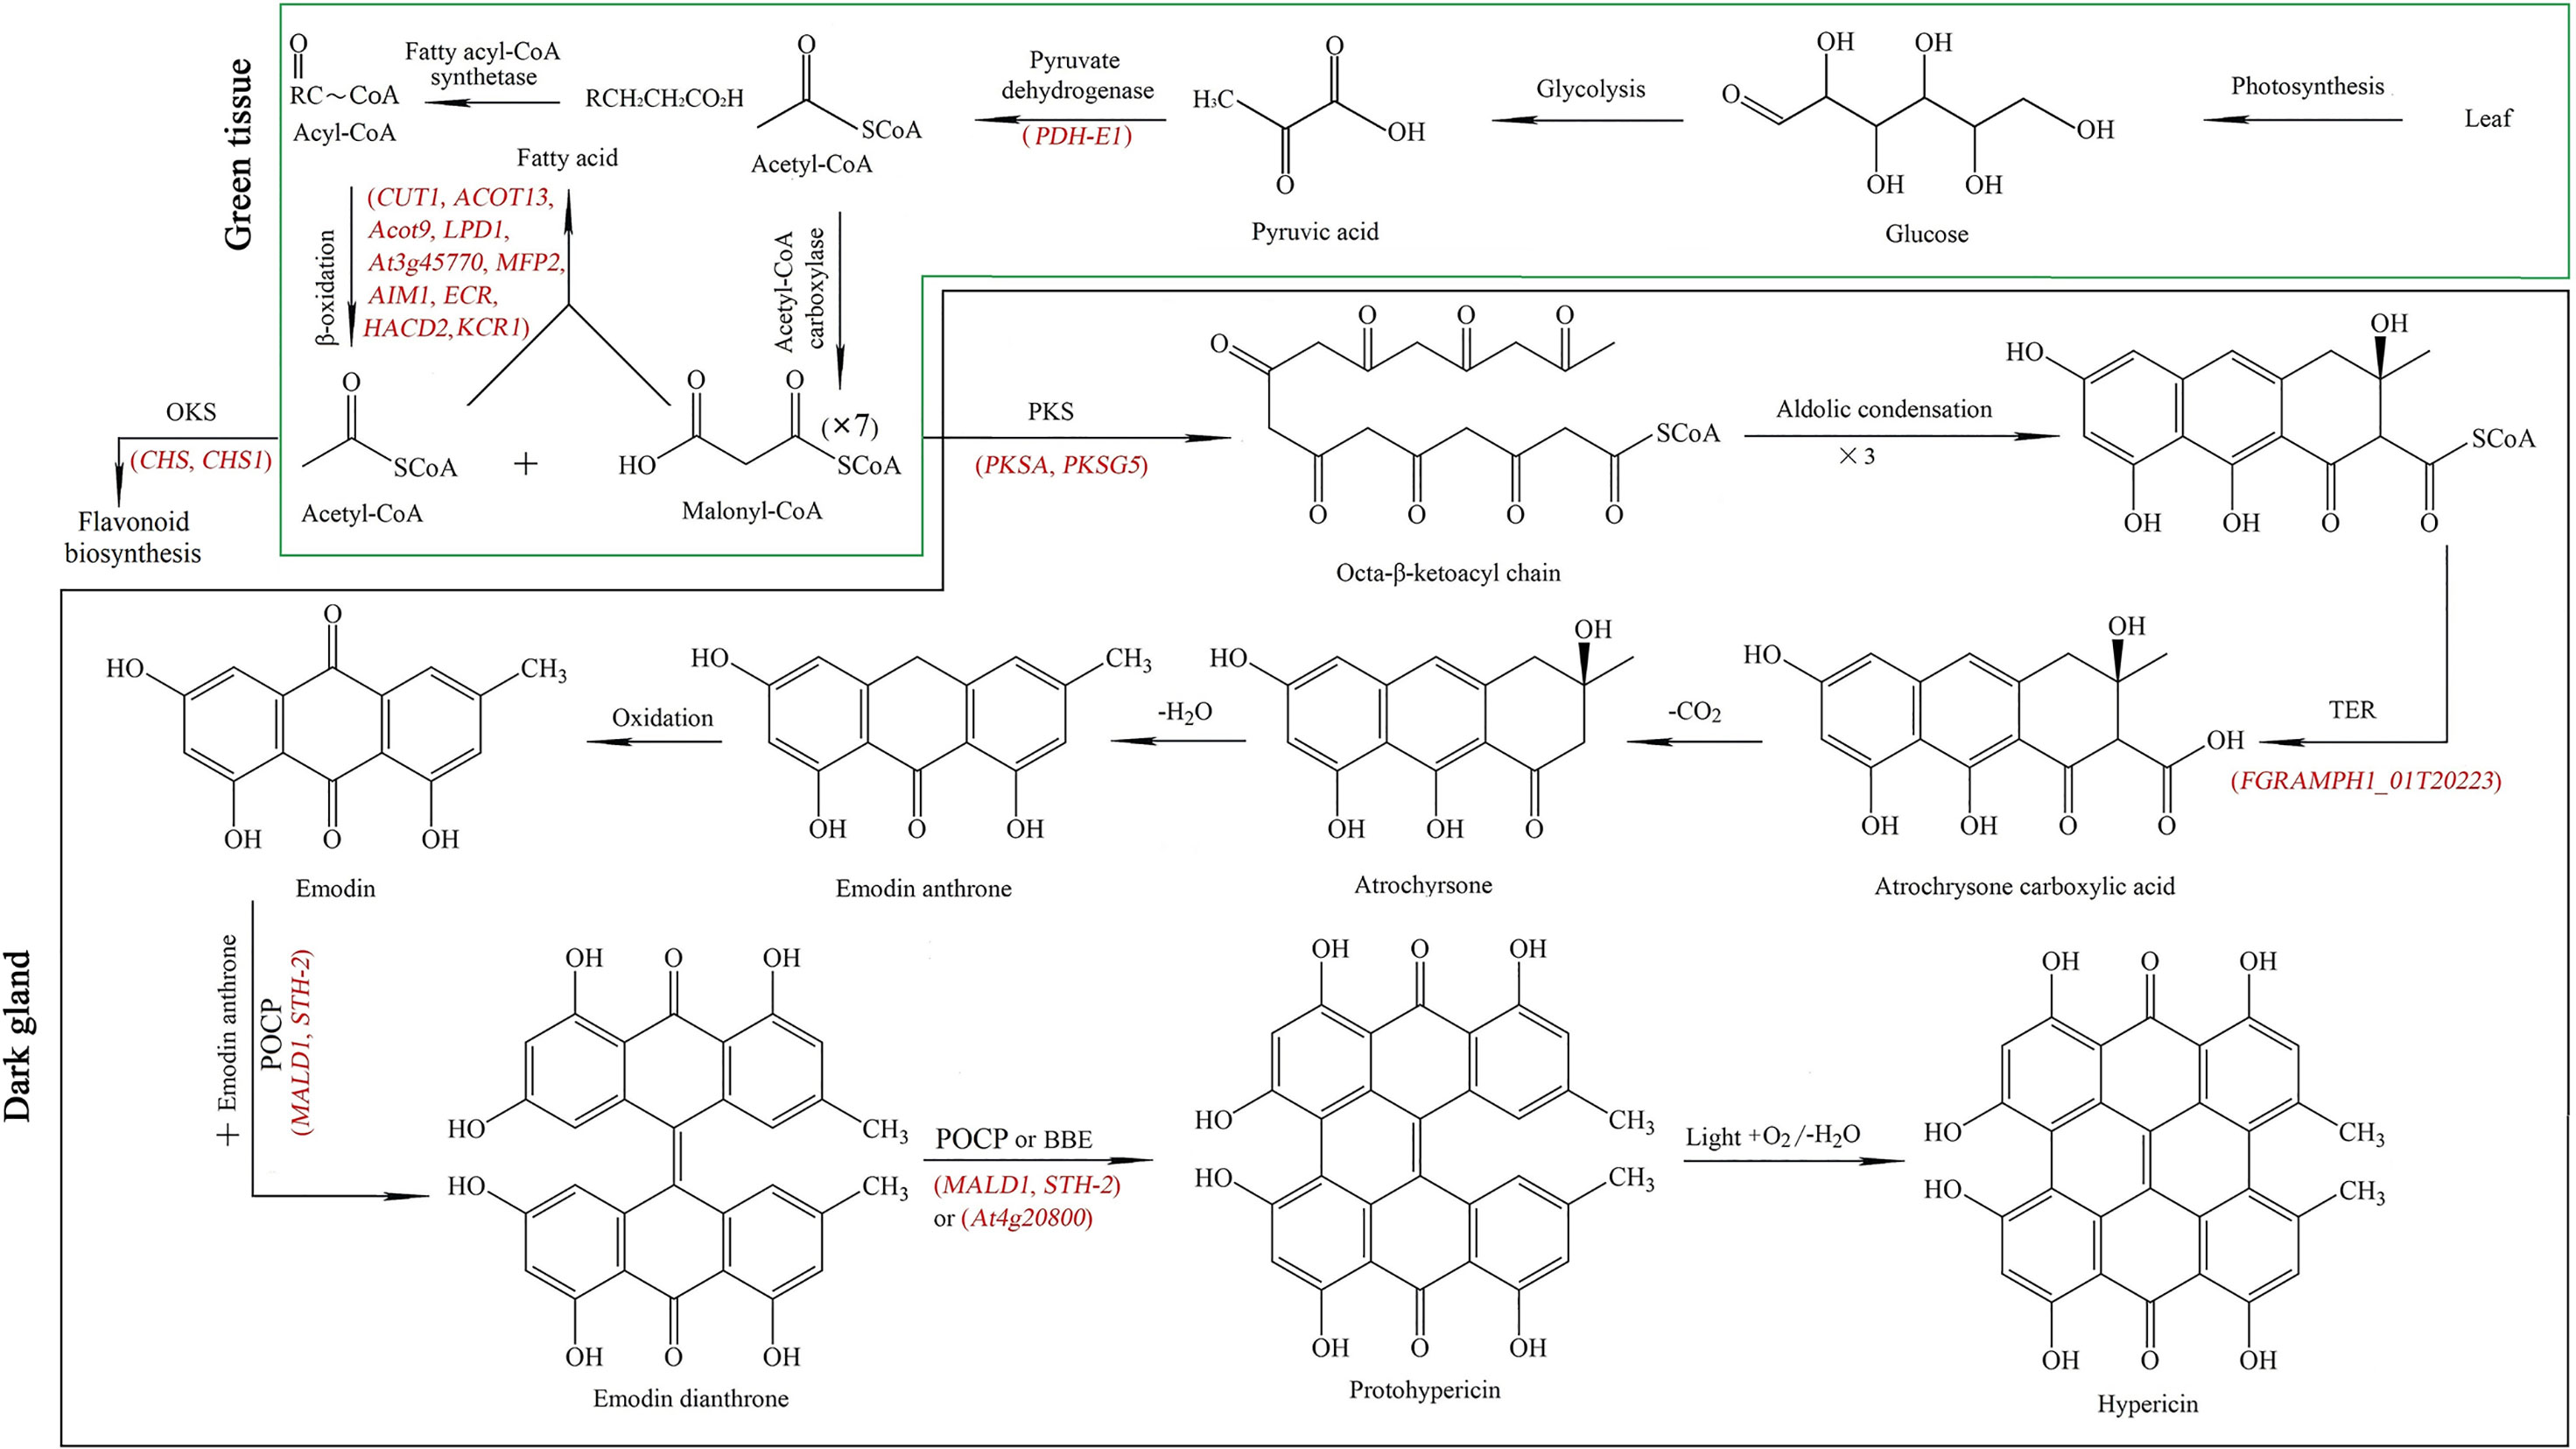
Figure 6 Key genes (red color) mapped in the Hyp biosynthetic pathway from glucose to acetyl- and malonyl-CoA in green tissue (green frame), and from acetyl- and malonyl-CoA to Hyp in dark gland (dark frame). PKS: polyketide synthase, OKS: octaketide synthase, TER: thioesterase, POCP: phenoloxidative coupling protein, BBE: berberine bridge enzyme. The Hyp biosynthetic pathway concludes from previous literatures (Zobayed et al., 2006; Rizzo et al., 2019; Rizzo et al., 2020; Su et al., 2021).
3.6.2 Expression level of genes in green tissue
The relative expression of selected genes in the green tissue were observed to be differentially regulated, with up-regulation of 1.6-, 1.6-, 1.1-, 1.1-, 1.4- and 1.1-fold for the 6 genes HXK1, PFP-ALPHA, CUT1, Acot9, AIM1 and KCR1, while down-regulation of 0.8- and 0.8-fold for the 2 genes PFK2 and ENO1, respectively at 15°C compared with 22°C (Figure 7). For selected genes involved in glycolysis, PFK2 is involved in the formation of fructose 1,6-bisphosphate by phosphorylating D-fructose 6-phosphate (Mustroph et al., 2007), ENO1 is involved in catalyzing the formation of phosphoenolpyruvate from 2-phosphoglycerate (Allen and Whitman, 2021), HXK1 and PFP-ALPHA are involved in the formation of D-glyceraldehyde 3-phosphate and glycerone phosphate (Todd et al., 1995; Giese et al., 2005). For genes involved in fatty-acid metabolism, CUT1 participates in both decarbonylation and acyl-reduction wax synthesis pathways (Fiebig et al., 2000), Acot9 is involved in the formation of free fatty acid and coenzyme A by hydrolyzing of acyl-CoAs (Poupon et al., 1999), AIM1 is involved in the peroxisomal beta-oxidation pathway for the biosynthesis of benzoic acid (Bussell et al., 2014), and KCR1 is responsible for the first reduction step in very long-chain fatty acids synthesis (Beaudoin et al., 2009). The up-regulation of these genes in green tissue at cooler temperature is likely to provide abundant acetyl-CoA and malonyl-CoA as precursors for downstream Hyp biosynthesis.
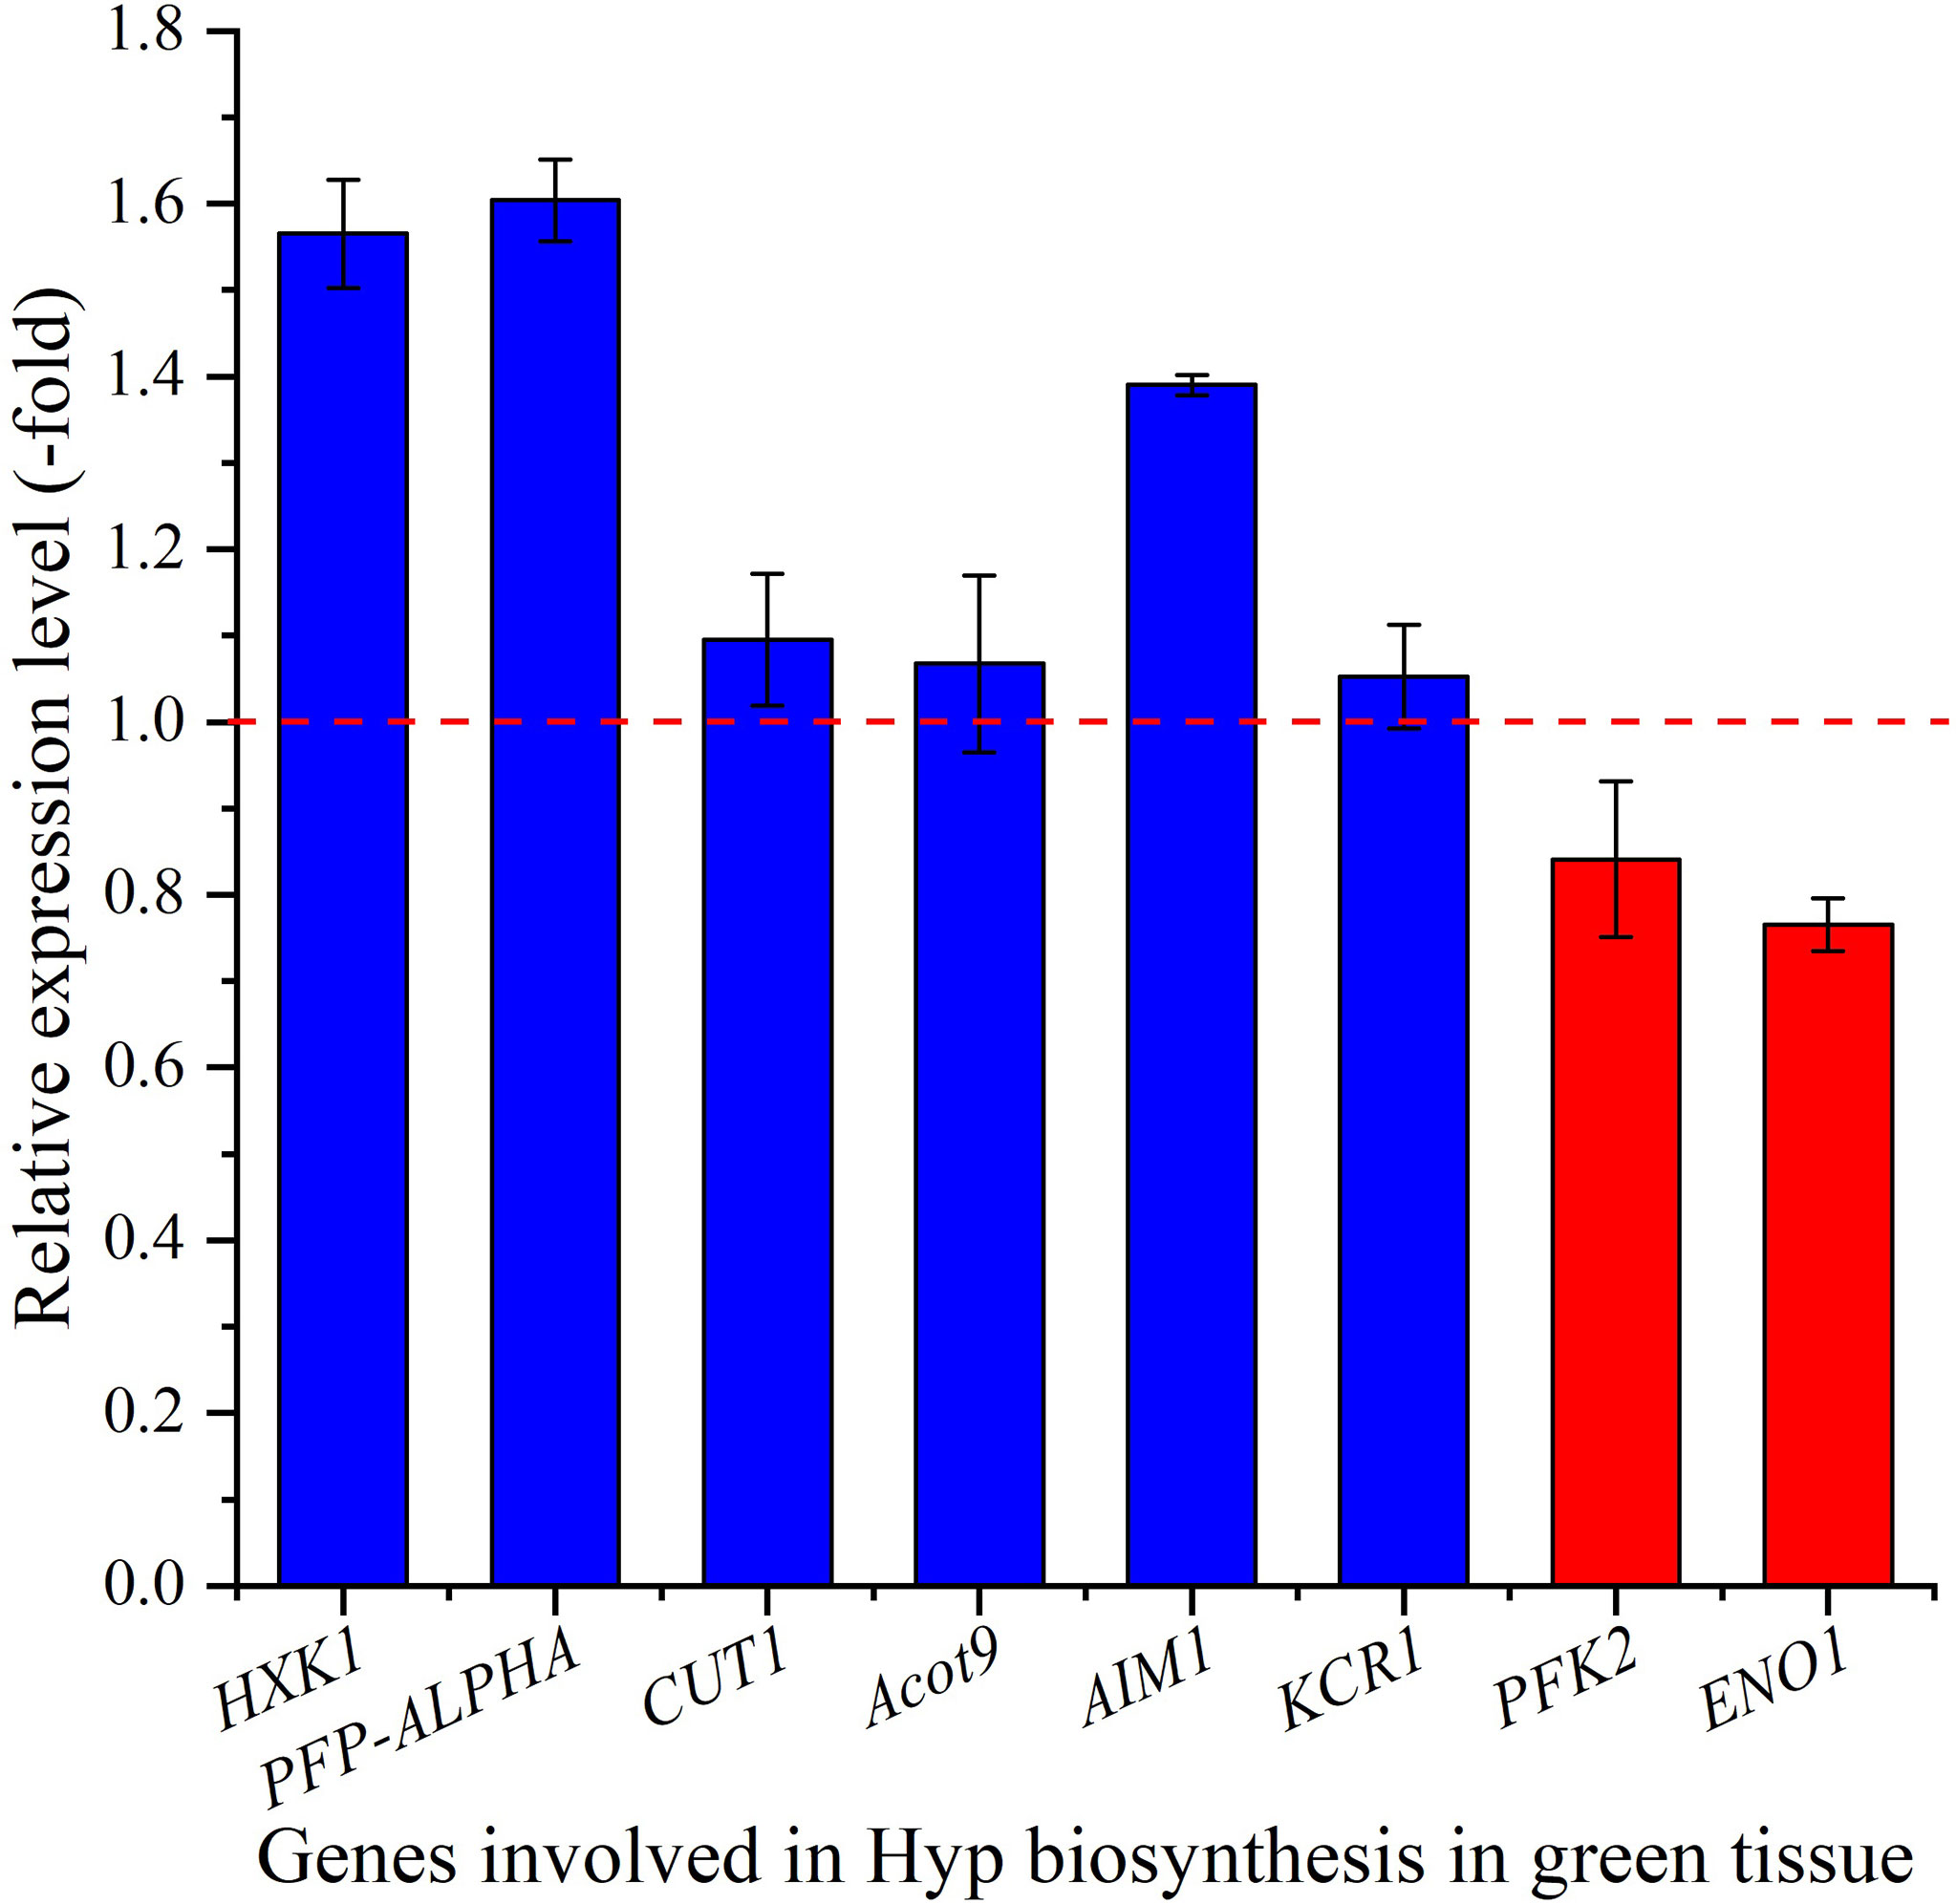
Figure 7 The expression level of genes involved in Hyp biosynthesis in green tissue for seedlings grown at 15 versus 22°C, as determined by qRT-PCR (n=3). Column highlighted in blue represents gene up-regulation and red represents gene down-regulation. The red dotted line in the image differentiates up-regulation (>1) and down-regulation (<1) at 15°C compared with 22°C (Control), respectively.
3.6.3 Expression level of genes in dark gland
The relative expression of selected genes in dark glands were also observed to be differentially regulated, with up-regulation of 1.5-, 1.5- and 1.2-fold for the 3 genes PKSA, FGRAMPH1_01T20223 and At4g20800, while down-regulation of 0.9-, 0.9- and 0.5-fold for the genes PKSG5, MALD1 and STH-2, respectively at 15°C compared with 22°C (Figure 8). Both PKSA and PKSG5 encode polyketide synthase that are involved in the condensation of malonyl-CoA units (Mizuuchi et al., 2008; Flores-Sanchez et al., 2010), FGRAMPH1_01T20223 is predicted to encode TER1 that participates in the formation of emodin anthrone (Kong et al., 2013), MALD1 and STH-2 are predicted to encode POCP, and At4g20800 encodes BBE-like 17 that catalyzes the oxidation of aromatic allylic alcohols (Daniel et al., 2015). The up-regulation of these genes (PKSA, FGRAMPH1_01T20223 and At4g20800) in dark glands at a cooler temperature is predicted to play a role in inducing Hyp biosynthesis and accumulation. In this study, the two CHS and CHS1 genes are not up-regulated, and the significant down-regulation (0.63-fold) of CHS1 might indicate that the reduced temperatures negatively affect phenylpropanoid biosynthesis. If this effect is directly connected to the up-regulation of the Hyp biosynthetic pathway via redirecting the pool of 4-coumaroyl-CoA and malonyl-CoA precursors remains to be established. This will require quantitative phenolic profiling by LC-MS combined with flux analysis, but is beyond the scope of this manuscript.
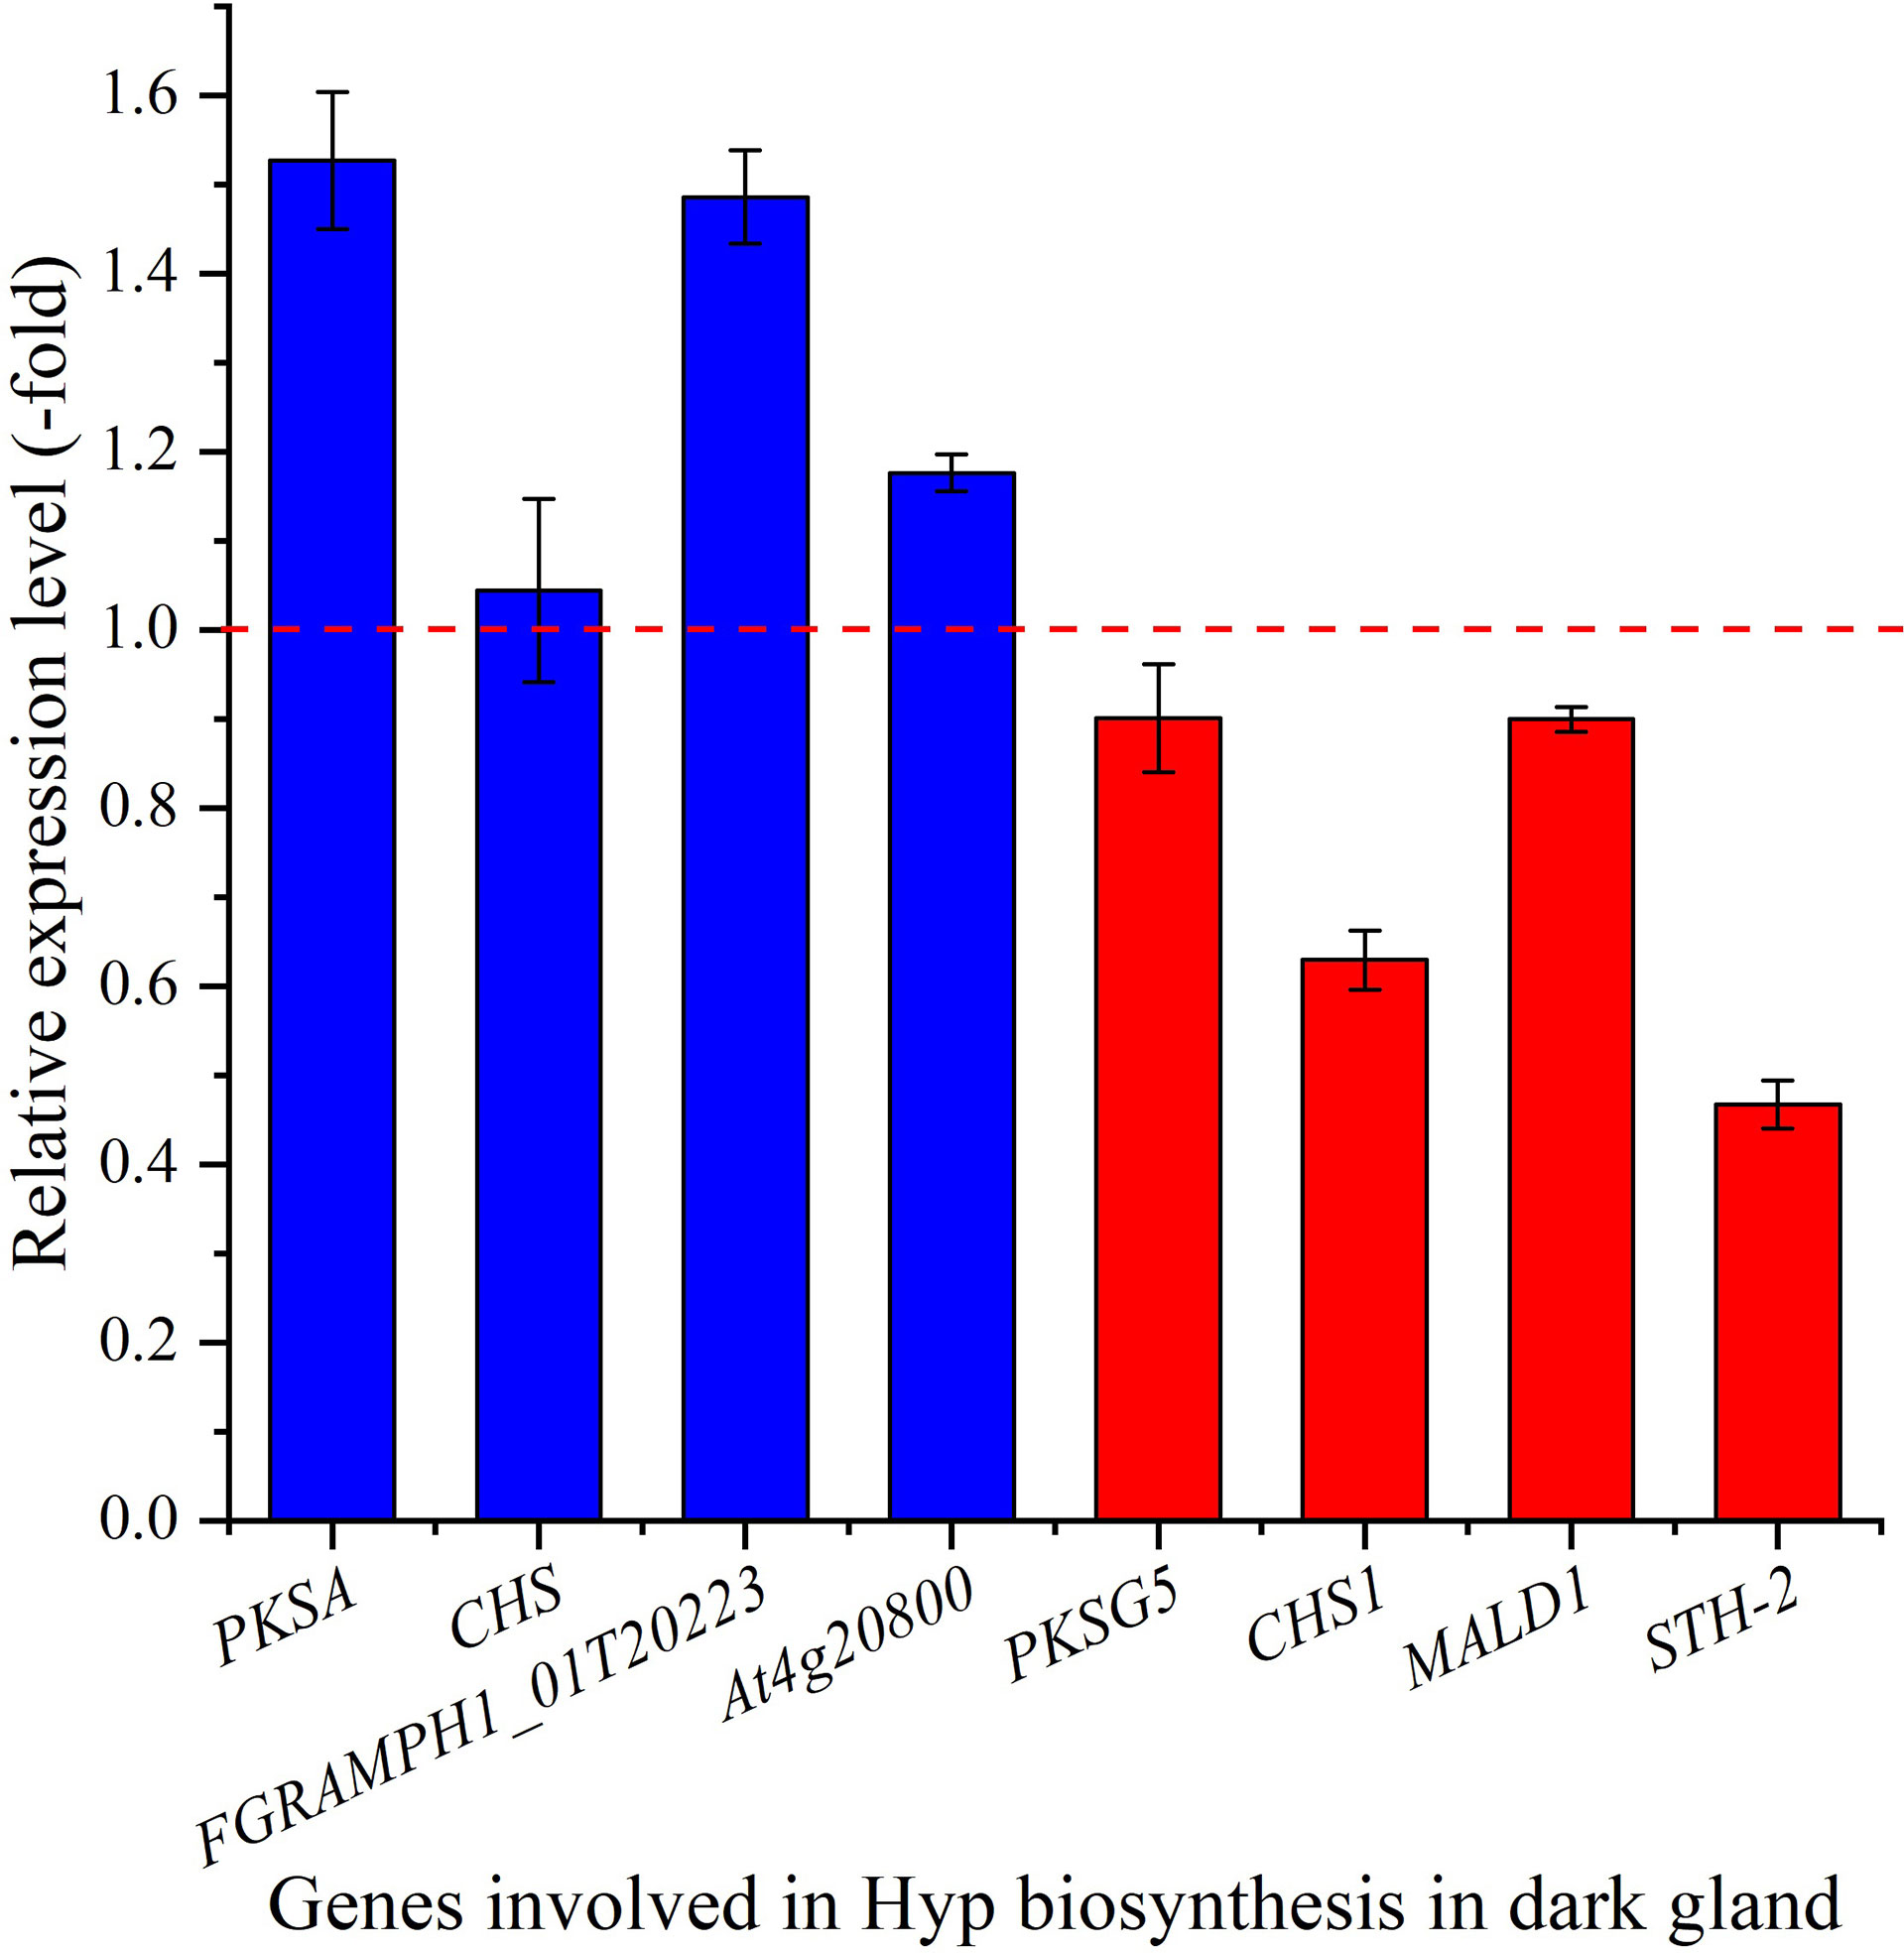
Figure 8 The expression level of genes involved in Hyp biosynthesis in dark gland for seedlings grown at 15 versus 22°C, as determined by qRT-PCR (n=3). Column highlighted in blue represents gene up-regulation and red represents gene down-regulation. The red dotted line in the image differentiates up-regulation (>1) and down-regulation (<1) at 15°C compared with 22°C (Control), respectively.
4 Conclusions
In Hypericum perforatum, low temperature changes cell structure (e.g. dark gland, secretory cell and hemispherical droplet) associated with regulating plant growth and gene expression (e.g. BBE, POCP and TER1) associated with Hyp biosynthesis in leaf green tissue and dark gland. These findings not only further confirm that low temperature enhances plant growth and Hyp biosynthesis (Yao et al., 2019; Tavakoli et al., 2020), but also complement previous transcriptomic analysis (Su et al., 2021). Moreover, these findings will provide useful references for guiding H. perforatum cultivation in field or green house, cell and tissue culture, and revealing the mechanism of Hyp biosynthesis to increase Hyp accumulation.
Data availability statement
The datasets presented in this study can be found in online repositories. The names of the repository/repositories and accession number(s) can be found in the article/Supplementary Material.
Author contributions
HS: data curation and investigation. LJ: Resourses. ML: conceptualization, project administration and writing—original draft. PP: writing—review and editing. All authors contributed to the article and approved the submitted version.
Funding
This research was funded by State Key Laboratory of Aridland Crop Science/Gansu Agricultural University (GSCS-2021-Z03), Assurance Project of Ecological Planting and Quality of Daodi Herbs (202103003).
Conflict of interest
The authors declare that the research was conducted in the absence of any commercial or financial relationships that could be construed as a potential conflict of interest.
Publisher’s note
All claims expressed in this article are solely those of the authors and do not necessarily represent those of their affiliated organizations, or those of the publisher, the editors and the reviewers. Any product that may be evaluated in this article, or claim that may be made by its manufacturer, is not guaranteed or endorsed by the publisher.
Supplementary material
The Supplementary Material for this article can be found online at: https://www.frontiersin.org/articles/10.3389/fpls.2022.1020857/full#supplementary-material
References
Allen, K. N., Whitman, C. P. (2021). The birth of genomic enzymology: discovery of the mechanistically diverse enolase superfamily. Biochemistry 60, 3515–3528. doi: 10.1021/acs.biochem.1c00494
Armbruster, U., Labs, M., Pribil, M., Viola, S., Xu, W., Scharfenberg, M., et al. (2013). Arabidopsis CURVATURE THYLAKOID1 proteins modify thylakoid architecture by inducing membrane curvature. Plant Cell 25, 2661–2678. doi: 10.1105/tpc.113.113118
Bagdonaitė, E., Mártonfi, P., Repčák, M., Labokas, J. (2010). Variation in the contents of pseudohypericin and hypericin in Hypericum perforatum from Lithuania. Biochem. Syst. Ecol. 38, 634–640. doi: 10.1016/j.bse.2010.08.005
Barnes, J., Anderson, L. A., Phillipson, J. D. (2001). St John's wort (Hypericum perforatum l.): a review of its chemistry, pharmacology and clinical properties. J. Pharm. Pharmacol. 53, 583–600. doi: 10.1211/0022357011775910
Beaudoin, F., Wu, X., Li, F., Haslam, R. P., Markham, J. E., Zheng, H., et al. (2009). Functional characterization of the Arabidopsis beta-ketoacyl-coenzyme a reductase candidates of the fatty acid elongase. Plant Physiol. 150, 1174–1191. doi: 10.1104/pp.109.137497
Berg, M., Rogers, R., Muralla, R., Meinke, D. (2005). Requirement of aminoacyl-tRNA synthetases for gametogenesis and embryo development in Arabidopsis. Plant J. 44, 866–878. doi: 10.1111/j.1365-313X.2005.02580.x
Briskin, D. P., Gawienowski, M. C. (2001). Differential effects of light and nitrogen on production of hypericins and leaf glands in Hypericum perforatum. plant physiol. Biochem 39, 1075–1081. doi: 10.1016/S0981-9428(01)01326-2
Brunáková, K., Petijová, L., Zámecník, J., Turecková, V., Cellárová, E. (2015). The role of ABA in the freezing injury avoidance in two Hypericum species differing in frost tolerance and potential to synthesize hypericins. Plant Cell. Tiss. Org. 122, 45–56. doi: 10.1007/s11240-015-0748-9
Bussell, J. D., Reichelt, M., Wiszniewski, A. A., Gershenzon, J., Smith, S. M. (2014). Peroxisomal ATP-binding cassette transporter COMATOSE and the multifunctional protein abnormal INFLORESCENCE MERISTEM are required for the production of benzoylated metabolites in Arabidopsis seeds. Plant Physiol. 164, 48–54. doi: 10.1104/pp.113.229807
Capitani, G., Markovic-Housley, Z., DelVal, G., Morris, M., Jansonius, J. N., ürmann, P. (2000). Crystal structures of two functionally different thioredoxins in spinach chloroplasts. J. Mol. Biol. 302, 135–154. doi: 10.1006/jmbi.2000.4006
Ciccarelli, D., Andreucci, A. C., Pagni, A. M. (2001). Translucent glands and secretory canals in Hypericum perforatum L. (Hypericaceae): Morphological, anatomical and histochemical studies during the course of ontogenesis. Ann. Bot. 88, 637–644. doi: 10.1006/anbo.2001.1514
Cirak, C., Radušienė, J., Karabük, B., Janulis, V. (2007). Variation of bioactive substances and morphological traits in Hypericum perforatum populations from northern Turkey. Biochem. Syst. Eco. 35, 403–409. doi: 10.1016/j.bse.2007.01.009
Couceiro, M. A., Afreen, F., Zobayed, S. M. A., Kozai, T. (2006). Variation in concentrations of major bioactive compounds of st. john’s wort: Effects of harvesting time, temperature and germplasm. Plant Sci. 170, 128–134. doi: 10.1016/j.plantsci.2005.08.011
Daniel, B., Pavkov-Keller, T., Steiner, B., Dordic, A., Gutmann, A., Nidetzky, B., et al. (2015). Oxidation of monolignols by members of the berberine bridge enzyme family suggests a role in plant cell wall metabolism. J. Bio. Chem. 290, 18770–18781. doi: 10.1074/jbc.M115.659631
Dong, H., Li, M. L., Jin, L., Xie, X. R., Li, M. F., Wei, J. H. (2022). Cool temperature enhances growth, ferulic acid and flavonoid biosynthesis while inhibiting polysaccharide biosynthesis in Angelica sinensis. Molecules 27, 320. doi: 10.3390/molecules27010320
Ducluzeau, A. L., Wamboldt, Y., Elowsky, C. G., Mackenzie, S. A., Schuurink, R. C., Basset, G. J. (2012). Gene network reconstruction identifies the authentic trans-prenyl diphosphate synthase that makes the solanesyl moiety of ubiquinone-9 in Arabidopsis. Plant J. 69, 366–375. doi: 10.1111/j.1365-313X.2011.04796.x
Erdelmeier, C. (1998). Hyperforin, possibly the major non-nitrogenous secondary metabolite of Hypericum perforatum L. Pharmacopsychiatry 31, 2–6. doi: 10.1055/s-2007-979339
Ferrer, J. L., Jez, J. M., Bowman, M. E., Dixon, R. A., Noel, J. P. (1999). Structure of chalcone synthase and the molecular basis of plant polyketide biosynthesis. Nat. Struct. Biol. 6, 775. doi: 10.1038/11553
Fiebig, A., Mayfield, J. A., Miley, N. L., Chau, S., Fischer, R. L., Preuss, D. (2000). Alterations in CER6, a gene identical to CUT1, differentially affect long-chain lipid content on the surface of pollen and stems. Plant Cell 12, 2001–2008. doi: 10.2307/3871209
Flores-Sanchez, I. J., Linthorst, H. J., Verpoorte, R. (2010). In silicio expression analysis of PKS genes isolated from cannabis sativa L. Genet. Mol. Biol. 33, 703–713. doi: 10.1590/S1415-47572010005000088
Germ, M., Stibilj, V., Kreft, S., Gaberšˇcik, A., Kreft, I. (2010). Flavonoid, tannin and hypericin concentrations in the leaves of st. john’s wort (Hypericum perforatum L.) are affected by UV-b radiation levels. Food Chem. 122, 471–474. doi: 10.1016/j.foodchem.2010.03.008
Giese, J. O., Herbers, K., Hoffmann, M., Kloesgen, R. B., Sonnewald, U. (2005). Isolation and functional characterization of a novel plastidic hexokinase from nicotiana tabacum. FEBS Lett. 579, 827–831. doi: 10.1016/j.febslet.2004.12.071
Glauser, D. A., Bourquin, F., Manieri, W., Schurmann, P. (2004). Characterization of ferredoxin: Thioredoxin reductase modified by site-directed mutagenesis. J. Biol. Chem. 279, 16662–16669. doi: 10.1074/jbc.M313851200
Gotor, C., Alvarez, C., Bermúdez, M. A., Moreno, I., García, I., Romero, L. C. (2010). Low abundance does not mean less importance in cysteine metabolism. Plant Signal Behav. 5, 1028–1030. doi: 10.4161/psb.5.8.12296
Gray, D. E., Pallardy, S. G., Garrett, H. E., Rottinghaus, G. E. (2003). Effect of acute drought stress and time of harvest on phytochemistry and dry weight of st. john’s wort leaves and flowers. Planta Med. 69, 1024–1030. doi: 10.1055/s-2003-45150
Hertle, A. P., Blunder, T., Wunder, T., Pesaresi, P., Pribil, M., Armbruster, U., et al. (2013). PGRL1 is the elusive ferredoxin-plastoquinone reductase in photosynthetic cyclic electron flow. Mol. Cell 49, 511–523. doi: 10.1016/j.molcel.2012.11.030
Hu, J. J., Wu, W., Cao, Z. H., Wen, J., Shu, Q. L., Fu, S. L. (2016). Morphological, physiological and biochemical responses of camellia oleifera to low-temperature stress. Pak. J. Bot. 48, 899–905.
Karimi, M., Ahmadi, N., Ebrahimi, M. (2022). Red LED light promotes biomass, flowering and secondary metabolites accumulation in hydroponically grown Hypericum perforatum L. (cv. topas). Ind. Crop Prod. 175, 114239. doi: 10.1016/j.indcrop.2021.114239
Kaundal, M., Sharma, R., Kumar, R. (2021). Elevated CO2 and temperature effect on growth, phenology, biomass and hypericin content of Hypericum perforatum L. in the western himalaya. Plant Physiol. Rep. 26, 116–127. doi: 10.1007/s40502-021-00571-7
Kong, E., Peng, S., Chandra, G., Sarkar, C., Zhang, Z., Bagh, M. B., et al. (2013). Dynamic palmitoylation links cytosol-membrane shuttling of acyl-protein thioesterase-1 and acyl-protein thioesterase-2 with that of proto-oncogene h-ras product and growth-associated protein-43. J. Biol. Chem. 288, 9112–9125. doi: 10.1074/jbc.M112.421073
Kornfeld, A., Kaufman, P. B., Lu, C. R., Gibson, D. M., Bolling, S. F., Warber, S. L., et al. (2007). The production of hypericins in two selected Hypericum perforatum shoot cultures is related to differences in black gland structure. Plant Physiol. Bioch. 45, 24–32. doi: 10.1016/j.plaphy.2006.12.009
Kwon, K. C., Cho, M. H. (2008). Deletion of the chloroplast-localized AtTerC gene product in Arabidopsis thaliana leads to loss of the thylakoid membrane and to seedling lethality. Plant J. 55, 428–442. doi: 10.1111/j.1365-313X.2008.03523.x
Li, L., Li, N. H., Jiang, S. M. (2009). Experimental guidance of plant physiology module (Beijing: Science Press), 22–39.
Li, M. F., Lv, M., Yang, D. L., Wei, J. H., Xing, H., Pare, P. W. (2020). Temperature-regulated anatomical and gene-expression changes in sinopodophyllum hexandrum seedlings. Ind. Crop Prod. 152, 112479. doi: 10.1016/j.indcrop.2020.112479
Li, X. F., Zhang, Z. L. (2016). Guidance for plant physiology experiments, 5th edition (Beijing: Higher Education Press), 30–31.
Love, M. I., Huber, W., Anders, S. (2014). Moderated estimation of fold change and dispersion for RNAseq data with DESeq2. Genome Biol. 15, 550. doi: 10.1186/s13059-014-0550-8
Lv, H. F., Hu, Z. H. (2001). Studies on the development of secretory structures and their secretory products accumulation of Hypericum perforatum. Acta Bota Boreal-Occident Sin. 21, 287–292. doi: 10.3321/j.issn:1000-4025.2001.02.016
Maia, R. M., Valente, V., Cunha, M. A., Cunha, M. A. V., Sousa, J. F., Araujo, D. D., et al. (2007). Identification of unannotated exons of low abundance transcripts in drosophila melanogaster and cloning of a new serine protease gene upregulated upon injury. BMC Genomics 8, 249. doi: 10.1186/1471-2164-8-249
Mizuuchi, Y., Shimokawa, Y., Wanibuchi, K., Noguchi, H., Abe, I. (2008). Structure function analysis of novel type III polyketide synthases from Arabidopsis thaliana. Biol. Pharm. Bull. 31, 2205–2210. doi: 10.1248/bpb.31.2205
Munekage, Y., Hojo, M., Meurer, J., Endo, T., Tasaka, M., Shikanai, T. (2002). PGR5 is involved in cyclic electron flow around photosystem I and is essential for photoprotection in Arabidopsis. Cell 110, 361–371. doi: 10.1016/S0092-8674(02)00867-X
Mustroph, A., Sonnewald, U., Biemelt, S. (2007). Characterisation of the ATP-dependent phosphofructokinase gene family from Arabidopsis thaliana. FEBS Lett. 581, 2401–2410. doi: 10.1016/j.febslet.2007.04.060
Nahrstedt, A., Butterweck, V. (1997). Biologically active and other chemical constituents of the herb of Hypericum perforatum L. Pharmacopsychiatry 30, 129–134. doi: 10.1055/s-2007-979533
Najafabadi, A. S., Khanahmadi, M., Ebrahimi, M., Moradi, K., Behroozi, P., Noormohammadi, N. (2019). Effect of different quality of light on growth and production of secondary metabolites in adventitious root cultivation of Hypericum perforatum. Plant Signal. Behav 14, 1559–2324. doi: 10.1080/15592324.2019.1640561
Nakagawa, N., Sakurai, N. (2006). A mutation in At-nMat1a, which encodes a nuclear gene having high similarity to group II intron maturase, causes impaired splicing of mitochondrial NAD4 transcript and altered carbon metabolism in Arabidopsis thaliana. Plant Cell Physiol. 47, 772–783. doi: 10.1093/pcp/pcj051
Napoli, E., Siracusa, L., Ruberto, G., Carrubba, A., Lazzara, S., Speciale, A., et al. (2018). Phytochemical profiles, phototoxic and antioxidant properties of eleven Hypericum species–a comparative study. Phytochemistry 152, 162–173. doi: 10.1016/j.phytochem.2018.05.003
Peltier, J. B., Emanuelsson, O., Kalume, D. E., Ytterberg, J., Friso, G., Rudella, A., et al. (2002). Central functions of the lumenal and peripheral thylakoid proteome of Arabidopsis determined by experimentation and genome-wide prediction. Plant Cell 14, 211–236. doi: 10.1105/tpc.010304
Poupon, V., Begue, B., Gagnon, J., Dautry-Varsat, A., Cerf-Bensussan, N., Benmerah, A. (1999). Molecular cloning and characterization of MT-ACT48, a novel mitochondrial acyl-CoA thioesterase. J. Biol. Chem. 274, 19188–19194. doi: 10.1074/jbc.274.27.19188
Rizzo, P., Altschmied, L., Ravindran, B. M., Rutten, T., D’Auria, J. C. (2020). The biochemical and genetic basis for the biosynthesis of bioactive compounds in Hypericum perforatum L., one of the largest medicinal crops in Europe. Genes 11, 1210. doi: 10.3390/genes11101210
Rizzo, P., Altschmied, L., Stark, P., Rutten, T., Guendel, A., Scharfenberg, S., et al. (2019). Discovery of key regulators of dark gland development and hypericin biosynthesis in st. john’s wort (Hypericum perforatum). Plant Biotechnol. J. 17, 2299–2312. doi: 10.1111/pbi.13141
Robinson, M. D., McCarthy, D. J., Smyth, G. K. (2009). EdgeR: A bioconductor package for differential expression analysis of digital gene expression data. Brief Bioinform. 26, 139–140. doi: 10.1093/bioinformatics/btp616
Schneider, A., Steinberger, I., Strissel, H., Kunz, H. H., Manavski, N., Meurer, J., et al. (2014). The Arabidopsis tellurite resistance c protein together with ALB3 is involved in photosystem II protein synthesis. Plant J. 78, 344–356. doi: 10.1111/tpj.12474
Soták, M., Czeranková, O., Klein, D., Jurčacková, Z., Li, L., Čellárová, E. (2016). Comparative transcriptome reconstruction of four Hypericum species focused on hypericin biosynthesis. Front. Plant Sci. 7. doi: 10.3389/fpls.2016.01039
Stoyanova-Koleva, D., Stefanova, M., Ganeva, T. S., Cellárová, E. (2015). Structural modifications in the mesophyll associated with cryopreservation of seven Hypericum species. Biol. Plantarum. 59, 214–520. doi: 10.1007/s10535-015-0528-8
Su, H. Y., Li, J., Chen, S. J., Sun, P., Xing, H., Yang, D. L., et al. (2021). Physiological and transcriptomic analysis provide insight into low temperature enhancing hypericin biosynthesis in Hypericum perforatum. Molecules 26, 2294. doi: 10.3390/molecules26082294
Taiz, L., Zeiger, E. (2010). “The control of flowering,” in Plant physiology, 5th Edition. Eds. Fosket, D. E., Amasino, R. (Sunderland, MA, USA: Sinauer Associates, Inc), 559–590.
Tavakoli, F., Rafieiolhossaini, M., Ravash, R., Ebrahimi, M. (2020). UV-B radiation and low temperature promoted hypericin biosynthesis in adventitious root culture of Hypericum perforatum. Plant Signal. Behav 15, 1764184. doi: 10.1080/15592324.2020.1764184
Todd, J. F., Blakeley, S. D., Dennis, D. T. (1995). Structure of the genes encoding the alpha- and beta-subunits of castor pyrophosphate-dependent phosphofructokinase. Gene 152, 181–186. doi: 10.1016/0378-1119(94)00646-A
Walker, L., Sirvent, T., Gibson, D., Vance, N. (2001). Regional differences in hypericin and pseudohypericin concentrations and five morphological traits among Hypericum perforatum plants in the northwestern united states. Can. J. Bot. 79, 1248–1255. doi: 10.1139/cjb-79-10-1248
Wang, S. H., Liang, W. X., Yao, L., Wang, J., Gao, W. Y. (2019). Effect of temperature on morphology, ginsenosides biosynthesis, functional genes, and transcriptional factors expression in Panax ginseng adventitious roots. J. Food Biochem. 43, e12794. doi: 10.1111/jfbc.12794
Wang, Q., Sullivan, R. W., Kight, A., Henry, R. L., Huang, J., Jones, A. M., et al. (2004). Deletion of the chloroplast-localized thylakoid formation1 gene product in Arabidopsis leads to deficient thylakoid formation and variegated leaves. Plant Physiol. 136, 3594–3604. doi: 10.1104/pp.104.049841
Willems, E., Leyns, L., Vandesompele, J. (2008). Standardization of real-time PCR gene expression data from independent biological replicates. Anal. Biochem. 379, 127–129. doi: 10.1016/j.ab.2008.04.036
Yang, J. J., Qu, Y., Cui, X. M. (2014). Determination of chloropyll and carotenoid in the aerial part of Panax Notoginseng. Special Wild Econ. Animal Plant Res. 2, 63–66. doi: 10.3969/j.issn.1001-4721.2014.02.016
Yao, Y. Y., Kang, T. L., Jin, L., Liu, Z. H., Zhang, Z., Xing, H., et al. (2019). Temperature-dependent growth and hypericin biosynthesis in Hypericum perforatum. Plant Physiol. Biochem 139, 613–619. doi: 10.1016/j.plaphy.2019.04.012
Zhang, J. H., Huang, W. D., Liu, Y. P., Pan, Q. H. (2005). Effects of temperature acclimation pretreatment on the ultrastructure of mesophyll cells in young grape plants (Vitis vinifera l. cv. jingxiu) under cross-temperature stresses. J. Integr. Plant Biol. 47, 959–970. doi: 10.1111/j.1744-7909.2005.00109.x
Zhang, R. F., Ji, Y. Y., Morcol, T., Lin, F. K., Gu, R. H., Kennelly, E. J., et al. (2021). UPLC-QTof-MS chemical profiling and characterization of antiproliferative and anti-inflammatory compounds from seven Hypericum species in China. Ind. Crop Prod. 173, 114156. doi: 10.1016/j.indcrop.2021.114156
Zobayed, S. M. A., Afreen, F., Goto, E., Kozai, T. (2006). Plant–environment interactions: Accumulation of hypericin in dark glands of Hypericum perforatum. Ann. Bot. 98, 793–804. doi: 10.1093/aob/mcl169
Zobayed, S. M. A., Afreen, F., Kozai, T. (2005). Temperature stress can alter the photosynthetic efficiency and secondary metabolite concentrations in st. john’s wort. Plant Physiol. Biochem. 43, 977–984. doi: 10.1016/j.plaphy.2005.07.013
Keywords: hypericum perforatum, temperature, green tissue, dark gland, secretory cell, hypericin
Citation: Su H, Jin L, Li M and Paré PW (2022) Low temperature modifies seedling leaf anatomy and gene expression in Hypericum perforatum. Front. Plant Sci. 13:1020857. doi: 10.3389/fpls.2022.1020857
Received: 16 August 2022; Accepted: 13 September 2022;
Published: 27 September 2022.
Edited by:
Jin-Lin Zhang, Lanzhou University, ChinaReviewed by:
Cinzia Margherita Bertea, University of Turin, ItalyThomas Vogt, Leibniz-Institut für Pflanzenbiochemie (IPB), Germany
Huahua Wang, Henan Normal University, China
Copyright © 2022 Su, Jin, Li and Paré. This is an open-access article distributed under the terms of the Creative Commons Attribution License (CC BY). The use, distribution or reproduction in other forums is permitted, provided the original author(s) and the copyright owner(s) are credited and that the original publication in this journal is cited, in accordance with accepted academic practice. No use, distribution or reproduction is permitted which does not comply with these terms.
*Correspondence: Mengfei Li, bG1mQGdzYXUuZWR1LmNu; Paul W. Paré, cGF1bC5wYXJlQHR0dS5lZHU=