 Jianfei Zhou
 Tianqi Song
 Hongwei Zhou
 Mingfei Zhang2
 Nan Li
95% of researchers rate our articles as excellent or good
Learn more about the work of our research integrity team to safeguard the quality of each article we publish.
Find out more
ORIGINAL RESEARCH article
Front. Plant Sci. , 22 December 2022
Sec. Plant Breeding
Volume 13 - 2022 | https://doi.org/10.3389/fpls.2022.1020584
This article is part of the Research Topic Chloroplast Redox State: New Insights Into Stress Responses and Acclimation View all 5 articles
Typical thioredoxin (TRX) plays an important role in maintaining redox balance in plants. However, the typical TRX genes in wheat still need to be comprehensively and deeply studied. In this research, a total of 48 typical TaTRX genes belonging to eight subtypes were identified via a genome-wide search in wheat, and the gene structures, protein conserved motifs, and protein 3D structures of the same subtype were very similar. Evolutionary analysis showed that there are two pairs of tandem duplication genes and 14 clusters of segmental duplication genes in typical TaTRX family members; TaTRX15, TaTRX36, and TaTRX42 had positive selection compared with the orthologs of their ancestral species; rice and maize have 11 and 13 orthologous typical TRXs with wheat, respectively. Gene Ontology (GO) analysis indicated that typical TaTRXs were involved in maintaining redox homeostasis in wheat cells. Estimation of ROS content, determination of antioxidant enzyme activity, and gene expression analysis in a line overexpressing one typical TaTRX confirmed that TRX plays an important role in maintaining redox balance in wheat. A predictive analysis of cis-acting elements in the promoter region showed that typical TaTRXs were extensively involved in various hormone metabolism and response processes to stress. The results predicted using public databases or verified using RT-qPCR show that typical TaTRXs were able to respond to biotic and abiotic stresses, and their expression in wheat was spatiotemporal. A total of 16 wheat proteins belonging to four different families interacting with typical TaTRXs were predicted. The above comprehensive analysis of typical TaTRX genes can enrich our understanding of this gene family in wheat and provide valuable insights for further gene function research.
Thioredoxins (TRXs) are ancient, small-molecule proteins that are widely present in prokaryotic and eukaryotic organisms, and mainly act as redox regulators (Holmgren, 1985). TRX forms the TRX system with thioredoxin reductase (TrxR) and the electron-donor nicotinamide adenine dinucleotide phosphate (NADPH) or ferredoxin (Fdx). The system has many functions, such as maintaining redox balance and regulating biological signal transduction (Meyer et al., 2012). TRXs contain the TRX domain in their amino acid sequences, which contain a conserved active site with an amino acid sequence of -Cys-X-X-Cys- (-CXXC-, the X represents amino acids other than Cys). Two cysteine sulfhydryl groups at the active site of a TRX protein can reversibly form disulfide bonds, making TRX existing in two forms: the oxidized state and the reduced state. Disulfide bonds reduced by TRXs are properly formed in the target proteins, thus regulating the activities and spatial structures of the target proteins (Gelhaye et al., 2005). The sequence of the active site of TRX determines the difference in catalytic properties. TRX proteins in plants can be divided into various types according to their active site sequences. TRXs containing the classical active site “WCGPC” are called typical TRXs. Other atypical TRXs include protein disulfide isomerase (PDI) containing the active site of “WCGHC”, chloroplastic drought-induced stress protein32 (CDSP32) containing “HCGPC”, and HCF containing “WCEVC” (Meyer et al., 2005; Chibani et al., 2012). Typical TRXs arouse the extensive attention of researchers because of their diverse functions involved in regulating plant growth and development, and alleviating oxidative stress caused by biotic/abiotic stress (Geigenberger et al., 2017).
Typical TRX subtypes in plants include TRX-F, -H, -M, -O, -X, -Y, -Z, and nucleoredoxin (NRX) containing the “WCGPC” active site. These typical TRXs are distributed in the cytoplasm and various organelles of plant cells, and can guarantee the proper progress of various physiological and biochemical activities in plants under normal circumstances by regulating the redox state of various target proteins. Typical TRXs are important regulators of the reactive oxygen species (ROS) scavenging mechanisms and important parts of the antioxidant signal network in plants when they are subjected to oxidative stresses caused by biotic and abiotic constraints (Vieira Dos Santos and Rey, 2006). The TRX-F subtype was originally described as the catalyst for Fructose 1, 6-bisphosphase (FBPase) in spinach (Spinacia oleracea L.) (Buchanan, 1980). In Arabidopsis thaliana, the adaptability of the AtTRX-F1 mutant to different light intensities is weakened, and the Calvin–Benson cycle activity and starch accumulation of the AtTRX-F1 mutant are strongly inhibited, resulting in severe inhibition of the growth of the mutant (Thormählen et al., 2015). The TRX-H subtype receives its name from the word “heterotrophic” because it was first found to exist in non-photosynthetic tissues. Most TRX-H subtypes are localized in the cytoplasm and they have also been found in the endoplasmic reticulum, mitochondria and nucleus (Gelhaye et al., 2004). The expression of the H type thioredoxin gene AtTRX-H5 in Arabidopsis thaliana is closely related to aging, pathogen infection and various kinds of oxidative stress (Christophe et al., 2004). The overexpression of the NtTRX-H3 gene in tobacco enhances its resistance to paraquat-induced oxidative stress, and its chloroplast damage is lower than that of the wild type. In addition, the overexpression of the NtTRX-H3 gene in tobacco enhances its resistance to tobacco mosaic virus (TMV) and cucumber mosaic virus (CMV) (Sun et al., 2010). TaTRX-H1 interacts with TaCP1 (a RD19-like cysteine protease) and participates in the regulation of the salicylic acid (SA) related defense signaling pathway, thus regulating wheat resistance to stripe rust (Shi et al., 2021). Multiple ABA response cis-elements have been predicted in the 1500 bp region upstream of the start codon of the TaTRX-h9 gene, and the expression of TaTRX-H9 in wheat leaves is induced by drought stress and ABA (Li et al., 2019). TRX-M proteins were initially described as catalysts for NADPH-dependent NADP-malate dehydrogenase (NADP-MDH) (Buchanan et al., 1980). TRX–M–mediated redox regulation has important effects on leaf structure, gas exchange, energy transfer, and anthocyanin accumulation. Based on the study of AtTRX-M depletion mutants in Arabidopsis, it was found that AtTRX-M protein plays an active role in the resistance of Arabidopsis to high light intensity stress (Serrato et al., 2021). The knockout of OsTRX-M in rice results in abnormal chloroplast development and inhibits the growth of the plants (Chi et al., 2008). O-type TRX has a predicted N-terminal mitochondrial target peptide, which was subsequently confirmed by subcellular localization in the mitochondria (Laloi et al., 2001). AtTRX-O1 was found to regulate the thiol redox status of succinate dehydrogenase and fumarase in the tricarboxylic acid (TCA) cycle, so as to regulate the activities of these two enzymes and ensure the smooth operation of the TCA cycle (Daloso et al., 2015). After treatment with a high concentration of H2O2, the overexpression of PsTRX-O1 (Pisum sativum L.) in tobacco is associated with increased catalase activity in cells and reduced content of endogenous H2O2, and finally keep the cell vitality of the tobacco overexpressing the TRX-O1 gene unchanged or make it even higher (Ortiz-Espín et al., 2015). TRX-X was originally identified in the genome of Arabidopsis thaliana, and its encoded protein exists in the chloroplast. The determination of kinetic parameters shows that TRX-X is a very effective reducing agent for 2-cys peroxiredoxin (Prx) (Collin et al., 2003). TRX-Y has also been identified in the chloroplast of Arabidopsis, and the TRX-Y gene is mainly expressed in leaves and induced by light (Collin et al., 2004). TRX-Z has high homology with TRX-X and TRX-Y based on phylogenetic analysis. Functional loss analyses of TRX-Z in Arabidopsis thaliana and Nicotiana bentosa have shown that TRX-Z interacts with two fructokinase-like proteins (FLN) to regulate chloroplast development (Arsova et al., 2010). Laughner et al. (1998) identified a new type of TRX in the nucleus from maize (Zea mays L.) and named it nucleoredoxin (NRX). NRX in plants can interact directly with phosphofructokinase 1 (PFK1) to regulate PFK1 activity, thus maintaining a balance between the glycolysis and pentose phosphate pathways (Funato et al., 2013). The overexpression of TaNRX1 (TaTRX24 in this study) in wheat can lead to an increase in gene expression related to hormone signal transduction, phenylpropane biosynthesis, carbon metabolism, and nitrogen metabolism, thus significantly enhancing the drought resistance of wheat (Zhang Y. R. et al., 2021). The aforementioned results indicate that typical TRXs in plants can affect and regulate a variety of metabolic pathways and improve defense against adverse stresses in plants due to the diversity of family members and their extensive distributions in cells.
Wheat is one of the most important crops globally and is widely grown in different geographical, climatic and ecological regions around the world (Yue et al., 2019). The world’s wheat production in 2020 was about 760.9 million tons, as counted by the Food and Agriculture Organization of the United Nations (FAO) (https://www.fao.org/faostat/-en/#data/QCL/visualize). At present, the challenges of global climate change and population surge are becoming increasingly serious. The stability of wheat yields is the top priority to ensure world food security and economic development (Pankaj et al., 2022). The yield and quality of wheat are severely affected by biotic and abiotic stresses such as disease, drought, high temperature, cold, high salinity and so on. In order to cope with and adapt to these stresses, wheat has evolved a complex regulatory network, which can regulate different biochemical and physiological processes under stress conditions (Kumar et al., 2022; Wang et al., 2022a; Wang et al., 2022b). Therefore, it is necessary to improve the stress resistance of wheat, reduce the influence of stress on the growth and development of wheat, and ultimately improve the yield and quality of wheat by exploring and studying the genes related to stress regulation in wheat and selecting and utilizing them in the breeding process. Wheat is a heterologous hexaploid with a large and complex genome consisting of three subgenomes (A, B, and D), making it an ideal model for studying polyploidy and the subfunctionalization of plant homologous genes. The completion of high-quality reference sequences enables researchers to study the gene distribution and evolutionary dynamics of wheat gene families at the genome-wide level (IWGSC, 2018). Bhurta et al. (2022) identified 42 TRX genes in wheat, and then selected 15 of them based on in silico expression analysis for bioinformatics comprehensive analysis, and further studies related to stripe rust showed that four TaTRX genes were significantly induced in the response to stripe rust infection, and that TRX can maintain the ROS homeostasis of wheat cells between 24h and 72h after wheat leaves were inoculated with stripe rust. However, all of the typical TRX genes in wheat have not yet been comprehensively and systematically studied. In this study, we performed a genome-wide search and identification of the typical TRX gene family in wheat, and then systematically analyzed the chromosomal location, phylogenetic relationship, gene structure, protein conserved domain, protein 3D structure, gene ontology, the relationship between redox status and TRX gene expression, cis-acting elements, and protein interaction networks. We also analyzed the spatiotemporal expression characteristics of typical TaTRX genes and the expression characteristics of typical TaTRX genes under abiotic or biotic stresses such as drought, high temperature, low temperature, salt, stripe rust and powdery mildew. The results obtained extend our understanding of the biological functions and evolutionary history of typical TaTRX genes and their encoded proteins in wheat, lay a foundation for further studies on the functions of typical TRX gene families in wheat and other crops, and enable us to provide candidate genes for breeding wheat varieties with strong stress resistance.
The coding DNA sequence (CDS), protein sequence and general feature format version 3 (GFF3) files of Triticum aestivum L. were downloaded from the Ensembl Plants database (http://plants.ensembl.org/Triticum_aestivum/Info/Index/). The hidden Markov model (HMM) of TRX (PF00085) was downloaded from the Pfam database (http://pfam.xfam.org/). The HMMER 3.1 search tool was used to screen the wheat TRX proteins. The cutoff value for the HMMsearch program was 0.001. The putative TaTRXs were subsequently submitted to the NCBI-CDD server (https://www.ncbi.nlm.nih.gov/cdd/), SMART database (http://smart.embl.de/) and HMMscan (https://www.ebi.ac.uk/Tools/hmmer/search/hmmscan/) to confirm the existence of the TRX domain. Finally, proteins containing the “WCGPC” sequence in the TRX domain were screened out, and were named according to their chromosomal locations. The same method was used to identify the typical TRX genes in Triticum turgidum (emmer wheat), Aegilops tauschii, Arabidopsis thaliana, Oryza sativa (rice), and Zea mays (maize). The chromosome locations of the typical TaTRX genes were obtained from the GFF3 files and were then visualized using the Mapchart (v2.32) software. The molecular weight (Mw), isoelectric point (pI), and grand average of hydropathicity (GRAVY) values of these identified proteins were investigated using ExPASy online tools (http://web.expasy.org/protparam/). Their subcellular localizations were predicted based on the CELLO online tool (v2.5, http://cello.life.nctu.edu.tw/) and the WoLF PSORT online tool (https://www.genscript.com/wolf-psort.html/).
The exon–intron organizations and untranslated regions (UTRs) of these predicted typical TaTRX genes were retrieved from the GFF3 files of the wheat genomes using the BMKCloud online tool (http://www.biocloud.net/), then they were graphically displayed using the Gene Structure Display Server (GSDS) online tool (v2.0, http://gsds.gao-lab.org/). Conserved motifs were predicted and displayed using the MEME online tool (v5.4.1, http://meme-suite.org/), and the parameters were set as follows: the maximum number of each motif was set at 10 and the optimum width of each motif was set to between 5 and 200 residues.
Proteins with similar amino acid sequences usually have similar three–dimensional (3D) structures, therefore, the successfully resolved 3D structure of the protein with a consistency of ≥ 30% with the amino acid sequence of the target protein was used as the template. 3D structures of typical TaTRX proteins can be predicted and drawn using the Swiss-Model interactive tool (https://swissmodel.expasy.org/) according to the homology modeling method. A template with a high degree of coverage and identity (≥ 30%) was selected preferentially using the Swiss-Model tool. Then, we selected the template with a global model quality estimation (GMQE) score of close to 1 and a QMEAN score of close to 0 from the above screening results. Finally, a Ramachandran plot was used to evaluate the quality of the 3D model constructed above.
To explore the evolutionary relationships of the typical TaTRX genes, multiple sequence alignments of the identified typical TRX proteins of wheat, Arabidopsis, rice and maize were performed using the ClustalW tool, and an evolutionary tree was constructed using the neighbor-joining (NJ) method with MGEA 8.0 software, with the bootstrap value set to 1000. Then, the Evolview online tool (v2.0, https://evolgenius.info//-evolview-v2/#login/) was used to refine the NJ–tree constructed above.
The MCScanX tool was used to study gene duplication and collinearity. The Ka (non-synonymous substitution)/Ks (synonymous substitution) values between common wheat and Triticum turgidum/Aegilops tauschii were calculated to assess the molecular selection effect using the KaKs-Calculator tool. The genes with Ks values of more than 0.3, as well as Ka and Ks values of 0, were discarded, because they might result from sequence saturation or misalignment (Guo et al., 2017).
The typical TaTRX genes were functionally annotated using GO terms in three main categories (CC, BP, and MF) with the TGT online tool (http://wheat.cau.edu.cn/TGT/). The Bonferroni correction method was used to adjust the p-values. The number of genes in the background ranged from 5 to 1200, and 0.05 was applied as the false discovery rate for the filter.
The 2,000 bp genome sequences upstream of the typical TRX genes transcription initiation sites in wheat were downloaded from the Ensembl Plants database (http://plants.ensembl.org/Triticum_aestivum/Info/Index/) to further identify the putative cis-regulatory elements in the promoter regions of the typical TaTRX genes. The various putative cis-regulatory elements in the above sequences were predicted using the PlantCARE online tool (http://bioinformatics.psb.ugent.be/webtools/plantcare/html/), and then graphically displayed using the GSDS online tool (v2.0, http://gsds.gao-lab.org/) and TBtools software (v0.664432).
In order to identify other wheat proteins that interact with typical TaTRXs, the protein interaction network involving typical TaTRXs was studied using the STRING online tool (v11.5, http://string-db.org/cgi/) based on the protein interaction networks in Arabidopsis and the orthologous genes between wheat and Arabidopsis. The predicted interaction network was displayed using the Cytoscape software (v3.8.2).
To study the expression profiles of typical TaTRXs, a total of 87 publicly available RNA-seq samples from five tissues (root, stem, leaf, spike, and grain) and six biotic/abiotic stress conditions (drought, heat, salt, cold, powdery mildew and stripe rust) were downloaded from Wheat URGI (http://www.wheat-expression.com/) and the NCBI Sequence Read Archive (SRA) database (https://www.ncbi.nlm.nih.gov/). The accession numbers and sample information are listed in Table S6. Subsequently, the expression levels of typical TaTRX genes were calculated and normalized with TPM (transcripts per million) values, and heatmaps were generated using the pheatmap package in R software.
In order to verify the accuracy of transcriptome data in the database, the wheat variety Chinese Spring (CS) was cultivated and grown in a climate chamber (70% humidity, 18,000 Lux light intensity) with 25°C/20°C (day/night), 16 h/8 h (light/dark). The concentration of the Hoagland solution used in this study was 50% of the standard. Wheat seedlings at the two-leaf-stage were subjected to 20% PEG 6000 (dehydration stress), 37°C (heat stress), 4°C (cold stress), and 200 mmol/L NaCl (salt stress) as stress treatments. Wheat leaves were collected after 0, 1, 2, 6, 12, and 24h, and the leaves treated at 0h served as controls for the stress treatments. All fresh samples were quickly frozen in liquid nitrogen and stored in an ultra-low temperature freezer (-80°C).
To investigate the relationship between the redox status and TRX gene expression, the seeds of two contrasting wheat genotypes, JW (selected from a segregated population of the cross of spring common wheat cultivars “Fielder” and “NB1”) and the TaNRX1 (TaTRX24 in this study) –overexpression (OE) line, a transgenic wheat line overexpressing the TaTRX24 gene in JW background (Zhang Y. R. et al., 2021), were used for the current experiment. JW was used as a wild–type (WT) receptor material in this study. The germinated seeds of the WT and OE wheat lines were cultivated with a 50% Hoagland nutrient solution. Plants were cultivated in a light incubator at 20-25°C, with a 16 h light/8 h dark photoperiod, humidity at approximately 70%, and light intensity at 18,000 Lux. When the wheat grew to the stage of two leaves and one heart, the nutrient solution was replaced by a 50% Hoagland nutrient solution with 20% (M/V) polyethylene glycol (PEG 6000). Sampling was conducted by collecting the leaves at 0 HAD (hours after dehydration stress treatment), 24 HAD, 48 HAD, 72 HAD, and 96 HAD for analysis.
Superoxide dismutase (SOD), peroxidase (POD), and catalase (CAT) contents were measured using a SOD, CAT, and POD test box (Suzhou Keming Biotechnology Co., Ltd, Suzhou, China). The H2O2 content was measured using a H2O2 test box (Suzhou Keming Biotechnology Co., Ltd, Suzhou, China). The O2- level was measured according to the method described by Wang et al. (2017). Malondialdehyde (MDA) content was measured using the thiobarbituric acid method (Zhang et al., 2020).
The total RNA was extracted using the TRIzol method (TIANGEN, China). The cDNA was synthesized with a reverse transcription kit (TransGen Biotech, China). The details of all the specific primers are listed in Table S7. Real–time quantitative PCR (RT-qPCR) was performed using the ABI life fluorescence quantitative PCR System Q3. Reactions of 20 µL contained 2×PerfectStart® Green qPCR SuperMix 10 µL, Passive Reference Dye (50×) 0.4 µL, 0.4 µL forward and reverse primers for each (0.2 μM), 1 µL cDNA (200 ng/μL), and 7.8 µL nuclease–free water. The reaction conditions applied were 94°C for 30s, 40 cycles of 94°C for 5s, and 60°C for 30s.
All experiments were independently repeated at least three times to obtain reliable data for statistical analysis. Statistical analysis was performed using SPSS 22.0 (SPSS, Chicago, Illinois, USA). The parametric test one-way analysis of variance was used for data analysis, and the least significant difference post hoc test was used to determine significant differences between means (*, statistically significant at P < 0.05; **, statistically significant at P < 0.01). The transcript abundance levels were calculated using the 2–ΔΔCt method with the wheat β-actin gene as the internal control.
In order to identify the typical members of the TaTRX gene family in wheat, the hidden Markov model (HMM) profile of the TRX domain (PF00085) was retrieved from the wheat protein database (IWGSC RefSeq v1.0) using the HMMsearch program (HMMER3.1 package), and then confirmed using the SMART database, HMMscan, and the NCBI–CDD server. In the retrieved TaTRX protein sequences, proteins containing the “WCGPC” sequence in the TRX domain were screened, and 48 typical TaTRX gene family members were finally identified. They were named from TaTRX1 to TaTRX48, ordered according to their locations in chromosomes from 1A to 7D, and from top to bottom (Figure 1).
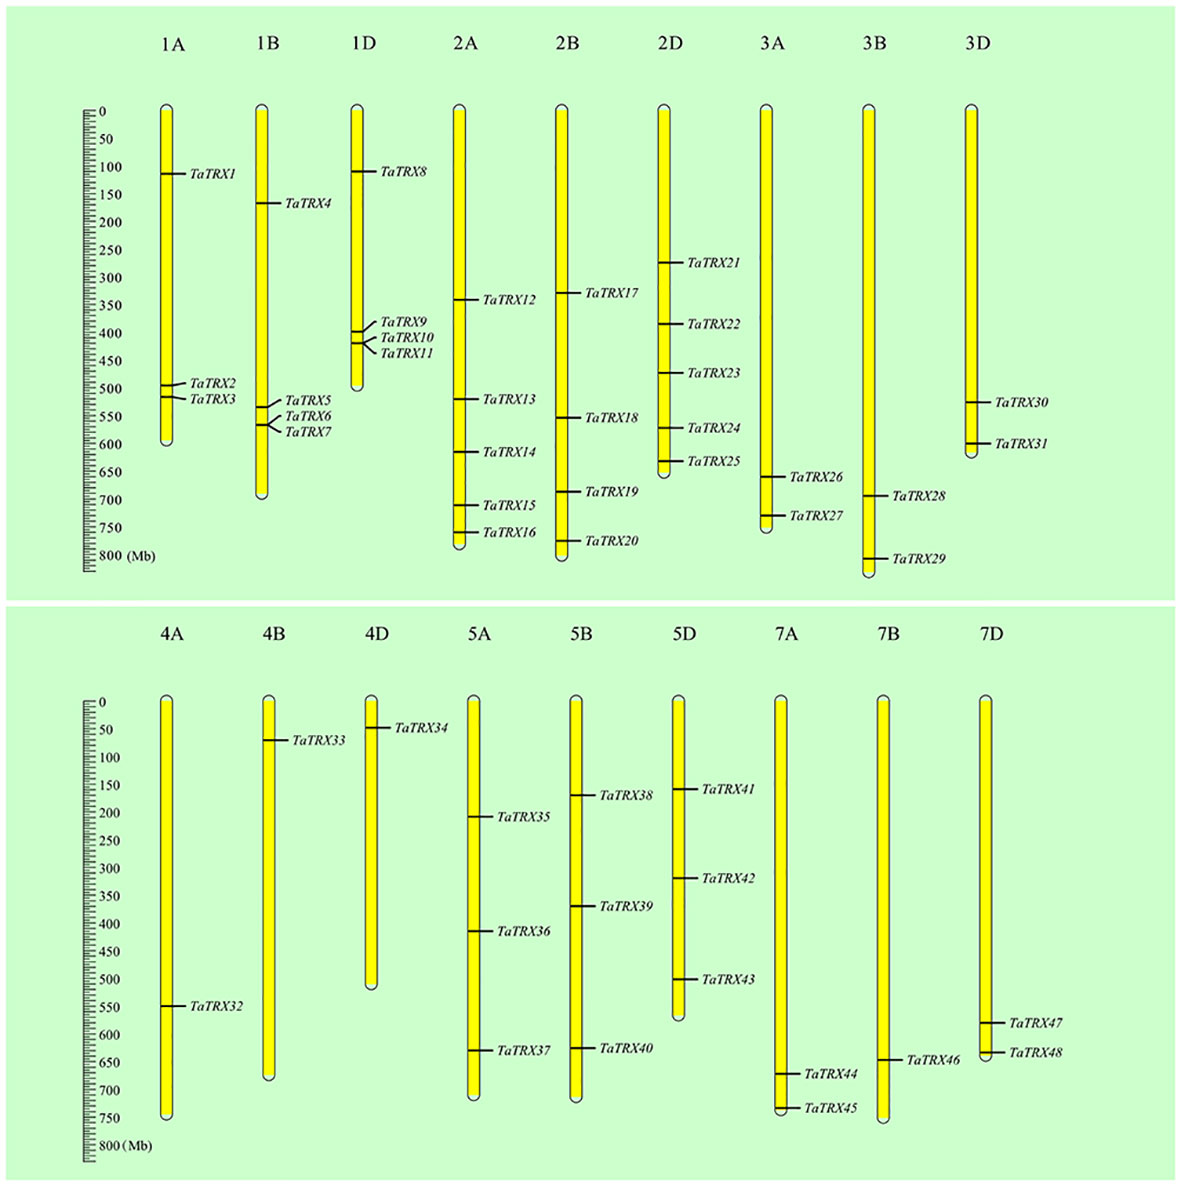
Figure 1 Relative positions of typical TaTRX family members in wheat on chromosomes. All wheat chromosomes were drawn to scale based on their actual physical lengths.
The basic information in respect of the typical TaTRX family members identified above is listed in Table S1. The proteins of this family members are composed of at least 95 amino acids (TaTRX17), and at most 525 amino acids (TaTRX24). The molecular weights of this family of proteins ranged from 10.39 kDa (TaTRX17) to 57.96 kDa (TaTRX15). The isoelectric points (pIs) ranged between 4.47 (TaTRX5) and 9.77 (TaTRX22), of which 22 family members had pIs greater than 7, and 26 family members had pIs less than 7. The grand average of hydropathicity (GRAVY) values of all family members were between -0.543 and 0.442, of which 14 family members had GRAVY values greater than 0, indicating that these proteins were hydrophobic, while 34 family members had GRAVY values that were less than 0, indicating that these proteins were hydrophilic. Chromosome mapping results (Figure 1) showed that typical TaTRX family members were distributed on 18 chromosomes except for 6A, 6B and 6D. Chromosomes 2A and 2D contained the maximum number of TaTRXs, while 4A, 4B, 4D and 7B had the minimum number of TaTRXs. In order to obtain information for the study of family member functions, predictions of subcellular locations were carried out (Table S1 and Table S2). The results show that a total of 23 typical TaTRX family members were localized in the cytoplasm (H type and NRX type), among which TaTRX2 was localized in both the cytoplasm and extracellular matrix, and TaTRX15, TaTRX19 and TaTRX24 were all localized in the cytoplasm and nucleus. In addition, 22 members were predicted to be localized in the chloroplast (F type, M type, X type, Y type, and Z type), and three members were predicted to be localized in the mitochondria (O type). The diversity of subcellular localization meant that typical TaTRXs might be widely involved in a variety of biochemical processes in wheat cells.
A total of 17 homoeologous groups were identified via multiple sequence alignment and cluster analysis of the protein sequences of typical TaTRXs in wheat. Combined with their respective amino acid sequence features and annotation information in the Ensembl Plants database (http://plants.ensembl.org/Triticum_aestivum/Info/Index), the identified 48 typical TRX genes were divided into eight subtypes: F, H, M, O, X, Y, Z, and NRX (Figure 2A). Among them, the H type comprised the largest number of TRX genes (20), followed by the M Type (10). A typical TaTRX of the other six subtypes contained three homologous genes each.
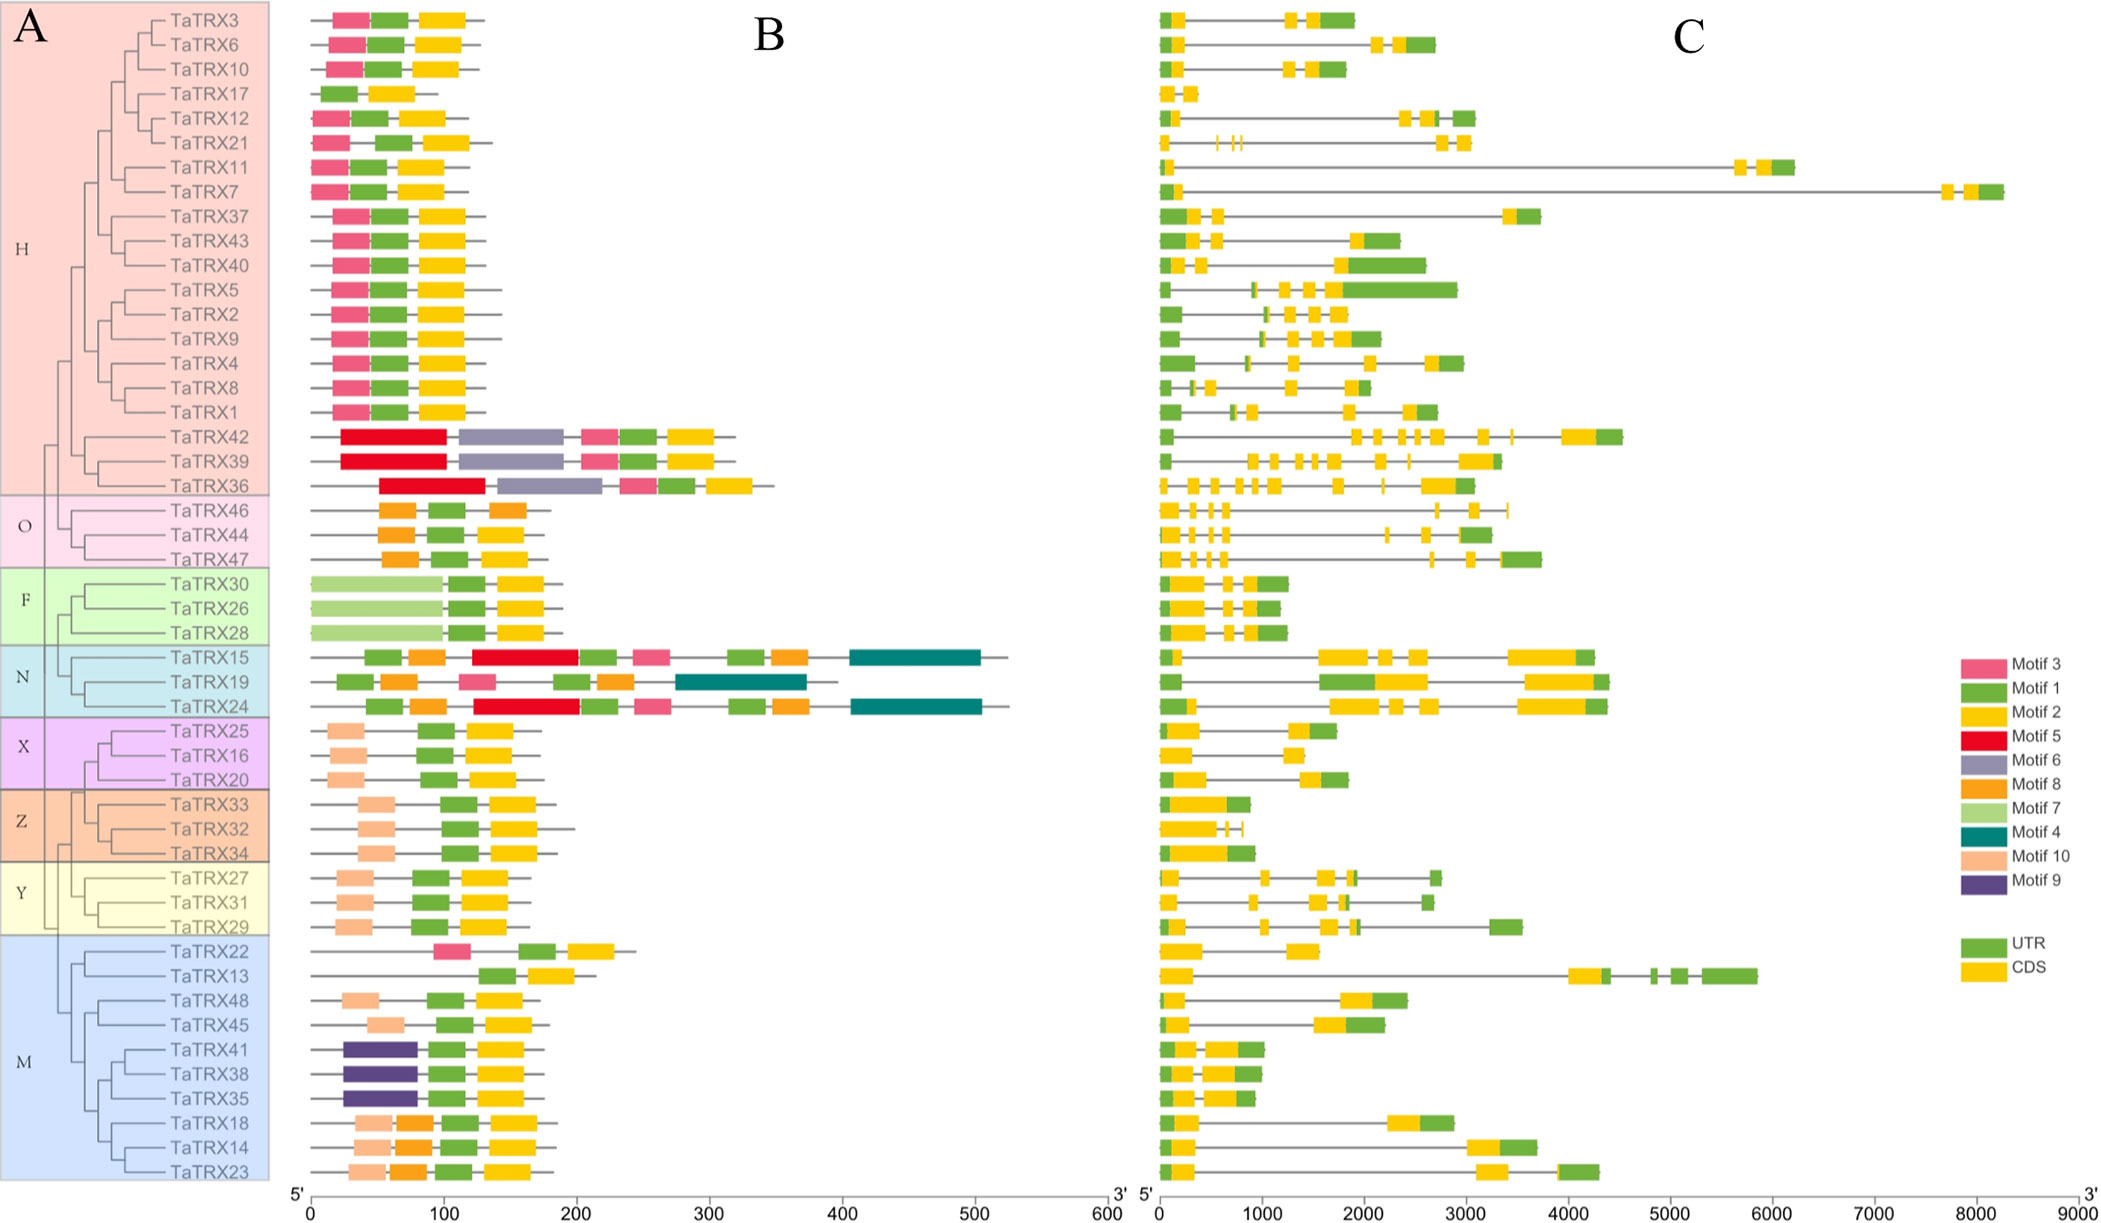
Figure 2 Phylogenetic relationships (A), conserved motifs (B), and gene structures (C) of typical TaTRX genes in wheat. The different colors in A represent the 8 subtypes of typical TaTRXs. The different colors in B represent the 10 identified motifs. The yellow and green rectangles in C represent the coding sequences (CDSs) and untranslated regions (UTRs), respectively, and the black lines represent introns. The length of the CDS, UTR, and intron for each typical TaTRX gene was shown proportionally.
Analyses of protein conserved motifs and gene structures can provide important and valuable information for the study of gene function diversification. The protein sequences of typical TaTRXs were submitted to the MEME website, and a total of 10 conserved motifs were identified (Figure 2B, Figure S1, and Table S3). Motif 1, which contains the “WCGPC” sequence, was located in the TRX domain, and all typical TaTRX proteins contained this motif (Figure S2). All TRX-H members contained motif 1, motif 2, and motif 3; all TRX-X, TRX-Y, and TRX-Z members contained motif 1, motif 2, and motif 10; and only TRX-F members contained motif 7. Most of the proteins of typical TaTRXs contained three conserved motifs, and motifs in same subtype of TaTRXs were very similar.
The results of gene structure analyses showed that TaTRX7 had the longest gene length and intron length, while TaTRX17 had the shortest gene length (Figure 2C). The numbers of introns ranged from 0 to 8, and the numbers of exons varied from 1 to 9. Only Z-type TaTRX33 and TaTRX34 had no introns among all family members, while TaTRX36, TaTRX39 and TaTRX42 contained more exons than other family members. In general, the gene structures of genes with a close genetic relationship were also more similar.
The 3D structures of these typical TaTRX proteins were predicted using homology-based modeling (Figures S3A–E). The predicted 3D models of 45 proteins had global model quality estimation (GMQE) values of greater than 0.8 and QMEAN values that were close to 0, and residues up to 90% fell in the most favored regions in the Ramachandran plot (Figures S4A–E), which show that these predicted 3D models were relatively reliable. It can be seen from the above prediction results that typical TaTRX proteins may be composed of four peripheral α-helices, and five anti-parallel and cross-stacked β-sheets inside. The second α-helix and the second β-sheet were connected by the active site “WCGPC”, which is very similar to the 3D structural model of Escherichia coli (E. coli) TRX (Martin, 1995).
According to the analysis results of the MCScanX program package and the chromosomal position information of typical TaTRXs (Figure 1, Table S1), two pairs of tandem duplication genes were screened out, namely TaTRX6 and TaTRX7, and TaTRX10 and TaTRX11. Their relative distances on chromosomes were 135.6Kb and 243.5Kb, respectively. Collinearity analyses of the MCScanX program package showed that there were 14 clusters of segmental duplication genes in the typical TRX family of wheat. Among the homologous gene clusters of TaTRX12, TaTRX17, and TaTRX21, only TaTRX12 and TaTRX17 exhibited the phenomenon of segmental duplication (Figure 3). The above results suggest that tandem duplication and segmental duplication might promote the expansion of members of the typical TaTRX gene family.
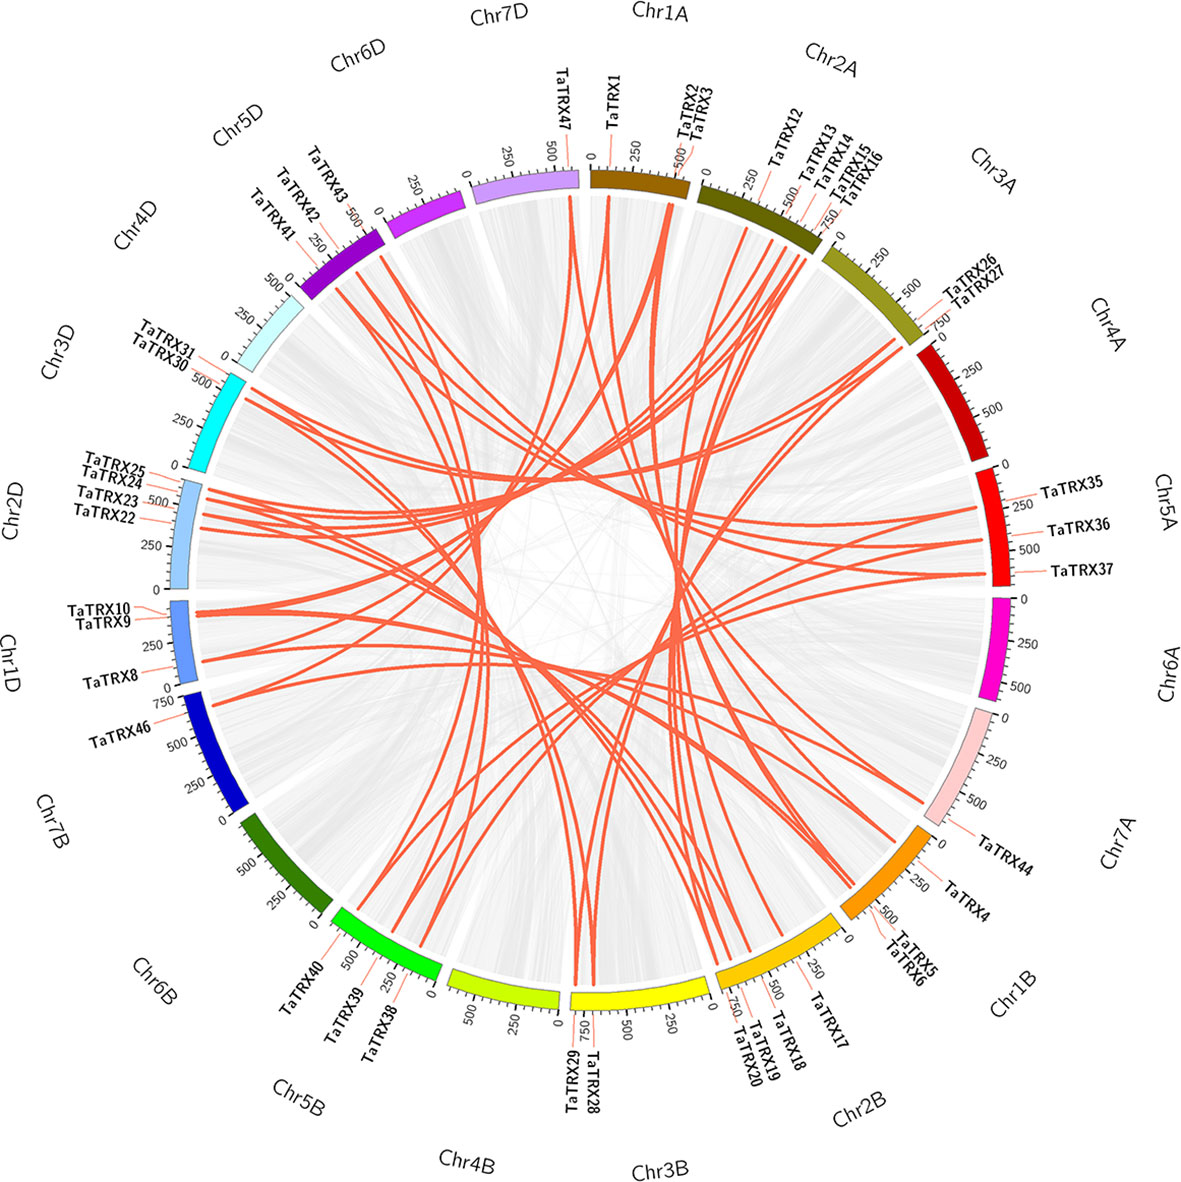
Figure 3 Distribution and duplication events of typical TaTRX genes across wheat genome. All typical TaTRX genes were mapped to 21 wheat chromosomes in a circle using Circos tool, and segmental duplications were mapped to their respective locations. Gray regions indicated all synteny blocks within the wheat genome, while red lines represented segmental duplications. The chromosome numbers were marked outside of the circle.
To analyze and evaluate the evolutionary relationships of typical TaTRXs, typical TRX protein sequences of wheat, Arabidopsis, rice, and maize were compared, and phylogenetic trees were constructed (Figure S5, Table S4). As shown in Figure S5, 20, 17, and 20 typical TRX genes were identified in Arabidopsis, rice, and maize, respectively, and the typical TRXs of the same subtypes were grouped together with their orthologous counterparts.
The collinearity of typical TRX gene families of these important crops was analyzed by constructing collinearity maps of wheat (Triticum aestivum L.), rice (Oryza sativa L.), and maize (Zea mays L.) (Figure S6). The results show that 11 genes in rice had orthologous relationships with 26 typical TRX genes in wheat, and 13 genes in maize had orthologous relationships with 19 typical TRX genes in wheat. Specifically, the typical TaTRX1/4/8 genes may have a common genetic origin with the typical OsTRX1/10 genes and the typical ZmTRX7/13 genes; the typical TaTRX13/22 genes may have a common genetic origin with the typical OsTRX7 gene and the typical ZmTRX5 gene; the typical TaTRX14/18/23 genes may have a common genetic origin with the typical OsTRX4/8 genes and the typical ZmTRX4/10/12 genes; the typical TaTRX16/20/25 genes may have a common genetic origin with the typical OsTRX9 gene and the typical ZmTRX3/20 genes; the typical TaTRX29 gene may have a common genetic origin with the typical OsTRX3 gene and the typical ZmTRX9 gene; and the typical TaTRX37/40/43 genes may have a common genetic origin with the typical OsTRX6 gene and the typical ZmTRX2/11 genes. The above results will assist in the study of the evolutionary history and even the gene function of the typical TRX gene family in wheat, rice, and maize.
The chromosomes of widely cultivated hexaploid wheat (AABBDD) are derived from Triticum turgidum (AABB) and Aegilops tauschii (DD). The typical TaTRX genes and orthologous pairs in the two progenitors of wheat were identified based on phylogenetic relationships and sequence alignment (Table S4). Types of Darwin evolutionary selection are usually measured by calculating the ratio Ka/Ks (non-synonymous substitution/synonymous substitution), where Ka/Ks=1 indicates neutral selection; Ka/Ks<1 indicates purification selection; and Ka/Ks>1 indicates positive selection. KaKs Calculator software was used to calculate the Ka/Ks values of orthologous typical TRX genes to detect molecular selection effects. A total of 18 genes among the typical TaTRX genes were completely identical to the orthologous gene sequences in Triticum turgidum or Aegilops Tauschii, as shown in Table 1. There were 11 orthologous gene pairs with Ka/Ks values of less than 1, indicating that these genes underwent purifying selection during evolution. In addition, three pairs of orthologous genes with Ka/Ks values greater than 1 were identified, which were TaTRX15 and TtTRX6 (Ka/Ks=1.144), TaTRX42 and AeTRX11 (Ka/Ks=1.810), and TaTRX36 and TtTRX24 (Ka/Ks=2.615). This meant that these three typical TaTRX genes had undergone positive selection relative to their orthologous genes in Triticum turgidum or Aegilops Tauschii, and played important roles in the evolution process.
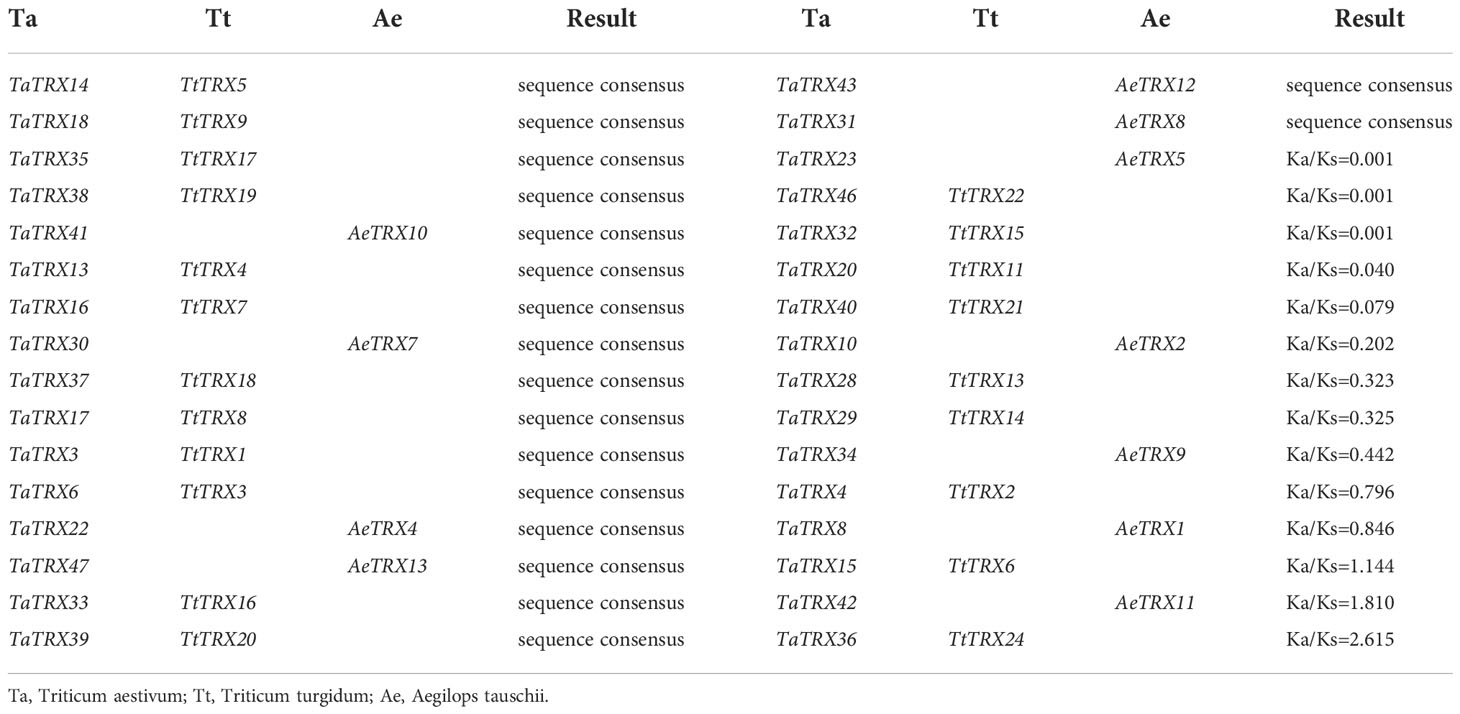
Table 1 Ka/Ks of typical TRXs between wheat and its two progenitors.
Different biological databases may use different terms, making it difficult to find biological information. Gene Ontology (GO) is a system for the unified normative description of genes and gene products of all species, which has promoted the grand unification of biological information (Ashburner et al., 2000). The contents of GO include biological process (BP), molecular function (MF), and cellular component (CC). A GO analysis of typical TaTRX genes (Figure S7, Table S5) indicated that the BP GO term for all 48 genes was cell redox homeostasis (GO: 0045454). The BP GO term and MF GO term of 39 genes were glycerol ether metabolic process (GO:0006662) and protein disulfide oxidoreductase activity (GO:0015035), respectively. In addition, the MF GO term and CC GO term of typical TaTRX16/18/20/23/25 also included enzyme activator activity (GO:0008047) and chloroplast stroma (GO:0009570), respectively, suggesting that these five genes may activate enzymes in the chloroplast stroma. The BP GO term for TaTRX18 and TaTRX23 was response to cytokinin (GO:0009735), indicating that these two genes might be involved in the cytokinine signaling pathway.
To confirm that TRX plays an important role in maintaining redox balance in wheat, we investigated the relationship between the redox status and TaTRX24 gene expression. As shown in Figure 4, after PEG 6000 treatment at the seedling stage, the relative expression level of the TaTRX24 gene in the wild type (WT) and the overexpression (OE) line showed a trend of first increasing and then decreasing, and it reached the maximum at 48 HAD. The expression level of the TaTRX24 gene in the OE line was higher than WT at different HADs, and the OE line was 5.06 times higher than WT, especially at 48 HAD. The activities of antioxidant enzymes (SOD, POD, and CAT), and the contents of H2O2, O2- and MDA in the leaves of the WT and OE lines also reached a peak at 48 HAD. At different HADs, the activities of antioxidant enzymes (SOD, POD, and CAT) in OE line were higher than those in WT, while the contents of H2O2, O2-, and MDA were lower than those in WT. At 48 HAD, the activities of SOD, POD, and CAT in the OE line leaves were 1.56, 1.71, and 2.09 times that of WT, respectively, while the contents of H2O2, O2-, and MDA in the OE line leaves were 67.43%, 57.15% and 49.53% of WT, respectively. These results show that after the expression level of TaTRX24 gene was increased under dehydration stress, the activities of antioxidant enzymes (SOD, POD, and CAT) were relatively improved, while the contents of H2O2, O2-, and MDA were relatively reduced. This suggests that the TaTRX24 plays an important role in maintaining redox balance after dehydration stress.
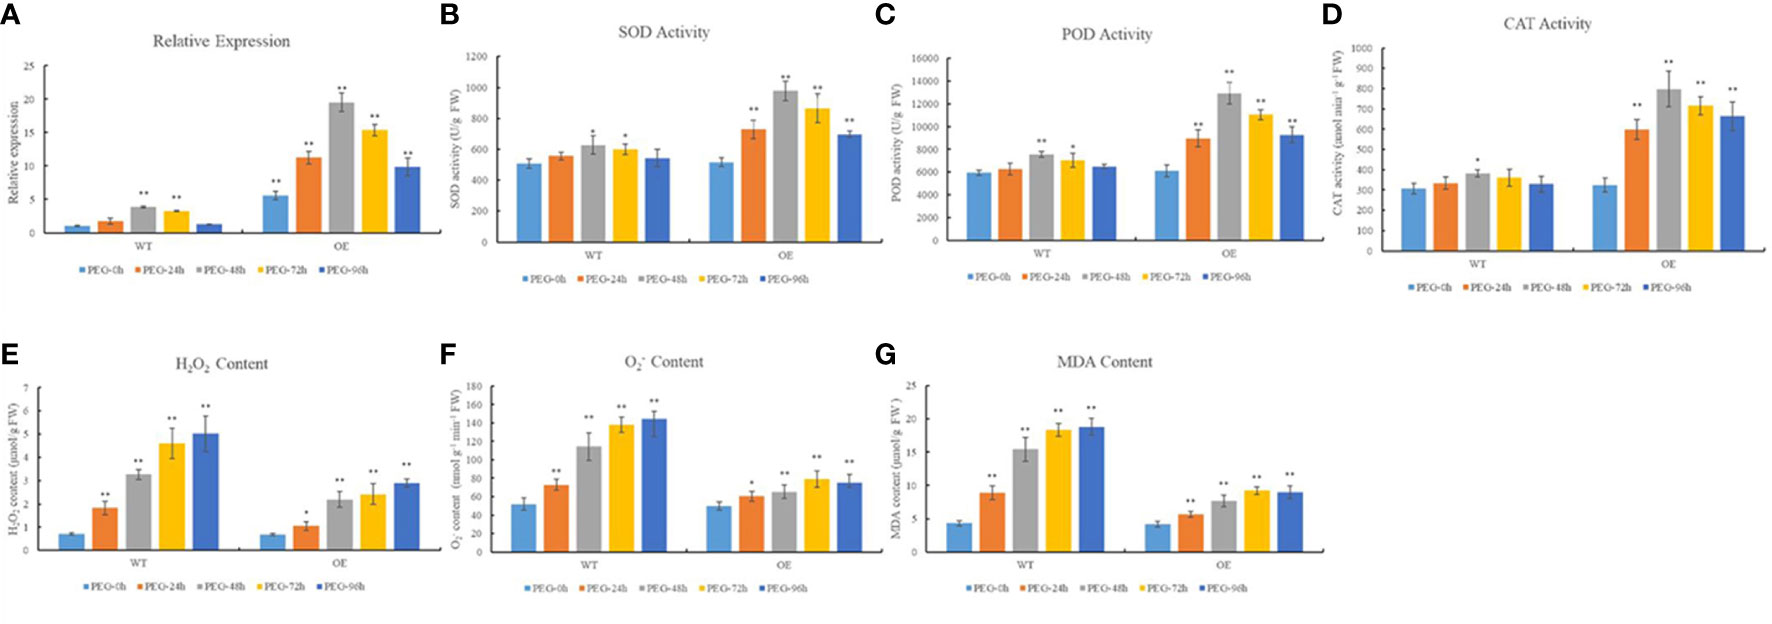
Figure 4 Relationship between the redox status and the expression of TaTRX24. (A) The relative expression of TaTRX24 gene in WT and OE line before and at 24h, 48h, 72h and 96h after treatment with 20% PEG 6000. (B) The SOD activity in WT and OE line before and at 24h, 48h, 72h and 96h after treatment with 20% PEG 6000. (C) The POD activity in WT and OE line before and at 24h, 48h, 72h and 96h after treatment with 20% PEG 6000. (D) The CAT activity in WT and OE line before and at 24h, 48h, 72h and 96h after treatment with 20% PEG 6000. (E) The H2O2 content in WT and OE line before and at 24h, 48h, 72h and 96h after treatment with 20% PEG 6000. (F) The O2- content in WT and OE line before and at 24h, 48h, 72h and 96h after treatment with 20% PEG 6000. (G) The MDA content in WT and OE line before and at 24h, 48h, 72h and 96h after treatment with 20% PEG 6000. PEG-0h, PEG-24h, PEG-48h, PEG-72h and PEG-96h respectively represent that the above wheat materials were not treated with 20% PEG 6000, and were treated with 20% PEG 6000 for 24h, 48h, 72h and 96h. Values are mean ( ± SE) of three biological replicates. *P < 0.05, **P < 0.01 represent significant difference between the WT (PEG-0h) and the others, respectively.
By predicting cis-elements in the promoters of typical TaTRX genes, a better understanding of the transcriptional regulation and potential functions of these genes can be obtained. The cis-elements of the typical TaTRX genes were analyzed using the 2000 bp genome sequences upstream of the typical TRX gene transcription initiation site in wheat and the PlantCARE online tool (Figures S8, Figure S9). The transcription related cis-elements, TATA-box and CAAT-box (the basic core components of the promoter), were found in all typical TaTRX genes. The cis-elements related to hormones and stresses were subsequently sorted out. The results show that there were nine kinds of elements related to hormone response, such as abscisic acid response element ABRE, gibberellin response element P-box, GARE-motif and TATC-box, auxin response element AuxRR-core and TGA-element, methyl jasmonate response element CGTCA-motif and TGACG-motif, and salicylic acid response element TCA. There were eight kinds of elements related to stress, i.e., MBS, MYB, and MYC (response to drought), LTR (response to low temperature), DRE (response to low temperature, dehydration and salt stress), ARE and GC-motif (response to hypoxia), and WUN-motif (response to wound). ABRE, TGACG-motif, CGTCA-motif, and MYC and MYB elements featured frequently in the promoters of typical TaTRX genes. TaTRX4 and TaTRX46 contained 11 and 9 ABRE elements, respectively, suggesting that these two genes might play important regulatory roles in the ABA signaling pathway. TaTRX15 and TaTRX24 both contained six TGACG-motif elements, and TaTRX10 contained seven CGTCA-motif elements, suggesting that these three genes might play important roles in the methyl jasmonate signaling pathway. All the promoters of typical TaTRX genes contained 95 MYC elements and 75 MYB elements. In general, it could be speculated that wheat typical TRX genes might be widely involved in hormone metabolism and stress response, and that the cis-elements of different typical TaTRX genes might be dissimilar, suggesting that these genes might play divergent roles in wheat. Furthermore, typical TaTRX genes in the same subgroup might perform different functions, while genes in different subgroups might work together.
The analyses of gene spatiotemporal expression specificity could provide valuable information for studying the function of typical TaTRX genes in wheat growth and development. The RNA-seq data titled “choulet_URGI” were downloaded to analyze the spatial and temporal expression profiles of typical TaTRX genes in wheat from expVIP website (http://www.wheat-expression.com/). Moreover, the spatiotemporal-specific expression clustering heatmap was plotted based on log2TPM+1 (transcripts per million) values (Figure 5 and Table S6). Compared with other genes in the family, the homologous group TaTRX37/40/43 (H type) was highly expressed in wheat roots at the seedling stage, three leaf stage, and flag leaf stage. TaTRX6 (H type) and TaTRX22 (M type) were highly expressed in the stem of the ear at a 1cm length, the ear at the two-edged stage, and the ear at the flowering stage. The homologous groups of TaTRX16/20/25 (X type), TaTRX26/28/30 (F type), TaTRX27/29/31 (Y type), and TaTRX35/38/41 (M type) were highly expressed in wheat leaves at the seedling stage, the tillering stage, and 2d after the flowering stage. Compared with the two–edged stage and flag–leaf stage, the expression of TaTRX2/5/9 (H type) increased in the spike of the flowering stage. TaTRX21 (H type) was highly expressed in the grain of 2d, 15d, and 30d after flowering. In addition, TaTRX14/18/23 (M type) and TaTRX37/40/43 (H type) were highly expressed in the grain of 2d after flowering, while TaTRX36/39/42 (H type) were highly expressed in the grain of 30d after flowering. Most of the homologous genes of typical TaTRX had similar spatiotemporal expression patterns. However, some homologous genes showed different expression patterns. For example, TaTRX45 (M type) was highly expressed in the leaf, while its homologous gene TaTRX48 was highly expressed in the stem, suggesting that these homologous genes were subfunctionalized.
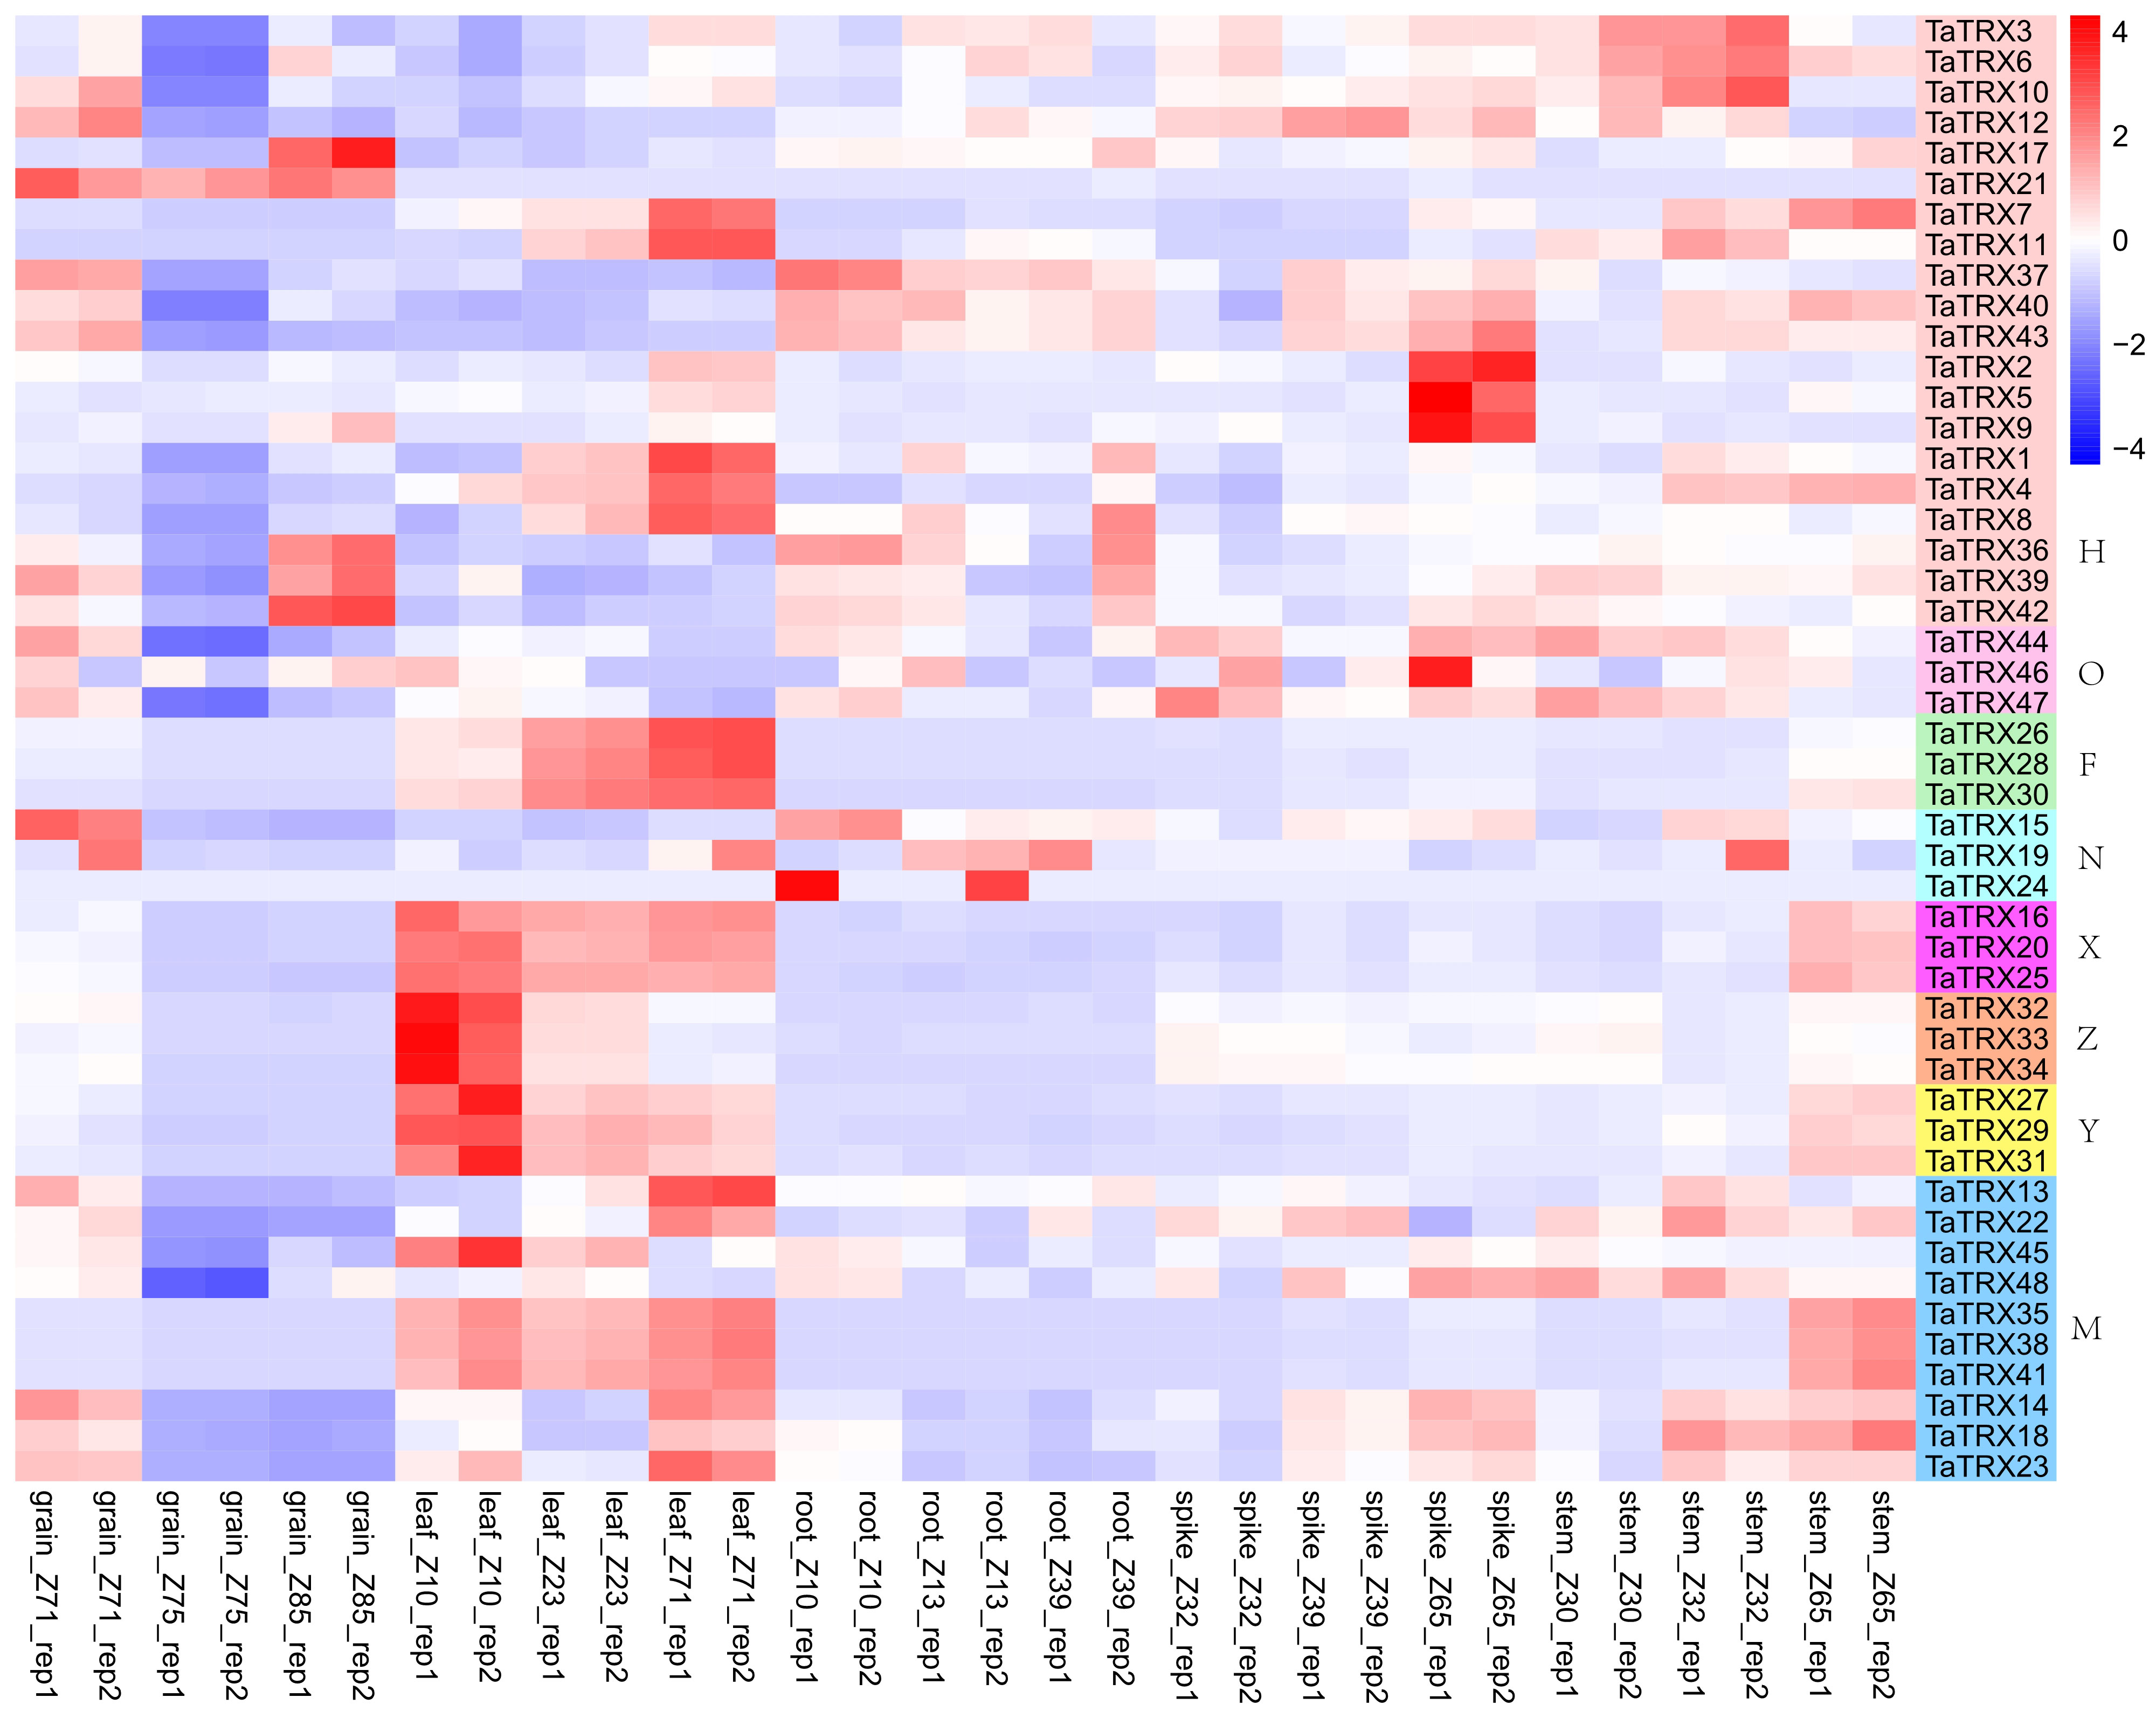
Figure 5 Expression profiles of typical TaTRX genes in different tissues and organs. grain_Z71, grain_Z75 and grain_Z85 were 2d, 15d and 30d grains after flowering, respectively. leaf_Z10, leaf_Z23 and leaf_Z71 represent leaf at seedling stage, flag leaf at tillering stage and leaf 2d after flowering, respectively. root_Z10, root_Z13 and root_Z39 represent roots at seedling stage, three-leaf stage and flag leaf stage, respectively. spike_Z32, spike_Z39 and spike_Z65 represent the spikes at two-edged stage, flag leaf stage and flowering stage respectively. stem_Z30, stem_Z32 and stem_Z65 were the ear at 1cm length, the ear at two-edged stage and the ear at flowering stage respectively. The red, white and blue cells represent the highest, medium and lowest gene expression levels, respectively. H, O, F, N, X, Z, Y, and M represent different subtypes of typical TaTRX genes, respectively. The colour scale represents Log2 expression values.
In order to understand the expression profiles of typical TRX genes in response to abiotic and biotic stresses in wheat, RNA–seq data (SRP045409, SRP043554, SRP062745 and SRP041017) were used to study the expression patterns of typical TaTRXs subjected to four abiotic stresses (drought, heat, cold, and salt) and two biotic stresses (powdery mildew and stripe rust) (Figures 6–9, Table S6). The expression of TaTRX3/6/10 (H type) and TaTRX44 (O type) increased gradually after 1h and 6h of drought stress, while the expression of two homologous groups, TaTRX26/28/30 (F type) and TaTRX35/38/41(M type) decreased sharply after 6h of drought stress. The expression levels of TaTRX12/17 (H type) and TaTRX45/48 (M type) were gradually up-regulated after heat stress treatment for 1h and 6h, while the expression levels of TaTRX15/19 (NRX) and TaTRX16/20/25 (X type) were sharply up-regulated after heat stress treatment for 6h. The expression profiles of typical TaTRXs under co-drought and heat stress were similar to that under heat stress (Figure 6). After 4 °C cold stress treatment on wheat, the expressions of seven homologous groups, TaTRX1/4/8 (H type), TaTRX3/10 (H type), TaTRX16/20/25 (X type), TaTRX26/28/30 (F type), TaTRX27/29/31 (Y type), TaTRX32/33/34 (Z type), and TaTRX45/48 (M type), were significantly up-regulated. However, TaTRX6 (H type), which was the homologous gene of TaTRX3/10, was down–regulated (Figure 7). After salt (NaCl) stress treatment, the expressions of TaTRX16/20/25 (X type) were gradually up-regulated at 6h, 12h, and 24h, and down–regulated at 48h. The expressions of TaTRX2/9 (H type) were gradually down–regulated after 6h, while their homologous gene TaTRX5 was down–regulated after 12h. The expression of TaTRX17 (H type) was up-regulated in all stages after salt stress treatment, while its homologous gene TaTRX12 was down–regulated in all stages (Figure 8).
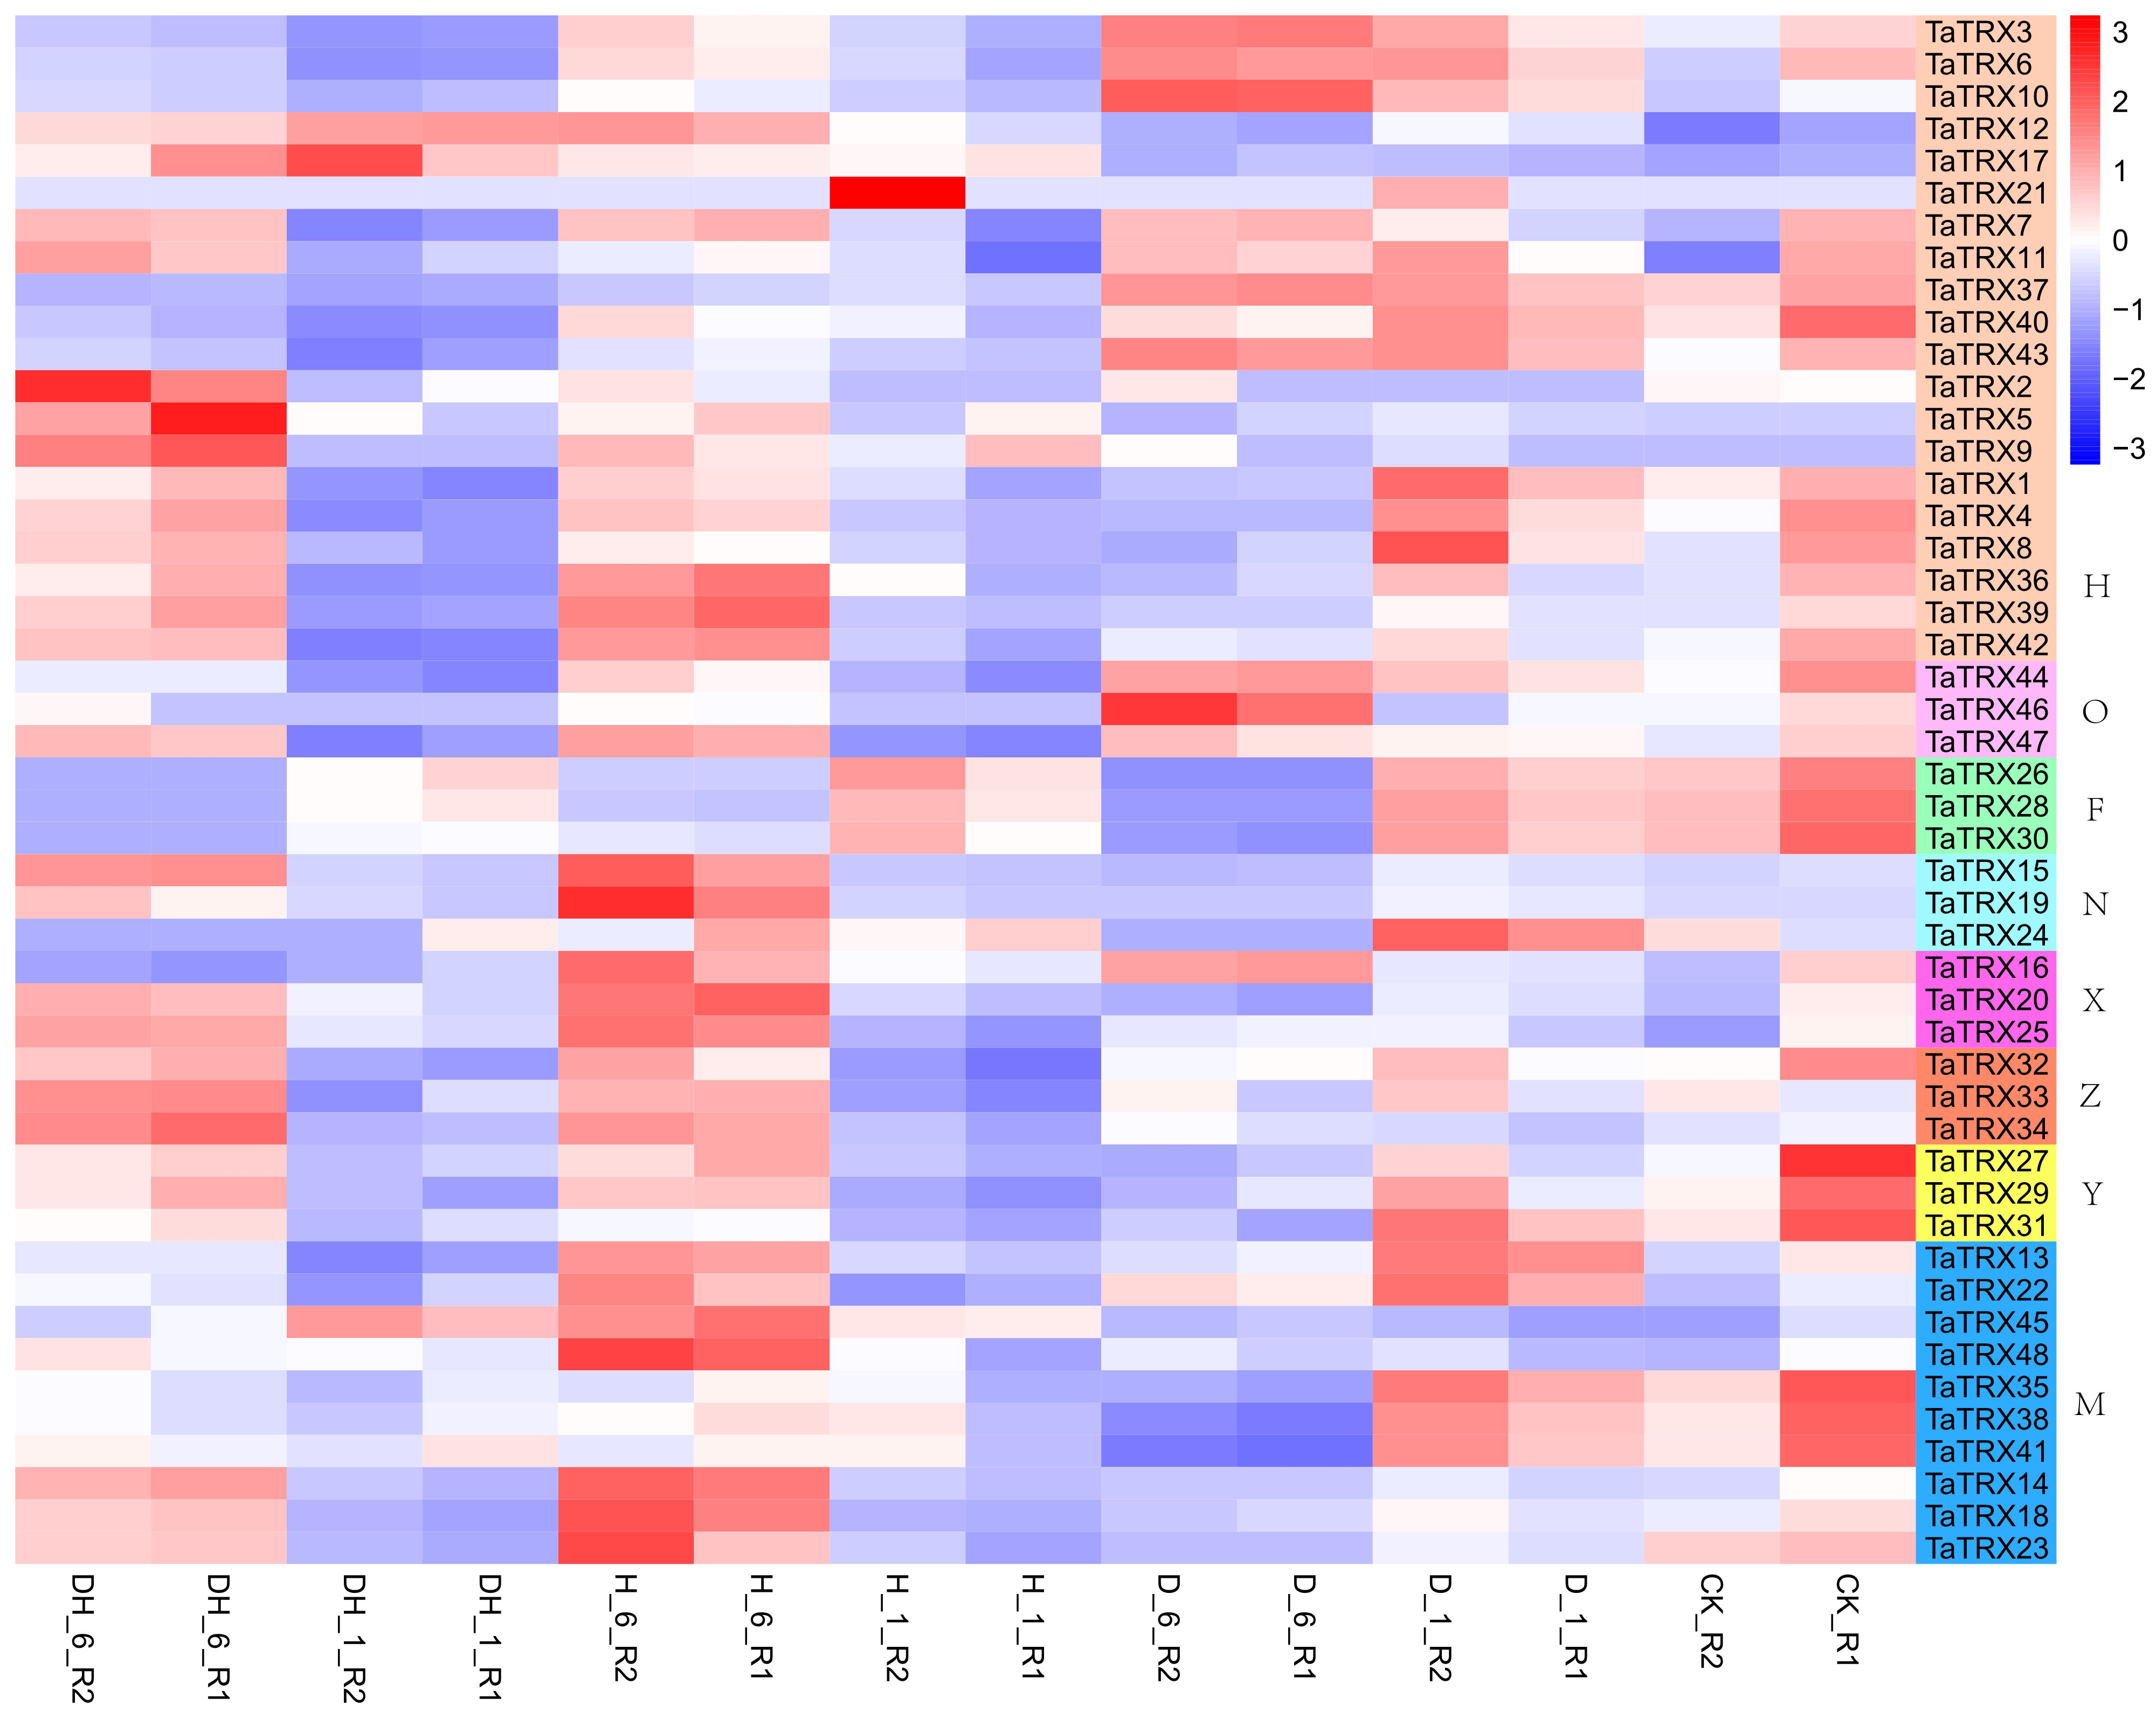
Figure 6 Expression profiles of typical TaTRX genes in wheat before and after drought stress, heat stress and co-drought and heat stress. D_1 and D_6 represent 1h and 6h after drought stress treatment of wheat respectively; H_1 and H_6 represent 1h and 6h after hot stress treatment of wheat respectively; DH_1 and DH_6 represent 1h and 6h after co-drought and heat stress treatment of wheat respectively; CK represents no stress treatment of wheat. The red, white and blue cells represent the highest, medium and lowest gene expression levels, respectively. H, O, F, N, X, Z, Y, and M represent different subtypes of typical TaTRX genes, respectively. The colour scale represents Log2 expression values.
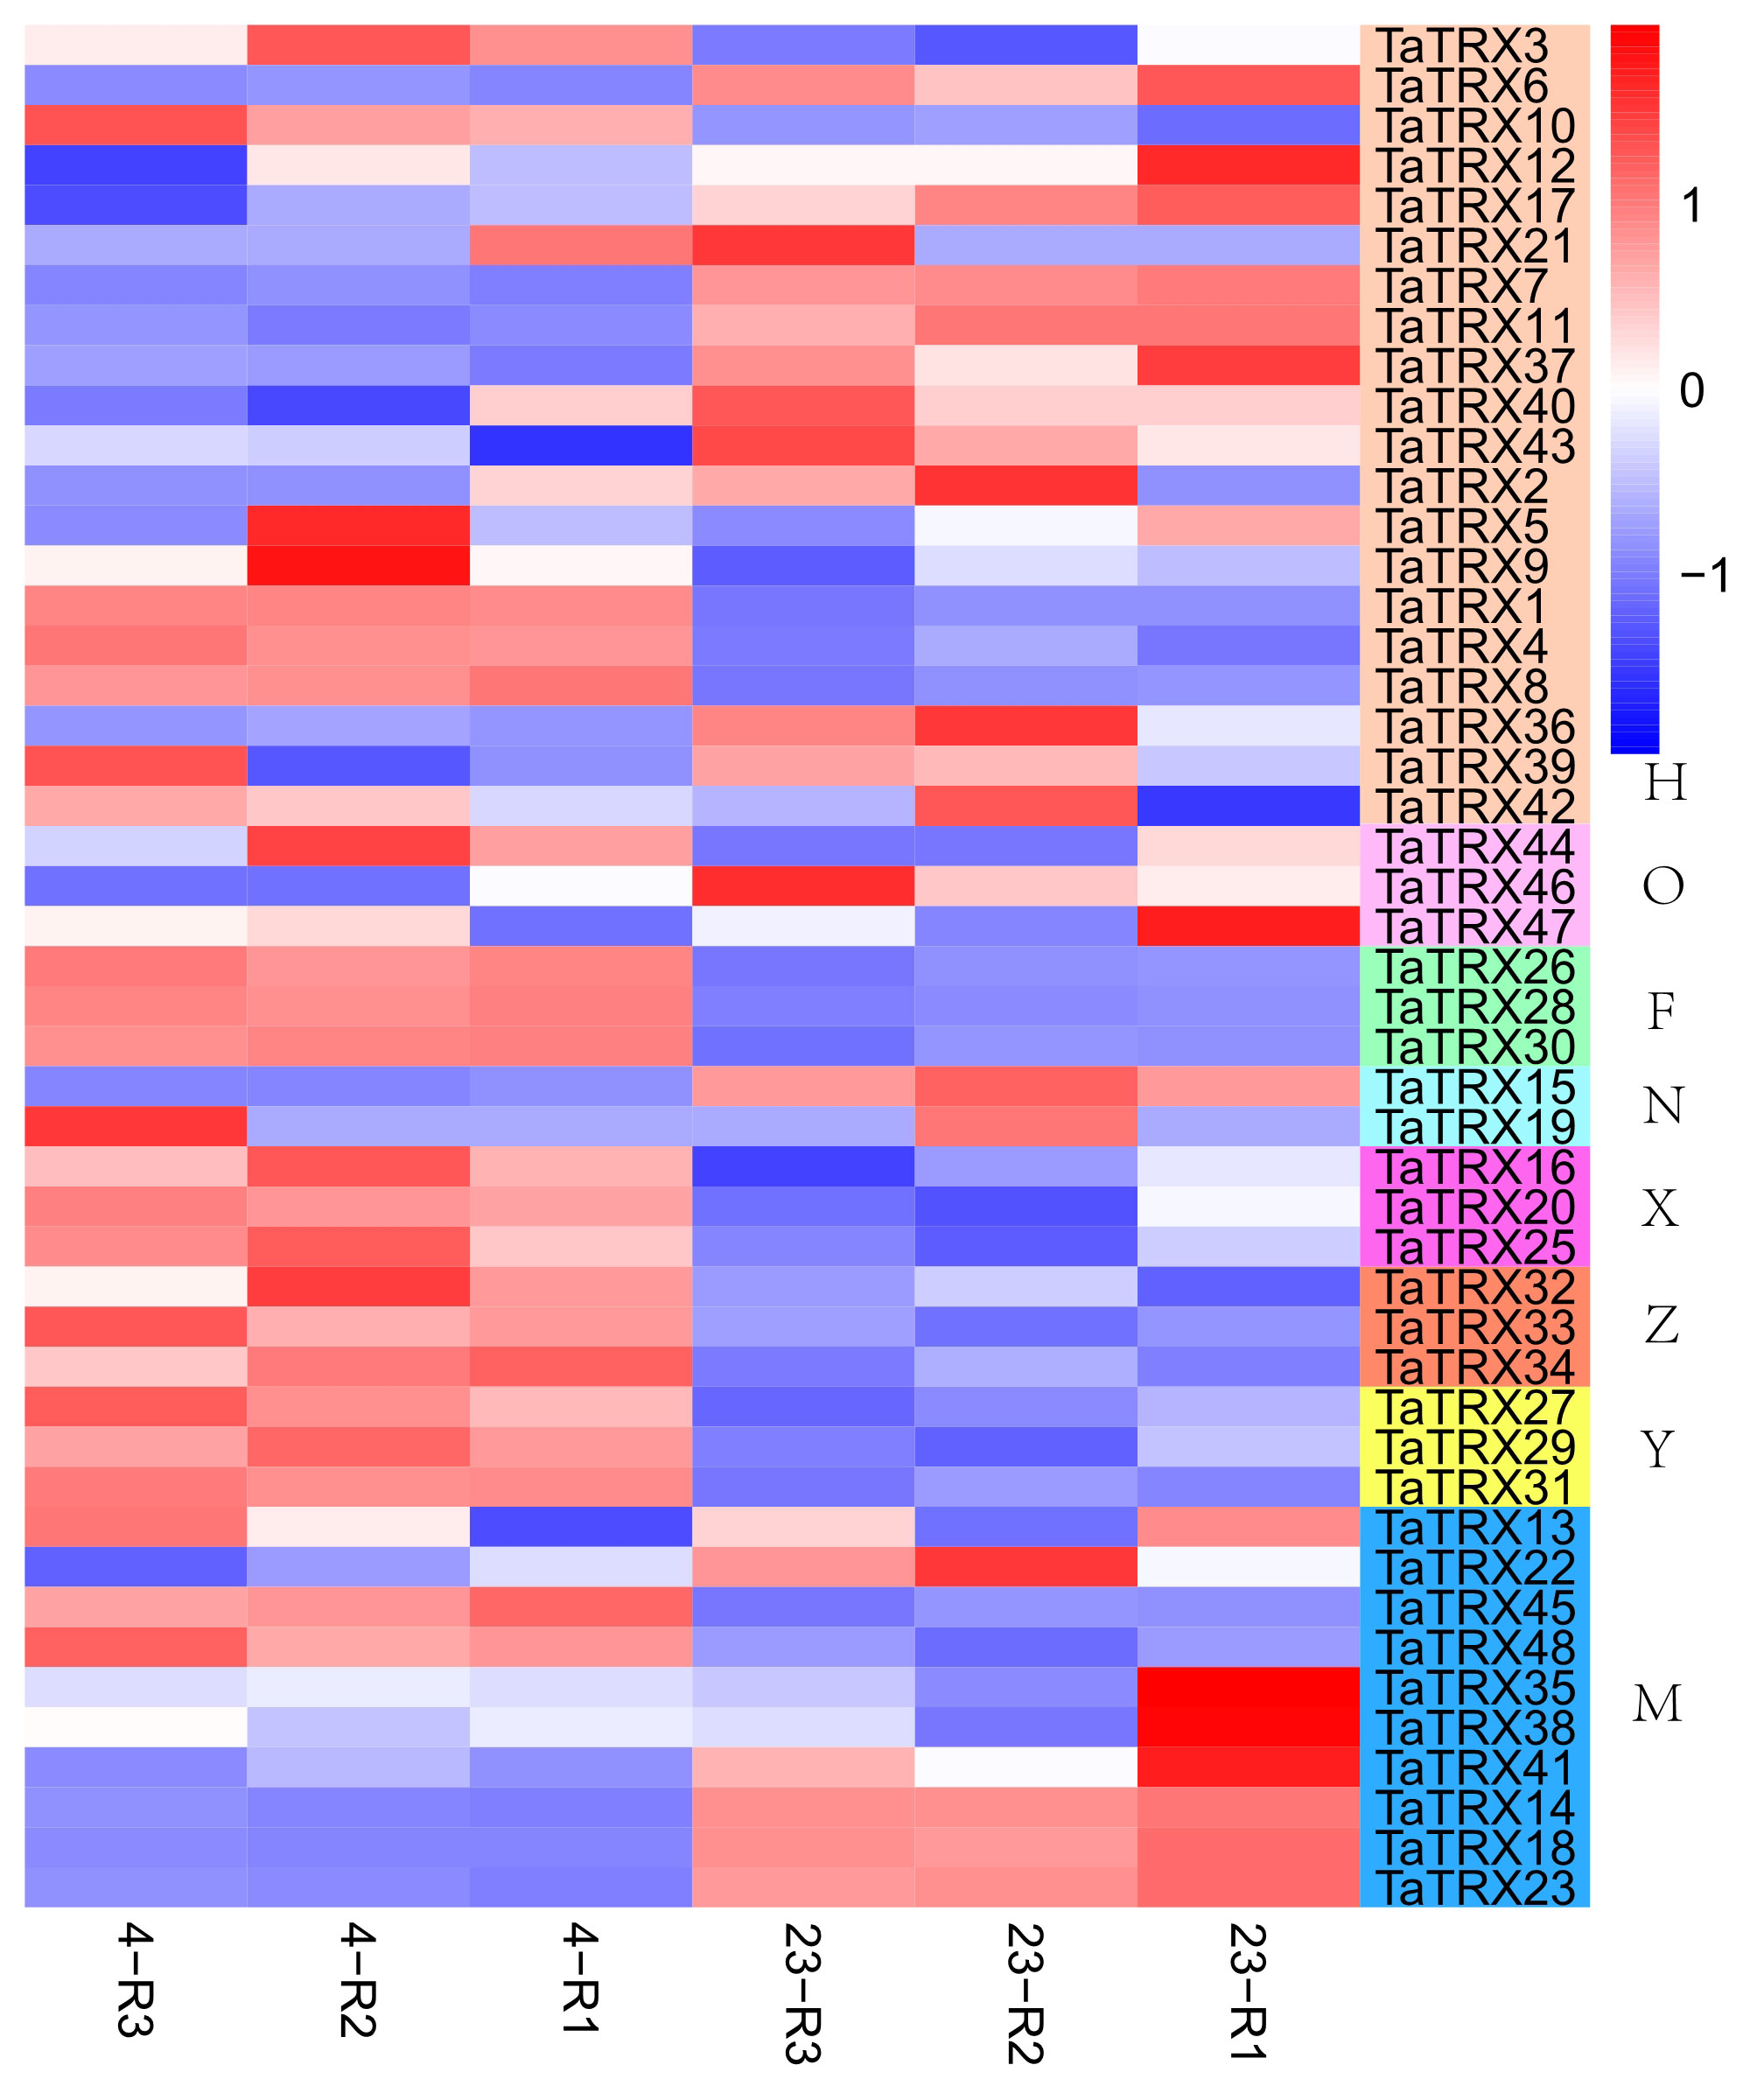
Figure 7 Expression profiles of typical TaTRX genes in wheat before and after cold stress. 23 represents wheat without cold stress treatment; 4 represents wheat treated by 4°C cold stress. The red, white and blue cells represent the highest, medium and lowest gene expression levels, respectively. H, O, F, N, X, Z, Y, and M represent different subtypes of typical TaTRX genes, respectively. The colour scale represents Log2 expression values.

Figure 8 Expression profiles of typical TaTRX genes in wheat treated with NaCl for 6h, 12h, 24h and 48h. CS and QM represent wheat varieties “Chinese Spring” and “Qing Mai 6” respectively; CK represents no stress treatment of wheat; Na represents NaCl treatment of wheat. The red, white and blue cells represent the highest, medium and lowest gene expression levels, respectively. H, O, F, N, X, Z, Y, and M represent different subtypes of typical TaTRX genes, respectively. The colour scale represents Log2 expression values.
As shown in Figure 9, after infecting wheat leaves with stripe rust, compared with healthy leaves, the expressions of TaTRX1/4/8 (H type) were up-regulated at 24h, and then the expressions of TaTRX1/4 were continuously down–regulated, while the expression of TaTRX8 was down–regulated at 48h, and then up–regulated at 72h. The gene expressions of TaTRX16/20/25 (X type) were continuously up–regulated at 48h and 72h, while the expressions of TaTRX35/38/41 (M type) were down–regulated at 24h and then up–regulated at 48h and 72h. After infecting wheat leaves with powdery mildew, the gene expressions of TaTRX13/22 (M type) were up–regulated at 24h, and then decreased compared with healthy leaves. TaTRX37/40/43 (H type) expressions were up–regulated at 24h and 48h, and then down–regulated at 72h; the expressions of TaTRX1/4/8 (H type), TaTRX3/6/10 (H type), TaTRX7/11 (H type), TaTRX14/18/23 (M type), TaTRX27/29/31 (Y type), and TaTRX36/39/42 (H type) increased at 48h and 72h. The expressions of TaTRX35/38/41 (M type) were down–regulated at 24h, 48h, and 72h. In conclusion, only TaTRX1/4/8 homologous group could be up–regulated when wheat leaves were infected with stripe rust and powdery mildew respectively. A total of eight typical TaTRX homologous groups were up–regulated in response to infection with powdery mildew, and most of them were H type, while only three homologous groups were up–regulated after the infection of stripe rust.
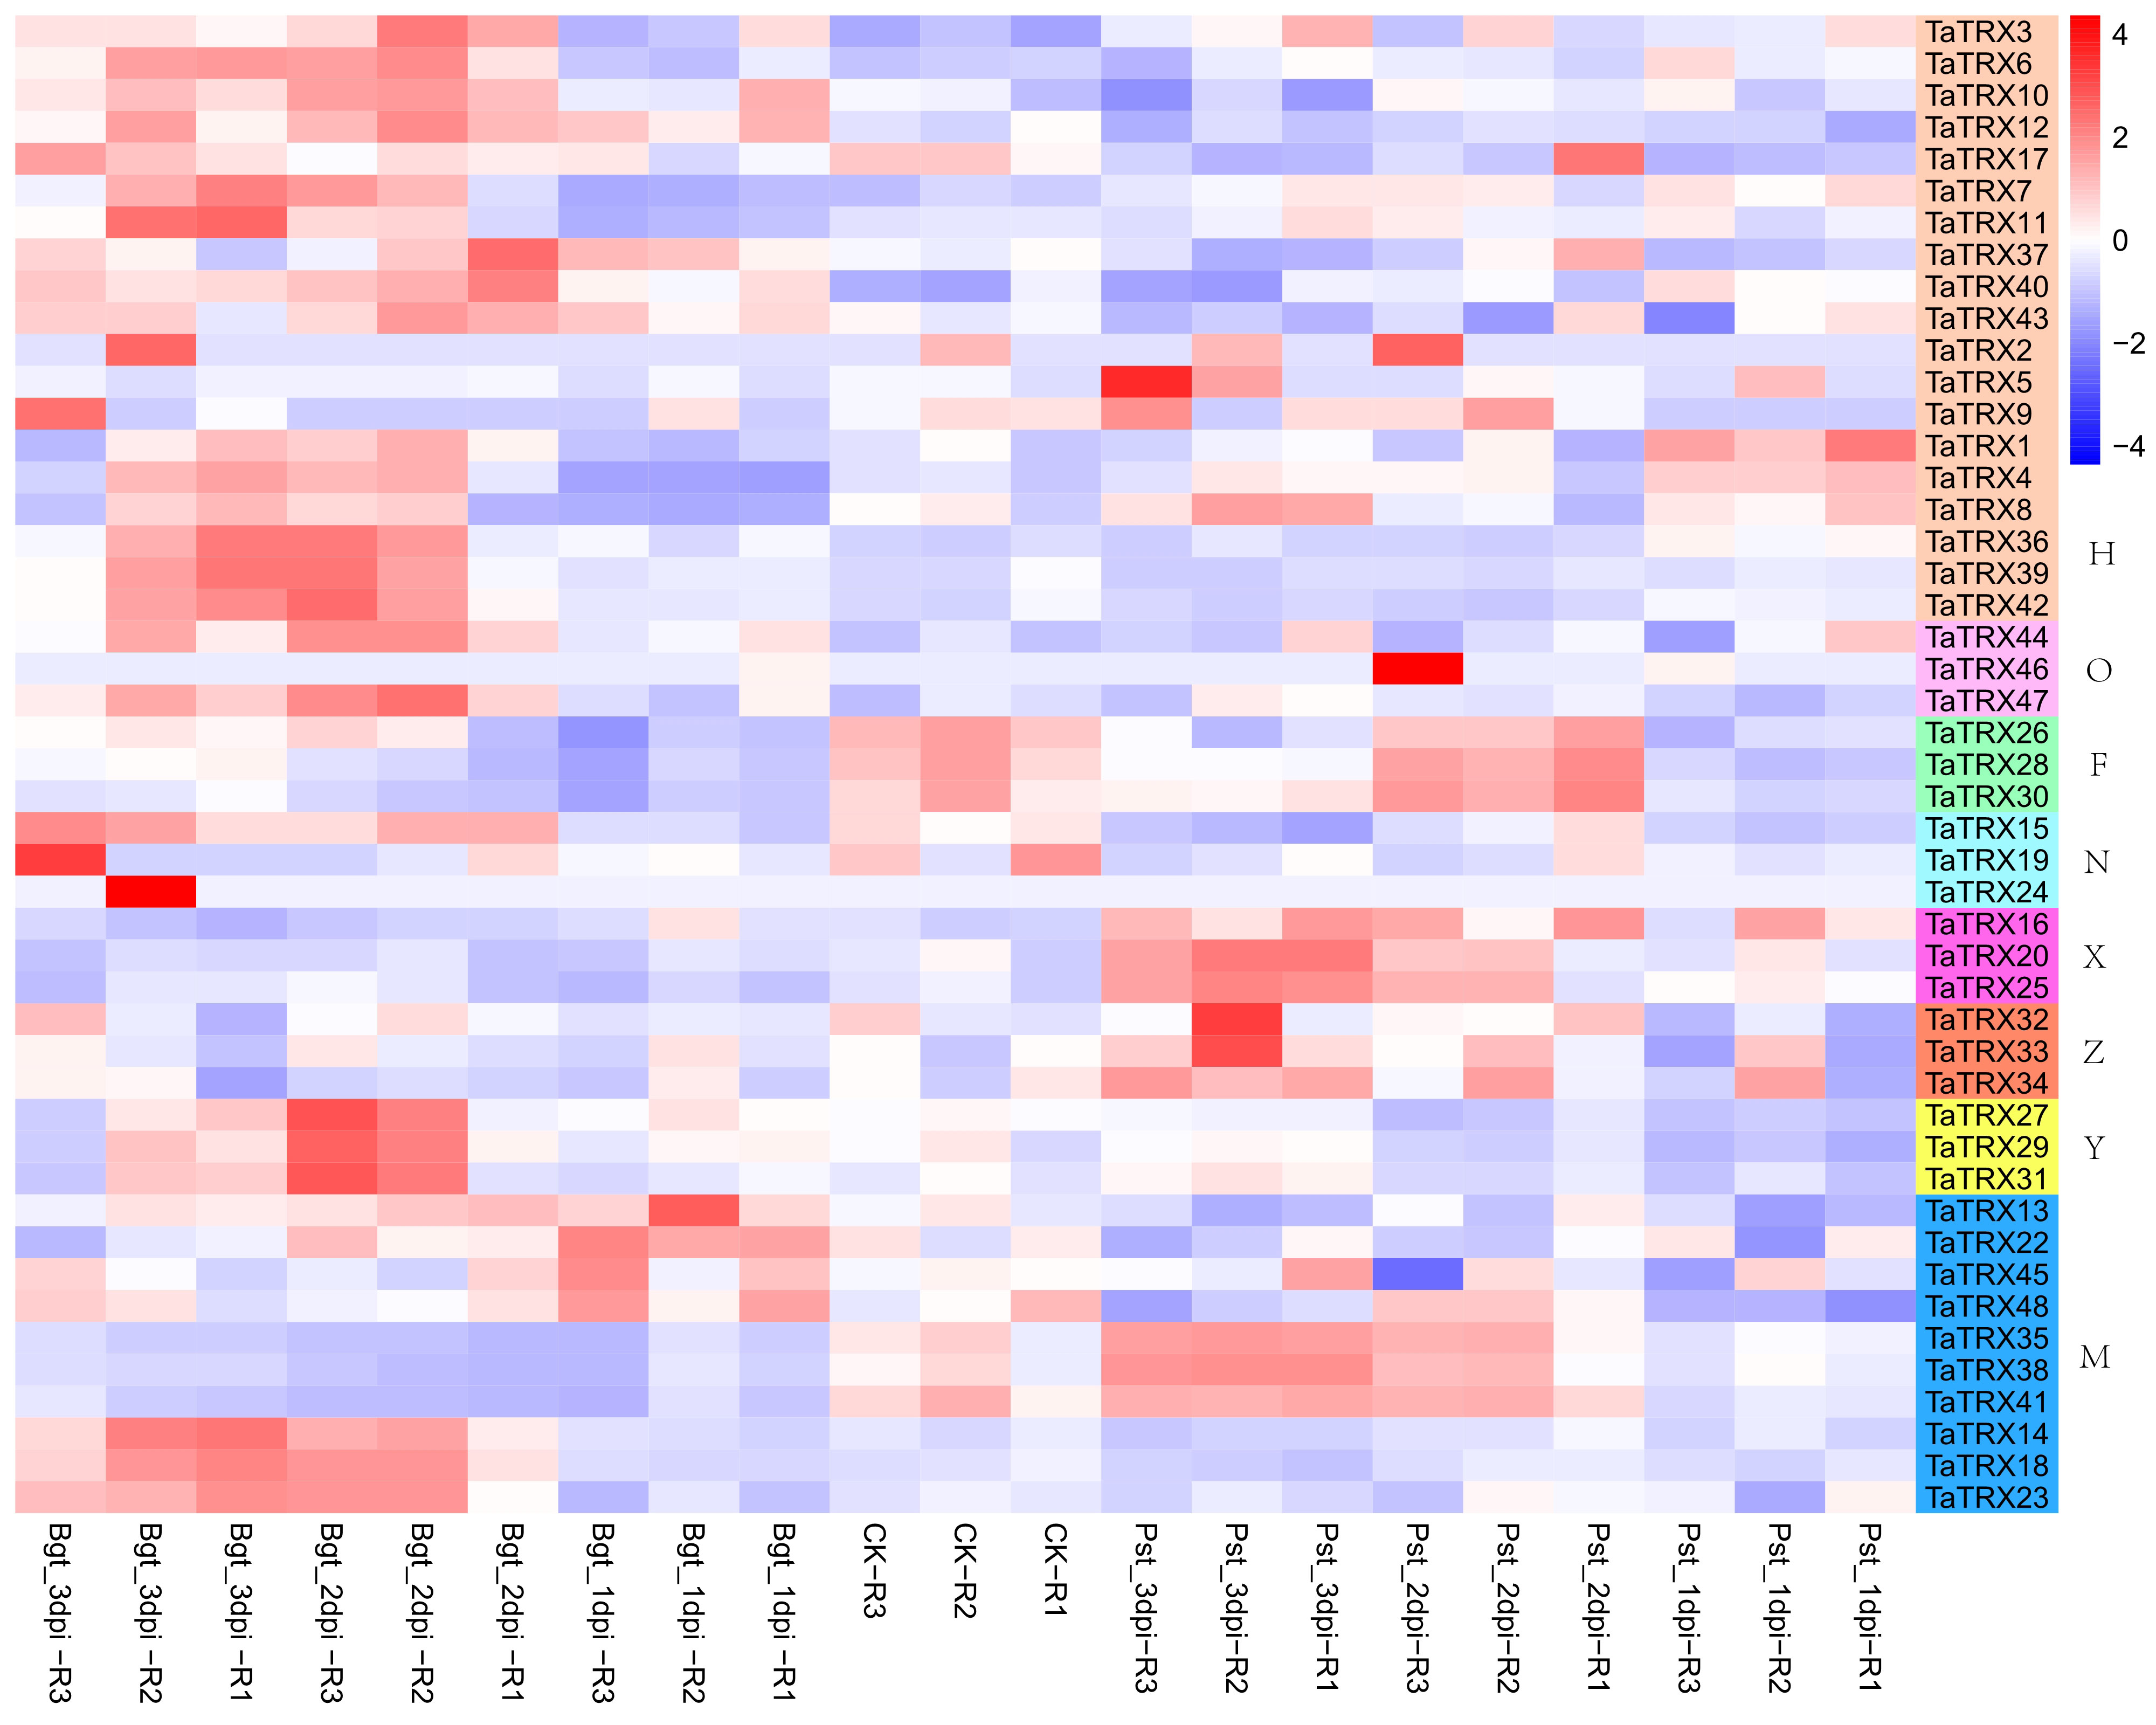
Figure 9 Expression profiles of typical TaTRX genes in wheat before and after the injection of powdery mildew and stripe rust. Bgt_1dpi, Bgt_2dpi and Bgt_3dpi represent 24h, 48h and 72h after powdery mildew pathogen was injected into wheat leaves; Pst_1dpi, Pst_2dpi and Pst_3dpi represent 24h, 48h and 72h after stripe rust pathogen was injected into wheat leaves; CK represents leaves not injected with powdery mildew and stripe rust. The red, white and blue cells represent the highest, medium and lowest gene expression levels, respectively. H, O, F, N, X, Z, Y, and M represent different subtypes of typical TaTRX genes, respectively. The colour scale represents Log2 expression values.
In order to verify the reliability of the above transcriptome data, six typical TaTRX genes were randomly selected and their expressions at multiple time points under different stress conditions were analyzed via RT-qPCR. The overall expression trends of these genes obtained via RT-qPCR analysis were basically consistent with that of RNA-seq analyses (Figure 10). In detail, under dehydration stress simulated using 20% PEG 6000, the expression levels of TaTRX1, TaTRX31, and TaTRX45 all showed a trend of increasing at first and then decreasing, and they reached the highest expression levels at 2h, 2h, and 1h, respectively. The expression of TaTRX10 showed a gradual upward trend and reached the highest level at 12h. Conversely, the expression of TaTRX28 showed a gradual downward trend with the increase in treatment time. Under 37°C heat stress treatment, the expressions of TaTRX1, TaTRX10 and TaTRX31 showed a trend of decreasing first and then increasing, while the expression of TaTRX16 and TaTRX45 showed a gradual increasing trend with the extension of treatment time. Under the treatment of 4°C cold stress, the expression of TaTRX1, TaTRX16 and TaTRX45 showed a gradually increasing trend, while the expression of TaTRX28 reached the highest level at 2h and gradually decreased, and the expression of TaTRX31 reached the highest level at 6h. Under NaCl stress, the expression of TaTRX16 gradually increased and reached a maximum at 24h, while the expression of TaTRX45 gradually decreased, and the expression of both TaTRX1 and TaTRX31 reached a maximum at 6h. These results meant that the transcriptome data used above were reliable.
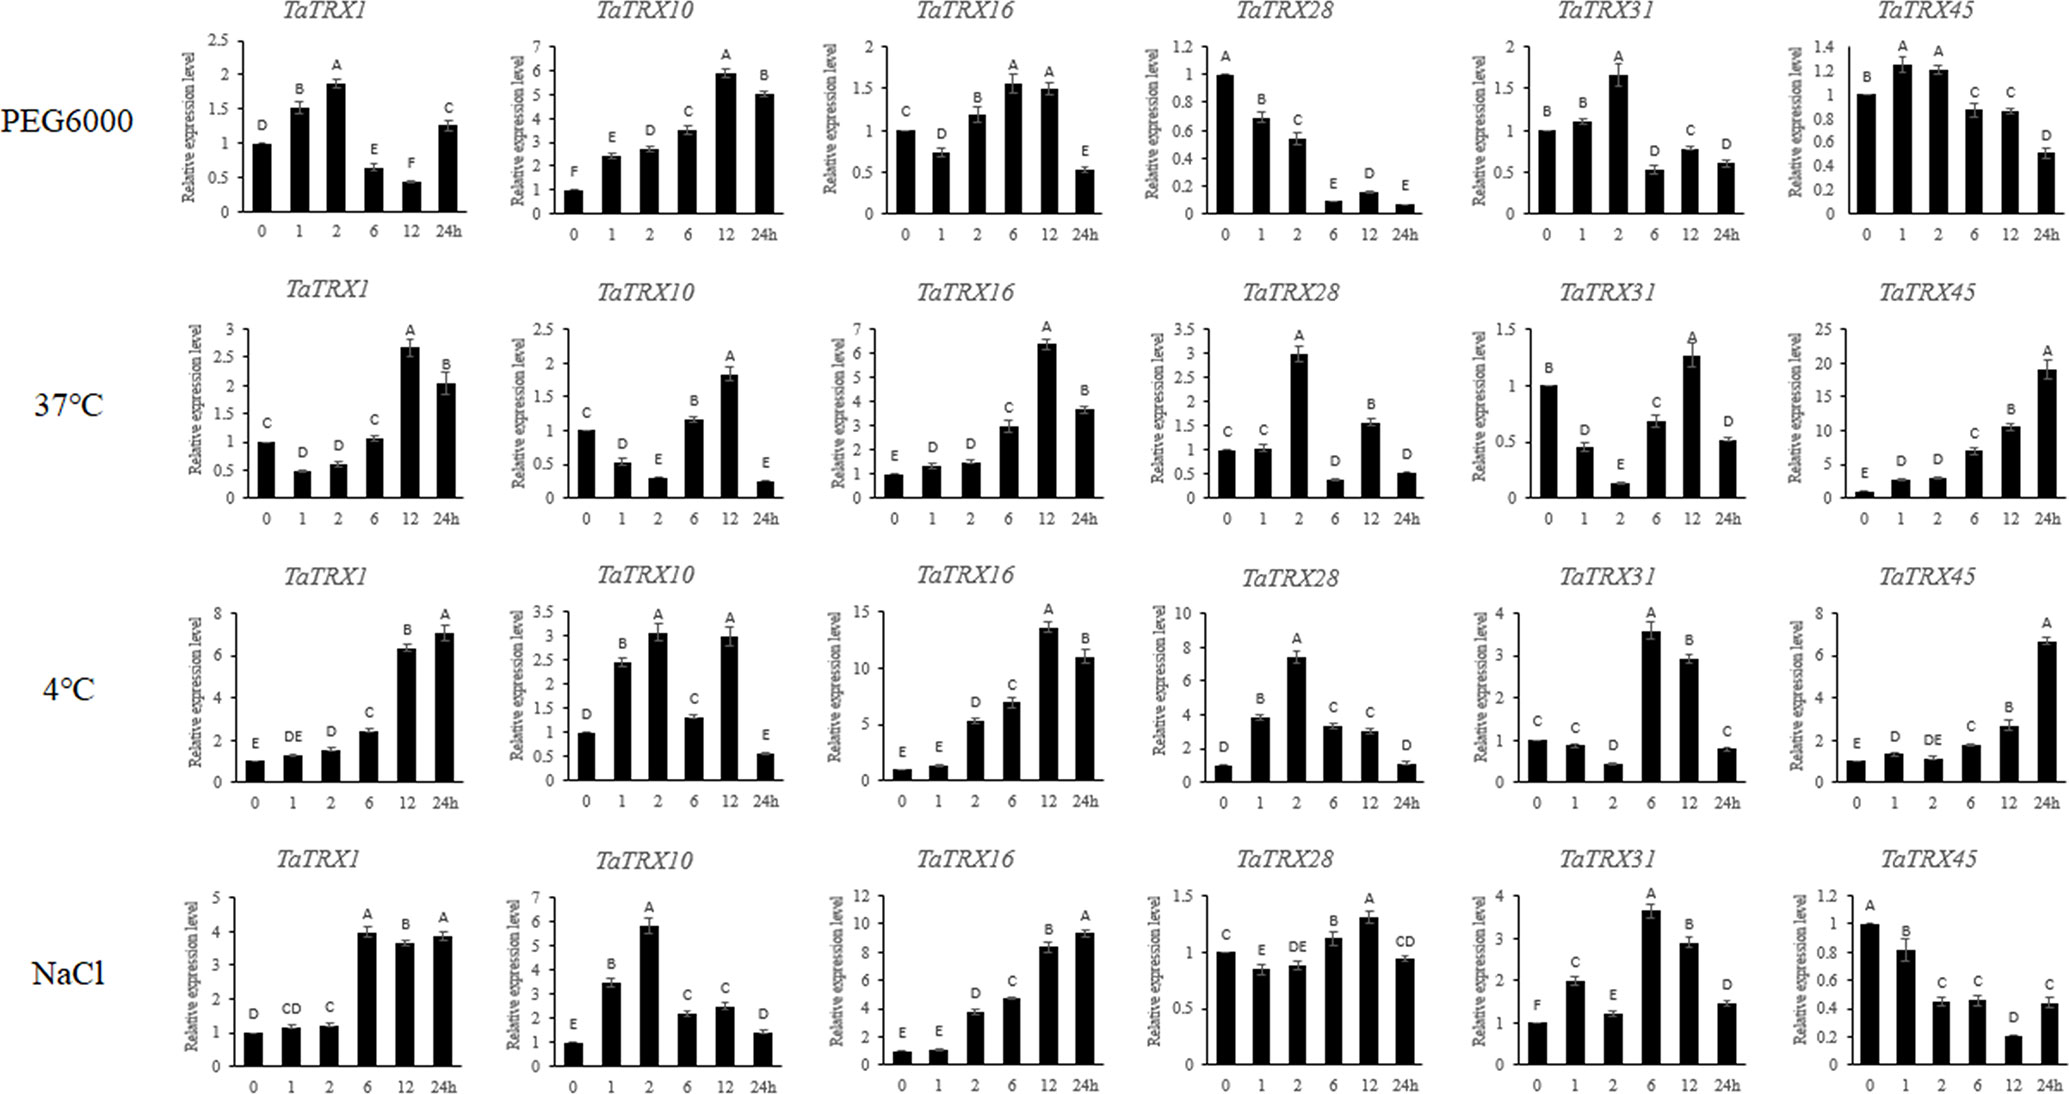
Figure 10 Expression analyses of typical TaTRX genes in wheat variety Chinese Spring (CS) under different treatments by RT-qPCR. Relative expression levels of typical TaTRXs in response to PEG 6000 (20%), heat (37°C), cold (4°C) and NaCl (200 mM) for 0 h, 1 h, 2 h, 6 h, 12 h, and 24 h in the leaves at the two-leaf stage. Data were normalized with β-actin gene. Vertical bars indicate standard deviations. Different capital letters indicate extremely significant differences at p < 0.01 according to one-way ANOVA and post-hoc Tukey’s test.
The orthology-based method was used to predict the interaction proteins of typical TaTRXs since the protein interaction database of wheat is not perfect, so as to better understand the biological function and mechanism of this family in wheat. A total of 16 proteins interacting with typical TaTRXs were predicted and named according to their homologies (Figure S10, Table S8). Among these 16 interacting proteins, TaNTR1-A, TaNTR1-B, and TaNTR2-D belonged to the NADPH-dependent thioredoxin reductase (NTR) family in wheat, TaFTR1-A and TaFTR1-D belonged to the ferredoxin-thioredoxin reductase (FTR) family in wheat, TaPrx1-A, TaPrx1-B, TaPrx1-D, TaPrx2-B, and TaPrx2-D belonged to the peroxiredoxin (Prx) family, and TaFRK1-A, TaFRK2-A, TaFRK2-B, TaFRK2-D, TaFRK3-A, and TaFRK3-B were members of the fructokinase (FRK) family. NTR, FTR, and Prx play important roles in the wheat redox regulation pathway. Only three Z-type TRXs (TaTRX32, TaTRX33, and TaTRX34) can interact with the above six TaFRK proteins, suggesting that Z-type TaTRXs might be able to participate in regulating the glycolysis pathway of wheat by regulating the redox states of TaFRKs, while other subtypes of TaTRXs should have no such function.
TRXs are important proteins that are widely present in organisms, and they regulate the redox state of cells. The TRX system in plants is widely involved in transcription and translation, metabolism, signal transduction, and so on, under normal circumstances (Geigenberger et al., 2017). When plants suffer from biotic or abiotic stresses, the concentration of ROS increases, and plants will be in a state of oxidative stress, resulting in serious damage to biological macromolecules such as DNA, proteins, and lipids (Miller et al., 2010). The TRX system can reduce, repair, and refold proteins that are damaged by oxidation in the body to restore their activity (Meyer et al., 2009; Wang et al., 2010), regulate the balance of other redox systems in the body, such as the glutathione (GSH) system, and maintain the stability of the redox balance of various physiological and biochemical processes in plants (Kanzok et al., 2001). The genome-wide analyses of the TRX family has been widely carried out because the genomes of many species have been sequenced in recent years. In total, 41, 61, 48, and 150 TRX family members have been identified in Arabidopsis (Chibani et al., 2021), rice (Nuruzzaman et al., 2012), grape (Zhang J. R. et al., 2021), and upland cotton (Elasad et al., 2018), respectively. However, due to the complexity of the wheat genome, the current research on wheat TRX family genes is incomplete. In this study, we conducted genome-wide identification and multifaceted analyses of typical TRX family members in wheat. This study provides a foundation for better understanding the roles of typical TaTRX members in wheat growth and stress responses.
In this study, a total of 48 typical TaTRX gene family members were identified by searching at the whole genome level of wheat, of which 16, 15, and 17 typical TaTRX genes were distributed in the A, B, and D subgenomes, respectively, indicating that there was no significant change in the gene abundance of typical TaTRX genes at the subgenome scale. Among the 17 homoeological groups, three groups contained only two homoeological copies, indicating that homologous copy loss events might occur in the typical TRX gene family of wheat during wheat polyploidy. The number of typical TRX members in Arabidopsis, rice, and maize were about 41.7%, 35.4% and 41.7% of that in wheat, respectively, indicating that allohexaploization was conducive to the expansion of typical TRX family members in wheat. The key to the increase in the diversity of gene family members usually includes gene tandem duplication and segmental duplication events. The members of the gene family formed by tandem replication are usually closely arranged on the same chromosome, forming a gene cluster with similar sequence and function. Fragment duplication events are large-scale gene proliferation processes at the chromosome level (Schmutz et al., 2010; Su et al., 2020). A study on the amplification of soybean ANK gene family members showed that the contribution rates of tandem duplication and segmental duplication events were 35.8% and 46.0%, respectively (Zhao et al., 2020); about 10.5% and 64.8% of wheat SCPL family genes were identified from tandem duplication and segmental duplication events, respectively (Xu et al., 2021). In this study, consistent with these prior findings, 8.3% of the members of the typical TRX family in wheat were shown to originate from tandem duplication, and 83.3% from segmental duplication, indicating that segmental duplication was the main factor in the amplification of the typical TRX genes in the wheat genome. The expansions of gene families are usually considered to be the result of species evolution, which helps species to improve their adaptabilities in different environments, so that they are widely distributed (Theiben et al., 2016; Zhao et al., 2021). The analyses of collinearity among species can provide information for the study of genome evolution history (Wang et al., 2012). In this study we found that 15 typical TRX genes in wheat, seven typical TRX genes in rice, and 11 typical TRX genes in maize might have common genetic origins, suggesting that these orthologous pairs might have existed before the differentiation of monocotyledon ancestors.
The codon system encoding amino acids has the property of degeneracy, and in general, a change in the third base causes a synonymous substitution, while a change in the first or second base causes a non-synonymous substitution. In genetics, Ka and Ks represent the non-synonymous replacement rate and synonymous replacement rate of two genes, respectively. Because non-synonymous substitution will cause amino acid changes, which may change the conformation and function of proteins, it will eventually lead to adaptive changes. Synonymous substitution does not change the composition of a protein, and so it is not affected by natural selection. The ratio of Ka and Ks can determine whether there is selective pressure on the coding gene of this protein (Akhunov et al., 2013). Lei et al. (2021) used PAML software to calculate the Ka/Ks values of wheat PYL genes and their orthologous genes of two ancestral species, and no positive selection genes were found, indicating that wheat PYL genes experienced purification selection in the process of evolution, and are highly conservative. Ru et al. (2021) also reached a similar conclusion in their study on wheat DEAD-box family genes. Ding et al. (2018) found in their study of TCP family genes in wheat that TaTCP16-A was the result of positive selection relative to its direct homologous genes in Urartu wheat (Triticum urartu L.), while other genes were the result of purified selection. In this study, three typical TRX genes of wheat were found to be positively selected relative to their orthologous ancestral species, suggesting that these three genes might play significant roles in the evolution of wheat. A total of 37.5% of the genes in the TRX family were identical to the orthologous gene sequences of their ancestors, indicating that the typical TRX family genes in wheat were conserved in the evolutionary process.
Gene structure and protein conserved motifs can provide important information for analyzing the evolutionary relationship and phylogenetic characteristics of gene families (Zhu et al., 2020), and their diversities are closely related to the evolutionary characteristics and functions of gene family members. In this study, among the typical TRX family genes in wheat, the gene structures of the same branch were relatively similar, but there were also a few exceptions (Figure 2). Structural differences can produce homologous genes with different functions, which is common in gene families (Xu et al., 2012; Zhao et al., 2021). Most proteins of the same types in the typical TRX family of wheat contained similar conserved motifs, but there were a few exceptions. For example, although TaTRX13 and TaTRX22 were in the same branch, motif3 only existed in TaTRX22, which might be related to the different compositions and arrangements of introns and exons. In addition, the putative 3D structures of the typical TRX proteins of the same subtypes were similar. In all the predicted models, the active “WCGPC” site associated with target protein reduction was located between the second α-helix and the second β-fold, these results provide important information for better understanding the biological functions of typical TRX genes in wheat.
The spatiotemporal expression specificity of genes will provide useful information for understanding their functions in growth and development (Tong et al., 2013). In this study, there were four typical TaTRX homologous groups (12 genes) with high levels of expression in wheat leaves at the three stages of seedling, tillering, and 2d after flowering stage. These 12 genes belonged to chloroplast TRXs and were predicted to be located in the chloroplasts. In addition, TaTRX32/33/34 (Z type) were highly expressed in the leaves at the seedling stage and the flag leaves at the tillering stage of wheat. The research of Arsova et al. (2010) shows that the interaction between the Z type TRX and two fructokinase-like proteins (FLNs) in chloroplasts may participate in the regulation of plastid-encoded polymerase (PEP)–dependent chloroplast transcription, and then link the transcriptional regulation and light signals through photosynthetic electron transport (PET), which may have an important impact on the normal development of chloroplasts. The prediction results of the protein interaction network in this study showed that only Z type TaTRX proteins could interact with fructokinase (FRK) proteins in wheat. Bhurta et al. (2022) predicted the possible interaction proteins of 15 previously screened TaTRX proteins, and the results did not include TaFRK, which may be because these 15 TaTRX proteins do not contain Z type TRX. The target proteins of plant typical TRXs in chloroplasts may also include chlorophyll a/b binding protein, photosystem I reaction center subunit N, light harvesting complex II protein kinase, etc. (Balmer et al., 2006; Schürmann and Buchanan, 2008; Montrichard et al., 2009). Therefore, the above 15 typical TaTRX genes may play important roles in the absorption of light energy and the energy transfer of plants. TaTRX14/18/23 (M type) and TaTRX37/40/43 (H type) were highly expressed in the early stage of wheat grain development; the expressions of TaTRX36/39/42 (H type) were higher in the late stage of wheat grain development; and the expression of TaTRX21 (H type) was higher at different stages of grain development after anthesis, but lower in other tissues of wheat. Wong et al. (2004) used both monobromobimane (mBBr) fluorescent gel electrophoresis and mutant thioredoxin affinity column chromatography methods to identify the target proteins of TRXs during wheat grain development. These target proteins mainly include aconitase, which is involved in the tricarboxylic acid cycle; ADP glucose pyrophosphorylase (AGPase), which plays an important role in starch synthesis; enolase and triosephosphate isomerase (TPI), the key enzymes in the glycolysis pathway; and protein disulfide isomerase (PDI), etc. These proteins are involved in biochemical processes such as carbohydrate metabolism, nitrogen metabolism and protein synthesis and degradation during wheat grain development. Therefore, in this study, the above 10 typical TaTRX genes (most of them are H type), might play important roles in the material synthesis and metabolism of wheat grain development. Kobrehel et al. (1992) found that thioredoxin H functions as a signal of the mobilization of storage proteins to enhance the metabolic processes associated with the germination of wheat seeds. Barley seeds with Trx H overexpressed in the endosperm showed accelerated germination and early or enhanced expression of associated enzymes (α-amylase and pullulanase). The underexpression of Trxh9 in wheat led to effects that were opposite to those observed for the overexpression of Trxh5 in the barley-retardation of germination, and the delayed or reduced expression of associated enzymes. Wheat lines with underexpressed Trx showed delayed preharvest sprouting when grown in the greenhouse or in a field without a decrease in final yield (Li et al., 2009). The expression of protein disulfide isomerase in the thioredoxin s antisense transgenic wheat was up-regulated, which induced easily forming glutenin macropolymers and the resistance of storage proteins to degradation (Guo et al., 2013). The results are further evidence that the level of Trx H in cereal endosperm determines the fundamental properties as well as the potential applications of the seed.
There are usually many cis-acting elements that are involved in various pathways in the promoter regions of genes, and their complex interactions with trans-acting factors can regulate gene expression (Hu et al., 2016). In this study, analyses of the expression profiles of typical TaTRXs showed that most genes could be induced by different stress treatments, but so far, there are few studies on the cis-acting elements of typical TaTRX promoters. In this study, the promoter regions of TaTRX3/6/10 (H type) and TaTRX44 (O type), which were up-regulated by drought treatment, all contained the drought-responsive elements MBS, MYB, or MYC; the seven homoeologous groups that were up-regulated by cold stress treatment all contained one or more low temperature response elements, LTR or DRE; the promoter regions of TaTRX2/5/9 (H type), TaTRX20/25 (X type), and TaTRX17 (H type), which were up-regulated after salt stress treatment, all contained the salt stress response-related elements DRE or MYB; these indicated that the expressions of typical TaTRXs after stress treatments might be affected by the interaction between their promoter-associated cis-acting elements and transcription factors. The promoter regions of most typical TaTRX genes contained ABRE elements, especially TaTRX4 (H type) and TaTRX46 (O type), which contained 11 and 9 ABRE elements, respectively. It is speculated that members of this family might be widely involved in wheat ABA signal transduction. Cheng et al. (Cheng et al., 2021) studied the promoter of TaNRX1 (TaTRX19 in this study) and showed that a 36 bp fragment containing two ABRE cis-acting elements was the key sequence of the TaNRX1 gene in response to polyethylene glycol (PEG) and ABA.
The results of the GO analysis show that the biological processes of all typical TaTRX genes comprised cell redox homeostasis. Our research on the expression of the TaTRX24 gene and the redox status of wheat under drought stress provides strong evidence for the results of GO. Previous studies have also shown that TRX can restore the activity of the target protein by reducing the disulfide bond that was incorrectly formed, so as to maintain the redox balance of cells (Gelhaye et al., 2005; Daloso et al., 2015). In this study, using RNA-seq data combined with RT-qPCR experiments, the expression characteristics of typical TaTRX genes under various biotic and abiotic stresses were deeply analyzed. The results show that different typical TaTRX genes can respond to different stresses and then up-regulate their expressions. For example, typical TaTRX1/4/8 (H type) can be up-regulated after infection with stripe rust, powdery mildew, and cold stress; typical TaTRX3/6/10 (H type) can be up-regulated after drought stress and after infection with powdery mildew; the typical TaTRX16/20/25 (X type) can be up-regulated after exposure to cold and salt stresses, and infection with stripe rust. The target proteins of TRXs that have been identified by predecessors that can help plants resist adversity stress include superoxide dismutase (SOD), peroxidase (POD), catalase (CAT), heat shock protein (HSP), cold shock protein (CSP), betaine aldehyde dehydrogenase (BADH), etc. (Balmer et al., 2004; Alkhalfioui et al., 2007; Hägglund et al., 2008). POD is an enzyme that uses H2O2 as an electron acceptor to catalyze the oxidation of the substrate. POD is important for the removal of excess ROS in plants. In this study, several TaPrx proteins, which are thiol peroxidases, were predicted to interact with TaTRXs based on the protein interaction network database. The prediction made by Bhurta et al. (2022) on the interaction proteins of 15 TaTRXs also reached the same conclusion. The functions of these target proteins are mainly related to the scavenging of excess ROS in plant cells, the maintenance of cell osmotic potential, and the stabilities of nucleic acids, proteins, and the structures of cell membranes under stresses. Zhang et al. (2015) found that under stress conditions, AtTRX-M2 can reduce ROS generation by targeting AtVDAC3. Kneeshaw et al. (2017) showed that enzymes of the hydrogen peroxide (H2O2) scavenging pathway, including CATs, were able to suffer oxidative damage in ROS-rich environments, then NRX was able to target CAT to optimize its enzymatic activity, thereby enhancing the ability of plants to scavenge ROS. When TRX reduces the target protein, it will become oxidized, and then thioredoxin reductase (TrxR) can transfer electrons to the oxidized TRX to restore its ability to reduce the target protein (Arnér and Holmgren, 2001). Because of the important role of TrxR, Bhurta et al. (2022) and the authors of this paper all predicted that TaTRX could interact with TaTrxR by using the protein interaction network database.
In addition, genes such as TaTRX5, TaTRX6, and TaTRX12 were differentially expressed after stress treatment compared with their homologous genes, suggesting that the typical wheat TRX gene family underwent the subfunctionalization of homologous genes during the process of allopolyploidization. However, the gene structures and protein conserved motifs of homologous genes in this family were not significantly different, so different UTR lengths and different distributions of cis-acting elements in the promoter regions might regulate the expression specificities of these homologous typical TaTRX genes. Further research on the potential effects of subfunctionalization for the typical TRX family genes in wheat will help to better mine these genes and to understand their functions and roles in wheat.
The original contributions presented in the study are included in the article/Supplementary Material. Further inquiries can be directed to the corresponding authors.
JZ, JX and XZ conceived and designed this research; JZ performed the experiment; JZ, TS, HZ, MZ and NL analyzed the data; JZ wrote the manuscript; JZ, TS, HZ, MZ, NL, JX and XZ completed the writing review and editing. All authors contributed to the article and approved the submitted version.
This research was supported by the National Natural Science Foundation of China (32171992, 31671693, 31260324), Research Program of Science and Technology at Universities of Inner Mongolia Autonomous Region (NJZZ22132), Central Guidance on Local Science and Technology Development Fund of Mongolia Autonomous Region (ZY20200089), Program for Young Talents of Science and Technology in Universities of Inner Mongolia Autonomous Region (NJYT-19-A25).
The authors are grateful to Weiwei Wang, Liuping Chen, Ningning Zhang and all lab members for their useful suggestions, support and encouragement.
The authors declare that the research was conducted in the absence of any commercial or financial relationships that could be construed as a potential conflict of interest.
All claims expressed in this article are solely those of the authors and do not necessarily represent those of their affiliated organizations, or those of the publisher, the editors and the reviewers. Any product that may be evaluated in this article, or claim that may be made by its manufacturer, is not guaranteed or endorsed by the publisher.
The Supplementary Material for this article can be found online at: https://www.frontiersin.org/articles/10.3389/fpls.2022.1020584/full#supplementary-material
Akhunov, E. D., Sehgal, S., Liang, H. Q., Wang, S. C., Akhunova, A. R., Kaur, G., et al. (2013). Comparative analysis of syntenic genes in grass genomes reveals accelerated rates of gene structure and coding sequence evolution in polyploid wheat. Plant Physiol. 161, 252–265. doi: 10.1104/pp.112.205161
Alkhalfioui, F., Renard, M., Vensel, W. H., Wong, J. H., Tanaka, C. K., Hurkman, W. J. (2007). Thioredoxin-linked proteins are reduced during germination of seeds of Medicago truncatula. Plant Physiol. 144, 1559–1579. doi: 10.1104/pp.107.098103
Arnér, E. S. J., Holmgren, A. (2001). Physiological functions of thioredoxin and thioredoxin reductase. Eur J Biochem. 267, 6102–6109. doi: 10.1046/j.1432-1327.2000.01701.x
Arsova, B., Hoja, U., Wimmelbacher, M., Greiner, E., Üstün, S., Melzer, M., et al. (2010). Plastidial thioredoxin z interacts with two fructokinase-like proteins in a thiol-dependent manner: Evidence for an essential role in chloroplast development in Arabidopsis and Nicotiana benthamiana. Plant Cell. 22, 1498–1515. doi: 10.1105/tpc.109.071001
Ashburner, M., Ball, C. A., Blake, J. A., Botstein, D., Butler, H., Cherry, J. M., et al. (2000). Gene ontology: Tool for the unification of biology. Nat. Genet. 25, 25–29. doi: 10.1038/75556
Balmer, Y., Vensel, W. H., Hurkman, W. J., Buchanan, B. B. (2006). Thioredoxin target proteins in chloroplast thylakoid membranes. Antioxid. Redox Signal. 8, 1829–1834. doi: 10.1089/ars.2006.8.1829
Balmer, Y., Vensel, W. H., Tanaka, C. K., Hurkman, W. J., Gelhaye, E., Rouhier, N. (2004). Thioredoxin links redox to the regulation of fundamental processes of plant mitochondria. Proc. Nat. Acad. Sci. 101, 2642–2647. doi: 10.1073/pnas.0308583101
Bhurta, R., Hurali, D. T., Tyagi, S., Sathee, L., Adavi, B. S., Singh, D., et al. (2022). Genome-wide identification and expression analysis of the thioredoxin (Trx) gene family reveals its role in leaf rust resistance in wheat (Triticum aestivum L.). Front. Genet. 13. doi: 10.3389/fgene.2022.836030
Buchanan, B. B. (1980). Role of light in the regulation of chloroplast enzymes. Annu. Rev. Plant Physiol. 31, 341–374. doi: 10.1146/annurev.pp.31.060180.002013
Cheng, J., Wei, F., Zhang, M. F., Li, N., Song, T. Q., Wang, Y., et al. (2021). Identification of a 193 bp promoter region of TaNRX1−D gene from common wheat that contributes to osmotic or ABA stress inducibility in transgenic Arabidopsis. Genes Genom. 43, 1035–1048. doi: 10.1007/s13258-021-01115-x
Chibani, K., Pucker, B., Dietz, K. J., Cavanagh, A. (2021). Genome-wide analysis and transcriptional regulation of the typical and atypical thioredoxins in Arabidopsis thaliana. FEBS Lett. 595, 2715–2730. doi: 10.1002/1873-3468.14197
Chibani, K., Tarrago, L., Gualberto, J. M., Wingsle, G., Rey, P., Jacquot, J. P., et al. (2012). Atypical thioredoxins in poplar: The glutathione-dependent thioredoxin-like2.1 supports the activity of target enzymes possessing a single redox active cysteine. Plant Physiol. 159, 592–605. doi: 10.1104/pp.112.197723
Chi, Y. H., Moon, J. C., Yoon, C. Y., Lim, C. O., Yean, K. J., Jin, Y. D., et al. (2008). Abnormal chloroplast development and growth inhibition in rice thioredoxin m knock-down plants. Plant Physiol. 148, 808–817. doi: 10.1104/pp.108.123547
Christophe, L., Dominique, M. O., Yves, M., Yves, M., Philippe, R. J. (2004). The Arabidopsis cytosolic thioredoxin-h5 gene induction by oxidative stress and its W-box-mediated response to pathogen elicitor. Plant Physiol. 134, 1006–1016. doi: 10.1104/pp.103.035782
Collin, V., Issakidis, B. E., Marchand, C., Hirasawa, M., Lancelin, J. M., Knaff, D. B., et al. (2003). The Arabidopsis plastidial thioredoxins: New functions and new insights into specificity. J. Biol. Chem. 278, 23747–23752. doi: 10.1074/jbc.M30207720
Collin, V., Lamkemeyer, P., Miginiac, M. M., Hirasawa, M., Knaff, D. B., Dietz, K. J., et al. (2004). Characterization of plastidial thioredoxins from Arabidopsis belonging to the new y-type. Plant Physiol. 136, 4088–4095. doi: 10.1104/pp.104.052233
Daloso, D. M., Muller, K., Obata, T., Florian, A., Tohqe, T., Bottcher, A. (2015). Thioredoxin, a master regulator of the tricarboxylic acid cycle in plant mitochondria. Proc. Natl. Acad. Sci. 112, 1392–1400. doi: 10.1073/pnas.1424840112
Ding, N., Li, Z. Z., Tian, W., Dang, R. M., Liu, Y. Y., Wen, S. S. (2018). Genome-wide identification of the wheat TCP gene family and its response to heat stress. J. Triticeae. Crops. 38, 1157–1165. doi: 10.7606/j.issn.1009-1041.2018.10.03
Elasad, M., Wei, H. L., Wang, H. T., Su, J. J., Ondati, E., Yu, S. X. (2018). Genome-wide analysis and characterization of the TRX gene family in upland cotton. Trop. Plant Biol. 11, 119–130. doi: 10.1007/s12042-018-9205-3
Elias, S. J., Arnér, Holmgren, A. (2001). Physiological functions of thioredoxin and thioredoxin reductase. Eur. J. Biochem. 267, 6102–6109. doi: 10.1046/j.1432-1327.2000.01701.x
Funato, Y., Hayashi, T., Irino, Y., Takenawa, T., Miki, H. (2013). Nucleoredoxin regulates glucose metabolism via phosphofructokinase 1. Biochem. Bioph. Res. Co. 440, 737–742. doi: 10.1016/j.bbrc.2013.09.138
Geigenberger, P., Thormählen, I., Daloso, D. M., Fernie, A. R. (2017). The unprecedented versatility of the plant thioredoxin system. Trends Plant Sci. 22, 249–262. doi: 10.1016/j.tplants.2016.12.008
Gelhaye, E., Rouhier, N., Gerard, J., Jolivet, Y., Gualberto, J., Navrot, N., et al. (2004). A specific form of thioredoxin-h occurs in plant mitochondria and regulates the alternative oxidase. Proc. Natl. Acad. Sci. 101, 14545–14550. doi: 10.1073/pnas.0405282101
Gelhaye, E., Rouhier, N., Navrot, N., Jacquot, J. P. (2005). The plant thioredoxin system. Cell. Mol. Life Sci. 62, 24–35. doi: 10.1007/s00018-004-4296-4
Guo, Y., Liu, J., Zhang, J. F., Liu, S. Y., Du, J. C. (2017). Selective modes determine evolutionary rates, gene compactness and expression patterns in brassica. Plant J. 91, 34–44. doi: 10.1111/tpj.13541
Guo, H. X., Wang, S. X., Xu, F. F., Li, Y. C., Ren, J. P., Wang, X., et al. (2013). The role of thioredoxin h in protein metabolism during wheat (Triticum aestivum L.) seed germination. Plant Physiol. Bioch. 67, 137–143. doi: 10.1016/j.plaphy.2013.03.006
Hägglund, P., Bunkenborg, J., Maeda, K., Svensson, B. (2008). Identification of thioredoxin protein disulfide targets using a quantitative proteomics approach based on isotope-coded affinitytags. J. Proteome Res. 7, 5270–5276. doi: 10.1021/pr800633y
Holmgren, A. (1985). Thioredoxin. Annu.Rev.Biochem. 54, 237–271. doi: 10.1146/annurev.bi.54.070185.001321
Hu, L., Yang, Y., Jiang, L., Liu, S. (2016). The catalase gene family in cucumber: Genome-wide identification and organization. Genet. Mol. Biol. 39, 408–415. doi: 10.1590/1678-4685-GMB-2015-0192
IWGSC (2018). Shifting the limits in wheat research and breeding using a fully annotated reference genome. Science. 361, 6403. doi: 10.1126/science.aar7191
Kanzok, S. M., Fechner, A., Bauer, H., Ulschmid, J. K., Muller, H. M., Munoz, J. B., et al. (2001). Substitution of the thioredoxin system for glutathione reductase in drosophila melanogaster. Science. 291, 643–646. doi: 10.1126/science.291.5504.643
Kneeshaw, S., Keyani, R., Delorme, H. V., Imrie, L., Spoel, S. H. (2017). Nucleoredoxin guards against oxidative stress by protecting antioxidant enzymes. Proc. Natl. Acad. Sci. 114, 8414–8419. doi: 10.1073/pnas.1703344114
Kobrehel, K., Joshua, H. W., Arpad, B., Ferenc, K., Boihon, C. Y., Bob, B. B. (1992). Specific reduction of wheat storage proteins by thioredoxin h. Plant Physiol. 99, 919–924. doi: 10.1104/pp.99.3.919
Kumar, R., Harikrishna, Barman, D., Ghimire, O. P., Gurumurthy, S., Singh, P. K. (2022). Stay-green trait serves as yield stability attribute under combined heat and drought stress in wheat (Triticum aestivum L.). Plant Growth Regul. 96, 67–78. doi: 10.1007/s10725-021-00758-w
Laloi, C., Rayapuram, N., Chartier, Y., Grienenberger, J. M., Bonnard, G., Meyer, Y. (2001). Identification and characterization of amitochondrial thioredoxin system in plants. Proc. Natl. Acad. Sci. 98, 14144–14149. doi: 10.1073/pnas.241340898
Laughner, B. J., Sehnke, P. C., Ferl, R. J. (1998). A novel nuclear member of the thioredoxin superfamily. Plant Physiol. 118, 987–996. doi: 10.1104/pp.118.3.987
Lei, P. Z., Wei, X. L., Gao, R. T., Huo, F. L., Nie, X. J., Tong, W., et al. (2021). Genome-wide identification of PYL gene family in wheat: Evolution, expression and 3D structure analysis. Genomics. 113, 854–866. doi: 10.1016/j.ygeno.2020.12.017
Li, M. Y., Fan, Y. D., Zhang, X. N., Jiang, Y. M., Meng, F. R., Li, Y. C. (2019). Sequence characteristics of Trxh9 gene and its response to osmotic stresses in wheat. Acta Bot. Boreal. Occident. Sin. 39, 896–903. doi: 10.7606/j.issn.1000-4025.2019.05.0896
Li, Y. C., Ren, J. P., Cho, M. J., Zhou, S. M., Kim, Y. B., Guo, H. X., et al. (2009). The level of expression of thioredoxin is linked to fundamental properties and applications of wheat seeds. Mol. Plant 2, 430–441. doi: 10.1093/mp/ssp025
Martin, J. L. (1995). Thioredoxin-a fold for all reasons. Structure. 3, 245–250. doi: 10.1016/S0969-2126(01)00154-X
Meyer, Y., Belin, C., Hinoux, V. D., Reichheld, J. P., Riondet, C. (2012). Thioredoxin and glutaredoxin systems in plants: Molecular mechanisms, crosstalks, and functional significance. Antioxid. Redox Sign. 17, 1124–1160. doi: 10.1089/ars.2011.4327
Meyer, Y., Buchanan, B. B., Vignols, F., Reichheld, J. P. (2009). Thioredoxins and glutaredoxins: Unifying elements in redox biology. Annu. Rev. Genet. 43, 335–367. doi: 10.1146/annurev-genet-102108-134201
Meyer, Y., Reichheld, J. P., Vignols, F. (2005). Thioredoxins in Arabidopsis and other plants. Photosynth Res. 86, 419–433. doi: 10.1007/s11120-005-5220-y
Miller, G., Suzuki, N., Ciftci, Y. S., Mittler, R. (2010). Reactive oxygen species homeostasis and signalling during drought and salinity stresses. Plant Cell Environ. 33, 453–467. doi: 10.1111/j.1365-3040.2009.02041.x
Montrichard, F., Alkhalfioui, F., Yano, H., Vensel, W. H., Hurkman, W. J., Buchanan, B. B. (2009). Thioredoxin targets in plants: The first 30 years. J. Proteomics. 72, 452–474. doi: 10.1016/j.jprot.2008.12.002
Nuruzzaman, M., Sharoni, A. M., Satoh, K., Turki, A. S., Shimizu, T., Sasaya, T., et al. (2012). The thioredoxin gene family in rice: Genome-wide identification and expression profiling under different biotic and abiotic treatments. Biochem. Bioph. Res. Co. 423, 417–423. doi: 10.1016/j.bbrc.2012.05.142
Ortiz-Espín, A., Locato, V., Camejo, D., Schiermeyer, A., Gara, L. D., Sevilla, F., et al. (2015). Over-expression of Trxo1 increases the viability of tobacco BY-2 cells under H2O2 treatment. Ann. Bot-London. 116, 571–582. doi: 10.1093/aob/mcv076
Pankaj, Y. K., Kumar, R., Pal, L., Gill, K. S., Nagarajan, R., Kumar, V., et al. (2022). Performance and yield stability of doubled haploid population of wheat (Triticum aestivum L.) under high-temperature regime. Cereal Res. Commun. 50, 1185–1203. doi: 10.1007/s42976-022-00247-4
Ru, J. N., Hou, Z. H., Zheng, L., Zhao, Q., Wang, F. Z., Chen, J., et al. (2021). Genome-wide analysis of DEAD-box RNA helicase family in wheat (Triticum aestivum) and functional identification of TaDEAD-box57 in abiotic stress responses. Front. Plant Sci. 12. doi: 10.3389/fpls.2021.797276
Schmutz, J., Cannon, S. B., Schlueter, J., Ma, J., Mitros, T., Nelson, W. (2010). Genome sequence of the palaeopolyploid soybean. Nature. 463, 178–183. doi: 10.1038/nature08670
Schürmann, P., Buchanan, B. B. (2008). The ferredoxin/thioredoxin system of oxygenic photosynthesis. Antioxid. Redox Sign. 10, 1235–1274. doi: 10.1089/ars.2007.1931
Serrato, A. J., Gonzalez, J. A. R., Romero, D. T., Vargas, P., Merida, A., Sahrawy, M. (2021). Thioredoxins m are major players in the multifaceted light-adaptive response in Arabidopsis thaliana. Plant J. 108, 120–133. doi: 10.1111/tpj.15429
Shi, B. B., Zhao, X. B., Li, M., Dong, Z. H., Yang, Q. C., Wang, Y., et al. (2021). Wheat thioredoxin (TaTrxh1) associates with RD19-like cysteine protease TaCP1 to defend against stripe rust fungus through modulation of programmed cell death. Mol. Plant Microbe Interact. 34, 426–438. doi: 10.1094/MPMI-11-20-0304-R
Sun, L. J., Ren, H. Y., Liu, R. X., Li, B. Y., Wu, T. G., Sun, F., et al. (2010). An h-type thioredoxin functions in tobacco defense responses to two species of viruses and an abiotic oxidative stress. Mol. Plant Microbe Interact. 23, 1470–1485. doi: 10.1094/MPMI-01-10-0029
Su, H. G., Zhang, X. H., Wang, T. T., Wei, W. L., Wang, Y. X., Chen, J. (2020). Genome-wide identification, evolution, and expression of GDSL-type Esterase/Lipase gene family in soybean. Front. Plant Sci. 11. doi: 10.3389/fpls.2020.00726
Theiben, G., Melzer, R., Rumpler, F. (2016). MADS-domain transcription factors and the floral quartet model of flower development: Linking plant development and evolution. Development. 143, 3259–3271. doi: 10.1242/dev.134080
Thormählen, I., Meitzel, T., Groysman, J., Ochsner, A. B., Lahaye, E. V. R., Naranjo, B., et al. (2015). Thioredoxin f1 and NADPH-dependent thioredoxin reductase c have overlapping functions in regulating photosynthetic metabolism and plant growth in response to varying light conditions. Plant Physiol. 169, 1766–1786. doi: 10.1104/pp.15.01122
Tong, C., Wang, X., Yu, J., Wu, J., Li, W., Huang, J. (2013). Comprehensive analysis of RNA-seq data reveals the complexity of the transcriptome in brassica rapa. BMC Genom. 14, 689. doi: 10.1186/1471-2164-14-689
Vieira Dos Santos, Rey, P. (2006). Plant thioredoxins are key actors in the oxidative stress response. Trends Plant Sci. 11, 329–334. doi: 10.1016/j.tplants.2006.05.005
Wang, X. G., Ling, S. K., Zhao, D. S., Sun, Q., Li, Q., Wu, F., et al. (2010). Redox regulation of actin by thioredoxin-1 is mediated by the interaction of the proteins via cysteine 62. Antioxid. Redox Sign. 13, 565–573. doi: 10.1089/ars.2009.2833
Wang, Y., Tang, H., DeBarry, J. D., Tan, X., Li, J., Wang, X., et al. (2012). MCScanX: A toolkit for detection and evolutionary analysis of gene synteny and collinearity. Nucleic Acids Res. 40, e49. doi: 10.1093/nar/gkr1293
Wang, K., Zhong, M., Wu, Y. H., Bai, Z. Y., Liang, Q. Y., Liu, Q. L., et al. (2017). Overexpression of a chrysanthemum transcription factor gene dgnac1improves the salinity tolerance in chrysanthemum. Plant Cell Rep. 36, 571–581. doi: 10.1007/s00299-017-2103-6
Wang, N., Tang, C. L., Fan, X., He, M. Y., Gan, P. F., Zhang, S., et al. (2022b). Inactivation of a wheat protein kinase gene confers broad-spectrum resistance to rust fungi. Cell. 185, 2961–2974. doi: 10.1016/j.cell.2022.-06.027
Wang, M., Wang, M., Zhao, M., Wang, M. C., Liu, S. P., Tian, Y. C., et al. (2022a). TaSRO1 plays a dual role in suppressing TaSIP1 to fine tune mitochondrial retrograde signaling and enhance salinity stress tolerance. N. Phytol. 236, 495–511. doi: 10.1111/nph.18340
Wong, J. H., Cai, N., Balmer, Y., Tanaka, C. K., Vensel, W. H., Hurkman, W. J., et al. (2004). Thioredoxin targets of developing wheat seeds identified by complementary proteomic approaches. Phytochemistry. 65, 1629–1640. doi: 10.1016/j.phytochem.2004.05.010
Xu, G., Guo, C., Shan, H., Kong, H. (2012). Divergence of duplicate genes in exon-intron structure. Proc. Natl. Acad. Sci. 109, 1187–1192. doi: 10.1073/pnas.1109047109
Xu, X. M., Zhang, L. L., Zhao, W., Fu, L., Han, Y. X., Wang, K. K., et al. (2021). Genome-wide analysis of the serine carboxypeptidase-like protein family in triticum aestivum reveals TaSCPL184-6D is involved in abiotic stress response. BMC Genomics 22, 350. doi: 10.1186/s12864-021-07647-6
Yue, Y. J., Zhang, P. Y., Shang, Y. R. (2019). The potential global distribution and dynamics of wheat under multiple climate change scenarios. Sci. Total Environ. 688, 1308–1318. doi: 10.1016/j.scitotenv.2019.06.153
Zhang, M., Takano, T., Liu, S. K., Zhang, X. X. (2015). Arabidopsis mitochondrial voltage-dependent anion channel 3 (AtVDAC3) protein interacts with thioredoxin m2. FEBS Lett. 589, 1207–1213. doi: 10.1016/j.febslet.2015.03.034
Zhang, S. J., Li, Y. L., Song, G. Q., Gao, J., Zhang, R. Z., Li, W., et al. (2020). Heterologous expression of the ThIPK2 gene enhances drought resistance of common wheat. J Integrat Agricult. 19, 941–952. doi: 10.1016/s2095-3119(19)62714-0
Zhang, J. R., Zhao, T., Yan, F. D., Wang, L., Tang, Y. J., Wang, Y. J., et al. (2021). Genome−wide identification and expression analysis of thioredoxin (Trx) genes in seed development of Vitis vinifera. J. Plant Growth Regul. 41, 3030–3045. doi: 10.1007/s00344-021-10494-0
Zhang, Y. R., Zhou, J. F., Wei, F., Song, T. Q., Yu, Y., Yu, M., et al. (2021). Nucleoredoxin gene TaNRX1 positively regulates drought tolerance in transgenic wheat (Triticum aestivum L.). Front. Plant Sci. 12, 756338. doi: 10.3389/fpls.2021.756338
Zhao, J. Y., Lu, Z. W., Sun, Y., Fang, Z. W., Chen, J., Zhou, Y. B. (2020). The ankyrin-repeat gene GmANK114 confers drought and salt tolerance in Arabidopsis and soybean. Front. Plant Sci. 11. doi: 10.3389/fpls.2020.584167
Zhao, W., Zhang, L. L., Xu, Z. S., Fu, L., Pang, H. X., Ma, Y. Z. (2021). Genome-wide analysis of MADS-box genes in foxtail millet (Setaria italic L.) and functional assessment of the role of SiMADS51 in the drought stress response. Front. Plant Sci. 12. doi: 10.3389/fpls.2021.-659474
Keywords: wheat, typical TRX, gene family, genome-wide, expression pattern
Citation: Zhou J, Song T, Zhou H, Zhang M, Li N, Xiang J and Zhang X (2022) Genome-wide identification, characterization, evolution, and expression pattern analyses of the typical thioredoxin gene family in wheat (Triticum aestivum L.). Front. Plant Sci. 13:1020584. doi: 10.3389/fpls.2022.1020584
Received: 16 August 2022; Accepted: 28 November 2022;
Published: 22 December 2022.
Edited by:
Yin-Zheng Wang, Institute of Botany, Chinese Academy of Sciences (CAS), ChinaReviewed by:
Yuhui Liu, Gansu Agricultural University, ChinaCopyright © 2022 Zhou, Song, Zhou, Zhang, Li, Xiang and Zhang. This is an open-access article distributed under the terms of the Creative Commons Attribution License (CC BY). The use, distribution or reproduction in other forums is permitted, provided the original author(s) and the copyright owner(s) are credited and that the original publication in this journal is cited, in accordance with accepted academic practice. No use, distribution or reproduction is permitted which does not comply with these terms.
*Correspondence: Jishan Xiang, eGlhbmdqaXNoYW5AY2Z4eS5lZHUuY24=; Xiaoke Zhang, emhhbmd4aWFva2U2NkAxMjYuY29t
Disclaimer: All claims expressed in this article are solely those of the authors and do not necessarily represent those of their affiliated organizations, or those of the publisher, the editors and the reviewers. Any product that may be evaluated in this article or claim that may be made by its manufacturer is not guaranteed or endorsed by the publisher.
Research integrity at Frontiers
Learn more about the work of our research integrity team to safeguard the quality of each article we publish.