 Bin Yang1†
 Nan Chen1,2†Yifei Dang1,2†Yuzhi Wang1
 Hongwei Wen1
 Jun Zheng1
 Xingwei Zheng1Jiajia Zhao1Jinxiu Lu1*
 Ling Qiao1*
- 1Institute of Wheat Research, State Key Laboratory of Sustainable Dryland Agriculture, Shanxi Agricultural University, Linfen, China
- 2College of Agronomy, Shanxi Agricultural University, Taiyuan, China
In wheat, the leaf chlorophyll content in flag leaves is closely related to the degree of phosphorus stress. Identifying major genes/loci associated with chlorophyll content in flag leaves under different phosphorus conditions is critical for breeding wheat varieties resistant to low phosphorus (P). Under normal, medium, and low phosphorus conditions, the chlorophyll content of flag leaves was investigated by a double haploid (DH) population derived from a cross between two popular wheat varieties Jinmai 47 and Jinmai 84, at different grain filling stages. Chlorophyll content of the DH population and parents decreased gradually during the S1 to the S3 stages and rapidly at the S4 stage. At the S4 stage, the chlorophyll content of the DH population under low phosphorus conditions was significantly lower than under normal phosphate conditions. Using a wheat 15K single-nucleotide polymorphism (SNP) panel, a total of 157 QTLs were found to be associated with chlorophyll content in flag leaf and were identified under three phosphorus conditions. The phenotypic variation explained (PVE) ranged from 3.07 to 31.66%. Under three different phosphorus conditions, 36, 30, and 48 QTLs for chlorophyll content were identified, respectively. Six major QTLs Qchl.saw-2B.1, Qchl.saw-3B.1, Qchl.saw-4D.1, Qchl.saw-4D.2, Qchl.saw-5A.9 and Qchl.saw-6A.4 could be detected under multiple phosphorus conditions in which Qchl.saw-4D.1, Qchl.saw-4D.2, and Qchl.saw-6A.4 were revealed to be novel major QTLs. Moreover, the closely linked SNP markers of Qchl.saw-4D.1 and Qchl.saw-4D.2 were validated as KASP markers in a DH population sharing the common parent Jinmai 84, showed extreme significance (P <0.01) in more than three environments under different phosphorus conditions, which has the potential to be utilized in molecular marker-assisted breeding for low phosphorus tolerance in wheat.
Introduction
Wheat (Triticum aestivum L.) is a hexaploid (2n=6x=42) staple food crop, feeding approximately 30% of the world’s population (Mayer et al., 2014), and estimated that wheat production will need to increase by 60% to meet human demands (Langridge, 2013). Thus, increasing the potential yield of wheat is the primary aim of breeders.
Flag leaf is one of the most crucial photosynthetic organs during the grain filling stage in wheat, contributing up to fifty percent of photosynthate to yield formation (Araus and Tapia, 1987). The chlorophyll of flag leaf is the main element to participate in photosynthesis in wheat. Chlorophyll content is significantly and positively correlated with photosynthetic efficiency (Avenson et al., 2005), which directly influences the accumulation of photosynthetic assimilates and yield formation (Jiang et al., 2004). The chlorophyll content is highly susceptible to degradation under abiotic stress conditions such as drought, high temperature, intense light, and nutritional deficiency, resulting in early leaf death and crop yields loss (Benbella and Paulsen, 1998; Fang et al., 2004; Li et al., 2010; Li et al., 2014; Talukder et al., 2014; Li et al., 2015). Under stress conditions, stress-tolerant genotypes usually display higher chlorophyll content and thus maintain stronger photosynthetic efficiency, which helps to delay leaf senescence (Kumar et al., 2012), prolong photosynthetic time (Farooq et al., 2014), and subsequently contribute to the formation of yield (Bogard et al., 2011). Therefore, investigating the molecular genetic mechanism of regulating chlorophyll content in flag leaves is crucial for improving wheat production potential under stressed conditions.
The chlorophyll content is a complex quantitative character regulated by both genotype and environment (Zhang et al., 2009). Mapping and cloning genes controlling chlorophyll are essential for studying the genetic characteristics of this trait (Thomas and Ougham, 2014; Rasheed et al., 2020). With increased research on chlorophyll-related traits in recent years, over 900 QTLs for chlorophyll content have been identified in rice, and at least eight stay-green related genes, including DYE1, SGR, and EF8, have been cloned (Morita et al., 2009; Feng et al., 2014; Yamatani et al., 2018; Yang et al., 2022). Research on the genetic mechanism that regulates chlorophyll in wheat lags behind model crops such as rice (Gupta et al., 2020). Under drought, high temperature, light intensity, and nutrient stress, QTL analysis of chlorophyll content has been performed (Fang et al., 2004; Li et al., 2010; Vijayalakshmi et al., 2010; Christopher et al., 2018; Maulana et al., 2018; Kamal et al., 2019), and hundreds of QTLs were identified on 21 chromosomes of wheat (Kumar et al., 2010; Li et al., 2010; Vijayalakshmi et al., 2010; Zhang et al., 2010; Kumar et al., 2012; Ilyas et al., 2014; Saleh et al., 2014; Barakat et al., 2015; Yang et al., 2016a; Yang et al., 2016b; Shi et al., 2017; Christopher et al., 2018; Puttamadanayaka et al., 2020; Yan et al., 2020; Yang et al., 2022). However, most studies used low-density SSR markers and were only identified in a few years/environments. The QTLs have not been confirmed for many years/environments, and most of them are minor QTLs that are easily affected by the environment, and this makes it challenging to use molecular markers to assist in breeding.
Single nucleotide polymorphism (SNP) mainly refers to DNA sequence polymorphisms caused by single nucleotide changes and small insertions/deletions (Useche et al., 2001; Tang et al., 2006). Compared to SSR markers, SNP markers have high throughput (Collard and Mackill, 2008), high abundance, and relative stability. They have been widely used in high-density genetic linkage map construction, fine mapping, functional marker development, and marker-assisted breeding (Zhang et al., 2013; Qi et al., 2014; Wang et al., 2019a). Several major stay-green QTLs/genes in wheat have been fine-mapped with the SNP array. The gene els1 has been mapped in the WGGB303-WGGB305 marker interval on 2BS, with a genetic distance of 1.5 cM (Li et al., 2018), while the els2 gene mapped to the 2BIP09-2BIP14 marker interval on 2BL, with a genetic distance of 0.95 cM (Wang et al., 2020). Ren et al. (2022) reported that two major stay-green QTLs, QSg.sau-2B.1 and QSg.sau-6A.2, were located on chromosomes 2B and 6A, respectively. However, the number of major and stable QTLs/genes identified in multiple environments remains limited. There is no report on gene map-based cloning that regulation wheat chlorophyll. Thus, Gupta et al. (2020) consider it necessary to apply SNP markers to identify more major QTLs controlling stay-green related traits in multiple environments, and these would establish the foundation for map-based cloning.
The leaf chlorophyll content is strongly connected to phosphorus stress (Ma et al., 2013; Maharajan et al., 2018). Phosphorus is one of the essential nutrients for wheat’s growth, development, and yield production. Phosphorus deficit is one of the most significant abiotic factors affecting wheat yield formation in China and worldwide. QTL analysis for chlorophyll content under phosphorus deficit conditions has been performed in rice, corn, soybean, and other crops (Kanbe et al., 2008; Cai et al., 2012; Li et al., 2016) but not in wheat. Since the genes that control chlorophyll content change during the filling period (Atchley and Zhu, 1997), genetic analysis of chlorophyll content at different filling periods is sure to help find more genetic information (Yang et al., 2016b). Therefore, QTL analysis of chlorophyll content at different filling stages under different phosphorus conditions is necessary to detect more stable and major QTL.
In this study, the DH1 population (Jinmai 47 × Jinmai 84) was used to analyze the QTL of chlorophyll content of flag leaves at different filling stages under normal phosphorus (CK), medium phosphorus (MP), and low phosphorus (LP) conditions, and the DH2 population (Jinmai 919 × Jinmai 84) was used to validate the major QTL. Our goals for this study are 1) to find out how different levels of phosphorus influence the dynamic changes in chlorophyll content in flag leaves at the grain filling stages; 2) to detect the major QTL which regulates chlorophyll content in flag leaves at different stages of grain filling; and 3) to recognize how different levels of phosphorus affect QTLs related to chlorophyll content in order to develop molecular markers for low-phosphorus tolerance-assisted breeding.
Materials and methods
Plant materials and plot design
The DH1 population was constructed by the crossing between Jinmai 47 × Jinmai 84, with a total of 201 lines, in which the female parent Jinmai 47 is a dryland variety, with light green leaves and high-stress resistance, and the male parent Jinmai 84 is a high-yield wetland variety with dark green leaves chosen by Cotton Research Institute of Shanxi Academy of Agricultural Sciences (Figure 1A). Whereas, the DH2 population was constructed by crossing between Jinmai 919 × Jinmai 84, a total of 160 lines, in which Jinmai 919 is a dryland variety approved by the Wheat Research Institute of Shanxi Agricultural University in 2018 with strong drought resistance. The DH1 and DH2 populations were planted in Hongbao Experimental Station, Linfen, China, in 2020-2021, including six experimental sites (normal phosphorus, CK1, and CK2; medium phosphorus, MP1, and MP2; low phosphorus, LP1, and LP2). Urea (CO(NH2)2) 168.75 kg·ha-1 and potassium chloride (KCl) 49.17 kg·ha-1 fertilizers were applied to all six experimental sites. As well as phosphorus pentaoxide (P2O5) 196 kg·ha-1 was also applied to CK1 and CK2, P2O5 84 kg·ha-1 was applied to MP1 and MP2, and LP1 and LP2 without phosphate fertilizer. The data of nutritional analysis of the soil are shown in Table S1. Treatment of DH2 population fertilization was consistent with DH1. The field design for both populations consisted of randomized complete blocks with three replications. Each plot consisted of two 1.5 m rows spaced 0.3 m apart at 21 seeds per row. After sowing, CK2, MP2, and LP2 were irrigated before the overwintering, jointing, and flowering, respectively. Each irrigation amount of 700 m3·hm-2. CK1, MP1, and LP1 relied on natural precipitation during the whole growth period. The precipitation for the wheat growth period in 2020-2021 was around 147 mm, and the precipitation after flowering is shown in Figure S1.
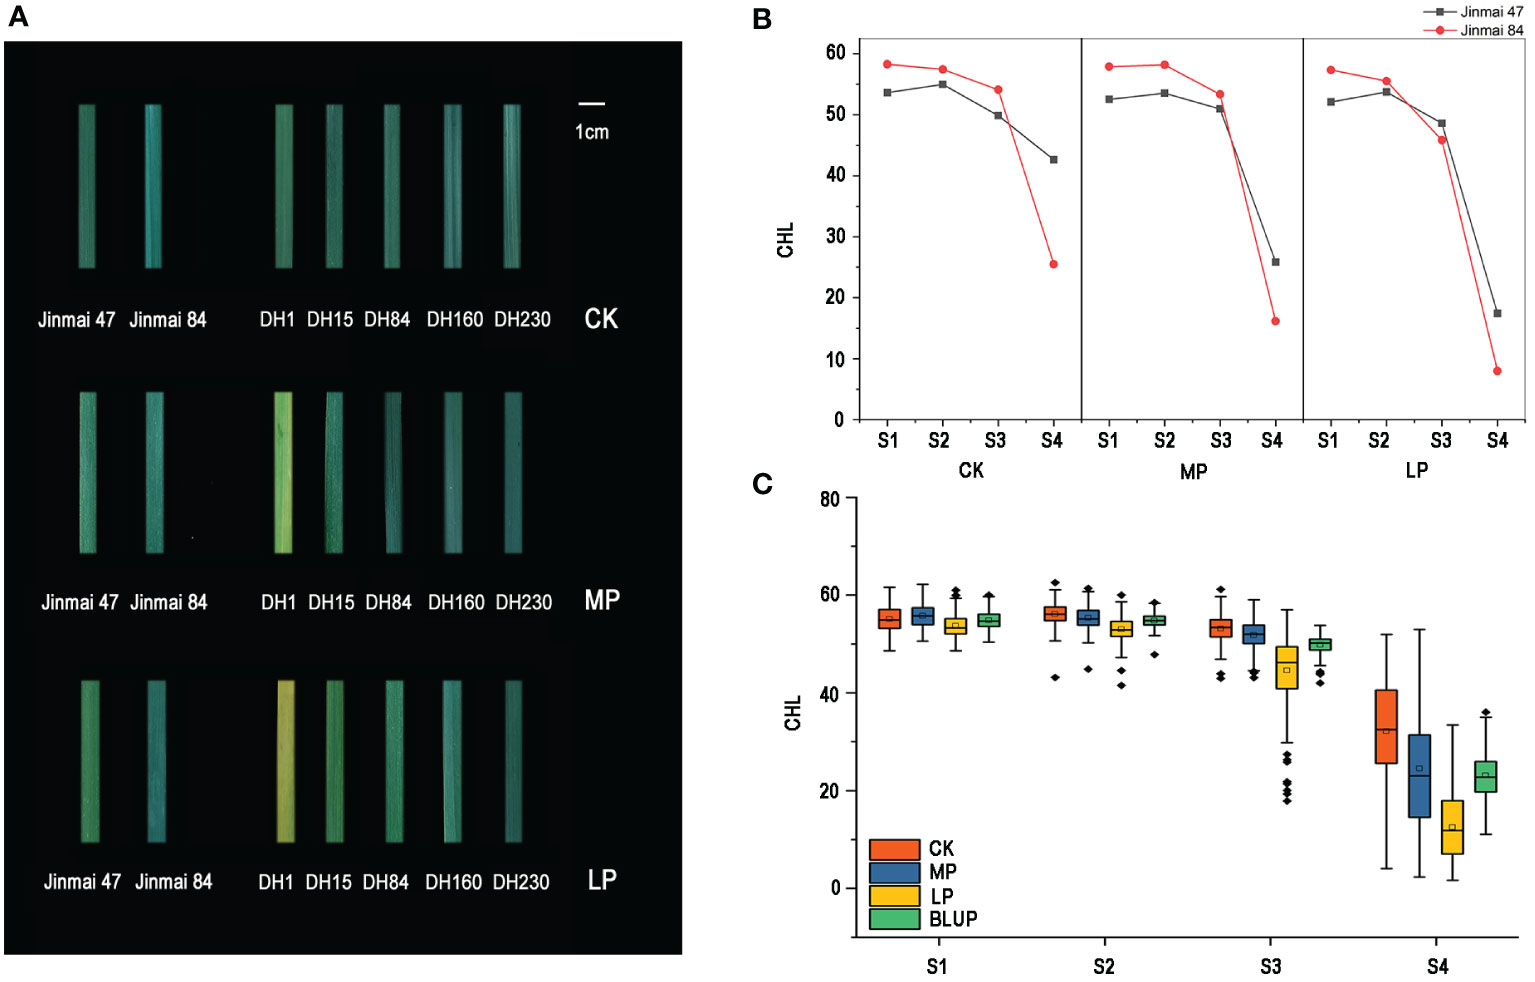
Figure 1 Leaf phenotype of parents and lines of DH1 population (A). Each leaf intercepts an equal area. Changes in chlorophyll content of parents (Jinmai 47 and Jinmai 84) under normal (CK), medium (MP), and low phosphorus (LP) conditions at four stages (B). Box diagram of chlorophyll content change in DH1 populations under three phosphorus conditions at four stages after flowering (C).
Evaluation and measurement of phenotypic traits
Ten plants were randomly selected and marked from the parents and each line of the DH1 population at the flowering stage based on similar flowering, development, and growth. The chlorophyll content of flag leaf was measured by SPAD-502 Plus chlorophyll meter (Konica-Minolta, Japan) from 7:00 to 10:00 hours at 7 days (S1), 14 days (S2), 21 days (S3), and 28 days (S4) after flowering (Yang et al., 2016a). Each flag leaf was measured three times at the base, middle, and tip, of leaves, and the average value was used for analysis. The determination method for DH2 population was the same as that for DH1 population, and the chlorophyll content of flag leaves was only measured at ten days after anthesis.
Data analysis
The analysis of variance (ANOVA), correlation analysis, and the Student’s t-test (P <0.05) of measured phenotype values in different environments were performed by SPSS 21.0 software (SPSS, Chicago, IL, USA; http://www.spss.com) (Yang et al., 2022). SAS (SAS Institute, Cary, NC, USA; https://www.sas.com) was used for calculating the best linear unbiased prediction (BLUP) and broad sense heritability (H2) for chlorophyll content of flag leaves in different environments (Smith et al., 1998). The low phosphorus tolerance coefficient (LPTC) is calculated according to the method of Zhang et al. (2011). The LPTC was calculated as MP (LP)/CK, where MP (LP) was the chlorophyll content measured under medium phosphorus (low phosphorus) conditions, and CK was the value obtained under normal phosphorus environments.
Construction of genetic linkage map and QTL mapping
DNA was extracted from all DH lines and respective parents using the CTAB method (Vijayalakshmi et al., 2010). The DH1 population was genotyped with a 15K SNP panel (Qiao et al., 2022), which yielded 14,868 SNPs and used in the linkage analysis via QTL IciMapping 4.1 (Meng et al., 2015) and visualized with JoinMap 4.0. The QTL was detected using WinQTLCart version 2.5 (https://brcwebportal.cos.ncsu.edu/qtlcart/WQTLCart.htm) based on the composite interval mapping method. QTLs were claimed to be significantly above the 2.5 logarithms of odds (LOD) threshold. The QTL contributing more than 10% to phenotypic variation in a certain environment (including BLUP) and detected in three environments (including BLUP) was considered a stable and major QTL. QTLs less than 1 cM apart or sharing common flanking markers were treated as a single locus and named according to McCouch et al. (1997).
Development of markers and validation of major QTLs
To develop kompetitive allele specific PCR (KASP) markers from peak marker of the major QTLs, two SNP specific primers (F1/F2) and one common primer (R) were designed for each KASP marker. The F1 tail added specific sequences that could bind to FAM fluorescence, and the F2 tail added specific sequences that could bind to HEX fluorescence. KASP primers were designed by Polymarker (http://www.polymarker.info/) and synthesized by Beijing Jiacheng Biotechnology Co., Ltd (Table S2). The developed KASP markers were used in DH2 population for validation. Following genotyping, the validation population was divided into two groups, and t-tests assessed differences in chlorophyll content of flag leaves between groups in SAS V8.0 (Yang et al., 2022).
Identification of candidate genes
The genes in the target region of QTL were identified by using the JBrowse platform of the Triticeae Multi-omics website (http://wheatomics.sdau.edu.cn). The GO (Gene ontology) database was used for functional annotation and enrichment analysis of genes in these regions based on the BioMart-Martview database (http://plants.ensembl.org/biomart/martview/), and genes associated with chlorophyll and phosphorus were selected. The expression of related genes was obtained using the expVIP website (http://www.wheat-expression.com/). The differential expression genes related to phosphorus stress were further analyzed.
Results
Phenotypic variations and correlations of chlorophyll content under different phosphorus conditions
The chlorophyll content of flag leaves of DH1 population and their parents at the S1, S2, S3, and S4 stages under three phosphorus conditions are shown in Table 1, which were decreased gradually during the S1 to S3 and rapidly at the S4 (Figures 1B, C). The ANOVA revealed that the difference in chlorophyll content between parents in most stages/environments was statistically (P <0.05) and highly significant (P <0.01). At the S1 and S2 stages, the male parent Jinmai 84 had more chlorophyll content than the female parent Jinmai 47 under all phosphorus conditions, whereas, at the S3 stage, the chlorophyll content of Jinmai 84 was higher than Jinmai 47 under CK and MP conditions but lower under LP conditions. As well as, at the S4 stage, the chlorophyll content of Jinmai 47 was higher than Jinmai 84 under three different phosphorus conditions, indicating that Jinmai 47 was much more tolerant to low phosphorus stress than Jinmai 84 at the final grain filling stage. During the S1 to S4, the chlorophyll content of parents under CK and MP conditions was higher than that under LP conditions, with the most significant difference occurring at S4. During the S1 to S3, there was no significant difference in chlorophyll content under CK and MP conditions; however, in S4, CK conditions had significantly higher chlorophyll content than MP conditions. The changing regulation of chlorophyll content of the DH population at different stages was similar to that of parents under three phosphorus circumstances (Figure 1C).
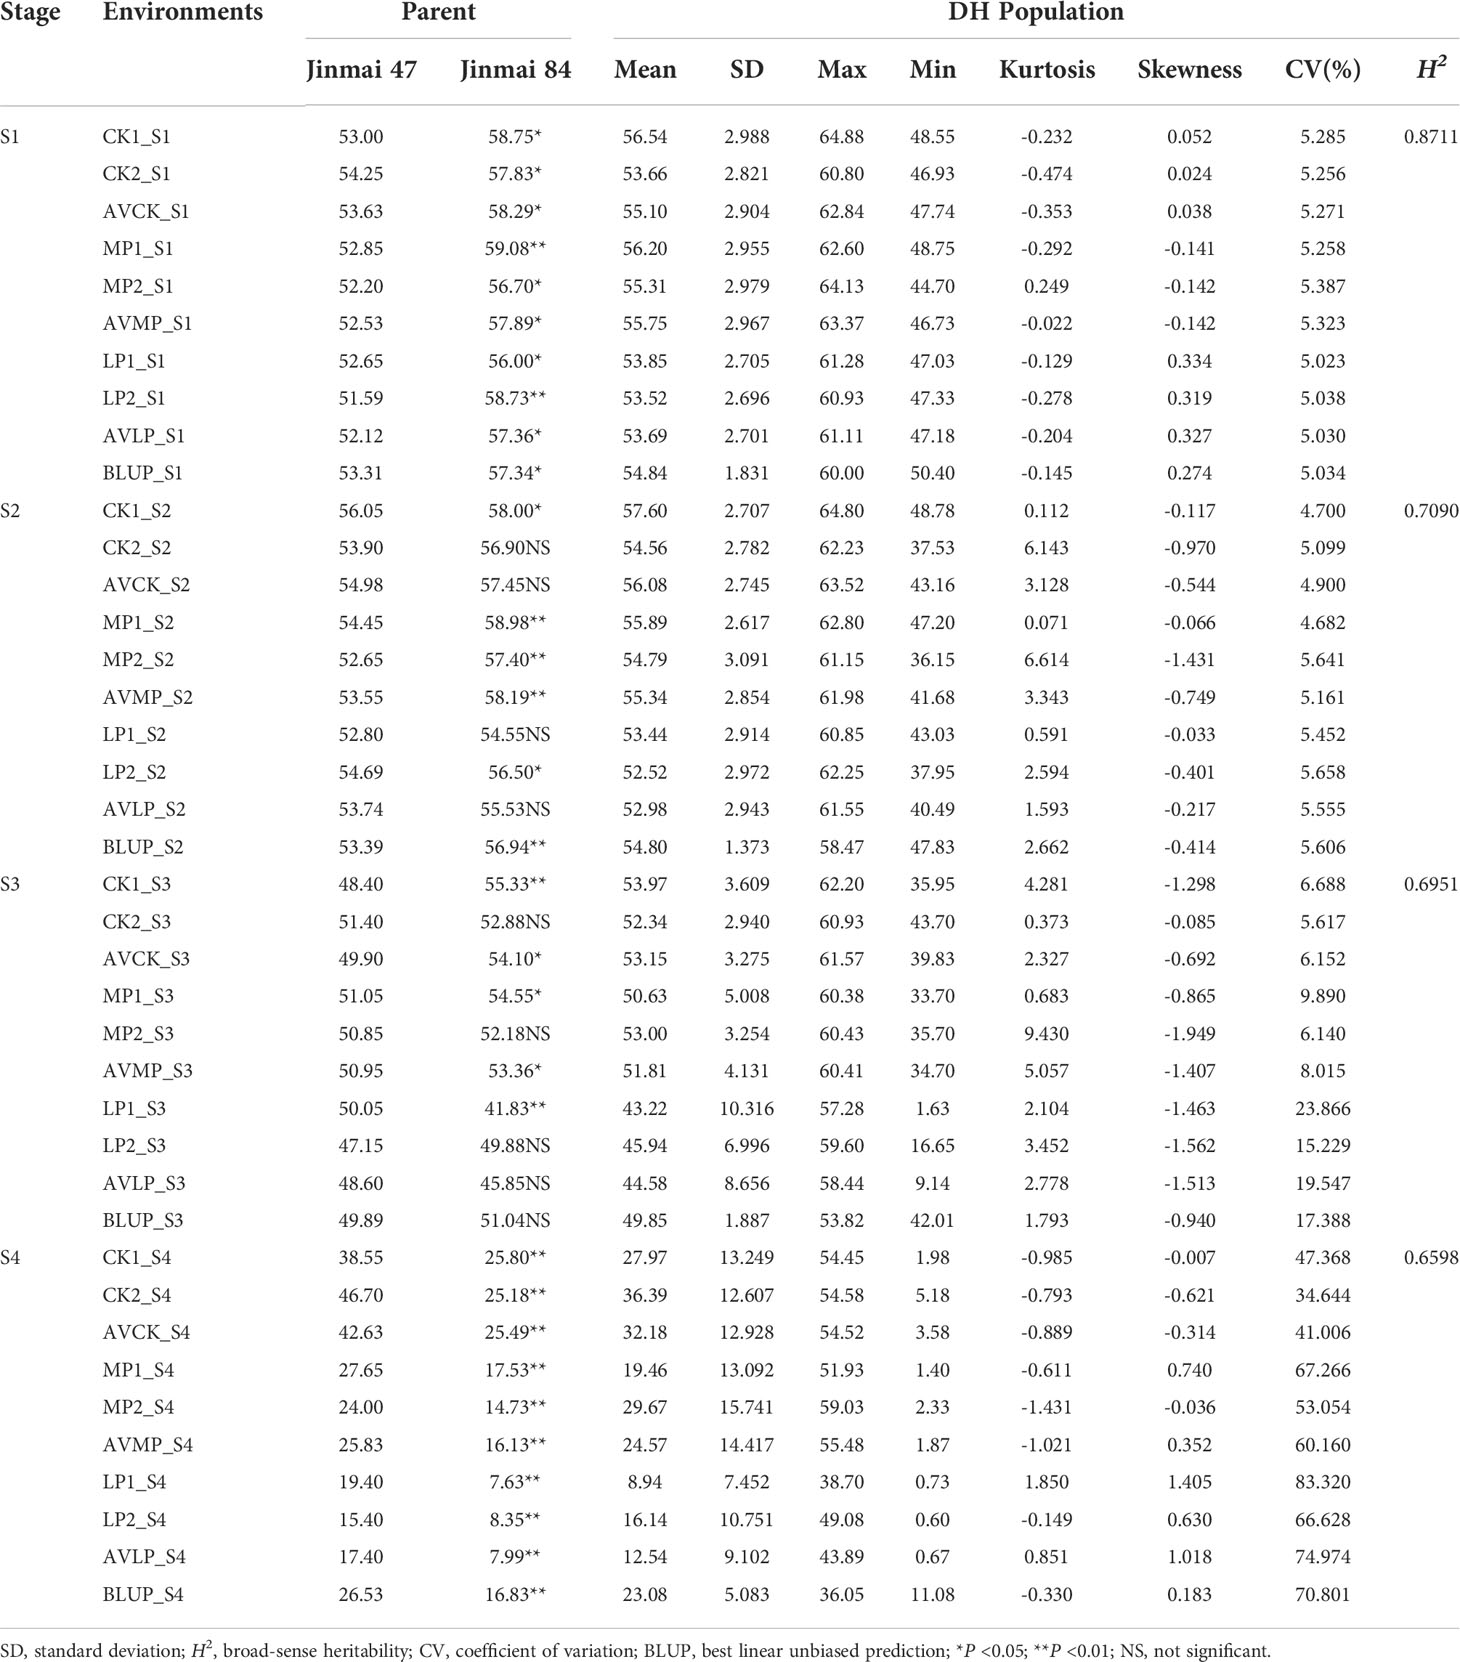
Table 1 The chlorophyll content of flag leaves in parents and DH population derived from Jinmai 47 × Jinmai 84 at four stages under three phosphorus conditions.
The heritability of chlorophyll content decreased from 0.8711 to 0.6598 during the S1 to S4, but remained higher than 0.5 (Table 1), indicating that genetic factors determined chlorophyll content primarily; as development proceeded, external factors imposed a stronger influence on the phenotypic value. In contrast, the coefficient of variation of chlorophyll content increased from 5.02 to 70.80% (Table 1). But, there was no significant difference in the coefficient of variation (CV) of chlorophyll content between the three phosphorus conditions at the S1 and S2 stages. The variance coefficient of chlorophyll content under LP conditions at the S4 was significantly greater than under CK and MP conditions, indicating that low phosphorus stress enhanced the phenotypic variation of chlorophyll content during the middle and later stages of grain filling.
The correlation coefficient analysis of chlorophyll content at different stages through BLUP value showed a highly significant (P <0.01) and positive correlation between each stage within the range of 0.188 and 0.799, except between the S1 and S4 stage. In which, S1 and S2 showed the most highly significant and positive correlation (0.799**), but the S1 and S4 recorded the negative and non-significant relationship (-0.039) (Table 2; Figure 2A). Under three phosphorus treatments (CK, MP, and LP), the correlation coefficient of chlorophyll content at each stage showed a decreasing trend with the development process (Tables S3–S5).
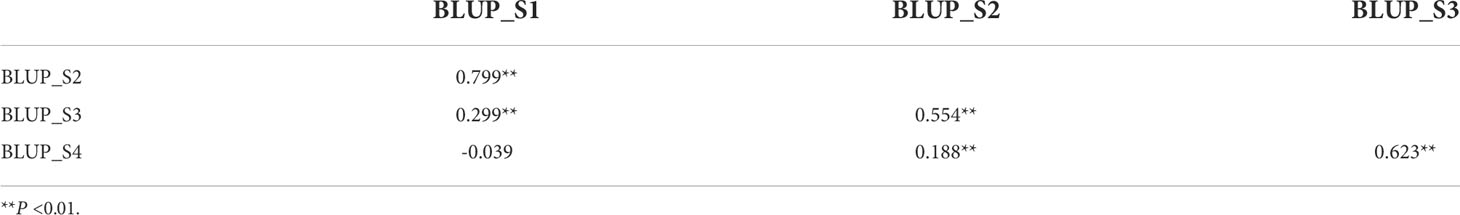
Table 2 Correlation coefficients of chlorophyll content between four stages of BLUP data.
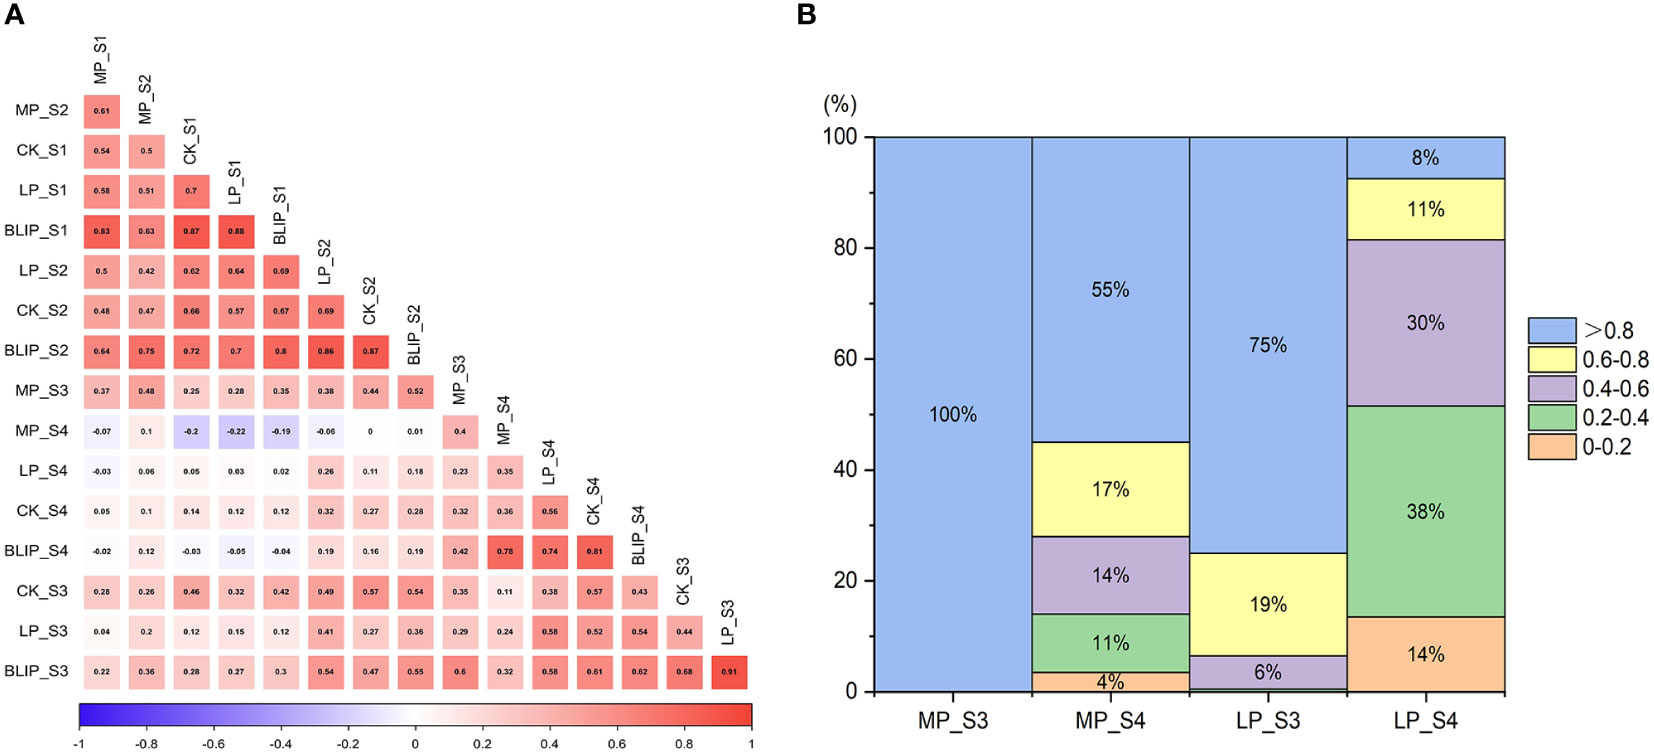
Figure 2 Correlation coefficients of chlorophyll content at four periods under normal, medium, and low phosphorus conditions (A). The LPTC of the S3 and S4 stages under medium and low phosphorus conditions (B).
Analysis of low phosphorus tolerance coefficient
The higher the value of LPTC, the less phosphorus stress affected the chlorophyll content of flag leaves. At the stage of S3 and S4, with a large variety of chlorophyll content, the LPTC of the DH population was investigated (Figure 2B). With development, number of lines with LPTC > 0.8 decreased gradually under MP and LP conditions, and number of lines with LPTC > 0.8 under LP conditions was smaller than MP at the same stage. At S4 stage, 8% of the genotypes exhibited higher LPTC, whereas 14% had lower LPTC under LP conditions, showing variations in phosphorus stress tolerance among DH lines. So, it is necessary to conduct further genetic analysis.
Construction of genetic linkage map
A genetic linkage map of the DH1 population was constructed by using the Wheat15k SNP panel. The total length of the map was 3,316.06 cM with an average genetic distance of 2.42 cM, including 1,373 SNP markers and across all 21 chromosomes (Table 3). The numbers of SNP markers in the A, B, and D genomes were 538, 657, and 178, respectively, and lengths of the linkage were 1,523.80 cM, 1,289.30 cM, and 502.96 cM, with an average distance between markers of 2.83 cM, 1.96 cM, and 2.83 cM, respectively (Table 3).
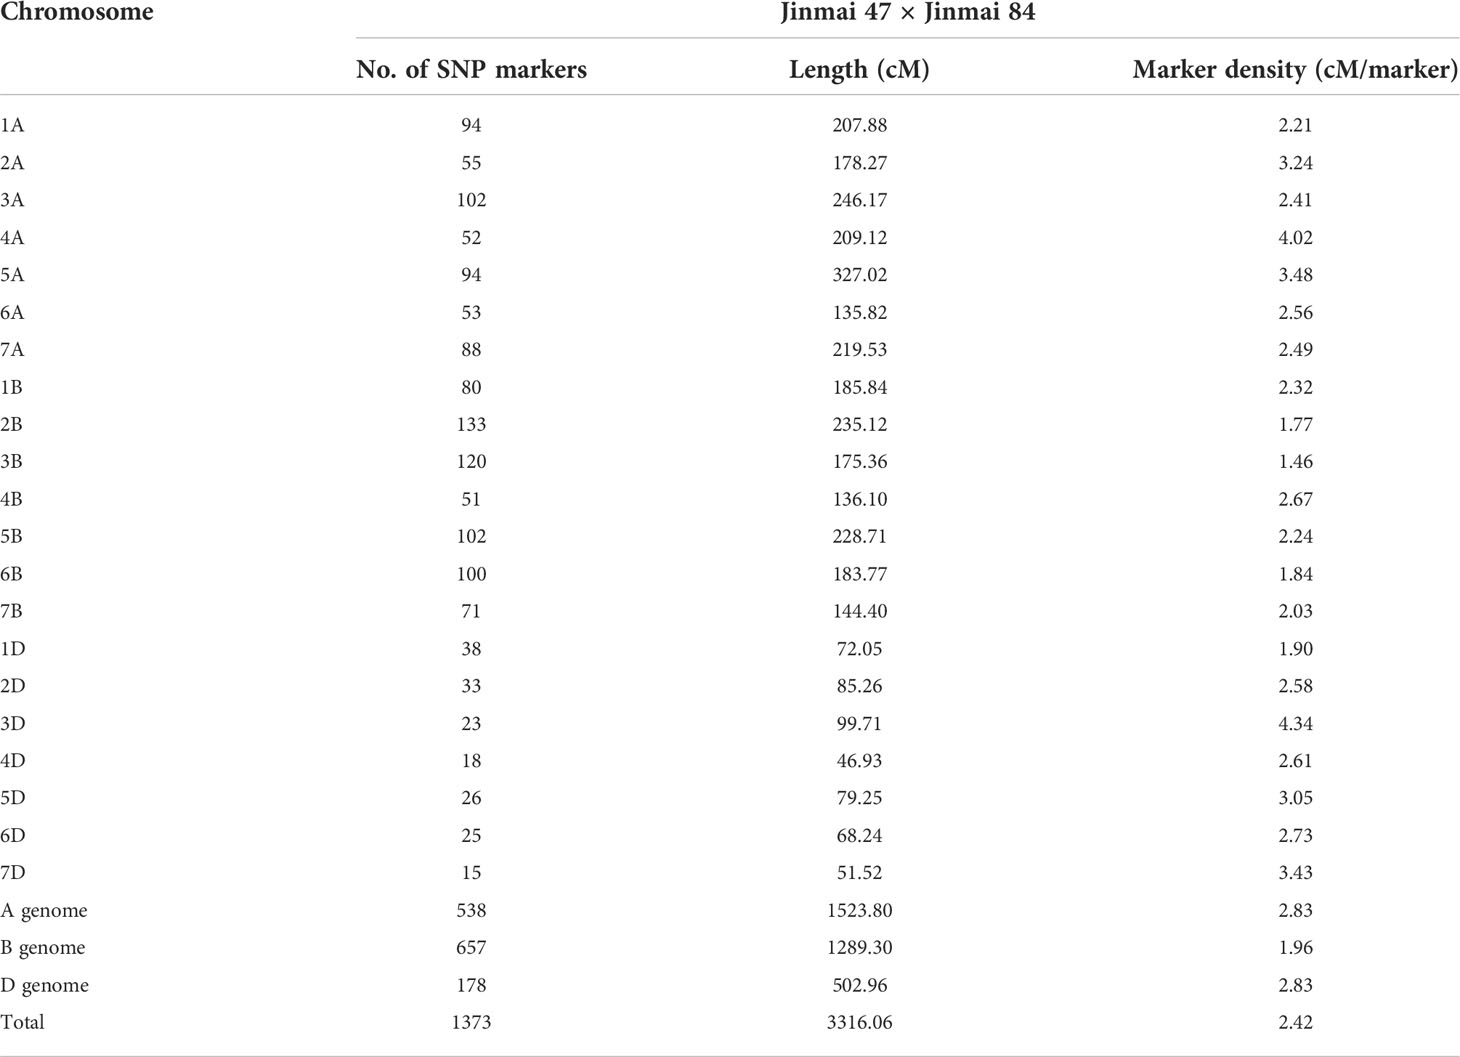
Table 3 Summary of linkage group and marker statistics obtained from a 15K SNP panel analysis of the DH1 population (Jinmai 47 × Jinmai 84).
QTL mapping for chlorophyll content at four stages under different phosphorus conditions
A total of 157 QTLs were associated with the chlorophyll content of flag leaves under different phosphorus conditions (Table S6), and they were distributed across all chromosomes except for 1A, 1B, 3D, 5B, 6D, and 7D. These QTLs explained accounting for 3.07 to 31.66% of PVE with the LOD value ranging from 2.52-18.42. Among them, favorable alleles of 62 QTLs were derived from the female parent Jinmai 47, and favorable alleles of 95 QTLs were derived from the male parent Jinmai 84 (Table S6). No QTLs could be expressed consistently in all four stages.
At the S1 stage, a total of 68 QTLs (including BLUP) were detected associated with chlorophyll content, in which 10, 12, and 24 QTLs were identified under CK, MP, and LP conditions, respectively (Table S6). The major QTL Qchl.saw-2B.1 located on chromosome 2B, was detected in four environments (CK1, CK2, MP2, and BLUP), whereas, another major QTL Qchl.saw-3B.1 positioned on chromosome 3B was detected in three environments (MP2, LP1, and BLUP). As well as, two major QTLs (Qchl.saw-4D.1 and Qchl.saw-4D.2) located on chromosome 4D could be detected under different phosphorus conditions, explaining 3.07-27.31% and 7.36-31.66% of PVE, respectively (Table 4).
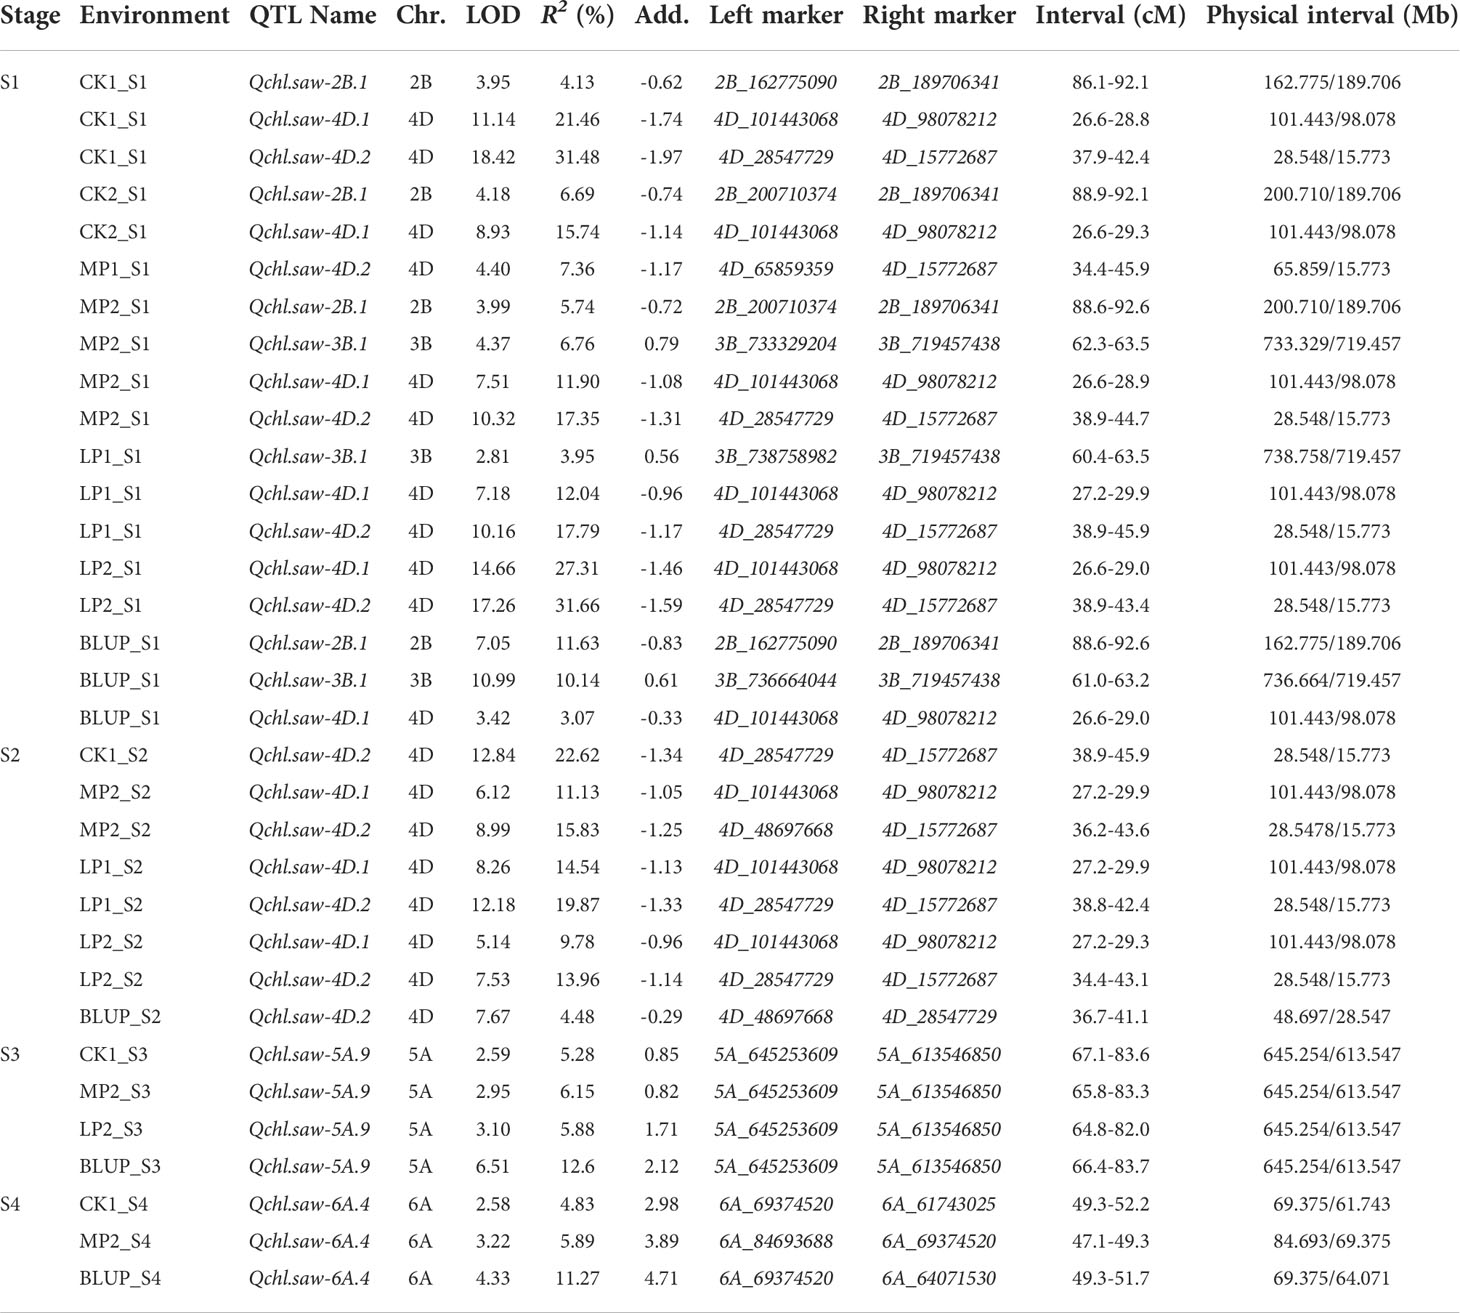
Table 4 Major QTLs for chlorophyll content at four stages under three phosphorus environments.
At the stage of S2, 43 QTLs (including BLUP) with chlorophyll content were detected, of which 14, 6, and 13 QTLs were detected under CK, MP, and LP conditions, respectively (Table S6). None of the QTL was detected that could be expressed under the three phosphorus conditions. Major QTL Qchl.saw-4D.1 and Qchl.saw-4D.2 could be detected under MP and LP conditions, exhibiting 14.54% and 19.87% of PVE, respectively (Table 4).
At the S3, in total 19 QTLs were detected, and Qchl.saw-5A.9 was detected as major due to identified in four environments, accounting for 5.30 to 12.60% of the PVE. At the S4, a total of 27 QTLs of chlorophyll content were detected, of which Qchl.saw-6A.4 was detected in three environments, with up to 11.27% of PVE (Tables 4; S6).
Additive effects of the six major QTLs on chlorophyll content
At S1, four major QTLs (Qchl.saw-2B.1, Qchl.saw-3B.1, Qchl.saw-4D.1, and Qchl.saw-4D.2) were detected (Table 4), and their additive effects for chlorophyll content (BLUP) were determined by using their linkage markers, which revealed that the more favorable alleles for polymerization, and higher the chlorophyll content (Figure 3A). The chlorophyll content of DH lines with 4, 3, 2, and 1 favorable allele increased by 8.45%, 6.41%, 3.52%, and 1.87% compared to those without four favorable alleles (P <0.05) (Table S7). The chlorophyll content of lines with only Qchl.saw-4D.1 allele was higher than that of other lines with only one favorable allele, implying that Qchl.saw-4D.1 had the strongest genetic effect on chlorophyll content (Table S7; Figure 3B). In addition, Qchl.saw-4D.1 (S2) and Qchl.saw-4D.2 (S2), Qchl.saw-5A.9 (S3) and Qchl.saw-6A.4 (S4) had strongly influenced chlorophyll content in more than three environments at different stages (Figure S2).
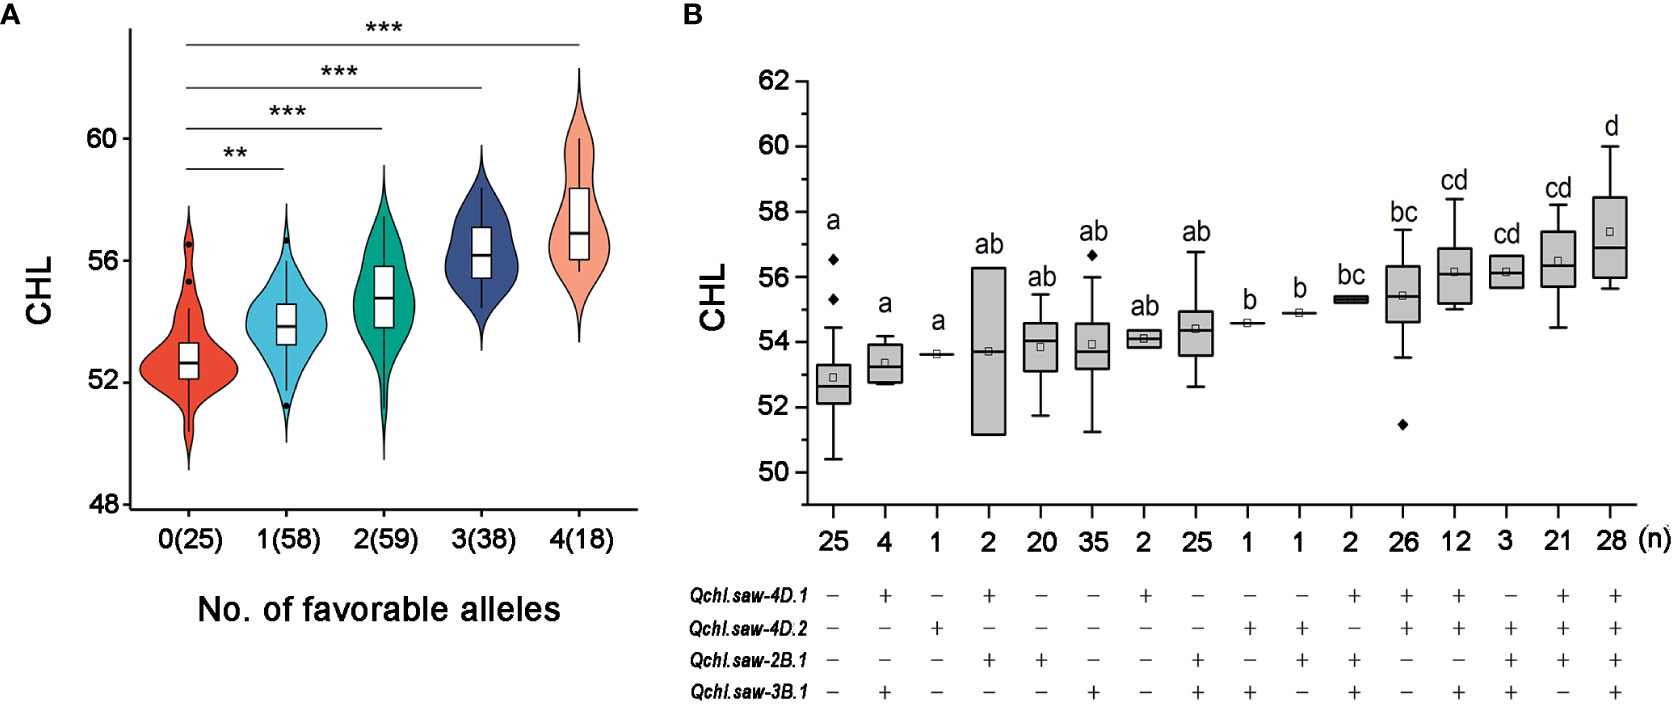
Figure 3 Relationship of numbers of favorable alleles and chlorophyll content in the DH1 population (A). Linear regressions between phenotypes and additive effects of the major QTLs for chlorophyll content in the DH1 population (B). ** and *** represent significance at P <0.01 and P <0.001, respectively. The letter above the bars indicated comparisons result at the significant level of 0.05 and respectively.
Validation of the major and stable QTLs Qchl.saw-4D.1 and Qchl.saw-4D.2
Six major QTLs Qchl.saw-2B.1, Qchl.saw-3B.1, Qchl.saw-4D.1, Qchl.saw-4D.2, Qchl.saw-5A.9 and Qchl.saw-6A.4 were detected under multiple environments (Table 4). The favorable alleles of Qchl.saw-3B.1, Qchl.saw-5A.9, and Qchl.saw-6A.4 were derived from the female parent Jinmai 47, whereas the favorable alleles of Qchl.saw-2B.1, Qchl.saw-4D.1, and Qchl.saw-4D.2 were derived from the male parent Jinmai 84. To further validate the Qchl.saw-2B.1, Qchl.saw-4D.1, and Qchl.saw-4D.2 in DH2 population, peak markers for each QTL were employed to evaluate their effects on chlorophyll content. The peak marker for Qchl.saw-2B.1 was not polymorphic between the Jinmai 919 and Jinmai 84, and thus the effects could not be evaluated. The remaining two QTLs (Qchl.saw-4D.1 and Qchl.saw-4D.2) were validated in the DH2 population (Figure 4). The effect of Qchl.saw-4D.1 for chlorophyll content was significant (P <0.05) under MP2 and highly significant (P <0.01) under CK2, MP1, LP1, LP2, and BLUP conditions. The effect of Qchl.saw-4D.2 was highly significant (P <0.01) under CK2, MP1, LP2, and BLUP conditions.
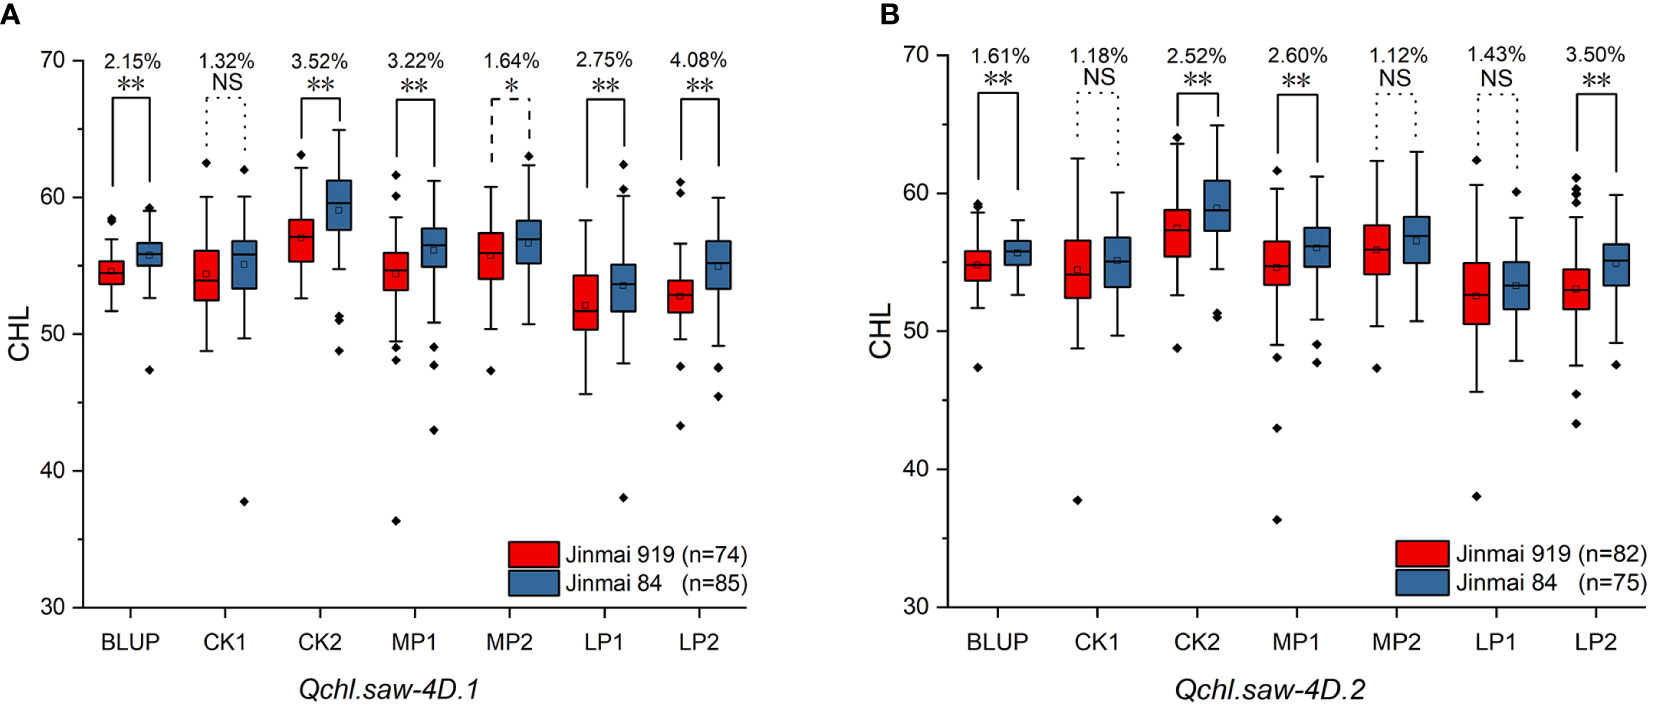
Figure 4 Validation of Qchl.saw-4D.1 (A), and Qchl.saw-4D.2 (B) in DH2 (Jinmai 919 × Jinmai 84) population under different environments. ** Significant at P <0.01; * Significant at P <0.05; NS, not significant.
Predictive analysis of candidate genes of major QTLs Qchl.saw-2B.1, Qchl.saw-3B.1, Qchl.saw-4D.1, Qchl.saw-4D.2, Qchl.saw-5A.9 and Qchl.saw-6A.4
The genomic functional annotation was performed between marker intervals of six major QTLs Qchl.saw-2B.1 (162.77-189.70 Mb), Qchl.saw-3B.1 (719.45-736.66 Mb), Qchl.saw-4D.1 (98.07-101.44 Mb), Qchl.saw-4D.2 (15.77-28.54 Mb), Qchl.saw-5A.9 (613.54-645.25 Mb) and Qchl.saw-6A.4 (61.74-69.37 Mb), and a total of 235 genes were identified to be associated with phosphorus and chlorophyll function enriched (Table S8; Figure S3). The expression patterns of these genes in leaves were analyzed by the expVIP platform, and the number of highly expressed genes in the above QTLs interval was 5, 4, 1, 5, 6, and 3, respectively, including 11 genes related to chlorophyll and photosynthesis and 13 genes associated with phosphorus (Table 5; Figure 5A).

Table 5 Function genes related to chlorophyll and phosphorus, which highly expressed in leaves.
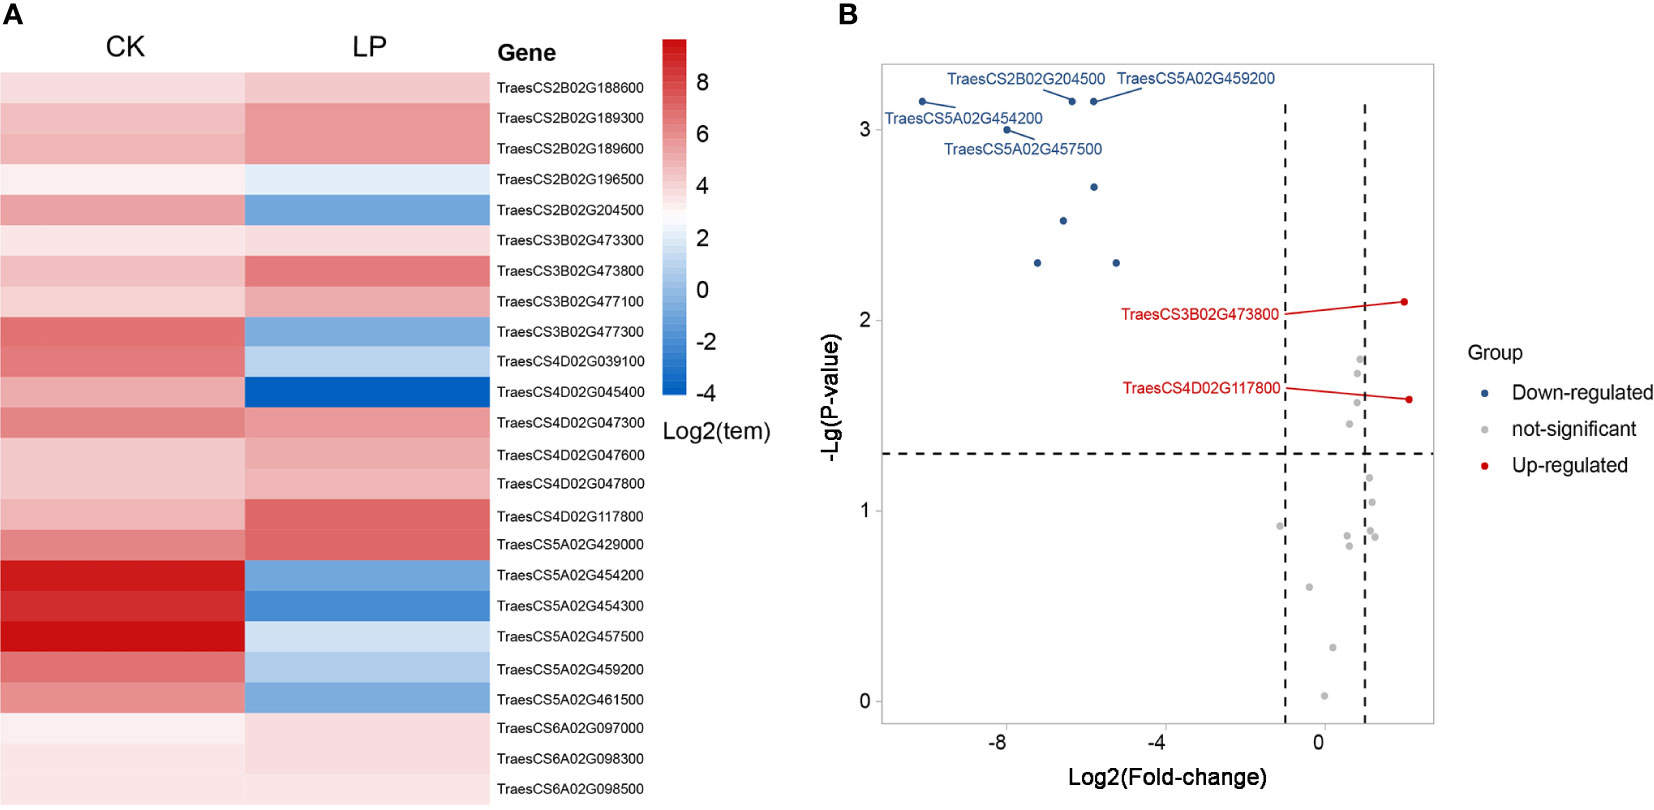
Figure 5 Differential expression heat map of chlorophyll genes screened under different phosphorus stress conditions (A). Volcano plot of differentially expressed genes under phosphorus stress conditions (B). Red indicates up-regulated genes, and blue indicates down-regulated genes.
Genes related to chlorophyll and photosynthesis regulate the structural composition of chloroplast, chloroplast stroma, thylakoid membrane, and a series of processes of photosynthesis, as well as the formation of photosystem II oxygen evolution complex to affect photosynthesis. Phosphorus-related genes with high levels of expression respond to phosphorus stress by regulating ATP, GTP, and NAD+ binding. The ATP synthesis is coupled with proton transport and protein phosphorylation, carbohydrate metabolism, biosynthesis, pyridoxal phosphate binding, lipid metabolism, and nucleic acid binding. The differential expression of 24 genes under normal and low phosphorus conditions, which was established by the expVIP platform in order to screen the genes controlling chlorophyll content under phosphorus stress more accurately. Two genes were up-regulated, and four were down-regulated in response to low phosphorus conditions (Figure 5B). The gene TraesCS3B02G473800 belongs to the QTL Qchl.saw-3B.1 and which is homologous to the TRA2 gene of Arabidopsis thaliana and regulates pentose-phosphate shunt, chloroplast stroma, and carbohydrate metabolic process by up-regulating expression, it has a similar function in Arabidopsis chloroplast (Peltier et al., 2006), whereas gene TraesCS4D02G117800 in the major QTL Qchl.saw-4D.1 interval responds to low phosphorus stress by up-regulating phospholipid metabolism. However, its homologous gene Os11g0112800 in rice shows high expression in the process of controlling flower buds and rooting after anthesis (Kikuchi et al., 2003). The down-regulated expression of gene TraesCS2B02G204500 decreased the oxidoreductase activity and thus decreased the transformation of NAD or NADP were deceived in Qchl.saw-2B.1. Previous studies have found that the homologous gene Os07g0601100 in rice was regulated the process of anthocyanin reduction, and has high expressed in rice leaves after anthesis, which echoes the chlorophyll-related QTL were located after anthesis in wheat (Kikuchi et al., 2003). While Qchl.saw-5A.9 interval’s genes TraesCS5A02G454200, TraesCS5A02G457500, and TraesCS5A02G459200 decreased chlorophyll content and photosynthesis by down-regulating the synthesis of chloroplast matrix and chloroplast thylakoid membrane in wheat, in which the gene TraesCS5A02G459200 is homologous of RbcX2 regulating the synthesis of chloroplast matrix in Arabidopsis thaliana and Os03g0807900 regulating chloroplast synthesis in rice. We are gratified that these homologous genes show the same function in different crops (Kikuchi et al., 2003; Kolesinski et al., 2011).
Discussion
Effect of low phosphorus stress on the dynamic change of chlorophyll content
There is no statistically significant change in chlorophyll content between DH populations under three phosphorus conditions during the S1 and S2 stages (Table 1). Because phosphorus is a reusable element, and up to 75% of the phosphorus in leaves is in the form of orthophosphate, of which 85% is present in vacuoles, which act as a buffer for phosphorus storage (Richardson et al., 2011; Van de Wiel et al., 2016). When phosphorus deficiency occurs at the early filling stage, phosphorus in the vacuole is allocated preferentially to mesophyll cells to ensure the synthesis of photosynthetic proteins (Conn and Gilliham, 2010; Hayes et al., 2018), the stability of chloroplasts and chlorophyll, and thus the maintenance of high photosynthetic efficiency (Veneklaas et al., 2012). At the middle and later stages of grain filling, the photosynthetic organ will transport phosphorus to the grain more rapidly. When phosphorus supply is adequate, 65% of phosphorus in photosynthetic organs will be transported to grains, whereas under conditions of phosphorus deficiency, 85% of phosphorus in photosynthetic organs will be transferred to grains (El Mazlouzi et al., 2020). The greater the degree of phosphorus deficiency, the more serious the senescence of photosynthetic organs. Therefore, the chlorophyll content of flag leaves of the DH population at the S3 and the S4 stages under LP conditions was significantly lower than under CK conditions. At the last stage of grain filling, phosphorus deficiency not only reduces the chlorophyll content and photosynthetic area of wheat (Khourchi et al., 2022; Nguyen et al., 2022) but also influences the photosynthetic efficiency (Nguyen et al., 2022), resulting in a decrease in the number of ATP (Lin et al., 2009), decreasing the synthesis of RuBP, limiting the fixation of CO2 (Bown et al., 2009), and seriously affecting yield formation (McDonald et al., 2015).
QTL expression characteristics of chlorophyll content at different stages under different phosphorus conditions
QTL analysis was performed on the chlorophyll content of flag leaves at different filling stages under normal, medium, and low phosphorus conditions using the DH population derived from Jinmai 47 and Jinmai 84. A total of 68, 43, 19, and 27 QTLs for chlorophyll content were detected at the S1, S2, S3, and S4 stages, respectively (Table S6), indicating that the genes controlling chlorophyll content were expressed most at the early filling stage, and gradually decreased as development progressed, which was consistent with the phenotypic change tendency of chlorophyll content.
The majority of the chlorophyll content QTLs detected at various stages were different, and no QTLs could be expressed throughout the filling stage. The QTL viz. Qchl.saw-2B.1 (S1 and S2), Qchl.saw-3B.1 (S1 and S3), Qchl.saw-4A.5 (S2 and S3), Qchl.saw-4D.1 (S1 and S2), and Qchl.saw-4D.2 (S1 and S2) could be detected at two different stages (Table S6). Yang et al. (2016b) reported a similar phenomenon in the QTL analysis of chlorophyll content at different filling stages, indicating that the expression of genes controlling chlorophyll content displayed certain both temporal and spatial characteristics, i.e., the majority of genes were only expressed temporarily in one or more developmental stages (Zhang et al., 2011). In other words, detecting the QTL of chlorophyll content in flag leaves at multiple filling stages helps to identify more major QTLs.
This study identified 36, 30, and 48 chlorophyll-containing QTLs under CK, MP, and LP conditions, respectively (Table S6). The number of QTLs detected under LP conditions was much larger than under CK conditions, implying that low phosphorus stresses may induce the expression of genes silenced under normal phosphorus conditions. Similarly, previous research has been reported (Su et al., 2009; Vijayalakshmi et al., 2010; Yang et al., 2016b). The majority of chlorophyll content QTLs detected under CK, MP, and LP conditions are different, indicating that the chlorophyll regulation mechanism under low phosphorus conditions may differ from that under normal phosphorus conditions, and similar phenomena have been observed in previous research (Yang et al., 2018; Yuan et al., 2020; Yang et al., 2021). Under multiple phosphorus conditions, six major QTLs Qchl.saw-2B.1, Qchl.saw-3B.1, Qchl.saw-4D.1, Qchl.saw-4D.2, Qchl.saw-5A.9 and Qchl.saw-6A.4 were detected (Table 4). Hassan et al. (2018) hypothesized that the major QTLs identified under stress conditions may contain stress-resistant functional genes that enhance yield potential. Wang et al. (2019b) also suggested that mapping QTL in phosphorus stress environments and identifying the major QTLs that are less influenced by environmental conditions is very important for low phosphorus tolerance breeding. Under the LP conditions, both major QTLs Qchl.saw-4D.1 and Qchl.saw-4D.2 could be detected, and their contribution to phenotype was more than 20%. It has the potential to be utilized in molecular marker-assisted breeding of wheat for low phosphorus tolerance.
Comparison with the results of previous studies
Chlorophyll synthesis and degradation is a complex biological process, and external and internal factors easily influence the regulation of chlorophyll gene expression. Before being applied to MAS breeding, six major QTLs detected under different phosphorus conditions should be validated in populations with different genetic backgrounds to confirm that they are not affected by the genetic background and are closely connected to the target traits (Ahmed et al., 2021). A total of 6, 17, 1, 14, and 9 QTLs for chlorophyll content were located on chromosomes 2B, 3B, 4D, 5A, and 6A, respectively, in previous studies (Table 6). The Qchl.saw-2B.1 was located between 162.77 Mb to 189.70 Mb on chromosome 2B. In the same interval, a chlorophyll content QTL qChlN-2B with an 8.3% phenotypic contribution rate was identified (Li et al., 2010), and a major QTL IWB29808 for 1000-grain weight was identified (Zhang et al., 2018). The Qchl.saw-3B.1 was identified on chromosome 3B between 719.45 Mb and 739.66 Mb, and a flag leaf chlorophyll content QTL, Qspad.acs-3B.2, was detected in the same location (Yang et al., 2016b). The Qchl.saw-5A.9 was identified between 613.54 Mb and 645.25 Mb on chromosome 5A. In the same interval, a major QTL for chlorophyll content in flag leaves, Qchl.saw-5A.3 (Yang et al., 2022), and three QTL for 1000-grain weight, QTKW.ndsu.5A.2 (Kumar et al., 2016), TKW1-IWB686 (Sukumaran et al., 2015), and TKW-IWB789 (Zhang et al., 2018) were detected, and a nitrogen efficiency gene TaNAC2-5A was cloned (He et al., 2015). The Qchl.saw-6A.4 was identified in the interval of 61.74 Mb to 69.37 Mb on chromosome 6A. However, no chlorophyll content QTLs were detected in this location previously, indicating that Qchl.saw-6A.4 is a novel major QTL of chlorophyll content, and a major QTL QTkw-6A.1 for 1000-grain weight was detected by Cui et al. (2014) in the same interval.
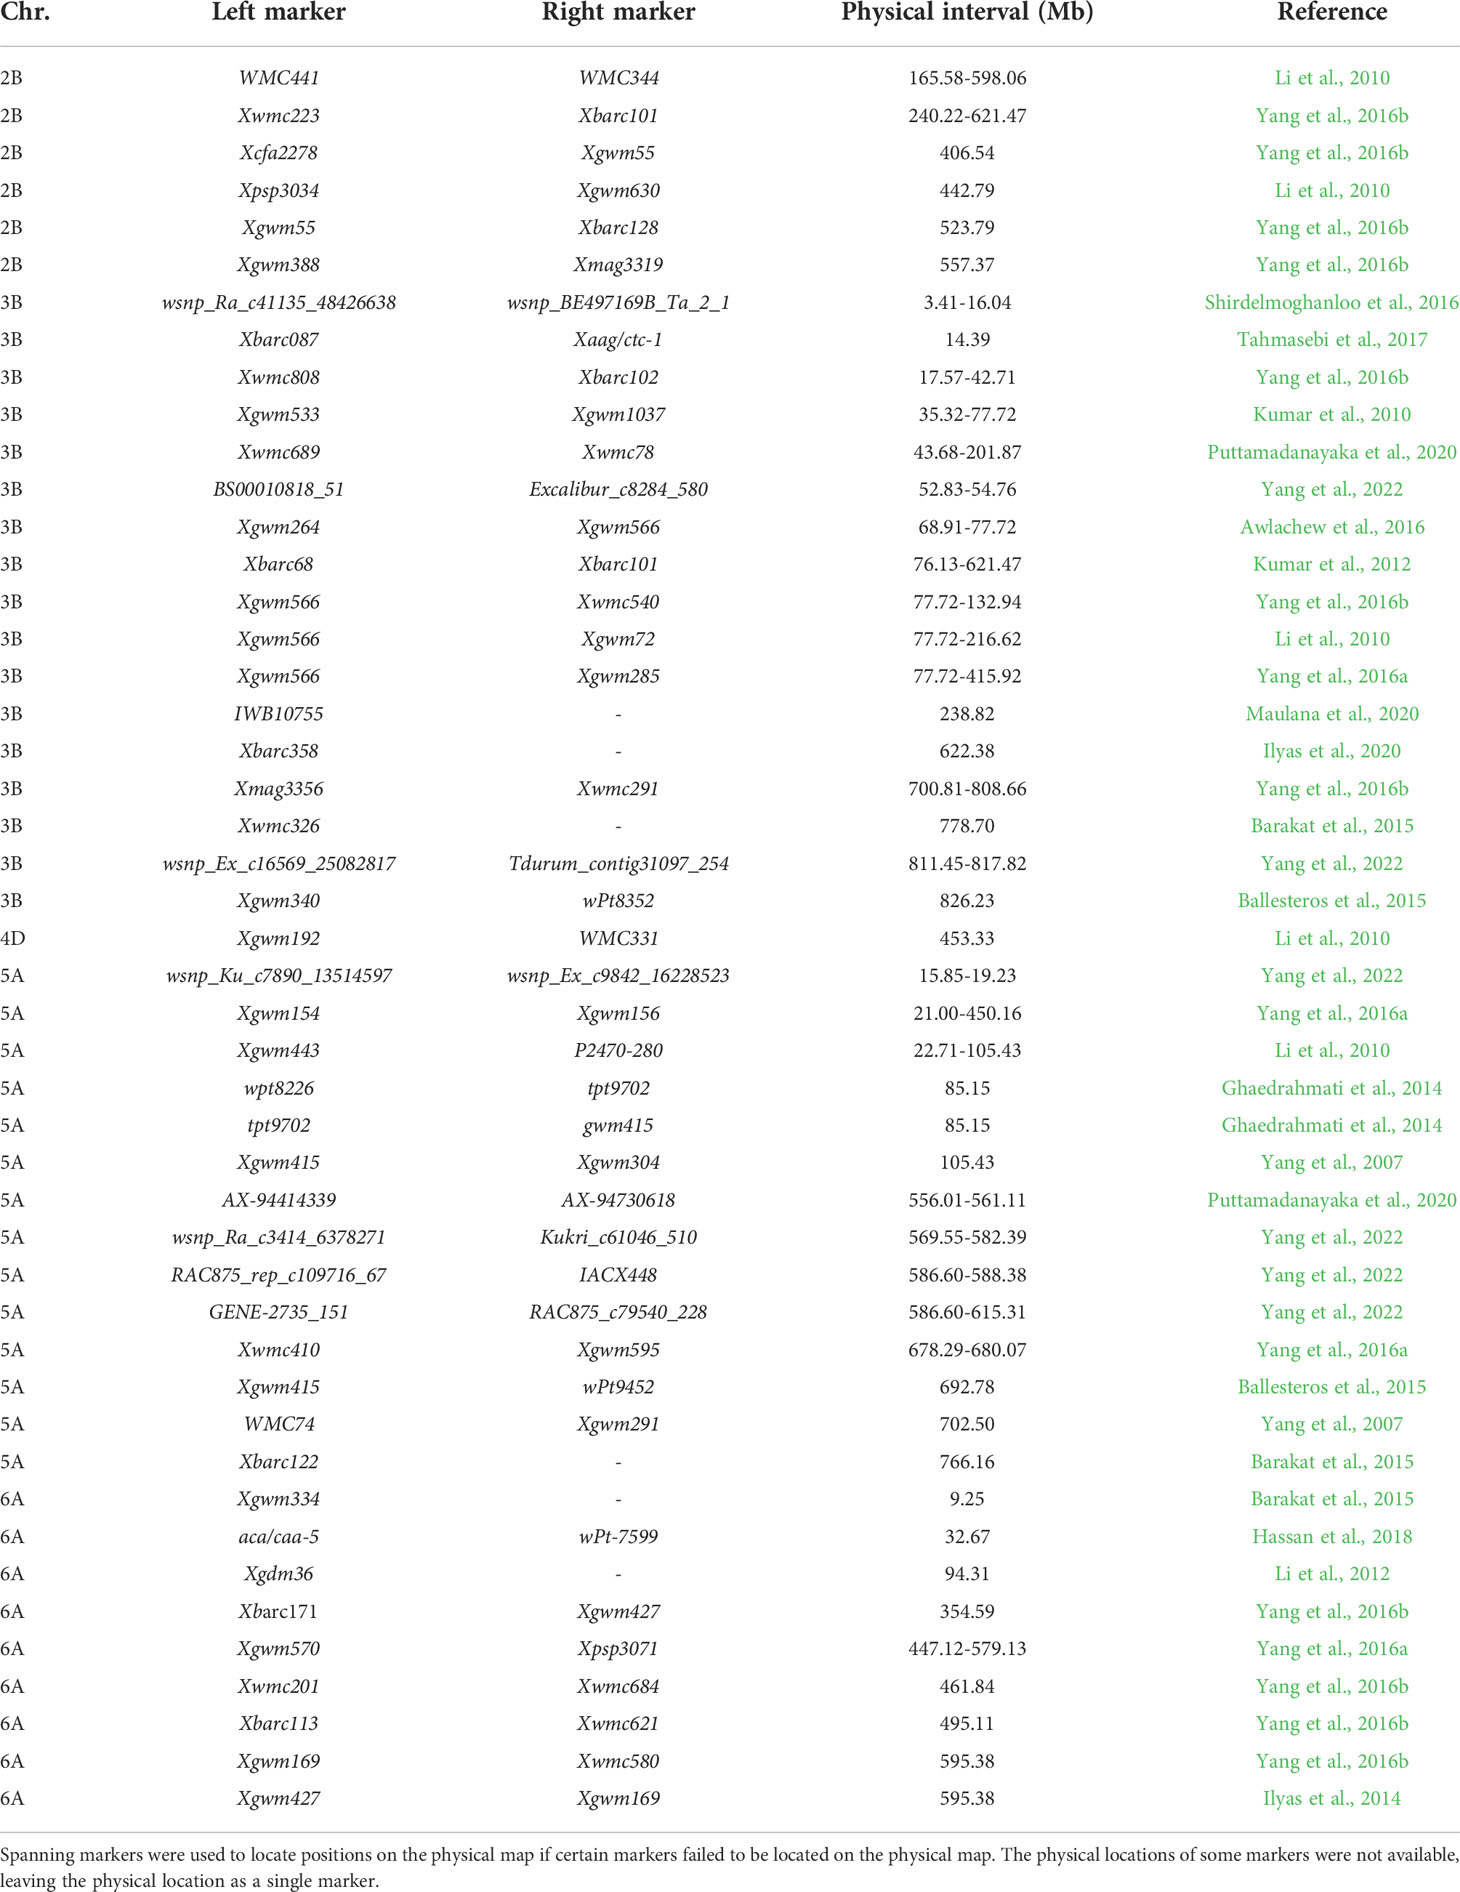
Table 6 Chlorophyll QTLs on chromosomes 2B, 3B, 4D, 5A, and 6A from previous studies.
The donor of the wheat D genome is the species of Aegilops tauschii. Previous research has revealed that the D genome of wheat plays a crucial role in stress tolerance (Mirzaghaderi and Mason, 2019; Hussain et al., 2022). In this study, the two major chlorophyll QTLs with the highest phenotypic contribution rate were identified on chromosome 4D, and there was no previously reported chlorophyll content QTLs in same interval, suggesting that Qchl.saw-4D.1 and Qchl.saw-4D.2 may be novel major QTL. Furthermore, Qchl.saw-4D.1 and Qchl.saw-2D.2 have been validated by the DH2 population with different genetic backgrounds, so they may be less affected by genetic background. Interestingly, Qchl.saw-4D.2 was identified in the 15.77 Mb-28.54 Mb interval, which also contained two major QTLs, viz. QTKW-4D-AN (Mohler et al., 2016) and QTgw-4D (Liu et al., 2014) were associated with 1000-grain weight. Dixon et al. (2018) identified the gene TB-D1, which regulates the structure of wheat inflorescence at the position 18.46 Mb on chromosome 4D. Peng et al. (1999) reported that the green revolution dwarf gene Rht-D1 was positioned at the location of 18.78 Mb on the linkage group 4D. The QTLs/genes of yield-related traits such as chlorophyll content and 1000-grain weight have been co-located in the same interval as in earlier studies using various genetic backgrounds, confirming that the major QTLs in this study have significant potential for application in marker-assisted selection (MAS) program of wheat. In summary, the major QTLs Qchl.saw-4D.1 and Qchl.saw-4D.2 as well as the developed KASP markers identified in this study could be utilized in developing low-phosphorus tolerant varieties of wheat.
Data availability statement
The original contributions presented in the study are included in the article/Supplementary Material. Further inquiries can be directed to the corresponding authors.
Author contributions
JL, LQ, and BY designed the experiment and wrote the manuscript. BY, NC and YD carried out the experiments. JZ analyzed the data. YW, XZ, JJZ, and HW did the field experiments. All authors contributed to the manuscript and approved the final manuscript to publish.
Funding
The research project is supported by the Basic Research Program of Shanxi Province (202103021223156 and 20210302124505), the Central Leading Local Technology Development Fund Project of Shanxi Province (YDZJSX2022A033), and the Shanxi Scholarship Council of China (2020-159).
Conflict of interest
The authors declare that the research was conducted in the absence of any commercial or financial relationships that could be construed as a potential conflict of interest.
Publisher’s note
All claims expressed in this article are solely those of the authors and do not necessarily represent those of their affiliated organizations, or those of the publisher, the editors and the reviewers. Any product that may be evaluated in this article, or claim that may be made by its manufacturer, is not guaranteed or endorsed by the publisher.
Supplementary material
The Supplementary Material for this article can be found online at: https://www.frontiersin.org/articles/10.3389/fpls.2022.1019012/full#supplementary-material
References
Ahmed, A. A. M., Mohamed, E. A., Hussein, M. Y., Sallam, A. (2021). Genomic regions associated with leaf wilting traits under drought stress in spring wheat at the seedling stage revealed by GWAS. Environ. Exp. Bot. 184, 104393. doi: 10.1016/j.envexpbot.2021.104393
Araus, J. L., Tapia, L. (1987). Photosynthetic gas-exchange characteristics of wheat flag leaf blades and sheaths during grain filling-the case of a spring crop grown under mediterranean climate conditions. Plant Physiol. 85, 667–673. doi: 10.1104/pp.85.3.667
Atchley, W. R., Zhu, J. (1997). Developmental quantitative genetics, conditional epigenetic variability and growth in mice. Genetics 147, 765–776. doi: 10.1093/genetics/147.2.765
Avenson, T. J., Cruz, J. A., Kanazawa, A., Kramer, D. M. (2005). Regulating the proton budget of higher plant photosynthesis. Proc. Natl. Acad. Sci. U S A. 102, 9709–9713. doi: 10.1073/pnas.0503952102
Awlachew, Z. T., Singh, R., Kaur, S., Bains, N. S., Chhuneja, P. (2016). Transfer and mapping of the heat tolerance component traits of Aegilops speltoides in tetraploid wheat Triticum durum. Mol. Breed. 36, 1–15. doi: 10.1007/s11032-016-0499-2
Ballesteros, D. C., Mason, R. E., Addison, C. K., Acuna, M. A., Arguello, M. N., Subramanian, N., et al. (2015). Tolerance of wheat to vegetative stage soil waterlogging is conditioned by both constitutive and adaptive QTL. Euphytica 201, 329–343. doi: 10.1007/s10681-014-1184-3
Barakat, M. N., Saleh, M., Al-Doss, A. A., Moustafa, K. A., Elshafei, A. A., Al-Qurainy, F. H. (2015). Identification of new SSR markers linked to leaf chlorophyll content, flag leaf senescence and cell membrane stability traits in wheat under water stressed condition. Acta Biol. Hung. 66, 93–102. doi: 10.1556/ABiol.66.2015.1.8
Benbella, M., Paulsen, G. M. (1998). Efficacy of treatments for delaying senescence of wheat leaves: II. senescence and grain yield under field conditions. Agron. J. 90, 332–338. doi: 10.2134/agronj1998.00021962009000030004x
Bogard, M., Jourdan, M., Allard, V., Martre, P., Perretant, M. R., Ravel, C., et al. (2011). Anthesis date mainly explained correlations between post-anthesis leaf senescence, grain yield, and grain protein concentration in a winter wheat population segregating for flowering time QTLs. J. Exp. Bot. 62, 3621–3636. doi: 10.1093/jxb/err061
Bown, H. E., Watt, M. S., Mason, E. G., Clinton, P. W., Whitehead, D. (2009). The influence of nitrogen and phosphorus supply and genotype on mesophyll conductance limitations to photosynthesis in Pinus radiata. Tree Physiol 29, 1143–1151. doi: 10.1093/treephys/tpp051
Cai, H., Chu, Q., Yuan, L., Liu, J., Chen, X., Chen, F., et al. (2012). Identification of quantitative trait loci for leaf area and chlorophyll content in maize (Zea mays) under low nitrogen and low phosphorus supply. Mol. Breed. 30, 251–266. doi: 10.1007/s11032-011-9615-5
Christopher, M., Chenu, K., Jennings, R., Fletcher, S., Butler, D., Borrell, A., et al. (2018). QTL for stay-green traits in wheat in well-watered and water-limited environments. Field Crops Res. 217, 32–44. doi: 10.1016/j.fcr.2017.11.003
Collard, B. C. Y., Mackill, D. J. (2008). Marker-assisted selection: an approach for precision plant breeding in the twenty-first century. Philo. Trans. R. Soc Lond. B. Bio. Sci. 363, 557–572. doi: 10.1098/rstb.2007.2170
Conn, S., Gilliham, M. (2010). Comparative physiology of elemental distributions in plants. Ann. Bot. 105, 1081–1102. doi: 10.1093/aob/mcq027
Cui, F., Zhao, C., Ding, A., Li, J., Wang, L., Li, X., et al. (2014). Construction of an integrative linkage map and QTL mapping of grain yield-related traits using three related wheat RIL populations. Theor. Appl. Genet. 127, 659–675. doi: 10.1007/s00122-013-2249-8
Dixon, L. E., Greenwood, J. R., Bencivenga, S., Zhang, P., Cockram, J., Mellers, G., et al. (2018). TEOSINTE BRANCHED1 regulates inflorescence architecture and development in bread wheat (Triticum aestivum). Plant Cell 30, 563–581. doi: 10.1105/tpc.17.00961
El Mazlouzi, M., Morel, C., Chesseron, C., Robert, T., Mollier, A. (2020). Contribution of external and internal phosphorus sources to grain P loading in durum wheat (Triticum durum L.) grown under contrasting P levels. Front. Plant Sci. 11. doi: 10.3389/fpls.2020.00870
Fang, P., Yu, X. M., Zhu, R. Q., Wu, P. (2004). QTLs for rice leaf chlorophyll content under low N stress. Pedosphere 14, 145–150. Available at: https://www.researchgate.net/publication/289819581.
Farooq, M., Hussain, M., Siddique, K. H. M. (2014). Drought stress in wheat during flowering and grain-filling periods. CRC. Crit. Rev. Plant Sci. 33, 331–349. doi: 10.1080/07352689.2014.875291
Feng, Z., Zhang, L., Yang, C., Wu, T., Lv, J., Chen, Y., et al. (2014). EF8 is involved in photoperiodic flowering pathway and chlorophyll biogenesis in rice. Plant Cell Rep. 33, 2003–2014. doi: 10.1007/s00299-014-1674-8
Ghaedrahmati, M., Mardi, M., Naghavi, M. R., Haravan, E. M., Nakhoda, B., Azadi, A., et al. (2014). Mapping QTLs associated with salt tolerance related traits in seedling stage of wheat (Triticum aestivum L.). J. AGR. Sci. 16, 1413–1428. Available at: https://www.researchgate.net/publication/272482905.
Gupta, P. K., Balyan, H. S., Sharma, S., Kumar, R. (2020). Genetics of yield, abiotic stress tolerance and biofortification in wheat (Triticum aestivum L.). Theor. Appl. Genet. 133, 1569–1602. doi: 10.1007/s00122-020-03583-3
Hassan, F. S. C., Solouki, M., Fakheri, B. A., Nezhad, N. M., Masoudi, B. (2018). Mapping QTLs for physiological and biochemical traits related to grain yield under control and terminal heat stress conditions in bread wheat (Triticum aestivum L.). Physiol. Mol. Biol. Pla. 24, 1231–1243. doi: 10.1007/s12298-018-0590-8
Hayes, P. E., Clode, P. L., Oliveira, R. S., Lambers, H. (2018). Proteaceae from phosphorus-impoverished habitats preferentially allocate phosphorus to photosynthetic cells: An adaptation improving phosphorus-use efficiency. Plant Cell Environ. 41, 605–619. doi: 10.1111/pce.13124
He, X., Qu, B., Li, W., Zhao, X., Teng, W., Ma, W., et al. (2015). The nitrate-inducible NAC transcription factor TaNAC2-5A controls nitrate response and increases wheat yield. Plant Physio. 169, 1991–2005. doi: 10.1104/pp.15.00568
Hussain, B., Akpinar, B. A., Alaux, M., Algharib, A. M., Sehgal, D., Ali, Z., et al. (2022). Capturing wheat phenotypes at the genome level. Front. Plant Sci. 13. doi: 10.3389/fpls.2022.851079
Ilyas, M., Ilyas, N., Arshad, M., Kazi, A. G., Kazi, A. M., Waheed, A. (2014). QTL mapping of wheat doubled haploids for chlorophyll content and chlorophyll fluorescence kinetics under drought stress imposed at anthesis stage. Pak. J. Bot. 46, 1889–1897. Available at: https://www.researchgate.net/publication/272621279.
Ilyas, N., Amjid, M. W., Saleem, M. A., Khan, W., Wattoo, F. M., Rana, R. M., et al. (2020). Quantitative trait loci (QTL) mapping for physiological and biochemical attributes in a Pasban90/Frontana recombinant inbred lines (RILs) population of wheat (Triticum aestivum) under salt stress condition. Saudi J Biol Sci 27, 341–351. doi: 10.1016/j.sjbs.2019.10.003
Jiang, D., Dai, T., Jing, Q., Cao, W., Zhou, Q., Zhao, H., et al. (2004). Effects of long-term fertilization on leaf photosynthetic characteristics and grain yield in winter wheat. Photosynthetica 42, 439–446. doi: 10.1023/B:PHOT.0000046164.77410.ef
Kamal, N. M., Gorafi, Y. S. A., Abdelrahman, M., Abdellatef, E., Tsujimoto, H. (2019). Stay-green trait: A prospective approach for yield potential, and drought and heat stress adaptation in globally important cereals. Int. J. Mol. Sci. 20, 5837. doi: 10.3390/ijms20235837
Kanbe, T., Sasaki, H., Aoki, N., Yamagishi, T., Ebitani, T., Yano, M., et al. (2008). Identification of QTLs for improvement of plant type in rice (Oryza sativa L.) using Koshihikari/Kasalath chromosome segment substitution lines and backcross progeny F-2 population. Plant Prod. Sci. 11, 447–456. doi: 10.1626/pps.11.447
Khourchi, S., Oukarroum, A., Tika, A., Delaplace, P., Bargaz, A. (2022). Polyphosphate application influences morpho-physiological root traits involved in P acquisition and durum wheat growth performance. BMC Plant Biol. 22, 309. doi: 10.1186/s12870-022-03683-w
Kikuchi, S., Satoh, K., Nagata, T., Kawagashira, N., Doi, K., Kishimoto, N., et al. (2003). Collection, mapping, and annotation of over 28,000 cDNA clones from japonica rice. Science 301, 376–379. doi: 10.1126/science.1081288
Kolesinski, P., Piechota, J., Szczepaniak, A. (2011). Initial characteristics of RbcX proteins from Arabidopsis thaliana. Plant Mol. Bio. 77, 447–459. doi: 10.1007/s11103-011-9823-8
Kumar, U., Joshi, A. K., Kumari, M., Paliwal, R., Kumar, S., Roeder, M. S. (2010). Identification of QTLs for stay green trait in wheat (Triticum aestivum L.) in the 'Chirya 3' × 'Sonalika' population. Euphytica 174, 437–445. doi: 10.1007/s10681-010-0155-6
Kumar, A., Mantovani, E. E., Seetan, R., Soltani, A., Echeverry-Solarte, M., Jain, S., et al. (2016). Dissection of genetic factors underlying wheat kernel shape and size in an Elite × Nonadapted cross using a high density SNP linkage map. Plant Genome 9, 1–22. doi: 10.3835/plantgenome2015.09.0081
Kumar, S., Sehgal, S. K., Kumar, U., Prasad, P. V. V., Joshi, A. K., Gill, B. S. (2012). Genomic characterization of drought tolerance-related traits in spring wheat. Euphytica 186, 265–276. doi: 10.1007/s10681-012-0675-3
Langridge, P. (2013). Wheat genomics and the ambitious targets for future wheat production. Genome 56, 545–547. doi: 10.1139/gen-2013-0149
Li, X. M., He, Z. H., Xiao, Y. G., Xia, X. C., Trethowan, R., Wang, H. J., et al. (2015). QTL mapping for leaf senescence-related traits in common wheat under limited and full irrigation. Euphytica 203, 569–582. doi: 10.1007/s10681-014-1272-4
Li, M., Li, B., Guo, G., Chen, Y., Xie, J., Lu, P., et al. (2018). Mapping a leaf senescence gene els1 by BSR-seq in common wheat. Crop J. 6, 236–243. doi: 10.1016/j.cj.2018.01.004
Li, H. W., Lin, F. Y., Wang, G., Jing, R. F., Zheng, Q., Li, B., et al. (2012). Quantitative trait loci mapping of dark-Induced senescence in winter wheat (Triticum aestivum). J Integr Plant Biol 54, 33–44. doi: 10.1111/j.1744-7909.2011.01088.x
Lin, Z. H., Chen, L. S., Chen, R. B., Zhang, F. Z., Jiang, H. X., Tang, N. (2009). CO2 assimilation, ribulose-1,5-bisphosphate carboxylase/oxygenase, carbohydrates and photosynthetic electron transport probed by the JIP-test, of tea leaves in response to phosphorus supply. BMC Plant Biol. 9, 43. doi: 10.1186/1471-2229-9-43
Li, H., Tong, Y., Li, B., Jing, R., Lu, C., Li, Z. (2010). Genetic analysis of tolerance to photo-oxidative stress induced by high light in winter wheat (Triticum aestivum L.). J. Genet. Genomics 37, 399–412. doi: 10.1016/s1673-8527(09)60058-8
Liu, G., Jia, L. J., Lu, L. H., Qin, D. D., Zhang, J. P., Guan, P. F., et al. (2014). Mapping QTLs of yield-related traits using RIL population derived from common wheat and Tibetan semi-wild wheat. Theor. Appl. Genet. 127, 2415–2432. doi: 10.1007/s00122-014-2387-7
Li, H., Wang, G., Zheng, Q., Li, B., Jing, R., Li, Z. (2014). Genetic analysis of biomass and photosynthetic parameters in wheat grown in different light intensities. J. Integr. Plant Bio. 56, 594–604. doi: 10.1111/jipb.12174
Li, H. Y., Yang, Y. M., Zhang, H. Y., Chu, S. S., Zhang, X. G., Yin, D. M., et al. (2016). A genetic relationship between phosphorus efficiency and photosynthetic traits in soybean as revealed by QTL analysis using a high-density genetic map. Front. Plant Sci. 7. doi: 10.3389/fpls.2016.00924
Maharajan, T., Ceasar, S. A., Krishna, T. P. A., Ramakrishnan, M., Duraipandiyan, V., Abdulla, A. D. N., et al. (2018). Utilization of molecular markers for improving the phosphorus efficiency in crop plants. Plant Breed. 137, 10–26. doi: 10.1111/pbr.12537
Maulana, F., Ayalew, H., Anderson, J. D., Kumssa, T. T., Huang, W. Q., Ma, X. F. (2018). Genome-wide association mapping of seedling heat tolerance in winter wheat. Front. Plant Sci. 9. doi: 10.3389/fpls.2018.01272
Maulana, F., Huang, W., Anderson, J. D., Ma, X. F. (2020). Genome-wide association mapping of seedling drought tolerance in winter wheat. Front. Plant Sci. 11. doi: 10.3389/fpls.2020.573786
Mayer, K. F. X., Rogers, J., Dolezel, J., Pozniak, C., Eversole, K., Feuillet, C., et al. (2014). A chromosome-based draft sequence of the hexaploid bread wheat (Triticum aestivum) genome. Science 345, 1251788. doi: 10.1126/science.1251788
Ma, L., Zhang, W. F., Ma, W. Q., Velthof, G. L., Oenema, O., Zhang, F. S. (2013). An analysis of developments and challenges in nutrient management in China. J. Enviro. Qual. 42, 951–961. doi: 10.2134/jeq2012.0459
McCouch, S. R., Chen, X. L., Panaud, O., Temnykh, S., Xu, Y. B., Cho, Y. G., et al. (1997). Microsatellite marker development, mapping and applications in rice genetics and breeding. Plant Mol. Biol. 35, 89–99. doi: 10.1023/a:1005711431474
McDonald, G., Bovill, W., Taylor, J., Wheeler, R. (2015). Responses to phosphorus among wheat genotypes. Crop Pasture Sci. 66, 430–444. doi: 10.1071/cp14191
Meng, L., Li, H. H., Zhang, L. Y., Wang, J. K. (2015). QTL IciMapping: Integrated software for genetic linkage map construction and quantitative trait locus mapping in biparental populations. Crop J. 3, 269–283. doi: 10.1016/j.cj.2015.01.001
Mirzaghaderi, G., Mason, A. S. (2019). Broadening the bread wheat D genome. Theor. Appl. Genet. 132, 1295–1307. doi: 10.1007/s00122-019-03299-z
Mohler, V., Albrecht, T., Castell, A., Diethelm, M., Schweizer, G., Hartl, L. (2016). Considering causal genes in the genetic dissection of kernel traits in common wheat. J. Appl. Genet. 57, 467–476. doi: 10.1007/s13353-016-0349-2
Morita, R., Sato, Y., Masuda, Y., Nishimura, M., Kusaba, M. (2009). Defect in non-yellow coloring 3, an alpha/beta hydrolase-fold family protein, causes a stay-green phenotype during leaf senescence in rice. Plant J. 60, 1110–1110. doi: 10.1111/j.1365-313X.2009.04019.x
Nguyen, V. L., Palmer, L., Stangoulis, J. (2022). Higher photochemical quenching and better maintenance of carbon dioxide fixation are key traits for phosphorus use efficiency in the wheat breeding line, RAC875. Front. Plant Sci. 12. doi: 10.3389/fpls.2021.816211
Peltier, J. B., Cai, Y., Sun, Q., Zabrouskov, V., Giacomelli, L., Rudella, A., et al. (2006). The oligomeric stromal proteome of Arabidopsis thaliana chloroplasts. Mole. Cell. Prot 5, 114–133. doi: 10.1074/mcp.M500180-MCP200
Peng, J. R., Richards, D. E., Hartley, N. M., Murphy, G. P., Devos, K. M., Flintham, J. E., et al. (1999). 'Green revolution' genes encode mutant gibberellin response modulators. Nature 400, 256–261. doi: 10.1038/22307
Puttamadanayaka, S., Harikrishna, Balaramaiah, M., Biradar, S., Parmeshwarappa, S. V., Sinha, N., et al. (2020). Mapping genomic regions of moisture deficit stress tolerance using backcross inbred lines in wheat (Triticum aestivum L.). Sci. Rep. 10, 21646. doi: 10.1038/s41598-020-78671-x
Qiao, L., Li, H. L., Wang, J., Zhao, J. J., Zheng, X. W., Wu, B. B., et al. (2022). Analysis of genetic regions related to field grain number per spike from Chinese wheat founder parent Linfen 5064. Front. Plant Sci. 12. doi: 10.3389/fpls.2021.808136
Qi, Z., Huang, L., Zhu, R., Xin, D., Liu, C., Han, X., et al. (2014). A high-density genetic map for soybean based on specific length amplified fragment sequencing. PloS One 9, e114349. doi: 10.1371/journal.pone.0104871
Rasheed, A., Takumi, S., Hassan, M. A., Imtiaz, M., Ali, M., Morgunov, A. I., et al. (2020). Appraisal of wheat genomics for gene discovery and breeding applications: A special emphasis on advances in Asia. Theor. Appl. Genet. 133, 1503–1520. doi: 10.1007/s00122-019-03523-w
Ren, T., Fan, T., Chen, S., Chen, Y., Ou, X., Jiang, Q., et al. (2022). Identification and validation of quantitative trait loci for the functional stay green trait in common wheat (Triticum aestivu L.) via high-density SNP-based genotyping. Theor. Appl. Genet. 135, 1429–1441. doi: 10.1007/s00122-022-04044-9
Richardson, A. E., Lynch, J. P., Ryan, P. R., Delhaize, E., Smith, F. A., Smith, S. E., et al. (2011). Plant and microbial strategies to improve the phosphorus efficiency of agriculture. Plant Soil 349, 121–156. doi: 10.1007/s11104-011-0950-4
Saleh, M. S., Al-Doss, A. A., Elshafei, A. A., Moustafa, K. A., Al-Qurainy, F. H., Barakat, M. N. (2014). Identification of new TRAP markers linked to chlorophyll content, leaf senescence, and cell membrane stability in water-stressed wheat. Bio. Plantarum 58, 64–70. doi: 10.1007/s10535-013-0351-z
Shi, S., Azam, F. I., Li, H., Chang, X., Li, B., Jing, R. (2017). Mapping QTL for stay-green and agronomic traits in wheat under diverse water regimes. Euphytica 213, 1–19. doi: 10.1007/s10681-017-2002-5
Shirdelmoghanloo, H., Taylor, J. D., Lohraseb, I., Rabie, H., Brien, C., Timmins, A., et al. (2016). A QTL on the short arm of wheat (Triticum aestivum L.) chromosome 3B affects the stability of grain weight in plants exposed to a brief heat shock early in grain filling. BMC Plant Biol. 16, 100. doi: 10.1186/s12870-016-0784-6
Smith, S. E., Kuehl, R. O., Ray, I. M., Hui, R., Soleri, D. (1998). Evaluation of simple methods for estimating broad-sense heritability in stands of randomly planted genotypes. Crop Sci. 38, 1125–1129. doi: 10.2135/cropsci1998.0011183X003800050003x
Sukumaran, S., Dreisigacker, S., Lopes, M., Chavez, P., Reynolds, M. P. (2015). Genome-wide association study for grain yield and related traits in an elite spring wheat population grown in temperate irrigated environments. Theor. Appl. Genet. 128, 353–363. doi: 10.1007/s00122-014-2435-3
Su, J. Y., Zheng, Q., Li, H. W., Li, B., Jing, R. L., Tong, Y. P., et al. (2009). Detection of QTLs for phosphorus use efficiency in relation to agronomic performance of wheat grown under phosphorus sufficient and limited conditions. Plant Sci. 176, 824–836. doi: 10.1016/j.plantsci.2009.03.006
Tahmasebi, S., Heidari, B., Pakniyat, H., McIntyre, C. L. (2017). Mapping QTLs associated with agronomic and physiological traits under terminal drought and heat stress conditions in wheat (Triticum aestivum L.). Genome 60, 26–45. doi: 10.1139/gen-2016-0017
Talukder, S. K., Babar, M. A., Vijayalakshmi, K., Poland, J., Prasad, P. V. V., Bowden, R., et al. (2014). Mapping QTL for the traits associated with heat tolerance in wheat (Triticum aestivum L.). BMC Genet. 15, 97. doi: 10.1186/s12863-014-0097-4
Tang, J., Vosman, B., Voorrips, R. E., Linden, C. G. V. D., Leunissen, J. A. M. (2006). QualitySNP: A pipeline for detecting single nucleotide polymorphisms and insertions/deletions in EST data from diploid and polyploid species. BMC Bioinf. 7, 438–438. doi: 10.1186/1471-2105-7-438
Thomas, H., Ougham, H. (2014). The stay-green trait. J. Exp. Bot. 65, 3889–3900. doi: 10.1093/jxb/eru037
Useche, F. J., Gao, G., Harafey, M., Rafalski, A. (2001). High-throughput identification, database storage and analysis of SNPs in EST sequences. Genome Inf. 12, 194–203. Available at: https://pubmed.ncbi.nlm.nih.gov/11791238.
Van de Wiel, C. C. M., Van der Linden, C. G., Scholten, O. E. (2016). Improving phosphorus use efficiency in agriculture: Opportunities for breeding. Euphytica 207, 1–22. doi: 10.1007/s10681-015-1572-3
Veneklaas, E. J., Lambers, H., Bragg, J., Finnegan, P. M., Lovelock, C. E., Plaxton, W. C., et al. (2012). Opportunities for improving phosphorus-use efficiency in crop plants. New Phytol. 195, 306–320. doi: 10.1111/j.1469-8137.2012.04190.x
Vijayalakshmi, K., Fritz, A. K., Paulsen, G. M., Bai, G., Pandravada, S., Gill, B. S. (2010). Modeling and mapping QTL for senescence-related traits in winter wheat under high temperature. Mol. Breed. 26, 163–175. doi: 10.1007/s11032-009-9366-8
Wang, W., Ding, G. D., White, P. J., Wang, X. H., Jin, K. M., Xu, F. S., et al. (2019b). Mapping and cloning of quantitative trait loci for phosphorus efficiency in crops: opportunities and challenges. Plant Soil 439, 91–112. doi: 10.1007/s11104-018-3706-6
Wang, H., Wang, S., Chang, X., Hao, C., Sun, D., Jing, R. (2019a). Identification of TaPPH-7A haplotypes and development of a molecular marker associated with important agronomic traits in common wheat. BMC Plant Bio. 19, 296. doi: 10.1186/s12870-019-1901-0
Wang, N., Xie, Y., Li, Y., Wu, S., Li, S., Guo, Y., et al. (2020). High-resolution mapping of the novel early leaf senescence gene Els2 in common wheat. Plants Basel. 9, 698. doi: 10.3390/plants9060698
Yamatani, H., Kohzuma, K., Nakano, M., Takami, T., Kato, Y., Hayashi, Y., et al. (2018). Impairment of Lhca4, a subunit of LHCI, causes high accumulation of chlorophyll and the stay-green phenotype in rice. J. Exp. Bot. 69, 1027–1035. doi: 10.1093/jxb/erx468
Yang, D. L., Jing, R. L., Chang, X. P., Li, W. (2007). Quantitative trait loci mapping for chlorophyll fluorescence and associated traits in wheat (Triticum aestivum). J Integr Plant Biol 49, 646–654. doi: 10.1111/j.1744-7909.2007.00443.x
Yang, D., Li, M., Liu, Y., Chang, L., Cheng, H., Chen, J., et al. (2016b). Identification of quantitative trait loci and water environmental interactions for developmental behaviors of leaf greenness in wheat. Front. Plant Sci. 7, 273. doi: 10.3389/fpls.2016.00273
Yang, X. L., Liu, Y. X., Wu, F. K., Jiang, X. J., Lin, Y., Wang, Z. Q., et al. (2018). Quantitative trait loci analysis of root traits under phosphorus deficiency at the seedling stage in wheat. Genome 61, 209–215. doi: 10.1139/gen-2017-0159
Yang, M. J., Wang, C. R., Hassan, M. A., Li, F. J., Xia, X. C., Shi, S. B., et al. (2021). QTL mapping of root traits in wheat under different phosphorus levels using hydroponic culture. BMC Genomics 22, 174. doi: 10.1186/s12864-021-07425-4
Yang, B., Wen, X. J., Wen, H. W., Feng, Y. R., Zhao, J. J., Wu, B. B., et al. (2022). Identification of genetic loci affecting flag leaf chlorophyll in wheat grown under different water regimes. Front. Genet. 13. doi: 10.3389/fgene.2022.832898
Yang, B., Yan, X., Wang, H., Li, X., Ma, H., Wang, S., et al. (2016a). Dynamic QTL analysis of chlorophyll content during grain filling stage in winter wheat (Triticum aestivum L.). Rom. Agric. Res. 33, 77–85. Available at: https://www.researchgate.net/publication/303148421.
Yan, X., Wang, S., Yang, B., Zhang, W., Cao, Y., Shi, Y., et al. (2020). QTL mapping for flag leaf-related traits and genetic effect of QFLW-6A on flag leaf width using two related introgression line populations in wheat. PloS One 15, e0229912. doi: 10.1371/journal.pone.0229912
Yuan, Y., Zhang, M., Zheng, H., Kong, F., Guo, Y., Zhao, Y., et al. (2020). Detection of QTL for phosphorus efficiency and biomass traits at the seedling stage in wheat. Cereal Res. Commun. 48, 517–524. doi: 10.1007/s42976-020-00067-4
Zhang, K., Fang, Z., Liang, Y., Tian, J. (2009). Genetic dissection of chlorophyll content at different growth stages in common wheat. J. Genet. 88, 183–189. doi: 10.1007/s12041-009-0026-x
Zhang, J., Gizaw, S. A., Bossolini, E., Hegarty, J., Howell, T., Carter, A. H., et al. (2018). Identification and validation of QTL for grain yield and plant water status under contrasting water treatments in fall-sown spring wheats. Theor. Appl. Genet. 131, 1741–1759. doi: 10.1007/s00122-018-3111-9
Zhang, J. A., Hao, C. Y., Ren, Q., Chang, X. P., Liu, G. R., Jing, R. L. (2011). Association mapping of dynamic developmental plant height in common wheat. Planta 234, 891–902. doi: 10.1007/s00425-011-1434-8
Zhang, Y., Wang, L., Xin, H., Li, D., Ma, C., Ding, X., et al. (2013). Construction of a high-density genetic map for sesame based on large scale marker development by specific length amplified fragment (SLAF) sequencing. BMC Plant Biol. 13, 141. doi: 10.1186/1471-2229-13-141
Zhang, Z. B., Xu, P., Jia, J. Z., Zhou, R. H. (2010). Quantitative trait loci for leaf chlorophyll fluorescence traits in wheat. Austra. J. Crop Sci. 4, 571–579. Available at: https://www.researchgate.net/publication/267835584.
Keywords: wheat, phosphorus deficiency, chlorophyll, quantitative trait locus, validation
Citation: Yang B, Chen N, Dang Y, Wang Y, Wen H, Zheng J, Zheng X, Zhao J, Lu J and Qiao L (2022) Identification and validation of quantitative trait loci for chlorophyll content of flag leaf in wheat under different phosphorus treatments. Front. Plant Sci. 13:1019012. doi: 10.3389/fpls.2022.1019012
Received: 14 August 2022; Accepted: 14 October 2022;
Published: 17 November 2022.
Edited by:
Jian Ma, Sichuan Agricultural University, ChinaReviewed by:
Yanmei Li, Beijing Academy of Agricultural and Forestry Sciences, ChinaChen Zeng, Institute of Tibetan Plateau Research (CAS), China
Copyright © 2022 Yang, Chen, Dang, Wang, Wen, Zheng, Zheng, Zhao, Lu and Qiao. This is an open-access article distributed under the terms of the Creative Commons Attribution License (CC BY). The use, distribution or reproduction in other forums is permitted, provided the original author(s) and the copyright owner(s) are credited and that the original publication in this journal is cited, in accordance with accepted academic practice. No use, distribution or reproduction is permitted which does not comply with these terms.
*Correspondence: Jinxiu Lu, eG1zbHVqaW54aXVAMTYzLmNvbQ==; Ling Qiao, cWlhb2xpbmdzbWlsZUAxNjMuY29t
†These authors have contributed equally to this work and share first authorship