 Tingchun Li1
 Yiting Wang2Qing Dong1
 Fang Wang1
 Fanna Kong1Guihu Liu1Yanli Lei1Huaying Yang1Yingbing Zhou1Cheng Li1*
- 1Tobacco Research Institute, Anhui Academy of Agricultural Sciences, Hefei, China
- 2School of Life Sciences, Anhui Agricultural University, Hefei, China
Anthocyanins are the visual pigments that present most of the colors in plants. Its biosynthesis requires the coordinated expression of structural genes and regulatory genes. Pericarps are the rich sources of anthocyanins in maize seeds. In the experiment, the transcriptomes of transparent and anthocyanins-enriched pericarps at 15, 20, and 25 DAP were obtained. The results output 110.007 million raw reads and 51407 genes’ expression matrix. Using data filtration in R language, 2057 genes were eventually identified for weighted gene co-expression network analysis. The results showed that 2057 genes were classified into ten modules. The cyan module containing 183 genes was confirmed to be the key module with the highest correlation value of 0.98 to the anthocyanins trait. Among 183 genes, seven structural genes were mapped the flavonoid biosynthesis pathway, and a transcription factor Lc gene was annotated as an anthocyanin regulatory gene. Cluster heatmap and gene network analysis further demonstrated that Naringenin, 2-oxoglutarate 3-dioxygenase (Zm00001d001960), Dihydroflavonol 4-reductase (Zm00001d044122), Leucoanthocyanidin dioxygenase (Zm00001d014914), anthocyanin regulatory Lc gene (Zm00001d026147), and Chalcone synthase C2 (Zm00001d052673) participated in the anthocyanins biosynthesis. And the transcription factor anthocyanin regulatory Lc gene Zm00001d026147 may act on the genes Chalcone synthase C2 (Zm00001d052673) and Dihydroflavonol 4-reductase (Zm00001d044122). The yeast one-hybrid assays confirmed that the Lc protein could combine with the promoter region of C2 and directly regulate the anthocyanin biosynthesis in the pericarp. These results may provide a new sight to uncover the module and hub genes related to anthocyanins biosynthesis in plants.
Introduction
Anthocyanins are the visual pigments that present most colors, including black, red, purple, and blue in plants (Paulsmeyer et al., 2017). Some of them take on colorful flowers and function as signals for the attraction of pollinators (Khoo et al., 2017). Some of them are accumulated in fruits and used as essential nutrients for their beneficial effects, including antioxidant activities, antimicrobial, inhibition of lipid peroxidation, and prevention of diseases (Cuevas Montilla et al., 2011; Petroni et al., 2014). Otherwise, anthocyanins play a vital role in protecting the plant from biologically and phenotypically damage such as photodamage and herbivory (Paulsmeyer et al., 2017).
In plants, anthocyanins are biosynthesized via the flavonoid metabolism pathway. It is derived from flavonol with the basic structure of flavylium ion. Until now, many kinds of anthocyanins and their derivatives have been identified in natural plants. The most common types are delphinidin, cyaniding, pelargonidin, peonidin, malvidin, and petunidin, which constitute distinct combinations and present various kinds of colors with different concentrations (Khoo et al., 2017). Though the composition of anthocyanins is complex, only several structural genes constitute the main biosynthesis pathway in plants, such as dihydroflavonol 4-reductase (DFR), flavanone 3-hydroxylase (F3H), chalcone synthase (CHS), and so on (Yang et al., 2015). In addition, some transcription factor family genes, including bHLH, MYB, WD40, and WRKY, were involved in the anthocyanins biosynthesis (Amato et al., 2017). For example, an MYB transcription factor gene, BoPAP1 is required for anthocyanin biosynthesis for purple kale (Zhang et al., 2012). A bHLH gene, NnTT8, functions as AtTT8 in regulating anthocyanin and proanthocyanin biosynthesis (Deng et al., 2021). A WD40 repeat protein could trigger the biosynthesis of flavan-3-ols by interacting with MYB and bHLH transcription factors in Camellia sinensis (Liu et al., 2018). And the ectopic expression of CsWD40 in tobacco enhances anthocyanins biosynthesis in transgenic petals (Liu et al., 2018).
In maize, its stalk, cob, leaf, root, and seed could synthesize and accumulate anthocyanins. Nevertheless, most researchers mainly focus on the anthocyanins in the seed for its edible use. The previous studies reveal that anthocyanins are naturally accumulated in the pericarp and aleurone layer of the seed (Salinas Moreno et al., 2005). Based on the color difference, the seeds with black, red, purple, blue, pink, and bronze pigment were isolated (Paulsmeyer et al., 2017). Further analysis of anthocyanins in the kernels demonstrated that anthocyanin profiles are almost identical, but the contents differ (Salinas Moreno et al., 2005). For example, the content of anthocyanins and total phenolic in red maize were about 5- and 2.5-fold that of blue maize (Ortega-Regules et al., 2012). And the structural genes related anthocyanins biosynthesis in maize were identified, such as ZmCHS (c2), ZmCHI (chi), ZmF3H (fht1), ZmF3’H (pr1), ZmDFR (a1), ZmANS (a2), ZmUFGT (bz1), and ZmGST (bz2). Transcription factors including ZmMYB (c1, p1, pl), ZmbHLH (Sn, r1, b1), and ZmWD40 (pac1) were proved to be the regulatory genes in anthocyanins biosynthesis (Li et al., 2019).
Most previous studies paid more attention to single or several genes associated with maize anthocyanins biosynthesis. In the experiment, the dynamic comparative transcriptome sequence and weighted gene co-expression network analysis (WGCNA) were conducted, and the key modules and hub genes correlated with anthocyanins biosynthesis were analyzed. These results would supplement more hints to understanding the molecular mechanism of anthocyanins biosynthesis and accumulations in maize seeds.
Materials and methods
Plant material
The corn inbred line W039 with a black pericarp and an inbred line W042 with a transparent pericarp were isolated from the F7 generations of the hybrid combination W024 and W133 in the farm of Tobacco Research Institute, Anhui Academy of Agricultural Sciences (Fengyang, China). The plants were cultivated on the farm in 2019. After pollination, the pericarps were collected at 15, 20, and 25 days after pollination (DAP). All pericarps were frozen and stored at -70°C refrigerator for the following experiments.
Microscopic observation and content determination of anthocyanins
The pericarps were separated from the mature seed. Then it was put on a glass slide using tweezers. With a digital camera, the Leica CTR6000 (Germany) was used to observe and document the microstructure. To determine the content of anthocyanins, the mature seeds were ground into powder. Then, 0.1 g samples were collected and resolved in 1 ml of 5% (v/v) formic acid solution by vortex. After ultrasonic vibration at 25°C for 30 min, the supernatants were collected by centrifugation at 6000×g for 10 min. The absorbance was recorded at 530 nm using a microplate reader (Multiskan SkyHigh, Thermo Fisher, USA). The cyanidin 3-sophoroside chloride was selected as standards to calculate the content of anthocyanins.
The cDNA library construction and sequencing
The RNAprep Pure Plant Kit (Tiangen, China) was employed to extract total RNA from 200 mg pericarp. Three biological replicates were created by independently extracting the RNA three times. The cDNA library construction and RNA-seq were conducted with the help of Beijing Novogene Biological Information Technology Co. Ltd. (Beijing, China) (http://www.novogene.cn/). The RNA-seq was conducted on an Illumina Hiseq 2500 platform with 200bp paired-end reads.
Data filtering and assembly
The low-quality reads, duplicated sequences, poly-N (reads with unknown nucleotides), and adaptor sequences were removed. The clean reads were mapped to the maize B73 genome (AGPv4) (ftp://ftp.ncbi.nlm.nih.gov/genomes/genbank/plant/Zea_mays/latest_assembly_versions/GCA_000005005.6_B73_RefGen_v4) (Schnable et al., 2009). The TopHat 2 tool was used to conduct the final transcriptome assembly as described by Kim et al. (2013). The fragments per kilobase million mapped reads (FPKM) were calculated based on the method described by Trapnell et al. (2010). All sequence data were stored in the GenBank Short Read Archive and could be accessible with the accession number PRJNA849728.
The genes with low FPKM values (FPKM< 1) were removed first to obtain the candidate genes. Then, the R package (R 4.1.2) (https://cran.r-projet.org/bin/windows/base/) and RStudio Desktop (2022.02.1-461) (https://www.rstudio.com/products/rstudio/download/) were downloaded and installed. The candidate genes’ variance between different samples was calculated using the var function based on the R language server. At last, the top 32% of genes with a maximum level of variance were collected for the following analysis using the quantile function.
WGCNA analysis
The WGCNA analysis was performed using the method described by Langfelder and Horvath (2008). In detail, the pick-Soft Threshold function command was executed to evaluate the distribution of the quantity matrix and confirm the appropriate power value. Then the adjacency matrix and topological matrix were created based on the calculation of Pearson’s correlations among all genes. Accordingly, the one-step network construction and module detection were conducted to classify the gene modules by marking modules with different colors. The automatic merging function combined the similar modules and obtained the ultimate modules. To get the key module correlated to the anthocyanin biosynthesis in the pericarp, the pigmented pericarp trait value of W039 was specified as “1”, and the transparent pericarp trait value of W042 was set as “0”. The cor order was used to identify the key module related to anthocyanins biosynthesis based on the P-value of the Module-trait relationship. The hub genes were identified based on gene annotation, expression pattern, and gene network analysis. The gene network was displayed using Cytoscape v.3.9.1.
Metabolism pathway analysis of genes in the key module
To identify the genes associated with the flavonoid biosynthesis pathway, the cDNA sequences of genes in the key module were uploaded to Mercator V3.6 online tools (https://www.plabipd.de/portal/mercator-sequence-annotation) to get root file. The log function calculates the Log Base 2 of the FPKM value. Then, the average values at 15, 20, and 25 DAP were obtained for every gene. The log of the fold changes between W039 and W042 was calculated to present blocks with different colors in mapped target pathways using MapMan software (Version 3.6.0RC1). The MeV software (Version 4.9.0) displayed the genes’ expression pattern. The cluster heatmap was generated using Manhattan Distance with average linkage clustering.
Yeast one-hybrid experiments
For the yeast one-hybrid experiments, the promoters containing cis-acting elements of ZmDFR and ZmC2 were cloned into the pAbAi vector to construct the pAbAi-baits including proC21-pAbAi, proC22-pAbAi, and proDFR-pABAi (Table S3). Then, they were all transformed into Saccharomyces cerevisiae strain Y1HGold, respectively. The cDNA pool with flanking end sequences of transcription factor ZmLc and the prey vector pGADT7 vector were separately co-transformed into Y1HGolds containing pAbAi-baits. At last, the transformed cells were cultured in a Synthetic Defined (SD) medium without leucine at 28°C for three days.
Results
Phenotypic analysis of anthocyanins in pericarps of two inbred lines
In the experiment, two inbred lines, W039 and W042, were obtained. In contrast with the transparent pericarp of W042, the W039 presented dark purple and contained higher anthocyanins content in its pericarp (Figure 1A, B).
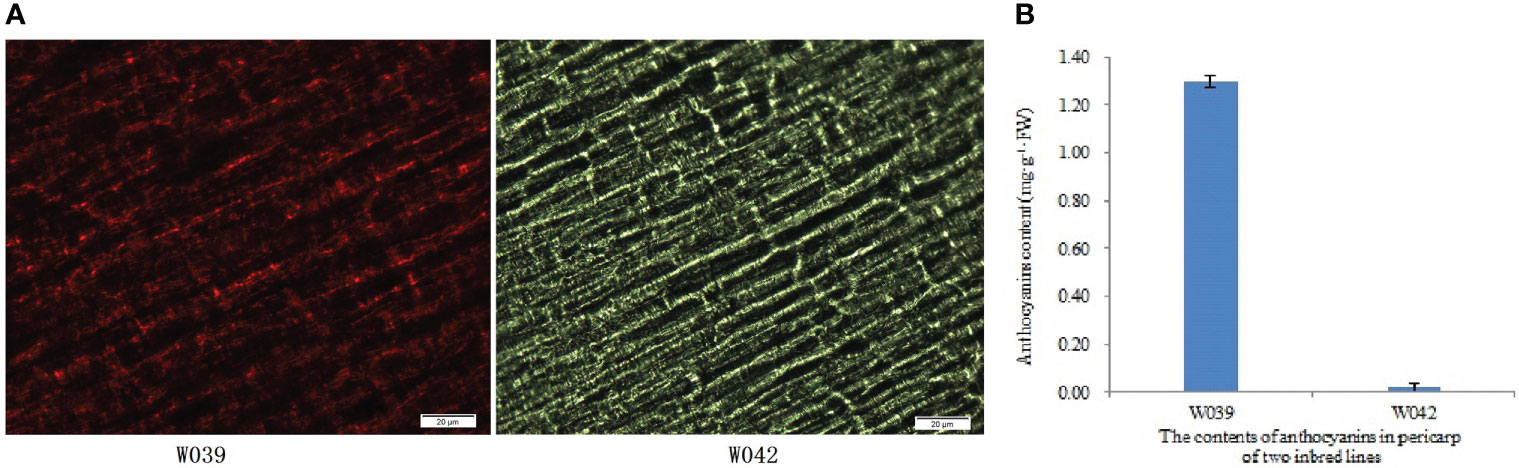
Figure 1 Phenotypic analysis and anthocyanins contents in pericarps of inbred lines W039 and W042. The letter (A) indicated the phenotypic observation results. The letter (B) showed the anthocyanins content in the pericarps of inbred lines W039 and W042.
Summary of transcriptome data
The pericarps from the seeds of two inbred lines at 15, 20, and 25 DAP were used to construct cDNA libraries. The RNA-seq result showed that 110.01 million raw reads were obtained for six samples, with three biological replicates for each (Table 1). After removing low-quality reads, 110.01 million clean reads with 161.94 Gb clean bases were isolated, for which the Q30 value was > 91.67%, and the range content was 53.85-57.60%. The 84.21-86.39% of the clean reads were mapped to the reference genome. The ratios of multiple mapped reads were from 1.85% to 3.01%. The proportions of uniquely mapped reads were over 82%. As a result, 51407 genes were eventually identified for the subsequent analysis (Table S1).
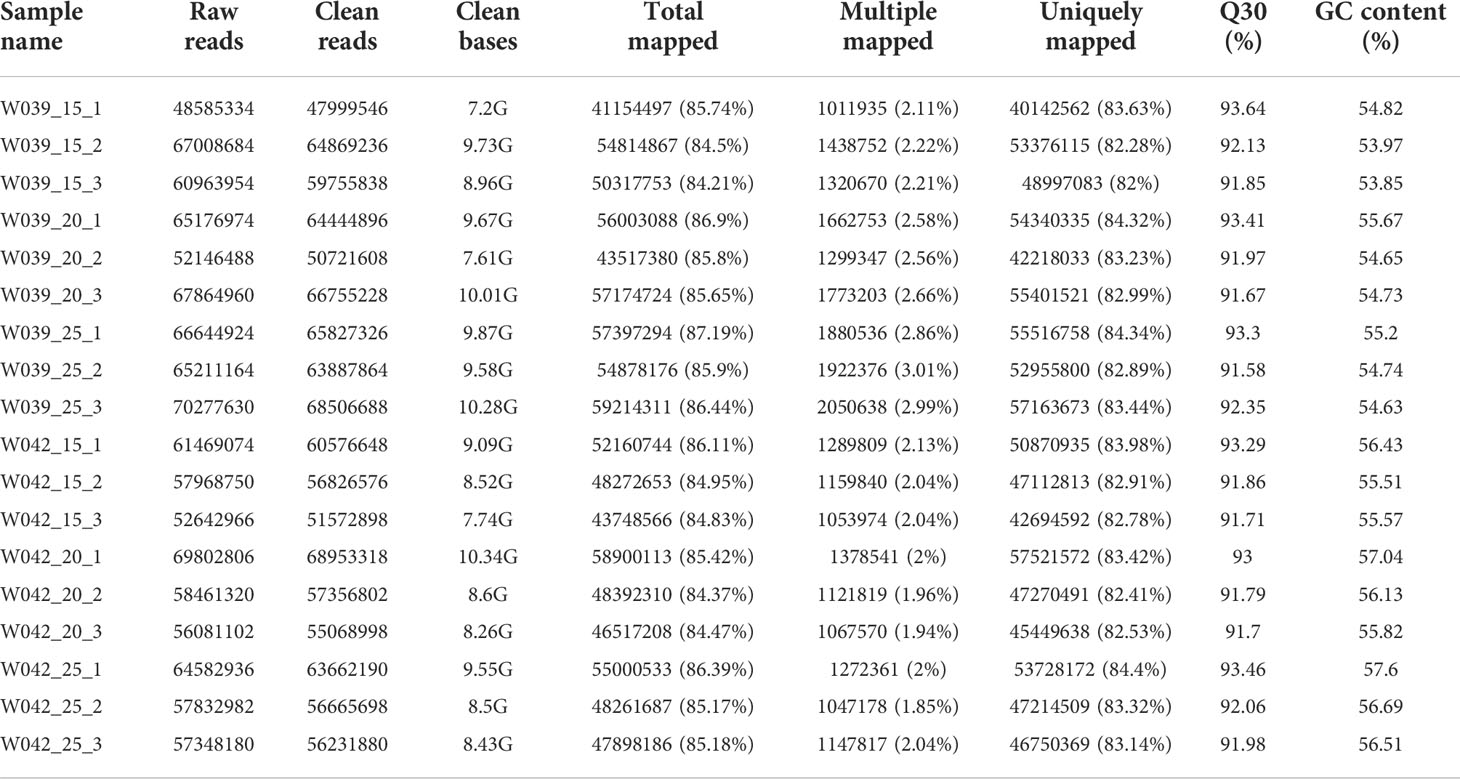
Table 1 Summary of transcriptome analysis results for pericarps of inbred lines W039 and W056.
Isolation of candidate genes for WGCNA
The R package was used for quantitative analysis to acquire the possible candidate genes and expression patterns. The var function was executed to calculate all genes’ variance between different samples. The top 32% of genes with a maximum level of variance were collected for the following analysis using quantile function. Finally, 2057 candidate genes were acquired for the subsequent analysis (Table S2).
Classification of modules for candidate genes
The WGCNA was conducted to uncover key modules and hub genes using 2057 candidate genes. Based on the soft-thresholding power of 14, the weighted adjacency matrix was created and then transformed into a topological overlap matrix (TOM). All candidate genes were clustered into different modules with similar expression profiles according to the TOM-based dissimilarity measure. The Dynamic Tree Cut with 30 of minModuleSize resulted that 2057 candidate genes being grouped into 23 modules. The eigengenes and dissimilarity of module eigengenes were calculated to cluster similar modules. Using the merging function, 23 modules were eventually combined into ten modules. Among these modules, black and blue modules contained 102 and 678 genes, respectively. The Cyan and greenyellow modules have 183 and 75 genes individually. The grey60 module and lightgreen separately include 314 and 43 genes. The magenta, midnightblue and pink modules were composed of 301, 219, and 137 genes, respectively (Figure 2).
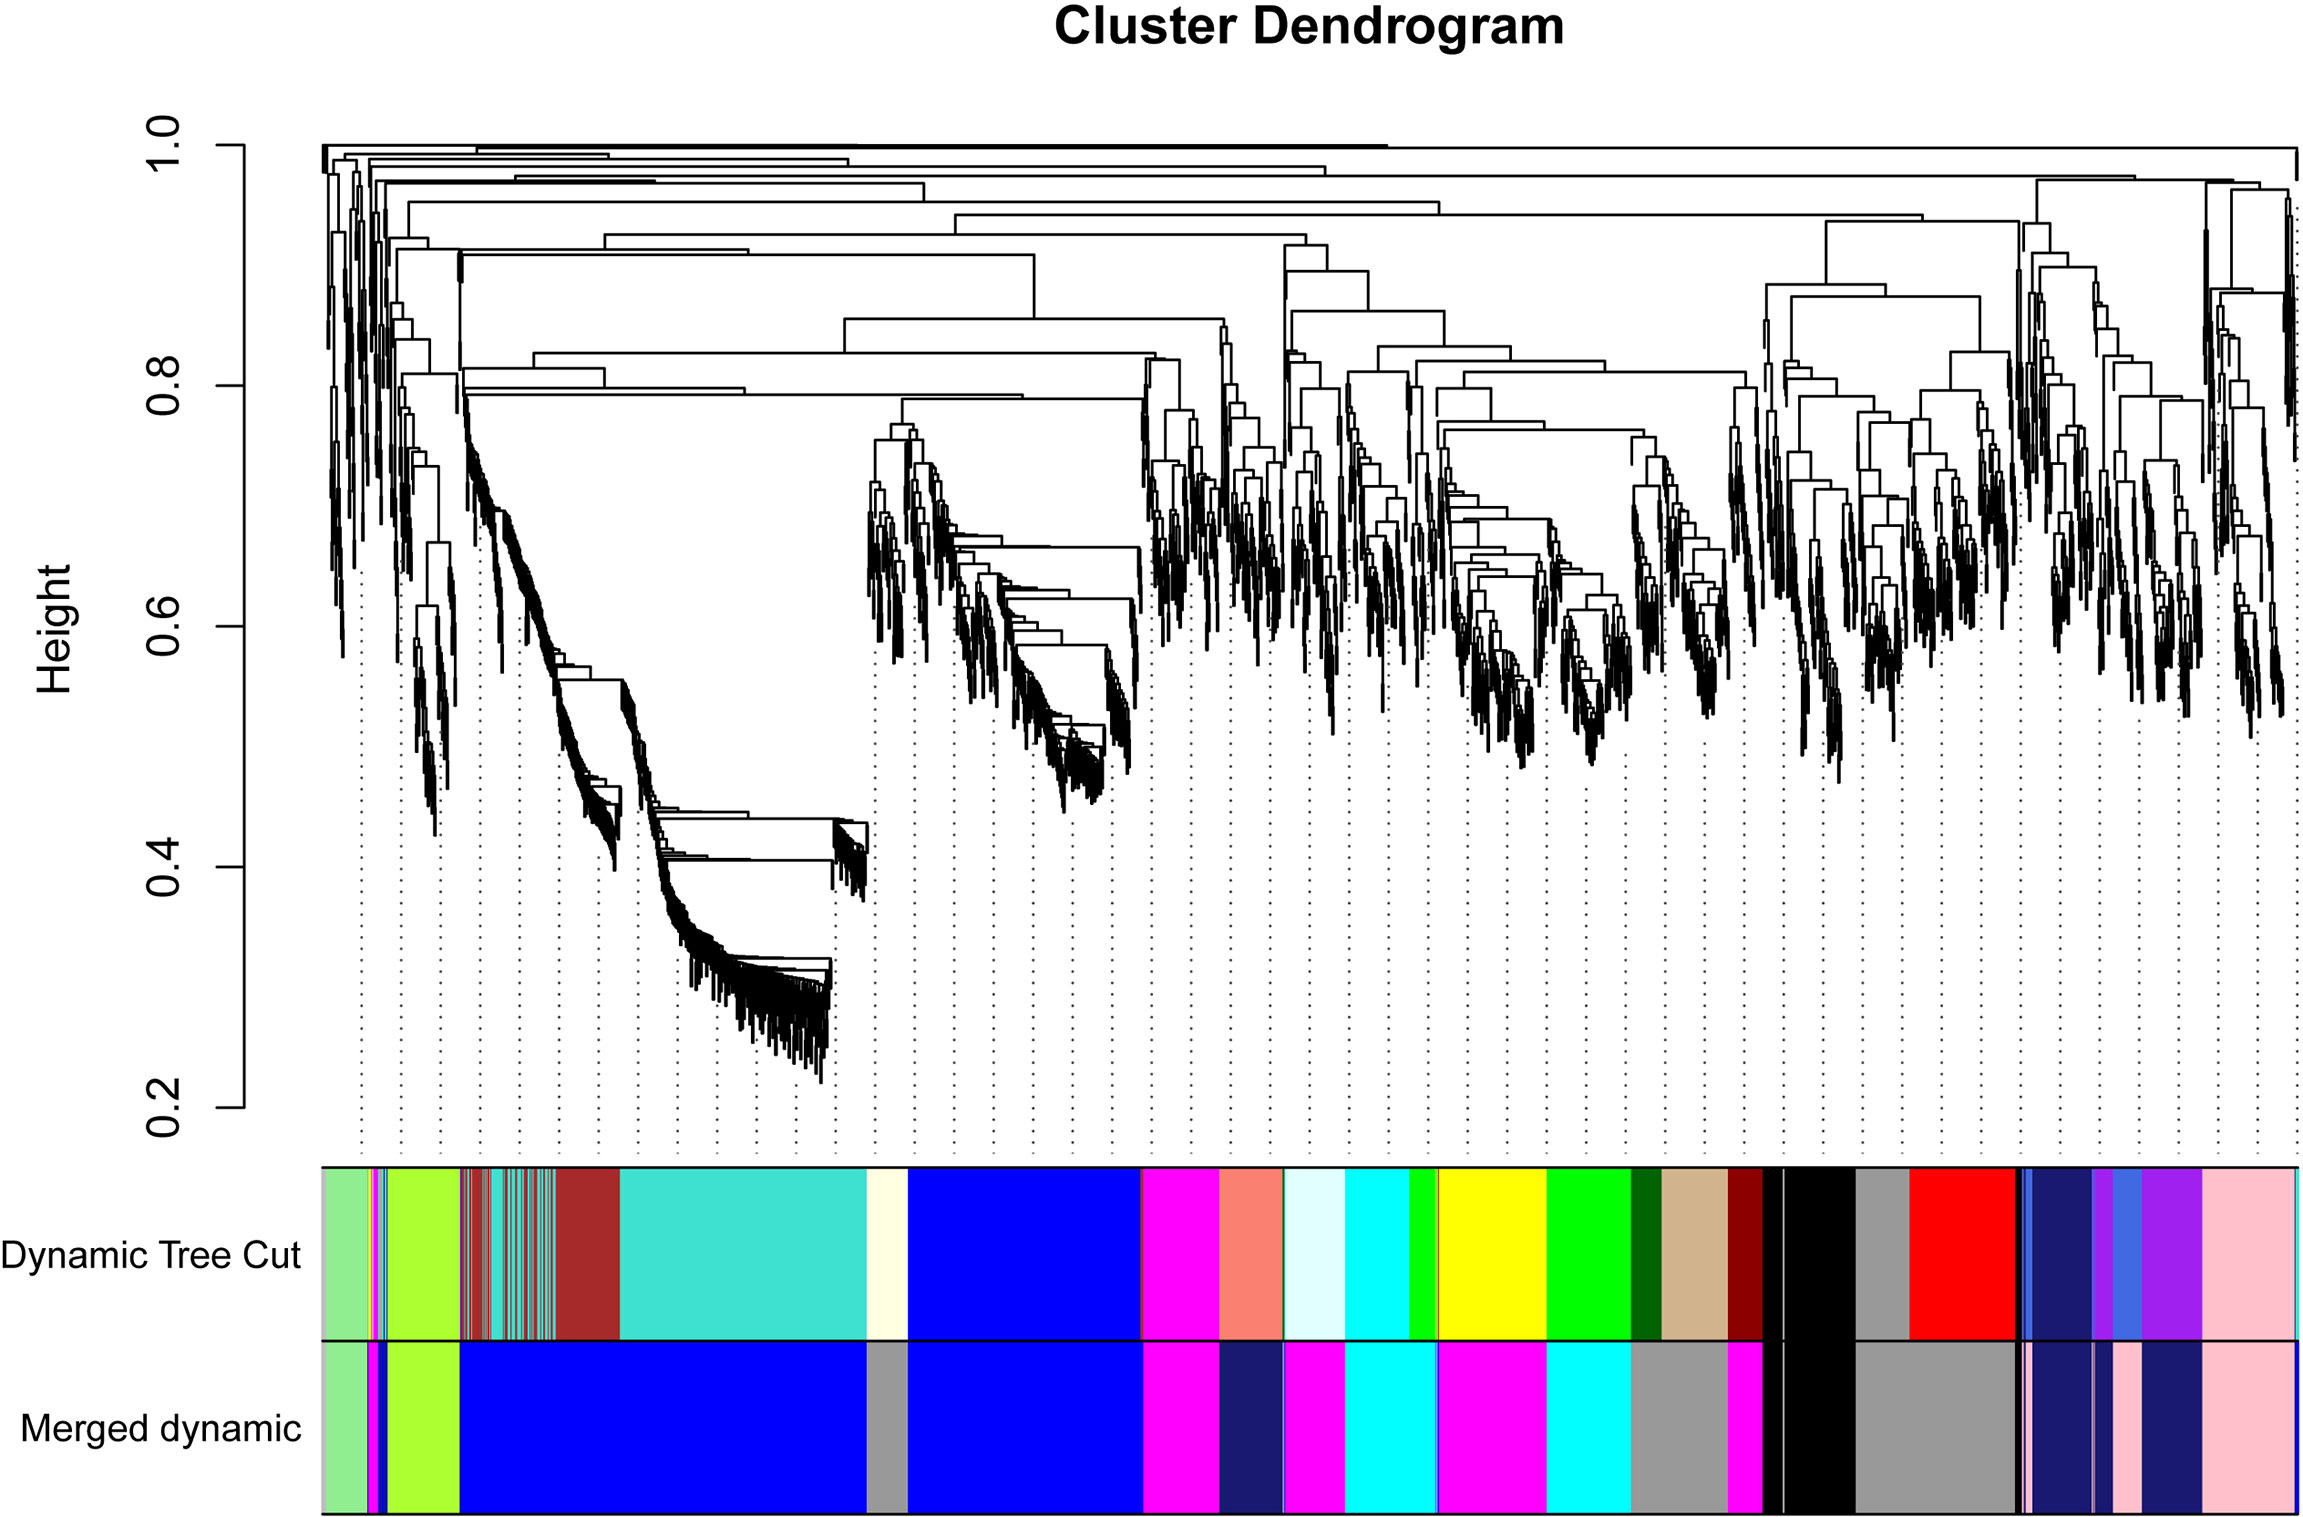
Figure 2 Dendrogram of all 2057 candidate genes clustered based on a dissimilarity measure (1-TOM). The minModuleSize was 30. The MEDissThres was set as 0.2. Different colors displayed the different modules. Each leaf in the tree represented one gene. The major tree branches are originally composed of 23 modules and eventually merged into 10 modules. Each color represented one module.
Identification of key modules related to anthocyanins biosynthesis
The module-trait relationships were analyzed using the cor function to obtain the key module and hub genes related to the anthocyanins biosynthesis in the pericarp. The pigmented pericarp trait value of W039 was specified as “1”, and the transparent pericarp trait value of W042 was set as “0”. Based on the Pearson correlation between the trait and transcriptome data, the cyan module was verified to be the key module with the highest correlation value of 0.98 (Figure 3). The P-value between the trait and both the magenta and grey60 modules accounted for 0.88. To confirm the above result, the Gene Significance (GS) was calculated to exhibit the associations of individual genes (Figure 4). The module membership (MM) was used to display the correlation between the gene expression profile and module eigengene. Then the intramodular analysis was conducted using the GS and MM measures. The result showed that ten modules showed different correlations with the trait. Among all modules, the cyan and magenta modules have a high correlation ratio with anthocyanins biosynthesis (Figure 4). Relationship analysis between module eigengenes demonstrated that the cyan module was closely related to the grey60 module and magenta module (Figure 5). Otherwise, the eigengene expression pattern and the module expression heatmap were plotted using the plotMat function. As is shown in Figure 6, ten modules exhibited distinct eigengene expression patterns and module expression heatmap. Only three modules, cyan, grey60, and magenta, were in accord with the samples at the different development stages. In contrast with grey60 and magenta, the eigengene was positively expressed in pigmented pericarp and negatively expressed in transparent pericarp, which was in accord with the anthocyanins biosynthesis in the tissue. These results confirmed that the cyan module was the key module, which was involved in anthocyanins biosynthesis.
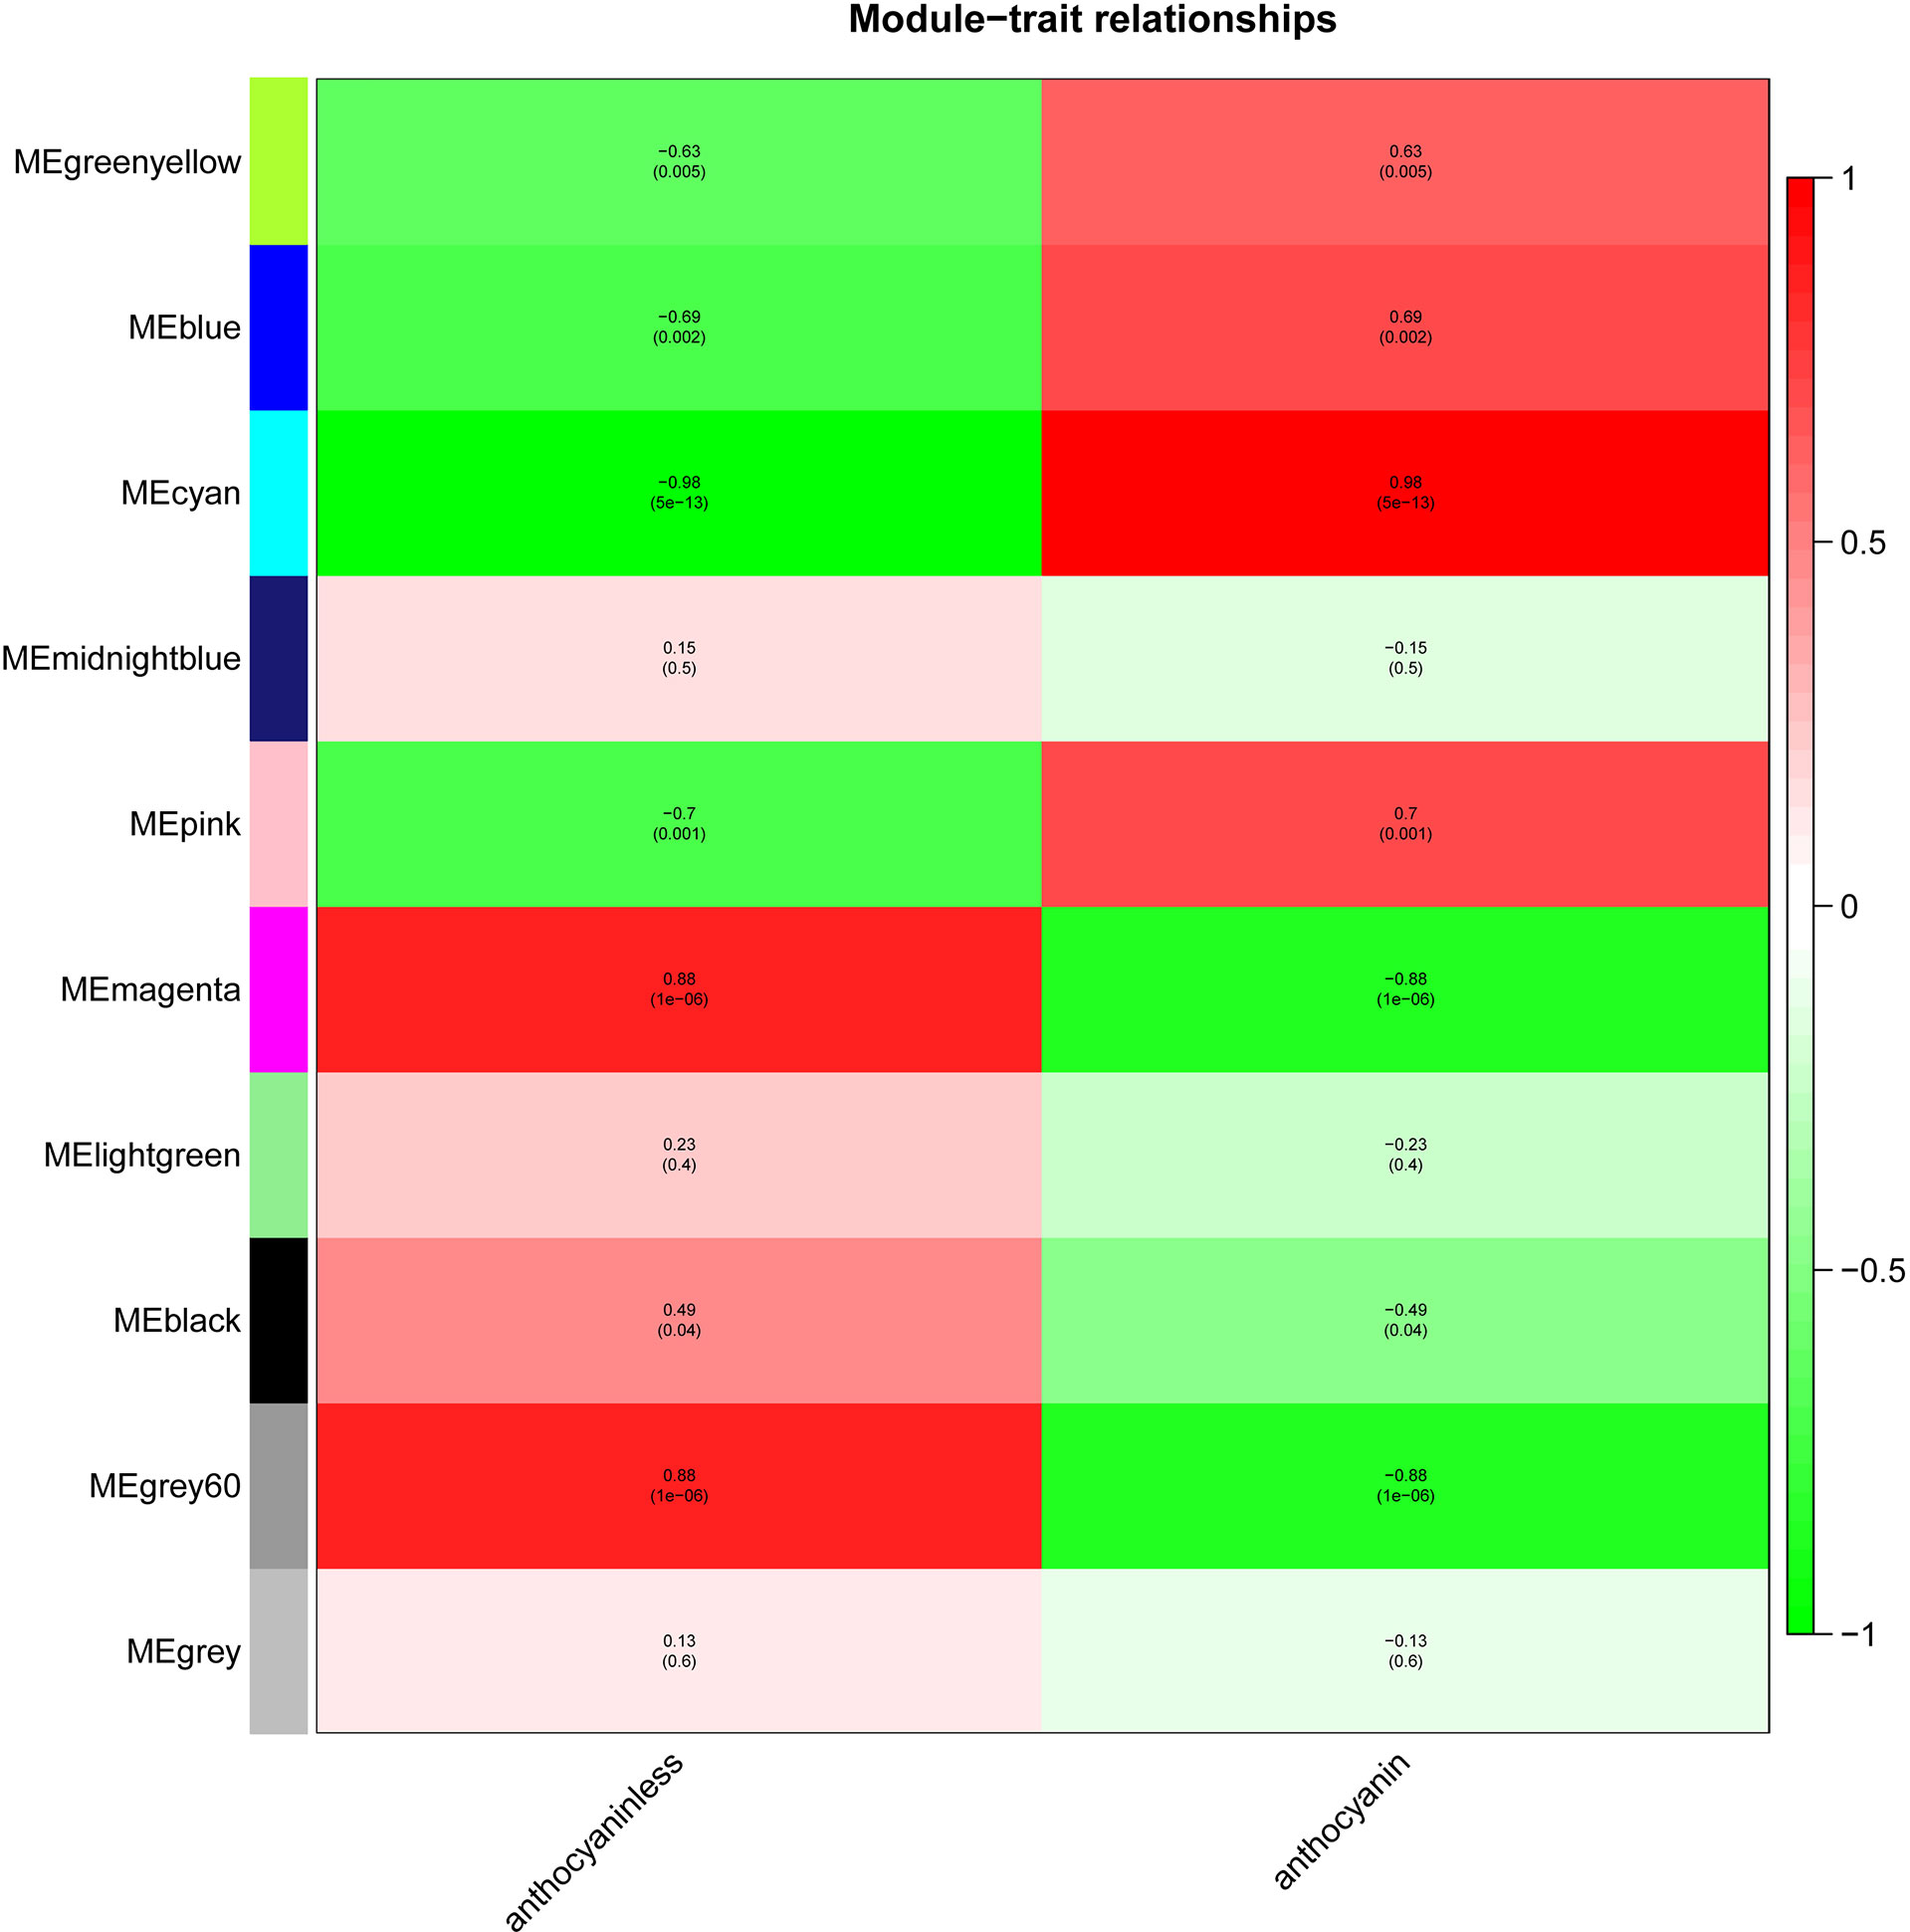
Figure 3 The module-trait relationship between transparent and anthocyanins biosynthesis pericarps. The anthocyanin indicated the pericarp with anthocyanin biosynthesis and accumulation. The anthocyaninless represented the transparent pericarp.
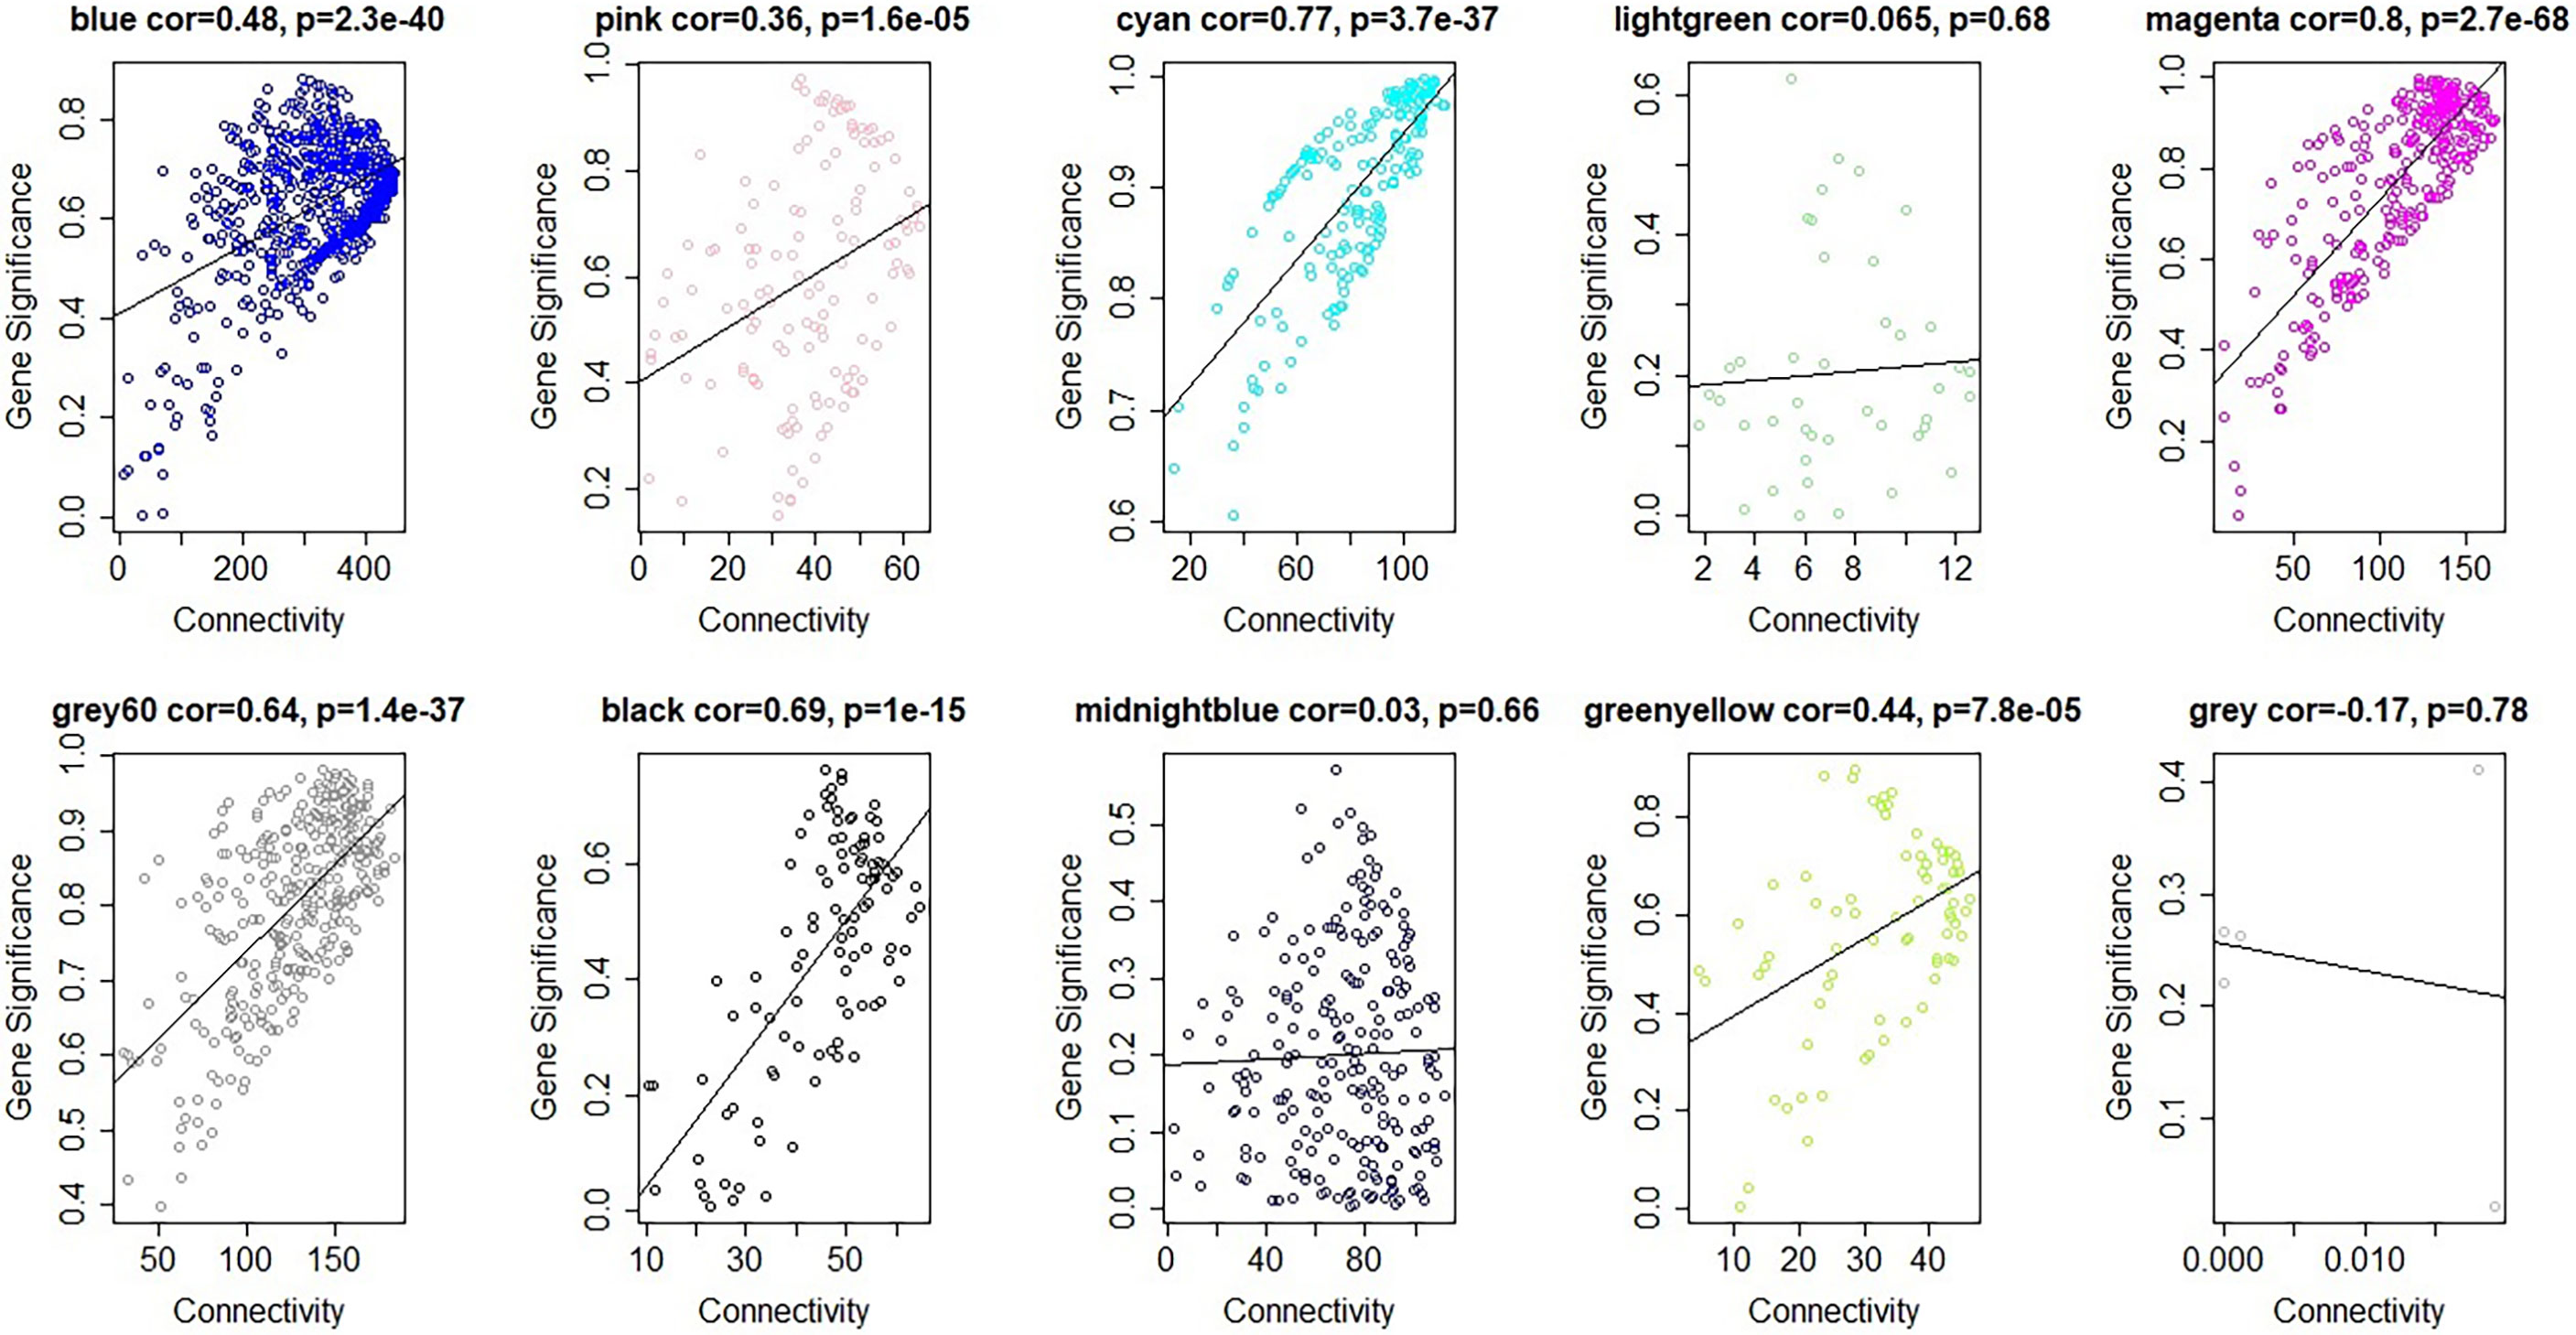
Figure 4 Gene significance vs intramodular connectivity plotted for ten modules. The y-axis indicated the Gene significance, the x-axis displayed the intramodular connectivity. The cyan and the magenta module showed that intramodular hub genes tend to have high gene significance.
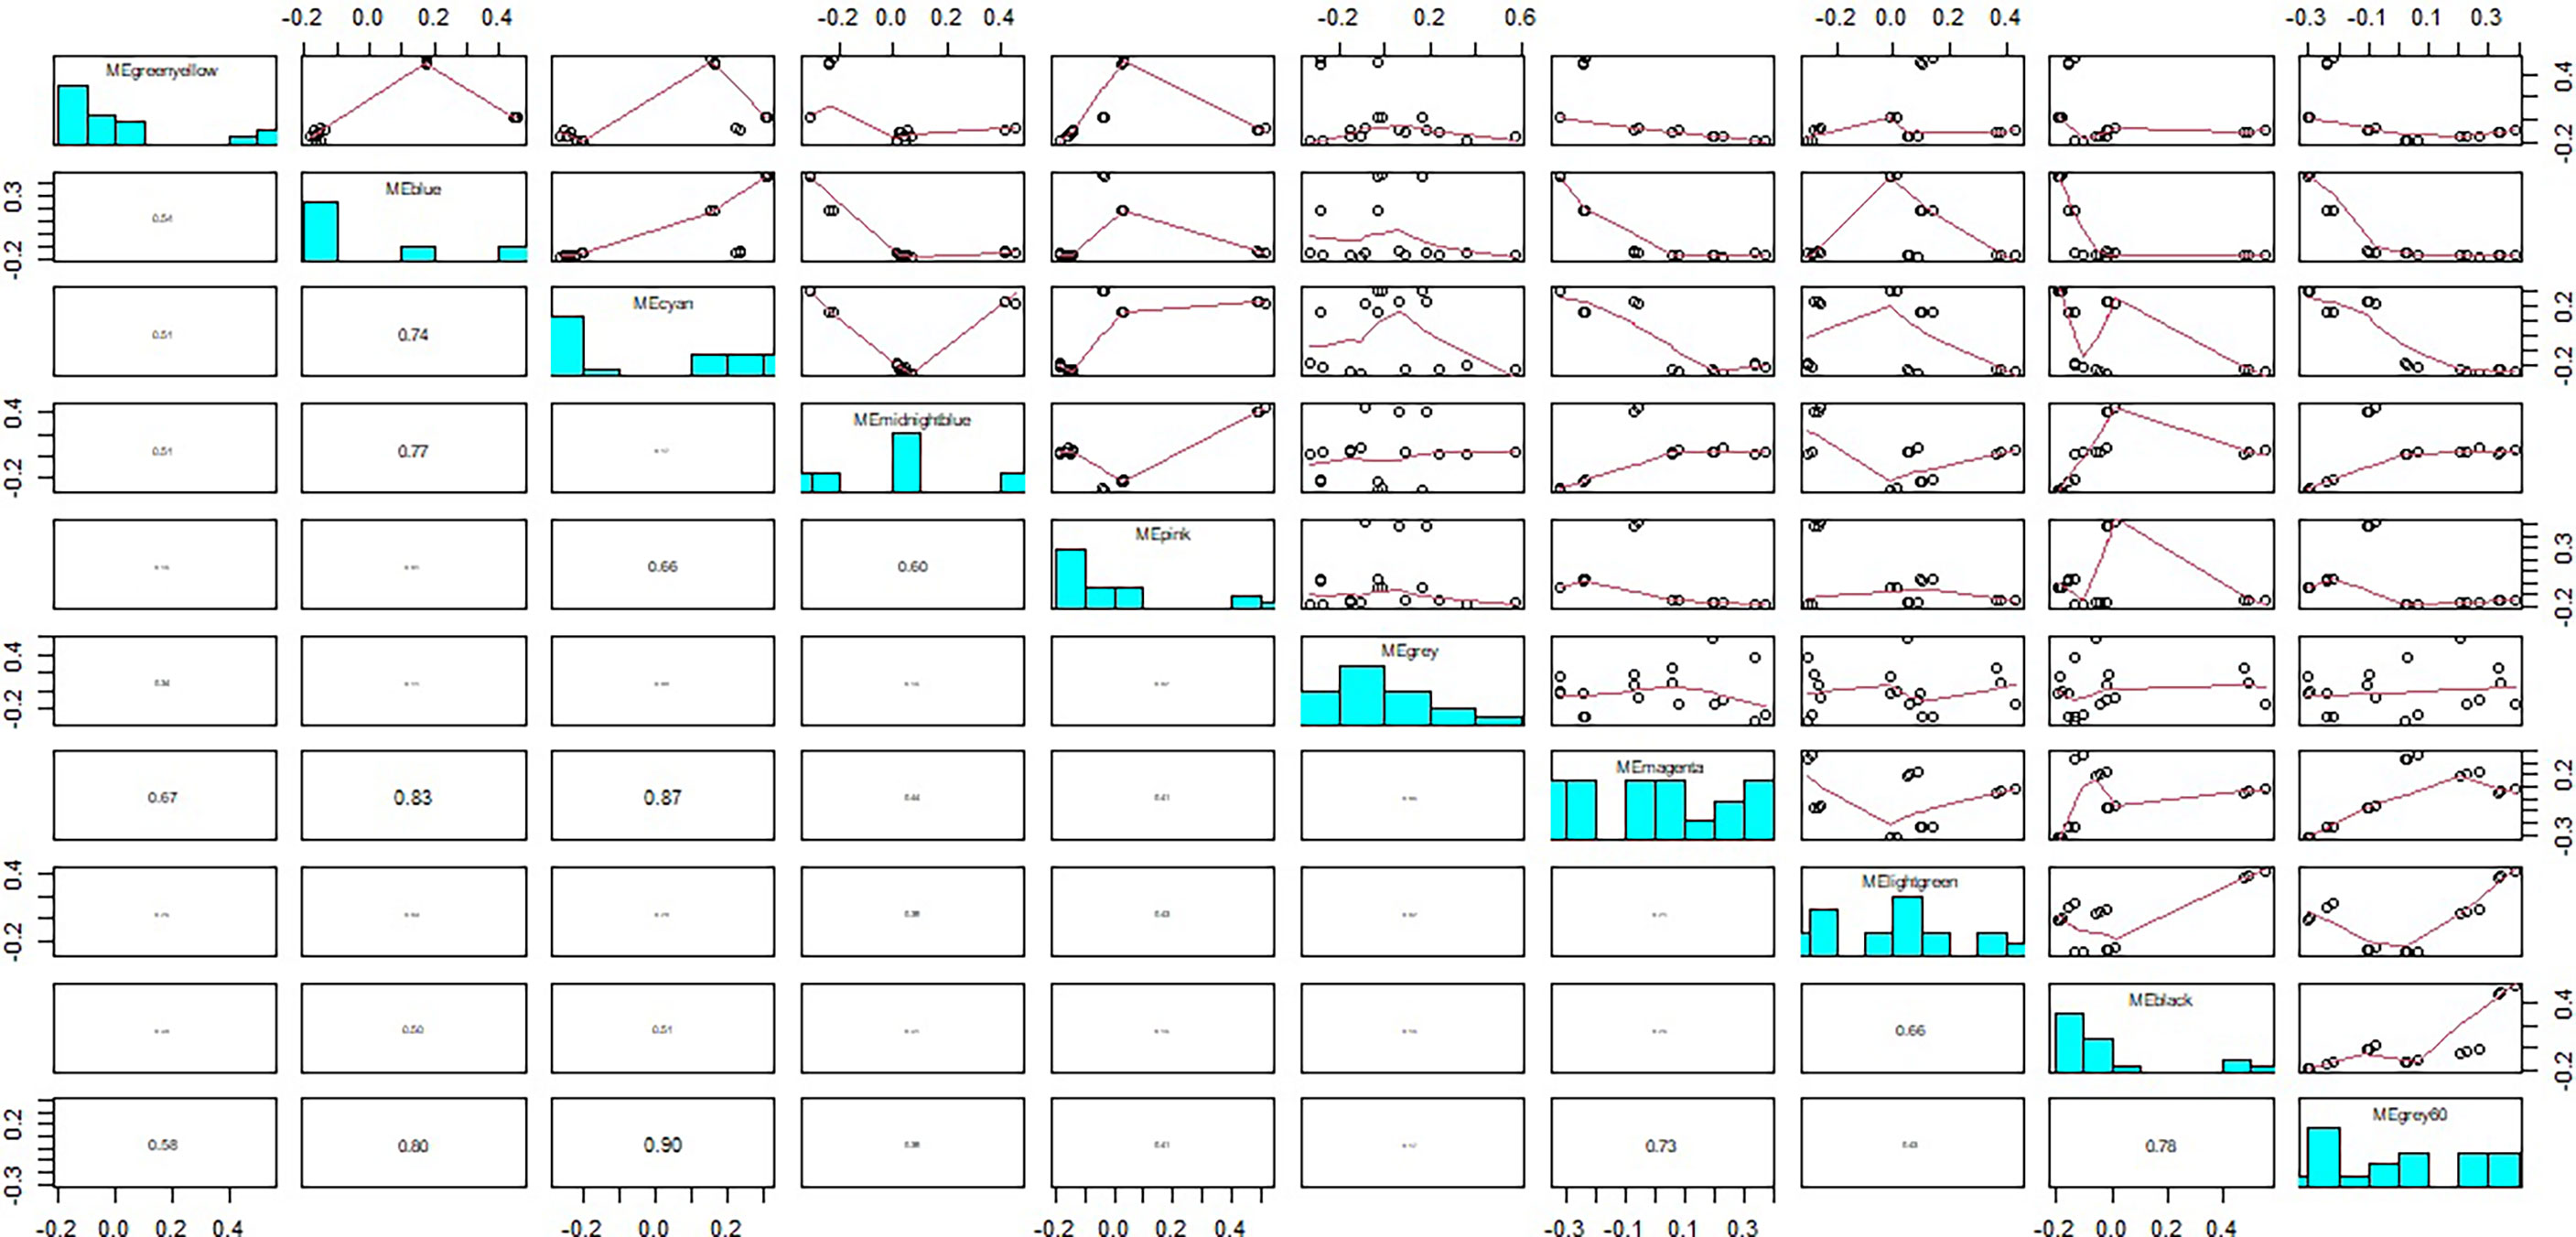
Figure 5 The relationship between module eigengenes. The numbers in column indicated correlation ratios between different modules.
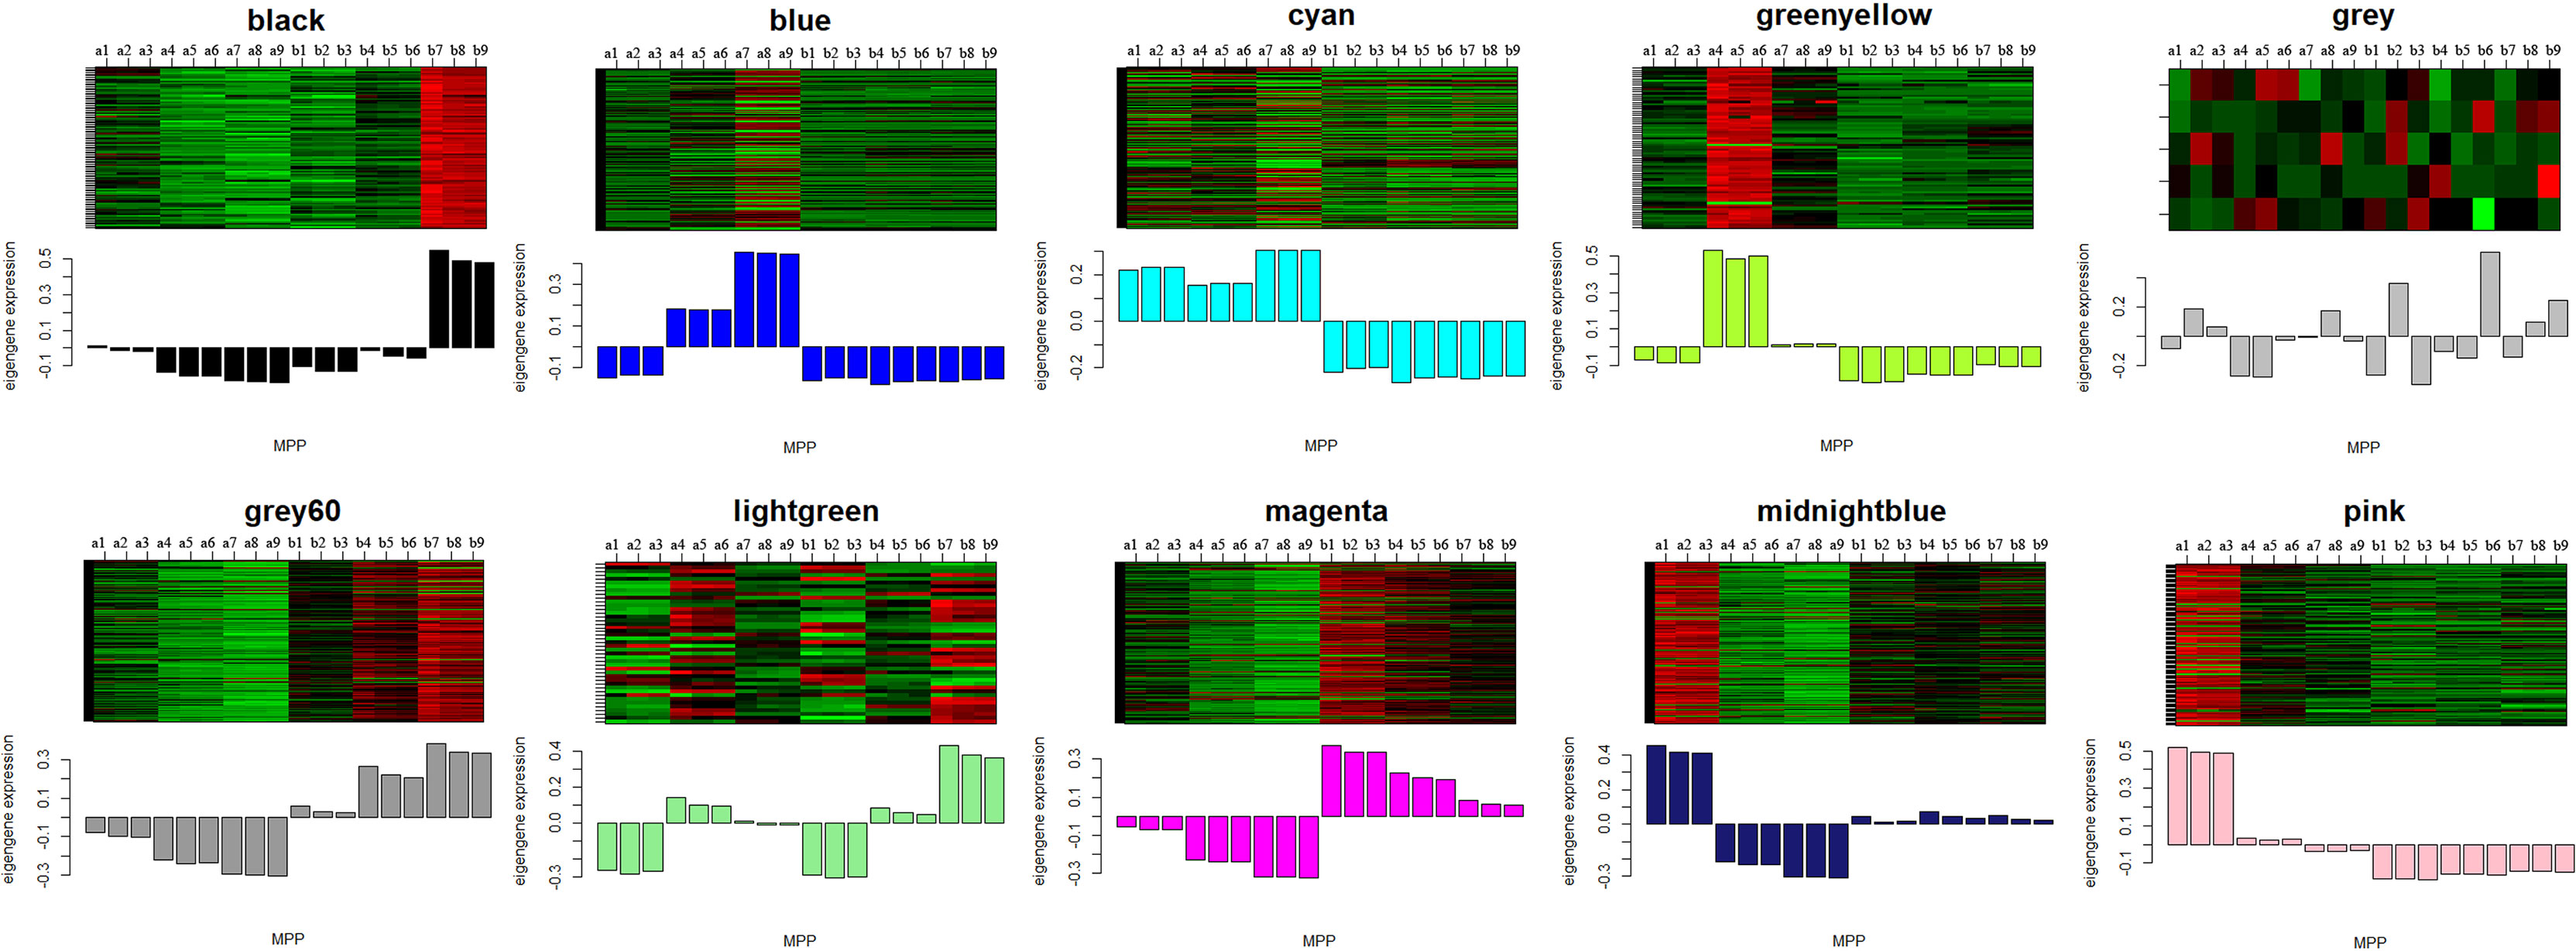
Figure 6 The eigengenes expression patterns and gene expression heatmap across samples for 10 identified modules. In heatmap, the letter a indicated W039, letter b represent W042. The numbers 1, 2 and 3 meant three biological repeats at the 15 DAP stage, 4, 5 and 6 showed three biological repeats at the 20 DAP stage, 7, 8 and 9 represented three biological repeats at the 25 DAP stage.
Identification of hub genes participated in anthocyanins biosynthesis
To identify the hub genes related to anthocyanins biosynthesis, all genes in the cyan module were mapped to the flavonoid biosynthesis pathway using MapMan software. The result showed that eight genes were distributed in the flavonoid biosynthesis pathway and functioned in different sequential steps of the biological process (Figure 7). For example, two genes, Zm00001d003106 and Zm00001d003015, were annotated as Phenylalanine ammonia-lyase (PAL). Zm00001d016471 functioned as Cytochrome P450 (CYP). Zm00001d052673 was the Chalcone synthase (CHS) C2, the key gene in the flavonoid biosynthesis pathway. Zm00001d034625 was marked with Chalcone flavanone isomerase (CHI). Zm00001d001960 was identified as Naringenin, 2-oxoglutarate 3-dioxygenase. Zm00001d044122 and Zm00001d014914 were commented as Dihydroflavonol 4-reductase (DFR) and Leucoanthocyanidin dioxygenase (LDOX), respectively. Moreover, ten transcription factors were isolated from the cyan module, including three members of the DREB subfamily A-1 of the ERF/AP2 transcription factor family (Zm00001d006169, Zm00001d027925, and Zm00001d032295), one bHLH transcription factor (Zm00001d026147), two zinc finger (CCCH-type) family proteins (Zm00001d035455 and Zm00001d034710), one MADS-box transcription factor 3 (Zm00001d039434), one histone superfamily protein (Zm00001d041672), one protein containing methyl-CpG-binding domain (Zm00001d013667), and one multiple stress-responsive zinc-finger protein (Zm00001d006016) (Figure 8). Among those transcription factors, the bHLH transcription factor Zm00001d026147 was annotated as anthocyanin regulatory Lc protein, which was confirmed to directly participate in the regulation of anthocyanins biosynthesis.
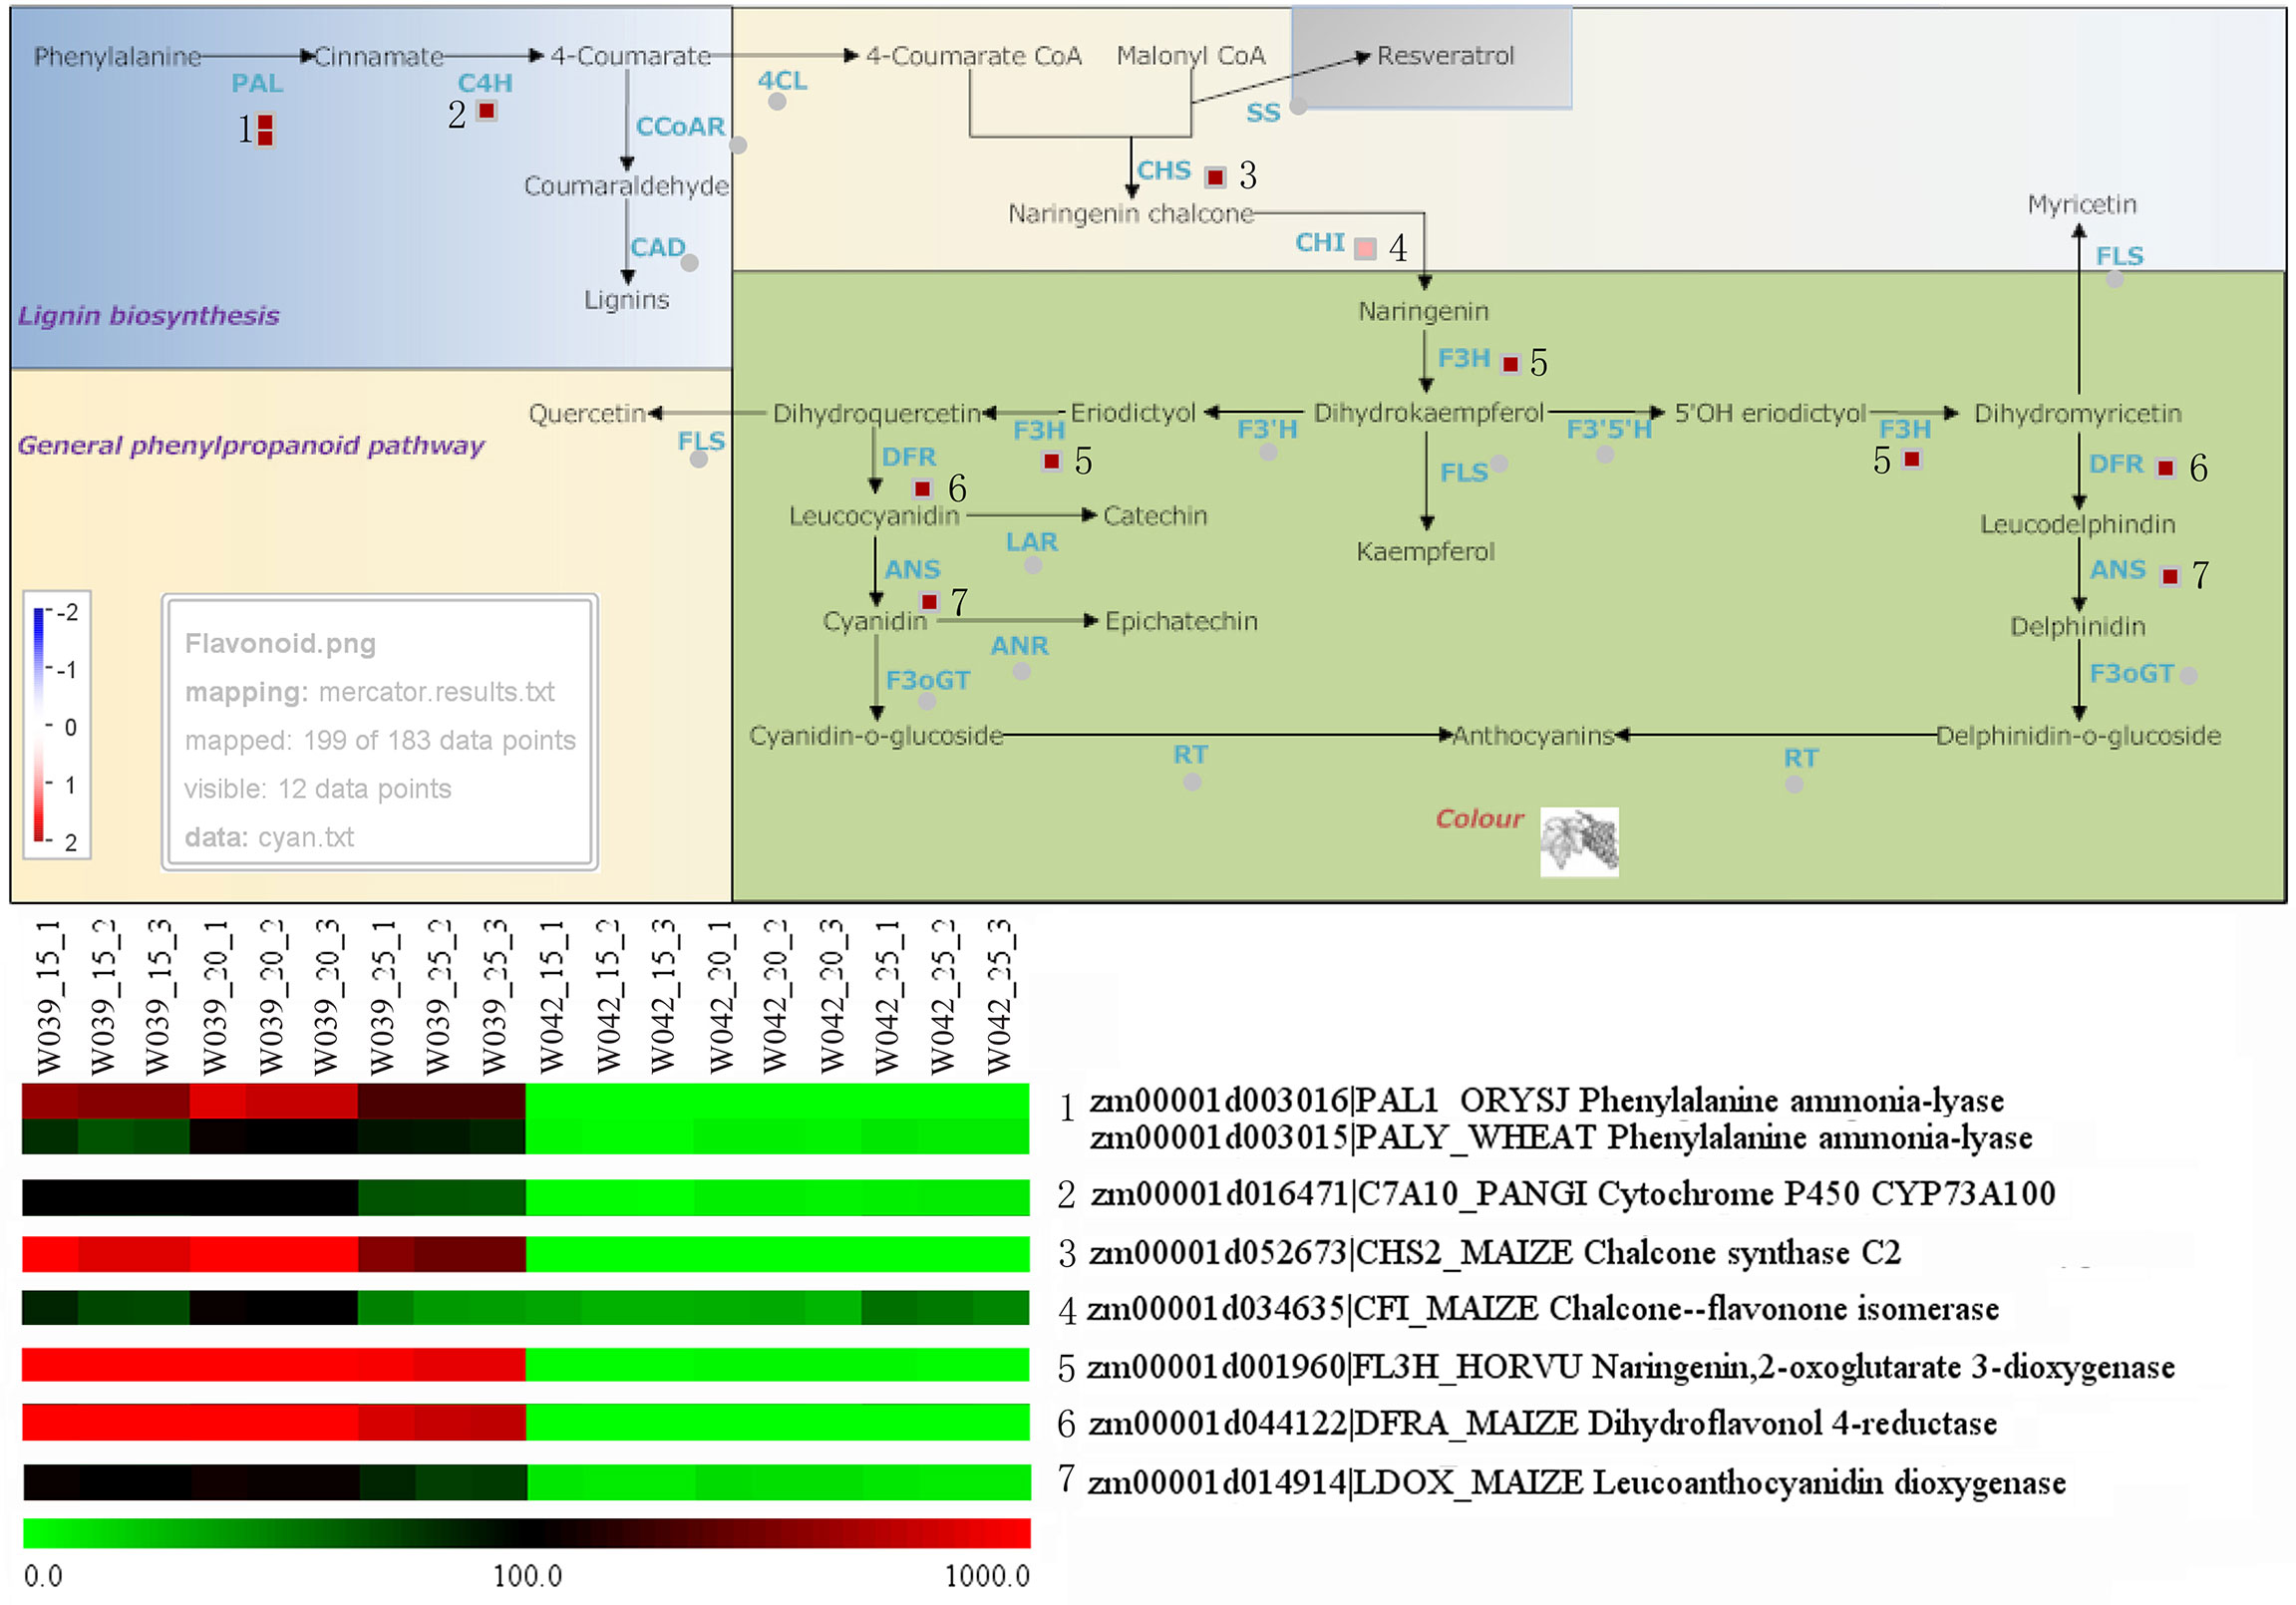
Figure 7 Identification of structural genes related to anthocyanins biosynthesis. The little squares in the pathway represented the LogFC values of W039 vs W042 which were calculated using the average values at 15, 20, and 25 DAP. The listed heatmap exhibited the FPKM value for each gene.
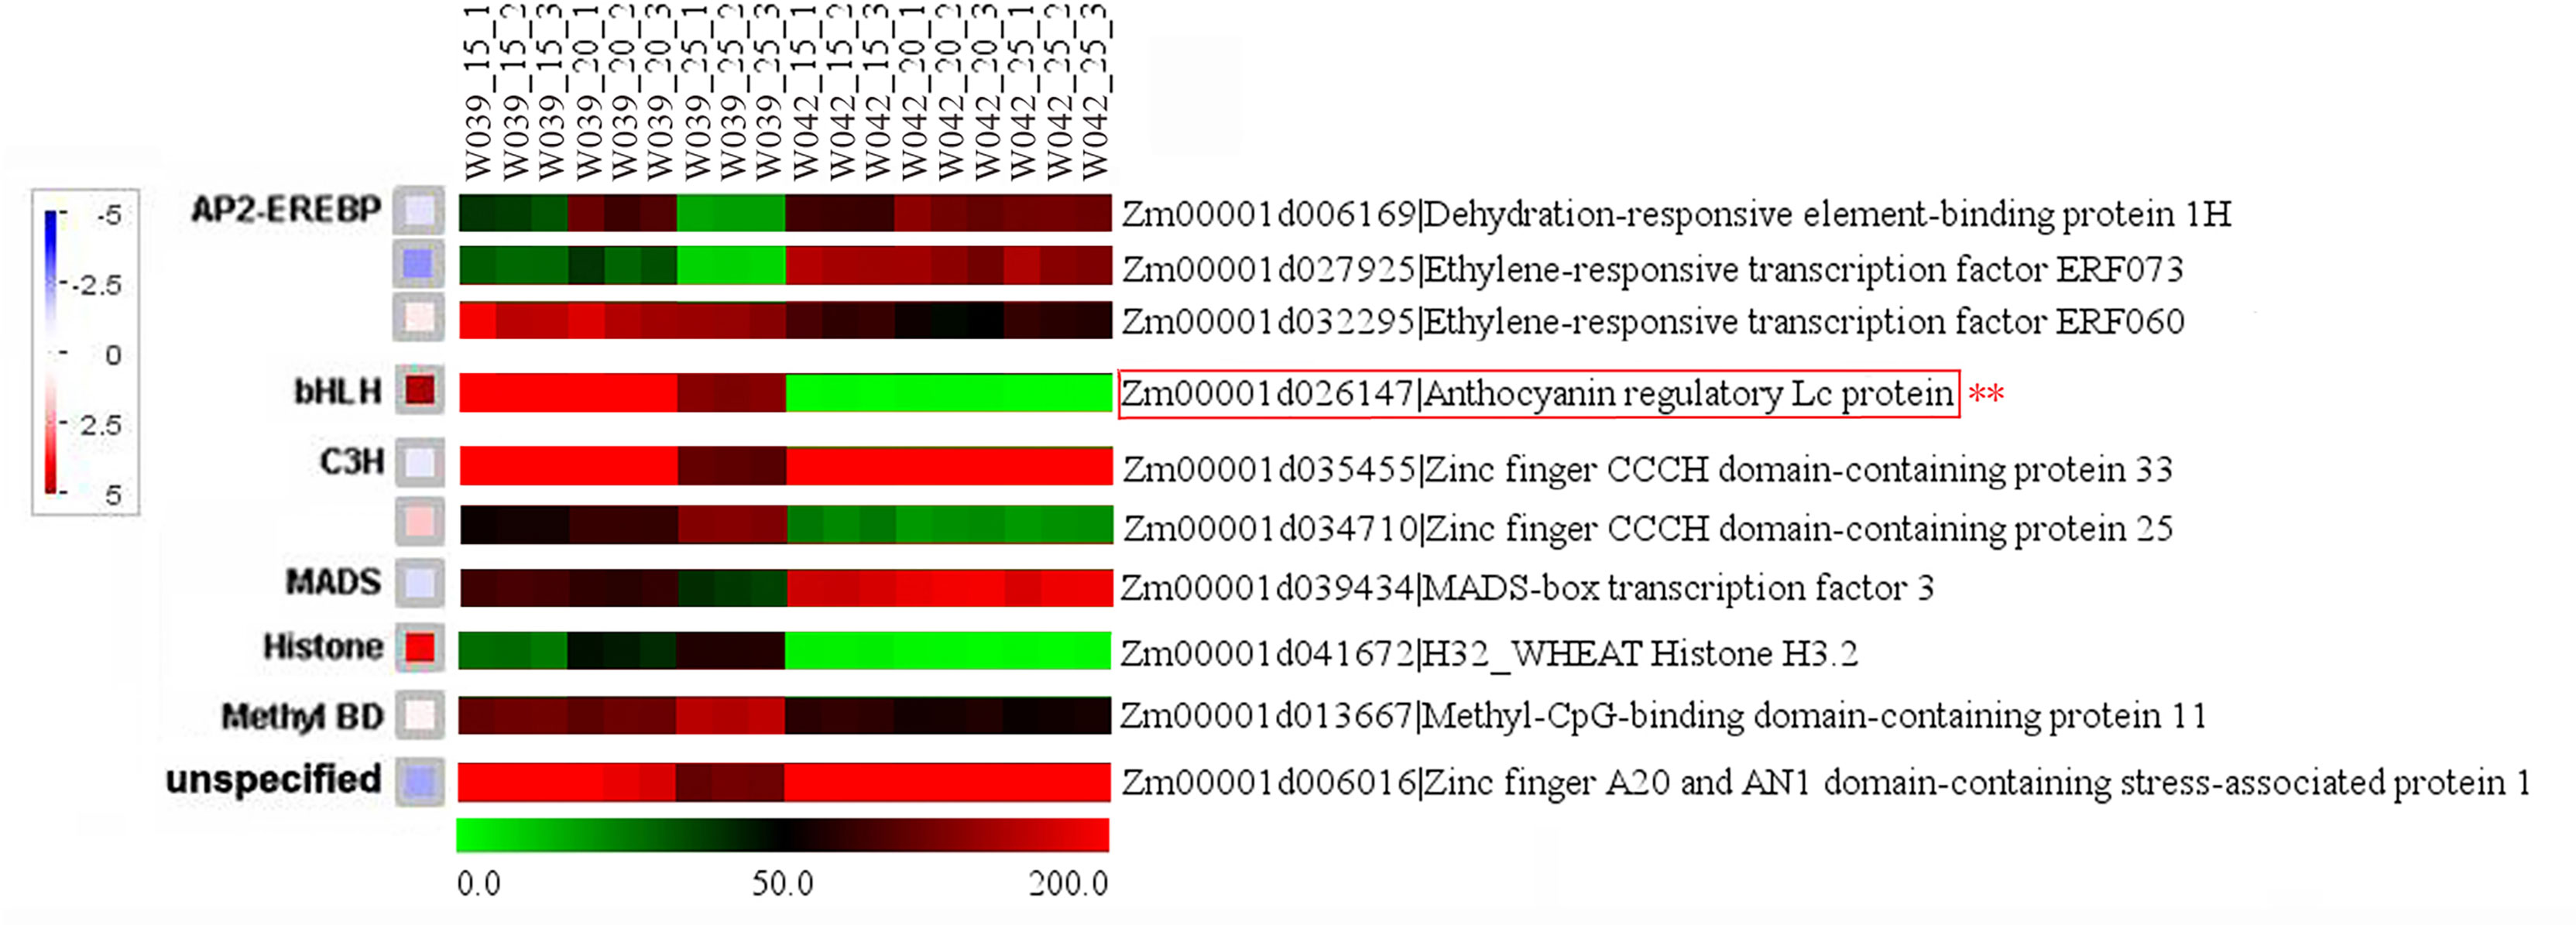
Figure 8 Identification of transcription factors related to anthocyanins biosynthesis. The little squares represented the LogFC values of W039 vs W042 which were calculated using the average values at 15, 20, and 25 DAP. The listed heatmap displayed the FPKM value for each gene..
Verification of hub genes related to anthocyanins biosynthesis
As is shown in Figure 9, the cluster heatmap was generated to display the genes’ expression matrices in a cyan module using MeV software. The result showed that Naringenin, 2-oxoglutarate 3-dioxygenase (Zm00001d001960), Dihydroflavonol 4-reductase (DFR) (Zm00001d044122), Acyl transferase 9 (AcT9) (Zm00001d039535), Zm00001d040028 (unknown), Leucoanthocyanidin dioxygenase (LDOX) (Zm00001d014914), Lc (Zm00001d026147), and Chalcone synthase (CHS) C2 (Zm00001d052673) were categorized to one group. Among those genes, Naringenin, 2-oxoglutarate 3-dioxygenase (Zm00001d001960), Dihydroflavonol 4-reductase (DFR) (Zm00001d044122), Leucoanthocyanidin dioxygenase (LDOX) (Zm00001d014914), Lc (Zm00001d026147), and Chalcone synthase (CHS) C2 (Zm00001d052673) were all participated in the anthocyanins biosynthesis. Gene network analysis revealed that the transcription factor Zm00001d026147 act on the genes Zm00001d052673 and Zm00001d044122 (Figure 10). The yeast one-hybrid assays demonstrated that the Lc gene (Zm00001d026147) could combine with the promoter region of C2 (Zm00001d052673), which directly regulated the anthocyanin biosynthesis in the pericarp (Figure 11).
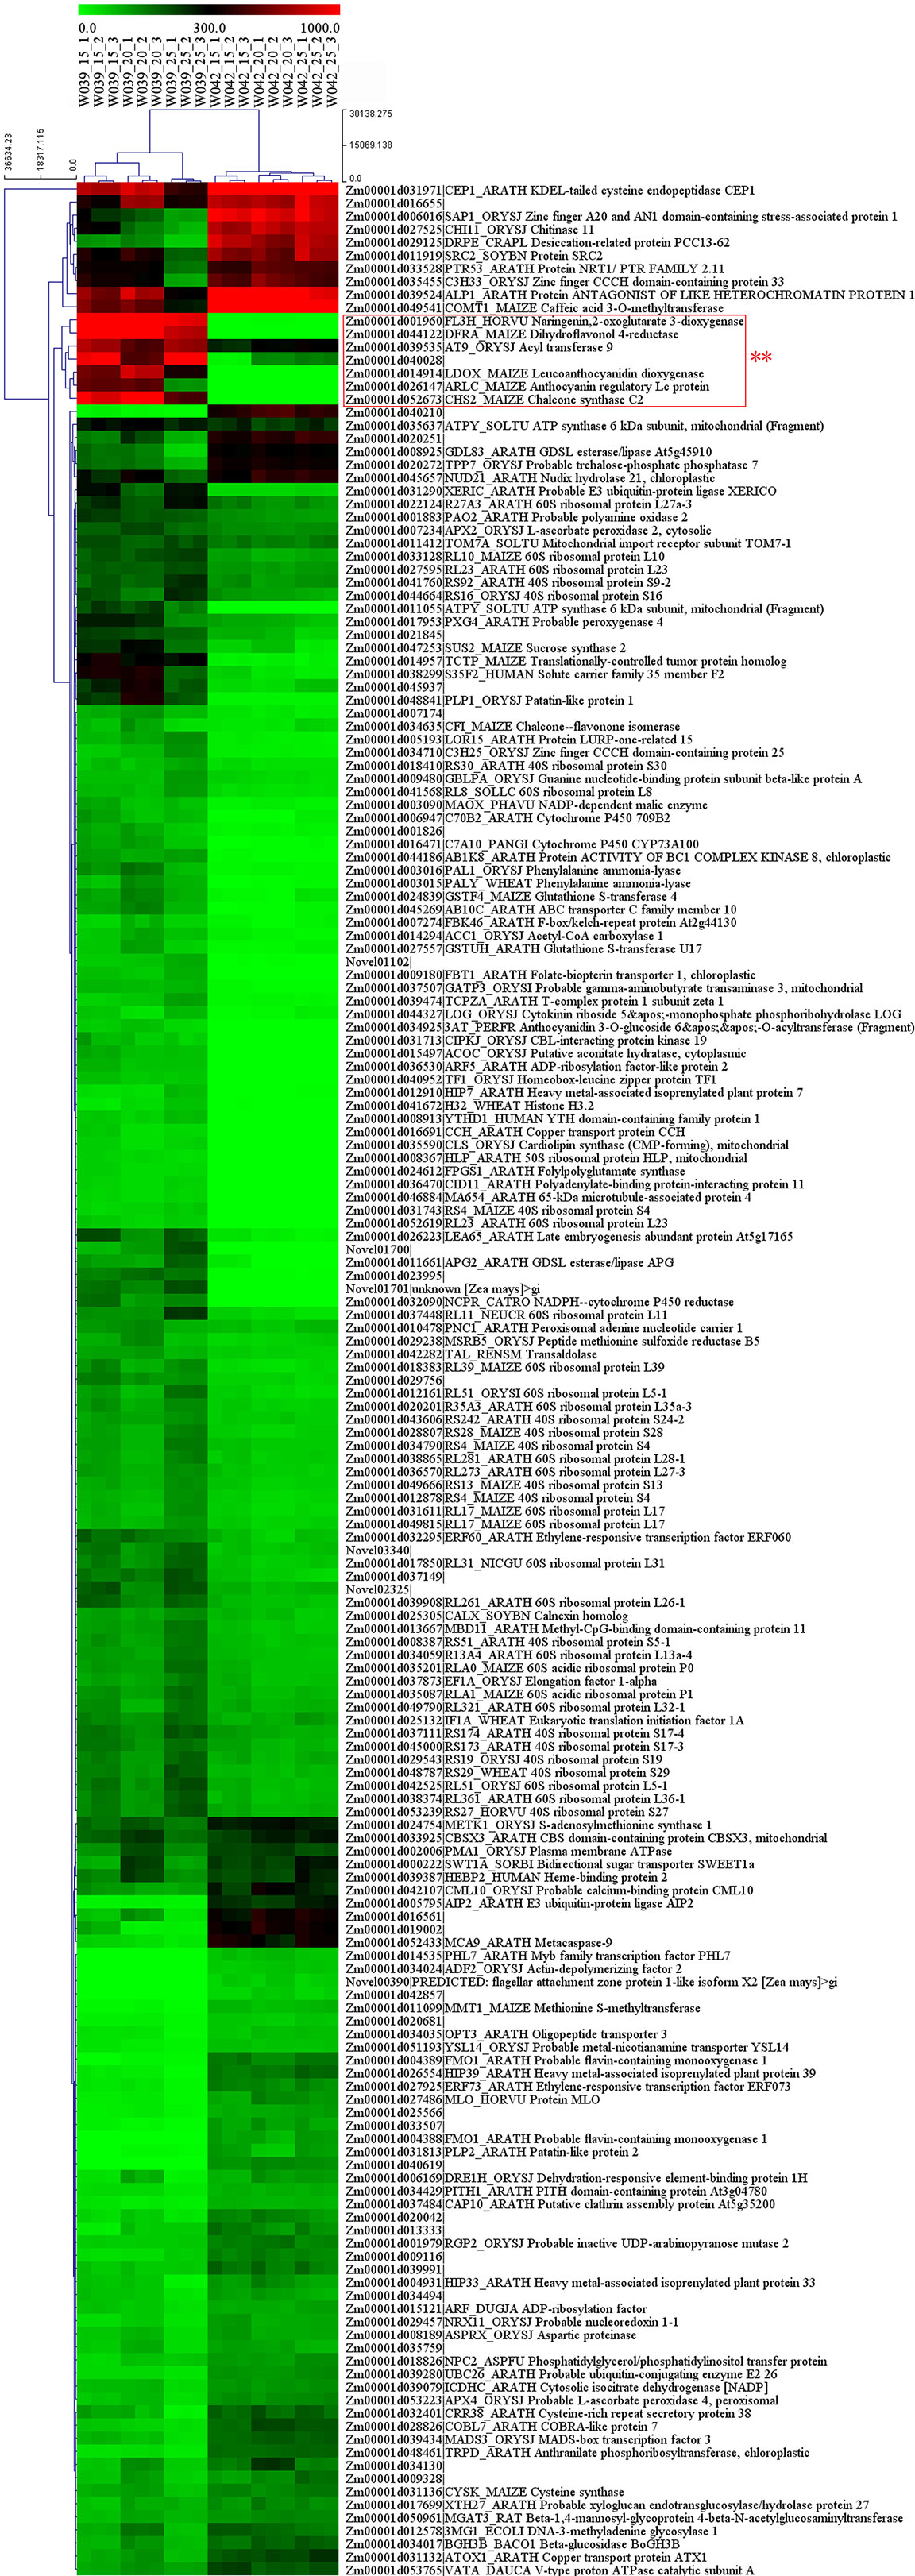
Figure 9 The expression pattern of 183 genes in cyan module. The heatmap represents the FPKM values from RNA sequencing data. The genes in the red square frame marked with double asterisks were categorized to one group and mainly participated in the anthocyanins biosynthesis.
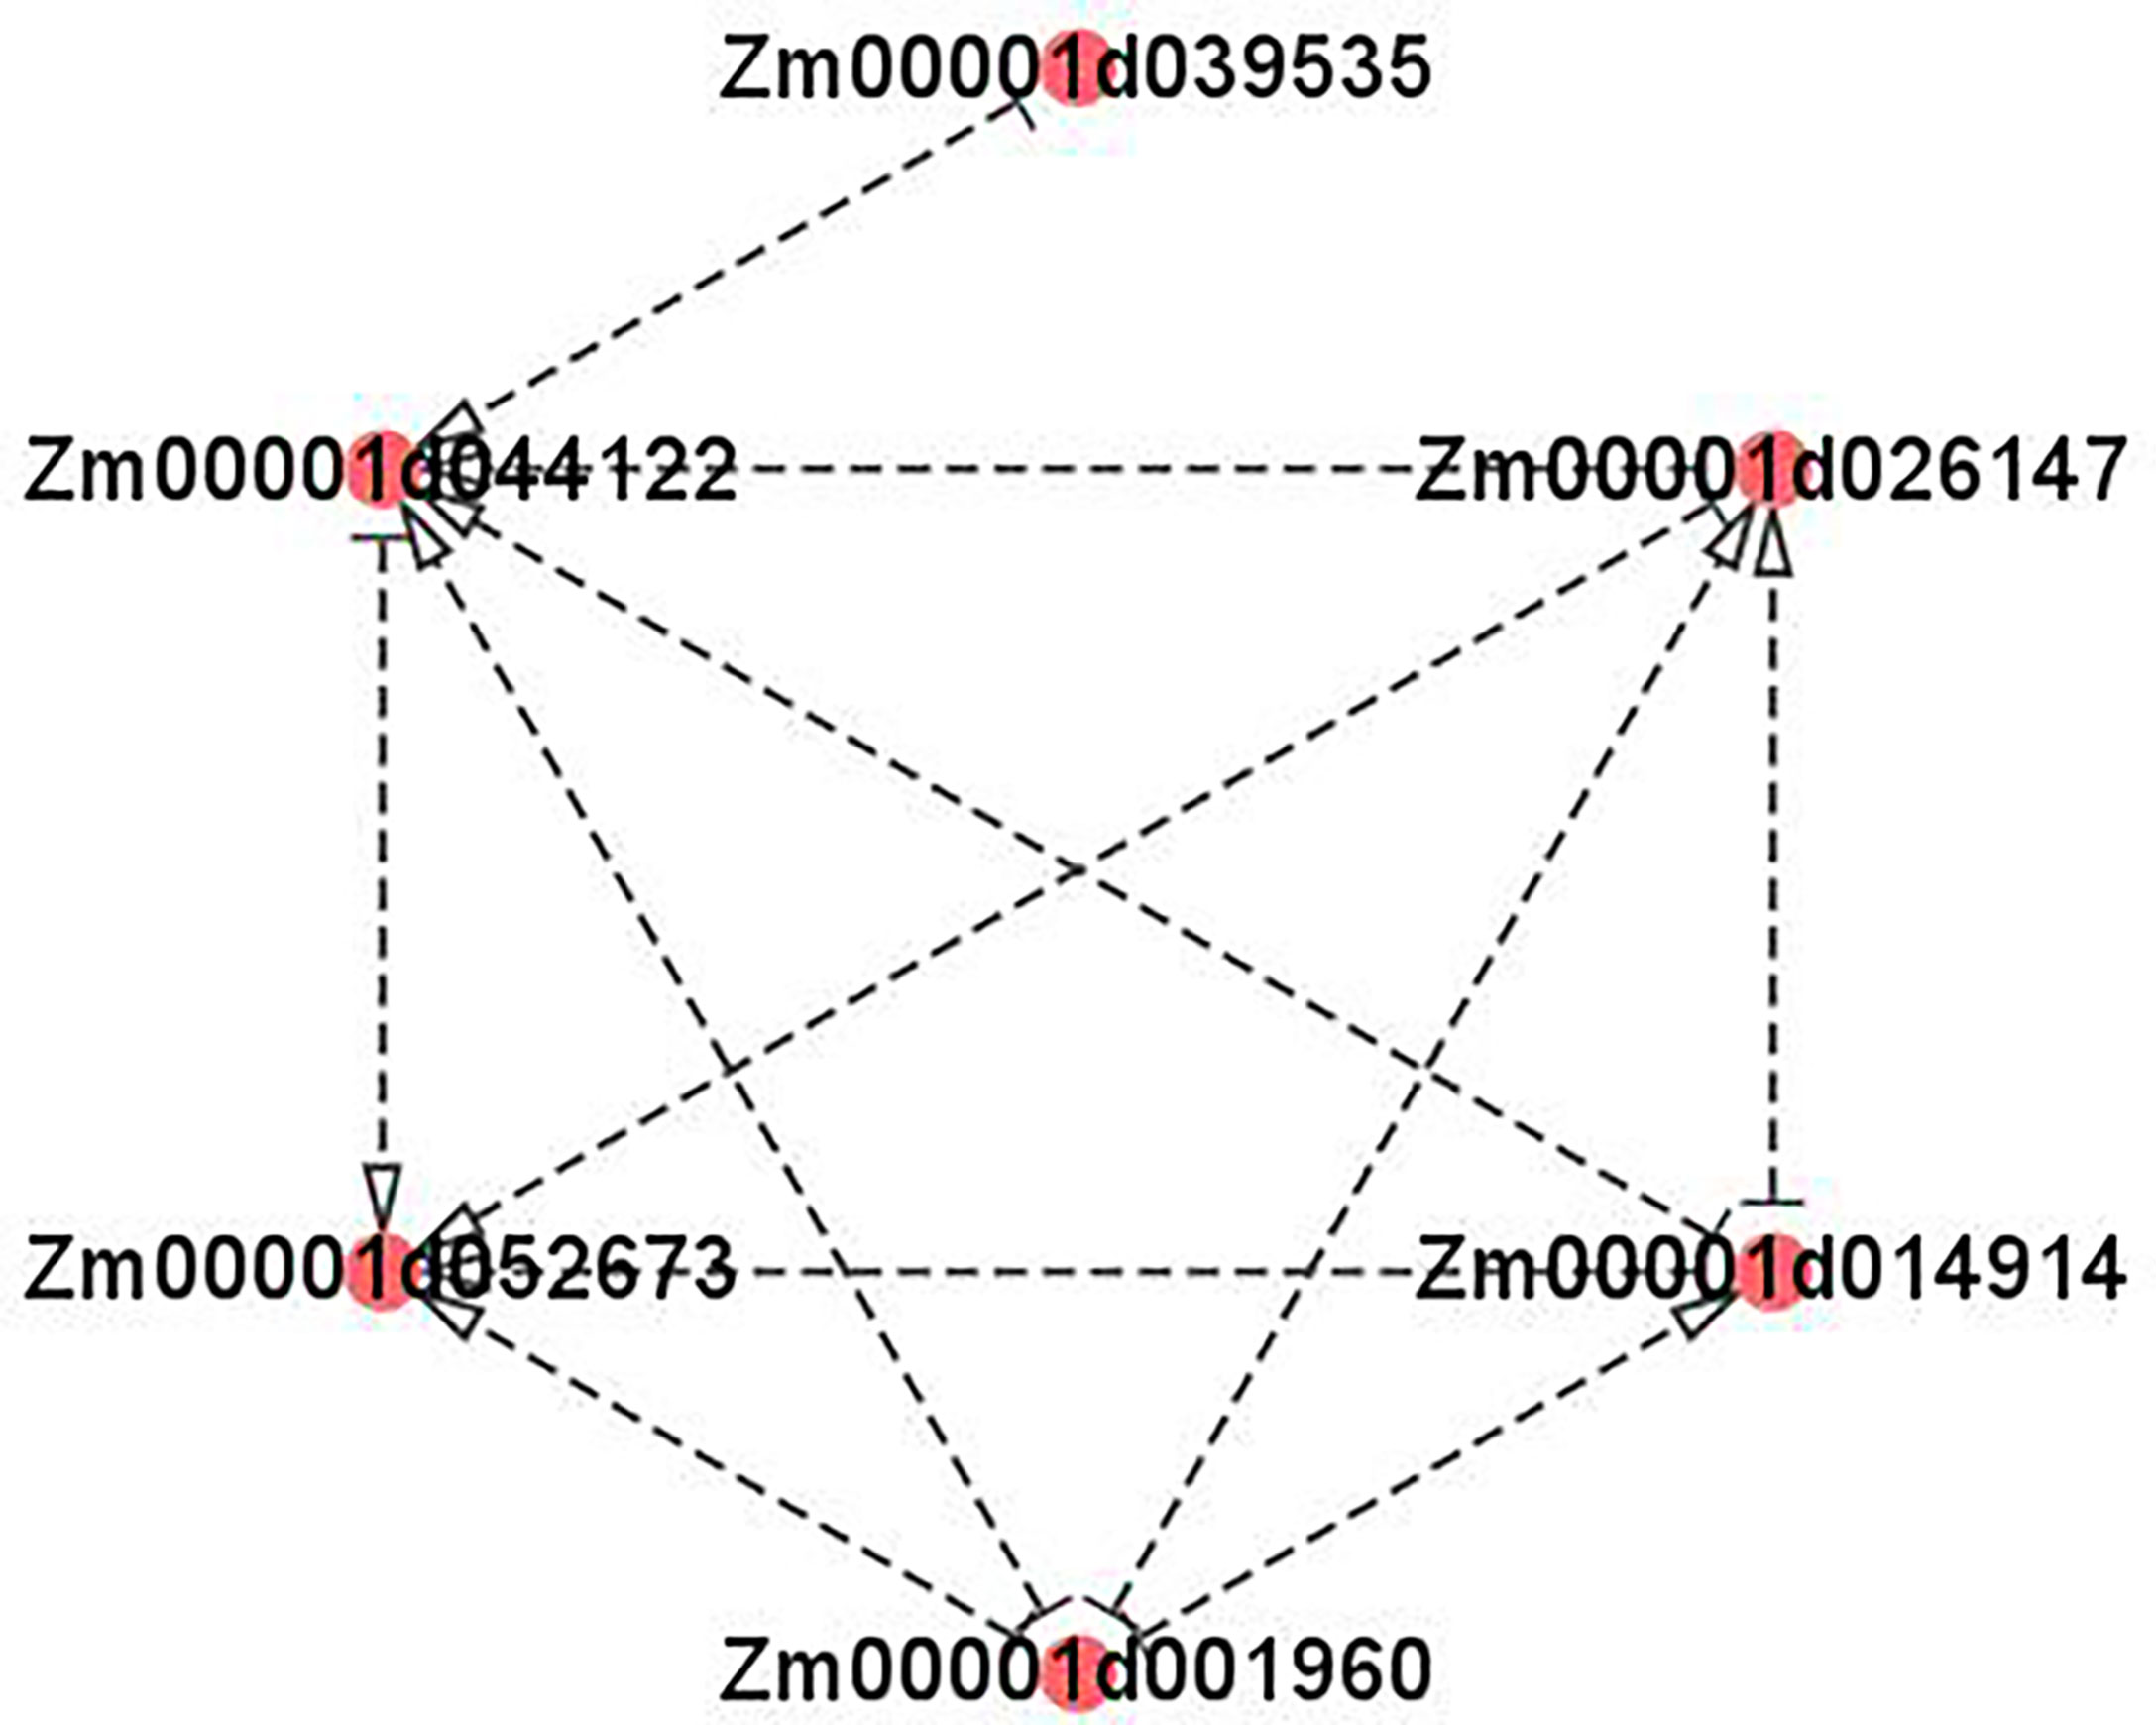
Figure 10 Visualization of co-expression gene network of hub genes by Cytoscape. The arrows pointed the target genes. And the other side of the arrows are the source genes. Zm00001d039535: Acyl transferase 9 (AcT9); Zm00001d044122: Dihydroflavonol 4-reductase (DFR); Zm00001d052673: Chalcone synthase (CHS) C2; Zm00001d001960: Naringenin, 2-oxoglutarate 3-dioxygenase; Zm00001d014914: Leucoanthocyanidin dioxygenase (LDOX); Zm00001d026147: Lc.
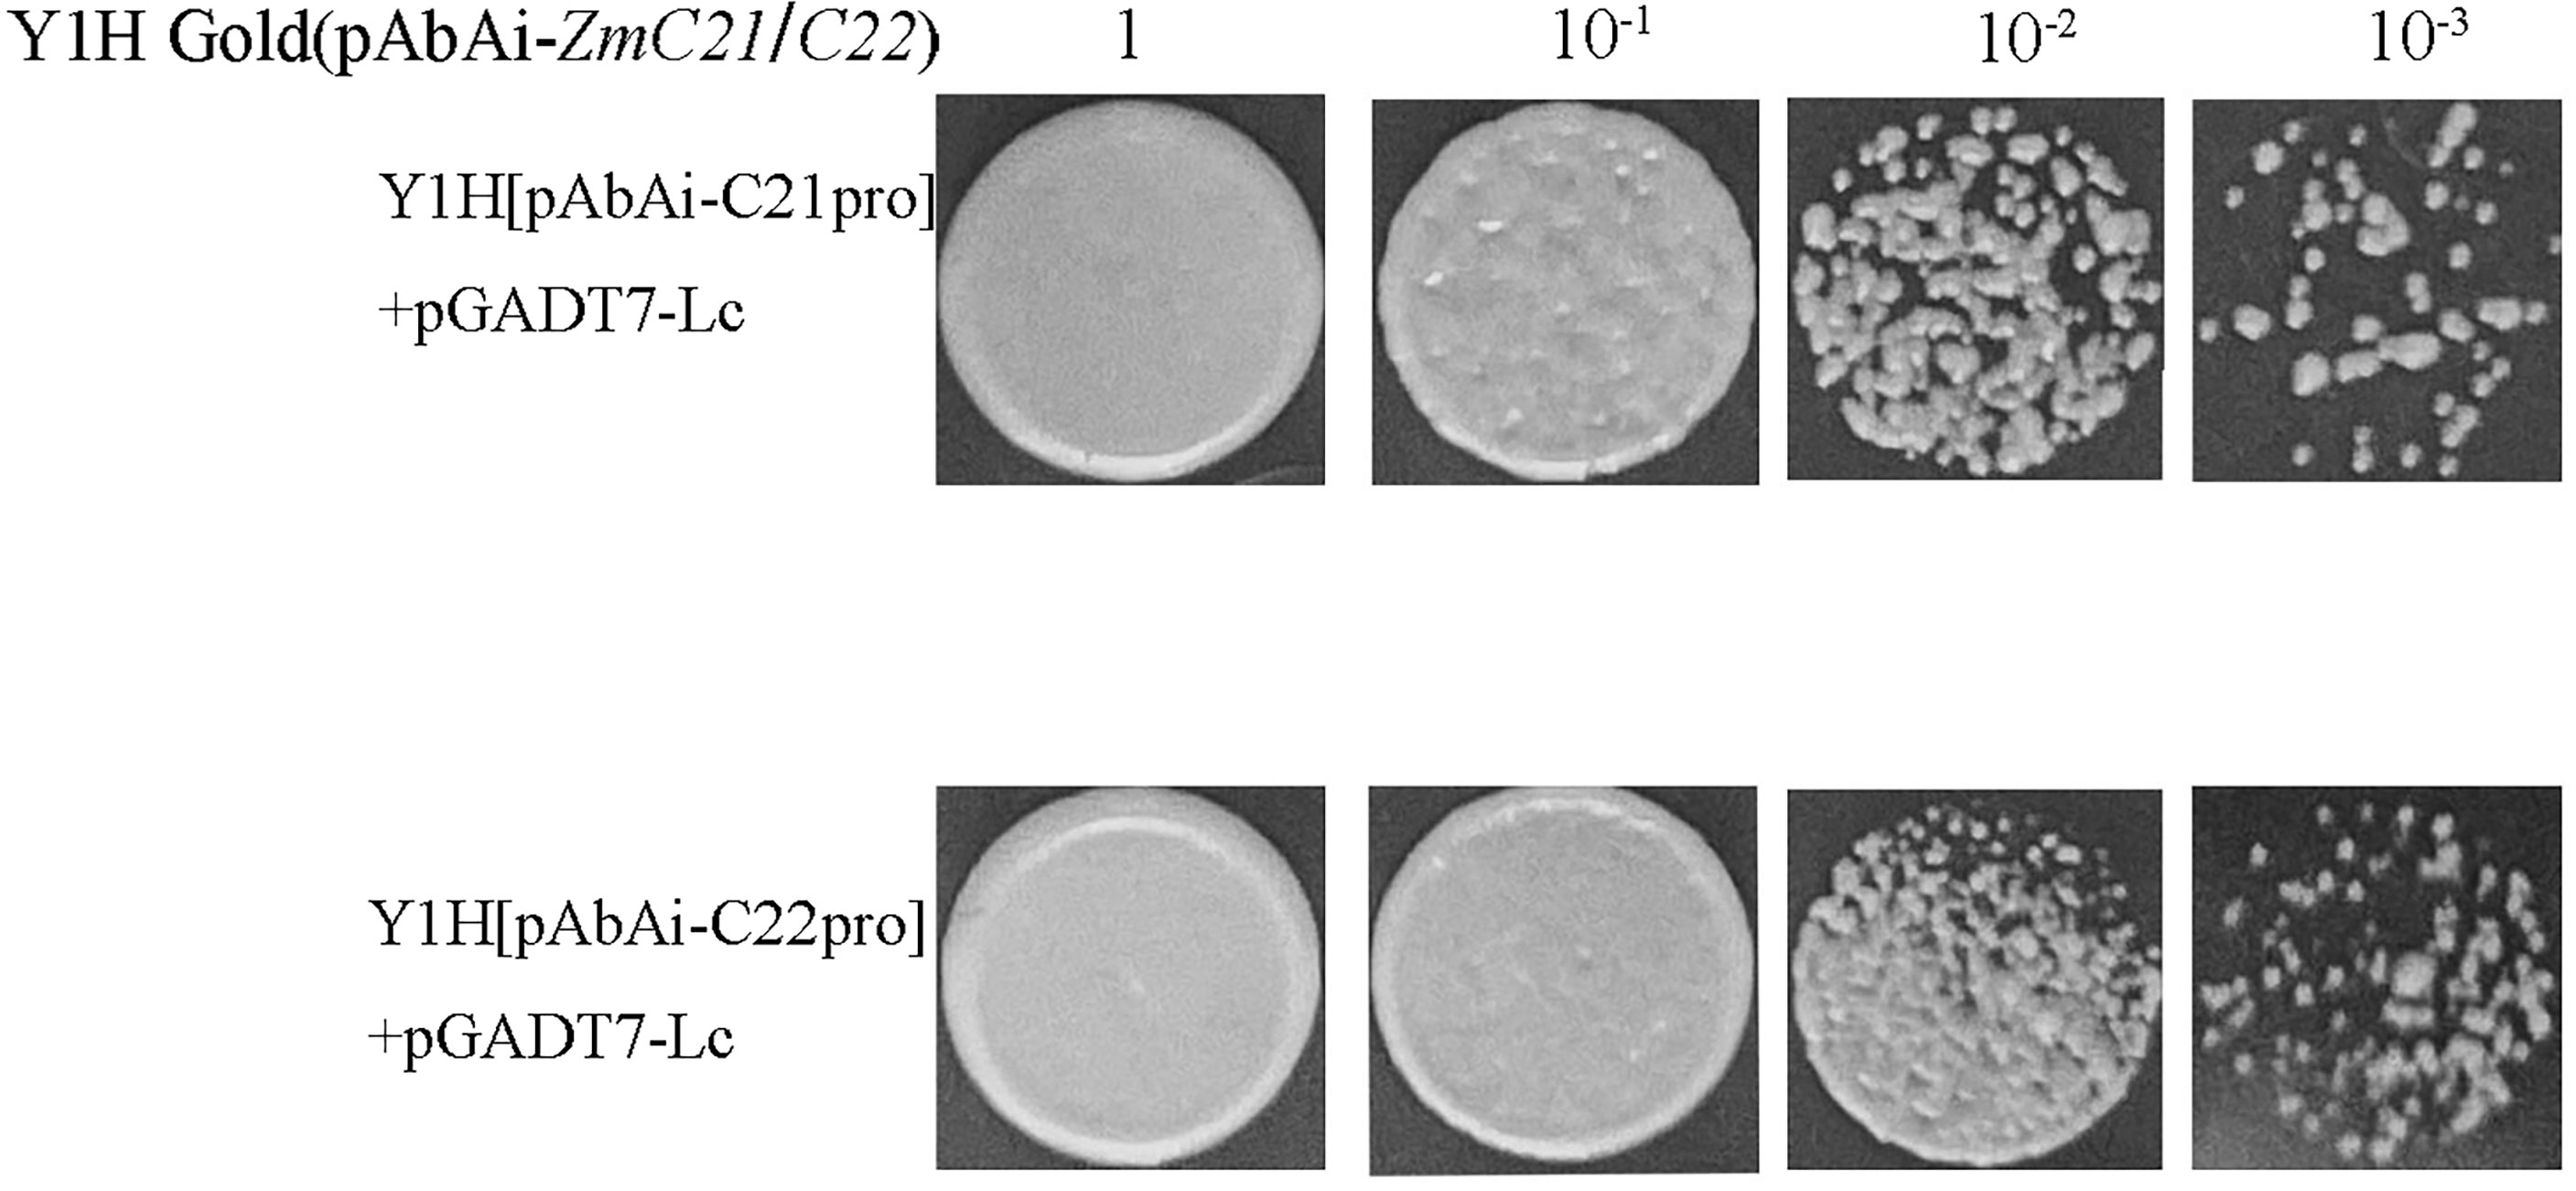
Figure 11 The yeast one-hybrid assays of in vivo interaction between ZmLc and the target promoter of ZmCHS. ZmC21 and ZmC22 represented the different region and sequences of the promoter for ZmCHS.
Discussion
The application of WGCNA in identification of modules and hub genes
Recently, WGCNA has been widely used to find modules of highly correlated genes and relate modules to one another and external sample traits (Langfelder and Horvath, 2008). It has been proved to be an effective tool for identifying key modules and hub genes correlated with target traits. It was successfully applied in various biological experiments, especially in mammals disease studies, including identifying the mechanism of breast cancer, revealing prognostic genes among diffferent cancer types, and uncovering key drivers of acute peanut allergic reactions (Guo et al., 2017; Watson et al., 2017; Ricketts et al., 2018). In plants, the WGCNA has been conducted to isolate the modules and hub genes related to seed development, metabolism, and stress responses (Du et al., 2017; Garg et al., 2017; Ma et al., 2017). This study obtained 18 samples’ transcriptomes at 10, 15, and 20 DAP, respectively. Using the quantile function of the R language, 2057 genes were filtrated out from 51407 genes based on FPKM values. Eventually, seven genes in the cyan module were mapped to the anthocyanins biosynthesis pathway, which participated in anthocyanins biosynthesis in the pericarp.
Structural genes and transcription factors related to anthocyanins biosynthesis in plants
Anthocyanin biosynthesis requires the coordinated expression of structural and regulatory genes (Ma et al., 2009). Regulatory genes, including bHLH, R2R3-MYB, WRKW, and WD40, have been widely identified in Petunia hybrida, apples, pears, and other plants (Li, 2014; Zhang et al., 2019). It is reported that R2R3-MYB proteins MYB11, MYB12, and MYB111 could trigger the expressions of the genes CHS, CHI, F3H, and FLS1 (Li, 2014). In apple, an MdbHLH2 gene was able to bind to the promoters’ sequences of the genes MdDFR, MdUFGT, and MdMYB. It could enhance anthocyanin accumulation induced by low temperature in fruit (Xie et al., 2012). Otherwise, a WD40 protein MdTTG1 could interact with bHLH transcription factors and indirectly regulate the anthocyanin biosynthesis (An et al., 2012). In red pear, the transcription factors PyMYB10, PybHLH, and PyWD40 formed a ternary complex to regulate anthocyanin biosynthesis in the peel under the sunlight (Cui et al., 2021). In kiwifruit, two transcription factors, MYBC1 and WRKY44, triggered the expression of F3′H and F3′5′H genes by activating their promoters (Peng et al., 2020). Moreover, AcMYB123 and AcbHLH42 could bind to promoters of AcANS and AcF3GT1 and activate their expressions. The co-expression of two genes is a prerequisite for anthocyanin production in Actinidia cultivars (Wang et al., 2019). In chrysanthemums, CmbHLH2 could bind to the CmDFR promoter and trigger anthocyanin biosynthesis (Xiang et al., 2015). In addition, a bHLH protein PsGBF could bind to the G-box cis-element of the PsCHS1 promoter and regulate anthocyanins biosynthesis in pea (Qian et al., 2007). In Zea mays, the members of two families’ genes of R2R3-MYB and bHLH have been isolated, too. The members of the c1 family, including c1 and pl, were annotated as MYB transcription factor genes, while the members of the r family, such as r, lc, sn and b, belong to bHLH transcription factor genes (Quattrocchio et al., 1998). The overexpression of maize ZmC1 and ZmR genes in wheat initiated anthocyanin biosynthesis (Riaz et al., 2019). Ectopic expression of Lc enhanced the accumulation of total anthocyanin contents in tobacco’s calyxes, petals, and filaments. The expressions of anthocyanin biosynthetic genes NtCHS, NtDFR, NtF3′H, and NtANS were in accord with the expression profile of the Lc gene (Huang et al., 2016). In the experiment, several structure genes, including Phenylalanine ammonia-lyase (PAL), Chalcone synthase (CHS) C2, Chalcone flavanone isomerase (CHI), Naringenin, 2-oxoglutarate 3-dioxygenase, Dihydroflavonol 4-reductase (DFR), Leucoanthocyanidin dioxygenase (LDOX), and one regulatory gene Lc gene were identified using WGCNA analysis based on dynamic comparative transcriptome sequence. Gene network and yeast one-hybrid verified that the Lc gene could bind to the promoter of C2 and further regulate the anthocyanin biosynthesis (Figure 11).
Conclusion
In the experiment, the transparent and anthocyanins-enriched pericarps at 15, 20, and 25 DAP were used to conduct dynamic comparative transcriptomes analysis. The results output 110.007 million raw reads and 51407 genes’ expression matrix. After filtration, 2057 genes were eventually identified as the candidate genes for weighted gene co-expression network analysis. As a results, ten modules were obtained and the cyan module containing 183 genes was the key module correlated with anthocyanins biosynthesis. Among 183 genes, four structural genes including Naringenin, 2-oxoglutarate 3-dioxygenase, Dihydroflavonol 4-reductase (DFR), Leucoanthocyanidin dioxygenase (LDOX), and Chalcone synthase (CHS) C2 and a transcription factor Lc gene participated in the anthocyanins biosynthesis. And the transcription factor anthocyanin regulatory Lc gene could bind to the promoter region of C2 and directly regulate the anthocyanin biosynthesis in the pericarp. These results may provide a new sight to uncover the module and hub genes related to anthocyanins biosynthesis in plants. And the WGCNA will be the effective tools to identify target genes and its correlated gene network associated with the plant phenotypic trait.
Data availability statement
The datasets presented in this study can be found in online repositories. The names of the repository/repositories and accession number(s) can be found in the article/Supplementary Material.
Author contributions
TL and CL designed the experiment and performed WGCNA analysis. YW and QD helped with transcriptome analysis. FW and KF helped with phenotypic analysis and yeast one-hybrid experiments. GL, YL, HY, and YZ were responsible for cultivating corns and preparing pericarps. All authors have read and approved the final manuscript. All authors contributed to the article and approved the submitted version.
Funding
This work was supported by the Key Research and Development Plan of Anhui Province (202104a06020019), the National Natural Science Foundation of China (31601240), the Natural Science Foundation of Anhui Province (2008085MC74), and the Anhui University research project (YJS20210230).
Conflict of interest
The authors declare that the research was conducted without any commercial or financial relationships construed as a potential conflict of interest.
Publisher’s note
All claims expressed in this article are solely those of the authors and do not necessarily represent those of their affiliated organizations, or those of the publisher, the editors and the reviewers. Any product that may be evaluated in this article, or claim that may be made by its manufacturer, is not guaranteed or endorsed by the publisher.
Supplementary material
The Supplementary Material for this article can be found online at: https://www.frontiersin.org/articles/10.3389/fpls.2022.1013412/full#supplementary-material
Supplementary Table 1 | All genes identified by transcriptome analysis and their distribution on chromosomes.
Supplementary Table 2 | The list of 2057 candidate genes and their belonging module.
Supplementary Table 3 | Primers with homologous arms sequences for promoters of target genes.
References
Amato, A., Cavallini, E., Zenoni, S., Finezzo, L., Begheldo, M., Ruperti, B., et al. (2017). A grapevine TTG2-like WRKY transcription factor is involved in regulating vacuolar transport and flavonoid biosynthesis. Front. Plant Sci. 7. doi: 10.3389/fpls.2016.01979
An, X. H., Tian, Y., Chen, K. Q., Wang, X. F., Hao, Y. J. (2012). The apple WD40 protein MdTTG1 interacts with bHLH but not MYB proteins to regulate anthocyanin accumulation. J. Plant Physiol. 169 (7), 710–717. doi: 10.1016/j.jplph.2012.01.015
Cuevas Montilla, E., Hillebrand, S., Antezana, A., Winterhalter, P. (2011). Soluble and bound phenolic compounds in different Bolivian purple corn (Zea mays l.) cultivars. J. Agr. Food Chem. 59 (13), 7068–7074. doi: 10.1021/jf201061x
Cui, D., Zhao, S., Xu, H., Allan, A. C., Zhang, X., Fan, L., et al. (2021). The interaction of MYB, bHLH and WD40 transcription factors in red pear (Pyrus pyrifolia) peel. Plant Mol. Biol. 106 (4), 407–417. doi: 10.1007/s11103-021-01160-w
Deng, J., Li, J., Su, M., Lin, Z., Chen, L., Yang, P. (2021). A bHLH gene NnTT8 of Nelumbo nucifera regulates anthocyanin biosynthesis. Plant Physiol. Biochem. 158, 518–523. doi: 10.1016/j.plaphy.2020.11.038
Du, J., Wang, S., He, C., Zhou, B., Ruan, Y. L., Shou, H. (2017). Identification of regulatory networks and hub genes controlling soybean seed set and size using RNA sequencing analysis. J. Exp. Bot. 68 (8), 1955–1972. doi: 10.1093/jxb/erw460
Garg, R., Singh, V. K., Rajkumar, M. S., Kumar, V., Jain, M. (2017). Global transcriptome and coexpression network analyses reveal cultivar-specific molecular signatures associated with seed development and seed size/weight determination in chickpea. Plant J. 91 (6), 1088–1107. doi: 10.1111/tpj.13621
Guo, X., Xiao, H., Guo, S., Dong, L., Chen, J. (2017). Identification of breast cancer mechanism based on weighted gene coexpression network analysis. Cancer Gene Ther. 24 (8), 333–341. doi: 10.1038/cgt.2017.23
Huang, Z. A., Zhao, T., Wang, N., Zheng, S. S. (2016). Ectopic expression of lc differentially regulated anthocyanin biosynthesis in the floral parts of tobacco (Nicotiana tobacco l.) plants. Bot. Stud. 57 (1), 1–7. doi: 10.1186/s40529-016-0138-6
Khoo, H. E., Azlan, A., Tang, S. T., Lim, S. M. (2017). Anthocyanidins and anthocyanins: colored pigments as food, pharmaceutical ingredients, and the potential health benefits. Food Nutr. Res. 61 (1), 1361779. doi: 10.1080/16546628.2017.1361779
Kim, D., Pertea, G., Trapnell, C., Pimentel, H., Kelley, R., Salzberg, S. L. (2013). TopHat2: accurate alignment of transcriptomes in the presence of insertions, deletions and gene fusions. Genome Biol. 14, R36. doi: 10.1186/GB-2013-14-4-r36
Langfelder, P., Horvath, S. (2008). WGCNA: an r package for weighted correlation network analysis. BMC Bioinform. 9 (1), 1–13. doi: 10.1186/1471-2105-9-559
Li, S. (2014). Transcriptional control of flavonoid biosynthesis: fine-tuning of the MYB-bHLH-WD40 (MBW) complex. Plant Signal. Behav. 9 (1), e27522. doi: 10.4161/psb.27522
Liu, Y., Hou, H., Jiang, X., Wang, P. Q., Dai, X., Chen, W., et al. (2018). A WD40 repeat protein from Camellia sinensis regulates anthocyanin and proanthocyanidin accumulation through the formation of MYB–bHLH–WD40 ternary complexes. Int. J. Mol. Sci. 19 (6), 1686. doi: 10.3390/ijms19061686
Li, T. C., Zhang, W., Yang, H. Y., Dong, Q., Ren, J., Fan, H. H., et al. (2019). Comparative transcriptome analysis reveals differentially expressed genes related to the tissue-specific accumulation of anthocyanins in pericarp and aleurone layer for maize. Sci. Rep. 9 (1), 1–12. doi: 10.1038/s41598-018-37697-y
Ma, S., Ding, Z., Li, P. (2017). Maize network analysis revealed gene modules involved in development, nutrients utilization, metabolism, and stress response. BMC Plant Biol. 17 (1), 1–17. doi: 10.1186/s12870-017-1077-4
Ma, H., Pooler, M., Griesbach, R. (2009). Anthocyanin regulatory/structural gene expression in Phalaenopsis. J. Am. Soc Hortic. Sci. 134 (1), 88–96. doi: 10.21273/JASHS.134.1.88
Ortega-Regules, A. E., Bautista-Ortín, A. B., Lozada-Ramírez, J. D., Gómez-Plaza, E. (2012). Anthocyanins from Mexican cultivars of colored maize and pomegranate: extraction, characterization, comparison and effect of geographic source. New Biotechnol. 29), S197–S198. doi: 10.1016/j.nbt.2012.08.555
Paulsmeyer, M., Chatham, L., Becker, T., West, M., West, L., Juvik, J. (2017). Survey of anthocyanin composition and concentration in diverse maize germplasms. J. Agric. Food Chem. 65 (21), 4341–4350. doi: 10.1021/acs.jafc.7b00771
Peng, Y., Thrimawithana, A. H., Cooney, J. M., Jensen, D. J., Espley, R. V., Allan, A. C. (2020). The proanthocyanin-related transcription factors MYBC1 and WRKY44 regulate branch points in the kiwifruit anthocyanin pathway. Sci. Rep. 10 (1), 1–19. doi: 10.1038/s41598-020-70977-0
Petroni, K., Pilu, R., Tonelli, C. (2014). Anthocyanins in corn: a wealth of genes for human health. Planta 240 (5), 901–911. doi: 10.1007/s00425-014-2131-1
Qian, W., Tan, G., Liu, H., He, S., Gao, Y., An, C. (2007). Identification of a bHLH-type G-box binding factor and its regulation activity with G-box and box I elements of the PsCHS1 promoter. Plant Cell Rep. 26 (1), 85–93. doi: 10.1007/s00299-006-0202-x
Quattrocchio, F., Wing, J. F., van der Woude, K., Mol, J. N. M., Koes, R. (1998). Analysis of bHLH and MYB domain proteins: species-specific regulatory differences are caused by divergent evolution of target anthocyanin genes. Plant J. 13 (4), 475–488. doi: 10.1046/j.1365-313X.1998.00046.x
Riaz, B., Chen, H., Wang, J., Du, L., Wang, K., Ye, X. (2019). Overexpression of maize ZmC1 and ZmR transcription factors in wheat regulates anthocyanin biosynthesis in a tissue-specific manner. Int. J. Mol. Sci. 20 (22), 5806. doi: 10.3390/ijms20225806
Ricketts, C. J., De Cubas, A. A., Fan, H., Smith, C. C., Lang, M., Reznik, E., et al. (2018). The cancer genome atlas comprehensive molecular characterization of renal cell carcinoma. Cell Rep. 23 (1), 313–326. doi: 10.1016/j.celrep.2018.03.075
Salinas Moreno, Y., Sánchez, G. S., Hernández, D. R., Lobato, N. R. (2005). Characterization of anthocyanin extracts from maize kernels. J. Chromatogr. Sci. 43 (9), 483–487. doi: 10.1093/chromsci/43.9.483
Schnable, P. S., Ware, D., Fulton, R. S., Stein, J. C., Wei, F., Pasternak, S., et al. (2009). The B73 maize genome: complexity, diversity, and dynamics. Sci 326, 1112–1115. doi: 10.1021/jf60232a042
Trapnell, C., Williams, B. A., Pertea, G., Mortazavi, A., Kwan, G., van Baren, M. J., et al. (2010). Transcript assembly and quantification by RNA-seq reveals unannotated transcripts and isoform switching during cell differentiation. Nat. Biotechnol. 14, 511–515. doi: 10.1038/nbt.1621
Wang, L., Tang, W., Hu, Y., Zhang, Y., Sun, J., Guo, X., et al. (2019). A MYB/bHLH complex regulates tissue-specific anthocyanin biosynthesis in the inner pericarp of red-centered kiwifruit Actinidia chinensis cv. hongyang. Plant J. 99 (2), 359–378. doi: 10.1111/tpj.14330
Watson, C. T., Cohain, A. T., Griffin, R. S., Chun, Y., Grishin, A., Hacyznska, H., et al. (2017). Integrative transcriptomic analysis reveals key drivers of acute peanut allergic reactions. Nat. Commun. 8 (1), 1–13. doi: 10.1038/s41467-017-02188-7
Xiang, L. L., Liu, X. F., Li, X., Yin, X. R., Grierson, D., Li, F., et al. (2015). A novel bHLH transcription factor involved in regulating anthocyanin biosynthesis in chrysanthemums (Chrysanthemum morifolium ramat.). PloS One 10 (11), e0143892. doi: 10.1371/journal.pone.0143892
Xie, X. B., Li, S., Zhang, R. F., Zhao, J., Chen, Y. C., Zhao, Q., et al. (2012). The bHLH transcription factor MdbHLH3 promotes anthocyanin accumulation and fruit colouration in response to low temperature in apples. Plant Cell Environ. 35 (11), 1884–1897. doi: 10.1111/j.1365-3040.2012.02523.x
Yang, Y. N., Yao, G. F., Zheng, D., Zhang, S. L., Wang, C., Zhang, M. Y., et al. (2015). Expression differences of anthocyanin biosynthesis genes reveal regulation patterns for red pear coloration. Plant Cell Rep. 34 (2), 189–198. doi: 10.1007/s00299-014-1698-0
Zhang, L., Hu, J., Han, X., Li, J., Gao, Y., Richards, C. M., et al. (2019). A high-quality apple genome assembly reveals the association of a retrotransposon and red fruit colour. Nat. Commun. 10, 1494. doi: 10.1038/s41467-019-09518-x
Keywords: anthocyanins, pericarp, comparative dynamic transcriptome analysis, weighted gene co-expression network analysis, maize
Citation: Li T, Wang Y, Dong Q, Wang F, Kong F, Liu G, Lei Y, Yang H, Zhou Y and Li C (2022) Weighted gene co-expression network analysis reveals key module and hub genes associated with the anthocyanin biosynthesis in maize pericarp. Front. Plant Sci. 13:1013412. doi: 10.3389/fpls.2022.1013412
Received: 07 August 2022; Accepted: 17 October 2022;
Published: 31 October 2022.
Edited by:
Song Li, Virginia Tech, United StatesCopyright © 2022 Li, Wang, Dong, Wang, Kong, Liu, Lei, Yang, Zhou and Li. This is an open-access article distributed under the terms of the Creative Commons Attribution License (CC BY). The use, distribution or reproduction in other forums is permitted, provided the original author(s) and the copyright owner(s) are credited and that the original publication in this journal is cited, in accordance with accepted academic practice. No use, distribution or reproduction is permitted which does not comply with these terms.
*Correspondence: Cheng Li, ODIxMDczNzM1QHFxLmNvbQ==