 Feiyi Huang
 Jihua Duan†
- Tea Research Institute, Hunan Academy of Agricultural Sciences/National Centre for Tea Improvement, Hunan Branch/Hunan Tea Variety and Seedling Engineering Technology Research Center, Changsha, China
‘Zijuan’ (Camellia sinensis var. assamica), a somatic mutant with purple foliage and stem selected from the Yunnan Daye cultivar, has been well developed owing to abnormal pattern of anthocyanin accumulation. However, the genetic basis for the specific accumulation of phloem glycosides is not clear. Tea plants are self-incompatible, so parents with large differences in foliage color were used for crosses to investigate the genetic mechanism of anthocyanins. In this study, ‘Zijuan’ and green foliage cultivar ‘Fudingdabaicha’ (C. sinensis var. sinensis) were used as female and male parents, respectively, to generated F1 hybrid progenies with various anthocyanin contents. In order to decipher the genetic rules of anthocyanins accumulation, we performed widely targeted metabolic and transcriptomic profiling. The results showed that cyanidin-3-O-galactoside, delphinidin-3-O-galactoside and petunidin-3-O-galactoside were the major types of anthocyanins and factors directly led to the color variation between parents and F1 plants. Transcriptomic analyses suggested the significant up-regulation of anthocyanidin synthase gene (CsANS1) and CsAN1, a MYB family gene positively regulated the expression of CsANS1, in anthocyanin-rich tea plants. Furthermore, the deletion mutation of CsAN1 was found by cloning and alignment in anthocyanin-lacking cultivars. Taken together, the function deficiency of CsAN1 is predominantly responsible for the inability of anthocyanins accumulation, and this trait is heritable in progenies through hybridization. The present study elucidated the molecular basis of leaf purple trait formation in ‘zijuan’ and ‘Fudingdabaicha’ and their F1 plants, which helps to elucidate the genetic mechanism of leaf anthocyanin accumulation regulation in tea plants, and the results provide a research reference for the selection and breeding of high anthocyanin type tea varieties.
Introduction
Tea plants (Camellia sinensis) from the family Theaceae are a perennial evergreen woody plant species that is cultivated widely in the tropical and subtropical district worldwide, including mainly China, Japan, and Kenya (Zhao et al., 2020). Tea, generally processed from the leaf of tea plants, provides abundant secondary metabolites which enrich our taste and improve human health as the world’s most prevalent beverage. The tasty flavors and different health-promoting functions of tea mainly owe to a great deal of bioactive compounds (Koch et al., 2019). Among these, the most characteristic metabolites are caffeine, theanine, flavonoids, and some volatiles (Turkozu and Sanlier, 2017). Among the abundant beneficial metabolites in tea plants, flavonoids, belonging to the phenolic compounds, has been paid much more attentions because of being nutraceutical and traditional medicine for human in recent years. Generally, flavonoids include anthocyanins, flavones, flavonoids, isoflavones, flavanols, flavonols, and some derivatives (e.g., catechins) (Nabavi et al., 2020). Anthocyanins are the primary pigments that determine the coloration in human edible and ornamental plants, such as many tropical and subtropical fruits, purple crops, and varicolored flowers (Tirumalai et al., 2019; Li et al., 2020b; Fu et al., 2021; Yi et al., 2021). For the plants, anthocyanins play significant roles for attracting pollinators and protecting plants against various abiotic stresses (Zhou et al., 2014). In addition, numerous studies and observations of animal models and human clinical trials show that anthocyanins have antioxidative and antimicrobial activities, improve neurological and visual health, and prevent various chronic diseases (Khoo et al., 2017). Purple-leaf tea plants, a novel germplasm of tea plants with rich anthocyanins accumulation (e.g., cv. ‘Baitang purple tea’), has been well developed owing to its attractive, unique color and pharmacological action responsible for prevention of some chronic diseases (Rothenberg et al., 2019; Tang et al., 2021). Pharmacological result shows that the purple-leaf tea extract can restrain the cancer proliferation by interrupting cell cycle progression and inducing apoptotic death (Hsu et al., 2012). Moreover, some valuable studies suggested that the purple-leaf tea extract plays a positive role in physiological activity including anti-trypanosome, cerebral antioxidants, and anti-obesity activities (Rashid et al., 2014a; Rashid et al., 2014b; Hayat et al., 2015; Hiroshi et al., 2015). Hence, the anthocyanins-rich tea plant germplasms have been paid much more attentions due to their notable health care capacity in recent years.
In generally, anthocyanin shows red pigment in acidic conditions while blue pigment appears in alkaline conditions (Coutinho et al., 2015). In the last two decades, efforts have been made to decipher the biosynthesis of anthocyanins in many plants from biochemical, physiological, or molecular genetic perspectives. In flowering plants, anthocyanins are synthesized via the flavonoid pathway under the control of multiple enzyme and regulatory genes (Jaakola, 2013). In C. sinensis, with the genome assembling, the key gene families involved in anthocyanin biosynthesis, such as chalcone synthase (CHS), chalcone isomerase (CHI), dihydroflavonol reductase (DFR), leucoanthocyanidin reductase (LAR), and anthocyanidin reductase (ANR) were identified (Wei et al., 2018). Furthermore, anthocyanin late biosynthetic genes, such as flavonoid 3-hydroxylase (F3H), flavonoid 3′;- hydroxylase (F3′;H), flavonoid 3′; 5′;- hydroxylase (F3′;5′;H), anthocyanidin synthase (ANS) and UDP glucose-flavonoid 3-o-glcosyl-transferase (UFGT), exhibit the specific expression in purple-leaf tea palnts (Rothenberg et al., 2019; Chen et al., 2020). Meanwhile, transcriptional regulation of structural genes appears to be a major factor contributed to the anthocyanin biosynthesis in plants. To date, a MYB-bHLH-WD40 (MBW) complex, which is assembled through MYB transcription factors (TFs), basic helix-loop-helix (bHLH) TFs, and WD-repeat proteins, is responsible for anthocyanin biosynthesis (Ramsay and Glover, 2005). In ‘Zijuan’ tea plants, A R2R3-MYB TF CsAN1 interacts with bHLH TFs (CsGL3 and CsEGL3), and recruits a WD-repeat protein CsTTG1 to form the MBW complex which largely determine the anthocyanin accumulation in the foliage of ‘Zijuan’ cultivar with purple leaf (Sun et al., 2016). Another R2R3-MYB TF CsMYB2, not the same as CsAN1, positively regulates the expression level of CsF3′;H (Wang et al., 2018). Furthermore, other TFs, such as MADS, WRKY, NAC, and bZIP, have also been shown to participate in regulatory control of anthocyanin biosynthesis in pear, apple, and bilberry (Jaakola et al., 2010; An et al., 2017; Sun et al., 2019; Li et al., 2020a). However, the genetic rules of anthocyanin accumulation in tea plants have not been well deciphered.
Drinking anthocyanin-rich tea promotes simultaneous ingestion of catechins and anthocyanins. Therefore, breeding abundant anthocyanin-rich tea cultivars was carried out. ‘Zijuan’ (ZJ) confers an abnormal accumulation of anthocyanin, resulting in a colored phenotype that has a claret-purple young foliage. In this study, we first set up a hybrid combination of ‘ZJ’ and green-leaf cultivar ‘Fudingdabaicha (FD)’, as well as found that anthocyanin accumulation occurred significant segregation in F1 generation plants. Widely targeted metabolomics technology was first used to investigate the contents and types of anthocyanins, and results showed that cyanidin-3-O-galactoside, delphinidin-3-O-galactoside and petunidin-3-O-galactoside were the major factors which directly led to the color variation between parents and F1 plants. Transcriptomic analyses suggested the significant upregulation of an anthocyanidin synthase gene (CsANS1) in anthocyanin-rich tea plants and cloning and alignment further suggested that a deletion mutant of CsAN1, a MYB family gene positively regulated the expression of CsANS1, potentially lead to drawback of anthocyanins accumulation in anthocyanins-lacking tea plants.
Materials and methods
Plant materials
The claret-colored leaf cultivar ‘ZJ’ (C. sinensis var. assamica) and green-leaf cultivar ‘FD’ (C. sinensis var. sinensis) were used as female and male parents to cross-fertilize, respectively. The F1 generation plants, including ‘YG’ (yellow-green leaf), ‘GP’ (mauve leaf), ‘RP’ (claret-colored leaf) and ‘BP’ (dark-purple leaf) were obtained. All materials were planted in the Changsha region (Changsha, Hunan, China). All materials were grown under the natural environmental conditions. The second tender leaf under the bud (100 g) of parents and progenies were collected and frozen in liquid nitrogen. Three biological replicates for every sample used. All samples were ground and stored at -80°C until used.
Anthocyanin extraction
For anthocyanin extraction, 0.05 g powder was accurately weighted and extracted with 500 μL methanol/water/hydrochloric acid (500:500:1, V/V/V). All extracts were vortexed for 5 min and ultrasound for more 5 min and centrifuged at 12, 000 rpm under 4°C for 3 min. The sediments were re-extracted according to the above steps again under the same conditions, respectively. The supernatants were collected, and filtrated through a membrane filter (0.22 μm, Anpel) before LC-MS/MS analysis. For determination of total anthocyanins, 1 g sample was quickly sliced and extracted with 15 ml HCl-methanol (0.15% HCl: 95%methanol, v: v=15: 85) for 4 h. The extract was centrifuged and its absorbance was determined at 530, 620 and 650 nm, respectively. The anthocyanin content measurement was based on the formula: ΔA/ml = (A530-A620) - 0.1 (A650-A620) (Zheng and Tian, 2006).
ESI-Q TRAP-MS/MS analyses
The sample extracts were detected by LC-ESI-MS/MS system (HPLC, Shim-pack UFLC SHIMADZU CBM30A system, www.shimadzu.com.cn/; MS, Applied Biosystems 4500 Q TRAP, http://www.appliedbiosystems.com.cn/). The liquid chromatography analytical conditions were as follows: 5 µL of sample was injected into a Waters ACQUITY UPLC HSS T3 C18 (1.8 µm, 2.1 mm*100 mm). The HPLC mobile phase was 0.04% acetic acid in acetonitrile (solvent B) versus 0.04% acetic acid in Milli-Q water (solvent A). Separation was achieved with the following gradients: starting with 5% solvent B, raising to 95% B in 11 min, maintaining at 95% B for 1 min, dropped quickly to 5% B within 0.1 min and maintaining at 5% B for 3 min. The flow rate was 0.40 mL/min at a temperature of 40°C.
Linear ion trap (LIT) and triple quadrupole (QQQ) scans were acquired on a triple quadrupole-linear ion trap mass spectrometer (API 4500 Q TRAP LC/MS/MS System; Boston, USA) equipped with an ESI Turbo Ion Spray interface, operating in both positive and negative ion model and controlled by Analyst 1.6.3 software (AB Sciex, Singapore). The ESI source operation parameters were as follows: ion source, turbo spray; source temperature, 550°C; ion spray voltage (IS), 5500 V; and ion source gas I (GSI), gas II (GSII), curtain gas (CUR) set to 55, 60 and 25 psi, respectively. The collision activated dissociation (CAD) was set at “high”. Instrument tuning and mass calibration were performed with 10 and 100 μmol/L polypropylene glycol solutions in QQQ and LIT modes, respectively. QQQ scans were acquired via multiple reaction monitoring (MRM) experiments with collision gas (nitrogen) set to 5 psi. Declustering potential (DP) and collision energy (CE) were optimized for individual MRM transitions. A specific set of MRM transitions was monitored for each period according to the metabolites eluted within the period (Zou et al., 2020).
MS data and statistical analyses
MS data acquisition and processing were performed as described previously (Chen et al., 2013). The analyses of the primary and secondary MS data were performed based on the self-built database MWDB (Metware Biotechnology Co., Ltd. Wuhan, China). Metabolite quantification was accomplished with data acquired in MRM mode by QQQ-MS (Zou et al., 2020). Metabolites with a fold change ≥2 or a fold change ≤0.5 were identified as upregulated or downregulated.
RNA extraction and RT-qPCR
Total RNA from each frozen sample was extracted by modified CTAB method (Gambino et al., 2008). RNA sample integrity was assessed by agarose gel electrophoresis and Agilent 2100 system (Agilent Technologies Inc., USA). The concentration of RNA was measured using NanoDrop 2000 spectrophotometer (Eppenforf, Germany). Total RNA (0.5 µg) was used to synthesize the first-strand cDNA with random primer according to the manufacturer’s instructions using a RevertAid First Strand cDNA Synthesis Kit (ThermoFisher, USA). The expression patterns of all candidates were verified by quantitative real-time PCR (RT-qPCR). RT-qPCR was conducted in CFX Real-Time PCR Detection System (Bio-Rad, USA) using the SYBR qPCR Mix (Vazyme, Nanjing, China). The 20 µL reactionmixture contained about 1 µL template cDNA, 0.2 µM of each forward and reversegene-specific primers and 10 µL SYBR. The relative expression levels were calculated using the 2-ΔΔCT formula (Livak and Schmittgen, 2001). For gene cloning, the first-strand cDNA was synthesized by the oligo (dT)18 primer, and the full-length of candidate was cloned using Phanta Max Super-Fidelity DNA Polymerase (Vazyme, nanjing, China) according to the manufacture’s descriptions. All primers used in this study were presented in Table S6.
Library preparation for transcriptome sequencing
The RNA sequencing libraries were generated were generated using NEBNext® UltraTM RNA Library Prep Kit for Illumina® (NEB, USA) following manufacturer’s recommendations. Briefly, mRNA was purified from total RNA using poly-T oligo attached magnetic beads. Fragmentation was carried out using divalent cations under elevated temperature in NEBNext First Strand Synthesis Reaction Buffer (5×). First strand cDNA was synthesized using random hexamer primer and M-MuLV Reverse Transcriptase (RNase H-). Second strand cDNA synthesis was subsequently performed using DNA Polymerase I and RNase H. Remaining overhangs were converted into blunt ends via exonuclease/polymerase activities. After adenylation of 3′; ends of DNA fragments, NEBNext Adaptor with hairpin loop structure were ligated to prepare for hybridization. In order to select cDNA fragments of preferentially 250~300 bp in length, the library fragments were purified with AMPure XP system (Beckman Coulter, Beverly, USA). Then 3 µl USER Enzyme (NEB, USA) was used with size-selected, adaptor-ligated cDNA at 37°C for 15 min followed by 5 min at 95°C before PCR. Then PCR was performed with Phusion High-Fidelity DNA polymerase, Universal PCR primers and Index (X) Primer. At last, PCR products were purified (AMPure XP system) and library quality was assessed on the Agilent Bioanalyzer 2100 system. The libraries were sequenced on an Illumina®HiSeq2500 platform and 125 bp/150 bp paired-end reads were generated.
Gene functional annotation and expression analysis
The raw data were filtered by removing low quality reads and adaptors, and were changed into clean reads. the HISAT v2.1.0 package was used to construct the index, and mapped clean reads to the reference genome (http://tpdb.shengxin.ren/). The feature Counts v1.6.2 package was used to calculate the gene alignment, and then calculate the FPKM of each gene based on the gene length. The DESeq2 v1.22.1 was used to analyze the differential expression between the two groups, and the p-value was corrected using the Benjamini & Hochberg method. Gene function was annotated according to these databases: (NCBI non-redundant protein sequences (Nr); Clusters of Orthologous Groups of proteins (COG/KOG); Swiss PROT protein sequence database (Swissprot); Kyoto Encyclopedia of Genes and Genomes (KEGG); homologous protein family (Pfam) and Gene Ontology (GO).
Statistical analysis
The standard deviation (SD) of the metabolite concentrations were calculated based on three biological replicates and technical replicates. SPSS 17.0 software was used to determine the significant differences by Duncun method with p <0.05.
Results
Anthocyanin accumulation variation in F1 plants
The claret-colored foliage cultivar ‘ZJ’ and green-foliage cultivar ‘FD’ were used as female and male parents, respectively, to generate F1 hybrid progenies. Among F1 offspring, significant differences were observed in the morphological phenotypes, especially concerning leaf color, including yellow-green leaf (‘YG’), mauve leaf (‘GP’), claret-colored leaf (‘RP’) and dark-purple leaf (‘BP’) (Figure 1A). To investigate overall anthocyanin differences among samples, the total anthocyanin content was determined. Those results showed that the anthocyanin content in ‘ZJ’ was the highest, and the anthocyanin content of ‘GP’, ‘RP’, and ‘BP’ were significantly higher than that in ‘FD’ and ‘YG’ (Figure 1B). Additionally, ‘RP’ is phenotypically similar in color with the parent ‘ZJ’. In C. sinensis, it has been proved that anthocyanin accumulation differences contribute to the color variation. Therefore, metabolic profiling was first performed to analyze between parents and progenies and to focus on anthocyanin contents. Metabolic profiling of the 6 samples using an UPLC-ESI-MS/MS system identified 57 metabolites (Table S1). According to the metabolome data, the metabolites identified include the following: 7 cyanidins, 13 delphinidins, 7 flavonoids, 4 malvidins, 8 pelargonidins, 13 peonidins and 5 procyanidins (Table S1). Comparing with the male parent, 10 differentially accumulated metabolites were detected between yellow-green leaf cultivar ‘YG’ and green-leaf cultivar ‘FD’, including 5 downregulated and 5 upregulated metabolites, respectively (Figures 1C, D and Table S2). Furthermore, comparing with the green-leaf cultivar ‘FD’, most of the differentially accumulated anthocyanins were significantly up-regulated in purple tea plants, including ‘GP’, ‘RP’, ‘BP’ and ‘ZJ’ (Figures 1C, D and Table S2). Those results suggested that, in C. sinensis, anthocyanin accumulation differences contributed to the color variation in F1 hybrid progenies.
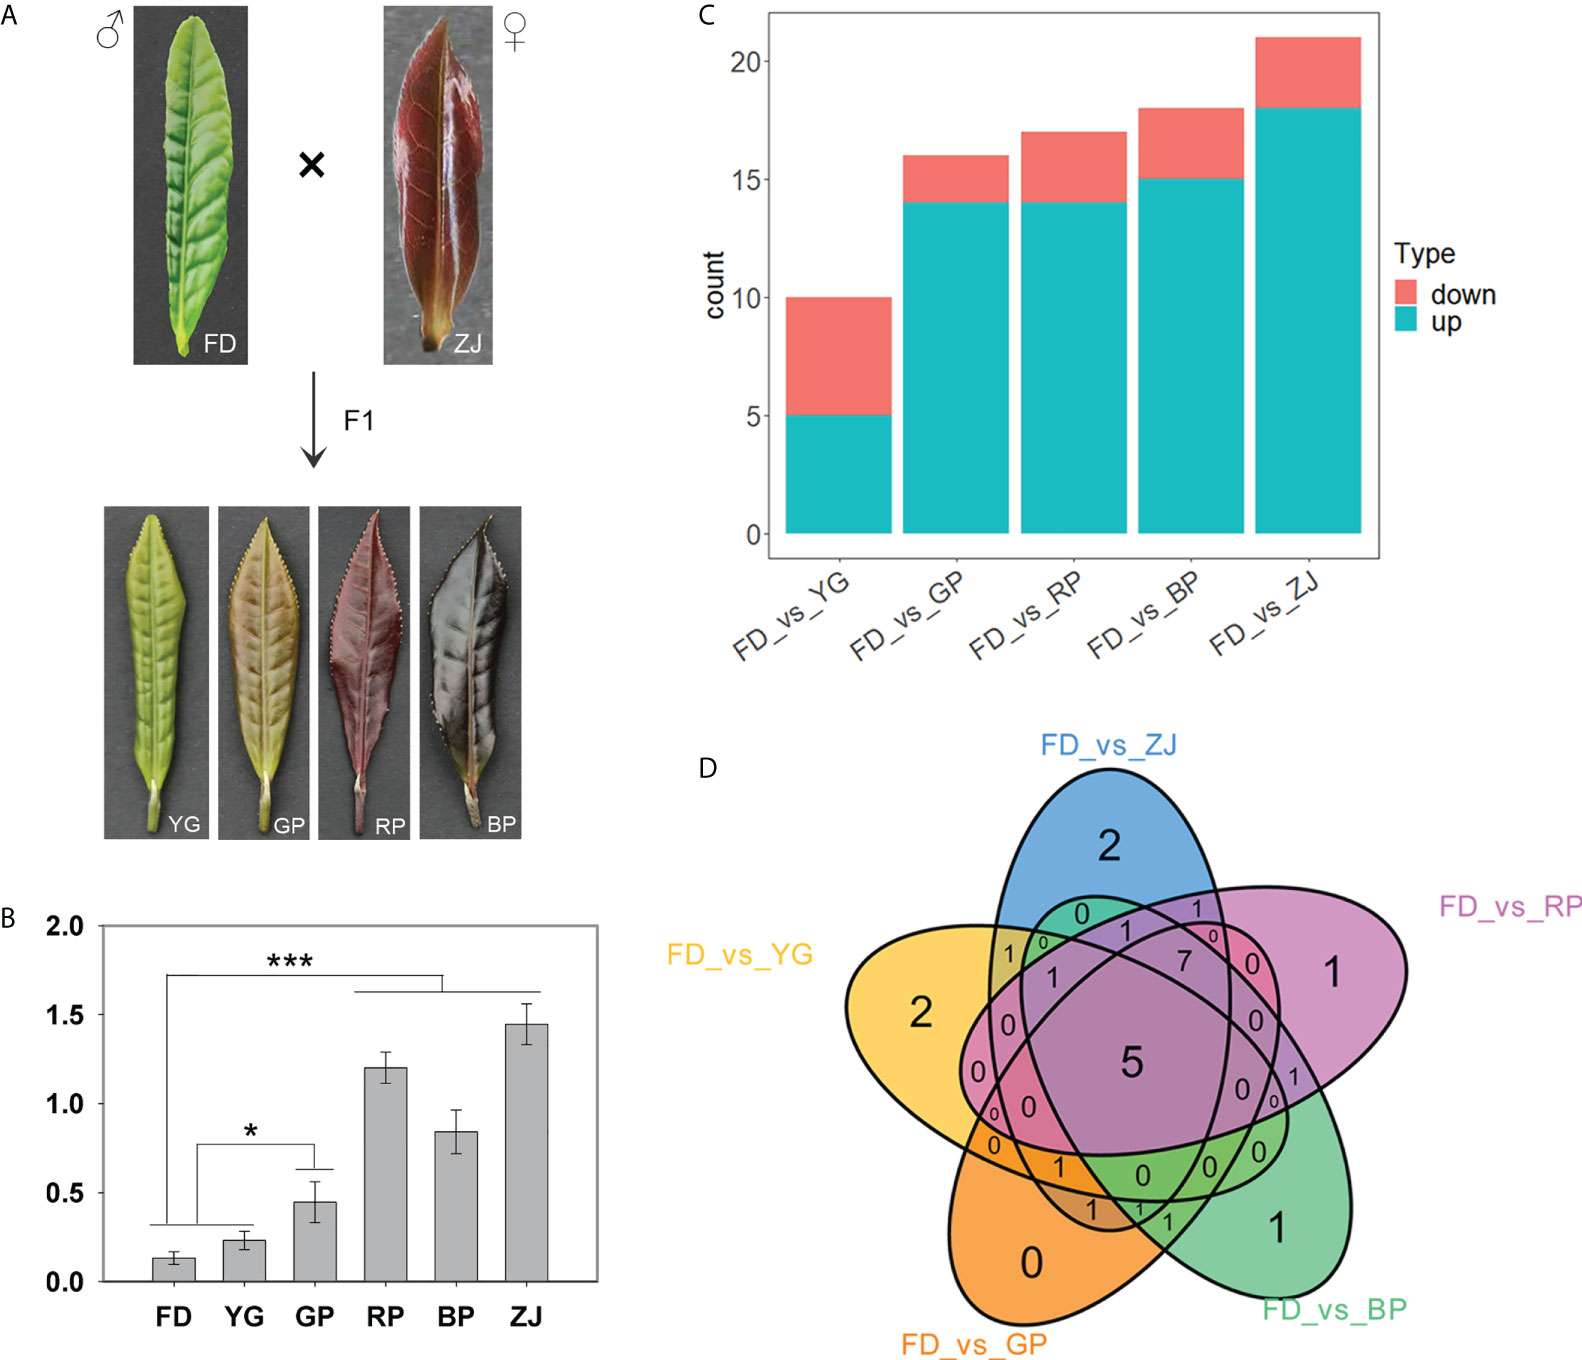
Figure 1 Metabolic profiling of the parents and F1 hybrid progenies. (A) The morphological phenotypes of the parents and F1 hybrid progenies; (B) The anthocyanin content of parents and hybrid progenies; (C) Differential metabolites in various groups; (D) Venn diagram of differential metabolites between 5 groups. “*”: p <0.05; “***”: p <0.001.
Main types of anthocyanidin accumulation in C. sinensis
Generally, anthocyanins structurally comprise an anthocyanidin aglycon bound to one or more sugar moieties. Six anthocyanidin types, namely cyanidin (Cy), delphinidin (Dp), pelargonidin (Pg), peonidin (Pn), petunidin (Pt), and malvidin (Mv), occur in colored plants (Figure 2A) (Jaakola, 2013). In order to investigate which types of anthocyanidin mainly accumulated in C. sinensis, the corrected peak area of each metabolite was calculated. Those results showed that Cy, Dp and Pt were the main types anthocyanidin aglycon accumulated in tea plants (Figures 2B–D). Though Mv, Pg and Pn were characterized and up-regulated accumulation in ‘RP’ and ‘ZJ’, the peak area of each metabolite was much lower (Figures S1A, B, E), suggesting that the contents of Mv, Pg and Pn were negligible. In addition, cyanidin-3-O-galactoside was the predominant anthocyanin and significantly up-regulated in tea plants with purple-leaf (Figure 2B). In the type of Dp, delphinidin-3-O-galactoside was the remarkable anthocyanin and significantly up-regulated in tea plants with purple-leaf, which was similar with the accumulation pattern of Cy (Figure 2C). Furthermore, petunidin-3-O-galactoside was the major component of the Pt type, which is notably accumulated in ‘RP’ and ‘ZJ’ with claret-colored leaf and, however, hardly detected in ‘BP’ with dark-purple leaf (Figure 2D). Though some flavonoids and procyanidins were characterized, however, there were no obvious accumulation differences (Figures S1C, D). Taken together, accumulation differences of cyanidin-3-O-galactoside, delphinidin-3-O-galactoside and petunidin-3-O-galactoside were the major factors which directly led to the color variation between parents and F1 hybrid progenies.
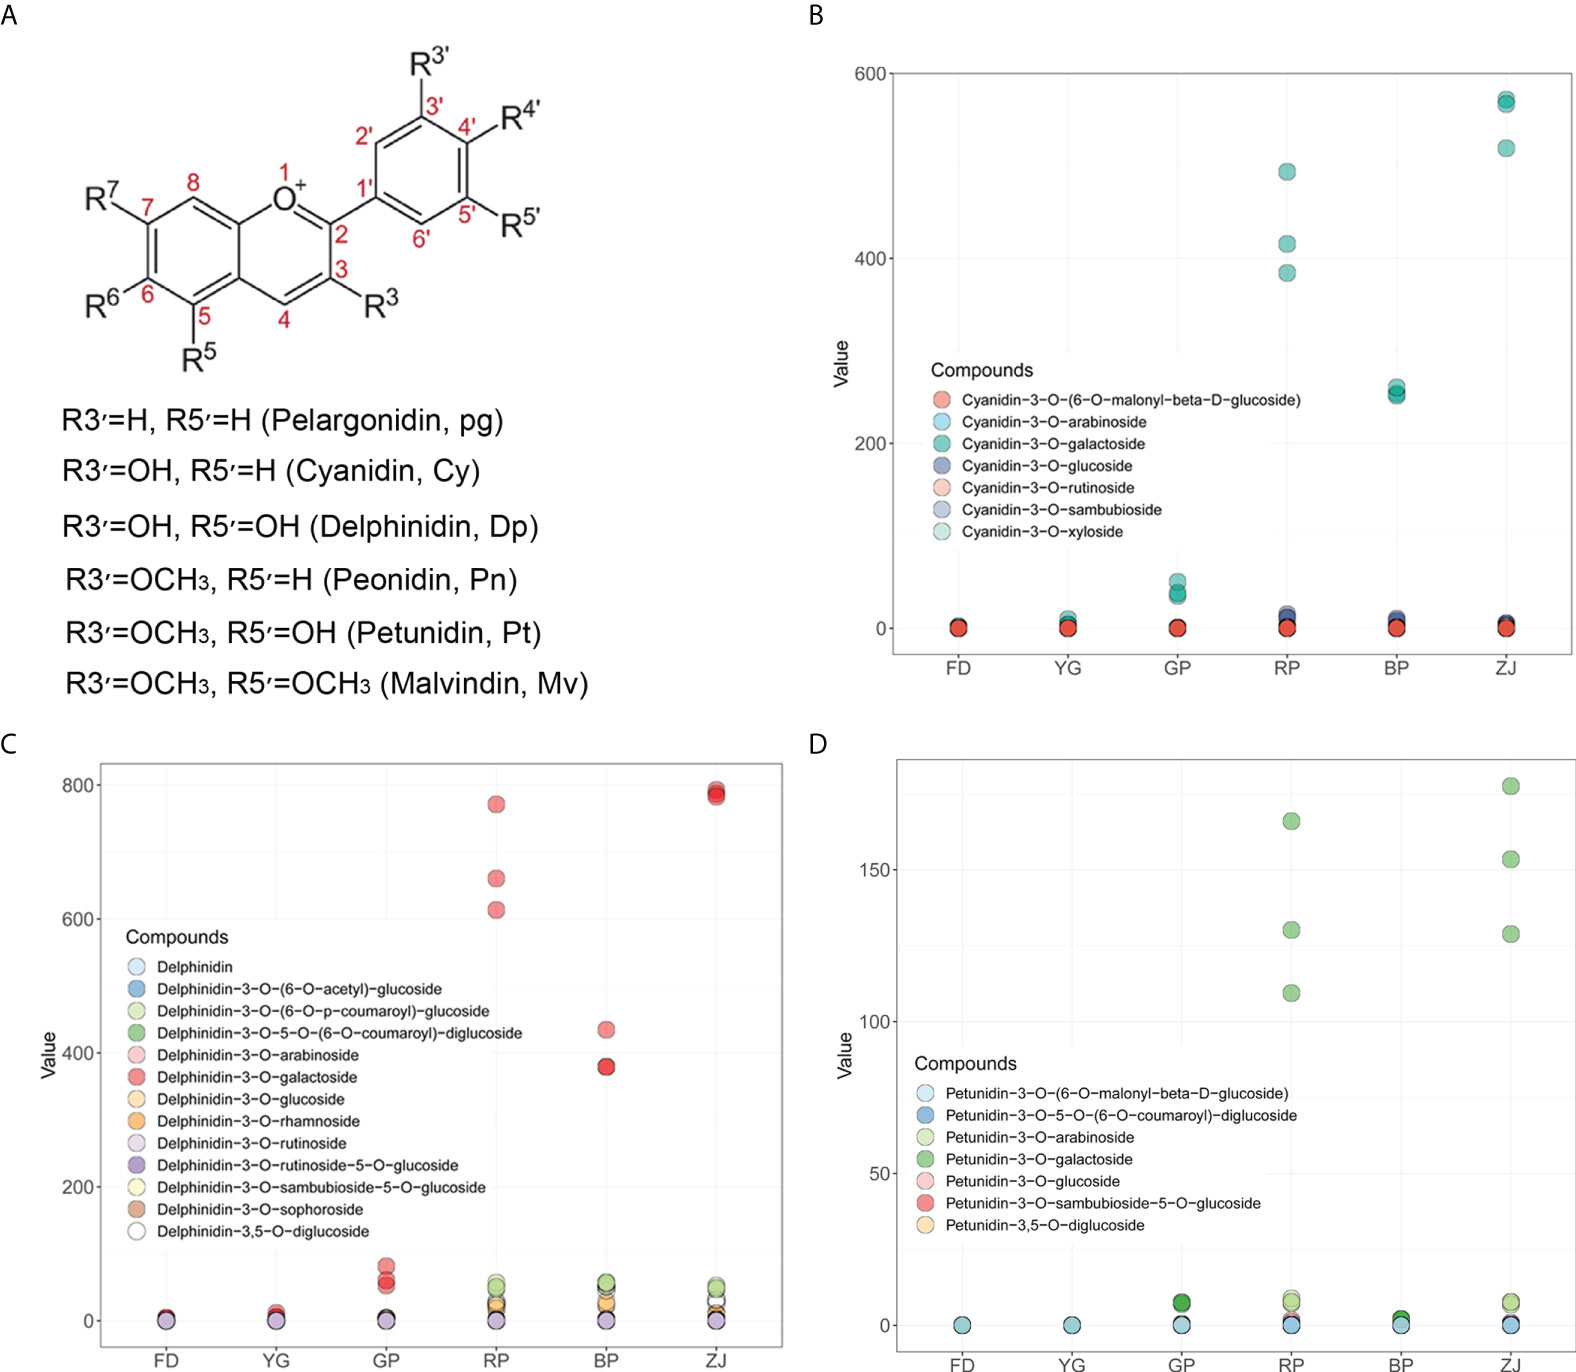
Figure 2 The main types of anthocyanins accumulation in C. sinensis. (A) The basic structure of anthocyanidins; (B) The accumulation variation of anthocyanins derived from Cy type in parents and F1 hybrid progenies; (C) The accumulation variation of anthocyanins derived from Dp type in parents and F1 hybrid progenies; (D) The accumulation variation of anthocyanins derived from Pt type in parents and F1 hybrid progenies.
Identification of differentially expressed genes using transcriptomic analyses
To investigate the mechanism which led to the anthocyanin various between parents and F1 groups, an RNA-seq library with the total RNA of tea plants leaf samples were constructed and a total of 43.76-57.21 million raw reads were produced by using the Illumina®HiSeq2500 platform (Table S3). After processing raw reads, 6.32-8.35 G clean base with a Q30 percentage of 92.07%-93.54% and GC content percentage of 43.71%-44.41% were obtained and been available for analyses (Table S3). All the reads were successfully annotated through alignment to the reference genome with percentage of 85.54%-87.24% (Table S3).
The differentially expressed genes (DEGs) were compared in all samples. In total, 21, 271 DEGs were identified, including a great deal of putative novel transcripts (Table S4). Cluster analysis showed that there was a high degree of consistency among biological duplications of DEGs (Figure 3A). In addition, the results showed that the DEGs patterns were remarkably opposite between the two parents (‘FD’ and ‘ZJ’) (Figure 3A). The number of DEGs had very high variance among different groups. The largest number of DEGs was found between ‘FD’ and ‘ZJ’ and the least number of DEGs was found between ‘FD’ and ‘YG’, which is the consistent with morphological phenotypes of the parents and F1 hybrid progenies (Figure 3B).
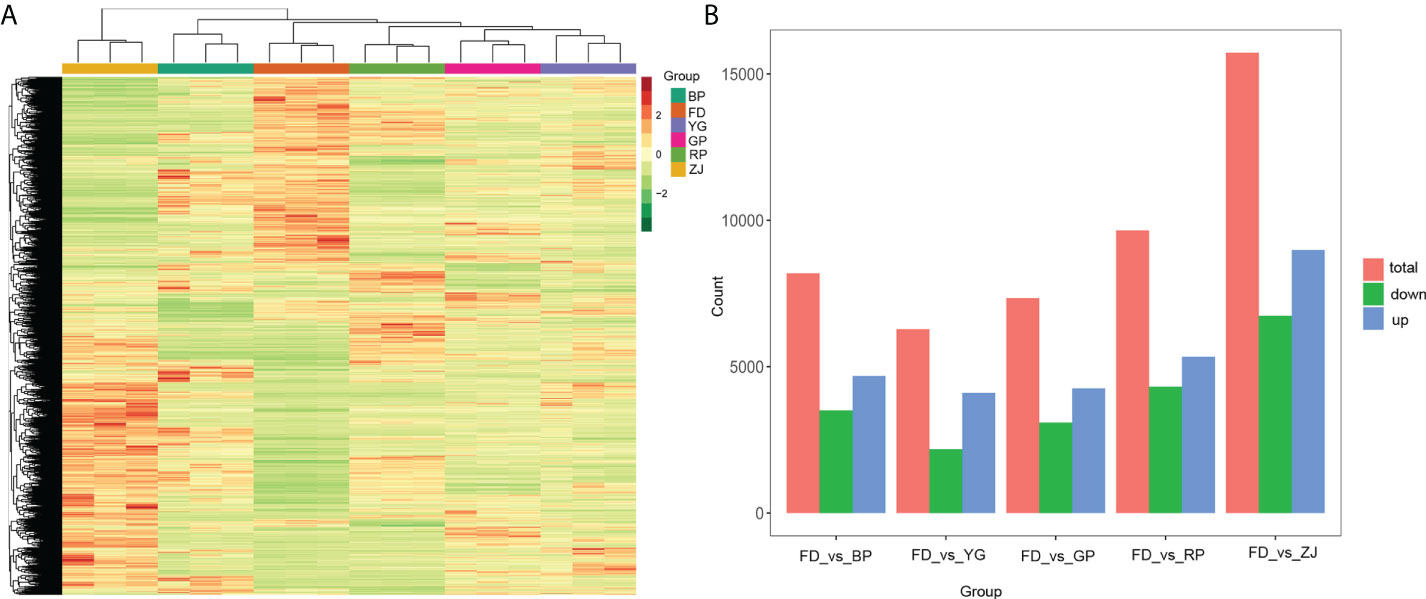
Figure 3 Differentially expressed genes (DEGs) at various sample groups. (A) The cluster analysis of all DEGs; (B) DEGs among ‘FD’_vs_’BP’, ‘FD’_vs_’YG’, ‘FD’_vs_’GP’, ‘FD’_vs_’RP’ and ‘FD’_vs_’ZJ’.
Differential genes expression in anthocyanin biosynthetic pathway
Anthocyanins are synthesized by the phenylpropanoid pathway through enzymatical shift of phenylalanine to 4-coumarol-CoA, resulting in entering the anthocyanin biosynthesis pathway (Figure 4A). In this study, enrichment analyses showed that 40 genes were involved in the anthocyanin biosynthesis pathway, which were differentially expressed between parents and F1 hybrid progenies (Figure 4B). The first step synthetic reaction was the phenylalanine de-amination reaction catalyzed by the phenylalanine ammonia-lyase (PLA) which is encoded by PLA gene. In the study, a PAL (CSS0018870) was up-regulation with the anthocyanin accumulation in ‘GP’, ‘RP’, ‘BP’ and ‘ZJ’ (Figure 4B). It was suggested that chalcone synthase played an important role in formation of anthocyanin precursors. In present study, nine CHI genes were identified by functional annotation, and among them, one CHI (CSS0034202) were up-expression with anthocyanin accumulation (Figure 4B). However, the expression pattern of PAL and CHI were not consistent with the RT-qPCR verification (Figures 5A, B). Two key ANS genes (CSS0010687 and CS0029211) were found in our dataset, notably, CSS0010687 (named CsANS1) was remarkable up-expression in the anthocyanins-rich cultivar (Figure 4B). Additionally, previous researches have been suggested that O-methyltransferase (OMT) modifies accumulation of methylated anthocyanin in plants (Gomez Roldan et al., 2014). In present study, three OMT genes (CSS0007434, CSS0027035 and CSS0033028) were identified and down-regulated in ‘BP’, ‘ZJ’, and ‘YG’ with dark-purple leaf (Figure 4B). Those results showed that the structural genes related to anthocyanins biosynthesis were differentially expressed.
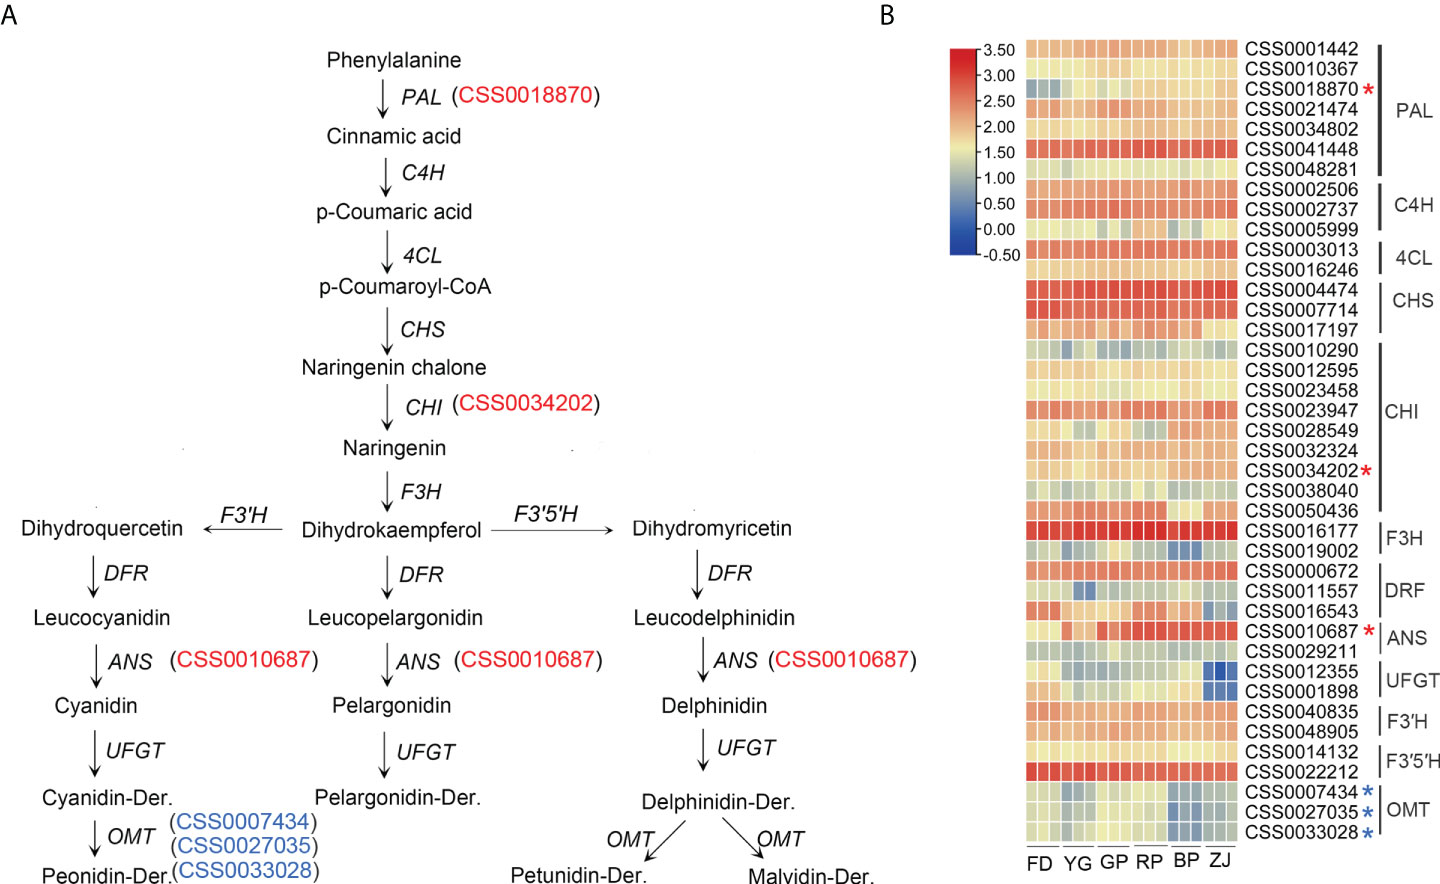
Figure 4 Transcript profiling of genes in the anthocyanin biosynthetic pathway. (A) anthocyanin biosynthetic pathway; (B) Heat map presentation of the expression patterns of anthocyanin-related genes The up-regulated genes in purple tea plants were marked by red "*", and the OMT genes were marked by blue "*" in (B).
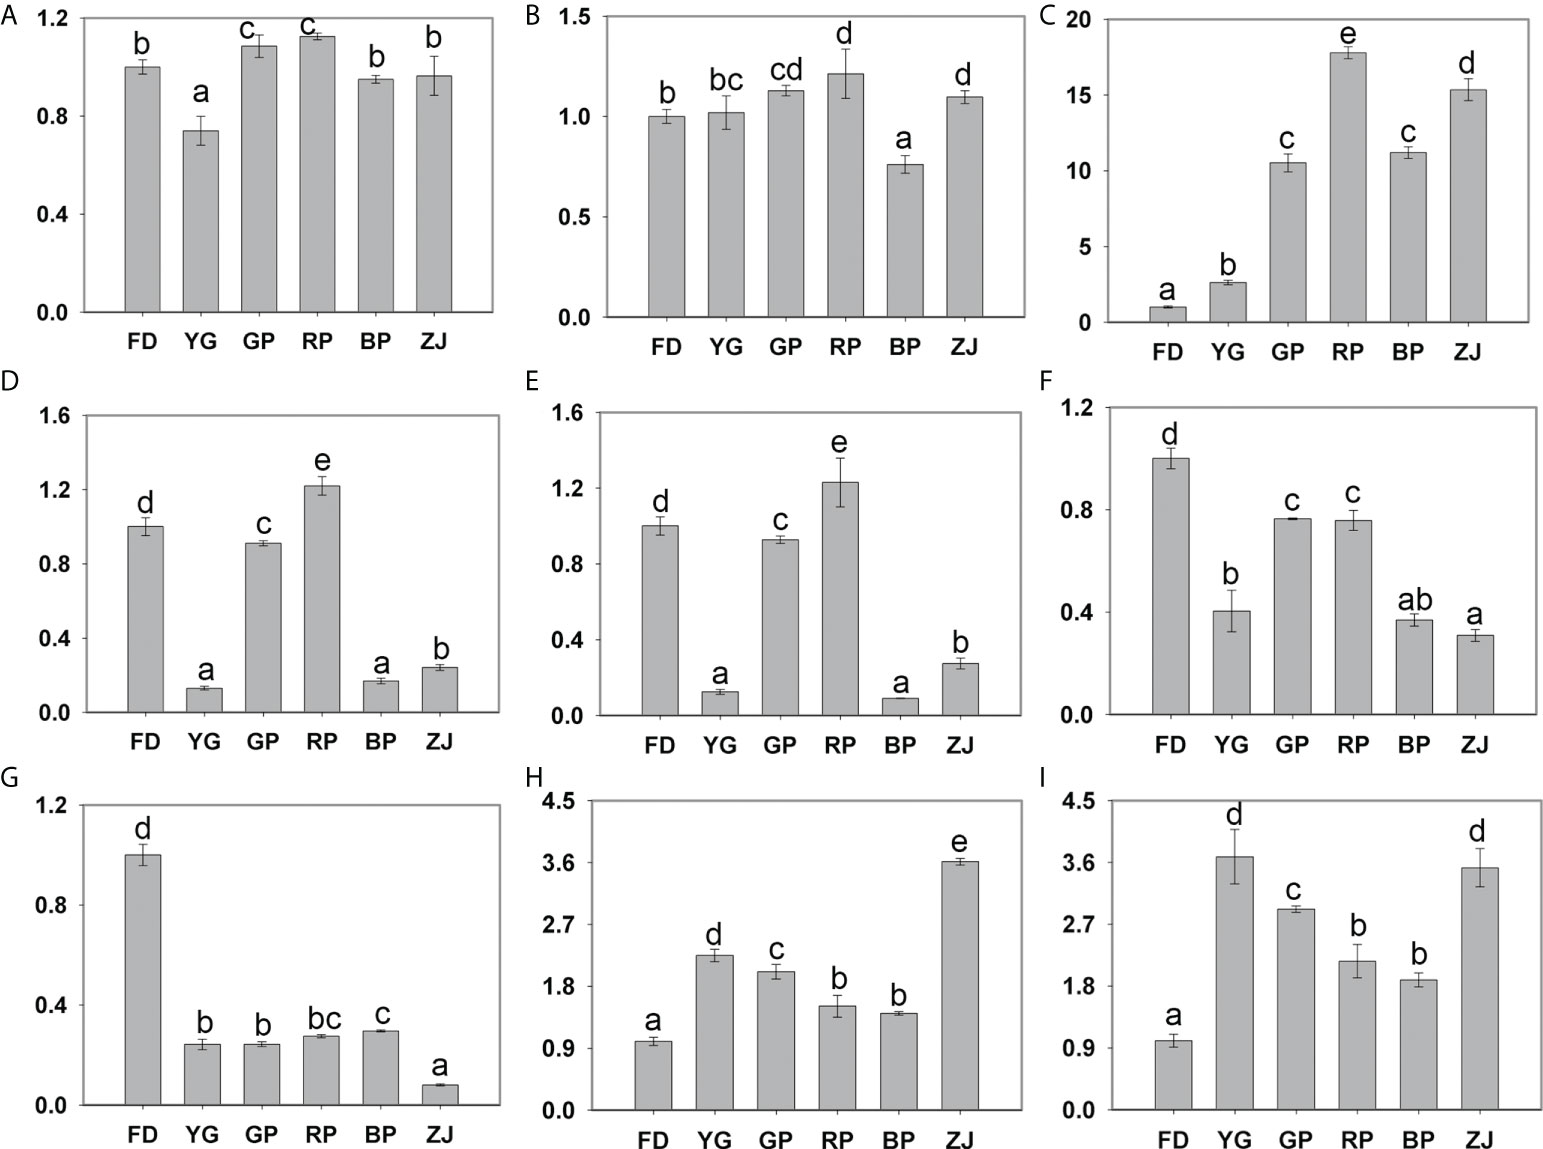
Figure 5 Expression of differentially expressed genes by RT-qPCR validation. (A) PAL (CSS0018870); (B) CHI (CSS0034202); (C) ANS (CSS0010687, CsANS1); (D) OMT (CSS0007434); (E) OMT (CSS0027035); (F) OMT (CSS0033028); (G) MYB family gene (CSS0015793); (H) MADS family gene (CSS0016295); (I) WRKY family gene (CSS0024910). Significant difference at p < 0.05 is indicated by different letters (a–e) above the columns.
Verification of anthocyanin-related genes by using RT-qPCR
To further verify the RNA-seq expression profile data, RT-qPCR assays were performed based on the six differentially expressed structural genes, including one PAL (CSS0018870), one CHI (CSS0034202), one CsANS1 (CSS0010687), three OMT (CSS0007434, CSS0027035 and CSS0033028) and three random selected TF genes (CSS0015793, CSS0016295 and CSS0024910). With respect to the results, all DEGs were found to be consistent with RNA-Seq data except PAL (CSS0018870) and CHI (CSS0034202) (Figure 5). Notably, the expression pattern of CsANS1 (CSS0010687) was significantly up-regulated in colored leaves of tea cultivars (‘GP’, ‘RP’, ‘BP’ and ‘ZJ’) (Figure 5C). In addition, the expression pattern of CSS0015793 and CSS0016295 were consistent with the transcriptomic analyses and that of CSS0024910 is inconsistent (Figures 5G–I and Table S4). Taken together, the remarkable up-regulation of CsANS1 directly contributed to the color variation through catalyzing anthocyanin biosynthesis in purple-leaf tea cultivars.
Identification of MBW complex members involved in the anthocyanin biosynthetic regulation
In order to identify the TFs involved in the anthocyanin-related regulation, all TFs detected in the RNA_seq data were filtrated based on the references of C. sinensis. A total of 2903 TFs were expressed in all samples, including MYB family, bHLH family, WD40 family, and WRKY family (Table S5). We first focused on the MBW complex which belongs to the key components regulating structural genes related to anthocyanin biosynthesis and found that the expression patterns of six genes (CSS0004715, CSS0005241, CSS0030514, CSS0006884, CSS0028445, CSS0037006) encoding MYB family members were associated with anthocyanin accumulation (Figure 6A). The expression of bHLH and WD40 family genes were also analyzed and no significant expression differences were found (Figure S2). Phylogenetic analyses found that all the MYB family members were grouped into the common clade except CSS0030514. Notably, the CSS0030514 (named CsAN1m in this study), homologous with AtMYB113 in Arabidopsis, had a much higher FPKM value in the RNA_seq data and significantly up-regulated with the increase of anthocyanin content (Figure 6A). Furthermore, CsAN1m was confidently clustered with CsAN1 which has been proven to be a MYB family gene responsible for positive regulation of the anthocyanin-related genes in ‘Zijuan’ tea plants (Figure 6B). However, CsAN1m was annotated in reference genome and only encode 92 residues with almost identical N-terminal sequences with CsAN1 (Figure 6C). Therefore, it is putative that the CsAN1m is the ortholog of CsAN1 with truncated mutation and probably lost regulatory functions.
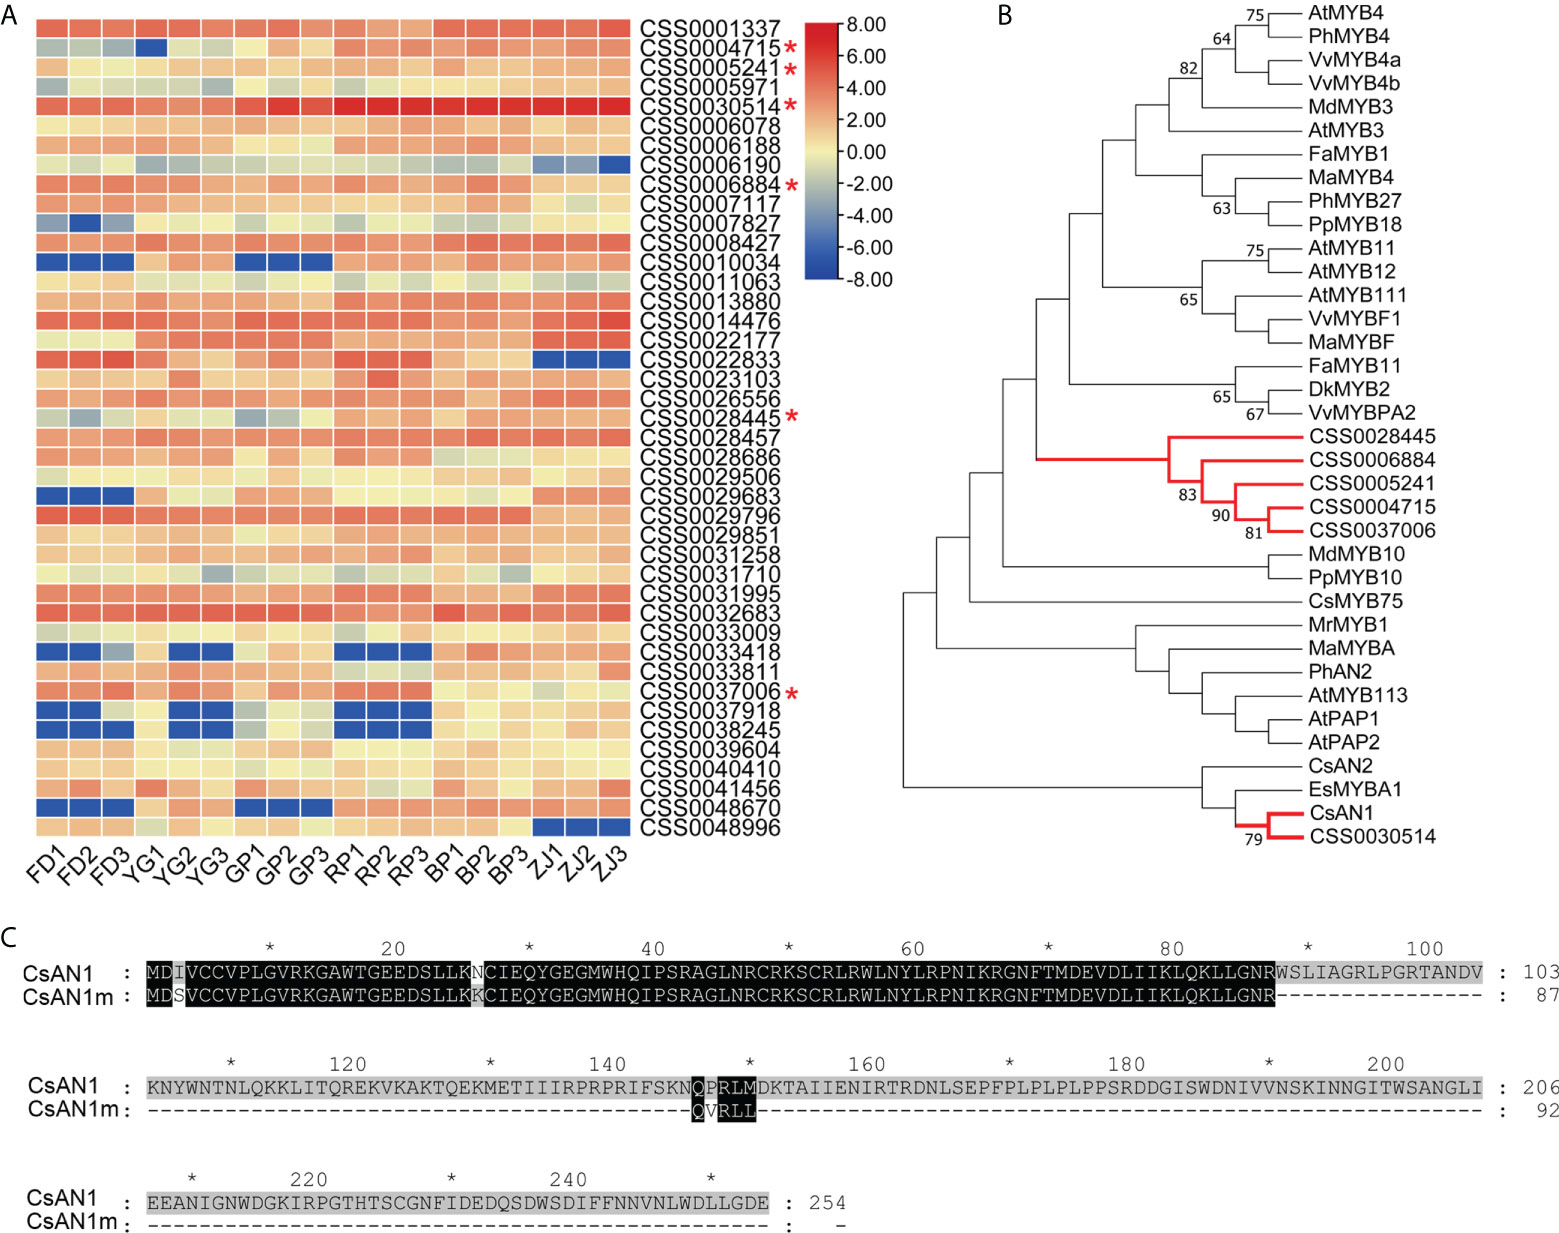
Figure 6 Identification of the MYB family members. (A) Heat map description of the expression patterns of MYB family members in parents and F1 hybrid progenies (the candidates of MYB family gene were marked by red "*"); (B) Phylogenetic analysis of candidate MYB family members; (C) Sequences alignment of CsAN1 (Gene bank accession: KU745295) and putative protein encoded by CsAN1m (CSS0030514) (the gray ‘*’ means the numbers spaced by ten).
CsAN1 responsible for key regulation of anthocyanin accumulation
To verify the existence and expression of CsAN1 and CsAN1m, we cloned and sequenced from all tested samples. Interestingly, all CsAN1 were successfully cloned from parents and F1 plants, while a fragment with 160-bp length was delated in green-leaf ‘FD’ and yellow-green leaf ‘YG’, named CsAN1d in this study (Figure 7A, B). We also designed the specific primer pair to cloned the CsAN1m, however, we just obtained it from green-leaf ‘FD’ and claret-colored leaf ‘RP’ (Figure S3). In addition, the expression pattern of CsAN1 was examined in tested cultivars, in consistent with prediction, the expression level was significantly up-regulated in anthocyanin-rich tea plants (Figure 7C). Taken together, it is putative that non-functional CsAN1 mutant (CsAN1d and CsAN1m) leads to the drawback of anthocyanin biosynthesis in ‘FD’ cultivar. While in ‘ZJ’ cultivar, a normal CsAN1 was sufficient to positively regulates the anthocyanin accumulation. And in F1 hybrid plants, CsAN1 mutant and normal CsAN1 were separated, resulting in anthocyanin content differences (Figure 7D).
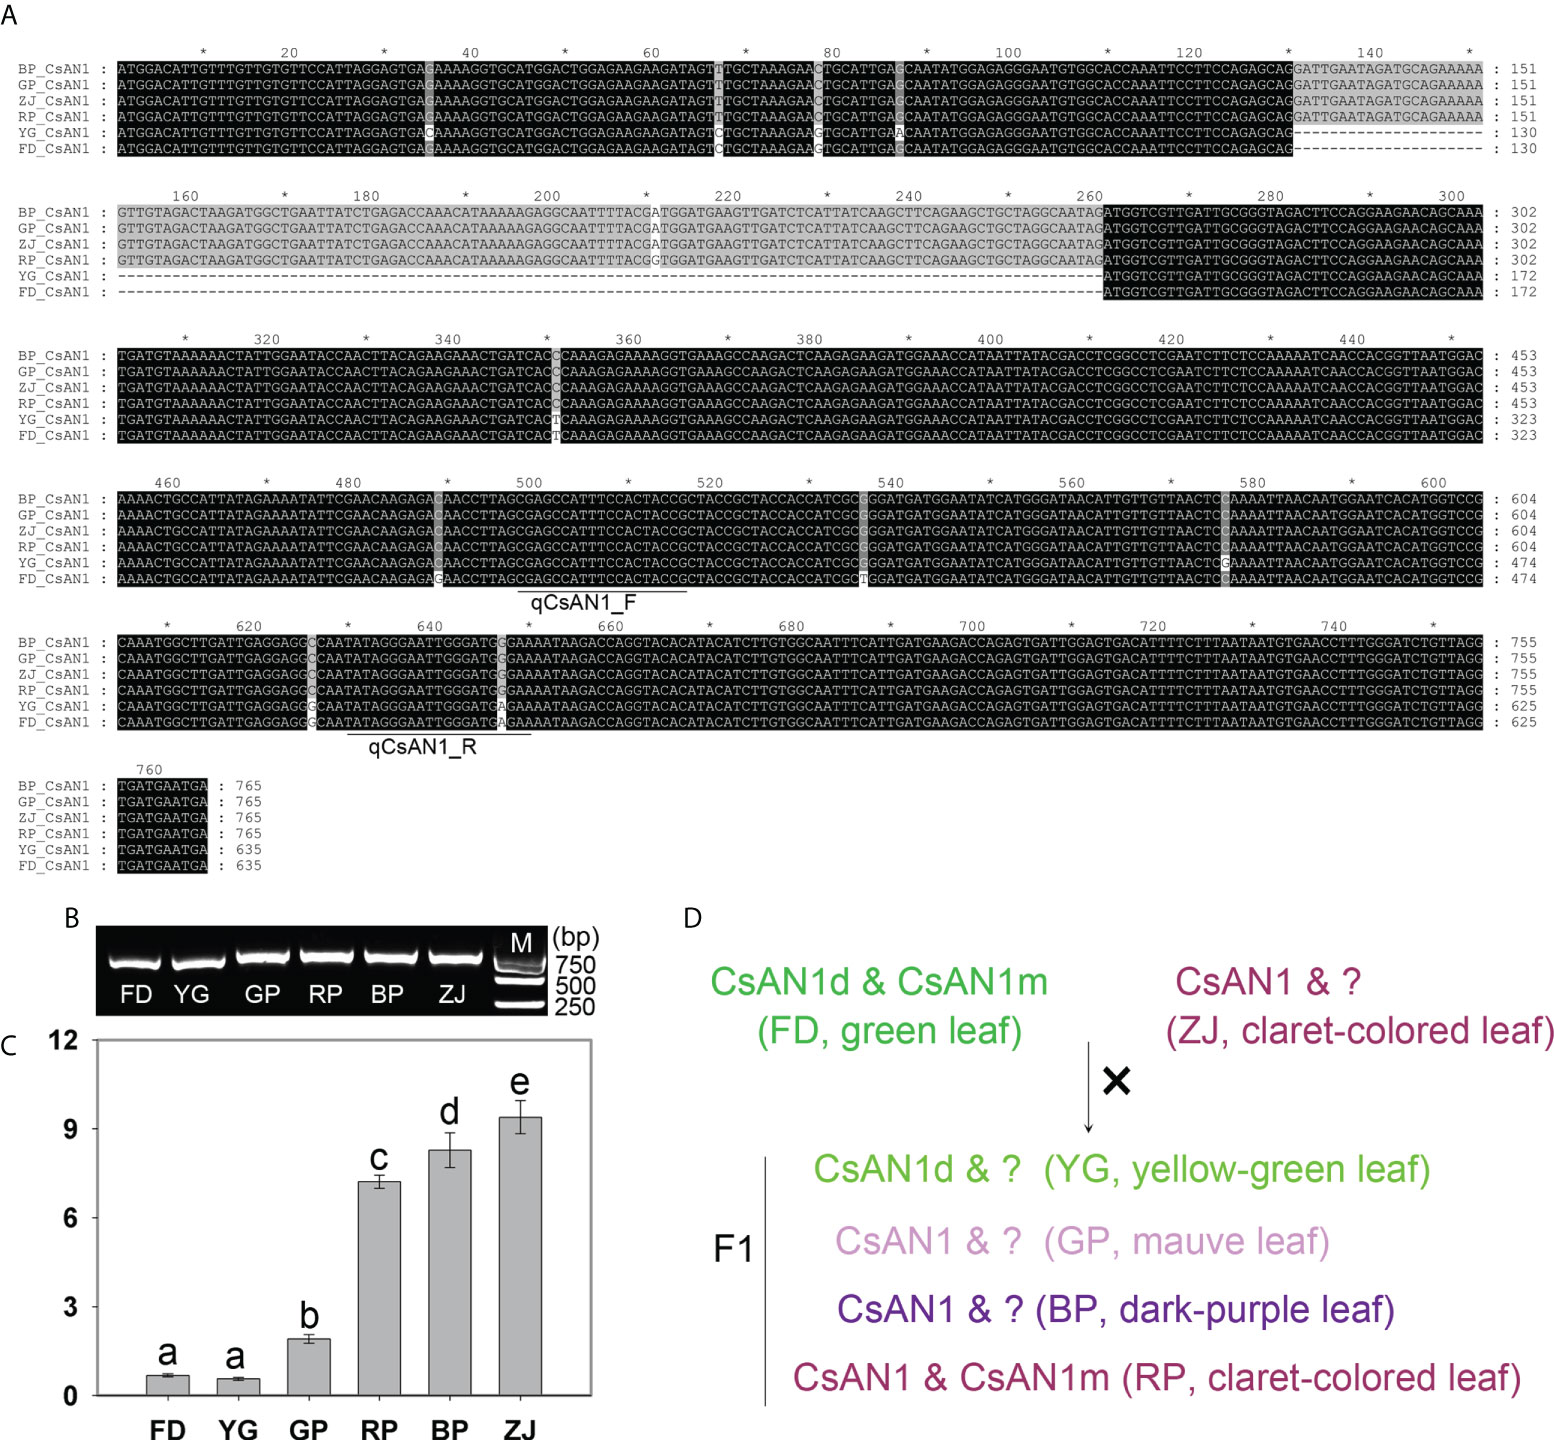
Figure 7 Cloning and expression analysis of CsAN1. (A) The sequence alignment of CsAN1 in the parents and F1 hybrids (the gray "*" means the numbers spaced by ten); (B) RT-PCR analysis of CsAN1 in the parents and F1 hybrids; (C) the expression pattern of CsAN1 in the parents and F1 hybrids; (D) The putative regulatoary model of anthocyanin accumulation in F1 hybrids. qCsAN1_F and qCsAN1_R was the primer pair for RT-qPCR detection. “?” represented the unknown CsAN1 ortholog. Significant difference at p < 0.05 is indicated by different letters (a-e) above the columns.
Discussion
Anthocyanins, belonging to flavonoids, were the key pigments for determining tea plants coloration, and they are synthesized by the phenylpropane metabolic pathway (Saito et al., 2011). Generally, anthocyanin structures are a composite of six types common anthocyanidin aglycon. ‘ZJ’ variety, an anthocyanin-rich tea cultivar, has been widely cultivated in the Yunnan province of China, as well as the amount of anthocyanins in ‘ZJ’ cultivar was up to 707 ± 28 μg/g of dry weight (Jiang et al., 2013). At least four main anthocyanins were successfully identified in previous study, including delphinidin-3-O-galactoside, cyanidin-3-O-D-galactoside, delphinidin-3-O-D-(6-(E)-pcoumaroyl) galactopyranoside and cyanidin-3-O-D-(6-(E)-p-coumaroyl) galactopyranoside (Jiang et al., 2013). In our study, six common members were also characterized by the widely targeted metabolomic analyses. Those results showed that cyanidin-3-O-galactoside, delphinidin-3-O-galactoside and petunidin-3-O-galactoside mainly contribute to the anthocyanin types and content, except the dark-purple ‘BP’ cultivar (Figures 1A and 2). In ‘BP’ cultivar, the petunidin-3-O-galactoside is scarcely accumulated and the accumulation level of cyanidin-3-O-galactoside and delphinidin-3-O-galactoside are much lower compared with deep-colored ‘RP’ and ‘ZJ’ varieties (Figure 2). Previous studies suggested that the peonidin-derivates (peonidin-der.) are methylated by the OMT. And more, the OMT also catalyzes the methylation reaction of delphinidin-derivates (delphinidin-der.) and transformed into petunidin and malvidin derivates (Gomez Roldanet al., 2014). In this study, three OMT were identified and have similar expression pattern with lower expression level in ‘BP’ and ‘YG’ comparing with ‘RP’ and ‘ZJ’ (Figures 4B, 5D–F). So, it is speculated that this is the reason caused the loss of petunidin-der. biosynthesis (Figure 2). Transcriptomic analysis suggested that the expression levels of the OMT were down-regulated in ‘YG’, ‘BP’, and ‘ZJ’, and that of them were higher in ‘FD’, ‘GP’, and ‘RP’ by transcriptomic analyses (Figure 4A), which is consistent with the RT-qPCR results (Figure D, E, F). However, the higher content Pt in ‘ZJ’, potentially own to the up-expressed of CsANS1 (CSS0010687) and the excessive accumulation of Dp (Figures 2C and 5C). Conversely, though the OMT were higher expression level in ‘FD’, the substrate accumulation for the methylation reaction was much less. Additionally, anthocyanin components also play a key role in leaf color. Cy, Pn, and Pt are the main anthocyanidins in pink and red leaf and dark red leaf, while Dp and Mv anthocyanidins are generally higher in purple black, blue purple, blue black and other dark leaf (Khoo et al., 2017). Therefore, the lower accumulation level of Cy and Pt potentially lead to the dark-purple leaf of ‘BP’ cultivar (Figure 2B).
Previous studies have certified that anthocyanin biosynthesis is mediated by multiple enzymes encoded by early structural genes (PAL, C4H, 4CL, CHS, CHI, and F3H) and late anthocyanin-specific biosynthesis genes (F3′;H, F3′;5′;H, DFR, ANS, UFGT and OMT) (Jaakola, 2013). In the present study, the expression pattern of all genes related to anthocyanin synthesis pathway were verified by the transcriptome analysis. The results suggested that the expression levels of PAL, CHI and ANS in purple cultivars were higher than those in green cultivars (Figure 4B). RT-qPCR was performed to verified the expression of those genes (Figures 5A–C). Though a previous study suggested that the PAL expression was upregulated in purple leaves of the ‘ZJ’ cultivar (Li et al., 2016), while the expression level of PLA was not obvious in parents and F1 hybrid plants by RT-qPCR analysis (Figure 5A). CHI is another important enzyme-coding gene in anthocyanin biosynthesis pathway, the RT-qPCR analysis showed that its expression difference was also insignificant (Figure 5B). Generally, transcriptome analysis is used for large-scale screening to reflect the overall gene expression trend of the sample, but it cannot guarantee that the change trend of every gene is consistent with that of RT-qPCR. ANS is one of the key enzymes that occur late in the anthocyanin synthesis pathway, and it can catalyze the conversion of leucodelphinidin, leucopelargonidin, and leucocyanidin to anthocyanins (Saito et al., 2002). We found that the expression level of CsANS1 in purple tea plants is considerably higher, which is consistent with the accumulation of anthocyanins content (Figures 1B and 5C). In addition, we found that the gene expression level of CsANS1 is slightly inconsistent with the anthocyanin content in ‘RP’ and ‘ZJ’, in which the expression of CsANS1 was up-regulated in ‘RP’ comparing with ‘ZJ’, but the anthocyanins content was lower in ‘ZJ’ (Figures 1B and 5C). In fact, the anthocyanin biosynthesis is regulated by different factors and even some negative regulatory factors (Sun et al., 2019; Li et al., 2020a). Therefore, it is reasonably putative that other regulators exclusively contribute to the anthocyanin content in tea cultivars. Thus, we also speculated that the high expression of CsANS1 is the key factor contributed to the color variation through catalyzing anthocyanin biosynthesis in purple-leaf tea cultivars.
Meanwhile, anthocyanin-related biosynthesis genes are regulated by the MYB-bHLH-WD40 (MBW) protein complex. In ‘Zijuan’ tree, the MBW complex regulates anthocyanin accumulation by upregulation mRNA expression of F3H, DFR and ANS (Sunet et al., 2016). In the present study, the MBW members were identified based on the transcriptomic analyses, respectively (Figure 6A and Figure S2). We found that a MYB family member, CsAN1m (CSS0030514), was significantly up-regulated with the expression of CsANS1 and anthocyanins accumulation (Figure 7C). Interestingly, CsAN1m and CsAN1 have highly identical N-terminal sequence (Figure 6C). It has been proven that the CsAN1, a MYB family member, can assembles into MBW complex and positively activates the expression of CsANS1, increasing the accumulation of anthocyanins in ‘ZJ’ cultivar (Sun et al., 2016). So, we speculated that the CsAN1m potentially mutated from CsAN1 during evolution, leading to the functional deficiency. Furthermore, the CsAN1 was cloned in all tested samples, and found that the CsAN1 has a 160-bp deletion mutation (CsAN1d) in anthocyanins-lacking ‘FD’ and ‘YG’. In fact, MYB TF mutation was reportedly involved in the regulation of anthocyanin biosynthesis. In grapevine, VvMYBA1 and VvMYBA2 are the switch genes for regulation of anthocyanin in the berry skin. The VvMYBA1 was shown not to be transcribed in white berries because of the insertion of a retrotransposon in the promoter, while VvMYBA2 is inactivated by two non-conservative mutations (Walker et al., 2007). Therefore, the function inactivation of the regulatory gene CsAN1 is responsible for the inability of anthocyanins accumulation in ‘FD’, and this trait is heritable in progenies through hybridization (Figure 7D). Notably, a functional CsAN1 was cloned, while the expression level was lower in ‘GP’, we assumed additional regulatory factors are involved in the regulation of anthocyanin biosynthesis and accumulation. From the previous results, other transcription factors (TFs), such as NAC, WRKY, bZIP, MADS and ERF, have also been proven to play a role in regulating anthocyanin biosynthesis (An et al., 2017; Sun et al., 2019; Li et al., 2020a; Yi et al., 2021).
Conclusion
In this study, the claret-colored leaf cultivar ‘ZJ’ and green-leaf cultivar ‘FD’ were first used as parents to generated F1 hybrid progenies. Anthocyanins accumulation differences were obviously observed between parents and offspring. Metabolic analyses showed that cyanidin-3-O-galactoside, delphinidin-3-O-galactoside and petunidin-3-O-galactoside mainly contribute to the anthocyanin content in colored tea plants. Transcriptomic analyses indicated that the up-regulated expression of anthocyanin synthesis gene, CsANS1, potentially served as the one of the key factors contributed to the anthocyanin accumulation in colored tea plants. And much higher expression of a MYB gene, CsAN1, is responsible for the anthocyanin accumulation in colored tea plants by positive regulation the expression of CsANS1.
Data availability statement
The data presented in the study are deposited in the NCBI repository, accession number PRJNA820473.
Author contributions
FH was responsible for the metabolic and transcriptomic analyses, and manuscript preparation. JD performed the hybrid assays. YuL performed the RT-qPCR and constructed discussions. YK was responsible for measurement of anthocyanin content. YiL and DD cloned the genes. YC prepared some figures with R scripts. SL was responsible for experiment design and reviewed the manuscript. All authors contributed to the article and approved the submitted version.
Funding
Natural Science Foundation of Hunan Province (2020JJ5276); Hunan Provincial Seed Industry Innovation Project (2021NK1008); Hunan Agricultural Innovation Fund (2022CX34).
Conflict of interest
The authors declare that the research was conducted in the absence of any commercial or financial relationships that could be construed as a potential conflict of interest.
Publisher’s note
All claims expressed in this article are solely those of the authors and do not necessarily represent those of their affiliated organizations, or those of the publisher, the editors and the reviewers. Any product that may be evaluated in this article, or claim that may be made by its manufacturer, is not guaranteed or endorsed by the publisher.
Supplementary material
The Supplementary Material for this article can be found online at: https://www.frontiersin.org/articles/10.3389/fpls.2022.1008588/full#supplementary-material
Supplementary Figure 1 | The less abundant anthocyanins accumulation in C. sinensis. (A) The accumulation variation of anthocyanins derived from malvidin type in parents and F1 hybrid progenies; (B) The accumulation variation of anthocyanins derived from pelargonidin type in parents and F1 hybrid progenies; (C) The accumulation variation of flavonoid in parents and F1 hybrid progenies; (D) The accumulation variation of procyanidins in parents and F1 hybrid progenies; (E) The accumulation variation of anthocyanins derived from peonidin type in parents and F1 hybrid progenies.
Supplementary Figure 2 | Heat map description of the expression patterns of bHLH (A) and WD40 (B) family members in parents and F1 hybrid progenies.
Supplementary Figure 3 | Cloning of CsAN1m from ‘FD’ and ‘RP’.
References
An, J. P., Qu, F. J., Yao, J. F., Wang, X. N., You, C. X., Wang, X. F., et al. (2017). The bZIP transcription factor MdHY5 regulates anthocyanin accumulation and nitrate assimilation in apple. Hortic. Res. 4, 17023. doi: 10.1038/hortres.2017.23
Chen, W., Gong, L., Guo, Z., Wang, W., Zhang, H., Liu, X., et al. (2013). A novel integrated method for large-scale detection, identification, and quantification of widely targeted metabolites: application in the study of rice metabolomics. Mol. Plant 6, 1769–1780. doi: 10.1093/mp/sst080
Chen, X., Wang, P., Zheng, Y., Gu, M., Lin, X., Wang, S., et al. (2020). Comparison of metabolome and transcriptome of flavonoid biosynthesis pathway in a purple-leaf tea germplasm jinmingzao and a green-leaf tea germplasm huangdan reveals their relationship with genetic mechanisms of color formation. Int. J. Mol. Sci. 21, 4167. doi: 10.3390/ijms21114167
Coutinho, I. B., Freitas, A., Macanita, A. L., Lima, J. C. (2015). Effect of water content on the acid-base equilibrium of cyanidin-3-glucoside. Food Chem. 172, 476–480. doi: 10.1016/j.foodchem.2014.09.060
Fu, M., Yang, X., Zheng, J., Wang, L., Yang, X., Tu, Y., et al. (2021). Unraveling the regulatory mechanism of color diversity in Camellia japonica petals by integrative transcriptome and metabolome analysis. Front. Plant Sci. 12. doi: 10.3389/fpls.2021.685136
Gambino, G., Perrone, I., Gribaudo, I. (2008). A rapid and effective method for RNA extraction from different tissues of grapevine and other woody plants. Phytochem. Anal. 19, 520–525. doi: 10.1002/pca.1078
Gomez Roldan, M. V., Outchkourov, N., van Houwelingen, A., Lammers, M., de la Fuente, R. I., Ziklo, N., et al. (2014). An O-methyltransferase modifies accumulation of methylated anthocyanins in seedlings of tomato. Plant J. 80, 695–708. doi: 10.1111/tpj.12664
Hayat, K., Iqbal, H., Malik, U., Bilal, U., Mushtaq, S. (2015). Tea and its consumption: benefits and risks. Crit. Rev. Food Sci. Nutr. 55, 939–954. doi: 10.1080/10408398.2012.678949
Hiroshi, S., Shoketsu, H., Seikou, N., Hisashi, M. (2015). Purple tea and its extract suppress diet-induced fat accumulation in mice and human subjects by inhibiting fat absorption and enhancing hepatic carnitine palmitoyltransferase expression. Int. J. BioMed. Sci. 11, 67–75.
Hsu, C. P., Shih, Y. T., Lin, B. R., Chiu, C. F., Lin, C. C. (2012). Inhibitory effect and mechanisms of an anthocyanins- and anthocyanidins-rich extract from purple-shoot tea on colorectal carcinoma cell proliferation. J. Agric. Food Chem. 60, 3686–3692. doi: 10.1021/jf204619n
Jaakola, L. (2013). New insights into the regulation of anthocyanin biosynthesis in fruits. Trends Plant Sci. 18, 477–483. doi: 10.1016/j.tplants.2013.06.003
Jaakola, L., Poole, M., Jones, M. O., Kamarainen-Karppinen, T., Koskimaki, J. J., Hohtola, A., et al. (2010). A SQUAMOSA MADS box gene involved in the regulation of anthocyanin accumulation in bilberry fruits. Plant Physiol. 153, 1619–1629. doi: 10.1104/pp.110.158279
Jiang, L., Shen, X., Shoji, T., Kanda, T., Zhou, J., Zhao, L. (2013). Characterization and activity of anthocyanins in zijuan tea (Camellia sinensis var. kitamura). J. Agric. Food Chem. 61, 3306–3310. doi: 10.1021/jf304860u
Khoo, H. E., Azlan, A., Tang, S. T., Lim, S. M. (2017). Anthocyanidins and anthocyanins: colored pigments as food, pharmaceutical ingredients, and the potential health benefits. Food Nutr. Res. 61, 1361779. doi: 10.1080/16546628.2017.1361779
Koch, W., Zagorska, J., Marzec, Z., Kukula-Koch, W. (2019). Applications of tea (Camellia sinensis) and its active constituents in cosmetics. Molecules. 24, 4227–4305. doi: 10.3390/molecules24234277
Li, J., Hossain, M. S., Ma, H., Yang, Q., Gong, X., Yang, P., et al. (2020b). Comparative metabolomics reveals differences in flavonoid metabolites among different coloured buckwheat flowers. J. Food Compos. Anal. 85, 103335. doi: 10.1016/j.jfca.2019.103335
Li, J., Lv, X., Wang, L., Qiu, Z., Song, X., Lin, J., et al. (2016). Transcriptome analysis reveals the accumulation mechanism of anthocyanins in ‘Zijuan’ tea (Camellia sinensis var. asssamica (Masters) kitamura) leaves. Plant Growth Regulation 81, 51–61. doi: 10.1007/s10725-016-0183-x
Livak, K. J., Schmittgen, T. D. (2001). Analysis of relative gene expression data using real-time quantitative PCR and the 2-ΔΔCT method. Methods. 25, 402–408. doi: 10.1006/meth.2001.1262
Li, C., Wu, J., Hu, K. D., Wei, S. W., Sun, H. Y., Hu, L. Y., et al. (2020a). PyWRKY26 and PybHLH3 cotargeted the PyMYB114 promoter to regulate anthocyanin biosynthesis and transport in red-skinned pears. Hortic. Res. 7, 37. doi: 10.1038/s41438-020-0254-z
Nabavi, S. M., Samec, D., Tomczyk, M., Milella, L., Russo, D., Habtemariam, S., et al. (2020). Flavonoid biosynthetic pathways in plants: Versatile targets for metabolic engineering. Biotechnol. Adv. 38, 107316. doi: 10.1016/j.biotechadv.2018.11.005
Ramsay, N. A., Glover, B. J. (2005). MYB-bHLH-WD40 protein complex and the evolution of cellular diversity. Trends Plant Sci. 10, 63–70. doi: 10.1016/j.tplants.2004.12.011
Rashid, K., Wachira, F. N., Nyabuga, J. N., Wanyonyi, B., Murilla, G., Isaac, A. O. (2014a). Kenyan Purple tea anthocyanins ability to cross the blood brain barrier and reinforce brain antioxidant capacity in mice. Nutr. Neurosci. 17, 178–185. doi: 10.1179/1476830513Y.0000000081
Rashid, K., Wachira, F. N., Nyariki, J. N., Isaac, A. O. (2014b). Kenyan Purple tea anthocyanins and coenzyme-Q10 ameliorate post treatment reactive encephalopathy associated with cerebral human African trypanosomiasis in murine model. Parasitol. Int. 63, 417–426. doi: 10.1016/j.parint.2014.01.001
Rothenberg, D. O., Yang, H., Chen, M., Zhang, W., Zhang, L. (2019). Metabolome and transcriptome sequencing analysis reveals anthocyanin metabolism in pink flowers of anthocyanin-rich tea (Camellia sinensis). Molecules. 24, 1064–1087. doi: 10.3390/molecules24061064
Saito, T., Honma, D., Tagashira, M., Kanda, T., Nesumi, A., Maeda-Yamamoto, M. (2011). Anthocyanins from new red leaf tea 'Sunrouge'. J. Agric. Food Chem. 59, 4779–4782. doi: 10.1021/jf200250g
Saito, K., Kobayashi, M., Gong, Z., Tanaka, Y., Yamazaki, M. (2002). Direct evidence for anthocyanidin synthase as a 2-oxoglutarate-dependent oxygenase. Plant J. 17, 9. doi: 10.1046/j.1365-313X.1999.00365.x
Sun, Q., Jiang, S., Zhang, T., Xu, H., Fang, H., Zhang, J., et al. (2019). Apple NAC transcription factor MdNAC52 regulates biosynthesis of anthocyanin and proanthocyanidin through MdMYB9 and MdMYB11. Plant Sci. 289, 110286. doi: 10.1016/j.plantsci.2019.110286
Sun, B., Zhu, Z., Cao, P., Chen, H., Chen, C., Zhou, X., et al. (2016). Purple foliage coloration in tea (Camellia sinensis l.) arises from activation of the R2R3-MYB transcription factor CsAN1. Sci. Rep. 6, 32534. doi: 10.1038/srep32534
Tang, H., Tang, J., Liu, J., Zhou, B., Chen, Y. (2021). Metabolomics analyses reveal anthocyanins-rich accumulation in naturally mutated purple-leaf tea (Camellia sinensis l.). All Life. 14, 744–755. doi: 10.1080/26895293.2021.1968509
Tirumalai, V., Swetha, C., Nair, A., Pandit, A., Shivaprasad, P. V. (2019). MiR828 and miR858 regulate VvMYB114 to promote anthocyanin and flavonol accumulation in grapes. J. Exp. Bot. 70, 4775–4792. doi: 10.1093/jxb/erz264
Turkozu, D., Sanlier, N. (2017). L-theanine, unique amino acid of tea, and its metabolism, health effects, and safety. Crit. Rev. Food Sci. Nutr. 57, 1681–1687. doi: 10.1080/10408398.2015.1016141
Walker, A. R., Lee, E., Bogs, J., McDavid, D. A., Thomas, M. R., Robinson, S. P. (2007). White grapes arose through the mutation of two similar and adjacent regulatory genes. Plant J. 49, 772–785. doi: 10.1111/j.1365-313X.2006.02997.x
Wang, W. L., Wang, Y. X., Li, H., Liu, Z. W., Cui, X., Zhuang, J. (2018). Two MYB transcription factors (CsMYB2 and CsMYB26) are involved in flavonoid biosynthesis in tea plant [Camellia sinensis (L.) o. kuntze]. BMC Plant Biol. 18, 288. doi: 10.1186/s12870-018-1502-3
Wei, C., Yang, H., Wang, S., Zhao, J., Liu, C., Gao, L., et al. (2018). Draft genome sequence of Camellia sinensis var. sinensis provides insights into the evolution of the tea genome and tea quality. Proc. Natl. Acad. Sci. U. S. A. 115, E4151–E4158. doi: 10.1073/pnas.1719622115
Yi, D., Zhnag, H., Lai, B., Liu, L., Pan, X., Ma, Z., et al. (2021). Integrative analysis of the coloring mechanism of red longan pericarp through metabolome and transcriptome analyses. J. Agr. Food Chem. 69, 9. doi: 10.1021/acs.jafc.0c05023
Zhao, M., Zhang, N., Gao, T., Jin, J., Jing, T., Wang, J., et al. (2020). Sesquiterpene glucosylation mediated by glucosyltransferase UGT91Q2 is involved in the modulation of cold stress tolerance in tea plants. New Phytol. 226, 362–372. doi: 10.1111/nph.16364
Zheng, X., Tian, S. (2006). Effect of oxalic acid on control of postharvest browning of litchi fruit. Food Chem. 96, 519–523. doi: 10.1016/j.foodchem.2005.02.049
Zhou, Y., Zhou, H., Lin-Wang, K., Vimolmangkang, S., Espley, R. V., Wang, L., et al. (2014). Transcriptome analysis and transient transformation suggest an ancient duplicated MYB transcription factor as a candidate gene for leaf red coloration in peach. BMC Plant Biol. 14, 388. doi: 10.1186/s12870-014-0388-y
Keywords: purple-leaf tea, anthocyanins, metabolomics, CsANS1, MYB
Citation: Huang F, Duan J, Lei Y, Kang Y, Luo Y, Chen Y, Ding D and Li S (2022) Metabolomic and transcriptomic analyses reveal a MYB gene, CsAN1, involved in anthocyanins accumulation separation in F1 between ‘Zijuan’ (Camellia sinensis var. assamica) and ‘Fudingdabaicha’ (C. sinensis var. sinensis) tea plants. Front. Plant Sci. 13:1008588. doi: 10.3389/fpls.2022.1008588
Received: 01 August 2022; Accepted: 01 September 2022;
Published: 21 September 2022.
Edited by:
Deyu Xie, North Carolina State University, United StatesReviewed by:
Yanjie Zhang, Zhengzhou University, ChinaZiyin Yang, South China Botanical Garden, Chinese Academy of Sciences (CAS), China
Shengrui Liu, Anhui Agricultural University, China
Copyright © 2022 Huang, Duan, Lei, Kang, Luo, Chen, Ding and Li. This is an open-access article distributed under the terms of the Creative Commons Attribution License (CC BY). The use, distribution or reproduction in other forums is permitted, provided the original author(s) and the copyright owner(s) are credited and that the original publication in this journal is cited, in accordance with accepted academic practice. No use, distribution or reproduction is permitted which does not comply with these terms.
*Correspondence: Saijun Li, aG5oamhsc2pAMTI2LmNvbQ==
†These authors have contributed equally to this work and share first authorship