
95% of researchers rate our articles as excellent or good
Learn more about the work of our research integrity team to safeguard the quality of each article we publish.
Find out more
ORIGINAL RESEARCH article
Front. Plant Sci. , 09 January 2023
Sec. Plant Biotechnology
Volume 13 - 2022 | https://doi.org/10.3389/fpls.2022.1006719
 Ludovic J. A. Capo-chichi1
 Ammar Elakhdar2,3*
 Takahiko Kubo2
 Joseph Nyachiro4Patricia Juskiw4
 Flavio Capettini4
 Jan J. Slaski5
 Guillermo Hernandez Ramirez1Aaron D. Beattie6
Studying the population structure and genetic diversity of historical datasets is a proposed use for association analysis. This is particularly important when the dataset contains traits that are time-consuming or costly to measure. A set of 96 elite barley genotypes, developed from eight breeding programs of the Western Canadian Cooperative Trials were used in the current study. Genetic diversity, allelic variation, and linkage disequilibrium (LD) were investigated using 5063 high-quality SNP markers via the Illumina 9K Barley Infinium iSelect SNP assay. The distribution of SNPs markers across the barley genome ranged from 449 markers on chromosome 1H to 1111 markers on chromosome 5H. The average polymorphism information content (PIC) per locus was 0.275 and ranged from 0.094 to 0.375. Bayesian clustering in STRUCTURE and principal coordinate analysis revealed that the populations are differentiated primarily due to the different breeding program origins and ear-row type into five subpopulations. Analysis of molecular variance based on PhiPT values suggested that high values of genetic diversity were observed within populations and accounted for 90% of the total variance. Subpopulation 5 exhibited the most diversity with the highest values of the diversity indices, which represent the breeding program gene pool of AFC, AAFRD, AU, and BARI. With increasing genetic distance, the LD values, expressed as r2, declined to below the critical r2 = 0.18 after 3.91 cM, and the same pattern was observed on each chromosome. Our results identified an important pattern of genetic diversity among the Canadian barley panel that was proposed to be representative of target breeding programs and may have important implications for association mapping in the future. This highlight, that efforts to identify novel variability underlying this diversity may present practical breeding opportunities to develop new barley genotypes.
Cultivated barley is among the oldest domesticated plants (Von Bothmer and Komatsuda, 2010). It is originated from wild barley (Hordeum vulgare L. ssp.) and is distributed through the Middle East, mostly falling into different classes according to phenology, morphology, and end-use: two-row vs. six-row, winter types vs. spring types, hulled vs. hull-less, feed barley vs. malting barley (Blake et al., 2011). Barley is adapted to a wide range of environmental conditions: withstands dry-hot climates, extensive salinity and marginal soils, in addition to a broad range of soil pH conditions (Weltzien, 1988; Pasam et al., 2014; Elakhdar et al., 2022), and low temperatures which is mainly based on an adaptive response. The adaptive responses refer to hardening or cold acclimation that activates by growth at low temperatures (Stanca et al., 2003). Barley is grown through different agroecological zones, from 46° S in Chile to 70° N in Norway (Leff et al., 2004). The physiological, morphological, and functional adaptation in barley reveals the fundamentals of genetic diversity which may assist to elucidate the environmental adaptation of this plant (Graner et al., 2003). In 2022, Canada ranked 4th for barley production globally after Russia, France, and Germany (Faostat, 2022). The total production of barley in Western Canada is estimated at 10,416,300 tonnes in the 2020 (Marta and Tricia, 2020). In the past, barley was used as human food but evolved mostly into a feed, and grain brewing (Baik and Ullrich, 2008; Graner et al., 2010). Due to the high levels of beneficial components for the human diet, barley now used as a functional food improvement (Dvořáková et al., 2008; Galli et al., 2020). The main advantage of barley in different food products and their consumption stems from barley’s potential health benefits. For example, several studies have shown that β-glucan soluble fiber from oat and barley can lower total and LDL cholesterol and thus play a role in both the prevention and management of cardiovascular disease (Ames and Rhymer, 2008).
Genetic improvement of crops depends on the level of variations in the germplasm which can be discovered by a specific and/or a combination of approaches (Mackay and Powell, 2007). Genetic diversity within a given gene pool reduces the vulnerability of crops to biotic and abiotic stress (Pasam et al., 2014). Hence, it is necessary to incorporate new sources of genetic diversity in breeding programs to achieve higher levels of tolerance to different environmental stress for increased yield. Studying genetic diversity is an essential tool for crop improvement through elucidating the diversity between the parental lines before the hybridization and introgression of desirable genes into elite genotypes (Chabane et al., 2005). The information provided by these studies has contributed to a better understanding of how germplasm collections are maintained over a long time (Mcclean et al., 2012). In association mapping studies, illustrating genetic diversity and population structure is also critical since the latter can lead to spurious associations (Gyawali et al., 2016). The benefit of this is particularly great when the dataset contains traits that time-consuming and/or are expensive to measure (Beattie et al., 2010). Thus, studying genetic diversity will support identifying genomic regions of related traits that control the phenotypic variation (Amezrou et al., 2017).
Several molecular markers have been used to measure genetic diversity, population structure, association studies, evolutionary origin, and breeding applications in barley. So far, simple sequence repeats (SSRs), Diversity arrays Technology (DArT), and single-nucleotide polymorphisms (SNPs) based on next-generation sequencing (NGS) have been utilized intensively in barley genetic diversity studies (Rafalski, 2002; Kumar et al., 2012; Elakhdar et al., 2016a; Elakhdar et al., 2016b; Elakhdar et al., 2018; Capo-Chichi et al., 2021). In barley, high-throughput SNP genotyping has revolutionized genome-wide association (GWAS) and gene mapping studies in recent years due to the development of high-throughput genotyping platforms. The barley 9 K iSelect Illumina SNP platform offers whole-genome coverage with enough genetic characterization, that will make the diversity contained in a given germplasm collection efficiently available to barley breeders (Malysheva-Otto et al., 2006; Comadran et al., 2009). Determining the density of markers necessary for association mapping or genomic selection is depending on linkage disequilibrium (LD) decay (Nordborg and Tavaré, 2002). Numerous studies of genetic diversity and LD have been highlighted in cultivated barley worldwide (Malysheva-Otto et al., 2006; Saisho and Purugganan, 2007) European genotypes (Rostoks et al., 2006), or North Africa (Elakhdar et al., 2016b; Elakhdar et al., 2018; Sallam et al., 2018). The results of these studies display a strong genetic structure within different collections of barley, with major groups corresponding to growth-habit and row-type (Elakhdar et al., 2018). Considering that barley is thought to have been domesticated twice, the differences in population genetic characteristics of these barley groups are likely to reflect their differences in breeding histories as well as differences in domestication histories (Morrell and Clegg, 2007).
To build on Canada’s position as a supplier of premium quality barley yield production, the Western Canadian cooperative trials breeding program aims to develop barley varieties with improved traits. For that purpose, a cooperative trial has been formalized in Western Canada in which 25 to 35 lines are evaluated annually in 15 to 20 locations. The result is an extensive collection of historical data demonstrating a wide variety of elite barley genotypes that can be used to discover desirable alleles through association mapping. With such unbalanced historical datasets, association mapping has been constructed for yield in barley (Kraakman et al., 2004; Beattie et al., 2010). The present study is the first to explore the genetic diversity within the Western Canadian barley cooperative trials collections using the Illumina iSelect SNP array. This study aims to (i) investigate the diversity patterns in 96 elite barley genotypes from eight breeding programs of the Western Canadian Cooperative Trials, (ii) assess LD decay in different subpopulations, and (iii) compare the level of polymorphism between the germplasm.
A set of 96 elite barley genotypes from Western Canadian breeding programs were used in this study. These panel from eight barley breeding programs and were grown at different times between 1994 and 2016 (Table 1). The panel consisting of registered cultivars, advanced breeding lines, and two-row lines for study limit dextrinase and beta-glucanase that have been evaluated over 15 years in the Western Two-Row Cooperative registration (Beattie et al., 2010). The advanced promising lines were selected based on their high percentage seed yield. Ninety-two lines of this population were used in the previous project (FHB screening of CDC barley breeding selections, 2011-2016). The registered cultivars include well-known cultivars, ‘CDC Kendall’, ‘AC Metcalfe’, ‘Harrington’, ‘CDC Copeland’, ‘CDC Landis’, ‘CDC Meredith’, ‘Merit 16’, ‘CDC Reserve’, and ‘Bentley’.
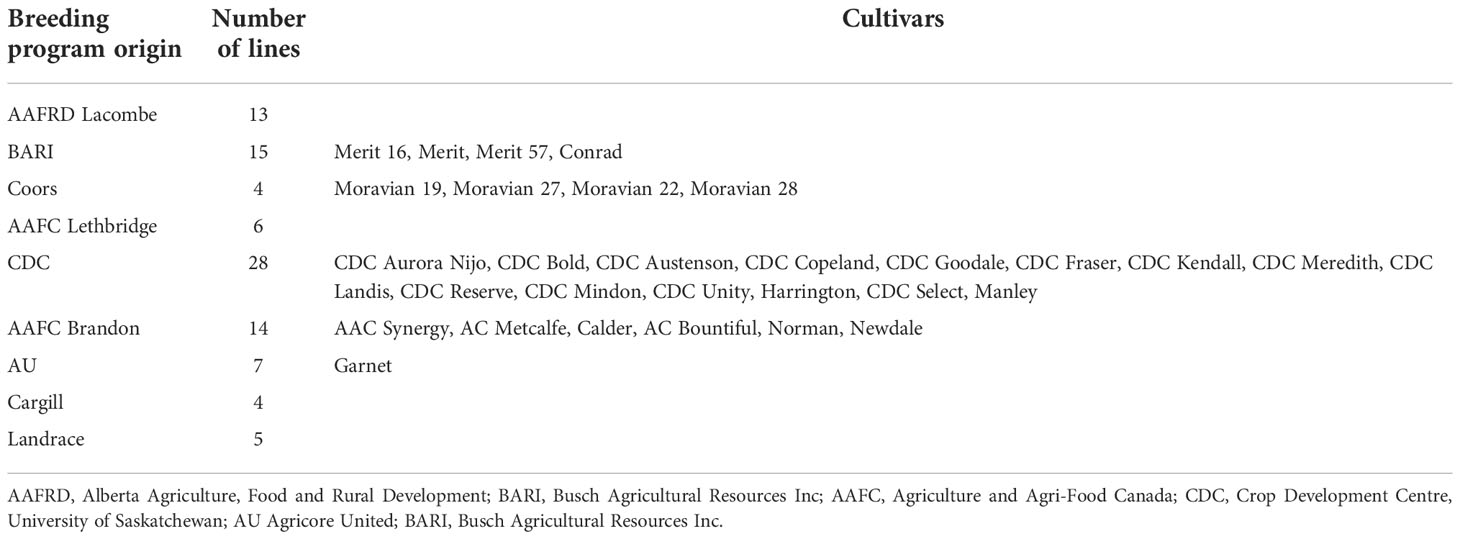
Table 1 The breeding program origin for barley lines in the current study.
Genomic DNA was collected from the young leaf tissue from each of the 96 genotypes using the DNeasy Plant Mini Kit (Qiagen, Hilden, Germany), then quantified at 230/260 and 260/280 absorption ratios. The barley panel was genotyped using an Illumina 9K barley Infinium iSelect SNP assay at the USDA-ARS Genotyping Laboratory, Fargo, ND, USA. The 9K barley SNP assay can interrogate approximately 9,000 SNP markers, containing the 1,596 SNPs on BOPA1 loci (https://bioinf.hutton.ac.uk/iselect/app/index.pl). The markers with unknowing chromosomal positions, monomorphic or had a minor allele frequency of<0.05, and SNPs with missing values of more than 20% of the genotypes were removed. Only, the markers with genetic and physical position information on the 9K SNP array were used. A total of 5063 high-quality SNP markers remained in the dataset and was used for estimating the diversity analysis and population structure.
Genetic diversity statistics for 5063 SNP markers including genetic diversity (GD), major allele frequency (MAF), heterozygosity, and availability were calculated (Weir, 1996) using PowerMarker v3.25 (Liu and Muse, 2005). The polymorphism information content (PIC) values for SNP data were estimated using the following formula (Botstein et al., 1980);
Gene diversity was calculated as, (Nei, 1978), where pi and pj are the frequency of the ith and jth alleles of a given locus, respectively.
The population structure analysis for the whole genotypes panel was estimated with 5063 SNP markers using STRUCTURE V2.3 (Pritchard et al., 2000). The Bayesian model-based clustering approach was used to define the number of subpopulations (k) given an admixture model with associated allele frequencies. STRUCTURE simulations were performed with the number of presumed clusters from k=1 to k=10. Five independent runs were used for each subpopulation (k-value). For each run, simulations were run for 100,000 burn-in and 100,000 Markov Chain Monte Carlo (MCMC) iterations (Tabanao et al., 2014). The Delta k statistic of (Evanno et al., 2005) was estimated using STRUCTURE HARVESTER (Earl and Vonholdt, 2011) to determine the best k value. The genetic relationships between groups were further analyzed by principal coordinate analysis (PCoA) and the percentage of variations using GenAlEx v6.5 (Peakall and Smouse, 2012).
AMOVA was performed to separate molecular variance at two levels: (a) among subpopulations (genotypes) which were inferred by the analysis of population structure, and (b) within subpopulations. To further verify the genetic differentiation, the number of different (Na), and effective alleles (Ne), expected heterozygosity (He), Fixation index (F), Shannon’s Information Index (I), diversity among and within subpopulations, the unbiased diversity index (uh) and pairwise PhiPT values were calculated for each population according to (Smouse et al., 2015). The PhiPT value, an analog of Fst, suppresses variance within populations while calculating differentiation between populations according to genotypic variance. To determine whether the variance component partitioning is significant, we estimated the probability values by 1000 permutations. The PhiPT values are calculated according to the formula; PhiPT = AP/(WP + AP), where AP; diversity among populations, WP; diversity within populations. In addition, the number of loci with private alleles, and the percentage of polymorphic loci were also computed using GenAlEx v6.5 (Peakall and Smouse, 2012).
Linkage disequilibrium (LD) was computed using the GAPIT program in R software (Clayton, 2015) as a pairwise squared allele frequency correlation (R2) for each chromosome. To associate the decay of LD among the genotypes, the genetic distance between each pair of SNP markers was plotted against R2 values. The squared allele frequency correlations (R2) for each pair of markers were measured to estimate significant linkage disequilibrium at a p-value<0.001. The density of the filtered SNP distribution on seven chromosomes was drawn using the CMplot package in R.
To demonstrate that the panel includes significant phenotypic variations for future use such as association mapping. Data have been collected on chlorophyll fluorescence-related traits; Minimum Fluorescence (F0), Variable fluorescence (FV), Maximum fluorescence intensity (FM), Maximum efficiency of Photosystem II (PSII), (FV/F0), and Maximum yield of primary photochemistry (FV/FM) under low-temperature stress (LTS). In brief, at a three-leaf stage the seedlings were exposed to temperatures raised between 3°C and 5°C, then gradually decreased to -12°C for 4 hours. Chlorophyll fluorescence parameters were measured as an indicator of photosynthetic energy that responds to alters in PSII photochemistry according to (Ghassemi-Golezani et al., 2008). Pearson correlation analysis between the chlorophyll fluorescence-related traits; F0, FV, FM, FV/F0, and FV/FM under low-temperature tolerance before and two hours after the treatment were calculated using ‘‘Hmisc’’ packages in R, the ‘‘PerformanceAnalytics’’ packages was used for drawing scatter plots.
Ninety-six barley genotypes were used to elucidate the genetic diversity within the gene pool of the Western Canadian cooperative trials. This panel includes elite germplasms and key cultivars which have featured strongly in the development of the recent barley cultivars in Western Canada or the Canadian Prairies. The panel was genotyped by using a 9K Illumina iSelect SNP array that contained more than 7864 markers. After quality control filtering of the dataset, 5063 SNPs were used for analysis. For each SNP marker, chromosomal positions were obtained from the James Hutton Institute, Scotland (https://bioinf.hutton.ac.uk/iselect/app/index.pl). The high-quality SNPs were well distributed across the barley genome and presented in (Figure 1A). The highest number of markers was observed on chromosome 5H; 14.13% (1111 SNPs), while chromosome 1H had the lowest number of SNPs with a percentage of 5.71% (449 SNPs) among the seven chromosomes (Figure 1B). The frequency of A/G and T/C transitions had the highest frequency of 38% (1920) and 35% (1799), respectively. Though the lowest frequency among the eight alleles combination was T/A with 1% (64) (Figure 1C).
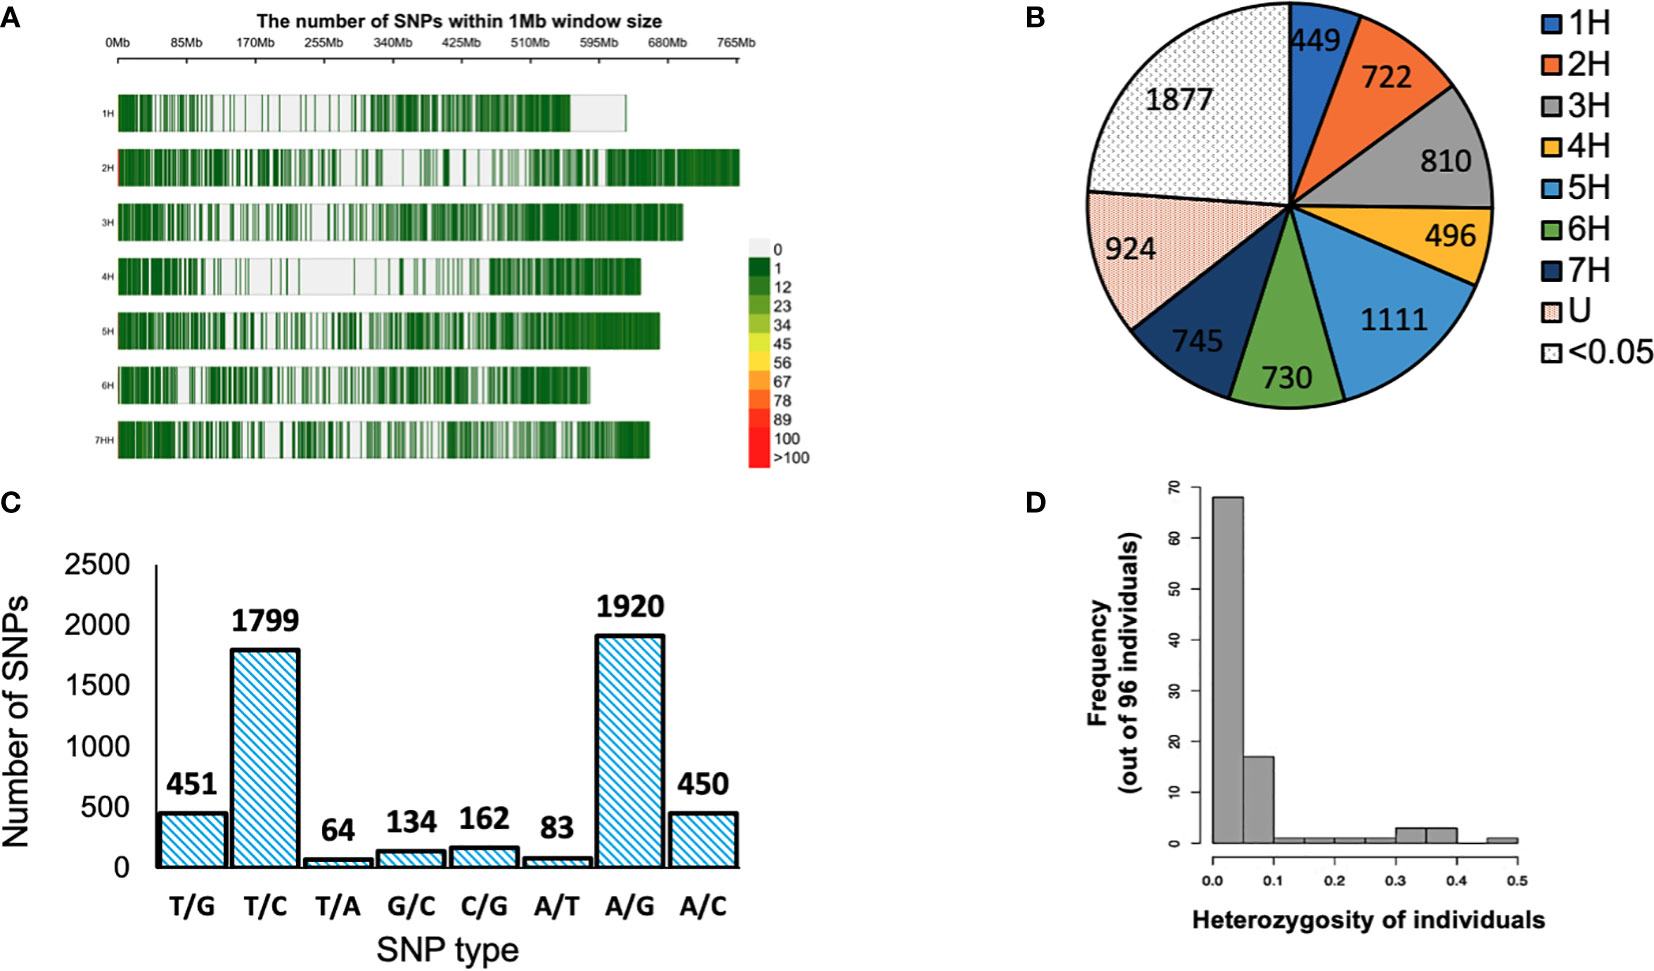
Figure 1 (A) Distribution of single nucleotide polymorphisms (SNPs) in the 9K Barley Infinium iSelect SNP assay. (B) Distribution of SNP markers obtained high quality filtration on the barley genome based on the physical map. U: markers with unknown positions SNPs with MAF of <0.05. (B) Distribution of SNP markers obtained high quality filtration on the barley genome based on the physical map. Color legend on the right shows the marker density. (C) SNP type for 5063 SNP markers used in the analysis. (D) Structure of heterogeneity detected in 96 barley genotypes > < 0.5. Color legend on the right shows the marker density. (C) SNP type for 5063 SNP markers used in the analysis. (D) Structure of heterogeneity detected in 96 barley genotypes > < 0.5. (B) Distribution of SNP markers obtained high quality filtration on the barley genome based on the physical map. Color legend on the right shows the marker density. (C) SNP type for 5063 SNP markers used in the analysis. (D) Structure of heterogeneity detected in 96 barley genotypes.
The genetic diversity was assessed using the filtered 5063 SNPs markers. The GD values ranged from 0.099 to 0.500 with an average of 0.341 (Table 2). The average PIC was 0.275 and ranged from 0.094 to 0.375 in the barley genome (Table 2). The average MAF was 0.747 while the heterozygosity means value was 0.055. High genome-wide heterozygosity of SNP markers was observed for the 96 genotypes (Figure 1D).
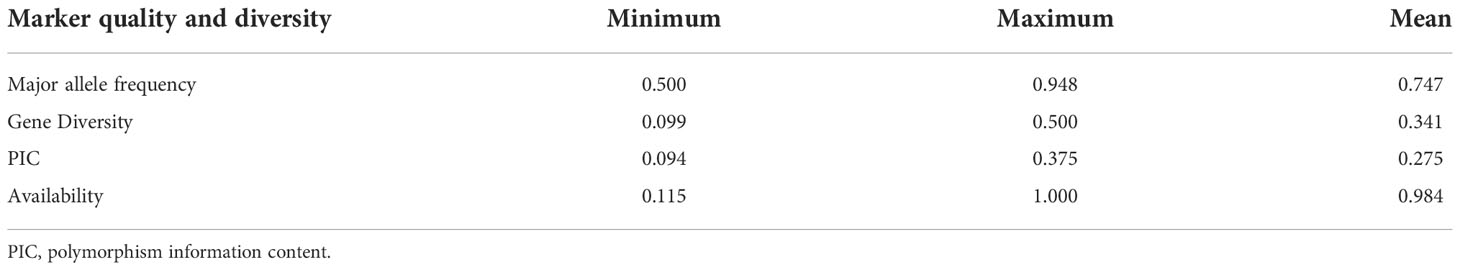
Table 2 Estimation of major allele frequency, gene diversity, PIC and availability.
The Bayesian model-based method was used to investigate the genetic structure of 96 Canadian barley genotypes using highly informative selected markers (5063 SNPs). To distinguish the optimum number of subpopulations, the number of clusters (K) was plotted against ΔK (Figure 2A). A gradual enhancement was detected in the calculated log-likelihood [Ln P(D)] by the growth in K (Figure 2B). The best number of K-values determined the number of populations as K = 5, depicting that those five subpopulations might contain all 96 genotypes with the highest probability (Figures 2C, D). Out of 96 genotypes, 24 genotypes were assigned to subpopulation 1 with 25% of the whole panel. While, subpopulations 2, 3, and 4 had two genotypes each with 2.08%, and 66 genotypes were assigned to subpopulation 5 with 68.75% (Figures 2C, D). Genotypes derived from the breeding programs of Coors, Cargill, and AU, and some of the AAFRD Lacombe genotypes exhibited highly diverse membership. Remarkable genetic divergence was observed among five subpopulations in addition to the average distance, He or gene diversity was detected among the germplasm in each subpopulation. The highest value of He was observed in subpopulation 5 with a value of 0.992 and the lowest was noted in subpopulation 3 with a value of 0.625. Furthermore, the highest value in diversity among and within subpopulations was observed in subpopulation 5 (Table 3).
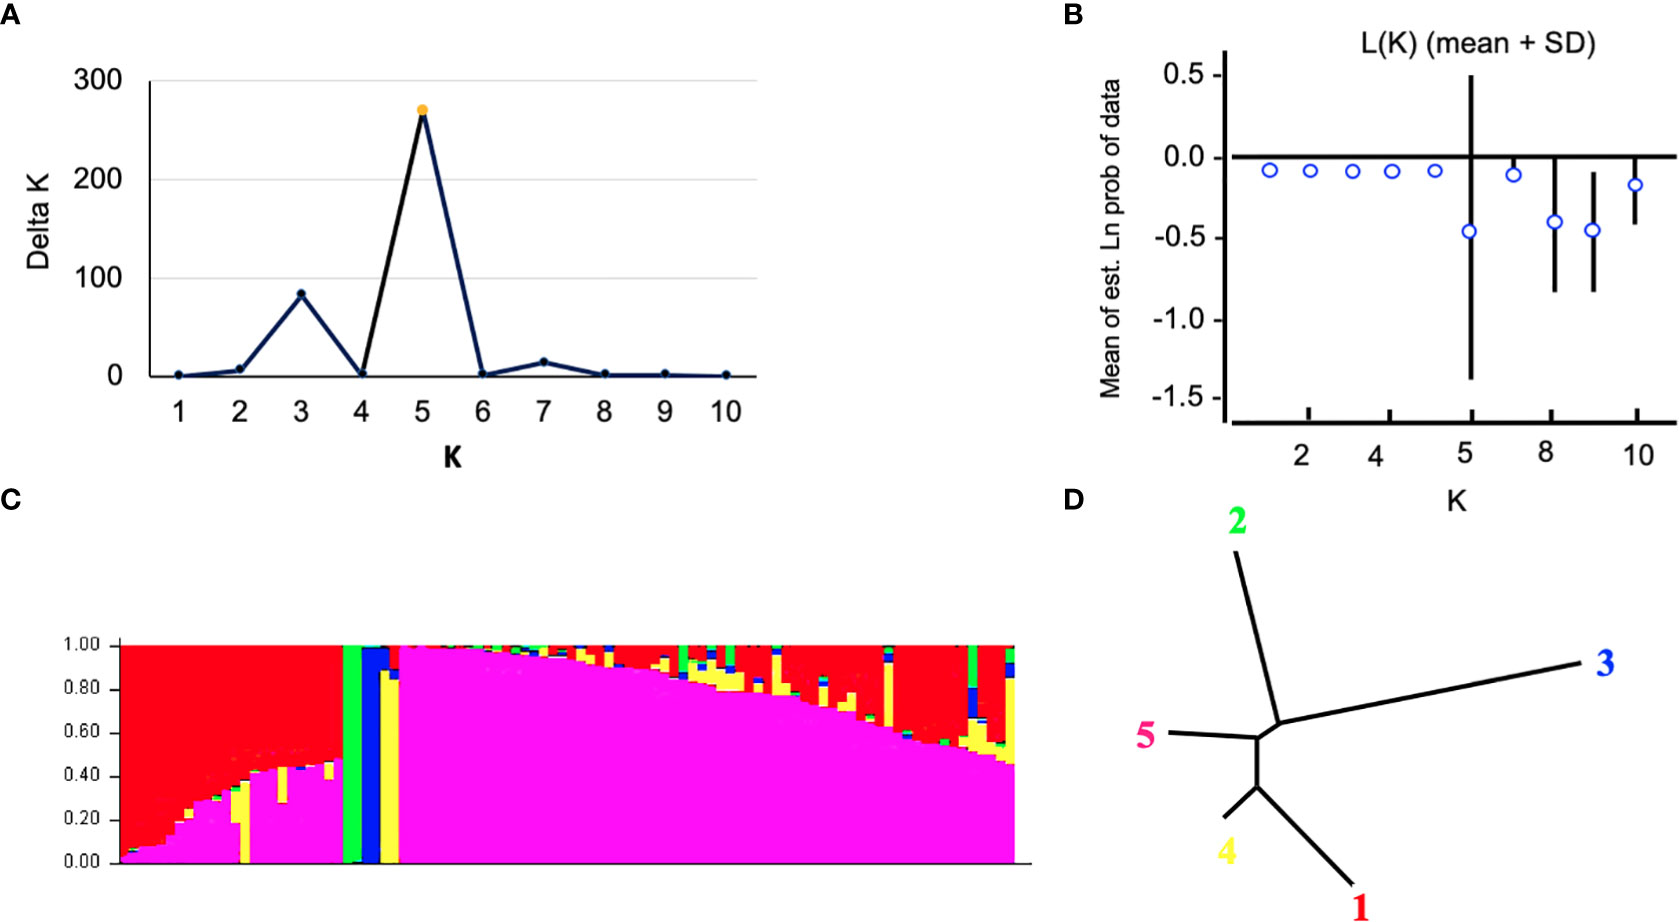
Figure 2 Analysis of population structure using 5063 SNP markers: (A) estimated population structure of 96 tow-rowed barley germplasm (k = 5). The y-axis the sub-population membership, and the x-axis is the genotypes, and (C) delta (Δ) K for different numbers of sub-populations, and (B) the average of the log-likelihood value. The mean values of ln P(D) and SD from 10 runs for each value of K 1/4 1–10. (D) Tree indicates the relationships among the five subpopulations.
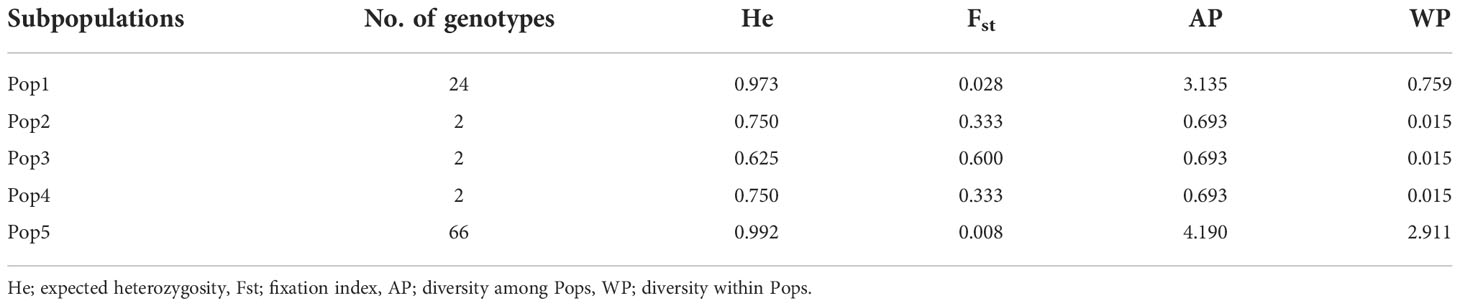
Table 3 Structure analysis of 96 barley genotypes.
The results of the STRUCTURE estimated that the fixation index (Fst) showed significant divergence within the subpopulations. A high level of genetic variation was observed in subpopulation 3 with the Fst value of 0.600. Subpopulation 5 displayed lower genetic variation with an Fst value of 0.008 among its genotypes (Table 3). Genotypes collected from the same breeding program commonly belonged to the same gene pools. Subpopulation 1 comprises the common individuals from the breeding program CDC. Nearly all remaining individuals from subpopulation 5 were assigned to the breeding program gene pool of AFC, AAFRD, AU, and BARI. Subpopulations 2, 3, and 4 originating from the AAFRD were very diverse, as their genotypes were attributed to dissimilar gene pools.
The assessment of genetic variability was calculated within (intra) and among (inter) populations by an AMOVA. A two-level AMOVA of 96 barley genotypes, belonging to eight different breeding programs in Canada, revealed that 95% of the total genetic variation exists within populations and 5% among populations based on PhiPT values (Table 4). These results revealed that genetic differentiation within subpopulations was higher than among subpopulations. Pairwise PhiPT genetic distance values ranged from 0.001 between Pop1 and Pop5, and 0.444 between Pop1 and Pop3. PhiPT values were significant (P< 0.001) for all the subpopulation-pairwise comparisons (Table 5). Based on Nei’s minimum distance, a similar pattern of subpopulation differentiation was observed (Table 5). Pairwise genetic distances between populations were computed using GenAlEx v6.5, when P-value< 0·001. The genetic distances between populations collected from the different breeding programs were higher than 0.05. The maximum value of genetic distances between populations was 0.693 between Pop2 and Pop3; Pop2 and Pop4, while the lower value of 0.133 resulted between Pop3 and Pop5; Pop4 and Pop5 (Supplemental Table 1).
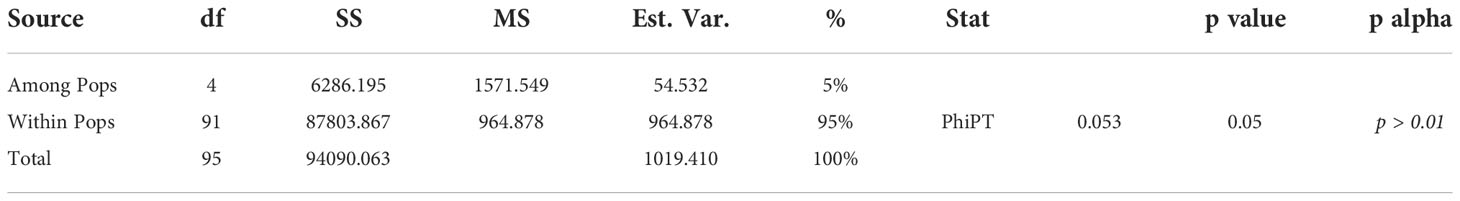
Table 4 Analysis of Molecular Variance (AMOVA) of western Canadian collections.
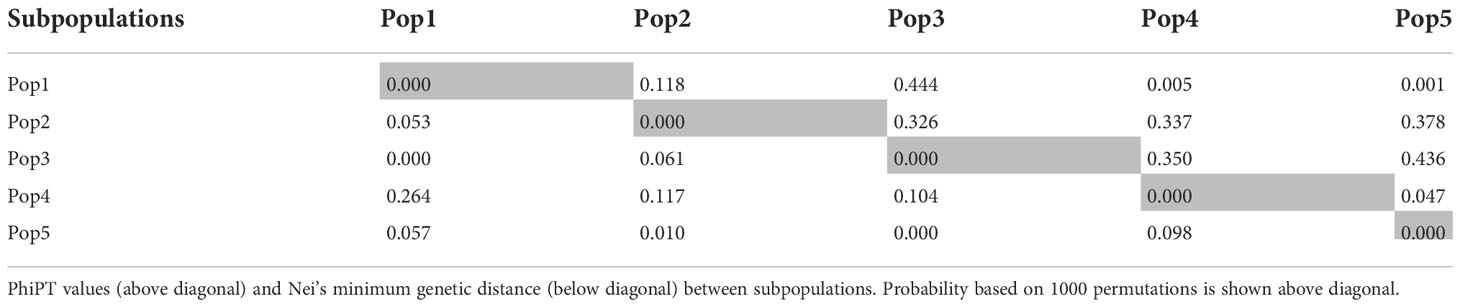
Table 5 Pairwise genetic distances between populations.
To infer significantly different patterns and levels of population genetic structure, patterns of allele frequency across populations were calculated. The Na and Ne ranged from 30 to 125 and 2.667 to 119.342, respectively. While, the Shannon index (I) and the unbiased diversity index (uh) values ranged from 1.040 to 4.809 and 0.833 to 1.00, respectively (Supplemental Table 2). Furthermore, the statistical parameters of the mean and standard errors for each subpopulation across loci are summarized in Figure 3. All the results of allelic patterns revealed that subpopulation 5 is the most diverse population since it has higher diversity indices values and represents the breeding program gene pool of AFC, AAFRD, AU, and BARI. While, low diversity was observed in subpopulations; 3, 2, and 4, respectively as expected with their low number of genotypes.
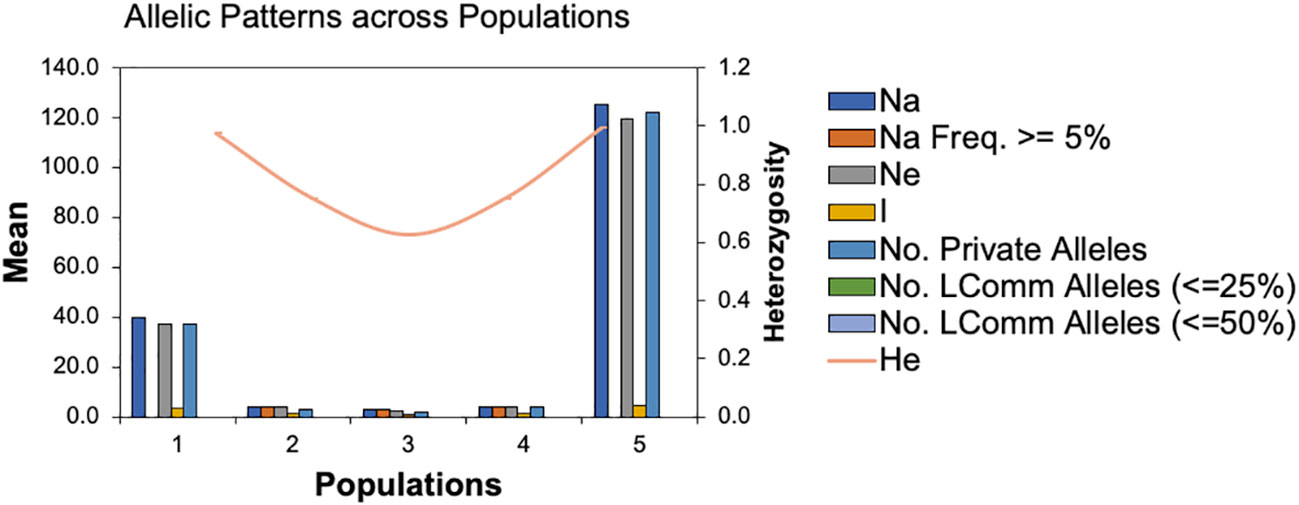
Figure 3 Patterns of allele frequency across populations. Na; no. of different alleles, Na (Freq >= 5%); No. of different alleles with a frequency >= 5%, Ne= No. of effective alleles, I; Shannon’s Information Index, No. LComm Alleles (<=25%); No. of Locally Common Alleles (Freq. >= 5%), No. LComm Alleles (<=50%); No. of Locally Common Alleles (Freq. >= 5%), He, Expected Heterozygosity; uHe, Unbiased Expected Heterozygosity.
To understand the genetic relationships among the studied genotypes, PCoA was performed and the first three components of PCoAs explained 22.20% of the total genetic variation (Figure 4), with 11.82%, 5.76%, and 4.62%, respectively (Supplemental Table 3). The PCoA analysis matched population structure findings in that they revealed the relationships among genotypes. In subpopulation 5 of the program gene pool of AFC, AAFRD, AU, and BARI were highly distinct. Overall, 22.22% variation was detected by the first three PCoA (Figure 4), which indicates that genotypes from the eight-breeding program were diverse from one another.
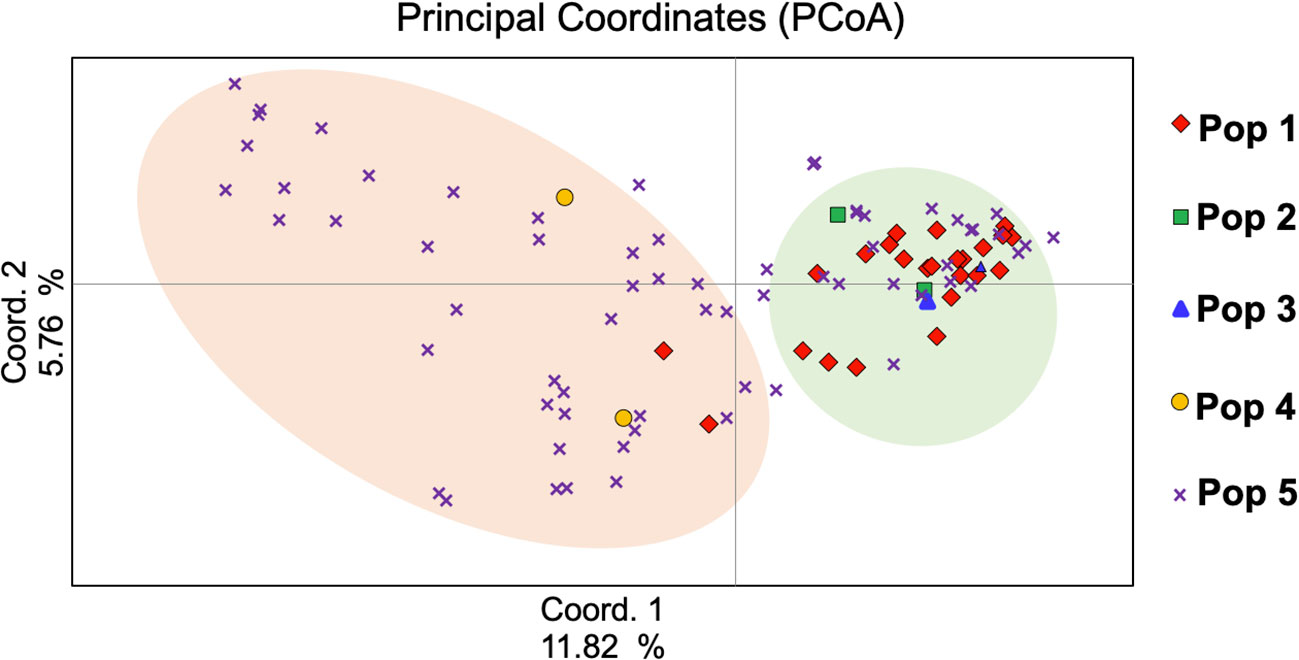
Figure 4 Principal coordinate analysis (PCoA) of the Western Canadian barley genotypes.
Using the classical LD algorithms r2 (squared allele-frequency correlations) and D′ (the standardized disequilibrium coefficient), we investigated whole-genome patterns of LD using the mixed-model method and population structure as co-factors to understand the predictive value of a marker for the association between its chromosomal region with the phenotype. The r2 between each SNP pair (cM) was calculated to identify the level of co-occurrence of alleles at two loci. The SNP markers with P< 0.001 of R2 on the seven barley chromosomes were selected for use in subsequent analysis. The mean values of R2 over all chromosomes revealed that there was no clear correlation with physical distance. A strong LD was observed among the 5063 marker pairs in the studied population with an approximate average value of 0.021 when the distance was 0.391 cM (Table 6). In contrast, the heatmap kinship of the distribution of intra-chromosomal r2 values across the whole genome of the tested genotypes highlights the extended LD values across the genetic centromeres (Figure 5A). Accordingly, the extent of LD was intensely influenced by population structure. A background of long-range LD groups was observed, that are usually due to the population structure and admixture within the genotypes (Ersoz et al., 2007). Furthermore, r2 methods with a maximum of 1 at two SNP pairs alleles display more frequent co-occurrence within the 96 genotypes (Figure 5B). Plotting LD of genetic distance showed comprehensive intra-chromosomal LD over each barley chromosome (Table 6). In all the barley genotypes analyzed, the maximum number of LD between two loci was on chromosome 5H with an average of 0.0141 and an R2 of 22.10%, followed by chromosome 3H. In contrast, the minimum number of LD was observed on chromosome 1H with an average of 0.0093 and an R2 of 8.79% (Table 6).
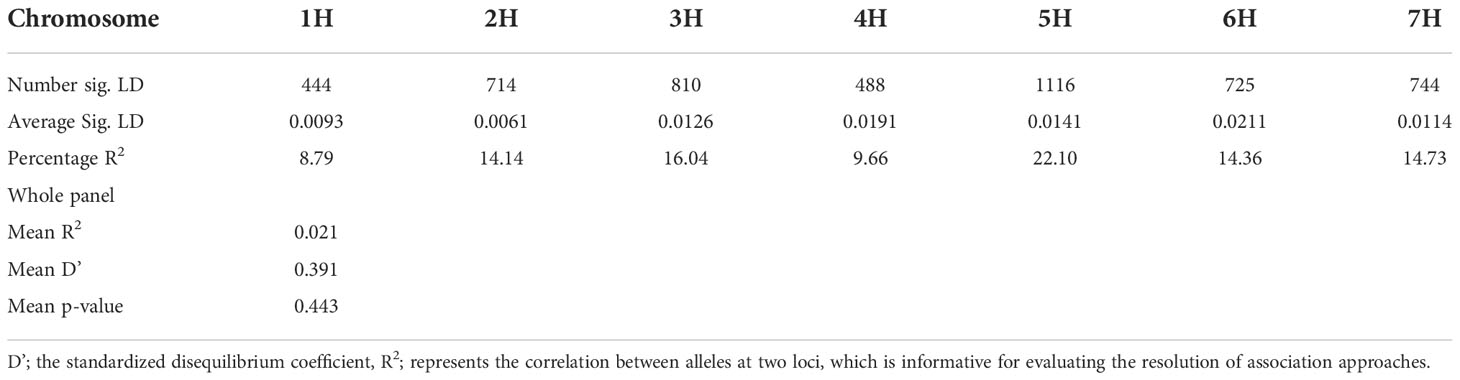
Table 6 Linkage disequilibrium between two polymorphisms alleles across the seven chromosomes.
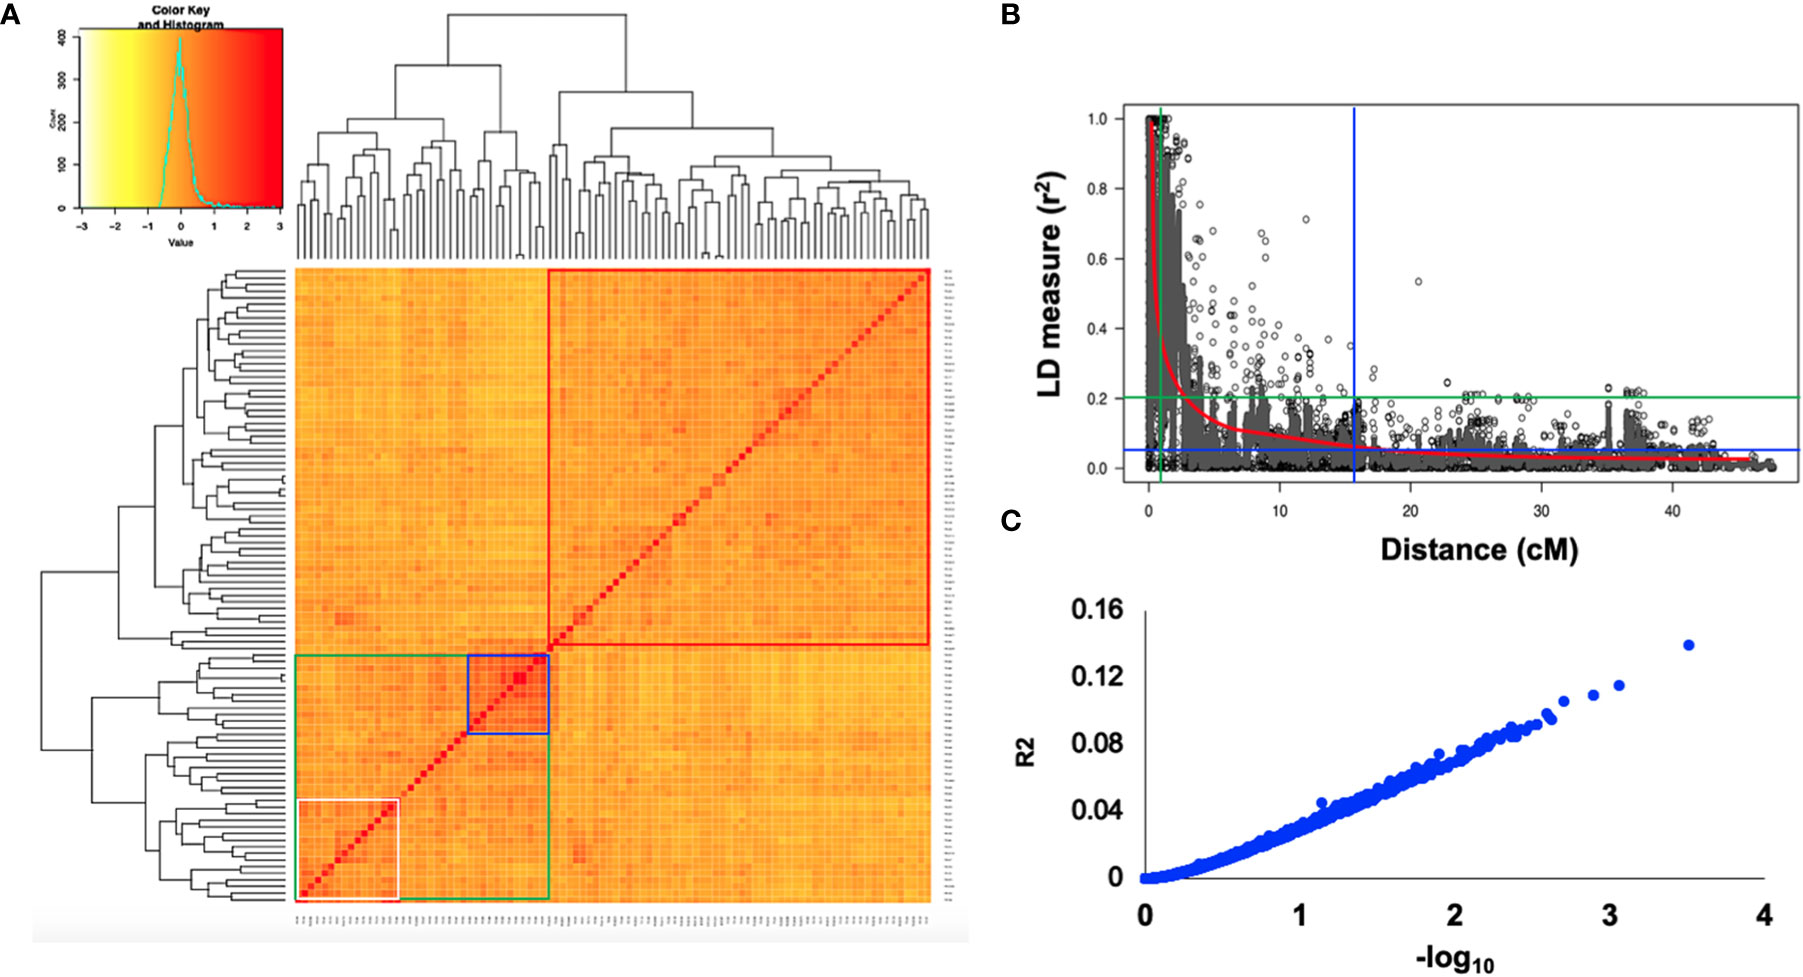
Figure 5 (A) Heat map of kinship matrix for the 5063 SNP markers. (B) Plots of LD values (r2) against genetic distance (cM) between pairs of SNPs. The red line indicates the non-linear regression line of the LD decay, the blue line displays the intersection of the 95% percentile representing the background LD, green line shows the intersection of an r2 value of 0.2 with the regression line (C) R2 values against –log10 over all chromosomes.
The strength and direction of the relationship between traits can be explained by the correlation coefficient (r). The genetic correlation between chlorophyll fluorescence-related traits is assessed by means of the non-parametric spearman correlations. The correlation coefficient is presented as pairs of scatter plots with an asterisk that have a significant correlation, and the greater the correlation, the more significant. Generally, before the low-temperature stress, an extremely significant and positive correlation (P< 0.001) was observed between F0 with FV and FM; FV with FM, FV/F0, and FV/FM (Spearman’s r > 0.95) (Figure 6). This finding revealed that an increase in F0 and FM traits leads to an increase in the other variable and vice versa. Under LTS on the other hand, extreme to moderate and significant correlation between most of the studied traits. Interestingly, a positive correlation was detected between FV/F0, and FV/FM, with all traits. These findings revealed a genetic variation and correlation between the studied phenotypic traits.
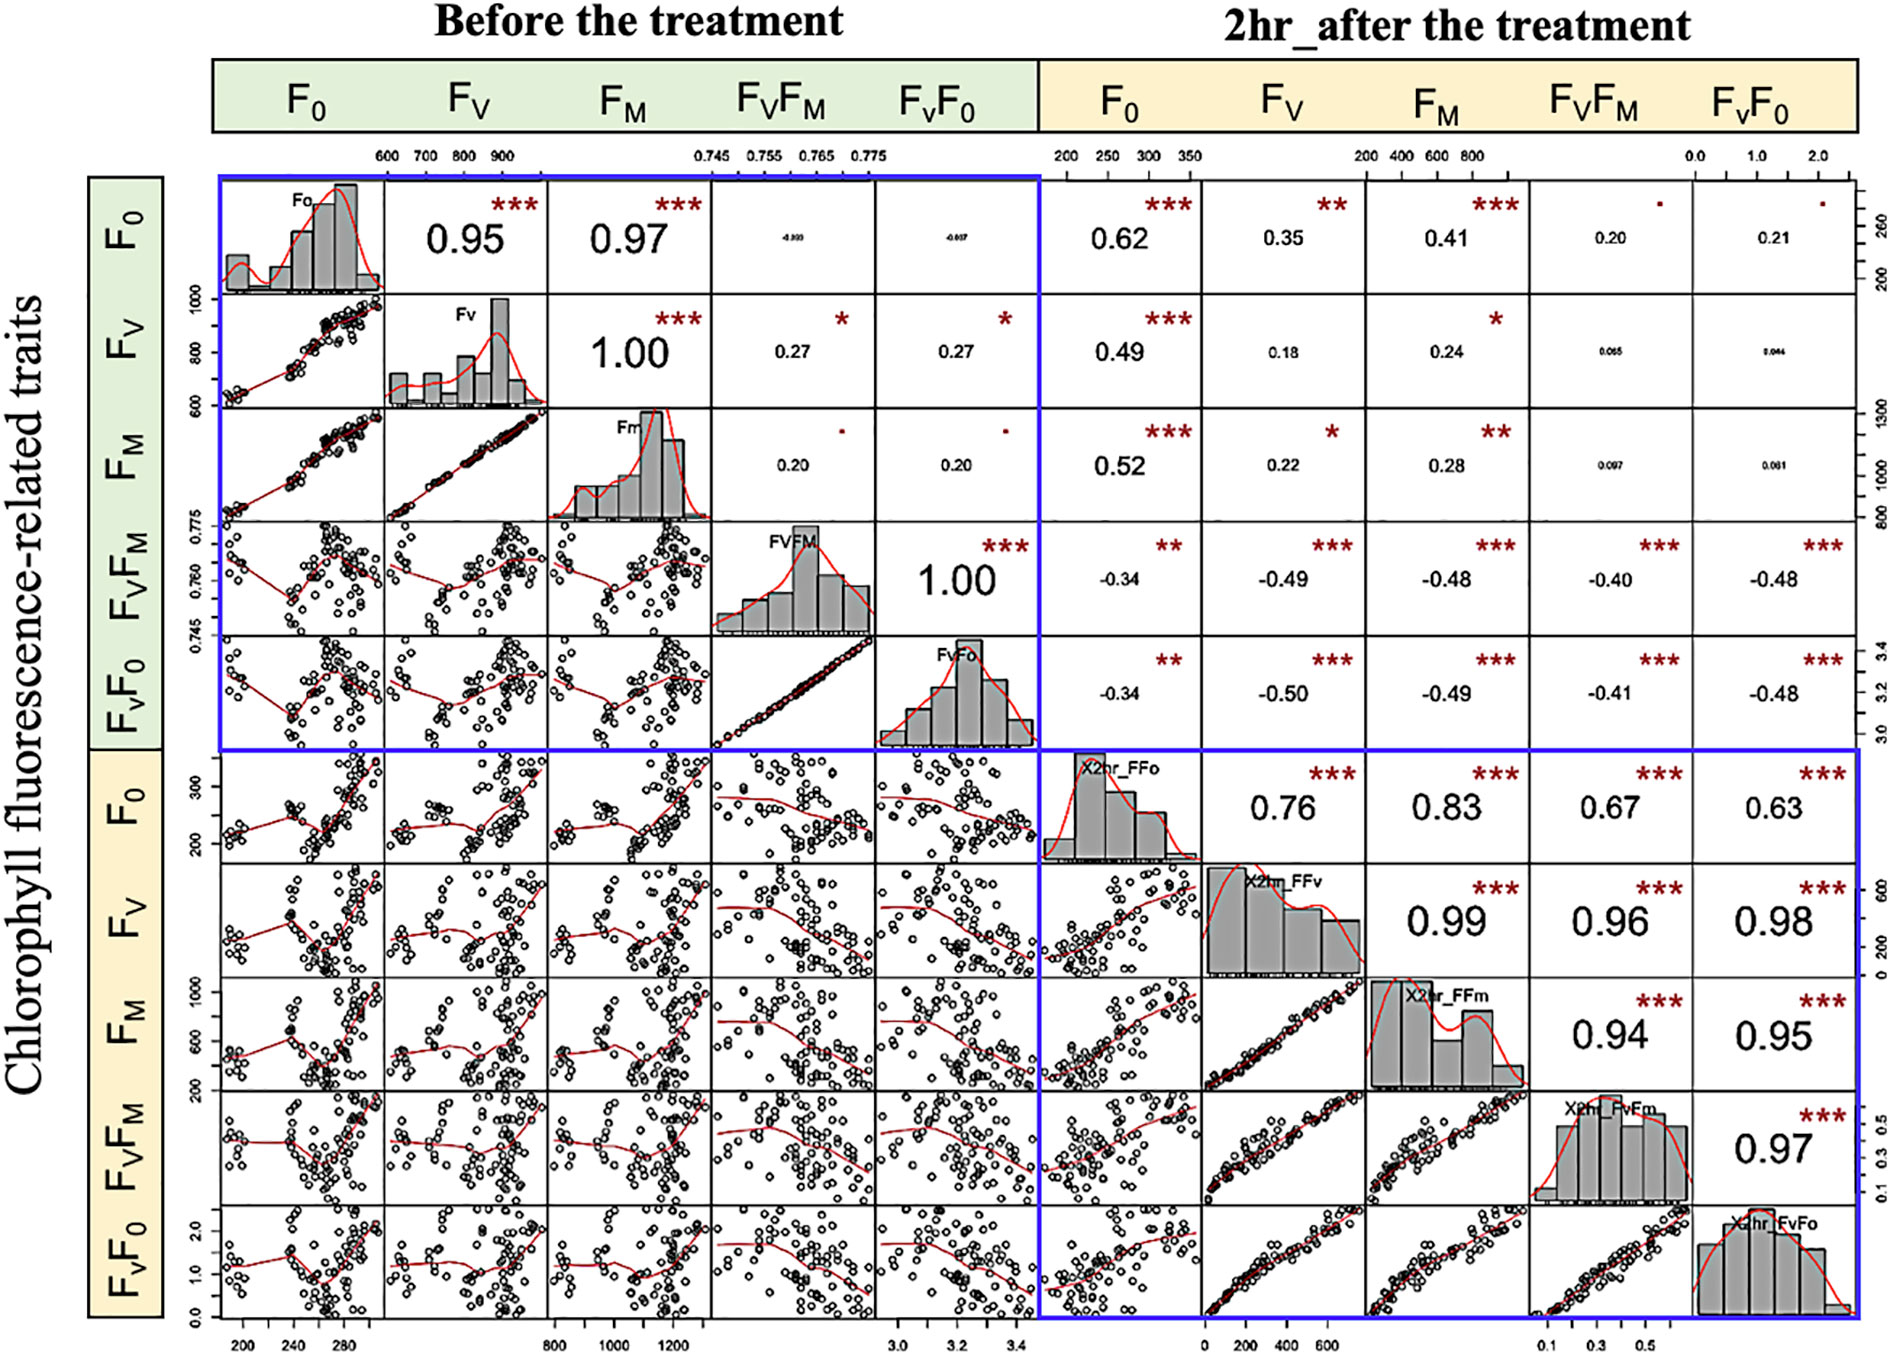
Figure 6 Variation and spearman scatter plots correlations among low-temperature-related traits. Histograms for F0, FV, FM, FV/FM, and FV/F0 values measured are displayed along the diagonal. The distribution of each variable is shown on the diagonal. On the bottom of the diagonal: the bivariate scatter plots with a fitted line are displayed. On the top of the diagonal: the value of the correlation plus the significance level as stars “. “, *,**, and *** are significance level P value 0.001, 0.01, 0.05, 0.1, 1 (not-significant, significant, very significant, and extremely significant, respectively).
An understanding of genetic diversity is essential for association analysis as population structure can cause false associations (Gyawali et al., 2016). Association analysis identifies QTL by illustrating the marker-trait association that could be attributed to the strength of linkage disequilibrium between functional polymorphisms and markers within a set of diverse genotypes. This benefit is particularly great when the dataset contains traits that are time-consuming and expensive to measure. For this purpose, a cooperative trial has been formalized in Canada in which 25 to 35 lines are evaluated annually in 15 to 20 locations in Western Canada. The result is an extensive collection of historical data demonstrating a wide variety of elite barley lines that can be used to discover desirable alleles through association mapping. In this study, phenotypic correlation analysis showed that there was a significant correlation between FV/F0, and FV/FM with all traits under LTS, suggesting relatively high genetic variability among studied genotypes (Elakhdar et al., 2018). Several DArT markers have been identified for grain quality using 91 genotypes of this panel (Beattie et al., 2010). In addition to disease ratings for true loose smut [Ustilago nuda (Jens.) Rostr.] and net-form net blotch [Pyrenophora teres f. teres Drechsler; anamorph: Drechslera teres (Sacc.) were recorded (Beattie et al., 2010). With such historical datasets, associations with barley yield have been identified through association mapping (Kraakman et al., 2004).
The current study is the first to investigate the genetic diversity within the Western Canadian barley cooperative trials collections using the Illumina iSelect SNP array. A set of 5063 high-quality SNP markers were identified across the barley genome (Figure 1). The highest number of markers were detected on the 5H chromosome (1114 SNPs), while the lowest was found on the 1H chromosome (444 SNPs). The 1H chromosome had a minimum genetic diversity level due to the low frequency of recombination rates. The findings are consistent with previous studies that used diverse markers such as SSR, AFLP, RFLP, and SNPs (Graner et al., 1991; Pakniyat et al., 1997; Backes et al., 2003; Karakousis et al., 2003; Elakhdar et al., 2016b; Amezrou et al., 2017; Bengtsson et al., 2017; Capo-Chichi et al., 2021). PIC values and genetic diversity are extremely useful for assessing the amount of polymorphism among the studied barley germplasm in breeding programs. The average PIC and GD in this study were 0.341 and 0.275, respectively (Table 2). The results are very similar to those of the study by Amezrou et al. (2017) using SNP markers in spring barley collection of ICARDA, while it is higher to slightly higher than that described by Bengtsson et al. (2017) and (Rodriguez et al., 2012), 0.28 in a Nordic spring barley genotypes and 0.298 in Sardinia barley landraces, respectively. Based on the type of marker, the PIC can be used to estimate the level of gene variation. In the case of multi-locus markers such as SSR, the PIC values range from 0 to 1.0. Therefore, Botstein et al. (Botstein et al., 1980), proposed three classes for the multi-allelic markers according to their PIC values; highly, moderately, and weakly informative markers in which the PIC values are > 0.5, from 0.25 to 0.5, and< 0.25, respectively. However, in the case of bi-allelic markers (such as SNPs), the maximum value of PIC is 0.5, as the marker’s scores are 50% (0) and 50% (1). Considering this aspect, the SNP markers would be classified as moderate or weak informative markers, because they are bi-allelic and also have a lower mutation rate in comparison with the SSRs (Martinez-Arias et al., 2001). This could explain the low correlation observed between genetic distances because of the low mutation rate of SNPs (Kruglyak et al., 1998). The PIC value in this study was a good indicator for studying the genetic diversity since they were moderate informative markers. Taken together, these findings provide the opportunities to identify barley genetic diversity within these geographic regions and the studied population could be used in determining alleles controlling economic traits in genome-wide association studies in the future.
The genetic variance in the current studied panel indicated that our germplasm had a good genetic variation since it was collected from eight barley breeding programs resources and could be used for a different purpose. The 96 barley genotypes composed advanced breeding lines, elite germplasm and commercial varieties registered in Canada. The elite germplasms from the Western Two-Row Cooperative Registration were evaluated over 15 years. Commercial cultivars currently registered in Western Canada such as ‘AC Metcalfe’, ‘CDC Copeland’, ‘Bentley’, ‘CDC Meredith’, and ‘CDC Reserve’. Four winter barley varieties; ‘02Ab431’, ‘02Ab671’, ‘02Ab669’, and ‘2Ab08 X 05W061-208’ (Aberdeen, ID) which have been developed by the US Department of Agriculture. The lines were selected based on their high percentage of winter survival, seed quality, and seed yield. Even though the panel studied does not contain full representations of breeding materials. It reflects the majority of commonly used parental genotypes and suggests that future progress can be achieved from a limited pool of variability if new sources of genotypes are not introduced. Previously, (Elakhdar et al., 2018) reported that a mini-core collection of barley could be used for the characterization of new resource variations in breeding programs.
Bayesian clustering in STRUCTURE, PCoA and AMOVA analyses, revealed that the population might be differentiated mainly due to the different breeding program origins and by ear row type and divided into five subpopulations. Several reports show that both geographical origin and ear-row type are factors influencing barley population structure (Kolodinska Brantestam et al., 2007; Cockram et al., 2010; Bengtsson et al., 2017). Barley genotypes originating from the Coors, Cargill and AU programs, and some of the AAFRD Lacombe barley genotypes exhibited extra diverse membership. Further breeding programs displayed high stable membership in various subpopulations, although the membership attribution in each subpopulation was varied. A genetic structure that corresponds to the breeding program has previously been described in the American barley genotypes (Hamblin et al., 2010). Hamblin et al. (2010) concluded that the differentiation in breeding programs may have been influenced by breeding history and local adaptation may have contributed to this differentiation. The geographical separation of the barley genotypes observed in this study could also be explained by local adaptation resulting from alterations in day length between northern and southern regions within Western Canada. This result is very important because, in breeding programs, genetic distance is a factor that should be carefully considered in choosing the candidate parents to improve a particular agronomic trait. Despite low variation between subpopulations (5%), the partitioning value was significant (P< 0.001). A high level of gene flow explains the low level of diversity between subpopulations (Arora et al., 2014). Hence, preserving genetic diversity in the Western Canadian breeding programs is essential for sustained breeding advances. The latter will allow barley breeders to conserve and manage germplasm effectively in the gene bank and to use the same effect in their improvement programs.
Population geneticists have long been interested in the extent of LD since its value reveals the number of genetic markers needed to construct GWAS and the mapping resolution (Flint-Garcia et al., 2003). The LD mapping resolution impacts the extent of LD and the rate of LD decay with genetic distance across the genome (Remington et al., 2001). Genome-wide LD analyses have been previously described in different barley populations (Malysheva-Otto et al., 2006; Saisho and Purugganan, 2007; Pasam et al., 2012; Bengtsson et al., 2017). In this study, there is a clear and strong structure in the population, we, therefore, measured LD in the subpopulations assessed from the STRUCTURE analysis. The average LD decay (r2-value) was 0.21 (Table 6). The LD decayed in linkage group 1H had the lowest value of SNPs (8.79%), while the highest value (22.10%) was in linkage group 5H. With increasing genetic distance, the LD values declined to below the critical r2 = 0.18 after 3.91 cM, and the same pattern was observed on each chromosome (Figure 5). Accordingly, the high and low levels of LD found across the whole genome provide an excellent chance to identify target QTLs in the currently studied materials (Wurschum et al., 2011). This result complies or is in agreement with an earlier study on worldwide spring barley (Pasam et al., 2012; Bengtsson et al., 2017), and European modern two-rowed barley cultivars (Kraakman et al., 2004). In our study, the 9K Barley SNP assay (5063 SNP markers) provided a region coverage of approximately 0.233 cM per SNP marker. Several association mapping analyses have been performed successfully for different traits using the 9K Barley SNP assay (Amezrou et al., 2017; Bengtsson et al., 2017; Honsdorf et al., 2017).
Species require genetic diversity to improve to cope with environmental changes by natural selection. Genetic diversity, strength of selection, effective population size, number of generations and the mutation rate are important factors that affect the ability of populations to tolerate natural selection. Loss of genetic diversity in small populations decreases their ability to evolve to cope with environmental change, thus increasing their extinction risk. Natural selection in the short to medium term predominantly utilizes pre-existing genetic diversity, but new mutations make increasing contributions in later generations (Frankham et al., 2022). Structure analysis differentiated barley populations based on the number and frequency distributions of SNPs segregating within the populations. A simplistic model of variation in cultivated barley would suggest that the two-row type has the most diversity because it is closest to its wild ancestor which had two rows and required vernalization (Pourkheirandish and Komatsuda, 2007). On the other hand, populations of six-row and spring type have the least diversity. Both the six-row and spring-type could have been accompanied by two selective bottlenecks correlated with the creation of this gene pool (Pourkheirandish and Komatsuda, 2007). Selection and high genetic gains in barley breeding led to a loss of genetic diversity. Current genetic diversity conservation actions focus on the long-term maintenance of breeding lines under selection. Gene banks play a role in such actions by storing genetic materials for future use and the recent development of genomic information is facilitating the characterization of gene bank material for better use. The question that remains is whether the reduction in genetic diversity has affected crop production today. A case study in barley demonstrates the application of understanding relationships between genetic diversity. As an outcrossing species, barley has tremendous genetic variation. Using the barley germplasm from the Western Canadian breeding program as a case study, we inferred the potential role of re-examining the historical dataset of old genotypes for genetic diversity conservation of the current population. The complementary combination of GWAS approaches, and germplasm resources are leading to important discoveries about the relationship between genetic diversity and phenotypic variation and the impact of domestication on trait variation (Flint-Garcia, 2013).
In summary, to build on Canada’s position as a supplier of premium quality barley yield production, the Western Canadian cooperative trials breeding program aims to develop barley varieties with improved traits. Re-examine the genetic diversity within the historical genotypes is valuable when the dataset contains traits that are costly to measure and/or time-consuming, such as protein content, enzyme activity (e.g., α-amylase, diastatic power), friability, plumpness, β-glucan, and fine extract are some of the traits that influence grain quality. The recent breeding history controlled by the characteristics of the malting productions has had a more dramatic effect on the diversity of barley, entailing a decline in the diversity of the six-row spring types (Beattie et al., 2010).
In the current study, genetic diversity within 96 genotypes of barley was characterized based on 5063 SNP markers. This panel represented elite barley germplasm used to study limit dextrinase and beta-glucanase. These lines have been in the Western Two-Row Cooperative Registration Tests and contain a number of barley check cultivars currently registered in Western Canada. The lines reflect the majority of commonly used parental genotypes, suggesting that further progress can be achieved from a limited pool of variability if the new resource of genotypes is not released subsequently. We have shown that the studied genotypes are genetically diverse, as well as interlinked and structured, indicating a heterogeneous collection. Although an ultimate target of breeders is the genetic diversity based on traits, our main objective was to demonstrate how SNP markers can generate biological variation between barley lines by causing differences in the recipes for proteins that are written in genes. The coverage of markers and population stratification besides the level of LD in our genotypes set was suitable to run different association mapping studies for key economic traits in barley in the future. The results obtained from this study will be useful for future genomic studies, and germplasm management in Western Canada and North American regions to elucidate genetic diversity and structure in their breeding material. Further, the results will assist the selection of parents with complementary allele combinations for future crosses and help identify progeny with the desired alleles is important to develop traits that are expensive and/or time-consuming to measure.
The datasets generated for this study can be found in FigShare, https://figshare.com/articles/dataset/Barley9Kplate3Project_96_sample_Raw_data_csv/21760586/1.
LC prepared the material for genotyping. AE developed the article concept. AB prepared the individual populations corresponding to each breeding program. AE performed bioinformatics data analysis and interpretation of the results. AE wrote the manuscript. LC, TK, JN, PJ, FC, JS, GR, and AB reviewed the manuscript. All authors contributed to the article and approved the submitted version.
This study received funding from the CDC barley breeding program by the Saskatchewan Ministry of Agriculture and the Western Grains Research Foundation Check-off. The funder was not involved in the study design, collection, analysis, interpretation of data, the writing of this article, or the decision to submit it for publication.
The authors would like to thank Anderson J. (Viterra, Inc., Calgary, AB), B. Cooper (Busch Agricultural Resources, Inc., Fort Collins, CO), P. Juskiw (AAFRD, Lacombe, AB), D. Kessler (Plant Gene Resources of Canada, Saskatoon, SK) and B. Legge (AAFC, Brandon, MB) for providing germplasm. AE would like to thank the Barley Research Department, Field Crop Research Institute of the Agricultural Research Center in Egypt for the valuable online resources.
JS is employed by InnoTech Alberta Inc., Vegreville, Canada.
The remaining authors declare that the research was conducted in the absence of any commercial or financial relationships that could be construed as a potential conflict of interest.
All claims expressed in this article are solely those of the authors and do not necessarily represent those of their affiliated organizations, or those of the publisher, the editors and the reviewers. Any product that may be evaluated in this article, or claim that may be made by its manufacturer, is not guaranteed or endorsed by the publisher.
The Supplementary Material for this article can be found online at: https://www.frontiersin.org/articles/10.3389/fpls.2022.1006719/full#supplementary-material
Ames, N. P., Rhymer, C. R. (2008). Issues surrounding health claims for barley. J. Nutr. 138, 1237S–1243S. doi: 10.1093/jn/138.6.1237S
Amezrou, R., Gyawali, S., Belqadi, L., Chao, S., Arbaoui, M., Mamidi, S., et al. (2017). Molecular and phenotypic diversity of ICARDA spring barley (Hordeum vulgare l.) collection. Genet. Resour. Crop Evol. 65, 255–269. doi: 10.1007/s10722-017-0527-z
Arora, A., Kundu, S., Dilbaghi, N., Sharma, I., Tiwari, R. (2014). Population structure and genetic diversity among Indian wheat varieties using microsatellite (SSR) markers. Aust. J. Crop Sci. 8(9), 1281–1289. doi: 10.3316/informit.675809051169521
Backes, G., Hatz, B., Jahoor, A., Fischbeck, G. (2003). RFLP diversity within and between major groups of barley in Europe. Plant Breed. 122, 291–299. doi: 10.1046/j.1439-0523.2003.00810.x
Baik, B.-K., Ullrich, S. E. (2008). Barley for food: Characteristics, improvement, and renewed interest. J. Cereal Sci. 48, 233–242. doi: 10.1016/j.jcs.2008.02.002
Beattie, A. D., Edney, M. J., Scoles, G. J., Rossnagel, B. G. (2010). Association mapping of malting quality data from Western Canadian two-row barley cooperative trials. Crop Sci. 50, 1649–1663. doi: 10.2135/cropsci2009.06.0334
Bengtsson, T., Manninen, O., Jahoor, A., Orabi, J., Consortium, P. B. (2017). Genetic diversity, population structure and linkage disequilibrium in Nordic spring barley (Hordeum vulgare l. subsp vulgare). Genet. Resour. Crop Evol. 64, 2021–2033. doi: 10.1007/s10722-017-0493-5
Blake, T., Blake, V., Bowman, J., Abdel-Haleem, H. (2011). Barley: Production, Improvement, and Uses. Ullrich, S. E. (ed) Wiley-Blackwell, pp 522–531
Botstein, D., White, R. L., Skolnick, M., Davis, R. W. (1980). Construction of a genetic-linkage map in man using restriction fragment length polymorphisms. Am. J. Hum. Genet. 32, 314–331.
Capo-Chichi, L. J. A., Eldridge, S., Elakhdar, A., Kubo, T., Brueggeman, R., Anyia, A. O. (2021). QTL mapping and phenotypic variation for seedling vigour traits in barley (Hordeum vulgare l.). Plants (Basel) 10, 1149. doi: 10.3390/plants10061149
Chabane, K., Ablett, G. A., Cordeiro, G. M., Valkoun, J., Henry, R. J. (2005). EST versus genomic derived microsatellite markers for genotyping wild and cultivated barley. Genet. Resour. Crop Evol. 52, 903–909. doi: 10.1007/s10722-003-6112-7
Clayton, D. (2015) snpStats: SnpMatrix and XSnpMatrix classes and methods. Available at: https://bioconductor.org/packages/release/bioc/html/snpStats.html.
Cockram, J., White, J., Zuluaga, D. L., Smith, D., Comadran, J., Macaulay, M., et al. (2010). Genome-wide association mapping to candidate polymorphism resolution in the unsequenced barley genome. Proc. Natl. Acad. Sci. U.S.A. 107, 21611–21616. doi: 10.1073/pnas.1010179107
Comadran, J., Thomas, W. T., Van Eeuwijk, F. A., Ceccarelli, S., Grando, S., Stanca, A. M., et al. (2009). Patterns of genetic diversity and linkage disequilibrium in a highly structured Hordeum vulgare association-mapping population for the Mediterranean basin. Theor. Appl. Genet. 119, 175–187. doi: 10.1007/s00122-009-1027-0
Dvořáková, M., Guido, L. F., Dostálek, P., Skulilová, Z., Moreira, M. M., Barros, A. A. (2008). Antioxidant properties of free, soluble ester and insoluble-bound phenolic compounds in different barley varieties and corresponding malts. J. Institute Brewing 114, 27–33. doi: 10.1002/j.2050-0416.2008.tb00302.x
Earl, D. A., Vonholdt, B. M. (2011). STRUCTURE HARVESTER: a website and program for visualizing STRUCTURE output and implementing the evanno method. Conserv. Genet. Resour. 4, 359–361. doi: 10.1007/s12686-011-9548-7
Elakhdar, A., Abd El-Sattar, M., Amer, K., Kumamaru, T. (2016a). Genetic diversity and association analysis among Egyptian barley (Hordeum vulgare l.) genotypes with different adaptations to saline conditions analyzed by SSR markers. Aust. J. Crop Sci. 10, 637–645. doi: 10.21475/ajcs.2016.10.05.p7331
Elakhdar, A., El-Sattar, M. A., Amer, K., Rady, A., Kumamaru, T. (2016b). Population structure and marker-trait association of salt tolerance in barley (Hordeum vulgare l.). C R Biol. 339, 454–461. doi: 10.1016/j.crvi.2016.06.006
Elakhdar, A., Kumamaru, T., Qualset, C. O., Brueggeman, R. S., Amer, K., Capo-Chichi, L. (2018). Assessment of genetic diversity in Egyptian barley (Hordeum vulgare l.) genotypes using SSR and SNP markers. Genet. Resour. Crop Evol. 65, 1937–1951. doi: 10.1007/s10722-018-0666-x
Elakhdar, A., Solanki, S., Kubo, T., Abed, A., Elakhdar, I., Khedr, R., et al. (2022). Barley with improved drought tolerance: Challenges and perspectives. Environ. Exp. Bot. 201, 1–31. doi: 10.1016/j.envexpbot.2022.104965
Ersoz, E. S., Yu, J., Buckler, E. S. (2007). Applications of linkage disequilibrium and association mapping in crop plants. In: Varshney, R. K., Tuberosa, R. (eds) Genomics assisted crop improvement, vol I, Genomics approaches and platforms. Springer, Dordrecht, 97–119.
Evanno, G., Regnaut, S., Goudet, J. (2005). Detecting the number of clusters of individuals using the software STRUCTURE: a simulation study. Mol. Ecol. 14, 2611–2620. doi: 10.1111/j.1365-294X.2005.02553.x
Flint-Garcia, S. A. (2013). Genetics and consequences of crop domestication. J. Agric. Food Chem. 61, 8267–8276. doi: 10.1021/jf305511d
Flint-Garcia, S. A., Thornsberry, J. M., Buckler, E. S. T. (2003). Structure of linkage disequilibrium in plants. Annu. Rev. Plant Biol. 54, 357–374. doi: 10.1146/annurev.arplant.54.031902.134907
Frankham, R., Ballou, J. D., Ralls, K., Eldridge, M. D. B., Dudash, M. R., Fenster, C. B., et al. (2022). “Loss of genetic diversity reduces ability to adapt,” in Genetic management of fragmented animal and plant populations. Eds. Frankham, J. D. B. R., Ralls, K., Eldridge, M. D. B., Dudash, M. R., Fenster, C. B., Lacy, R. C., Sunnucks, P. (Oxford, Oxford University Press), 65–86.
Galli, V., Venturi, M., Guerrini, S., Blandino, M., Luti, S., Pazzagli, L., et al. (2020). Antioxidant properties of sourdoughs made with whole grain flours of Hull-less barley or conventional and pigmented wheat and by selected lactobacilli strains. Foods 9, 640. doi: 10.3390/foods9050640
Ghassemi-Golezani, K., Khomari, S., Valizadeh, M., Alyari, H.. (2008). Effects of seed vigour and the duration of cold acclimation on freezing tolerance of winter oilseed rape. Seed Science and Technology 36(3), 767–775. doi: 10.15258/sst.2008.36.3.26
Graner, A., Bjørnstad, Å., Konishi, T., Ordon, F. (2003). “Molecular diverisity of the barley genome,” in Diversity in barley (Hordeum vulgare). Eds. V.H.T. Von Bothmer, R., Knüpffer, H., Sato, K. (Amsterdam: Elsevier Science B.V), 121–141.
Graner, A., Jahoor, A., Schondelmaier, J., Siedler, H., Pillen, K., Fischbeck, G., et al. (1991). Construction of an RFLP map of barley. Theor. Appl. Genet. 83, 250–256. doi: 10.1007/BF00226259
Graner, A., Kilian, A., Kleinhofs, A. (2010). “Barley genome organization, mapping, and synteny,” in Barley productions, importance and uses. Ed. Ullrich, S. E. Wiley–Blackwell, Oxford, 63–84.
Gyawali, S., Harrington, M., Durkin, J., Horner, K., Parkin, I. A., Hegedus, D. D., et al. (2016). Microsatellite markers used for genome-wide association mapping of partial resistance to sclerotinia sclerotiorum in a world collection of brassica napus. Mol. Breed 36, 72. doi: 10.1007/s11032-016-0496-5
Hamblin, M. T., Close, T. J., Bhat, P. R., Chao, S., Kling, J. G., Abraham, K. J., et al. (2010). Population structure and linkage disequilibrium in U.S. barley germplasm: Implications for association mapping. Crop Sci. 50, 556–566. doi: 10.2135/cropsci2009.04.0198
Honsdorf, N., March, T. J., Pillen, K. (2017). QTL controlling grain filling under terminal drought stress in a set of wild barley introgression lines. PloS One 12, e0185983. doi: 10.1371/journal.pone.0185983
Karakousis, A., Gustafson, J. P., Chalmers, K. J., Barr, A. R., Langridge, P. (2003). A consensus map of barley integrating SSR, RFLP, and AFLP markers. Aust. J. Agric. Res. 54, 1173–1185. doi: 10.1071/AR02177
Kolodinska Brantestam, A., Von Bothmer, R., Dayteg, C., Rashal, I., Tuvesson, S., Weibull, J. (2007). Genetic diversity changes and relationships in spring barley (Hordeum vulgare l.) germplasm of Nordic and Baltic areas as shown by SSR markers. Genet. Resour. Crop Evol. 54, 749–758. doi: 10.1007/s10722-006-9159-4
Kraakman, A. T., Niks, R. E., Van Den Berg, P. M., Stam, P., Van Eeuwijk, F. A. (2004). Linkage disequilibrium mapping of yield and yield stability in modern spring barley cultivars. Genetics 168, 435–446. doi: 10.1534/genetics.104.026831
Kruglyak, S., Durrett, R. T., Schug, M. D., Aquadro, C. F. (1998). Equilibrium distributions of microsatellite repeat length resulting from a balance between slippage events and point mutations. Proc. Natl. Acad. Sci. U.S.A. 95, 10774–10778. doi: 10.1073/pnas.95.18.10774
Kumar, S., Banks, T. W., Cloutier, S. (2012). SNP discovery through next-generation sequencing and its applications. Int. J. Plant Genomics 2012, 831460. doi: 10.1155/2012/831460
Leff, B., Ramankutty, N., Foley, J. A. (2004). Geographic distribution of major crops across the world. Global Biogeochemical Cycles 18, GB1009. doi: 10.1029/2003GB002108
Liu, K., Muse, S. V. (2005). PowerMarker: an integrated analysis environment for genetic marker analysis. Bioinformatics 21, 2128–2129. doi: 10.1093/bioinformatics/bti282
Mackay, I., Powell, W. (2007). Methods for linkage disequilibrium mapping in crops. Trends Plant Sci. 12, 57–63. doi: 10.1016/j.tplants.2006.12.001
Malysheva-Otto, L. V., Ganal, M. W., Roder, M. S. (2006). Analysis of molecular diversity, population structure and linkage disequilibrium in a worldwide survey of cultivated barley germplasm (Hordeum vulgare l.). BMC Genet. 7, 6. doi: 10.1186/1471-2156-7-6
Marta, S. I., Tricia, M. (2020). “Barley production, barley nutrient content, and quality of malting barley in Western Canada 2020,” in Grain research laboratory Canadian grain commission (Canada: Annual Barley Harvest Report).
Martinez-Arias, R., Calafell, F., Mateu, E., Comas, D., Andres, A., Bertranpetit, J. (2001). Sequence variability of a human pseudogene. Genome Res. 11, 1071–1085. doi: 10.1101/gr.167701
Mcclean, P. E., Terpstra, J., Mcconnell, M., White, C., Lee, R., Mamidi, S. (2012). Population structure and genetic differentiation among the USDA common bean (Phaseolus vulgaris l.) core collection. Genet. Resour. Crop Evol. 59, 499–515. doi: 10.1007/s10722-011-9699-0
Morrell, P. L., Clegg, M. T. (2007). Genetic evidence for a second domestication of barley (Hordeum vulgare) east of the fertile crescent. Proc. Natl. Acad. Sci. U.S.A. 104, 3289–3294. doi: 10.1073/pnas.0611377104
Nei, M. (1978). Estimation of average heterozygosity and genetic distance from a small number of individuals. Genetics 89, 583–590. doi: 10.1093/genetics/89.3.583
Nordborg, M., Tavaré, S. (2002). Linkage disequilibrium: what history has to tell us. Trends Genet. 18, 83–90. doi: 10.1016/S0168-9525(02)02557-X
Pakniyat, H., Powell, W., Baird, E., Handley, L. L., Robinson, D., Scrimgeour, C. M., et al. (1997). AFLP variation in wild barley (Hordeum spontaneum c. koch) with reference to salt tolerance and associated ecogeography. Genome 40, 332–341. doi: 10.1139/g97-046
Pasam, R. K., Sharma, R., Malosetti, M., Van Eeuwijk, F. A., Haseneyer, G., Kilian, B., et al. (2012). Genome-wide association studies for agronomical traits in a world wide spring barley collection. BMC Plant Biol. 12, 16. doi: 10.1186/1471-2229-12-16
Pasam, R. K., Sharma, R., Walther, A., Ozkan, H., Graner, A., Kilian, B. (2014). Genetic diversity and population structure in a legacy collection of spring barley landraces adapted to a wide range of climates. PloS One 9, e116164. doi: 10.1371/journal.pone.0116164
Peakall, R., Smouse, P. E. (2012). GenAlEx 6.5: genetic analysis in excel. population genetic software for teaching and research. Bioinformatics 28, 2537–2539. doi: 10.1093/bioinformatics/bts460
Pourkheirandish, M., Komatsuda, T. (2007). The importance of barley genetics and domestication in a global perspective. Ann. Bot. 100, 999–1008. doi: 10.1093/aob/mcm139
Pritchard, J. K., Stephens, M., Donnelly, P. (2000). Inference of population structure using multilocus genotype data. Genetics 155, 945–959. doi: 10.1093/genetics/155.2.945
Rafalski, A. (2002). Applications of single nucleotide polymorphisms in crop genetics. Curr. Opin. Plant Biol. 5, 94–100. doi: 10.1016/S1369-5266(02)00240-6
Remington, D. L., Thornsberry, J. M., Matsuoka, Y., Wilson, L. M., Whitt, S. R., Doebley, J., et al. (2001). Structure of linkage disequilibrium and phenotypic associations in the maize genome. Proc. Natl. Acad. Sci. U.S.A. 98, 11479–11484. doi: 10.1073/pnas.201394398
Rodriguez, M., Rau, D., O'sullivan, D., Brown, A. H., Papa, R., Attene, G. (2012). Genetic structure and linkage disequilibrium in landrace populations of barley in Sardinia. Theor. Appl. Genet. 125, 171–184. doi: 10.1007/s00122-012-1824-8
Rostoks, N., Ramsay, L., Mackenzie, K., Cardle, L., Bhat, P. R., Roose, M. L., et al. (2006). Recent history of artificial outcrossing facilitates whole-genome association mapping in elite inbred crop varieties. Proc. Natl. Acad. Sci. U.S.A. 103, 18656–18661. doi: 10.1073/pnas.0606133103
Saisho, D., Purugganan, M. D. (2007). Molecular phylogeography of domesticated barley traces expansion of agriculture in the old world. Genetics 177, 1765–1776. doi: 10.1534/genetics.107.079491
Sallam, A., Amro, A., El-Akhdar, A., Dawood, M. F. A., Kumamaru, T., Stephen Baenziger, P. (2018). Genetic diversity and genetic variation in morpho-physiological traits to improve heat tolerance in spring barley. Mol. Biol. Rep. 45, 2441–2453. doi: 10.1007/s11033-018-4410-6
Smouse, P. E., Whitehead, M. R., Peakall, R. (2015). An informational diversity framework, illustrated with sexually deceptive orchids in early stages of speciation. Mol. Ecol. Resour 15, 1375–1384. doi: 10.1111/1755-0998.12422
Stanca, A. M., Romagosa, I., Takeda, K., Lundborg, T., Terzi, V., Cattivelli, L. (2003). “Diversity in abiotic stress tolerances,” in Diversity in barley - hordeum vulgare. Eds. Bothmer, R.V., Hintum, T.V., Knüpffer, H., Sato, K. (Elsevier Science B.V.), 179–199.
Tabanao, D. A., Pocsedio, A. E., Yabes, J. C., Niño, M. C., Millas, R. A., Sevilla, N. R. L., et al. (2014). Genetic diversity and population structure in a rice drought stress panel. Plant Genet. Resour. 13, 195–205. doi: 10.1017/S1479262114000884
Von Bothmer, R., Komatsuda, T. (2010). “Barley origin and related species,” in Barley: Production, improvement, and uses. Ed. Ullrich, S. E. (Chichester: Wiley-Blackwell), 14–62.
Weir, B. S. (1996). Genetic data analysis II: Methods for discrete population genetic data. Sunderland (Massachusetts): Sinauer Associates 445 p.
Weltzien, E. (1988). Evaluation of barley (Hordeum vulgare l.) landrace populations originating from different growing regions in the near East. Plant Breed. 101, 95–106. doi: 10.1111/j.1439-0523.1988.tb00273.x
Keywords: Hordeum vulgare L, historical datasets, SNP markers, allelic variability, association mapping, structure
Citation: Capo-chichi LJA, Elakhdar A, Kubo T, Nyachiro J, Juskiw P, Capettini F, Slaski JJ, Ramirez GH and Beattie AD (2023) Genetic diversity and population structure assessment of Western Canadian barley cooperative trials. Front. Plant Sci. 13:1006719. doi: 10.3389/fpls.2022.1006719
Received: 29 July 2022; Accepted: 25 November 2022;
Published: 09 January 2023.
Edited by:
Ahmad M. Alqudah, Qatar University, QatarReviewed by:
Melaku Gedil, International Institute of Tropical Agriculture (IITA), NigeriaCopyright © 2023 Capo-chichi, Elakhdar, Kubo, Nyachiro, Juskiw, Capettini, Slaski, Ramirez and Beattie. This is an open-access article distributed under the terms of the Creative Commons Attribution License (CC BY). The use, distribution or reproduction in other forums is permitted, provided the original author(s) and the copyright owner(s) are credited and that the original publication in this journal is cited, in accordance with accepted academic practice. No use, distribution or reproduction is permitted which does not comply with these terms.
*Correspondence: Ammar Elakhdar, YS5lbGFraGRhckBreXVkYWkuanA=
Disclaimer: All claims expressed in this article are solely those of the authors and do not necessarily represent those of their affiliated organizations, or those of the publisher, the editors and the reviewers. Any product that may be evaluated in this article or claim that may be made by its manufacturer is not guaranteed or endorsed by the publisher.
Research integrity at Frontiers
Learn more about the work of our research integrity team to safeguard the quality of each article we publish.