
94% of researchers rate our articles as excellent or good
Learn more about the work of our research integrity team to safeguard the quality of each article we publish.
Find out more
ORIGINAL RESEARCH article
Front. Plant Sci. , 12 October 2022
Sec. Plant Abiotic Stress
Volume 13 - 2022 | https://doi.org/10.3389/fpls.2022.1004802
This article is part of the Research Topic Advances in Buckwheat Research View all 5 articles
Rapid industrialization and urbanization have caused serious cadmium (Cd) pollution in soil. Tartary buckwheat is an important pseudocereal crop with the potential ability to tolerate various stresses. However, the responses to Cd stress in this species are unclear. In this study, we assessed the phenotypic, cytological, physiological, and transcriptomic characteristics of Tartary buckwheat under the various concentrations of Cd treatments to investigate the responses and their regulatory pathways for the first time. The results showed Tartary buckwheat could tolerate the high Cd concentration of 50 mg/L under Cd stress. The average root diameters increased as a result of more cell layers of the endodermis and the bigger size of the pericycle. Cd primarily accumulated in roots and relatively less transferred to leaves. Antioxidant activities and malondialdehyde (MDA) accumulation varied in different tissues and different Cd concentrations of treatments. Meanwhile, Cd stress led to the formation of Casparian strips in roots and damaged the cytoderm and organelles. The weighted gene co-expression and interaction network analyses revealed that 9 core genes induced by Cd stress were involved in metal ion binding, Ca signal transduction, cell wall organization, antioxidant activities, carbohydrate metabolic process, DNA catabolic process, and plant senescence, which regulated a series of phenotypic, cytological, and physiological changes above. These results laid the foundation for a deep understanding of the responses to Cd toxicity in Tartary buckwheat. It’s also a critical reference for the functional characterization of genes for Cd tolerance.
With the rapid development of industry and agriculture, the ecological environment has deteriorated. Heavy metal pollution in the environment is a serious threat to plants and animals. It also causes human health problems with the food chain. Of them, cadmium (Cd) has been the main pollute element as its toxicity, bio-persistence, superior absorption by plants, and widespread exists in the environment (Qin et al., 2020). Many countries like China, India, Japan, America, Germany, and Belgium have suffered from Cd pollution (Kubier et al., 2019). According to the reports on the State of the Ecology and Environment in China (2019) and National Soil Pollution Survey Bulletin (2014), Cd has become the main pollutant in heavy metal pollution since 2019 and around 7.0% of farmland has exceeded the allowable Cd contamination level (Zhao et al., 2015; MEE, 2020). Cd is widely found in a range of sources like batteries, electroplating, plastics, coating, pesticides, fertilizers, and wastewater that are closely related to people’s lives (Bali et al., 2020). As a stable pollutant, Cd could be accumulated and retained in the soil for decades. Meanwhile, Cd is easily absorbed and transported in plants due to its good activity in the soil (Shanmugaraj et al., 2019). Excess absorption of Cd could cause serious toxicity to plants at the morphological, cytological, physiological, biochemical, and molecular levels (El Rasafi et al., 2020). Cd in the soil can directly contact plant roots, resulting in the inhibition of root growth and the absorption of water and nutrients (Pál et al., 2006; Abedi and Mojiri, 2020). Cd pollution also causes leaf yellowing and senescence, and biomass reduction (Rizwan et al., 2016; El Rasafi et al., 2020). Cd toxicity further results in metabolic dysfunction, inhibition of chlorophyll, organic matter, and protein synthesis, reduction of photosynthesis and respiration, and changes in enzyme activity, thus causing a decline in crop yield ad quality (Pál et al., 2006; Rizwan et al., 2016; Abedi and Mojiri, 2020; El Rasafi et al., 2020), which finally leads to serious food security problems.
The toxic effects of Cd have been widely reported in many crops like rice, wheat, maize, potatoes, oilseed rape, and soybean (Pál et al., 2006; Rizwan et al., 2016; Qin et al., 2018). Physiological and molecular mechanism of Cd stress in these crops has been intensively studied (Pál et al., 2006; Rizwan et al., 2016; Abedi and Mojiri, 2020; Fan et al., 2021). Many antioxidant enzymes like peroxidase (POD), superoxide dismutase (SOD), ascorbate peroxidase (APX), glutathione peroxidase (GPX), catalase (CAT), and nonenzymatic antioxidants glutathione (GSH) play important roles in reducing reactive oxygen species (ROS) that may help alleviate oxidative stress. The malondialdehyde (MDA) is an important indicator in assessing the degree of lipid peroxidation under oxidative damage (Rizwan et al., 2016; Rizwan et al., 2017; Ahmad et al., 2019; Chen et al., 2020; El Rasafi et al., 2020). To deal with Cd stress, plants have developed various strategies classified into three categories: avoidance through limiting the Cd uptake, tolerance by accumulation and sequestration of Cd in some special parts like vacuole, and resistance of Cd toxicity by the antioxidant system (El Rasafi et al., 2020). These strategies depend on species, genotypes, environments, and many other factors (Rizwan et al., 2017; El Rasafi et al., 2020). Breeding Cd tolerance genotype is an efficient, safe, and environmental strategy to maintain the quality and yield under its stresses. Studying the responses to Cd stress and understanding their regulatory pathways provide a theoretical reference for screening and characterizing Cd resistance plants.
Tartary buckwheat (Fagopyrum tataricum Gaertn.) is a dicotyledonous herb belonging to the Polygonaceae family and Fagopyrum genus, an important pseudocereal crop with properties both of food and medicine (Zou et al., 2021). Tartary buckwheat is a short-season crop, widely grown up at high altitudes, in cool and humid environments, which has the characteristics of rapid growth, strong adaptability, and high tolerance to harsh and barren environments. It’s also famous for its high content of flavonoids. D’Amelia et al. (2018) reported flavonoid is a kind of antioxidant that can remove ROS resulting from the biotic and abiotic stress to reduce damage in plants. Wang et al. (2015) found that Tartary buckwheat can detoxify aluminum (Al) by forming non-phytotoxic Al complexes with organic acids. Meanwhile, Tartary buckwheat can improve the tolerance to lead stress by sequestrating lead in leaf vacuoles (Wang et al., 2020). Yang et al. (2015) and Shi et al. (2019) identified that low and high concentrations of Cd treatments could promote and inhibit Tartary buckwheat seed germination, respectively. Lu et al. (2019) reported that endogenous sulfur can inhibit Cd accumulation in the leaves of Tartary buckwheat, but significantly increase Cd concentration in roots. All studies have focused on the phenotypic and physiological impacts caused by Cd stress, but the response to Cd stress on Tartary buckwheat at molecular levels is unclear now. China is the origin of Tartary buckwheat, that’s also the major producer and exporter in the world (Zhou et al., 2018). The annual cultivation area of buckwheat maintains more than 530,000 ha. Cd contamination occurs in many buckwheat growing areas in recent years (Huang et al., 2019). Thus, we should speed up the comprehensive and in-depth research of Tartary buckwheat from Cd stresses.
Transcriptome analysis is a powerful tool for the in-depth study of plants at the gene expression and molecular level. It has been used in the research of Tartary buckwheat under various abiotic stresses and revealed the regulation mechanisms. Wang et al. (2020) identified the fundamental lead tolerance, and explored hyperaccumulation mechanisms regulated by TFs, metal iron binding, and membrane transport proteins in the leaves of Tartary buckwheat through transcriptome profiling. Jeon et al. (2018) and Song et al. (2022) took advantage of transcriptomic analysis to demonstrate the phenylalanine pathway played a vital role in responding to cold stress. Huang et al. (2021) determined an ABA-dependent and ABA-independent pathway in the regulation of drought stress in Tartary buckwheat based on the transcriptome analysis. Also using transcriptome analysis, Song et al. (2021) found that ROS induced by salt stress acted as a signal messenger triggering ROS-regulated protein kinases and then caused the phosphorylation/dephosphorylation of transcription factors. And the increase of ROS content can promote the activities of SOD, POD, APX, and other antioxidant enzymes to enhance salt resistance. The application of transcriptome analysis in the study of Tartary buckwheat stress has been very mature. But it’s a blank in the research under Cd stress in Tartary buckwheat.
In this study, we investigated the phenotypes, primary-and ultrastructure of roots, antioxidant activities, the Cd concentration in different tissues, and the gene expression in Tartary buckwheat seedlings roots under various concentrations of Cd stress for the first time. The objectives of this study were to (1) understand the effects of Cd stress on the phenotypic, physiological, cytological, and transcriptomic characteristics in Tartary buckwheat seedlings, and (2) identify the regulatory pathway and the core genes in Tartary buckwheat under Cd stress. The comprehensive analysis of Tartary buckwheat under Cd stress provides the reference for understanding the mechanism of Cd response and the functional characterization of genes for Cd tolerance.
Tartary buckwheat used in this study is Xiqiao No. 1 (XQ1) derived from radiation-induced mutagenesis breeding. It’s a commercial variety characterized by early maturity and high yielding potential, widely planted in southwest China. The seeds were provided by the Key Laboratory of Coarse Cereals Processing of the Ministry of Agriculture and Rural Affairs at Chengdu University. The seeds of 40 g were disinfected in 1% potassium permanganate for half an hour and then rinsed with clean water. The cleaned seeds germinated on the wet gauze in sprouting trays in an illumination incubator for 4 days. The temperature, relative humidity, light intensity, and light cycle were 24/18°C (day/night), 70%, 150 μmol/m2/s, and 10/14 hours (day/night), respectively. Seedlings with similar coleoptile lengths were then selected and divided into four groups in sprouting trays containing filter paper with suitable holes. The sprouting trays were put in the different hydroponic systems with Hoagland solution (Hoagland and Arnon, 1950) containing 0, 10, 30, 50 mg/L CdCl2 (designated as CK, Cd10, Cd30, and Cd50), respectively. Three biological replicates were used for each treatment.
After a 7-day treatment of Cd stress, the root morphological characteristics under different treatments were scanned using Epson XL (12000×) and evaluated using a WinRHIZO Pro 2017 image analysis software (Régent Instruments, Quebec, Canada). The root morphological characteristics included total root length (TRL), total root surface area (TRSA), average root diameter (ARD), total root volume (TRV), number of root tips (RT), and number of root forks (RF). Ten plants from each biological duplication were measured. The significant differences (at the level of p < 0.05) in root morphological characteristics among different treatments were analyzed using the software SPSS 20.0 (IBM Corp., Armonk, NY, USA) with the Duncan t-test.
To investigate the changes in the primary structure of roots under Cd stresses, we got the transverse sections of the root maturation zone through pretreatment, dehydration, embedding, and cutting. They were double-stained with Safranin O and Fast Green, examined using a light microscope (Nikon Eclipse E100, Tokyo, Japan) and imaging software (Nikon DS-U3, Tokyo, Japan). To examine their cell ultrastructure, the roots were fixed for 12 hours at 4°C in 0.1 M phosphate buffer (PB) containing 2.5% glutaraldehyde and then washed in PB. The roots were then fixed in PB containing 1% OsO4 for 1 hour, dehydrated in a graded series of ethanol, embedded in LR white resin, and then got the ultrathin sections (80-nm thick). The sections were examined using a transmission electron microscopic (TEM, Hitachi HT7700 TEM, Japan).
Antioxidants were closely related to biological and abiotic stress. Enzymatic antioxidants like SOD, POD and nonenzymatic antioxidants GSH play an important role in reducing ROS that may help alleviate oxidative stress. MDA is an important indicator for the degree of lipid peroxidation under oxidative damage. Together with MDA content, we assessed activities of SOD, POD, and GSH in different tissues (root, stem, and leaves) after 7-day treatment. All of these assessments were carried out using the corresponding assay kits (Jiancheng Biotechnology, Nanjing, China) with three biological duplications. The significant differences (at the level of p < 0.05) in values were analyzed using software SPSS 20.0 (IBM Corp., Armonk, NY, USA) with the Duncan t-test.
The Cd concentration in different tissues was measured after 7-day treatment. Roots, stems, and leaves were collected with three biological replicates. The collected materials were dried in an electric thermostatic drying oven at 105°C for half an hour and then at 65°C for 48 hours. The dried materials were ground into powders with a diameter of less than 0.250 mm. 0.2 g of each sample was digested using a Graphite Block Acid Digestion System (ODLAB Co., Ltd., Seoul, Korea), then suspended in 50 ml of ultrapure water, filtered, and finally determined the Cd content using inductively coupled plasma-mass spectroscopy (ICP-MS) (iCAP RQ, Thermo Fisher Scientific Inc., Massachusetts, USA).
Following 7-day treatments, the root tissues were sampled with three independent biological replicates and quickly frozen into liquid nitrogen. Total RNA was extracted using a Plant RNA Extraction kit (Takara Bio, Otsu, Japan) following the manufacturer’s protocol. RNA concentration and purity were measured using NanoDrop 2000 (Thermo Fisher Scientific, Wilmington, DE). RNA integrity was assessed using the RNA Nano 6000 Assay Kit of the Agilent Bioanalyzer 2100 system (Agilent Technologies, CA, USA). The RNA with the criterion of RIN larger than 8.5 were subjected to the subsequent construction of complementary DNA (cDNA) libraries. mRNAs were enriched from total RNA using oligo(dT)-attached magnetic beads, and then were randomly fragmented using divalent cations under elevated temperature in NEBNext First Strand Synthesis Reaction Buffer (5X). First strand cDNA was synthesized using random hexamer primer and M-MuLV Reverse Transcriptase. Second strand cDNA synthesis was subsequently performed using DNA Polymerase I and RNase H. Double-strand cDNA was subjected to end repair. Adenosine was added to the end and ligated to adapters. AMPure XP beads were applied here to select fragments within the size range of 300-400 bp. The cDNA library was obtained by certain rounds of PCR on the selected fragments. Paired-end 2×150 bp reads were generated using an Illumina platform (NovaSeq 6000).
Based on the initial assessments using the software FastQC v 0.11.5 (Andrews, 2016), we removed the adapters from the obtained sequence reads, and deleted ploy-N (>10%) and low-quality reads (the bases number of Q ≤ 10 greater than 50%) from raw sequences using SolexaQA++ (Cox et al., 2010) to generate clean sequences with high quality. All the downstream analyses were based on the clean sequences with high quality. The clean sequences were mapped onto the reference genome of Tartary buckwheat Puku1 (http://www.mbkbase.org/Pinku1/) using HISAT2 v2.0.4 (Kim et al., 2015) with default parameters. The mapped reads were assembled using the StringTie v1.3.4d (Pertea et al., 2015). The gene expression values FPKM (fragments per kilobase of transcript length per million mapped reads) (Florea et al., 2013) were also calculated using StringTie v1.3.4d (Pertea et al., 2015). The criteria of RPKM≥1 were used to define expressed genes. The differentially expressed genes (DEGs) were identified using DESeq2 v1.6.3 in the R package (Love et al., 2014) based on a model using the negative binomial distribution with the criteria of Fold Change (FC) ≥ 2 and FDR (false discovery rate) < 0.01. Based on the reference genome sequences, the software StringTie v1.3.4d (Pertea et al., 2015) was used to assemble mapped reads and compared them with the original genome annotation to find the originally unannotated transcription regions. The transcript regions without annotation obtained by the above processes are defined as novel transcripts or new genes.
To annotate the genes we identified, the software blastx 2.2.31 (Altschul et al., 1997) was used to search against the multiple databases including Swiss-Prot (A manually annotated, non-redundant protein sequence database) (Apweiler et al., 2004), GO (Gene Ontology) (Ashburner et al., 2000), KOG (Clusters of Protein homology) (Koonin et al., 2004), Pfam (Protein family) (Finn et al., 2014), and KEGG (Kyoto Encyclopedia of Genes and Genomes) (Kanehisa et al., 2004). The KEGG Orthology results were obtained using the software KOBAS2.0 (Xie et al., 2011). The predicted amino acid sequences of target genes were blasted against the Pfam database using software hmmscan 3.1b2 (Eddy, 1998) to gain the annotation information. The software KOBAS (Mao et al., 2005) was used to test the statistical enrichment of DEGs in KEGG pathways. The interaction networks among genes were visualized using the software Cytoscape 3.8.2 (Shannon et al., 2003). The software MapMan 3.6.0 (https://mapman.gabipd.org/mapman-version-3.6.0) was used to analyze and visualize the metabolic pathways. To study the Cd-induced genes and the related traits they regulate, we analyzed the relationship between specific traits (ARD and Cd concentration in different tissues) and key modules using the weighted gene co-expression network analysis (WGCNA) using WGCNA (v 1.0) package in R software (Langfelder and Horvath, 2008). All the 3,647 DEGs between CK and Cd stress were applied to WGCNA. The cutreeStatic function was used to remove the offending sample. The parameter minModuleSize was set to 30. Network visualization for each module was performed using the software Cytoscape 3.8.2 (Shannon et al., 2003).
The qRT-PCR was used to verify the expression level of Cd-induced genes in the roots of Tartary buckwheat seedlings. The reference gene was FtH3 (Li et al., 2019). All primers were designed using the online system (https://www.sangon.com/newPrimerDesign). The cDNA was synthesized using the EasyScript One-Step gDNA Removal and cDNA Synthesis SuperMix kit (TransGen Biotech, Beijing, China) according to the manufacturer’s protocol. The qRT-PCR reactions were performed in qTOWER3 G Real-Time PCR System (Analytik Jena AG, Germany) following the procedure of 95°C for 30 s, followed by 40 cycles of 95°C for 10 s, 60°C for 30 s, and 72°C for 30 s. Finally, we used the 2−ΔΔCt method to normalize the gene expression (Livak and Schmittgen, 2001).
With the increase of Cd treatment concentration, the growth inhibition strengthened. Chlorosis and necrosis were not observed on plants although the stems turned red under Cd stress (Figure 1). We scanned the root morphological characteristics and analyzed TRL, TRSA, ARD, TRV, RT, and RF under each of the four different treatments (Figure 2). The average value for TRL was 31.456 cm, for TRSA was 3.3473 cm2, for ARD was 0.3384 mm, for TRV was 0.0287 cm3, for RT was 117.4, and for RF was 129.6 under CK treatment. Cd stress had no significant effects on TRV. TRL became significantly lower with the increase of the Cd concentration. No significant differences existed in TRSA, ARD, RT, or RF between CK and Cd10. So did between Cd30 and Cd50 except for TRL and ARD. There were no significant differences in ARD and RF between Cd10 and Cd30. TRSA and RT under Cd30 and Cd50 were significantly lower than that under CK and Cd10. RF was significantly lower under Cd50 than other treatments. To our surprise, ARD significantly increased under Cd30 and Cd50 compared with those in CK.
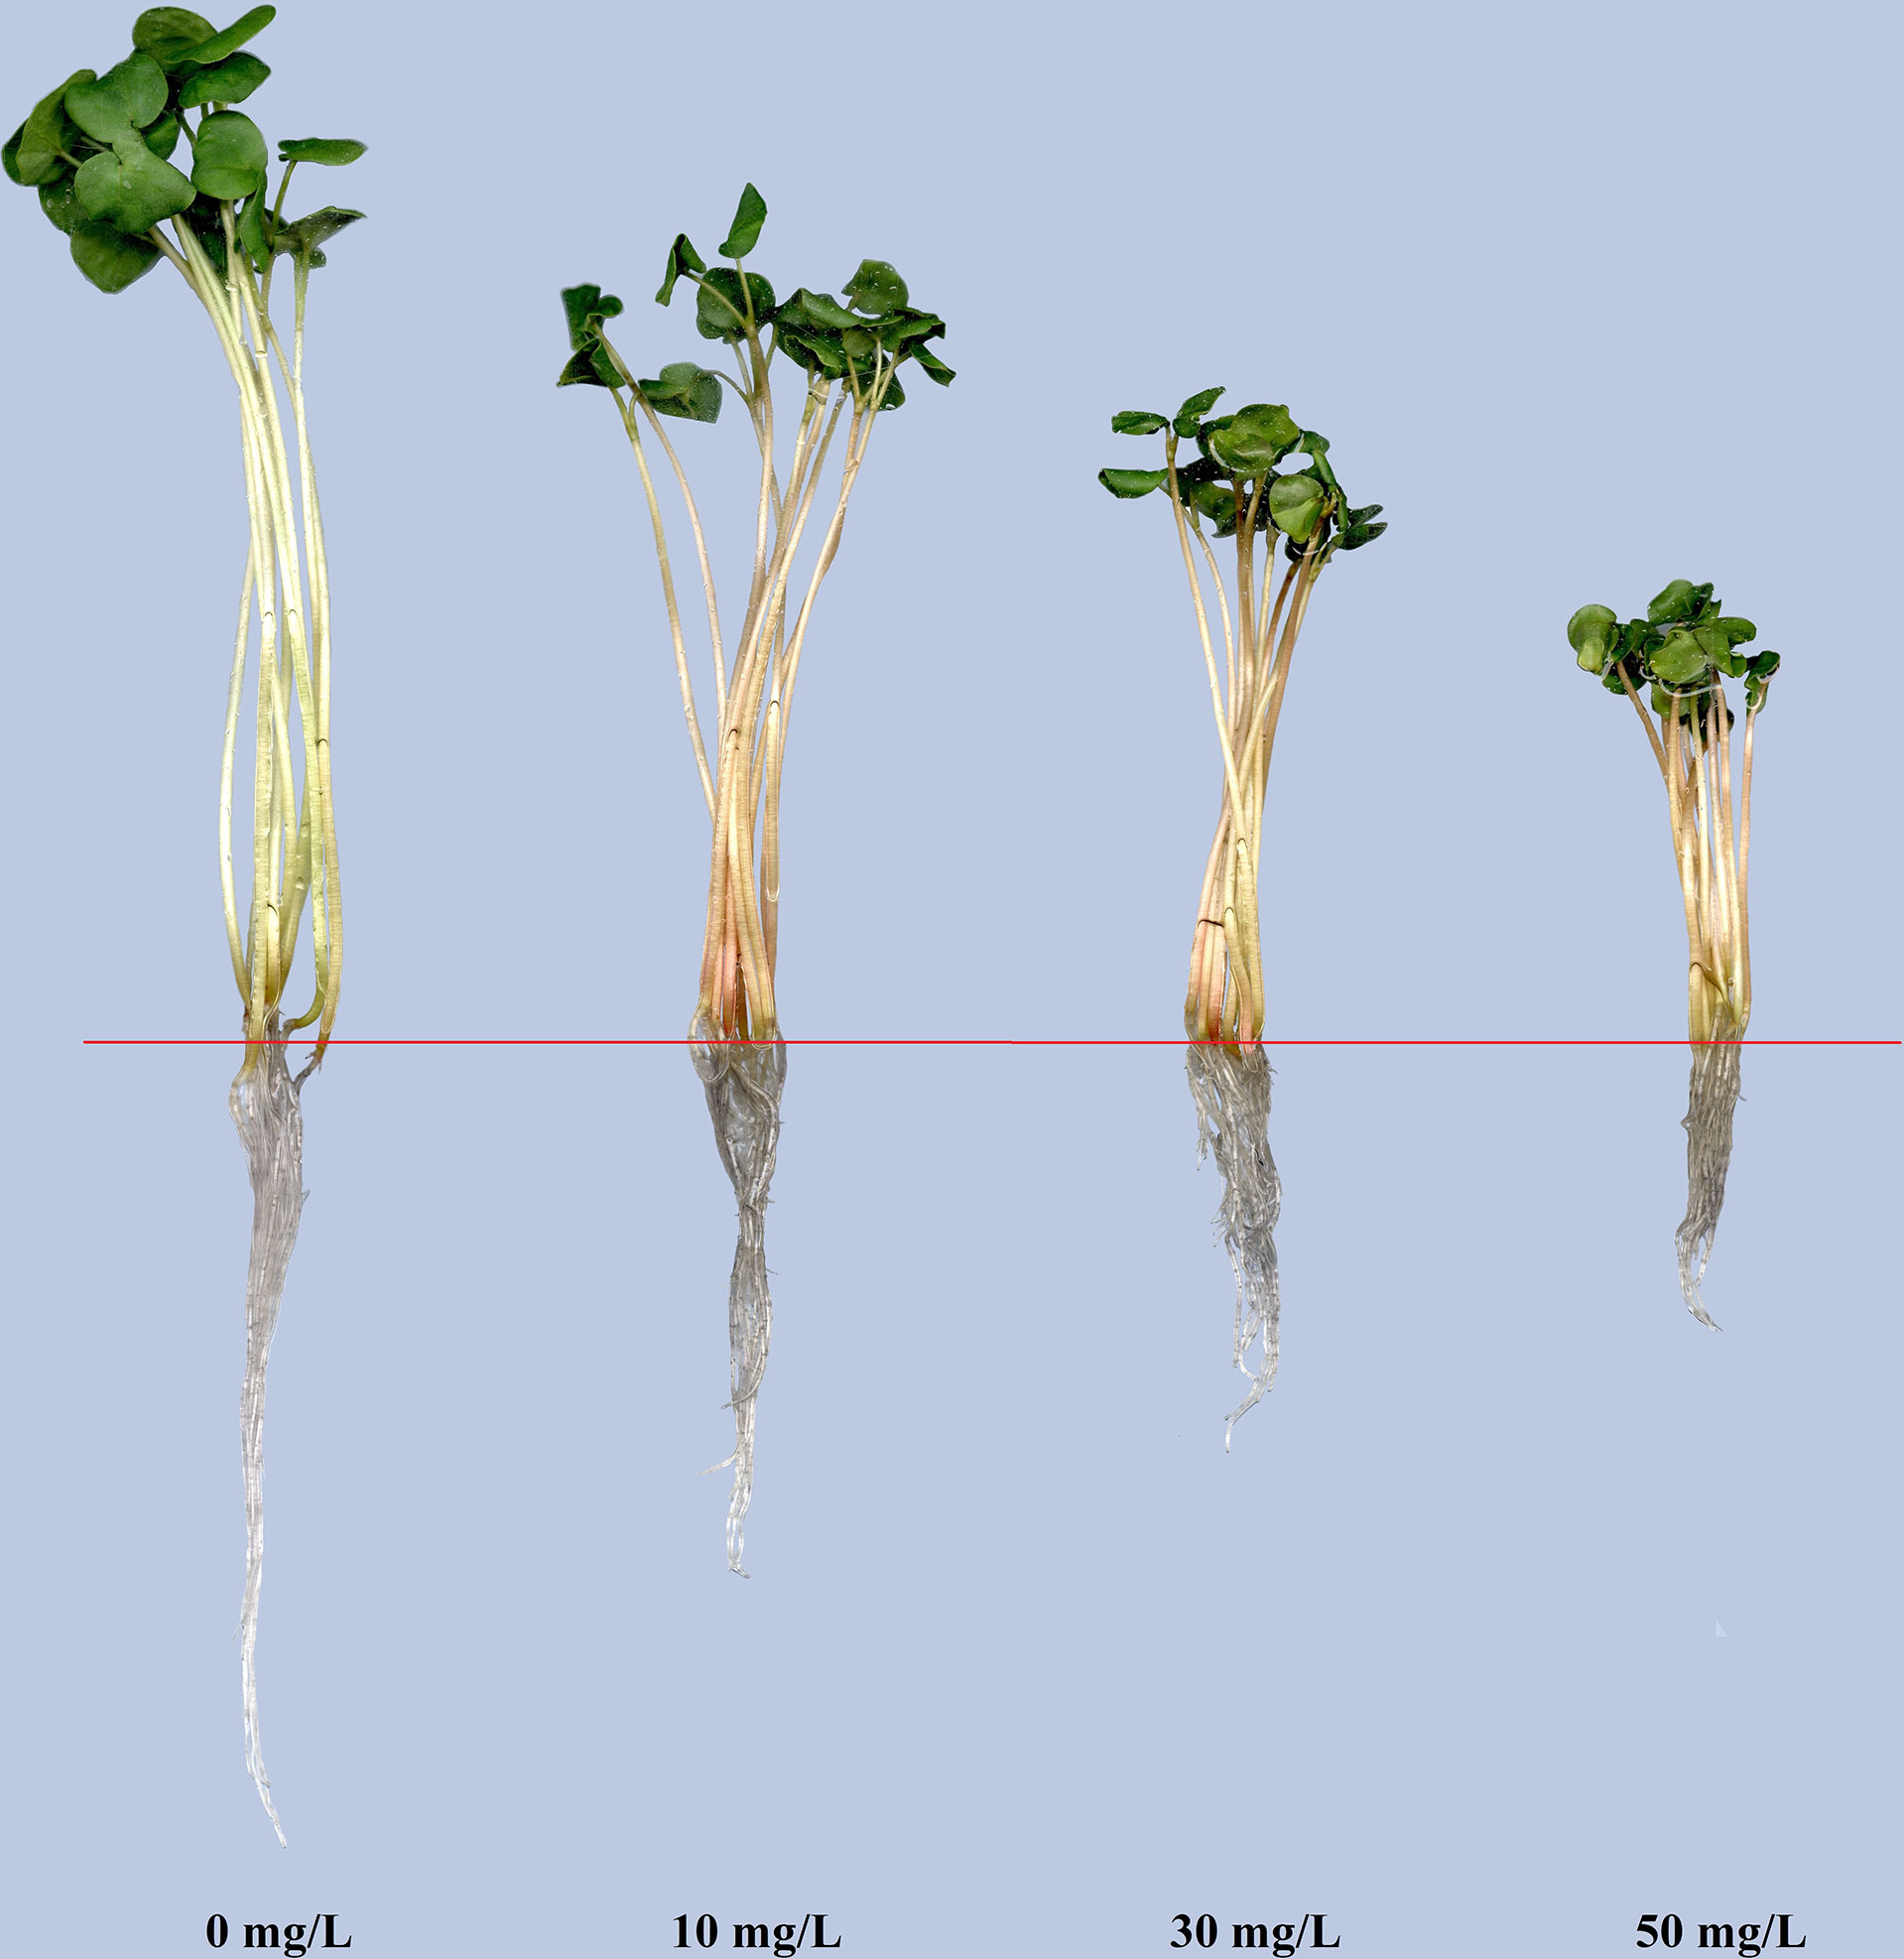
Figure 1 The Tartary buckwheat seedling under cadmium stress of various concentrations for 7-day treatments.
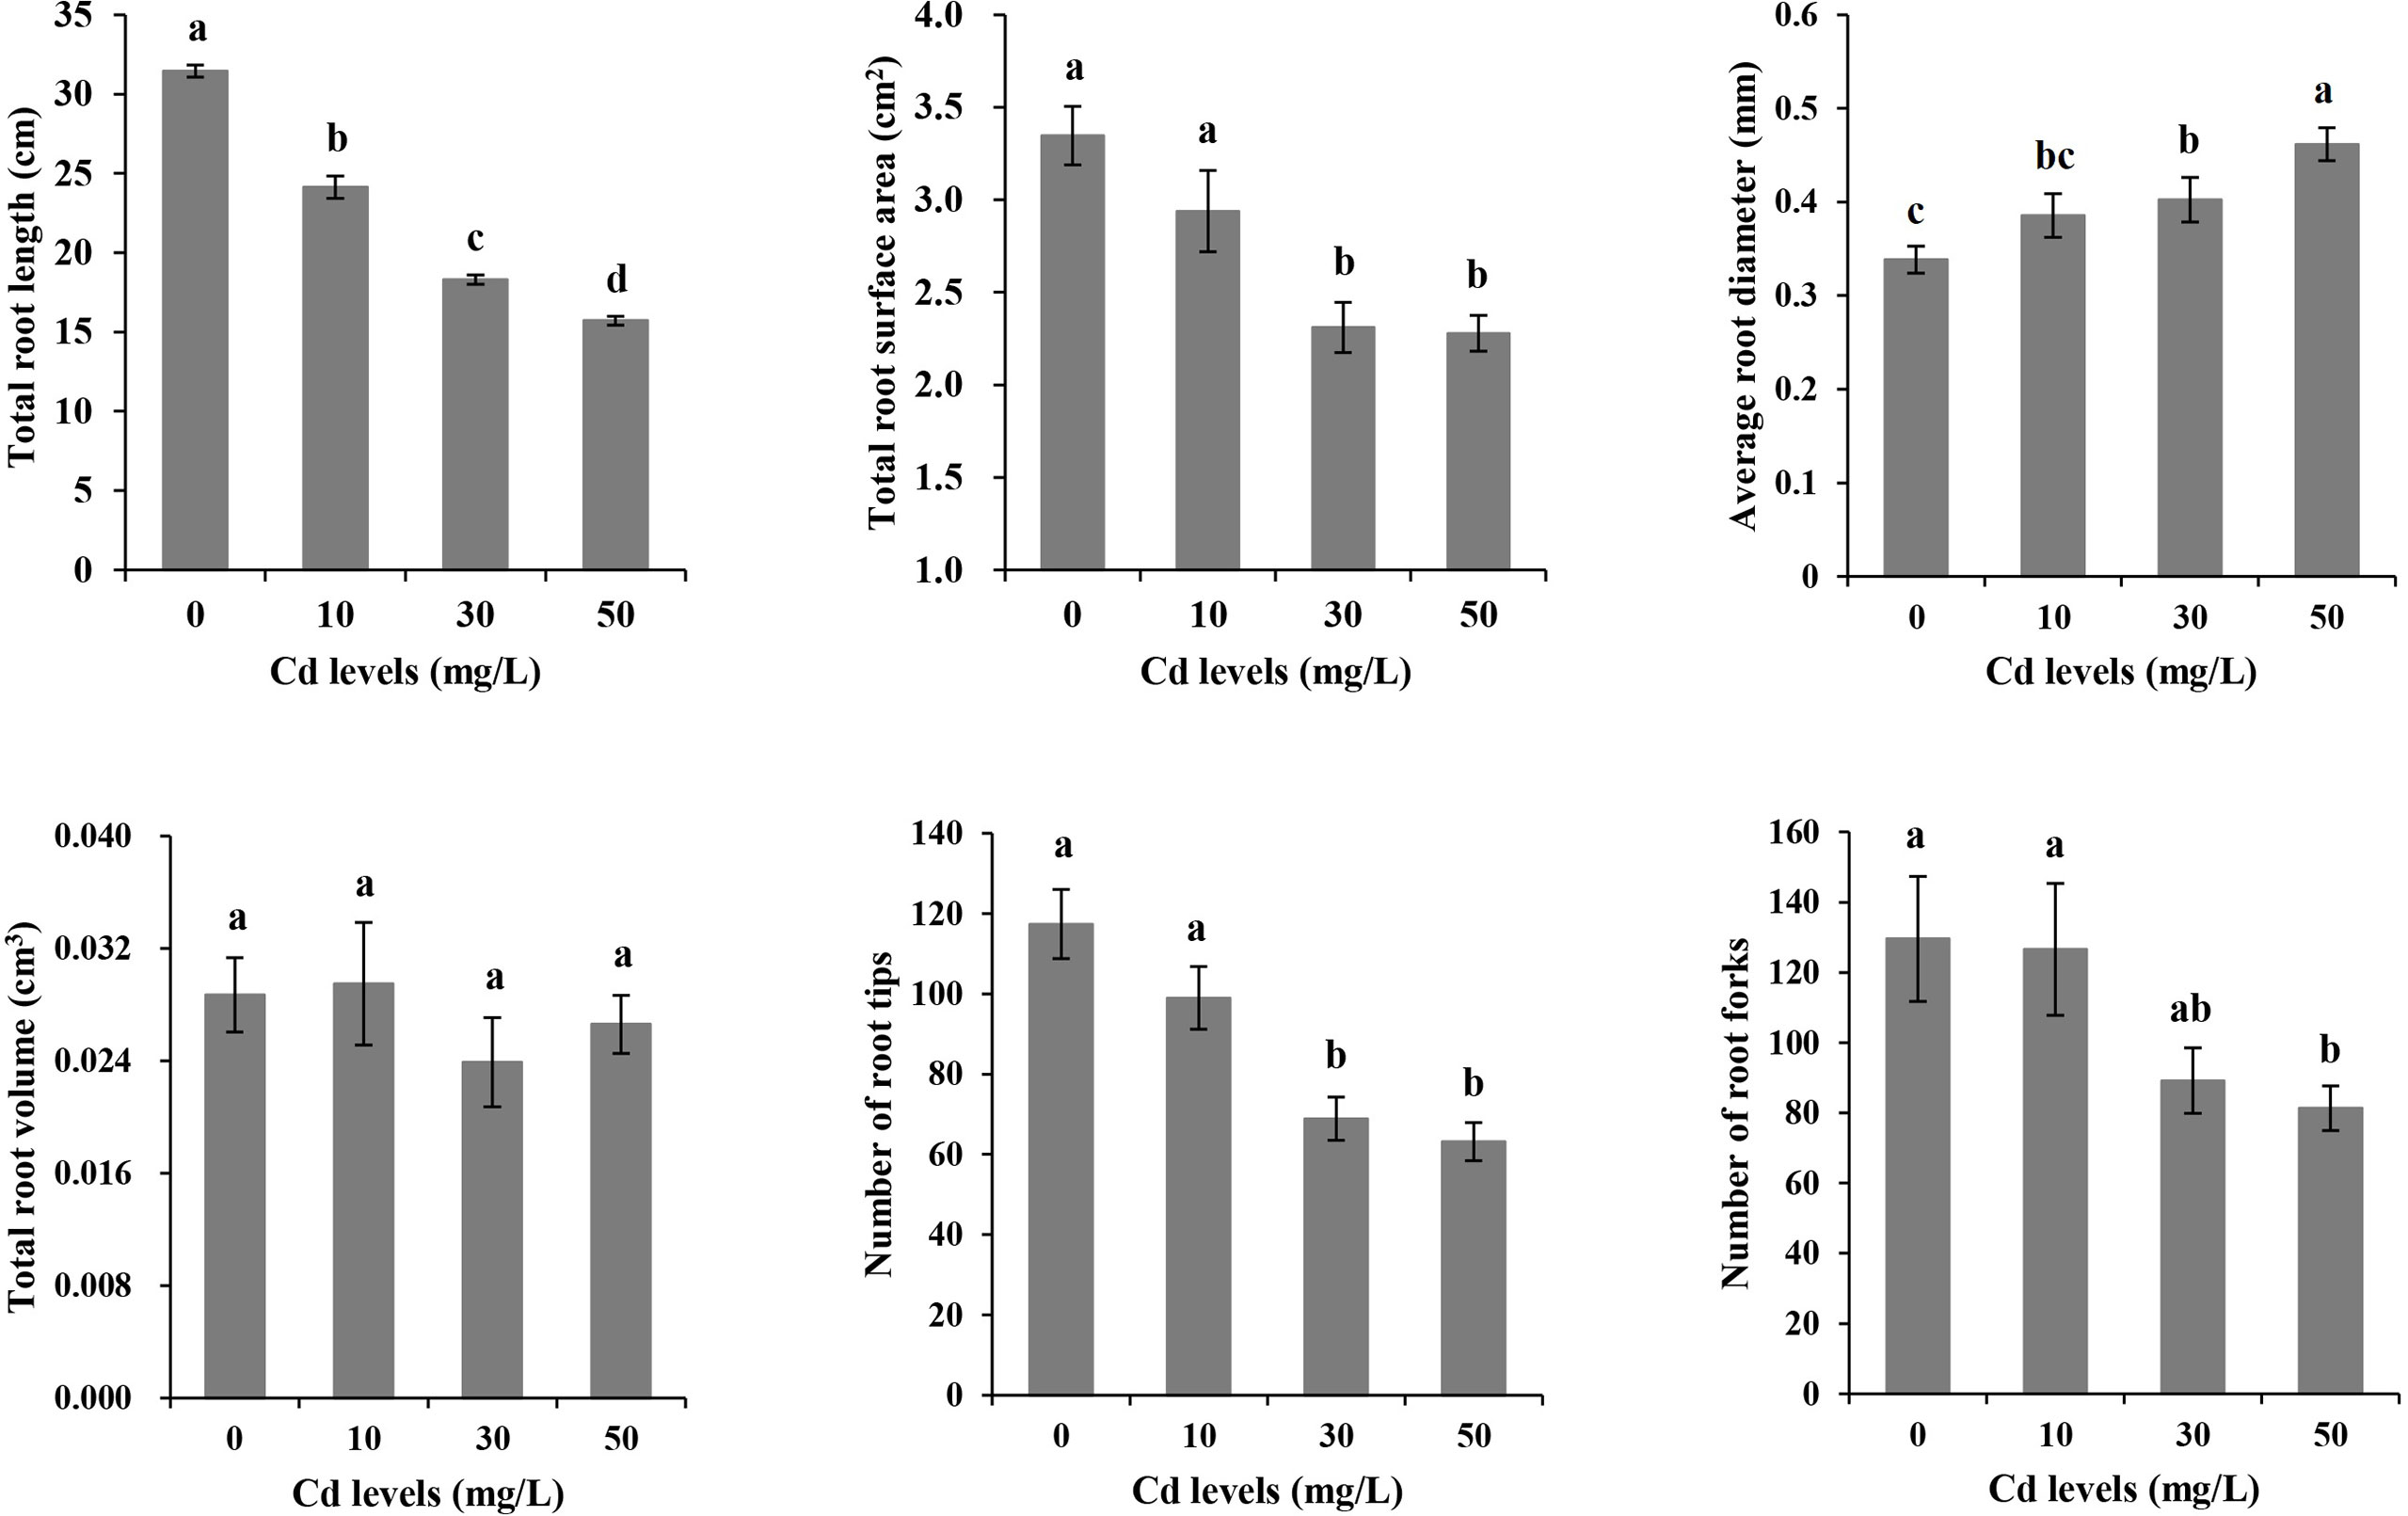
Figure 2 The morphological characteristics of roots in Tartary buckwheat seedling under cadmium stresses. Different lowercase letters on the top of bars indicate significant differences between treatments according to Duncan t-test (p-value < 0.05).
Cd can trigger the antioxidant system to respond to Cd toxicity in plants. We tested SOD, POD, GSH, and MDA in different tissues after a 7-day treatment of Cd stress. The antioxidant activities and MDA accumulation varied in different tissues under different Cd stresses (Figure 3). In roots, the activities of SOD under Cd10 and Cd30, and the GSH under Cd10 increased, while the GSH decreased under Cd50. The activities of POD and the accumulation of MDA significantly decreased with the increase of Cd concentration. In stems, the higher the Cd concentration, the lower the activities of POD and GSH, and the less the accumulation of MDA. The activities of SOD significantly increased and decreased under Cd10 and Cd50, respectively. In leaves, the activities of SOD and the accumulation of MDA significantly decreased with the increase of Cd concentration. The activities of POD and GSH significantly increased under Cd10 but significantly decreased under Cd30 and Cd50.
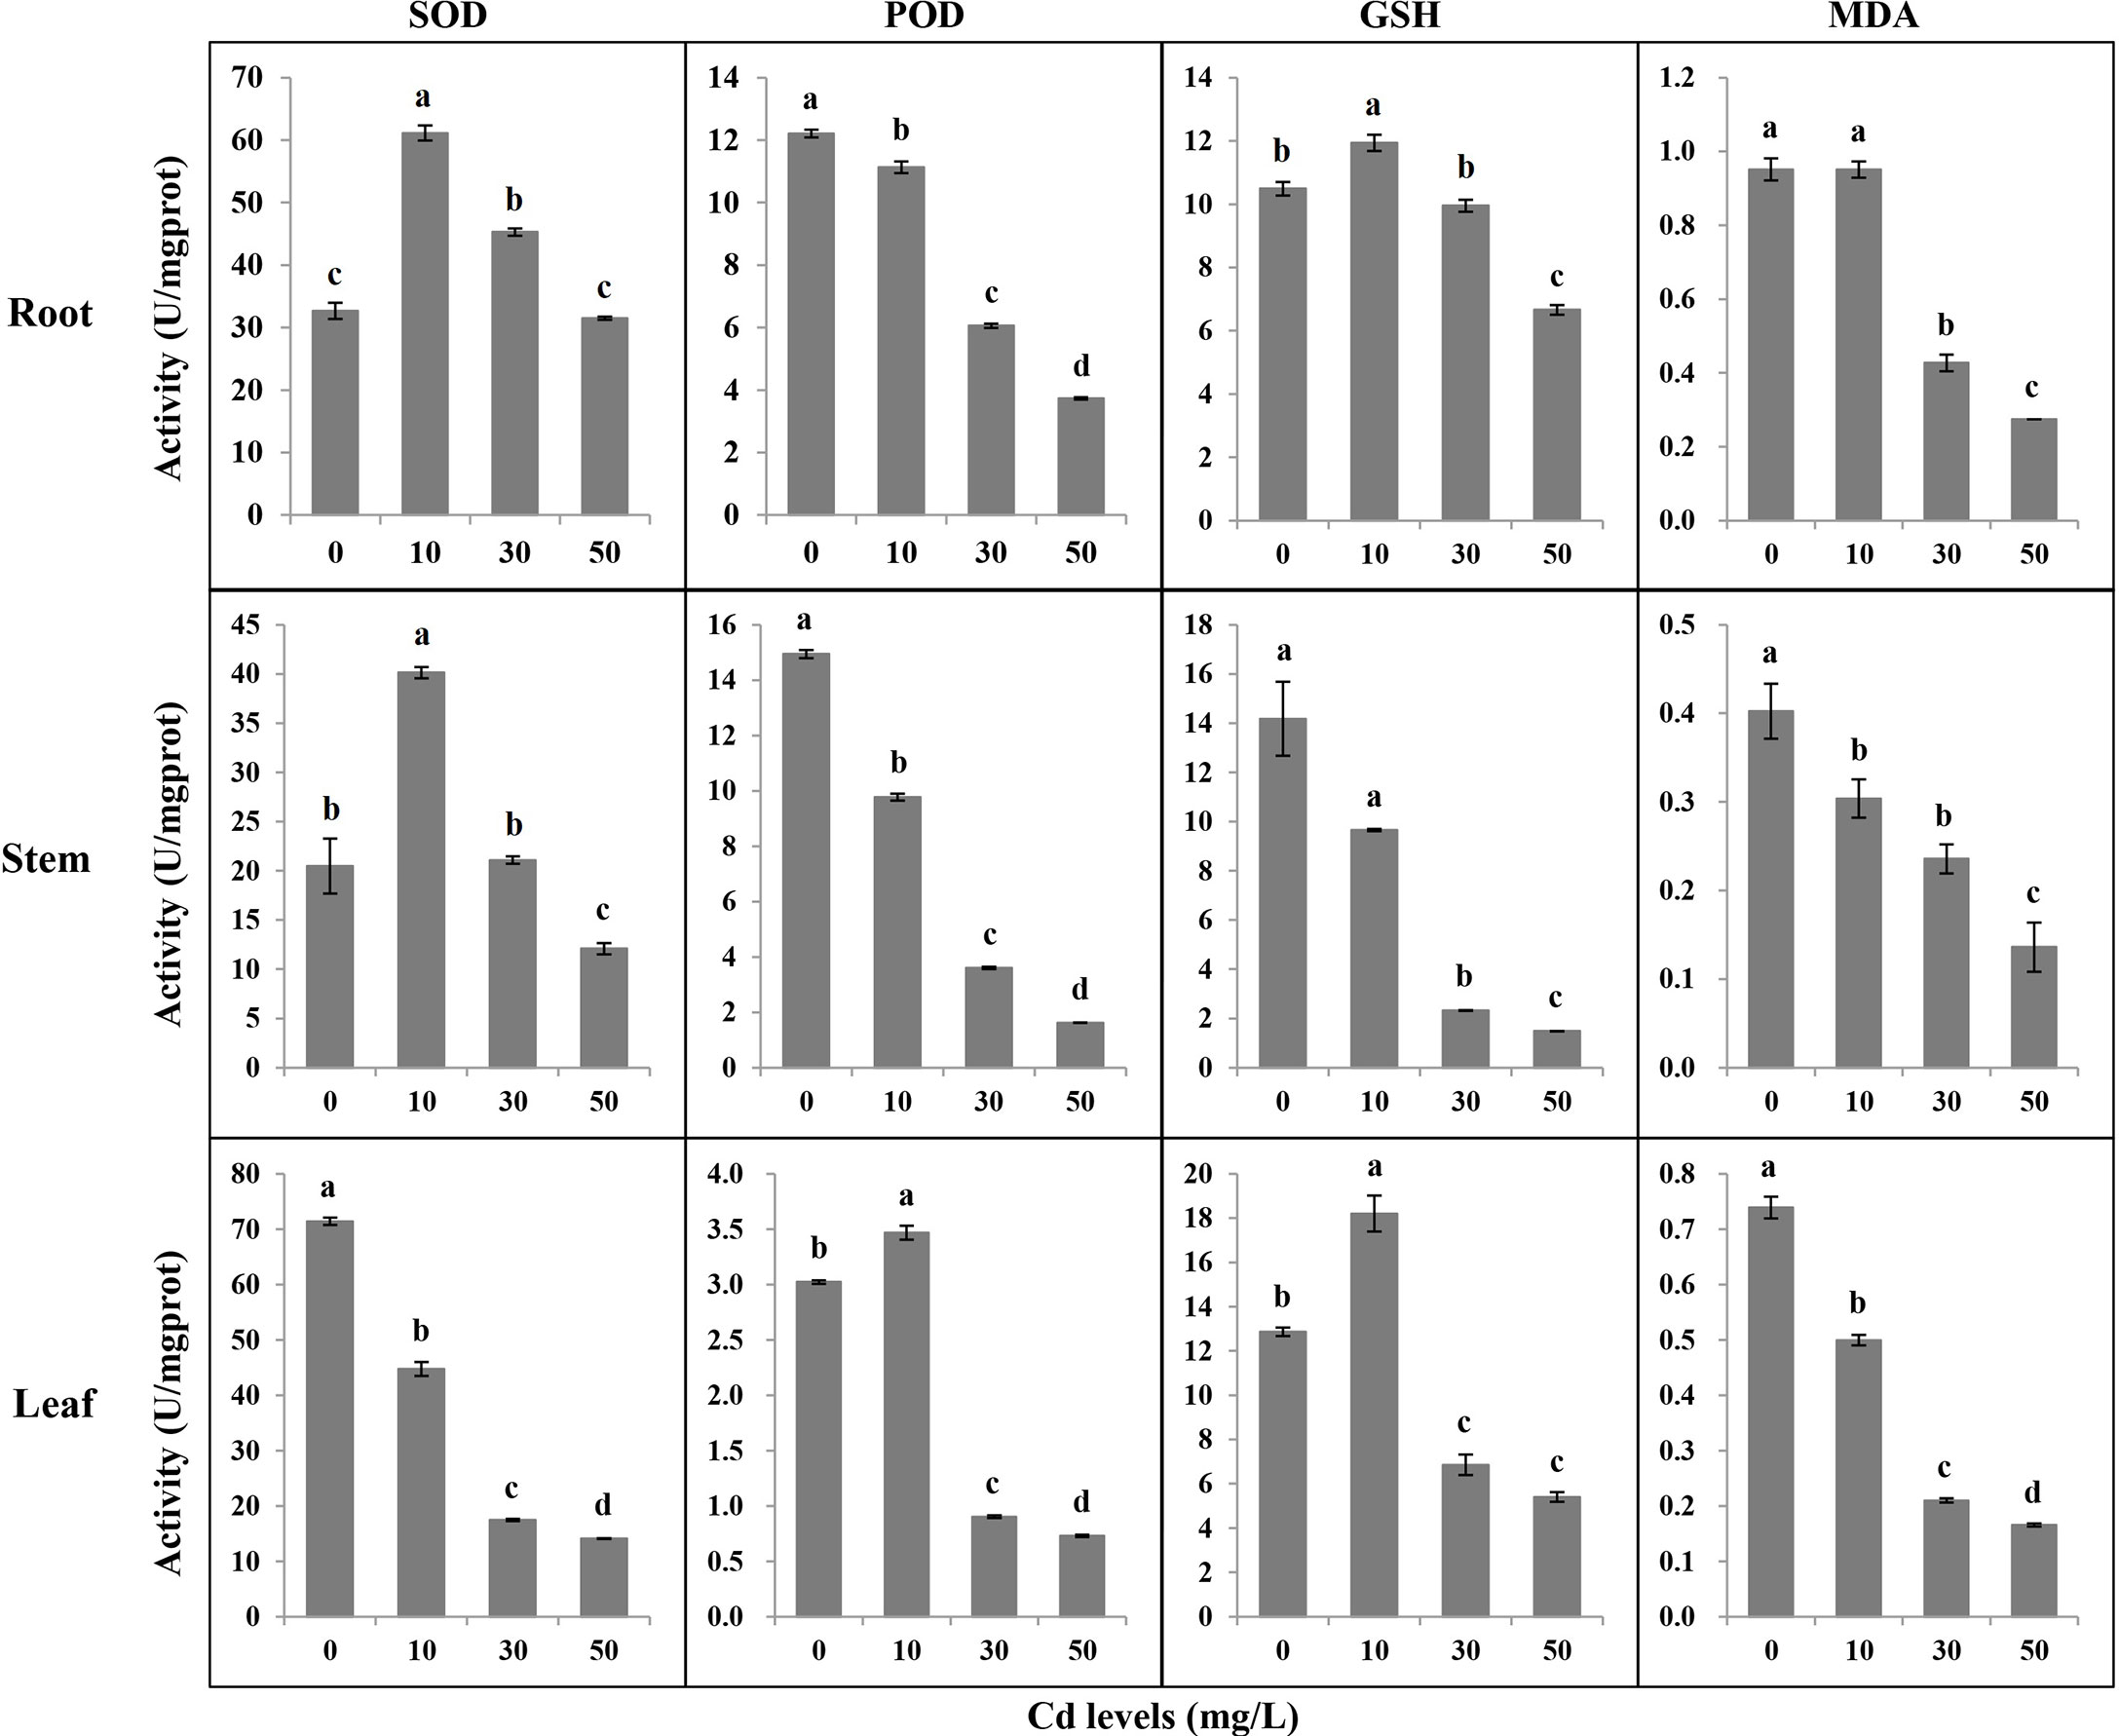
Figure 3 The antioxidant activities and malondialdehyde content in different tissues of Tartary buckwheat seedling after 7-day treatments. SOD, superoxide dismutase; POD, peroxidase; GSH, glutathione; MDA, malondialdehyde. Different lowercase letters on the top of bars indicate significant differences between treatments according to Duncan t-test (p-value < 0.05).
We analyzed the Cd accumulation in roots, stems, and leaves under different concentrations of Cd treatment (Figure 4). For a given level of the treatments, Cd accumulated the most in root and least in leaf tissues. For the same tissue, the higher the Cd concentration of treatments, the higher the concentration absorbed by the tissue. The highest Cd concentration (2991.17 mg/kg) was detected in roots, which were almost four folds than in leaves under the treatment of Cd50, 16.7-fold than in leaves (179.43 mg/kg) under treatment of Cd10. The differences in Cd concentration between different tissues under the same Cd treatment or in the same tissue under different treatments reached extremely significant levels.
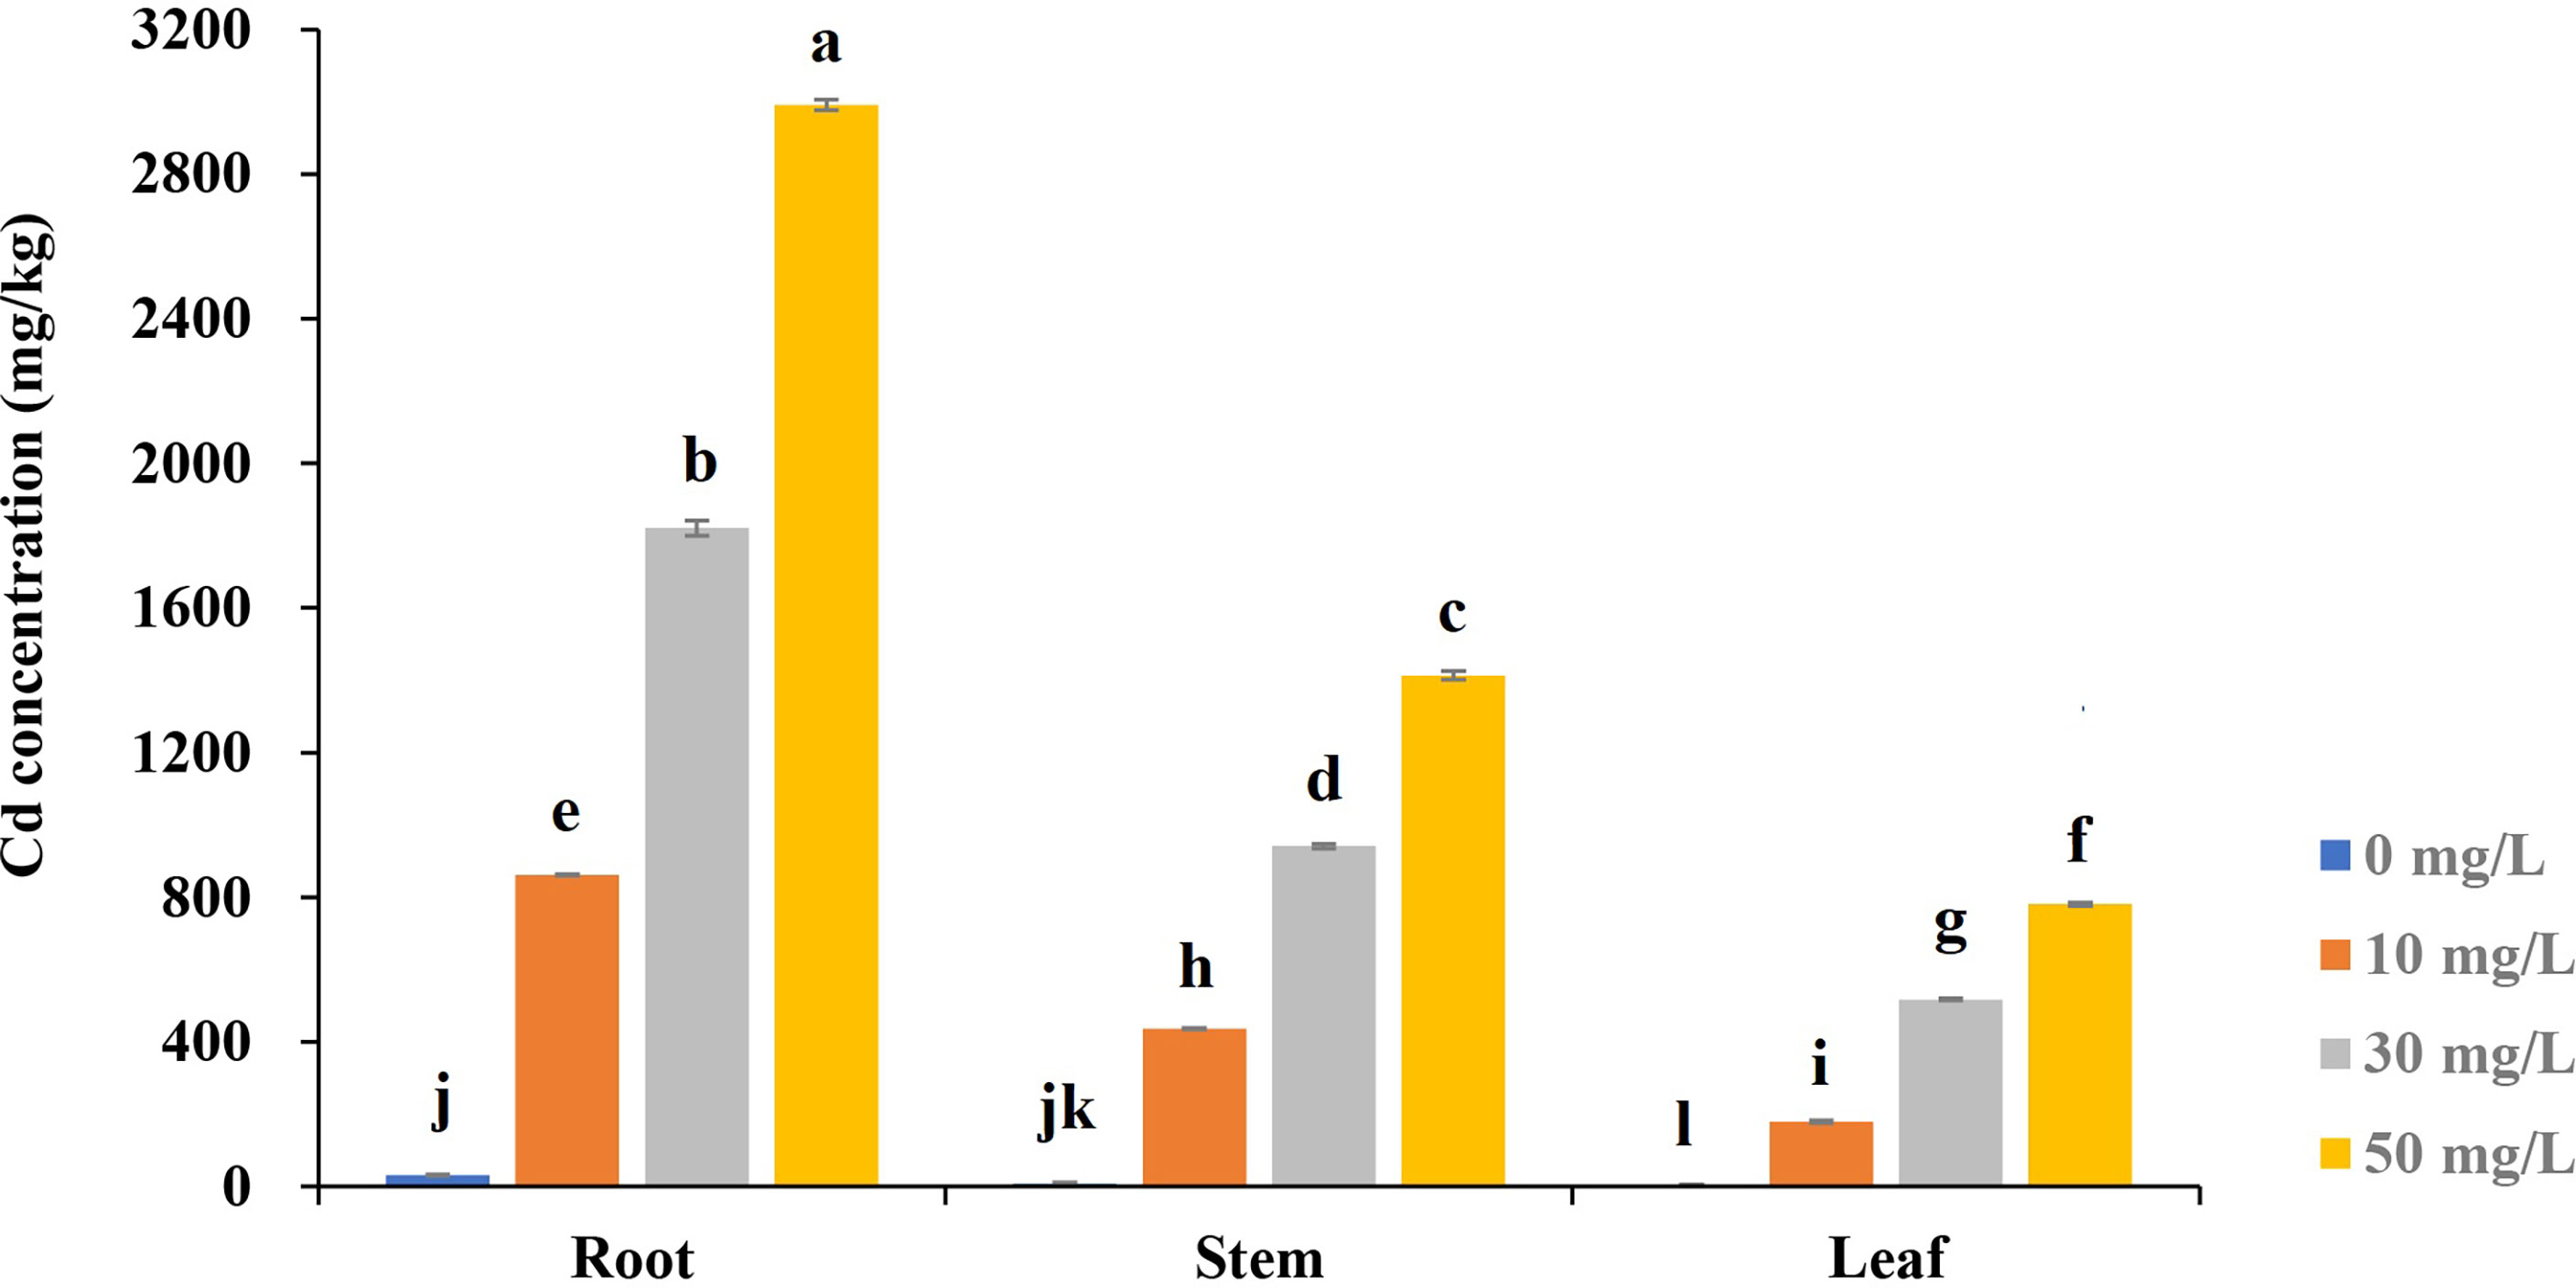
Figure 4 The Cd concentration in different tissues of Tartary buckwheat seedling under various cadmium stresses after 7-day treatments. Different lowercase letters on the top of bars indicate significant differences between treatments according to Duncan t-test (p-value < 0.05).
The significant differences in the primary structure of roots between CK and Cd treatments were identified (Figure 5). The transverse sections of roots from CK were smaller than those from Cd treatments. Compared with those from CK, the parenchymal cells in the cortex were smaller with increased numbers and closer arrangement under Cd treatments. Meanwhile, Cd treatments increased the endodermis thickness and reduced the sizes of primary xylems. Casparian strips were formed in Cd-treated roots.

Figure 5 The primary structure of roots under different cadmium treatments. a, endodermis; b, primary xylem; c, primary phloem; d, cortex; e, epidermis; f, casparian strip. CK, Cd10, Cd30, Cd50 indicates the Cd concentration 0 mg/L, 10 mg/L, 30 mg/L, and 50 mg/L, respectively.
The ultrastructural examinations showed that cells in roots from CK were well-shaped and complete with smooth plasma membranes, cell walls, and intact organelles (Figures 6A, E, I). We observed the phenomenon of plasmolysis in root cells under Cd treatments (Figures 6F, G, J–L). The cells deformed under Cd30 and Cd50 (Figures 6C, D, K, L). There’s no significant difference in cell walls between CK and Cd10, while the cell walls under Cd30 and Cd50 were slightly damaged (Figures 6G, K, L), and under Cd50 were thinner than those under other treatments (Figures 6D, H, L). The vacuoles enlarged, and many organelles were severely damaged and disappeared under Cd treatments (Figures 6J–L). The Cd-induced depositions were evenly distributed in the vacuoles under Cd10 and Cd30 (Figures 6B, C, J, K). And some black precipitates gradually appeared on the inner sides of the vacuoles with the increase of Cd concentration (Figures 6D, L).
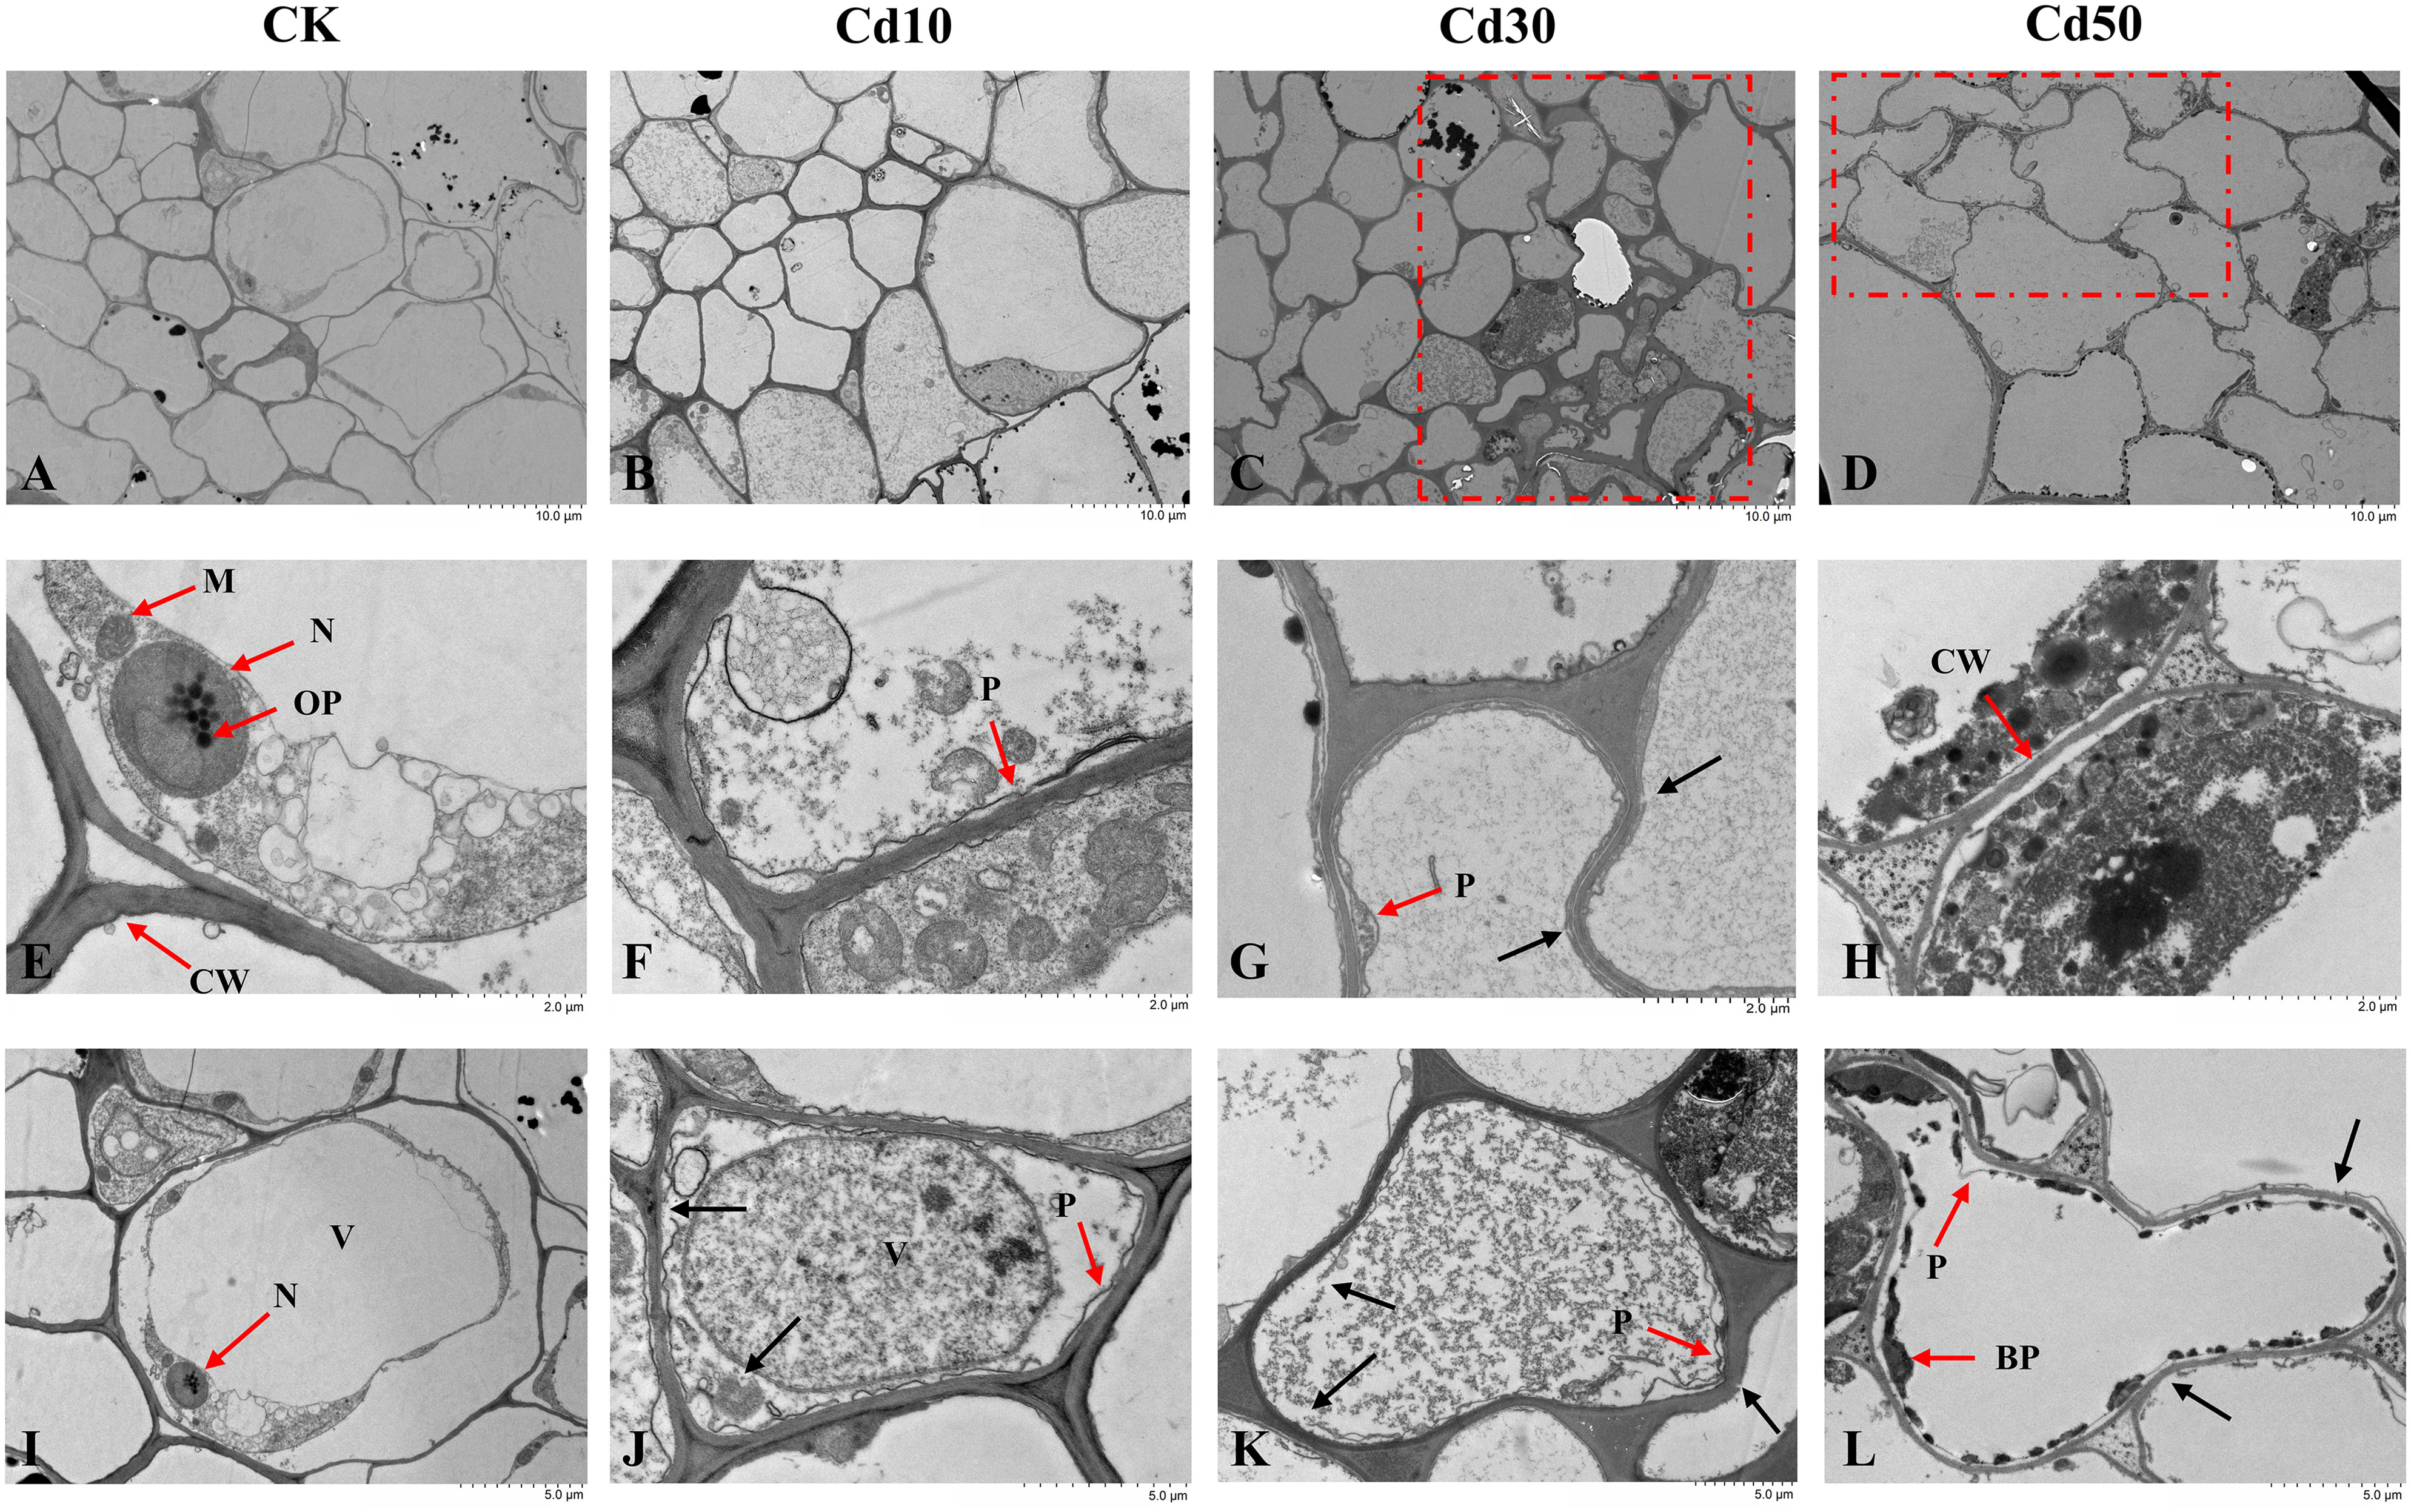
Figure 6 The ultrastructural examinations of root cells under different cadmium treatments. (A, E, I) Normal cell morphology, organelles, plasma membranes, and cell walls in controls. (B–D) Cell morphology under different Cd concentrations of treatments. (F–H, J–L) Damages induced by Cd in cell morphology, organelles, plasma membranes, and cell walls. CK, Cd10, Cd30, Cd50 indicates the Cd concentration 0 mg/L, 10 mg/L, 30 mg/L, and 50 mg/L, respectively. BP, black precipitates; CW, cell wall; M, mitochondria; N, nucleus; OP, osmiophilic particles; P, plasmolysis; V, vacuole. The red box shows the cell deformation. The red arrow points to the organelle or cellular content corresponding to the letters. The black arrow indicates the damaged parts.
To clarify gene expression of Tartary buckwheat under Cd stress, RNA sequencing was performed on roots treated with different Cd concentrations. A total of 78.61 Gb clean sequences were obtained from 12 samples, and each sample at least contained 6.10 Gb clean data. The score Q30 of the clean sequences for each sample was more than 94.17%. The clean data were mapped to the Tartary buckwheat reference genome, the mapping ratio varied from 90.30% to 93.67% for each sample, and the unique mapped reads accounted for 88.60-91.83% (Supplementary Table 1). A total of 31,674 transcripts were generated from all mapped reads. From the mapped results, we identified 1,956 new genes, 755 of them were functionally annotated. According to the threshold of average FPKM ≥ 1, 20,424, 20,700, 20,795, and 20,285 genes were expressed under CK, Cd10, Cd30, and Cd50, respectively. Of them, 377 genes were newly annotated, and 1,435 genes were highly expressed (average FPKM ≥ 100).
A total of 3,647 DEGs in response to Cd stresses were identified based on the criteria of FC ≥ 2 and FDR < 0.01 (Table 1). Compared with CK, 1,130 (726 up-regulated and 404 down-regulated), 1,581 (1,110 up-regulated and 471 down-regulated), and 3085 (1,798 up-regulated and 1,287 down-regulated) DEGs were identified from Cd10, Cd30, and Cd50, respectively. The results showed that the higher the Cd concentration, the more the DEGs. Moreover, 701 of these DEGs were detected in all of the Cd treatments. Of them, 495 were up-regulated and 206 down-regulated. There were 107 DEGs between Cd10 and Cd30, 1,108 between Cd10 and Cd50, and 920 between Cd30 and Cd50 (Table 1).
GO classification was carried out for the 3467 DEGs and all of the expressed genes. The DEGs could be categorized into 37 GO terms (Supplementary Figure 1). Compared with all expressed genes, a higher percentage of DEGs was involved in “single-organism process”, “localization”, “response to stimulus”, “multi-organism process”, and “immune system process” in the biological process category. A higher percentage of DEGs was expressed in “membrane”, “membrane part”, “extracellular region”, “cell junction”, “symplast”, “extracellular region part” in the cellular component category. A higher percentage of DEGs was enriched in “catalytic activity”, “transporter activity”, “antioxidant activity”, and “nutrient reservoir activity” in the molecular function category.
To understand the gene functional characteristics of DEGs, we analyzed the overview of the metabolic and regulatory pathways. There were 546 DEGs mapped to the metabolism overview and 1017 DEGs mapped to the regulation overview (Figure 7). In metabolism overview (Figure 7A), most DEGs were involved in cell wall metabolism, lipids metabolism, secondary metabolism, and the oxidative pentose phosphate (OPP) pathway. In the secondary metabolism pathway, there were 65 DEGs related to flavonoids metabolism, and 73 were associated with phenylpropanoids & phenolic metabolism. In regulation overview (Figure 7B), a great number of DEGs were associated with transcription factor (Supplementary Figure 2), protein modification and degradation, hormone pathway, and signaling pathway. In the signaling pathway, 207 DEGs were receptor kinases, 36 DEGs were involved in calcium regulation.
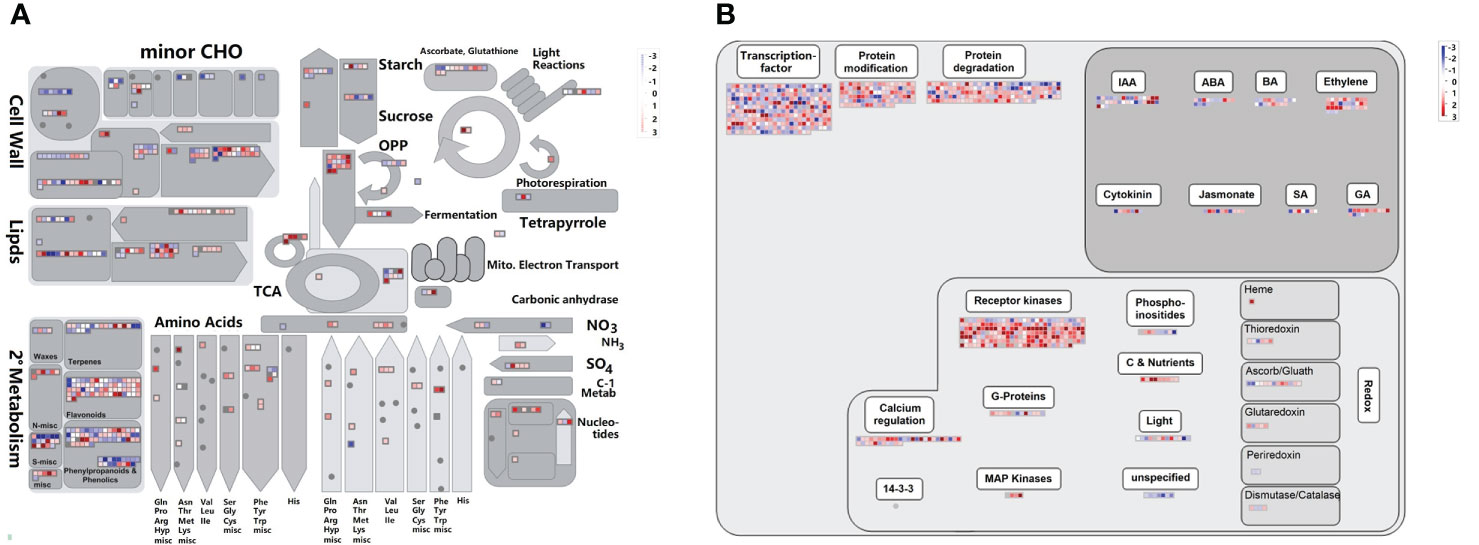
Figure 7 Overviews of cellular metabolism (A) and regulation (B) for DEGs. DEGs indicates differentially expressed genes. The individual small square indicates one DEG. The scale from -3 to +3 indicates the average FPKM normalized log2 transformed counts of DEGs.
After being filtered by the WGCNA package, a total of 1069 genes were used to generate a heat map of the module-sample matrix (Figure 8A). The results showed the brown module had higher positive correlations with root characteristic ARD and the Cd concentration in the three tissues assessed (Figure 8A and Supplementary Figure 3). The genes in the brown module were highly expressed under Cd50 treatment and not significantly different among CK, Cd10, and Cd30 (Figure 8B). The results suggested that genes specifically expressed under Cd50 treatments regulated ARD and Cd absorption. There were 159 genes in the brown module. Of them, 137 were selected to do further analysis based on the connectivity weight value over 0.7. Moreover, we identified 1748 DEGs that were specifically expressed under Cd50 treatments (Figure 9A). Of them, 88 were included in the brown module as well (Figure 9B). They were important genes specifically induced by Cd50. The molecular function analysis for the 88 genes showed that they were primarily involved in oxidoreductase activity, nitrate transmembrane transporter activity, and iron ion binding (Figure 9C). Furthermore, the KEGG pathway enrichment pathways were mostly phenylpropanoid biosynthesis and plant hormone signal transduction (Figure 9D).
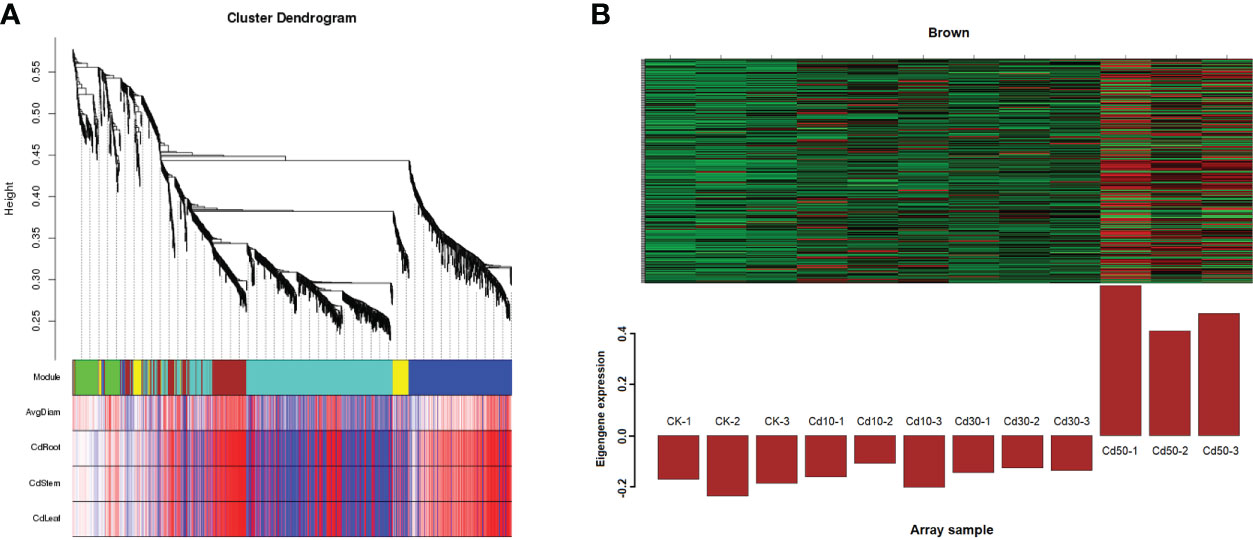
Figure 8 Weighted gene co-expression network analysis between traits and modules. (A) Heat map of correlations between modules and traits. In the traits part, the redder the color, the more positive the correlation. A strong correlation existed between genes in the brown module and the traits like ARD, and Cd concentration in different tissues. CK, Cd10, Cd30, Cd50 indicates the Cd concentration 0 mg/L, 10 mg/L, 30 mg/L, and 50 mg/L, respectively. AvgDiam, Average diameter; CdRoot, CdStem, and CdLeaf indicate the Cd concentration in roots, stems, and leaves, respectively. (B) The specific high expression genes under Cd50 treatments in the brown module.
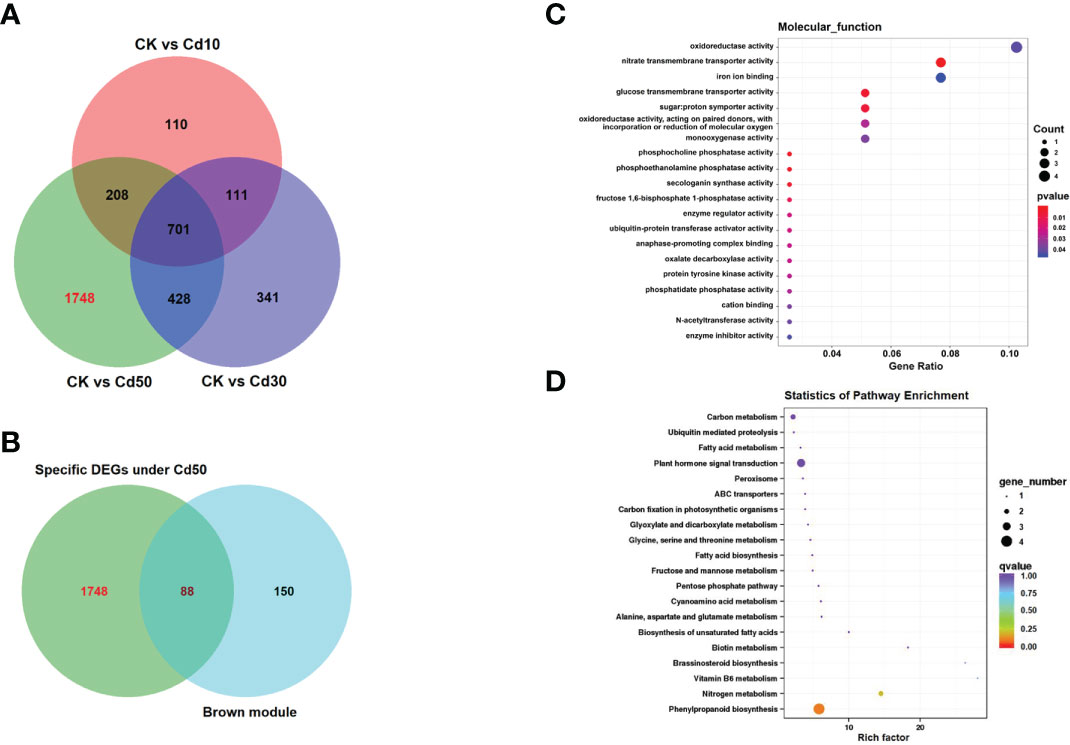
Figure 9 The Venn diagram, Molecular function, and KEGG (Kyoto Encyclopedia of Genes and Genomes) enrichment analyses for the hub genes induced by Cd50. (A) Venn diagram for the specifically expressed genes under Cd50. (B) The 88 genes were not only specifically expressed under Cd50 but also existed in the brown module. (C, D) Molecular function and KEGG analyses for 88 genes. CK, Cd10, Cd30, Cd50 indicates the Cd concentration 0 mg/L, 10 mg/L, 30 mg/L, and 50 mg/L, respectively. DEGs indicates differentially expressed genes.
The interaction networks analysis showed 448 edges among the 88 nodes (Figure 10). We identified 9 core genes playing critical roles in the interaction networks based on the total weight values of connectivity (Table 2). They interacted with each other. Four of them were involved in metal ion binding. They were FtPinG0201871600.01, FtPinG0505176900.01, FtPinG0505205000.01, and FtPinG0809126500.01. FtPinG0100416000.01 was homologous to GMGT1 (galactomannan galactosyltransferase 1) in Cyamopsis tetragonoloba, which is involved in transferase activity in cell wall organization (Edwards et al., 2004). The function of FtPinG0201259500.01 is unknown. FtPinG0302785600.01 and FtPinG0606994800.01 were transcription factors NAC and AFT, respectively. FtPinG0302785600.01 was homologous to Arabidopsis gene SMB (SOMBRERO) involved in plant-type secondary cell wall biogenesis, positive regulation of cell fate commitment, regulation of transcription, and root cap development (Willemsen et al., 2008; Bennett et al., 2010). Transcription factor AFT (Gene ID: FtPinG0606994800.01) was involved in the positive regulation of transcription from RNA polymerase II promoter in response to iron ion starvation based on the GO annotation. FtPinG0303392700.01 contained a calmodulin (CaM)-binding domain, which was related to the calcium (Ca) signal transduction pathway.
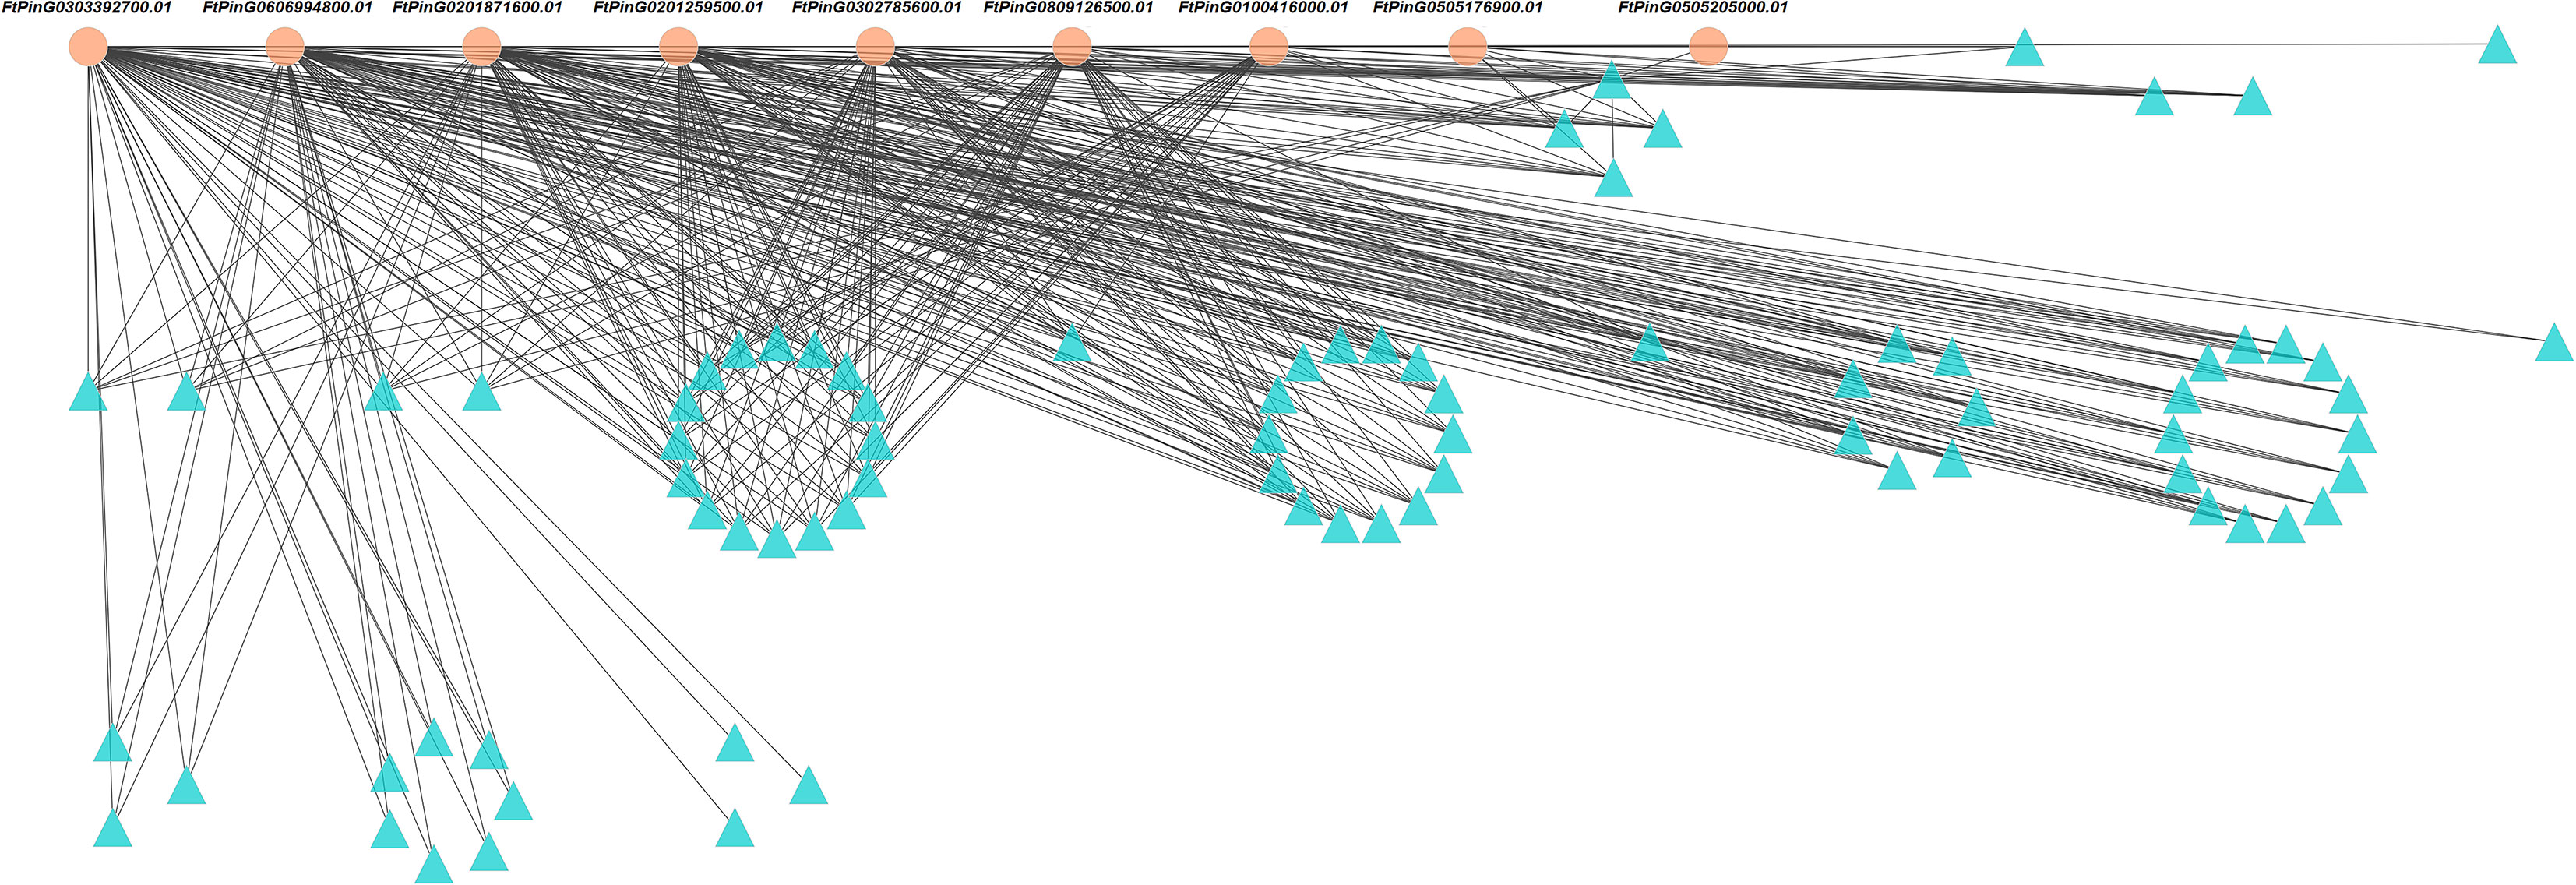
Figure 10 The interaction networks among 88 genes induced by Cd50 based on the gene expression profile. The genes with orange background were 9 core genes expressed under Cd50. Cd50 indicates the Cd concentration of 50 mg/L.
Nine core genes played critical roles in the response to Cd stress based on the WGCNA and interaction networks analyses. To verify the expression levels of these genes, we designed primers (Supplementary Table 2) for qRT-PCR analysis based on their coding sequence (CDS). As displayed in Figure 11, a significant difference in expression for each gene was detected between Cd50 and the other treatments. The 9 core genes were expressed more under Cd50 than under any other treatment, which was consistent with the gene expression trend in the brown module as shown in Figure 8B. Meanwhile, the expression levels of FtPinG0505205000.01 and FtPinG0809126500.01 were the same as the RNA-seq results under different treatments. The expression for the rest seven genes slightly varied under Cd10 and Cd30. FtPinG0100416000.01 showed increase expression under Cd10 and Cd30. FtPinG0201259500.01 down-regulated under Cd30. FtPinG0201871600.01 and FtPinG0303392700.01 slightly upregulated under Cd30. The expression of FtPinG0302785600.01 decreased under Cd10. With the increase of the Cd concentration, the expression of FtPinG0505176900.01 enhanced. And its expression under Cd50 treatment is 28 times that of CK. FtPinG0606994800.01 down-regulated both under Cd10 and Cd30.
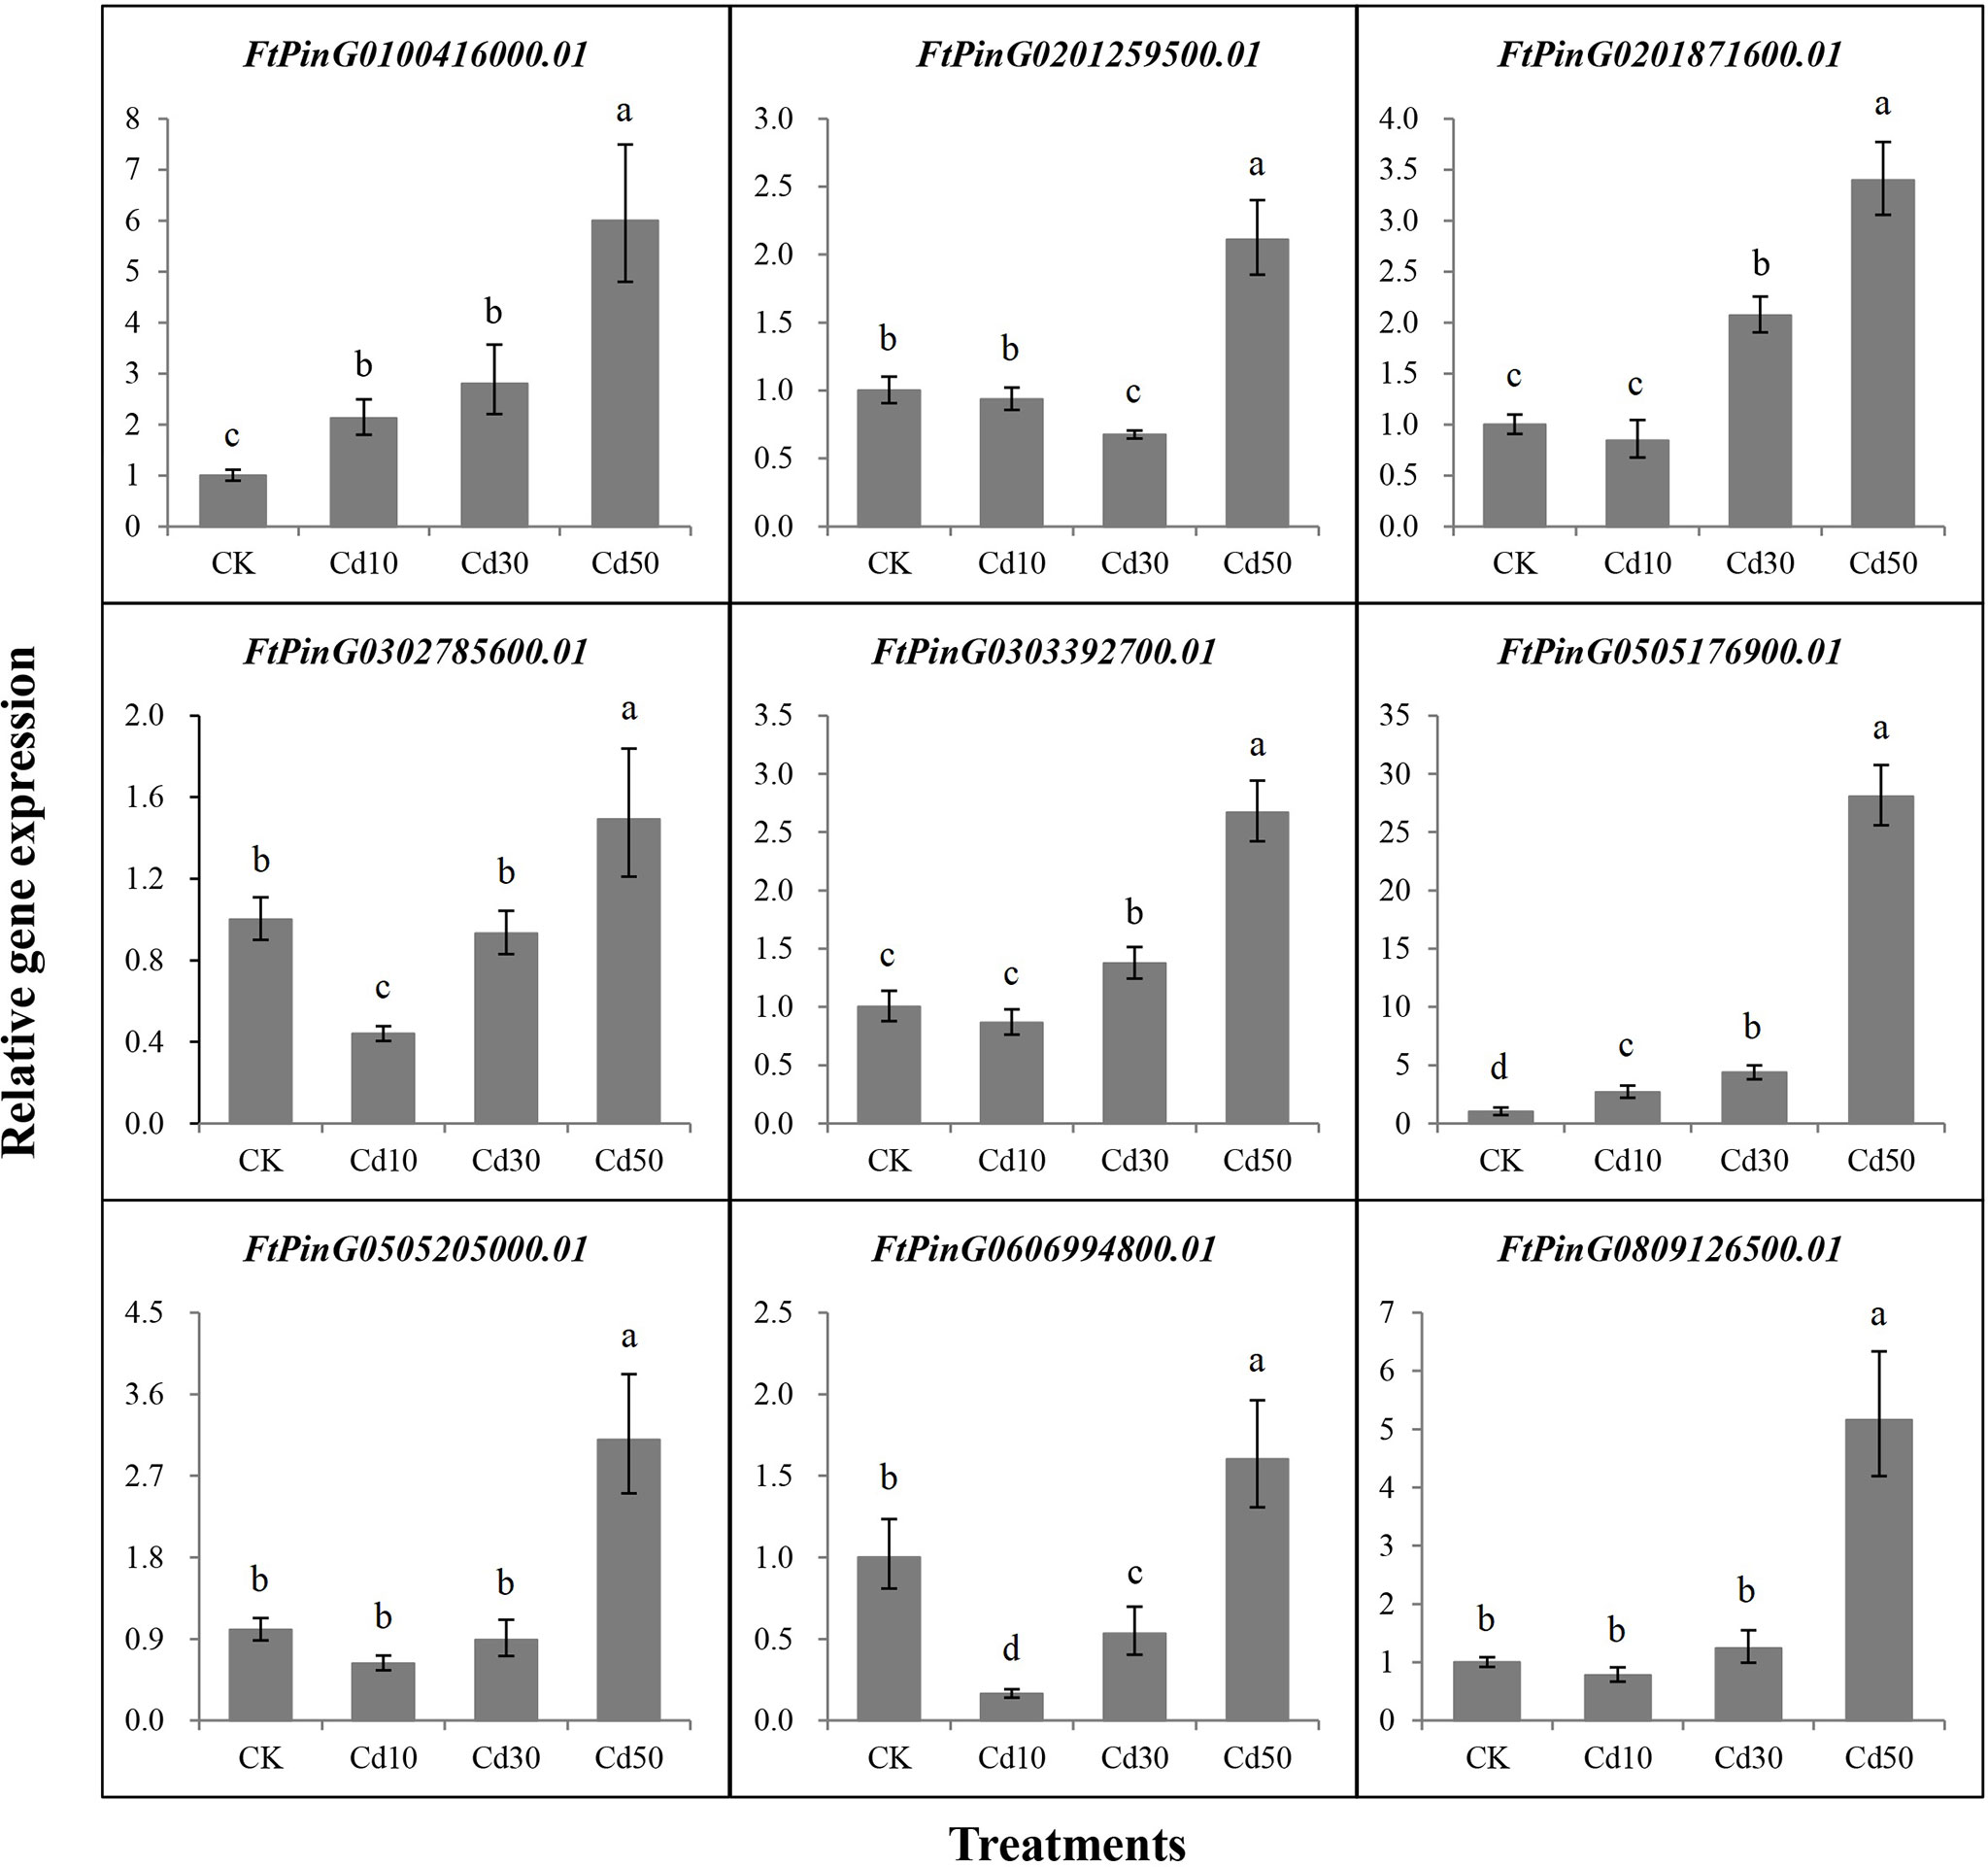
Figure 11 The relative gene expression for 9 core genes was highly induced by Cd stress of 50 mg/L. CK, Cd10, Cd30, and Cd50 indicates the Cd concentration 0 mg/L, 10 mg/L, 30 mg/L, and 50 mg/L, respectively. Different lowercase letters on the top of bars indicate significant differences between treatments according to Duncan t-test (p-value < 0.05).
Cd stress inhibited Tartary buckwheat growth. Although high concentrations of Cd accumulated (2991.17 mg/kg) in the roots, the plants showed no obvious disease spots even under the high concentration of Cd treatment (50 mg/L) for 7 days (Figure 1). The results seem to indicate that Tartary buckwheat cv XQ1 is highly tolerant to Cd, with the increase in root diameter as a possible contributing factor. Potocka and Szymanowska-Pułka (2018) reported that plants could increase root diameter to adapt to unfavorable environments. Many reports found that Cd stress can elevate the root diameter and accelerate the root maturation (Scebba et al., 2006; Lux et al., 2011; Wang et al., 2016; Qin et al., 2018). Here, we observed significant differences in root morphological characteristics and transverse sections between CK and Cd treatments. Compared with CK, the root diameter was larger because of more cell layers of the endodermis and the larger size of the pericycle (Figure 5). Maksimović et al. (2007) reported the bigger size of parenchyma cells and cortical tissues caused an increase in root diameter, thus improving plant resistance to water and solute flow under Cd stress. Bochicchio et al. (2015) believed that the increase in root diameter could be a compensatory growth under metal stress, and it’s a barrier to protect the root from the metals. Liu et al. (2020) found that rice plants had multiple strategies like altering root system architecture (including increasing root diameter) to enhance their tolerance to Cd-induced oxidative stress. Therefore, we believe the increase in root diameter may be a defense response to Cd toxicity in Tartary buckwheat. In addition, with the Cd treatments, the parenchyma cells in the cortex lined up tighter, and the Casparian strip was formed. We thought the relative less Cd transferred to the stems and leaves, which may be limited by the Casparian strip formed in the roots (Figure 5). As reported by Lux et al. (2011), the physical barriers like Casparian strip and lignification can limit Cd translocation to the shoots. Santoro et al. (2022) believed that the up-regulated gene involved in cell wall remodeling and lignification had the function of avoiding cadmium uptake. It’s probably another way for Tartary buckwheat to respond to Cd stress (El Rasafi et al., 2020).
Cd stress activated the antioxidant system as significant changes in antioxidant activities in different tissues under different concentrations of Cd treatments. The enzymatic and nonenzymatic antioxidants belong to the important defensive system that can minimize metal-induced oxidative damage in plants (Rizwan et al., 2017; Hussain et al., 2019; Shanmugaraj et al., 2019; Abedi and Mojiri, 2020; El Rasafi et al., 2020; Angulo-Bejarano et al., 2021). Besides, with the increase of Cd concentration in treatments, MDA content decreased, which indicated the oxidative damage caused by Cd to plants was reduced (El Rasafi et al., 2020). Rizwan et al. (2017) believed pakchoi can enhance the Cd tolerance by decreasing the production of MDA. Therefore, we thought Tartary buckwheat has the potential tolerance to Cd stress. As found in our study, there were no chlorosis and necrosis on plants even under a high concentration of Cd treatment for 7 days. Meanwhile, GO classification analysis showed a significantly higher percentage of DEGs involved in antioxidant activity and immune system process. We considered that the antioxidant system of XQ1 played a role in Cd detoxification.
Berni et al. (2019) believed that secondary metabolites like phenolic acids, flavonoids, and anthocyanins, together with the enzymatic antioxidant system, contributed to the counterbalance of ROS. Many transcription factors such as MYB, AP2/EREBP, WRKY, NAC, and bZIP played key roles in plant tolerance and mitigation of Cd stress (El Rasafi et al., 2020; Angulo-Bejarano et al., 2021). The receptor kinases were the important proteins that bound and transmitted signals, which can trigger the immune responses in plants (Zhou et al., 2019). In Poa Pratensis, many receptor kinases were highly expressed under Cd stress (Xian et al., 2020). All of these genes mentioned above were highly expressed in our study (Figure 7). The overviews of cellular metabolism and regulation pathways revealed most DEGs were involved in flavonoid metabolism, transcription factors, and receptor kinases, suggesting their potential roles in the Cd defense responses. To summarize, our results, for the first time, comprehensively analyzed the responses to Cd stress at phenotypic, physiological, cytological, and molecular levels in Tartary buckwheat.
The cell wall is the first barrier for Cd to get into the cell and the major site to immobilize Cd by ion binding, which is an important strategy to detoxify Cd in plants (Shanmugaraj et al., 2019; Santoro et al., 2022). The GMGT1 gene (Gene ID: FtPinG0100416000.01) is involved in galactomannan biosynthesis (Edwards et al., 2004). Galactomannans are the largest group of cell wall storage polysaccharides, which have the function of thickening, emulsifying, gelling, flocculating, and film-forming (Bento et al., 2013). In this study, the expression of GMGT1 gene (Gene ID: FtPinG0100416000.01) may regulate the cell wall against the Cd stress (Bento et al., 2013). As shown in Figure 6, the cell wall under Cd50 was thinner than others.
The FtPinG0201259500.01 is an uncharacterized protein, its function is unknown, but we can be sure it plays an important role in responding to Cd stress based on our studies. It’s a potential novel discover in the function of FtPinG0201259500.01 to respond to Cd stress.
Cd stress can affect the expression of FtPinG0201871600.01, a photosynthetic enzyme in the cytoplasm, fructose-1,6-bisphosphatase. Song et al. (2019) reported that Cd stress can inhibit energy utilization and carbon sequestration by slowing down the activity of fructose-1,6-bisphosphatase. Here, we speculated the growth inhibition of Tartary buckwheat because the lower activity of fructose-1,6-bisphosphatase (Gene ID: FtPinG0201871600.01) caused by Cd stress can depress the photosynthesis and energy consumption.
The SMB gene (Gene ID: FtPinG0302785600.01) could repress stem cell-like divisions in the daughter cells of the root cap and increase the number of cell layers of columella and lateral root cap (Willemsen et al., 2008; Bennett et al., 2010). SMB located in the nucleus belongs to the NAC transcription factor family, which is a big family involved in abiotic stress, plant growth, and development (Yang et al., 2021). Cd stress inhibited plant growth. The roots were shorter and the lateral roots fewer. However, the root diameter increased significantly (Figure 2). Therefore, we thought high expression of SMB gene (Gene ID: FtPinG0302785600.01) may inhibit root elongation through repressing stem cell-like divisions in the root cap daughter cells. Meanwhile, it may increase the root diameter by increasing the cell layer number of the endodermis (Figures 2, 5). The increased cell layer numbers help to prevent the invasion of Cd (Bochicchio et al., 2015; Liu et al., 2020). This phenomenon was also found in many other plants like wheat, soybean, Arabidopsis, Miscanthus sinensis, and Iris lactea (Scebba et al., 2006; Lux et al., 2011; Bochicchio et al., 2015; Wang et al., 2016; Qin et al., 2018; Liu et al., 2020).
Cd stress can activate signaling systems in Tartary buckwheat. The calcium ion (Ca2+) is a major signal molecular under stress conditions (Zhu, 2016; Wang et al., 2021). FtPinG0303392700.01 contains a CaM-binding domain. It could combine with Ca2+ to form a Ca2+-CaM complex, which can transduce the Ca2+ signal by regulating the activities of several downstream target proteins (Wang et al., 2021). Several studies have shown that the Ca2+-CaM complex is involved in the responses to Cd stress (Rivetta et al., 1997; Perfus‐Barbeoch et al., 2002; White and Broadley, 2003; Zeng et al., 2015). Moreover, WGCNA identified that the 88 genes including core genes associated with Cd concentration, suggesting the expression of FtPinG0303392700.01 is associated with the concentration of Cd accumulation in roots. This result was supported by Shukla et al. (2014) since the gene OsACA6 having the CaM-binding domain can sequestrate more Cd2+ in roots to maintain cellular ion homeostasis and modulate the ROS-scavenging pathway.
FtPinG0505176900.01 is orthologous to Arabidopsis gene peroxidase 57, which can sense the signaling of Ca2+ and respond to oxidative stress. It also resisted the Cd stress by removing H2O2 in peroxidase activity in rice (Shah et al., 2001). In this study, the change of the antioxidant activity (Figure 3) in Tartary buckwheat may indicate the peroxidase 57 gene (Gene ID: FtPinG0505176900.01) regulated the response to Cd stress by removing H2O2.
FtPinG0505205000.01 is homologous to Beta vulgaris gene CYP76AD1 (Cytochrome P450 76AD1), which was located in the membrane and involved in the pathway betalain biosynthesis, iron ion binding, and oxidoreductase activity (Hatlestad et al., 2012). In Hylocereus monacanthus, the CYP76AD1 was not only can present different colors but also play fundamental roles in plant responses and adaptation to biotic and abiotic stresses (Zhang et al., 2021b). Here, the CYP76AD1 gene (Gene ID: FtPinG0505205000.01) may regulate the Tartary buckwheat stem turning red under Cd stress (Figure 1) and taking part in the responses to Cd.
The GO annotation showed transcription factor AFT (Gene ID: FtPinG0606994800.01) is involved in the positive regulation of transcription from RNA polymerase II promoter in response to iron (Fe) ion starvation. Besides, He et al. (2017) reported that Cd uptake could lead to competition for the absorption of mineral nutrients like Fe. Therefore, we predicted the Cd stress may trigger the expression of transcription factor AFT (Gene ID: FtPinG0606994800.01) to deal with iron ion starvation.
Long-term high concentration Cd stress could damage the DNA, growth, and development, resulting in senescence and plant death (El Rasafi et al., 2020). FtPinG0809126500.01 is orthologous to Arabidopsis gene ENDO1 (Endonuclease 1) which was involved in the metal ion binding, nucleic acid binding, T/G mismatch-specific endonuclease activity, programmed cell death (PCD), and senescence in plants (Pérez-Amador et al., 2000; Farage-Barhom et al., 2008).
In this study, we analyzed the effects of Cd stress on phenotypic, cytological, physiological, and transcriptomic characteristics in Tartary buckwheat. The interaction networks of 9 core genes revealed that Cd stress can activate a series of responses in this species (Figures 10, 12). Roots were the tissues in direct contact with Cd. Cd stress can activate the signaling system of Ca2+ to form the Ca2+-CaM complex with FtPinG0303392700.01. The Ca2+-CaM complex can trigger the downstream target proteins to respond to Cd stress (Shukla et al., 2014; Wang et al., 2021). The Peroxidase 57 gene (Gene ID: FtPinG0505176900.01) took part in the hydrogen peroxide catabolic process to relieve the damage caused by Cd-induced H2O2. The GMGT1 gene (Gene ID: FtPinG0100416000.01) could strengthen the cell wall to block the Cd invasion by regulating the galactomannan biosynthesis. The SMB gene (Gene ID: FtPinG0302785600.01) elevated the root diameter by increasing the number of cell layers and the size of the pericycle, which was a defense response to Cd stress by strengthening the root system. The CYP76AD1 gene (Gene ID: FtPinG0505205000.01) is a cytochrome gene regulating the colors and it’s highly expressed under Cd50. The stems turning red under Cd stress may be regulated by this gene, which could respond to Cd stress by acting as oxidoreductase as well. In addition to the typical defensive responses to Cd stress above, Cd stress also affected the ion balance, and plant growth and development. The Cd uptake could result in competition for the Fe absorption (He et al., 2017). The transcription factor AFT (Gene ID: FtPinG0606994800.01) was involved in the regulation of iron ion starvation. Cd stress limited energy utilization and carbon sequestration by slowing down the activity of fructose-1,6-bisphosphatase (Gene ID: FtPinG0201871600.01), thus depressing the photosynthesis and energy consumption, inhibiting Tartary buckwheat growth (Song et al., 2019). Finally, the long-term high concentration of Cd stress can cause DNA damage like T/G specific mismatch regulated by ENDO1 gene (Gene ID: FtPinG0809126500.01), leading to PCD and senescence in plants (Pérez-Amador et al., 2000; Farage-Barhom et al., 2008).
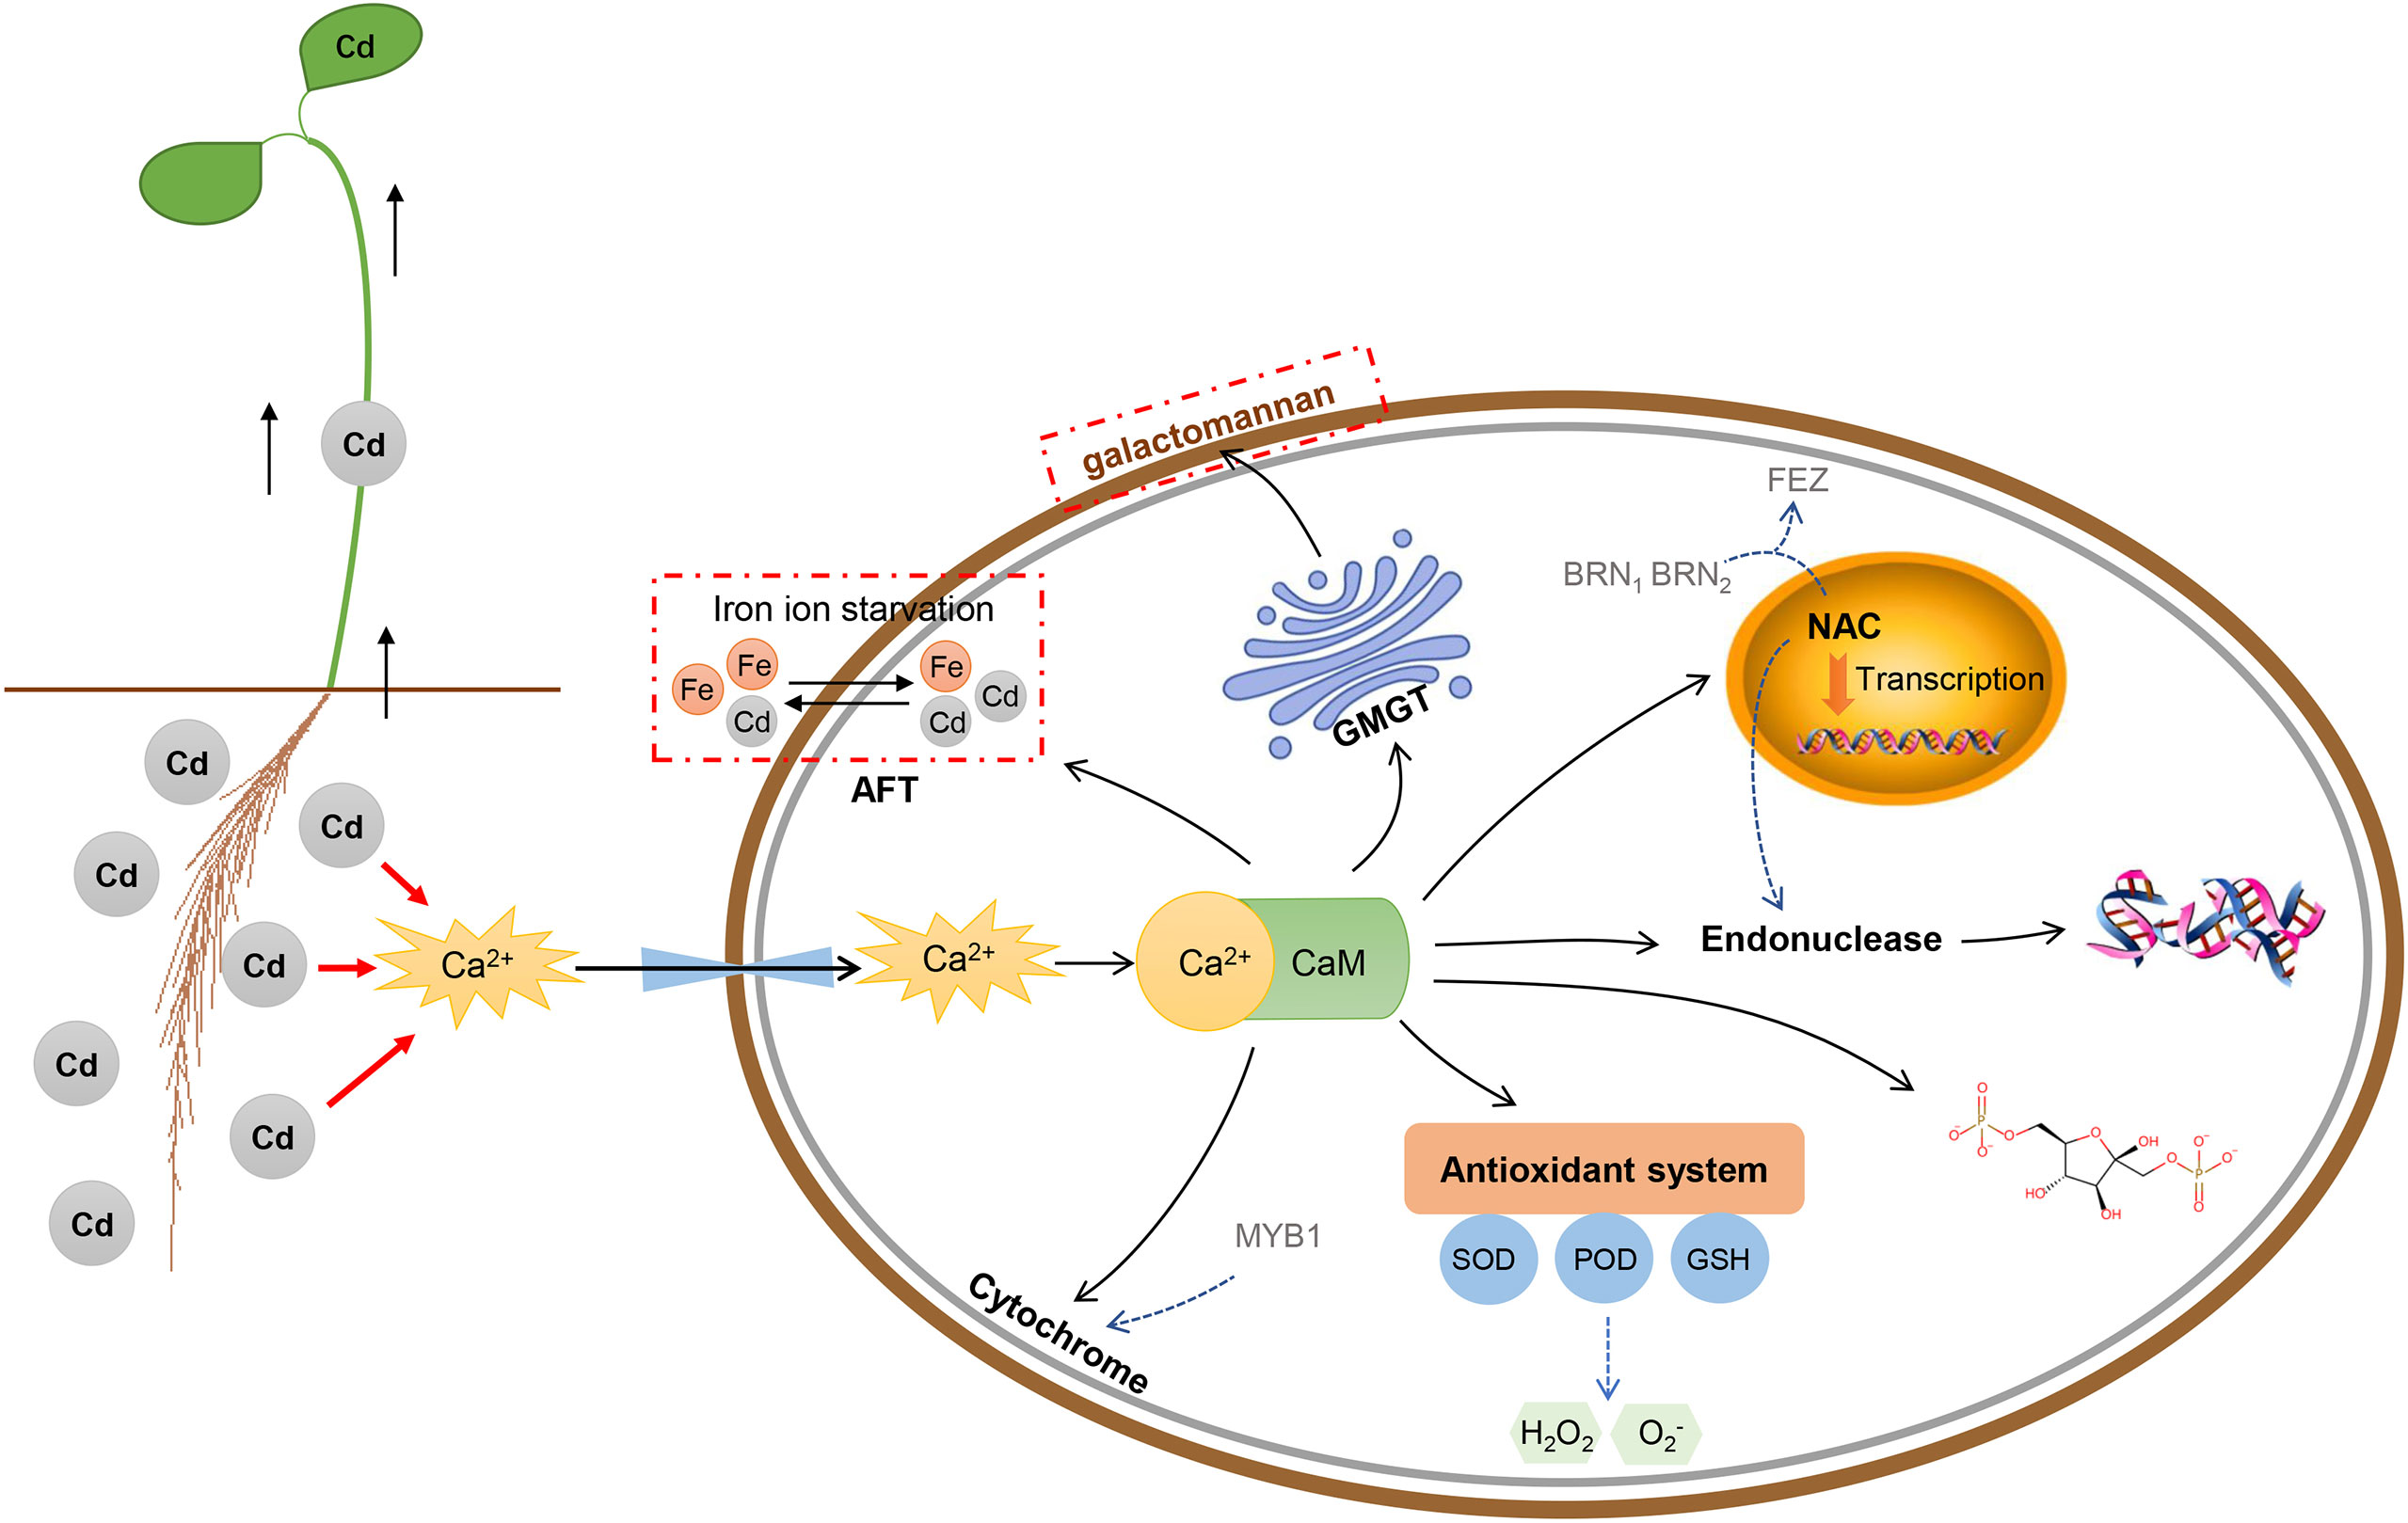
Figure 12 The schematic representation of the physiological and molecular processes induced by Cd stress in Tartary buckwheat roots cells. The CaM-binding domain can transduce the Ca2+ signal by combining with Ca2+ to form a Ca2+-CaM complex, then trigger a series of reactions downstream like antioxidant activity, metal ion binding, plant-type secondary cell wall biogenesis, regulation of transcription, and nucleic acid binding.
Tartary buckwheat can be developed into various commodities well received by consumers. The demanded amount of Tartary buckwheat is large. However, Cd contamination has occurred in many buckwheat growing areas in recent years (Huang et al., 2019). It not only can decrease the yield but also damage the quality. Growing resistance varieties is an eco-friendly, efficient, and sustainable approach against Cd stress. Understanding the Cd toxicity to plants was the first step to preventing and controlling Cd pollution. Xiqiao No. 1 used in this study is a widely cultivated variety in China, which has the advantage of early maturity and high yield. The Cd concentrations used in studying various species varied from 2 to 500 uM or from 3.3 to 100 mg/kg, the Cd concentration accumulated in roots ranged from 1.5 to 5000 mg/kg. Cd concentrations of roots obtained from most of the studies varied from 100 to 1000 mg/kg and only two of the species (Medicago sativa, and Viola) over 3000 mg/kg (Fan et al., 2021). Our study showed the roots of Tartary buckwheat contained a high concentration (2991.17 mg/kg) of Cd and that no chlorosis and necrosis showed in plants, indicating that this species has a high level of tolerance to Cd. It’s elite germplasm for further study of the Cd tolerance mechanism.
Phytoremediation is a way to use plants and associated soil microbes to reduce the concentrations and thus toxic effects of contaminants in the environment (Ali et al., 2013). This approach is environment-friendly, economically feasible, and highly efficient. Suitable plants used for phytoremediation should be characterized by a high accumulation of heavy metals and tolerance to them (Ali et al., 2013; Zhang et al., 2021a). In this study, high levels of Cd accumulation in roots and high tolerance to Cd may suggest the potential of Tartary buckwheat in the phytoremediation of Cd. Meanwhile, this species is a short-season crop with wide adaptability that can withstand cold and barren environments (Zhou et al., 2018). Tartary buckwheat, used as phytoremediation, can be planted in a wide range of environments and even grown twice a year in some warm (temperature above zero) places. Further, fertilizers and pesticides are usually not required for growing Tartary buckwheat. The comprehensive study of response to Cd stress in this study suggested Tartary buckwheat is a potential species in Cd phytoremediation.
This study comprehensively identified the responses to Cd stress in Tartary buckwheat for the first time. A high concentration of Cd accumulated in roots, but there was no chlorosis and necrosis in plants, indicating a high tolerance to Cd stress. Root diameter increased as a result of the increase of the cell layer number and the pericycle size under Cd stress. The antioxidant systems were triggered as well. Nine core genes took part in the defense activities like metal ion binding, Ca signal transduction, cell wall organization, plant-type secondary cell wall biogenesis, hydrogen peroxide catabolic process, antioxidant activities, carbohydrate metabolic process, DNA catabolic process, and plant senescence. It provided the references for a deep understanding of the responses to Cd toxicity and genetic improvement in Tartary buckwheat. These results also provide a critical reference for the functional characterization of genes for Cd tolerance.
The datasets presented in this study can be found in online repositories. The names of the repository/repositories and accession number(s) can be found below: https://www.ncbi.nlm.nih.gov/, PRJNA755504.
XY conceived and performed the experiments, analyzed the data, and wrote the manuscript. QL and CL analyzed the data. DX conceived the experiment. All the authors reviewed and edited the manuscript. All authors contributed to the article and approved the submitted version.
This work was supported by National Key Research and Development Program of China (2019YFD1001300,2019YFD1001302), Sichuan Science and Technology Program (2022NSFSC1725), and the earmarked found for China Agriculture Research System (CARS-07-B-1).
The authors declare that the research was conducted in the absence of any commercial or financial relationships that could be construed as a potential conflict of interest.
All claims expressed in this article are solely those of the authors and do not necessarily represent those of their affiliated organizations, or those of the publisher, the editors and the reviewers. Any product that may be evaluated in this article, or claim that may be made by its manufacturer, is not guaranteed or endorsed by the publisher.
The Supplementary Material for this article can be found online at: https://www.frontiersin.org/articles/10.3389/fpls.2022.1004802/full#supplementary-material
Supplementary Figure 1 | Gene ontology classification of differentially expressed genes. *, the higher percentage of genes.
Supplementary Figure 2 | Histogram of the number of transcription factors for differentially expressed genes.
Supplementary Figure 3 | Heatmap of the Module-Trait correlation. AvgDiam, Average diameter; CdRoot, CdStem, and CdLeaf indicate the Cd concentration in roots, stems, and leaves, respectively.
Abedi, T., Mojiri, A. (2020). Cadmium uptake by wheat (Triticum aestivum l.): An overview. Plants 9 (4), 500.
Ahmad, J., Ali, A. A., Baig, M. A., Iqbal, M., Haq, I., Qureshi, M. I. (2019). Role of phytochelatins in cadmium stress tolerance in plants. in cadmium toxicity and tolerance in plants (Cambridge, MA, USA: Academic Press), 185–212.
Ali, H., Khan, E., Sajad, M. A. (2013). Phytoremediation of heavy metals-concepts and applications. Chemosphere 91 (7), 869–881. doi: 10.1016/j.chemosphere.2013.01.075
Altschul, S. F., Madden, T. L., Schäffer, A. A., Zhang, J., Zhang, Z., Miller, W., et al. (1997). Gapped BLAST and PSI BLAST: A new generation of protein database search programs. Nucleic Acids Res. 25 (17), 3389–3402. doi: 10.1093/nar/25.17.3389
Andrews, S. (2016) FastQC: a quality control tool for high throughput sequence data. Available at: http://www.bioinformatics.babraham.ac.uk/projects/fastqc.
Angulo-Bejarano, P. I., Puente-Rivera, J., Cruz-Ortega, R. (2021). Metal and metalloid toxicity in plants: an overview on molecular aspects. Plants 10 (4), 635. doi: 10.3390/plants10040635
Apweiler, R., Bairoch, A., Wu, C. H., Barker, W. C., Boeckmann, B., Ferro, S., et al. (2004). UniProt: the universal protein knowledgebase. Nucleic Acids Res. 32, D115–D119. doi: 10.1093/nar/gkh131
Ashburner, M., Ball, C. A., Blake, J. A., Botstein, D., Butler, H., Cherry, J. M., et al. (2000). Gene ontology: tool for the unification of biology. Nat. Genet. 25 (1), 25–29. doi: 10.1038/75556
Bali, A. S., Sidhu, G. P., Kumar, V. (2020). Root exudates ameliorate cadmium tolerance in plants: a review. environ. Chem. Lett. 18 (4), 1243–1275. doi: 10.1007/s10311-020-01012-x
Bennett, T., van den Toorn, A., Sanchez-Perez, G. F., Campilho, A., Willemsen, V., Snel, B., et al. (2010). SOMBRERO, BEARSKIN1, and BEARSKIN2 regulate root cap maturation in Arabidopsis. Plant Cell 22 (3), 640–654. doi: 10.1105/tpc.109.072272
Bento, J. F., Mazzaro, I., de Almeida Silva, L. M., de Azevedo Moreira, R., Ferreira, M. L. C., Reicher, F., et al. (2013). Diverse patterns of cell wall mannan/galactomannan occurrence in seeds of the leguminosae. Carbohydr. Polym. 92 (1), 192–199. doi: 10.1016/j.carbpol.2012.08.113
Berni, R., Luyckx, M., Xu, X., Legay, S., Sergeant, K., Hausman, J. F., et al. (2019). Reactive oxygen species and heavy metal stress in plants: Impact on the cell wall and secondary metabolism. Environ. Exp. Bot. 161, 98–106. doi: 10.1016/j.envexpbot.2018.10.017
Bochicchio, R., Sofo, A., Terzano, R., Gattullo, C. E., Amato, M., Scopa, A. (2015). Root architecture and morphometric analysis of Arabidopsis thaliana grown in Cd/Cu/Zn-gradient agar dishes: A new screening technique for studying plant response to metals. Plant Physiol. Biochem. 91, 20–27. doi: 10.1016/j.plaphy.2015.03.010
Chen, P., Chen, T., Li, Z., Jia, R., Luo, D., Tang, M., et al. (2020). Transcriptome analysis revealed core genes and pathways related to cadmium-stress tolerance in kenaf (Hibiscus cannabinus l.). Ind. Crops Prod. 158, 112970. doi: 10.1016/j.indcrop.2020.112970
Cox, M. P., Peterson, D. A., Biggs, P. J. (2010). SolexaQA: At-a-glance quality assessment of illumina second-generation sequencing data. BMC Bioinform. 11 (1), 1–6. doi: 10.1186/1471-2105-11-485
D’Amelia, V., Aversano, R., Chiaiese, P., Carputo, D. (2018). The antioxidant properties of plant flavonoids: their exploitation by molecular plant breeding. Phytochem. Rev. 17 (3), 611–625. doi: 10.1007/s11101-018-9568-y
Eddy, S. R. (1998). Profile hidden Markov models. Bioinformatics 14 (9), 755–763. doi: 10.1093/bioinformatics/14.9.755
Edwards, M. E., Choo, T. S., Dickson, C. A., Scott, C., Gidley, M. J., Reid, J. G. (2004). The seeds of Lotus japonicus lines transformed with sense, antisense, and sense/antisense galactomannan galactosyltransferase constructs have structurally altered galactomannans in their endosperm cell walls. Plant Physiol. 134 (3), 1153–1162. doi: 10.1104/pp.103.029967
El Rasafi, T., Oukarroum, A., Haddioui, A., Song, H., Kwon, E. E., Bolan, N., et al. (2020). Cadmium stress in plants: A critical review of the effects, mechanisms, and tolerance strategies. Crit. Rev. Environ. Sci. Technol., 52 (5), 675–762.
Fan, W., Liu, C., Cao, B., Ma, S., Hu, J., Xiang, Z., et al. (2021). A meta-analysis of transcriptomic profiles reveals molecular pathways response to cadmium stress of gramineae. Ecotoxicol. Environ. Saf. 209, 111816. doi: 10.1016/j.ecoenv.2020.111816
Farage-Barhom, S., Burd, S., Sonego, L., Perl-Treves, R., Lers, A. (2008). Expression analysis of the BFN1 nuclease gene promoter during senescence, abscission, and programmed cell death-related processes. J. Exp. Bot. 59 (12), 3247–3258. doi: 10.1093/jxb/ern176
Finn, R. D., Bateman, A., Clements, J., Coggill, P., Eberhardt, R. Y., Eddy, S. R., et al. (2014). Pfam: the protein families database. Nucleic Acids Res. 42 (D1), D222–D230. doi: 10.1093/nar/gkt1223
Florea, L., Song, L., Salzberg, S. L. (2013). Thousands of exon skipping events differentiate among splicing patterns in sixteen human tissues. F1000Research 2, 188. doi: 10.12688/f1000research.2-188.v1
Hatlestad, G. J., Sunnadeniya, R. M., Akhavan, N. A., Gonzalez, A., Goldman, I. L., McGrath, J. M., et al. (2012). The beet r locus encodes a new cytochrome P450 required for red betalain production. Nat. Genet. 44 (7), 816–820. doi: 10.1038/ng.2297
He, S., Yang, X., He, Z., Baligar, V. C. (2017). Morphological and physiological responses of plants to cadmium toxicity: A review. Pedosphere 27 (3), 421–438. doi: 10.1016/S1002-0160(17)60339-4
Hoagland, D. R., Arnon, D. I. (1950). The water-culture method for growing plants without soil. Calif. Agric. Exp. Sta. Circ. 347, 32.
Huang, J., Chen, Q., Rong, Y., Tang, B., Zhu, L., Ren, R., et al. (2021). Transcriptome analysis revealed gene regulatory network involved in PEG-induced drought stress in tartary buckwheat (Fagopyrum tararicum). PeerJ 9, e11136. doi: 10.7717/peerj.11136
Huang, Y., Wang, L., Wang, W., Li, T., He, Z., Yang, X. (2019). Current status of agricultural soil pollution by heavy metals in China: A meta-analysis. Sci. Total Environ. 651, 3034–3042. doi: 10.1016/j.scitotenv.2018.10.185
Hussain, A., Ali, S., Rizwan, M., Zia-ur-Rehman, M., Yasmeen, T., Hayat, M. T., et al. (2019). “Morphological and physiological responses of plants to cadmium toxicity,” in Cadmium toxicity and tolerance in plants (Cambridge, Academic Press: Elsevier), 47–72.
Jeon, J., Kim, J. K., Wu, Q., Park, S. U. (2018). Effects of cold stress on transcripts and metabolites in tartary buckwheat (Fagopyrum tataricum). Environ. Exp. Bot. 155, 488–496. doi: 10.1016/j.envexpbot.2018.07.027
Kanehisa, M., Goto, S., Kawashima, S., Okuno, Y., Hattori, M. (2004). The KEGG resource for deciphering the genome. Nucleic Acids Res. 32, D277–D280. doi: 10.1093/nar/gkh063
Kim, D., Langmead, B., Salzberg, S. L. (2015). HISAT: a fast spliced aligner with low memory requirements. Nat. Methods 12 (4), 2015 357–360. doi: 10.1038/nmeth.3317
Koonin, E. V., Fedorova, N. D., Jackson, J. D., Jacobs, A. R., Krylov, D. M., Makarova, K. S., et al. (2004). A comprehensive evolutionary classification of proteins encoded in complete eukaryotic genomes. Genome Biol. 5 (2), R7. doi: 10.1186/gb-2004-5-2-r7
Kubier, A., Wilkin, R. T., Pichler, T. (2019). Cadmium in soils and groundwater: A review. Appl. Geochem. 108, 104388. doi: 10.1016/j.apgeochem.2019.104388
Langfelder, P., Horvath, S. (2008). WGCNA: an r package for weighted correlation network analysis. BMC Bioinform. 9 (1), 1–3. doi: 10.1186/1471-2105-9-559
Liu, Q., Zhang, Y., Wang, Y., Wang, W., Gu, C., Huang, S., et al. (2020). Quantitative proteomic analysis reveals complex regulatory and metabolic response of Iris lactea pall. var. chinensis to cadmium toxicity. J. Hazard. Mater. 400, 123165.
Livak, K. J., Schmittgen, T. D. (2001). Analysis of relative gene expression data using real-time quantitative PCR and the 2–ΔΔCT method. Methods 25 (4), 402–408.
Li, C., Zhao, H., Li, M., Yao, P., Li, Q., Zhao, X., et al. (2019). Validation of reference genes for gene expression studies in tartary buckwheat (Fagopyrum tataricum gaertn.) using quantitative real-time PCR. PeerJ 7, e6522.
Love, M. I., Huber, W., Anders, S. (2014). Moderated estimation of fold change and dispersion for RNA-seq data with DESeq2. Genome Biol. 15 (12), 1–21. doi: 10.1186/s13059-014-0550-8
Lu, Y., Wang, Q. F., Li, J., Xiong, J., Zhou, L. N., He, S. L., et al. (2019). Effects of exogenous sulfur on alleviating cadmium stress in tartary buckwheat. Sci. Rep. 9 (1), 1–2. doi: 10.1038/s41598-019-43901-4
Lux, A., Martinka, M., Vaculík, M. (2011). White PJ. root responses to cadmium in the rhizosphere: a review. J. Exp. Bot. 62 (1), 21–37.
Maksimović, I., Kastori, R., Krstić, L., Luković, J. (2007). Steady presence of cadmium and nickel affects root anatomy, accumulation and distribution of essential ions in maize seedlings. Biol. Plant 51 (3), 589–592. doi: 10.1007/s10535-007-0129-2
Mao, X., Cai, T., Olyarchuk, J. G., Wei, L. (2005). Automated genome annotation and pathway identification using the KEGG orthology (KO) as a controlled vocabulary. Bioinformatics 21 (19), 3787–3793. doi: 10.1093/bioinformatics/bti430
MEE (2020) Ministry of ecology and environment of P.R. china. bulletin of china’s ecological environment, (2020). Available at: http://www.mee.gov.cn/hjzl/hjzlqt/trhj/202105/P020210526578269763105.pdf.
Pál, M., Horváth, E., Janda, T., Páldi, E., Szalai, G. (2006). Physiological changes and defense mechanisms induced by cadmium stress in maize. J. Plant Nutr. Soil Sci. 169 (2), 239–246. doi: 10.1002/jpln.200520573
Pérez-Amador, M. A., Abler, M. L., De Rocher, E. J., Thompson, D. M., van Hoof, A., LeBrasseur, N. D., et al. (2000). Identification of BFN1, a bifunctional nuclease induced during leaf and stem senescence in Arabidopsis. Plant Physiol. 122 (1), 169–180. doi: 10.1104/pp.122.1.169
Perfus-Barbeoch, L., Leonhardt, N., Vavasseur, A., Forestier, C. (2002). Heavy metal toxicity: cadmium permeates through calcium channels and disturbs the plant water status. Plant J. 32 (4), 539–548. doi: 10.1046/j.1365-313X.2002.01442.x
Pertea, M., Pertea, G. M., Antonescu, C. M., Chang, T. C., Mendell, J. T., Salzberg, S. L. (2015). StringTie enables improved reconstruction of a transcriptome from RNA-seq reads. Nat. Biotechnol. 33 (3), 290–295. doi: 10.1038/nbt.3122
Potocka, I., Szymanowska-Pułka, J. (2018). Morphological responses of plant roots to mechanical stress. Ann. Bot. 122 (5), 711–723. doi: 10.1093/aob/mcy010
Qin, S. Y., Li, H. G., Ni, Z. J., Rengel, Z., Wei, G. A., Li, C., et al. (2020). Toxicity of cadmium and its competition with mineral nutrients for uptake by plants: A review. Pedosphere 30 (2), 168–180. doi: 10.1016/S1002-0160(20)60002-9
Qin, X., Nie, Z., Liu, H., Zhao, P., Qin, S., Shi, Z. (2018). Influence of selenium on root morphology and photosynthetic characteristics of winter wheat under cadmium stress. Environ. Exp. Bot. 150, 232–239. doi: 10.1016/j.envexpbot.2018.03.024
Rivetta, A., Negrini, N., Cocucci, M. (1997). Involvement of Ca2+-calmodulin in Cd2+ toxicity during the early phases of radish (Raphanus sativus l.) seed germination. Plant Cell Environ. 20, 600–608. doi: 10.1111/j.1365-3040.1997.00072.x
Rizwan, M., Ali, S., Adrees, M., Ibrahim, M., Tsang, D. C., Zia-ur-Rehman, M., et al. (2017). A critical review on effects, tolerance mechanisms and management of cadmium in vegetables. Chemosphere 182, 90–105. doi: 10.1016/j.chemosphere.2017.05.013
Rizwan, M., Ali, S., Adrees, M., Rizvi, H., Zia-ur-Rehman, M., Hannan, F., et al. (2016). Cadmium stress in rice: Toxic effects, tolerance mechanisms, and management: a critical review. Environ. Sci. Pollut. Res. Int. 23 (18), 17859–17879. doi: 10.1007/s11356-016-6436-4
Santoro, D. F., Sicilia, A., Testa, G., Cosentino, S. L., Lo Piero, A. R. (2022). Global leaf and root transcriptome in response to cadmium reveals tolerance mechanisms in Arundo donax l. BMC Genom. 23 (1), 1–18. doi: 10.1186/s12864-022-08605-6
Scebba, F., Arduini, I., Ercoli, L., Sebastiani, L. (2006). Cadmium effects on growth and antioxidant enzymes activities in Miscanthus sinensis. Biol. Plant 50 (4), 688–692. doi: 10.1007/s10535-006-0107-0
Shah, K., Kumar, R. G., Verma, S., Dubey, R. S. (2001). Effect of cadmium on lipid peroxidation, superoxide anion generation and activities of antioxidant enzymes in growing rice seedlings. Plant Sci. 161 (6), 1135–1144. doi: 10.1016/S0168-9452(01)00517-9
Shanmugaraj, B. M., Malla, A., Ramalingam, S. (2019). “Cadmium stress and toxicity in plants: an overview,” in Cadmium toxicity and tolerance in plants: From physiology to remediation (Cambridge, MA, USA: Academic Press), 1–17.
Shannon, P., Markiel, A., Ozier, O., Baliga, N. S., Wang, J. T., Ramage, D., et al. (2003). Cytoscape: a software environment for integrated models of biomolecular interaction networks. Genome Res. 13 (11), 2498–2504. doi: 10.1101/gr.1239303
Shi, X. D., Sun, M. H., Zhao, G. (2019). The effects of cd stress on the seed germination and seedling growth in tartary buckwheat cultivar miqiao. J. Chengdu Univ. 38 (3), 260–262.
Shukla, D., Huda, K. M. K., Banu, M. S. A., Gill, S. S., Tuteja, R., Tuteja, N. (2014). OsACA6, a p-type 2B Ca 2+ ATPase functions in cadmium stress tolerance in tobacco by reducing the oxidative stress load. Planta 240 (4), 809–824.
Song, Y., Feng, J., Liu, D., Long, C. (2022). Different phenylalanine pathway responses to cold stress based on metabolomics and transcriptomics in tartary buckwheat landraces. J. Agric. Food Chem. 70 (2), 687–698. doi: 10.1021/acs.jafc.1c06915
Song, J. N., Liu, X. H., Wang, Y. Q., Yang, H. B. (2021). Transcriptome analysis reveals salinity responses in four tartary buckwheat cultivars. J. Plant Biochem. Biotechnol. 30 (3), 564–578. doi: 10.1007/s13562-021-00648-2
Song, X., Yue, X., Chen, W., Jiang, H., Han, Y., Li, X. (2019). Detection of cadmium risk to the photosynthetic performance of Hybrid pennisetum. Front. Plant Sci. 10, 798. doi: 10.3389/fpls.2019.00798
Wang, H., Chen, R. F., Iwashita, T., Shen, R. F., Ma, J. F. (2015). Physiological characterization of aluminum tolerance and accumulation in tartary and wild buckwheat. New Phytol. 205 (1), 273–279. doi: 10.1111/nph.13011
Wang, Y., Dai, X., Xu, G., Dai, Z., Chen, P., Zhang, T., et al. (2021). The Ca2+-CaM signaling pathway mediates potassium uptake by regulating reactive oxygen species homeostasis in tobacco toots under low-k+ stress. Front. Plant Sci. 12.
Wang, P., Deng, X., Huang, Y., Fang, X., Zhang, J., Wan, H., et al. (2016). Root morphological responses of five soybean [Glycine max (L.) merr] cultivars to cadmium stress at young seedlings. Environ. Sci. Pollut. Res. 23 (2), 1860–1872.
Wang, L., Zheng, B., Yuan, Y., Xu, Q., Chen, P. (2020). Transcriptome profiling of Fagopyrum tataricum leaves in response to lead stress. BMC Plant Biol. 20 (1), 1–14. doi: 10.1186/s12870-020-2265-1
White, P. J., Broadley, M. R. (2003). Calcium in plants. Ann. Bot. 92 (4), 487–511. doi: 10.1093/aob/mcg164
Willemsen, V., Bauch, M., Bennett, T., Campilho, A., Wolkenfelt, H., Xu, J., et al. (2008). The NAC domain transcription factors FEZ and SOMBRERO control the orientation of cell division plane in Arabidopsis root stem cells. Dev. Cell 15 (6), 913–922. doi: 10.1016/j.devcel.2008.09.019
Xian, J., Wang, Y., Niu, K., Ma, H., Ma, X. (2020). Transcriptional regulation and expression network responding to cadmium stress in a cd-tolerant perennial grass Poa pratensis. Chemosphere 250, 126158. doi: 10.1016/j.chemosphere.2020.126158
Xie, C., Mao, X., Huang, J., Ding, Y., Wu, J., Dong, S., et al. (2011). KOBAS 2.0: a web server for annotation and identification of enriched pathways and diseases. Nucleic Acids Res. 39 (suppl 2), W316–W322.
Yang, Z., Nie, G., Feng, G., Han, J., Huang, L., Zhang, X. (2021). Genome-wide identification, characterization, and expression analysis of the NAC transcription factor family in orchardgrass (Dactylis glomerata l.). BMC Genom. 22 (1), 1–15. doi: 10.1186/s12864-021-07485-6
Yang, L. Q., Wang, Y. F., Xiao, H., Li, J. Q., Ma, Y. B., Bao, W. G., et al. (2015). Effects of cadmium on seed germination in buckwheat. j. inner Mongolia univ. Nationalities 30 (4), 314–316.
Zeng, H., Xu, L., Singh, A., Wang, H., Du, L., Poovaiah, B. W. (2015). Involvement of calmodulin and calmodulin-like proteins in plant responses to abiotic stresses. Front. Plant Sci. 6, 600. doi: 10.3389/fpls.2015.00600
Zhang, J., Cao, X., Yao, Z., Lin, Q., Yan, B., Cui, X., et al. (2021a). Phytoremediation of cd-contaminated farmland soil via various Sedum alfredii-oilseed rape cropping systems: Efficiency comparison and cost-benefit analysis. J. Hazard. Mater. 419, 126489. doi: 10.1016/j.jhazmat.2021.126489
Zhang, L., Chen, C., Xie, F., Hua, Q., Zhang, Z., Zhang, R., et al. (2021b). A novel WRKY transcription factor HmoWRKY40 associated with betalain biosynthesis in pitaya (Hylocereus monacanthus) through regulating HmoCYP76AD1. Int. J. Mol. Sci. 22 (4) 2171, 1–14. doi: 10.3390/ijms22042171
Zhao, F. J., Ma, Y., Zhu, Y. G., Tang, Z., McGrath, S. P. (2015). Soil contamination in China: Current status and mitigation strategies. Environ. Sci. Technol. 49 (2), 750–759. doi: 10.1021/es5047099
Zhou, M., Tang, Y. U., Deng, X., Ruan, C., Kreft, I., Tang, Y., et al. (2018). “Overview of buckwheat resources in the world,” in Buckwheat germplasm in the world (Cambridge, MA, USA: Academic Press), 1–7.
Zhou, Z., Zhao, Y., Bi, G., Liang, X., Zhou, J. M. (2019). Early signalling mechanisms underlying receptor kinase-mediated immunity in plants. Philos. Trans. R. Soc B 374 (1767), 20180310. doi: 10.1098/rstb.2018.0310
Zhu, J. K. (2016). Abiotic stress signaling and responses in plants. Cell 167 (2), 313–324. doi: 10.1016/j.cell.2016.08.029
Keywords: Tartary buckwheat, Cd stress, regulatory pathway, RNA-Seq, root transcriptome
Citation: Ye X, Li Q, Liu C, Wu Q, Wan Y, Wu X, Zhao G, Zou L and Xiang D (2022) Transcriptomic, cytological, and physiological analyses reveal the potential regulatory mechanism in Tartary buckwheat under cadmium stress. Front. Plant Sci. 13:1004802. doi: 10.3389/fpls.2022.1004802
Received: 27 July 2022; Accepted: 05 September 2022;
Published: 12 October 2022.
Edited by:
Yongfeng Guo, Tobacco Research Institute (CAAS), ChinaReviewed by:
Angela Roberta Lo Piero, University of Catania, ItalyCopyright © 2022 Ye, Li, Liu, Wu, Wan, Wu, Zhao, Zou and Xiang. This is an open-access article distributed under the terms of the Creative Commons Attribution License (CC BY). The use, distribution or reproduction in other forums is permitted, provided the original author(s) and the copyright owner(s) are credited and that the original publication in this journal is cited, in accordance with accepted academic practice. No use, distribution or reproduction is permitted which does not comply with these terms.
*Correspondence: Dabing Xiang, eGlhbmdkYWJpbmdAY2R1LmVkdS5jbg==
Disclaimer: All claims expressed in this article are solely those of the authors and do not necessarily represent those of their affiliated organizations, or those of the publisher, the editors and the reviewers. Any product that may be evaluated in this article or claim that may be made by its manufacturer is not guaranteed or endorsed by the publisher.
Research integrity at Frontiers

Learn more about the work of our research integrity team to safeguard the quality of each article we publish.