 Fenfen Yan1,2†
 Yujia Luo
 Jiurui Wang
 Mengjun Liu
- 1College of Horticulture and Forestry, Tarim University/The National and Local Joint Engineering Laboratory of High Efficiency and Superior-Quality Cultivation and Fruit Deep Processing Technology of Characteristic Fruit Trees in Southern Xinjiang, Alar, China
- 2Xinjiang Production and Construction Crops Key Laboratory of Protection and Utilization of Biological Resources in Tarim Basin, Tarim University, Alar, China
- 3College of Forestry, Hebei Agricultural University, Baoding, China
- 4College of Horticulture, Hebei Agricultural University, Baoding, China
Chinese jujube (Ziziphus jujuba Mill.), a member of the genus Ziziphus, which comes under the family Rhamnaceae, is the most important species in terms of its economic, ecological, and social benefits. To dissect the loci associated with important phenotypical traits and analyze their genetic and genomic information in jujube, a whole-genome resequencing (WGR) based highly saturated genetic map was constructed using an F1 hybrid population of 140 progeny individuals derived from the cross of ‘JMS2’ × ‘Jiaocheng 5’. The average sequencing depth of the parents was 14.09× and that of the progeny was 2.62×, and the average comparison efficiency between the sample and the reference genome was 97.09%. Three sets of genetic maps were constructed for a female parent, a male parent, and integrated. A total of 8,684 markers, including 8,158 SNP and 526 InDel markers, were evenly distributed across all 12 linkage groups (LGs) in the integrated map, spanning 1,713.22 cM with an average marker interval of 0.2 cM. In terms of marker number and density, this is the most saturated genetic map of jujube to date, nearly doubling that of the best ones previously reported. Based on this genetic map and phenotype data from 2019 to 2021, 31 leaf trait QTLs were identified in the linkage groups (LG1, 15; LG3, 1; LG5, 8; LG7, 4; LG8, 1, and LG11, 2), including 17 major QTLs. There were 4, 8, 14, and 5 QTLs that contributed to leaf length, leaf width, leaf shape index, and leaf area, respectively. Six QTLs clusters were detected on LG1 (8.05 cM–9.52 cM; 13.12 cM–13.99 cM; 123.84 cM–126.09 cM), LG5 (50.58 cM–50.86 cM; 80.10 cM–81.76 cM) and LG11 (35.98 cM–48.62 cM). Eight candidate genes were identified within the QTLs cluster regions. Annotation information showed that 4 genes (LOC107418196, LOC107418241, LOC107417968, and LOC112492570) in these QTLs are related to cell division and cell wall integrity. This research will provide a valuable tool for further QTL analysis, candidate gene identification, map-based gene cloning, comparative mapping, and marker-assisted selection (MAS) in jujube.
Introduction
Jujube (Ziziphus jujuba Mill.) is the most important species of the family Rhamnaceae and an increasingly popular fruit tree crop in the world in terms of its economic, ecological, and social benefits (Liu et al., 2020). Jujube is drought and salinity tolerant, making it suitable for cultivation in arid and semi-arid marginal regions of the world. Its fruit is a well-known nourishing fruit and traditional herbal medicine, as well as an excellent source of vitamin C and sugar (Liu and Wang, 2019). It is currently one of the most important cultivated fruit species, with a growing area of 2 million hectares, producing about 8 million tons annually, and is also the primary source of income for 20 million farmers in China (Huang et al., 2016; Liu et al., 2020).
Marker-assisted selection (MAS) has been proven to be an efficient approach for quickening the breeding of fruit trees. Furthermore, MAS is generally based on high-density genetic linkage maps to develop molecular markers for high-throughput selection of superior traits (Zhu et al., 2018; Gao et al., 2020). The most important agronomic traits of fruit trees are quantitative traits, such as organ size, yield, fruit quality, stress resistance, and so on, and their phenotypic traits have a continuous normal distribution in offspring (Liu et al., 2016; Wang et al., 2019). Quantitative trait loci (QTL) analysis based on a genetic linkage map is an important method in studying molecular assisted breeding and functional genomics (Wu et al., 2014; Xu et al., 2015; Ma et al., 2020). Consequently, a high-density genetic map is needed to facilitate various genetic studies and meet the increasing demand for cultivar improvement of jujube.
Some progress has been made in the development of molecular markers and the construction of molecular linkage maps in jujube. Before the jujube genome was sequenced in 2014, a few genetic maps were constructed in jujube by using different types of markers, such as amplified fragment length polymorphisms (AFLPs), random amplified polymorphic DNAs (RAPDs), and simple sequence repeats (SSRs). These maps were limited by low marker density and had some inconsistencies in LG number, which has prevented the fine mapping of target traits (Lu, 2003; Shen, 2005; Qi, 2006; Xu, 2012). Since the jujube genome sequence was released (Liu et al., 2014; Huang et al., 2016), the development of massive SNP markers and the construction of a high-density genetic map in jujube became possible. Until now, four saturated reference maps using a simplified genome sequencing technique have been published for jujube derived from different F1 progeny from 2014 to 2019 (Zhao et al., 2014; Zhang, 2016; Zhang et al., 2016; Wang et al., 2019). The above-mentioned simplified genome sequencing technologies such as GBS and RAD-seq are relatively inexpensive, but parts of incomplete data might be produced (Sun et al., 2015; Zhu et al., 2018). However, it is still far behind many other fruits in the genetic map density, the functional genetic mapping and marker-assisted selection in jujube. Whole genome resequencing (WGS) is a technique for developing molecular markers based on reference genome information that has higher efficiency and accuracy compared to other methods (Li et al., 2018). In addition to a large number of SNPs, a large number of InDel information can also be generated by WGS, which is present in co-dominance and widely distributed in the genome. QTL analysis mostly relies on polymorphisms between the parents of mapping populations and different hybrid progeny, which show different marker genotypes or linkage relationships. Thus, there is an urgent need to develop a highly saturated genetic linkage map in jujube for marker-assisted breeding and genome investigations.
The leaf is an important organ that undergoes photosynthesis in the plant and serves as the foundation for a high and stable yield. The size and shape of the leaves can directly affect the plant productivity and reflect the characteristics of the cultivars (Wang et al., 2019a). The inheritance of leaf size traits has been proven to be quantitative, and 27 QTLs for leaf traits were detected based on the genetic map (Wang et al., 2019). Among them, QTLs linked to leaf length were found on LG1 and LG11 based on two maps (Shen, 2005; Wang et al., 2019), but most QTLs linked to leaf traits always have low rates for the explanation of variance. Thus, mapping of genes controlling leaf traits and the development of applicable markers will be of great significance for molecular-assisted breeding in jujube.
In this study, we constructed a highly saturated genetic linkage map of jujube by using WGS technology with a F1 population of 140 progeny individuals derived from a cross between ‘JMS2’ (a male sterile cultivar) and ‘Jiaocheng 5’ (a cultivar with high resistance to phytoplasma disease and big fruit). Then, QTL analysis was performed to identify the genomic regions associated with leaf traits. These results could provide useful information for marker-assisted breeding and increase understanding of the genetic control of leaf traits in jujube.
Materials and methods
Plant material and DNA extraction
The F1 jujube hybrids of 140 progeny individuals derived from a cross between ‘JMS2’ and ‘Jiaocheng 5’ were generated in 2016. The female parent is a male sterile table cultivar, with a medium-sized oval fruit shape, excellent quality, high yield, and good adaptability. The male parent is an elite strain of ‘Junzao’ with extremely high resistance to phytoplasma disease and a long cylinder shape with big-size fruit. Hybrid seeds were sown in a greenhouse in 2016. A total of 178 hybrids were randomly harvested, of which 140 of them and two parents were used as the mapping population. All plant materials were grafted on the rootstock of 7-year-old ‘Junzao jujube’ in Aral, Xinjiang, China (40°59’N, 81°28’E) in April 2018. Each hybrid seedling was grafted with three main branches as three biological replicates. It grew in soil sand and a desert climate in the orchard. Common ways of orchard management were applied.
Investigations of the progeny of individuals were performed from 2019 to 2021. Healthy young leaves (second or third leaf from the apex of the bearing shoot, less than 1 cm2) were harvested from both parents and each individual progeny plant (F1 generation). The samples were stored in an −80°C refrigerator. Genomic DNA was extracted using the improved CTAB method (Xin and Chen, 2012). DNA concentration and quality were evaluated using the NanoDrop 2000 spectrophotometer (Thermo Fisher Scientific, Waltham, MA, USA). Finally, the concentration and volume of each DNA sample were 500 ng·μl−1 and 50 μl, respectively. The quality of DNA was electrophoresed on a 1% agarose gel. The DNA was diluted to a final concentration of 2.5 ng·μl−1 for the next steps.
Sequencing library construction
After checking the quality of DNA, the DNA sequence was segmented into random 200–500 bp fragments by ultrasonic. The sequencing libraries were constructed using terminal repair, followed by the addition of a 3’ end with A and a sequencing linker. The samples were then purified and amplified by PCR. After quality inspection, the qualified libraries were sequenced using the Illumina HiSeqTM platform using the Illumina PE150-sequencing strategy, and the total sequencing read length was 300 bp. The sequencing library construction was completed by the Shanghai Magi company.
SNP and InDel identification and genotyping
Raw reads from the Illumina HiseqTM were filtered to obtain high-quality reads (clean reads), then the clean reads were re-mapped to the reference genome: the ‘Dongzao’ genome (https://www.ncbi.nlm.nih.gov/genome/?term=Ziziphus+jujuba) was used as the reference genome to get the sequence position (BWA files) by BWA software (Li and Richard, 2009). The best practice process of GATK (McKenna et al., 2010) was used for base recalibration, variant calling, and strictly filtering the SNPs and Small InDel to correct the BAM files. To guarantee the quality of the genetic map, SNPs and Small InDel were filtered: (1) The depth of markers from the parental line was more than 10×, and the progeny depth was more than 2×. (2) The marker confirms the characteristics of the F1 population, at least one parent was selected as heterozygous typing. (3) The progeny separation ratio confirms to the Mendelian separation ratio (p >0.05). (4) The absence rate of progeny typing was less than 23%.
Gene genotyping of the progenies was based on the parental genotype. The parental line with high sequencing depth could guarantee that the genotyping of the progenies is right. The average sequencing depth was 13-fold in the parents and 3.32-fold in the progenies. Variants filtered by quality as described above were genotyped in accordance with their heterozygous parents into eight segregation types. After filtering those with no polymorphisms between parents or partial separation based on a P-value <0.01, markers with homozygous parents were used to construct a genetic linkage map for the F1 generation.
Genetic map construction and evaluation
Genetic marker data were scored in accordance with the criteria of JoinMap v.5.0. A logarithm of the odds (LOD) score of 4–20 was set to distinguish linkage groups (Danny et al., 2010). Regression mapping was used as the mapping algorithm, and the genetic distances were calculated on the basis of Kosambi’s mapping function (Kosambi, 2011).
Based on the basic principle of the genetic map, the genetic map was constructed by a pseudo-test cross in a linkage group. Due to the F1 integrating the restructuring events of the female parent and male parent, respectively, in meiosis, both the female genetic map and the male genetic map were constructed separately, then the integrated maps were constructed by integrating all recombination events of common molecular markers between the female and male maps. The whole analysis process was completed by Crosslink analysis. All of the sequences of the bin markers that were used to construct the linkage map were aligned to the physical sequences of the reference genome. Collinearity between genetic and physical positions was determined by plotting genetic marker positions against their physical positions, and the BLAST program was used to confirm their physical positions in the genome (Li et al., 2018). The Spearman correlation coefficients were calculated to assess the collinearity between the genetic and physical maps.
Evaluation of phenotypes
The leaf traits of 140 hybrids and their parents were investigated from September 2019 to September 2021. Thirty leaves were picked from the middle of the bearing shoots on each tree, which were potted in an ice box to maintain freshness. Four major leaf traits, including leaf length, leaf width, leaf area, and leaf shape index, were scanned and analyzed by the LA-S plant image analyzer system. All data were analyzed using SPSS 26.0 to calculate the mean, standard deviation, kurtosis, and skewness.
QTL analysis tables
QTL locations were conducted with Internal Mapping and R/QTL software (Broman et al., 2003) was used for QTL analysis. The permutation test was used to determine the limit of detection (LOD). The threshold of the LOD score for significance (p = 0.05) was determined using 1,000 permutations. The calculation of the percentage of phenotypic variance explained by each QTL was based on the population variance found within the segregation population. A LOD threshold of 3.0 was set to identify leaf QTLs at the 95% confidence level, except a LOD threshold of 2.7 was set to identify QTLs of leaf width in 2019. Ranges above the LOD threshold of 3.0 were identified as QTL intervals, and those higher than 3.5 were considered major loci.
Based on the positions of the flanking markers, all of the genes within the confidence interval were identified as candidates. The candidate genes in the target locus region were annotated from the Jujube reference genome. Annotations from the GO and KEGG databases were used to categorize the candidate genes. Candidate regions were named according to the naming system rules (Mccouch, et al. 1997) as follows: q + trait abbreviation + year abbreviation + locus number. The loci for the same trait across different generations and environments were considered common loci when their confidence intervals overlapped.
Results
Quality evaluation of sequencing data
The sequencing library with an insert fragment size of about 400 bp was constructed by the Illumina Novaseq 6000 database building sequencing platform. After filtering low-quality bases, a total of 203.02-G clean reads were obtained for 142 sample individuals, with an average of 1.43-G clean data for each sample. The Q30 ratio of both parents was 93.48%, and that of F1 progeny ranged from 90.26% to 93.56%, with an average of 92.03%, indicating the high quality of sequencing data (Table 1). The GC content of the parents was 35%, while that of the hybrid population ranged from 33.96% to 36.48%, with an average of 34.84%.
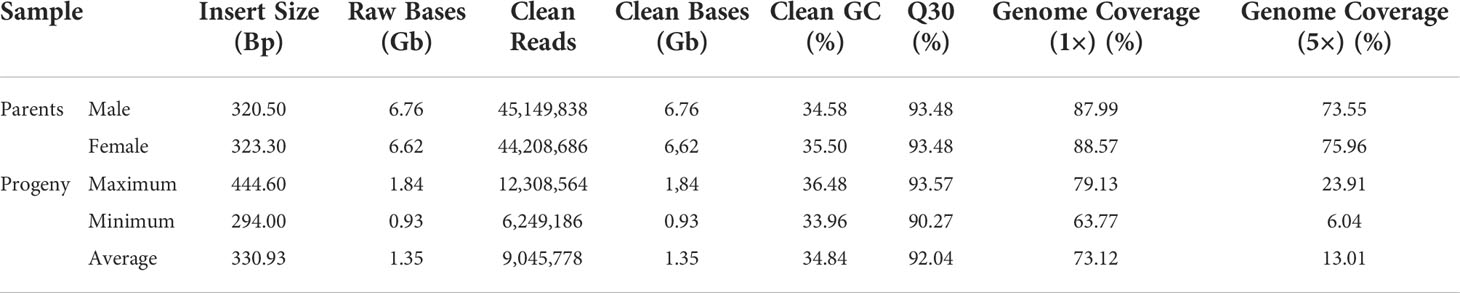
Table 1 Quality evaluation of sequencing data in 140 hybrid progeny and their parent.
Clean reads were compared to the published reference jujube genome sequences (Liu et al., 2014) using BWA software. The mapping ratios of the two parents, ‘JMS2’ and ‘Jiaocheng 5,’ were 96.98% and 97.17%, respectively, and the average comparison efficiency between the sample and the reference genome was 97.09%. The average sequencing depth of the parents and progeny was 14.09×, and that of the progeny was 2.62×, respectively. The average genome coverage (1×) was 73.33% (at least one base coverage).
SNP and InDel discovery and genotyping
The SNP and InDel markers were detected by GATK. A total of 4,588,795 SNPs and 1,078,886 InDel markers were obtained. Then, these markers were filtered, and screened by the screening criteria. At least 14,167 markers were obtained conforming to the construction of the genetic map, which could be divided into eight segregation patterns as follows: aa×bb, ab×cc, ab×cd, cc×ab, ef×eg, hk×hk, lm×ll, and nn×np (Table 2). Since this study was conducted in the F1 population, segregation patterns except aa× bb type were selected as effective markers for population composition. At last, the effective markers that could be used for genetic map construction accounted for 89.48%.
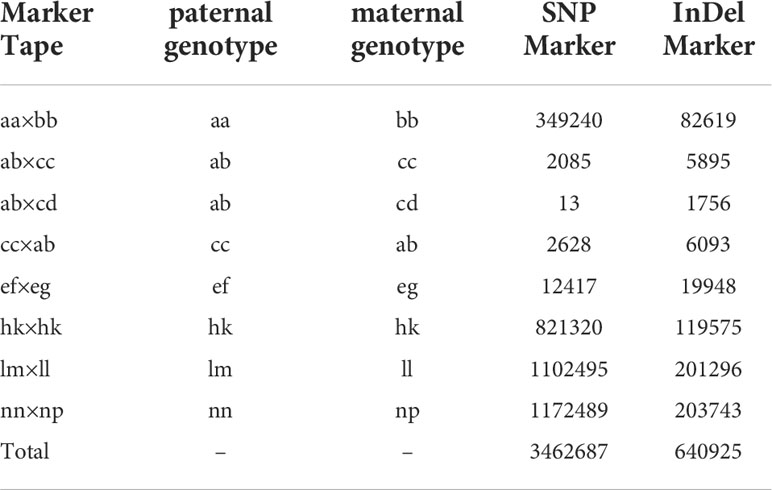
Table 2 Genotyping and number of markers.
Genetic linkage map construction
Linkage clustering was carried out according to the LOD value between genomic information and markers, and an LOD value between 4 and 20 was selected in this clustering scheme. Meanwhile, the number of linkage groups (LG) was kept consistent with the number of jujube chromosomes (12). Finally, the above 14,167 markers were divided into 12 linkage groups after correcting and filtering, and a total of 8,684 markers were found in the linkage groups (Table 3). Both SNP and InDel markers were distributed on all 12 chromosomes. Among them, the LG5 contained 1,792 markers (1,684 SNP and 108 InDel), which has the largest number of markers. LG2 and LG1 were not far behind, containing 1,135 and 1,019 markers, respectively, while LG12 had the fewest markers (233).
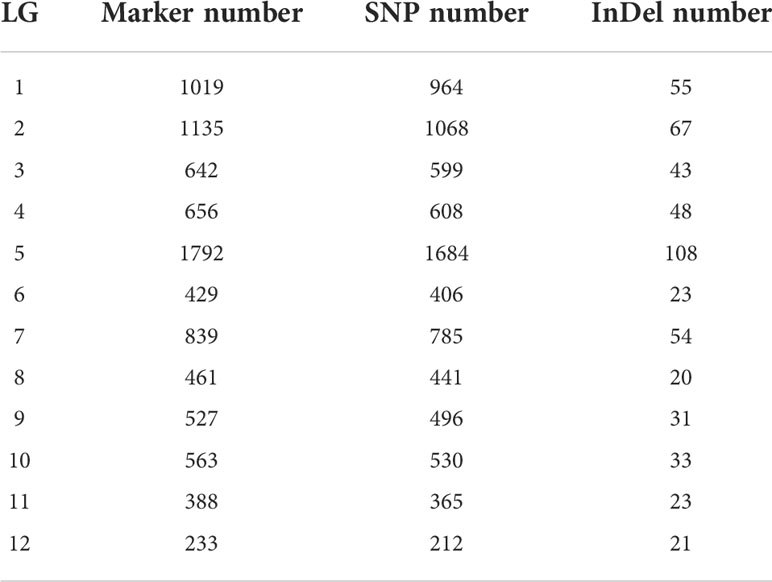
Table 3 Distribution of markers of integrated map in 12 linkage groups.
Based on the basic principle of genetic mapping, the genetic map was constructed by pseudo-testcross for the F1 group. Due to the F1 group integrating experienced the recombination event of female parent and male parent at the time of the separation, the construction of the F1 population map should build maternal and paternal separate genetic map firstly, then all the recombination events should be integrated using common molecular markers between the female and male maps, and the integrated map was obtained by cross-link analysis. Finally, three sets of maps were obtained, including female, male, and integrated. The specific statistical results are also shown in Table 3.
The female map contained 5,097 markers with a total length of 1,842.47 cM and the average distance between markers was about 0.36 cM (Table 4). Among the 12 LGs, LG5 contained the most markers (1,163) with a genetic distance of 160.78 cM and an average marker interval of 0.14 cM, whereas LG12 contained the fewest (123) markers, spanning 169.82 cM, with an average marker interval of 1.39 cM. The largest gap was detected on LG2 with a distance of 42.46 cM, and the smallest gap was detected on LG4 with a distance of 6.31 cM. The distance between adjacent markers was more than 5 cM (‘Gap >5 cM’), which ranged from 2 (LG3, LG4, LG5, and LG10) to 8 (LG11).
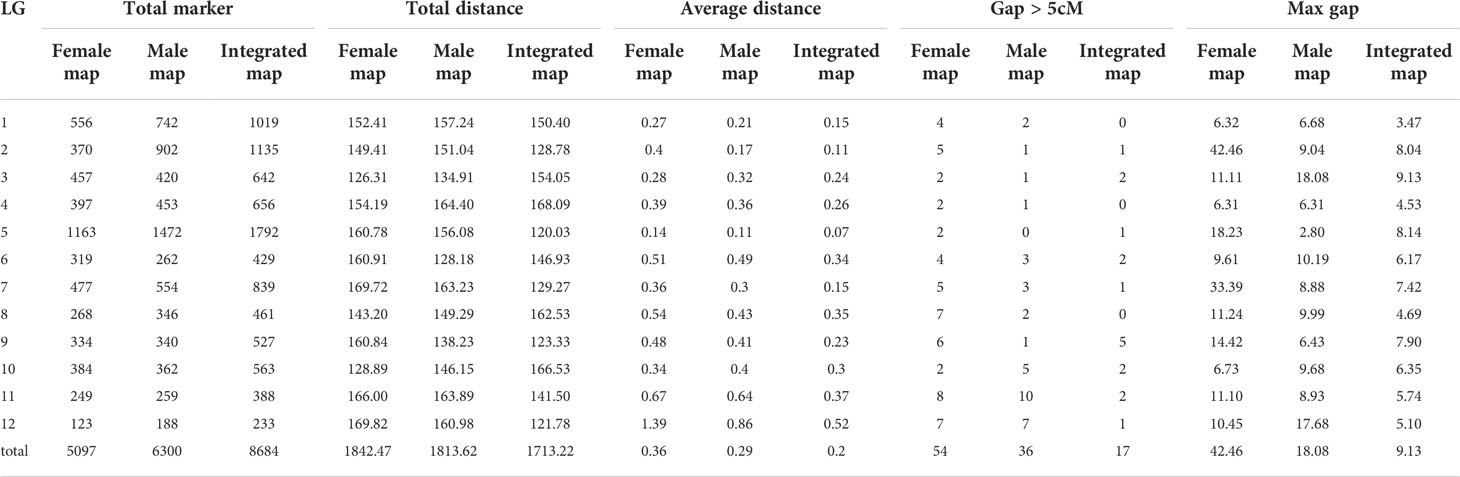
Table 4 Basic characteristics of Jujube linkage groups bout Female map,Male map and Integrated map.
The map of the male parent contained 6,300 markers spanning 1,813.62 cM with an average distance of about 0.29 cM between markers (Table 4). LG5 (1,472) and LG12 (188) contained the most and the least markers, with the shortest (0.11 cM) and the longest (0.86 cM) being the average distance between markers, respectively. The length of each LG ranged from 128.18 cM for LG6 to 164.40 cM for LG4. The largest gap (18.08 cM) was detected on LG3 and the smallest gap (2.80 cM) was detected on LG5. There were 36 ‘Gap > 5 cM’ detected in this map, including most of 10 on LG11 and at least 0 on LG5.
The integrated map contained a set of 8,684 markers spanning 1,713.22 cM, with an average inter-marker distance of 0.2 cM (Table 4; Figure 1). The genetic length of LGs ranged from 120.03 cM (LG5) to 168.09 cM (LG4), with an average length of 142.77 cM. LG5 contained the most markers (1,792) spanning 120.03 cM with an average genetic interval of 0.07 cM, whereas LG12 spanned 121.78 cM and contained the fewest markers (233) with an average genetic interval of 0.52 cM. Similarly, LG2 contained 1,135 markers with an average genetic interval of 0.11 cM, and LG1 contained 1,019 markers with an average genetic interval of 0.15 cM. Only 17 of ‘Gap >5’ were observed in nine LGs, among which LG9 contained 5 with a max gap of 7.9 cM and LG3 had a max gap of 9.13 cM. There was no’Gap >5’ in LG1, LG4 and LG8, which indicated the markers were well-distributed on the genome.
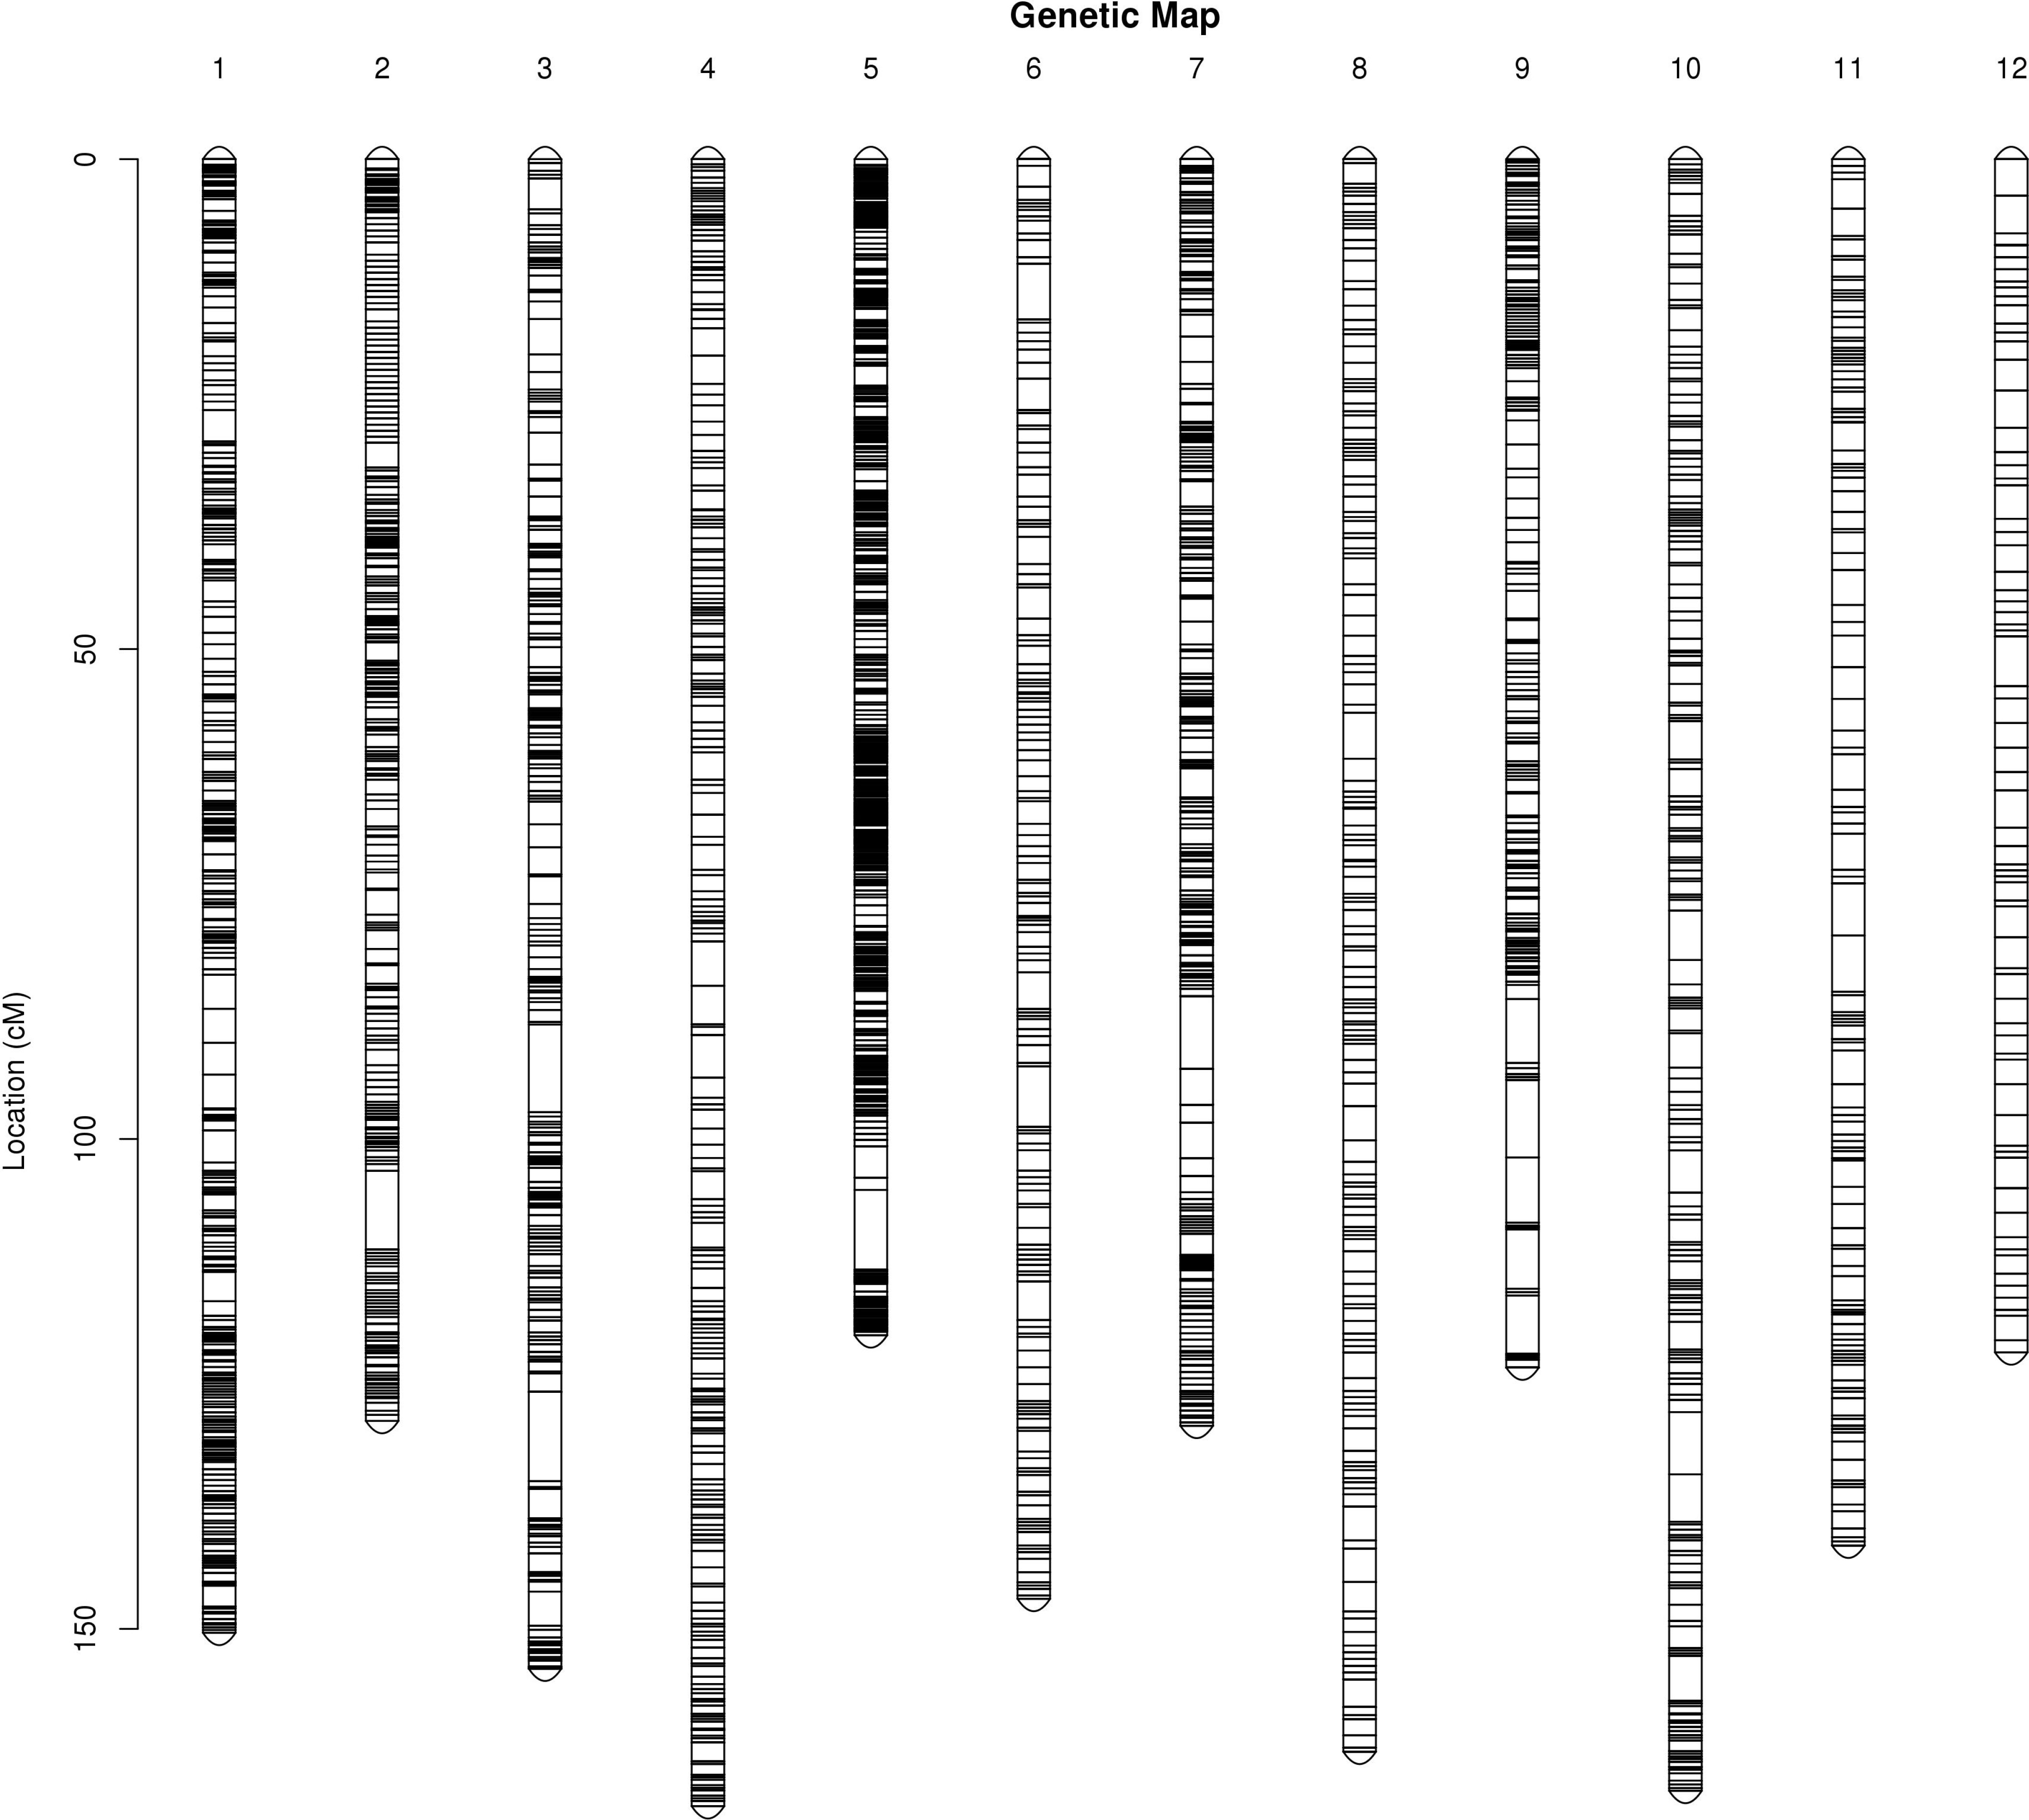
Figure 1 Genetic linkage groups of integrated map.
Collinearity of the genetic and physical maps
The purpose of the genetic map is to analyze multi-point recombination; the closer the distance between markers, the lower the recombination rate. To evaluate the quality of the genetic map, heat maps of the 12 LGs were generated separately based on pair-wise recombination values for the 8,684 recombination bin markers. The linkage relation heat map illustrated the relationship between recombination markers on one chromosome, which generally indicated that the construction of the present genetic map was accurate. The correlation between genetic and physical positions on a linkage map defines its quality. To compare genetic and physical maps, we investigated the locations of all SNP and InDel markers on the reference genome (Figure 2). A high degree of collinearity was observed between genetic and physical distances in the 12 LGs, and the absolute values of Spearman correlation coefficients were all greater than 98%, except LG6, meaning the value of 99%. All consecutive curves generated from the 12 LGs indicated that they have high genetic collinearity with the physical positions of each chromosome, and markers covered 12 chromosomes were positioned accurately, which was sufficient to cover the jujube genome. Our high-density genetic map overlaps 97.09% of the physical map of Jujube.
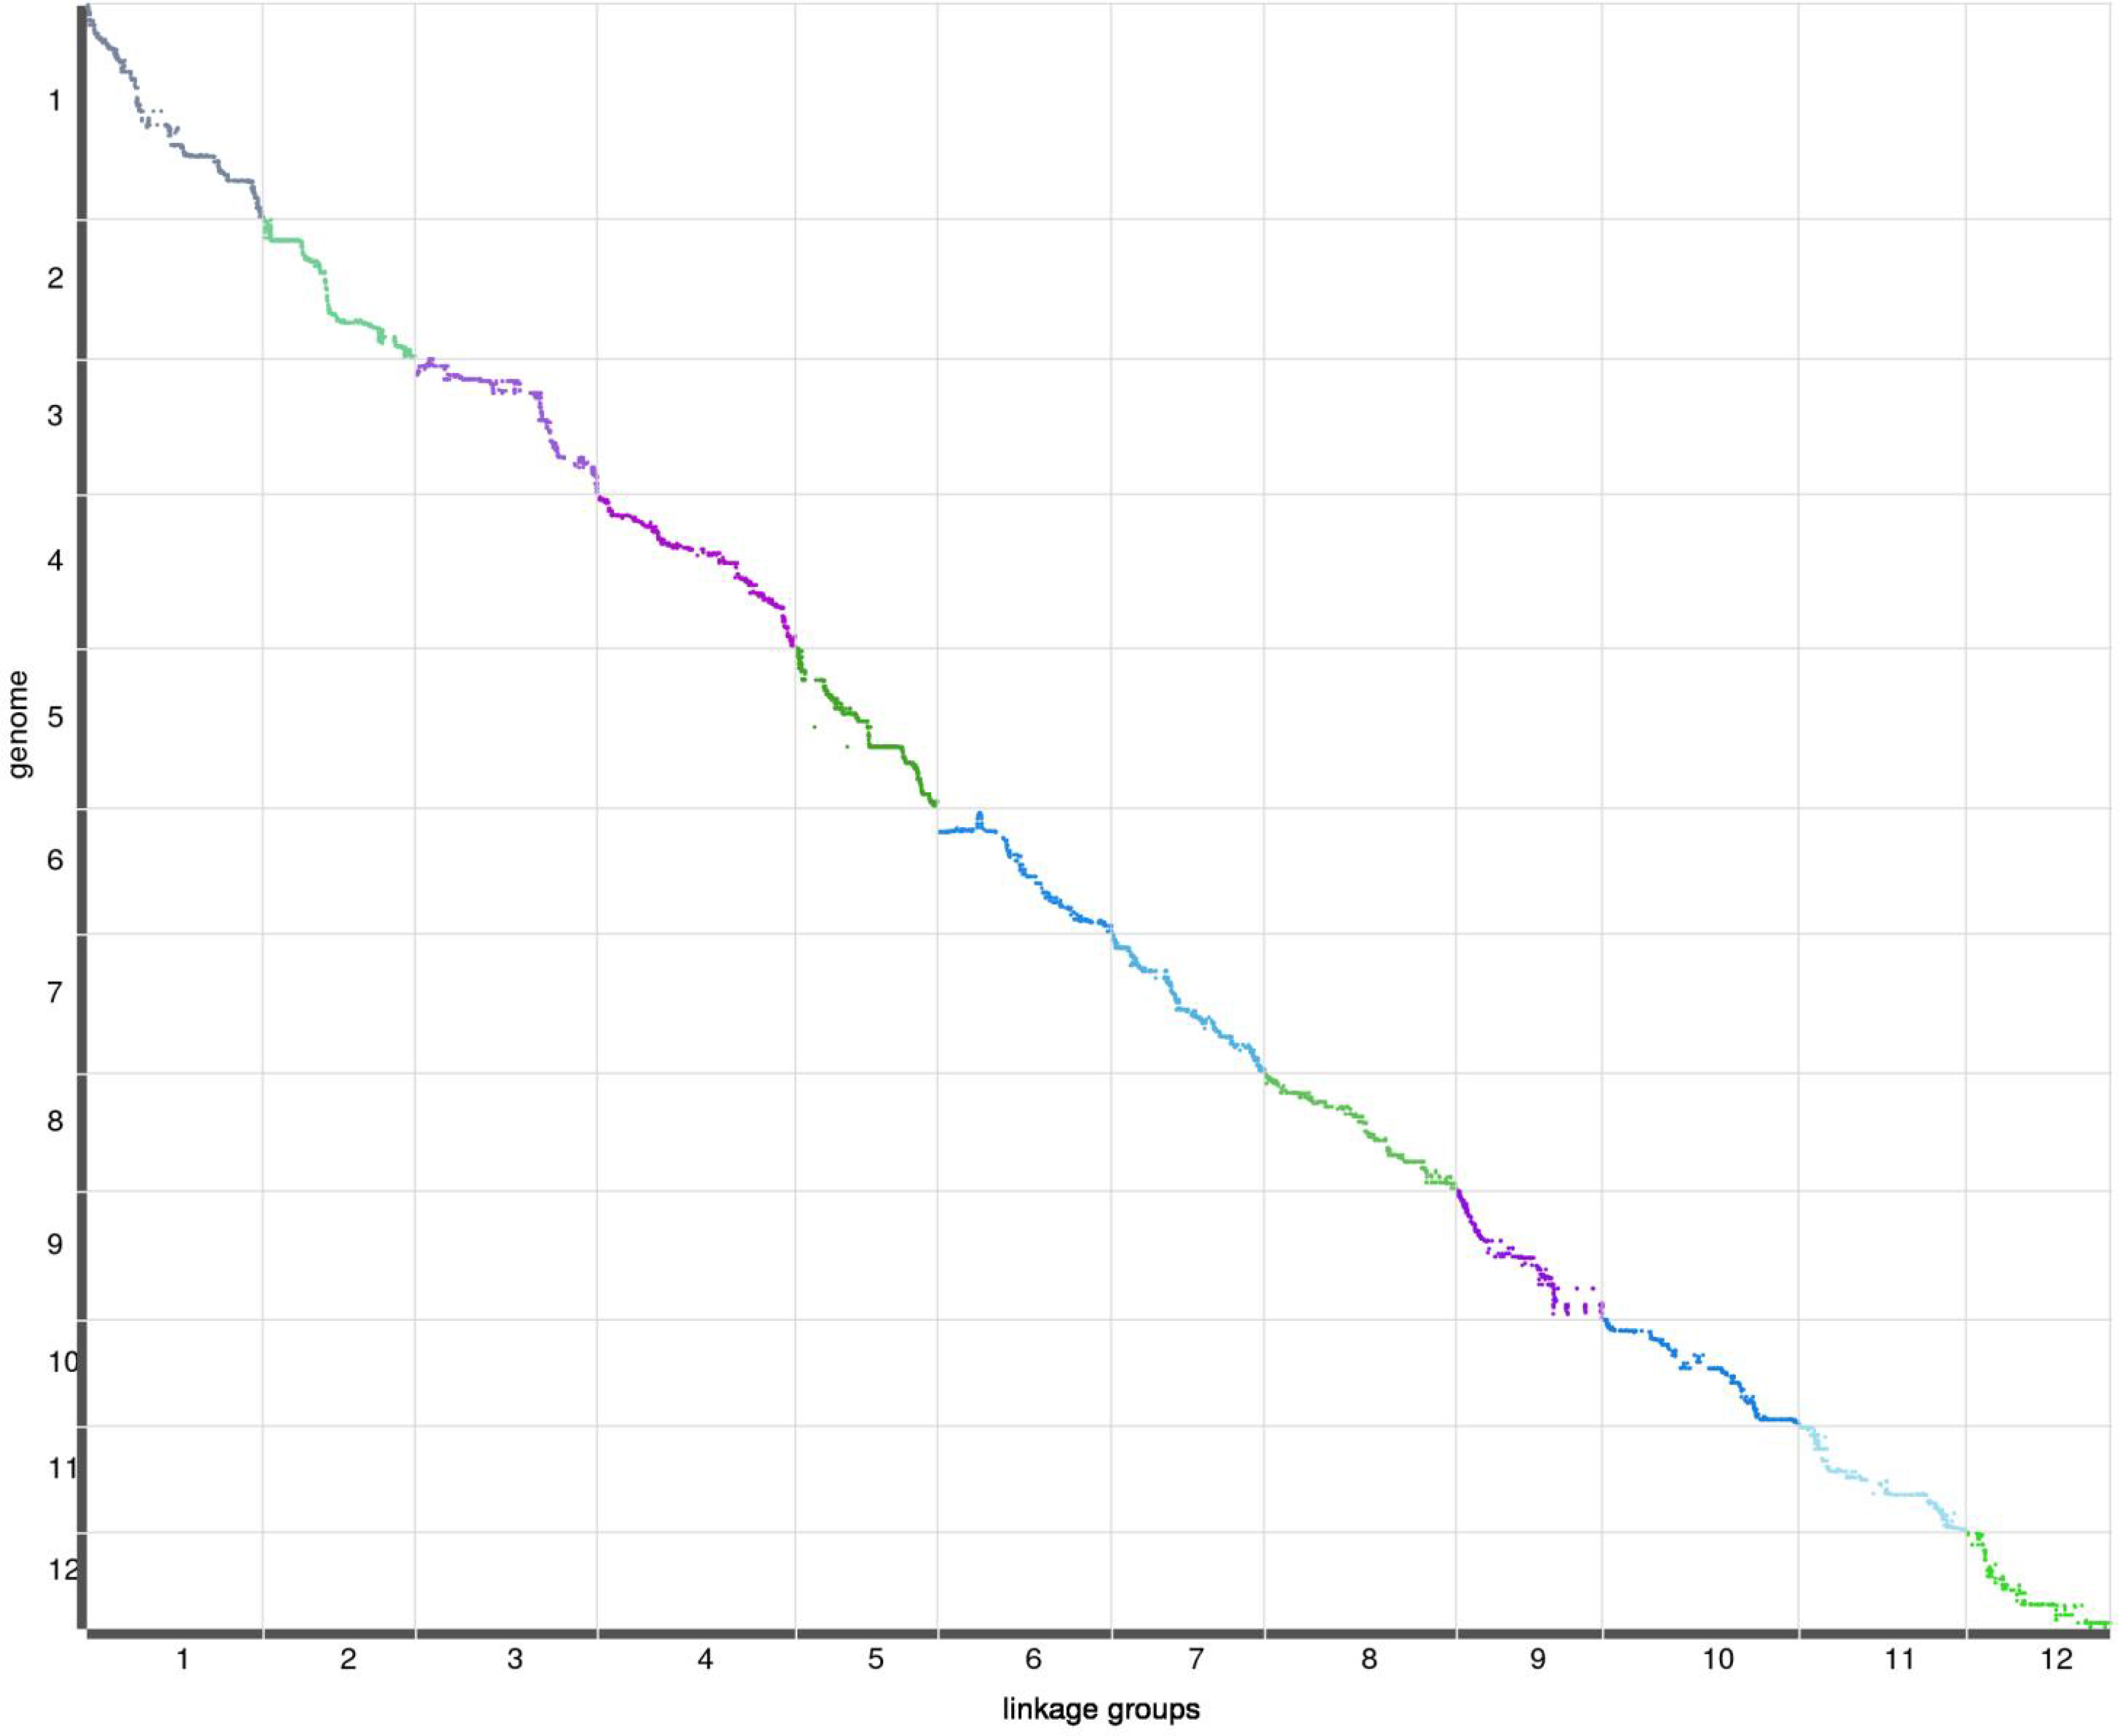
Figure 2 Relationship between genetic and physical positions with each chromosome.In each plot, genetic distance is on the x-axis, and physical distance is on the y-axis.
Characterization of leaf traits in the mapping population
Leaf traits including leaf length, leaf width, leaf area and leaf shape index of the ‘JMS2’ × ‘Jiaocheng 5’ segregation population were investigated for three years from 2019 to 2021 (Table 5). The mean value of leaf length, leaf width, and leaf area of the male parent were all greater than that of the female parent, and the progeny mean value of leaf length, leaf width, and leaf area were all less than the two parents, which showed a trend of small variation. The population mean value of leaf traits varied with the year, and it was speculated that environmental factors could have been responsible for the impacts. In our previous study (Bao et al., 2021), results showed that the leaf area value ranged from 6.31 cm to 22.46 cm in 2019 and from 7.44 cm to 22.46 cm in 2020, and the coefficient of variation (CV) value of leaf area was 22.9% and 27%, while the CV of leaf shape index was 7.67% and 8.05%. After another year of research, we found that the leaf area value ranged from 6.31cm to 35.37cm in 2021, the coefficient of variation (CV) value of leaf area was 29.52%, and the CV of leaf shape index was 9.31% in 2021. The value of leaf traits varied continuously and had a normal distribution according to the Shapiro–Wilk test, demonstrating these traits were typical quantitative traits controlled by polygenes (Figure 3).
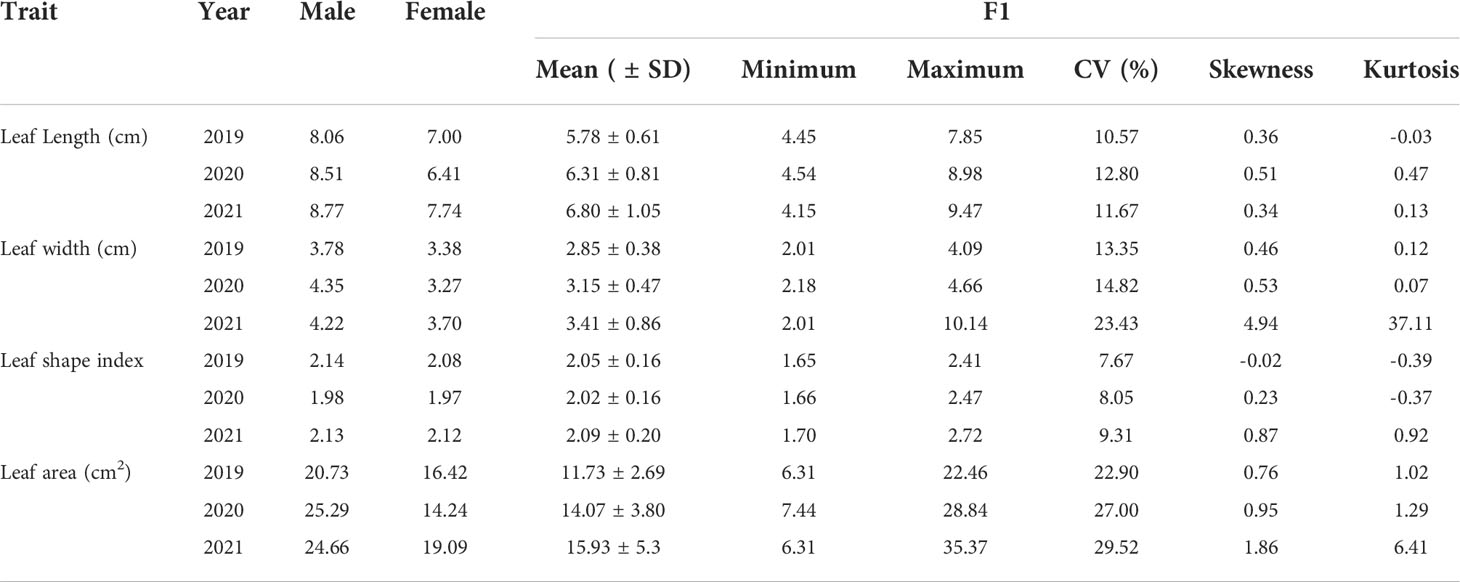
Table 5 The leaf phenotypic traits of mapping population (Bao et al., 2021).
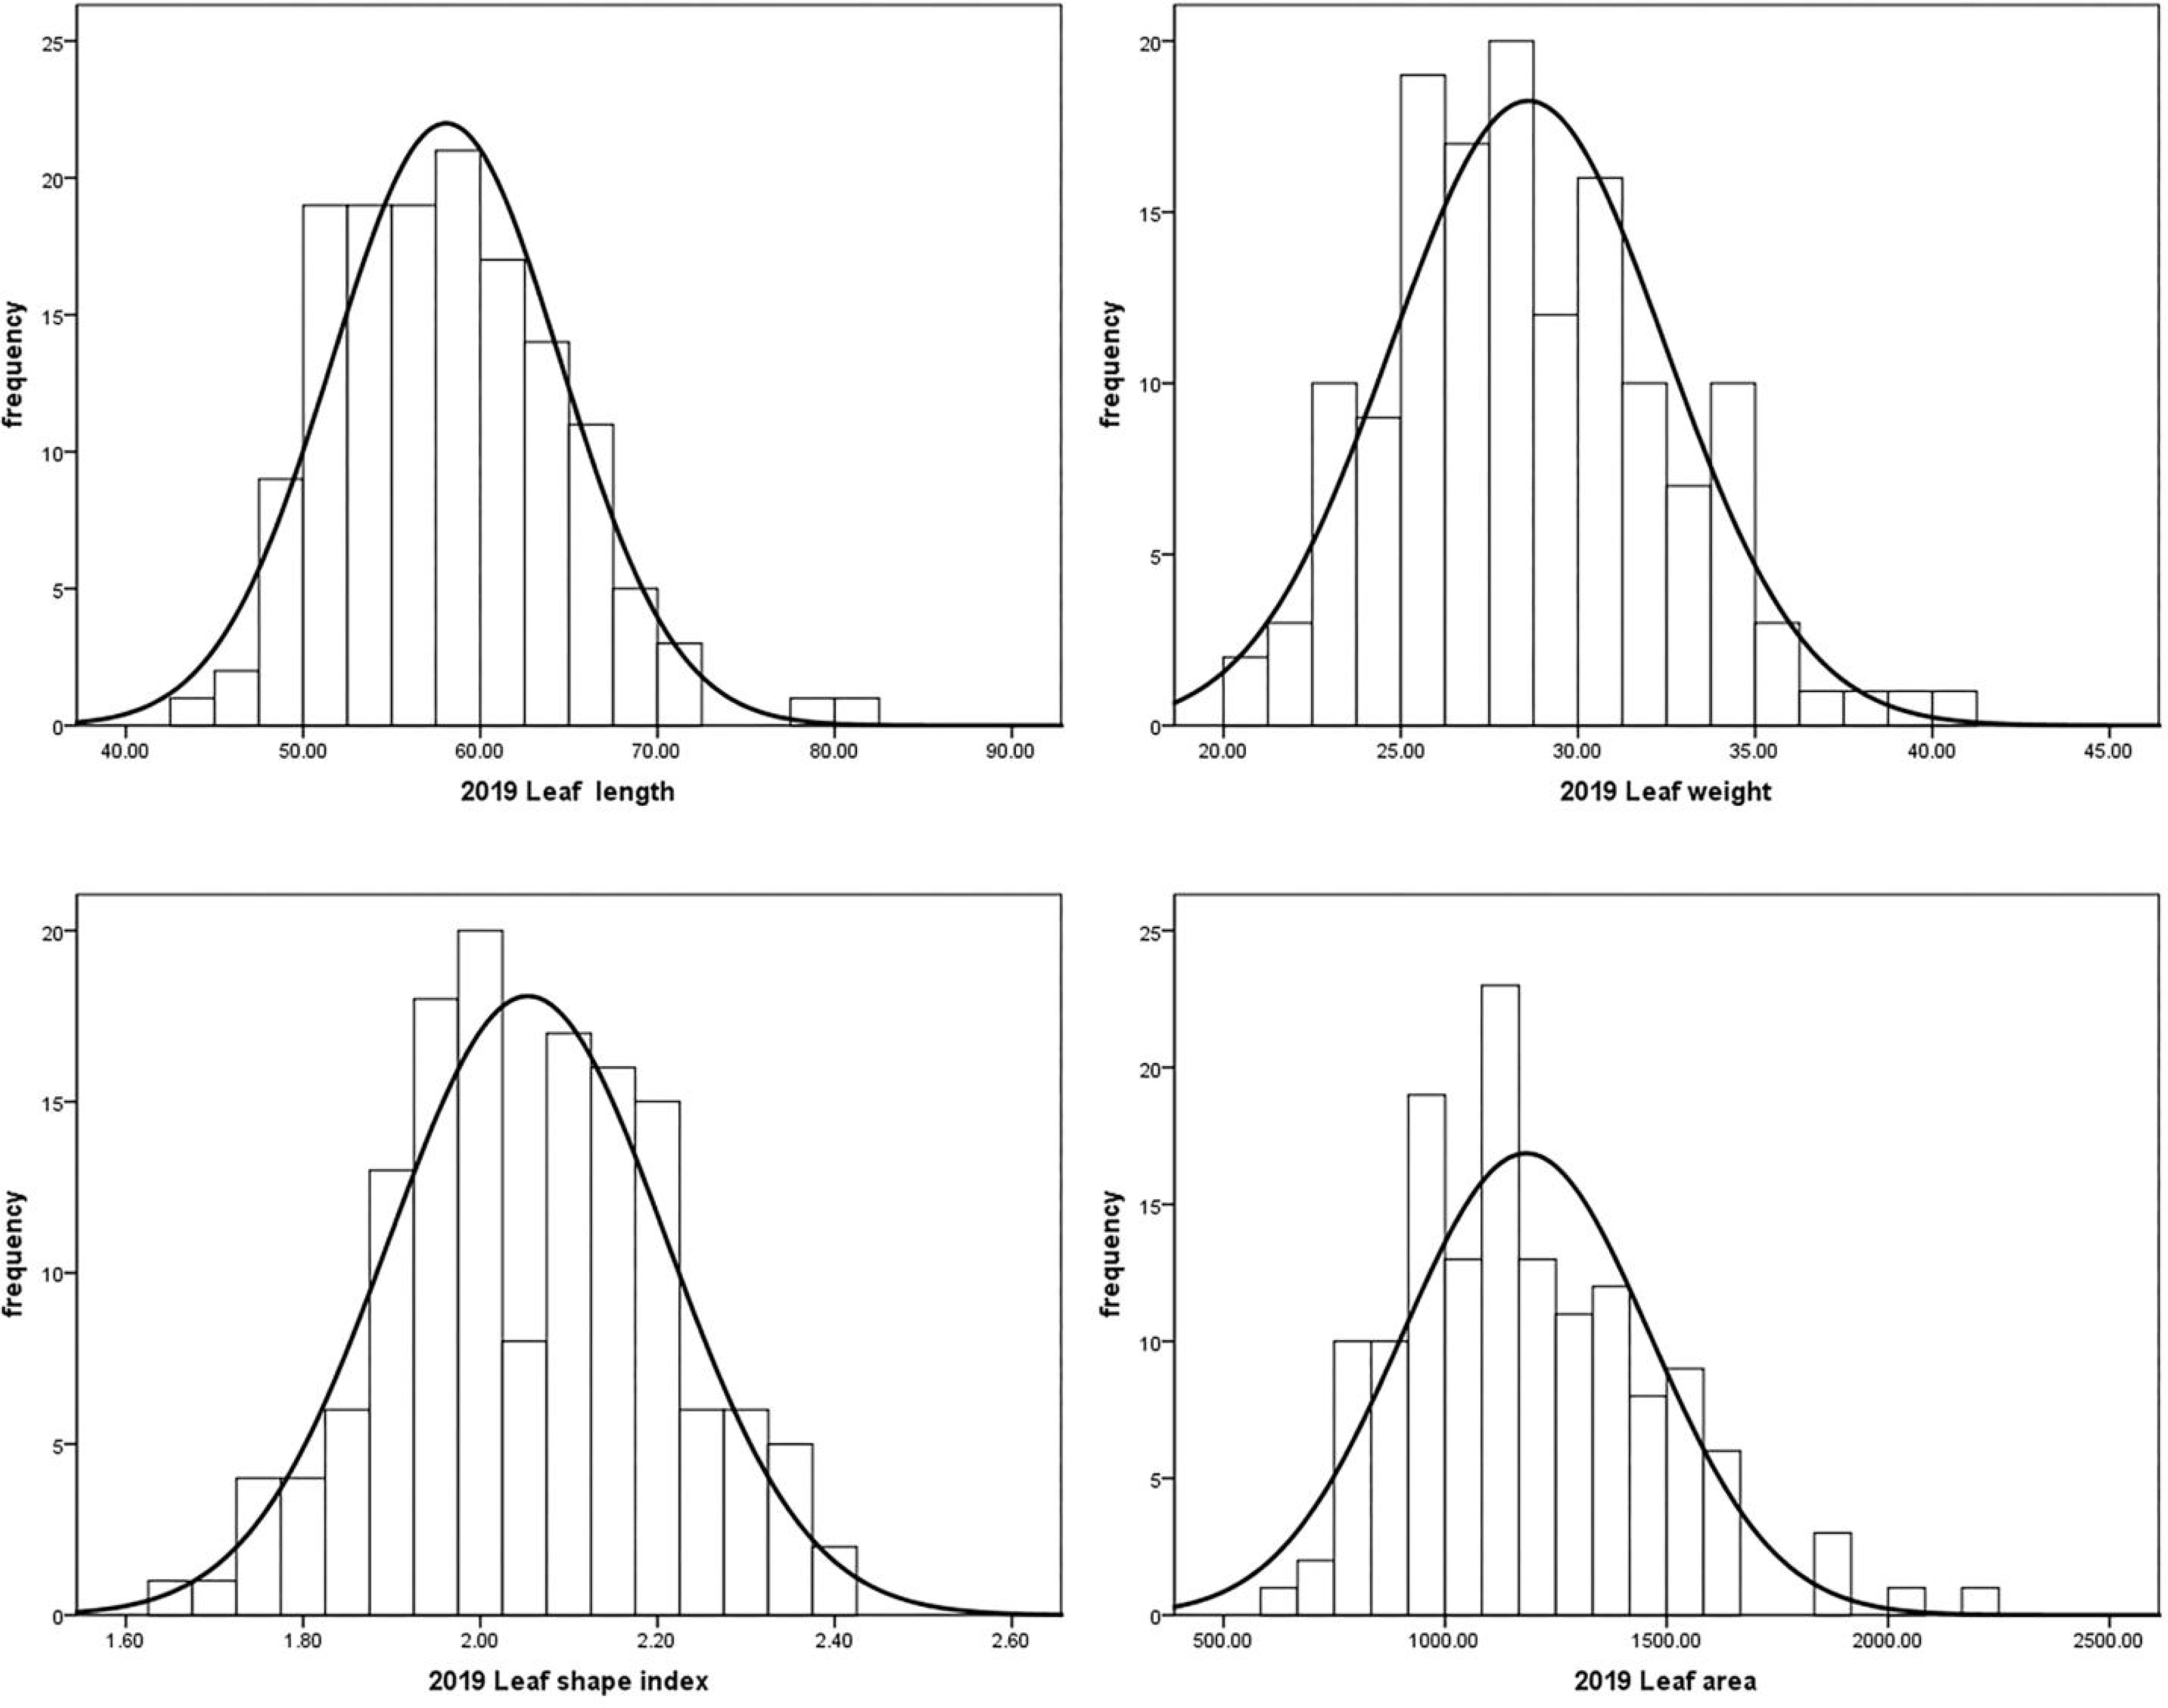
Figure 3 Normal distribution plot of leaf size in 2021.
QTL analysis of leaf traits
The compound interval mapping method (CIM) was used to ensure the reliability of the identified QTLs in combination with leaf phenotypic traits for three consecutive years. It was regarded as presenting QTL loci when the threshold was greater than 3 (LOD >3), and we generally believed that the major QTLs would exist when the threshold was greater than 3.5 (LOD >3.5). In our study, QTLs were detected by LOD ≥3.0, except for the leaf width QTLs, which were divided by LOD ≥2.7 in 2019. A total of 31 QTLs were detected, with LODs ranging from 2.70 to 27.26 and PVEs from 0.74% to 34.79%, including 17 major QTLs (LOD ≥3.5). There were four-leaf length-related QTLs detected in LG1, LG3, LG5, and LG8, with LODs ranging from 3.3 to 5.34 and PVEs from 3.28% to 14.22%. Eight leave width-related QTLs were located in LG1, LG5, and LG7, with LODs ranging from 2.7 to 27.26 and PVEs from 0.74% to 34.79%, of which the QTL qLW21-1 was detected in LG5 (80.10 cM–81.76 cM) with LOD values of 27.26 and explaining 34.79% of the observed genotypic variation. Fourteen QTLs associated with leaf shape index were detected in LG1, LG5, LG7, and LG11, with LODs ranging from 3.03 to 4.74 and PVEs from 1.42% to 13.85%. In addition, five linked to leaf area QTLs were identified in LG1 and LG5, with LOD values from 3.78 to 21.93 and PVEs from 3.64% to 28.97%, of which the QTL qLA21-3 was detected in LG5 (80.10 cM–81.76 cM) with LOD values of 21.93 and explaining 28.97% of the observed genotypic variation, containing 35 markers (Table 6; Figures 4, 5).
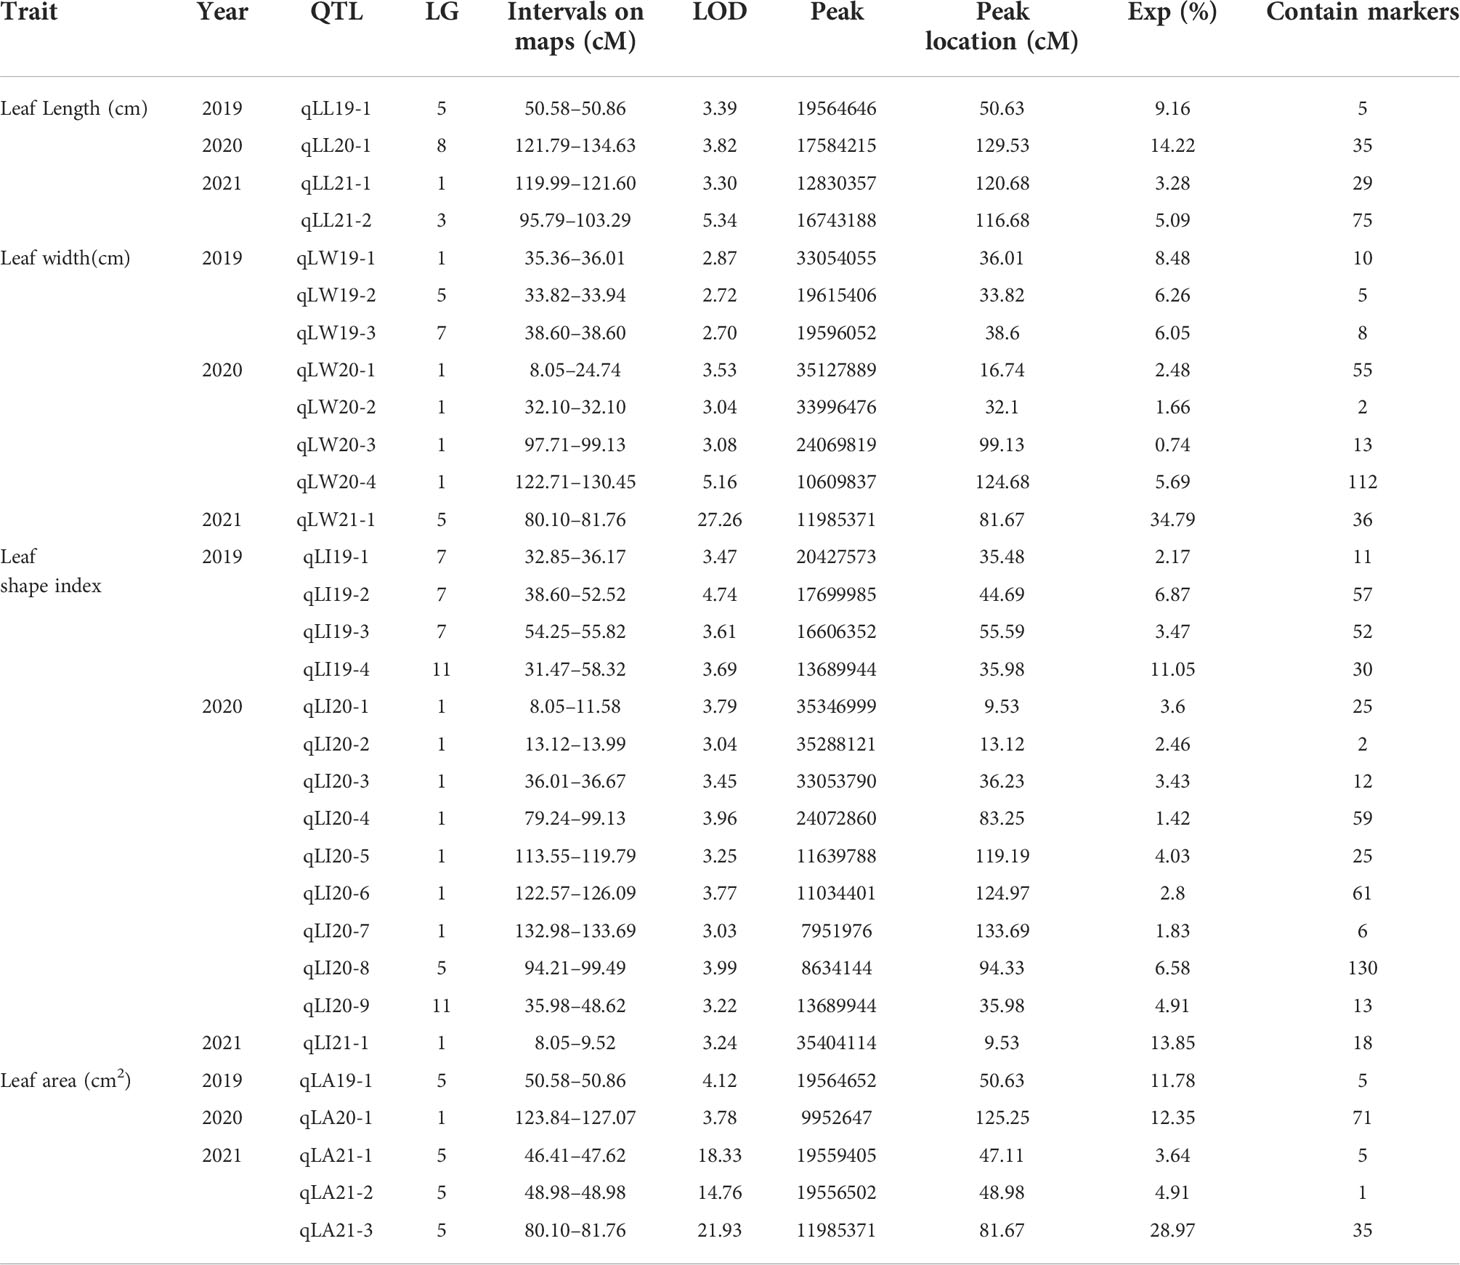
Table 6 QTLs for leaf traits detected by interval mapping.
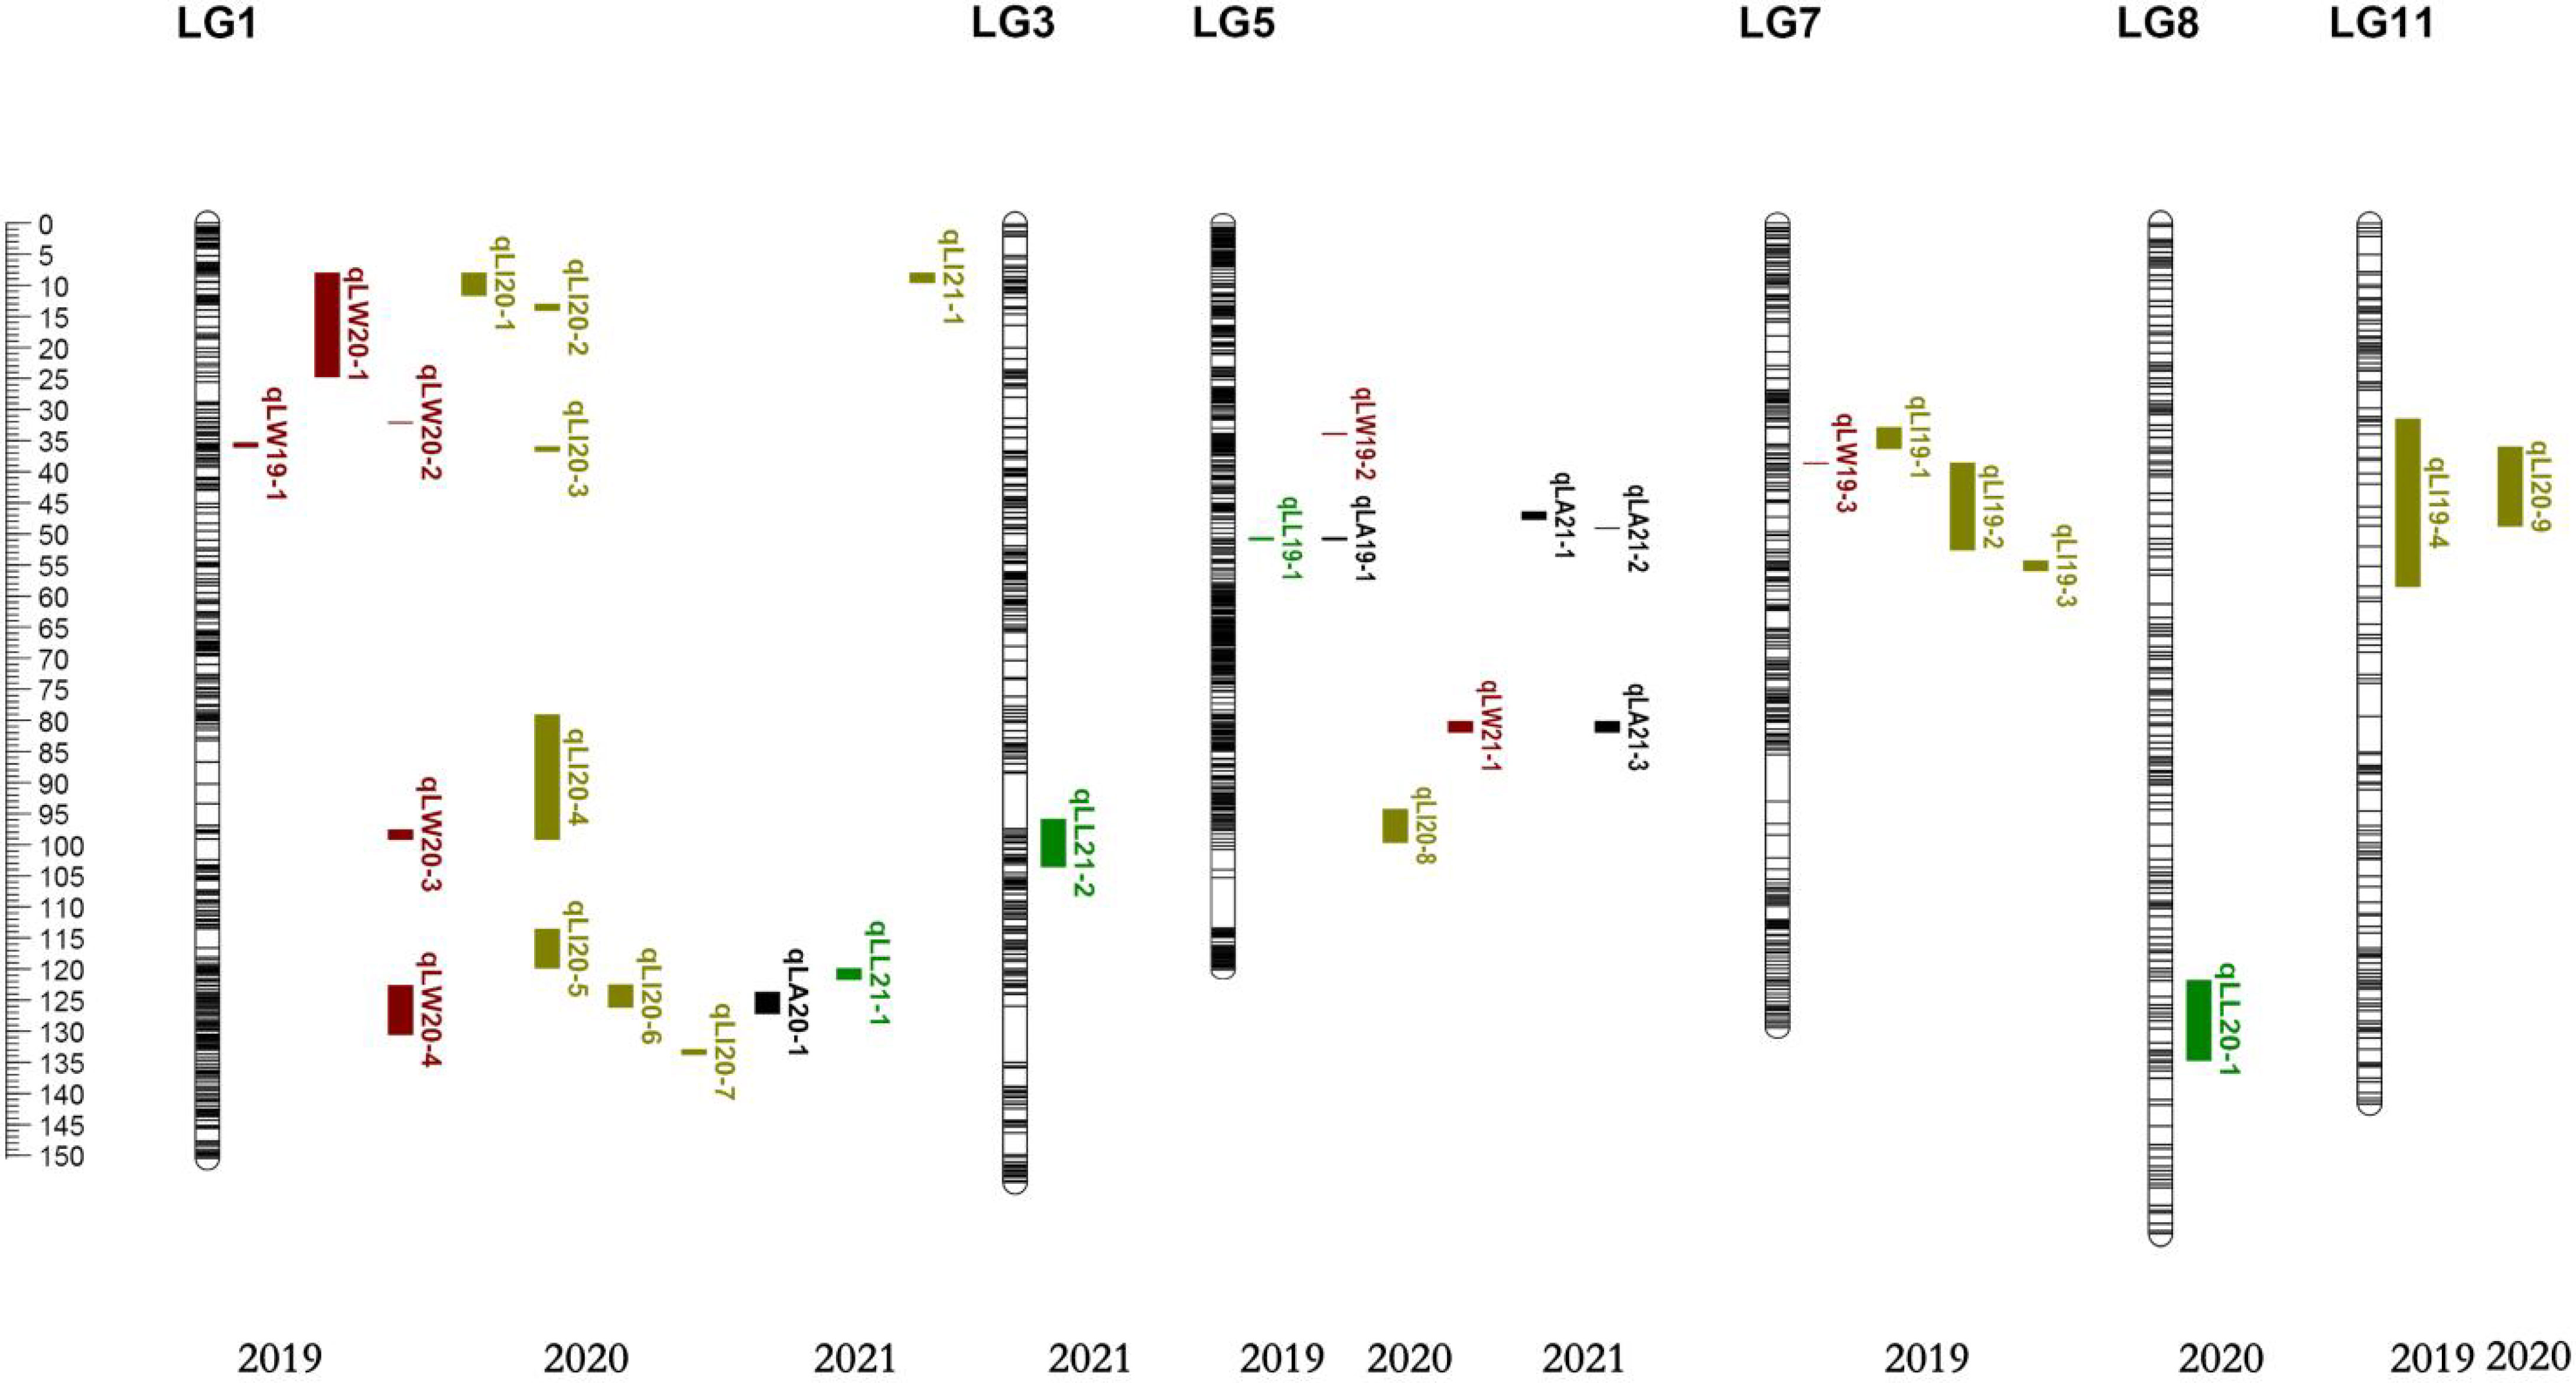
Figure 4 Distribution map of QTL loci for leaf size traits.
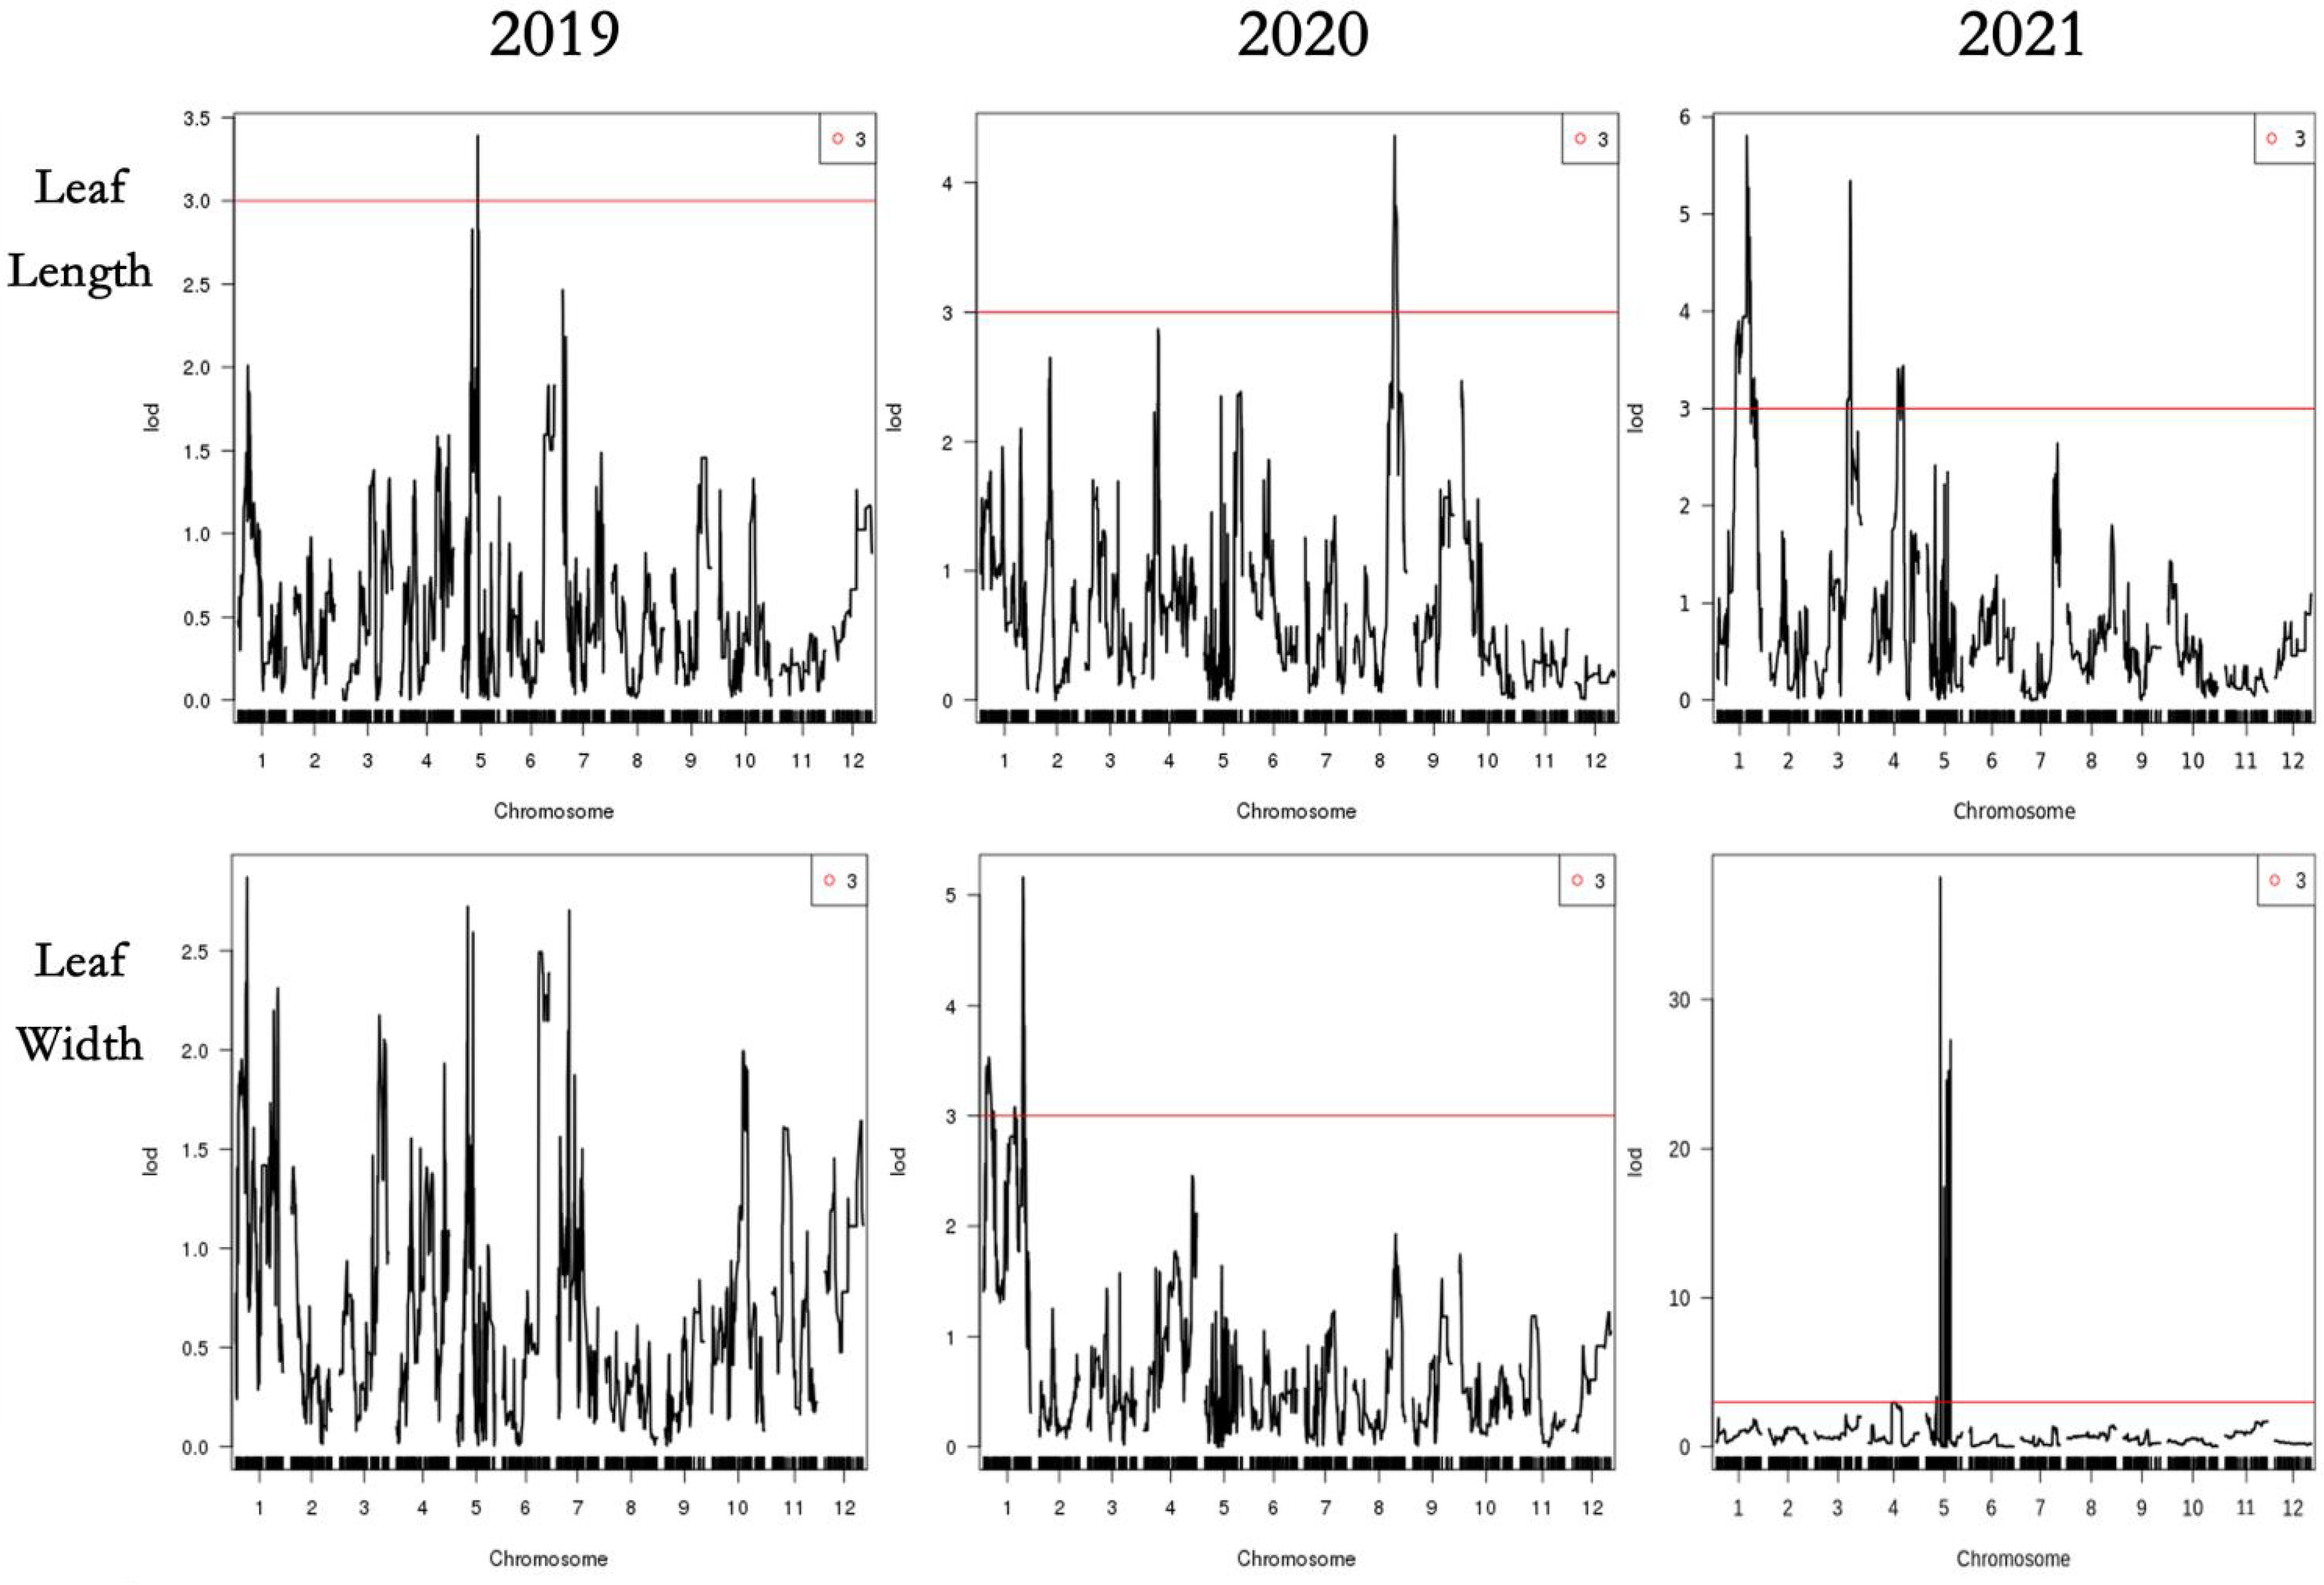
Figure 5 QTL analysis of the 4 leaf traits in 2019,2020 and 2021. The x-axis indicates map position (cM) across the 12 LGs, while the y-axis represents the LOD scores. Horizontal line on the chart represents LOD threshold.
Quantitative trait loci clusters and candidate gene prediction
There were six overlapping intervals among the QTL loci for leaf size traits (Table 7). The QTLs associated with the leaf shape index were identified corresponding to their genetic distance intervals of 31.47 cM–58.32 cM and 35.98 cM–48.62 cM on LG11, with a LOD score of 3.69 and 3.22, explaining 11.05% and 4.91% of phenotypic variation in 2019 and 2020, respectively. The location of 50.58 cM–50.86 cM mapped on LG5, with a LOD score of 3.39 and 4.12, explained 9.16% and 11.78% phenotypic variation of leaf length and leaf area in 2019, respectively. The location of 80.10 cM–81.76 cM mapped on LG5, with a LOD score of 27.26 and 21.93, explained 34.79% and 28.97% of the phenotypic variation of leaf width and leaf area in 2021. There were 3 overlaps (qLW20-4, qLI20-6, and qLA20-1) with distance intervals of 123.84 cM–126.09 cM on LG1, which were linked to leaf width, leaf shape index, and leaf area simultaneously. There were other 3 overlaps (qLW20-1, qLI20-1, and qLI21-1) with distance intervals of 8.05 cM–9.52 cM on LG1, which were linked to leaf width, leaf shape index, and leaf area simultaneously. One overlapping interval (qLW20-1, qLI20-2) between leaf width and leaf shape index was identified with distance intervals of 13.12 cM–13.99 cM on LG1. These genetic intervals identified with stable QTL effects deserve special attention in follow-up studies.

Table 7 QTL cluster information of leaf size traits.
To delve deeper into the markers and genes associated with leaf phenotypic traits, we compared the KEGG and GO databases to determine the tag information for the associated region and the markers as well as genes in the associated regions (Table 8). A total of 16,355 and 1,769 genes with functional SNP and InDel markers, respectively, as well as 2,829 genes with functional variation were compared. The KEGG and GO databases were compared to 724 and 2,982 genes, respectively. According to the physical positions of overlapping QTL fragments, three candidate regions for leaf size traits were identified, suitable candidate genes were directly searched for in the relevant regions, and their functions were predicted (Table 9). There were two QTL clusters in LG1. Five candidate genes in the genomic region were obtained from the reference genome database, and three candidate genes were screened in LG5. These candidate genes related to leaf size were involved in cell wall biosynthesis (LOC107433386, LOC107417968, LOC112492570, LOC112491602, LOC107418569, and LOC107418597) and cell division (LOC107418196 and LOC107418241).

Table 8 Markers and genes in the associated regions by comparing the data bases.
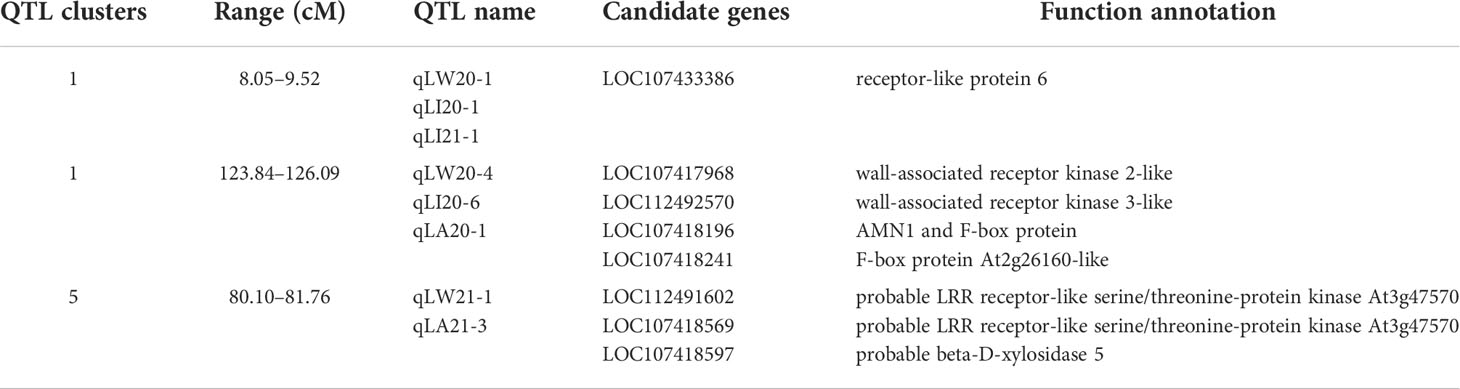
Table 9 Quantitative trait loci clusters and candidate gene functional predictions.
Discussion
Construction of the genetic map
The high-saturate molecular linkage map is an important tool for elucidating the genetic basis for key traits of interest and MAS-based breeding, which may help in the fine mapping of quantitative trait loci (QTL). However, there were obvious problems, including the inconsistency between LG number and chromosome number and large spacing among markers in the previous genetic linkage map in Chinese jujube constructed by AFLP, RAPD, and SSR, which affected the accuracy of QTL (Lu, 2003; Shen, 2005; Qi, 2006; Xu, 2012). So far, some of the highest density genetic linkage maps of jujube have been constructed over the years. For example, the genetic linkage map of ‘JMS2’ × ‘Xing 16’ was published based on the RAD-Tag method and contained a total of 2,748 SNP markers spanning 913.87 cM, with an average distance of 0.34 cM between adjacent markers (Zhao et al., 2014). The genetic map of ‘Dongzao’ × ‘Yingshanhong’ constructed by restriction-site-associated DNA sequencing (RAD-seq) consisted of 4,669 markers (4,137 SNPs, 486 InDel, and 46 SSRs) and spanned 2,643.79 cM with an average marker interval of 0.57 cM (Zhang et al., 2016).The genetic map of ‘Dongzao’ × ‘Zhongningyuanzao’ was constructed by sequencing strategy (GBS), which spanned 1,456.53 cM and contained 2,540 SNP markers with an average marker interval of 0.88 cM (Zhang et al., 2016).The most recent jujube genetic map of ‘Dongzao’ × ‘Jinsi 4’ was produced by GBS strategy and developed a total of 3,792 SNP markers spanning 2,167.5 cM, with an average marker interval distance of 0.358 cM (Wang et al., 2019). In this study, Illumina sequencing approaches were employed to facilitate the re-sequencing of 140 F1 jujube progeny and their parents, yielding 203.02 GB of raw data from which a high-density genetic map was constructed by the WGR method. Relative to other previously reported genetic linkage maps, our map is superior with a marker number of 8,684 (including 8,158 SNP and 526 InDel) and a smaller marker spacing of 0.20 cM. The LG5 presented the most markers (1,684 SNP and 108 InDel) and the smallest average distance between the markers of 0.07 cM and the shortest total genetic distance of 120.03 cM in the integrated maps. Only 17 of ‘Gap >5’ were observed and the LG1, LG4, and LG8 had no ‘Gap >5,’ which indicated good uniform coverage and highly saturated linkage maps. The number of markers in our map was roughly 2-fold higher than the reported high-density map (Zhang et al., 2016; Wang et al., 2019), and such increased density enables more accurate QTL detection and can better facilitate potential candidate genes associated with key plant traits. However, the total distance of this map was 1,713.22 cM, which was shorter than the spanned 2,643.79 cM reported by Zhang et al. (2016), which may be caused by differences in hybrid population materials, sequencing methods, mapping software, etc. It could be found that the total length of the genetic map was not proportional to the average spacing between markers in apple (MD Clark et al., 2014; Gardner et al., 2014) and watermelon (Nimmakayala et al., 2014; Zhang et al., 2018). This map can serve as a high-quality reference to support candidate gene identification, molecular breeding, map-based gene cloning, and marker-assisted selection of jujube.
Quantitative trait locus identification
The leaf-related traits such as area and size determine the photosynthetic capacity of plants, thereby these traits regulate potential fruit yield and quality (Zhang et al., 2021). Thus, the genetic factors responsible for the regulation of leaf traits in jujube trees are invaluable for both selective breeding efforts and clarification of the mechanisms governing plant developmental biology. The construction of an F1 population and mapping of QTLs in jujube is challenging because jujube is a self-incompatible plant with a small flower size and a high seedless percentage, so it is difficult to generate an F1 population by traditional crossbreeding (Wang et al., 2019). With the development of cross-breeding by controlled honeybee-assisted pollination by nets in jujube, a genetic mapping population of ‘JMS2’ and ‘Jiaocheng 5’ was successfully constructed, which provided the opportunity for QTL analysis for leaf traits. A LOD value is a reflection of the recombination frequency or linkage distance between predicted genes and traits (Khan et al., 2013). The LOD threshold of 2.5 was used to identify potential QTLs, and a significant LOD threshold was calculated by permutation test as 3.5 at the 95% confidence level, which can effectively control the occurrence of false positive loci (Zhang et al., 2012; Wu et al., 2014). Previous studies on QTL mapping of leaf phenotypical traits in jujube have rarely been precise sections on the linkage group. For example, Shen (2005) first detected 25 QTLs for leaf traits using AFLP markers, but the genetic maps constructed were of lower resolution and unsaturated, and possibly unable to reliably capture QTLs. Wang et al. (2019) detected four QTLs for leaf length on LG1 and LG11, five QTLs for leaf width on LG1 and LG11, four QTLs for leaf area on LG9 and LG11, and seven QTLs for leaf shape index on LG1 and LG11. In this study, a total of 31 QTLs, including 17 major QTLs, were detected, of which four QTLs for leaf length on LG1, LG3, LG5, and LG8, eight QTLs for leaf width on LG1, LG5, and LG7, 14 QTLs for leaf shape index on LG1, LG5, LG7, and LG11, and five QTLs for leaf area were identified on LG1 and LG5. Significantly, the qLW21-1 for leaf width and qLA21-3 for leaf area were detected simultaneously in LG5 (80.10 cM–81.76 cM) with LOD values of 27.26 and 21.93, explaining 34.79% and 28.97% of the observed genotypic variation, respectively. In addition, the QTLs associated with leaf length and leaf area were located in the same linkage group (LG1, LG5, and LG11) as those in previous studies, although at different positions (Shen, 2005; Wang et al., 2019).
QTLs and genes can exhibit pleiotropic effects on multiple traits, and phenotypically correlated traits are often mapped together (Jia et al., 2016; Wang et al., 2019). Most of the evaluated traits showed significant differences between years, suggesting that environmental orchard conditions in an orchard affect phenotypic characters (Zhang et al., 2022). Hence, the collection of reliable phenotypic data and continuous trait localization for many years is a critical step in the identification of genomic markers. Quantitative trait loci clusters are regions of the chromosome containing multiple loci associated with a range of traits (Kochevenko et al., 2018; Guan et al., 2020).
In this study, six overlapping intervals among the QTL loci for leaf size traits were clearly observed in some chromosomal intervals. Three QTL clusters were detected on LG1. The overlaps of 123.84 cM–126.09 cM included three QTLs (qLW20-4, qLI20-6, and qLA20-1) with LOD threshold higher than 3.5, which were related to leaf width, leaf shape index, and leaf area simultaneously. The overlaps of 8.05 cM–11.58 cM included three QTLs (qLW20-1, qLI20-1, and qLI21-1) with LOD threshold higher than 3.5, which were related to leaf width and leaf shape index and leaf area simultaneously, suggesting that there were major genes affecting leaf phenotypic traits in this region. The overlaps of 13.12 cM–13.99 cM included two QTLs (qLW20-1, qLI20-2) were related to leaf width and leaf shape index. It was found that LG1 had the most QTL loci related to leaf phenotypic traits, including leaf width, leaf area, and leaf shape index. Two QTL clusters were detected on LG5, including the location of 50.58 cM–50.86 cM with a LOD score of 3.39 and 4.12, explaining 9.16% and 11.78% phenotypic variation of leaf length and leaf area in 2019, respectively, and the location of 80.10 cM–81.76 cM with a LOD score of 27.26 and 21.93, explaining 34.79% and 28.97% phenotypic variation of leaf width and leaf area in 2021. It was speculated that there were stable genes affecting the leaf area in this region. In addition, one QTL cluster were detected on LG11 with genetic distance intervals of 31.47 cM–48.62 cM, with a LOD score of 3.69 and 3.22, explaining 11.05% and 4.91% of phenotypic variation in 2019 and 2020, respectively. Such clusters are of particular relevance to breeders, as they can thereby focus their efforts on QTL regions associated with the greatest degree of phenotypic variance. These newly identified QTL clusters would be valuable resources for further screening and verification of candidate genes related to leaf traits in jujube.
Candidate gene screening and analysis
In the current genetic study, candidate gene searches based on QTL intervals are common. Within these three cluster ranges, eight potentially relevant genes were identified. The genes with functional variation were analyzed by comparing KEGG and GO databases to further clarify the functions of genes within QTLs. It is generally known that leaf size traits are determined by the coordination of cell proliferation and cell expansion during leaf development (Gonzalez et al., 2012). Two genes (LOC107418196, LOC107418241) are predicted to encode ‘AMN1 and F-box protein’ and ‘F-box protein At2g26160-like,’ which is a key regulator of leaf size by regulating plant cell division and the number of cells. This trend has also been observed in other species. For example, the difference in the size of leaves of Populus deltoides ‘Danhong’ and Populus simonii ‘Tongliao1’ was related to the number of cells and is affected by cell division and chromosome duplication (Zhang et al., 2021a). Zhou et al. (2021) showed that MINI ORGAN1 (MIO1) encodes the F-Box protein, which increases leaf cell proliferation by regulating cell division during the growth and development of leaves. These two candidate genes represent ideal targets for future cloning and functional verification studies.
In addition, the other two genes in this cluster include LOC107417968 and LOC112492570, which encode ‘wall-associated receptor kinase 2-like’ and ‘wall-associated receptor kinase 3-like, ‘ expressed cell wall-associated kinases (WAKs) and play a crucial role in maintaining cell wall integrity during plant growth (Jose et al., 2020). It was found that receptor-like kinases (RLKs) and receptor-like proteins (RLPs) are the main cell surface receptors of plants. Among them, receptor-like kinases (RLKs) are protein kinases located on the cell membrane and play an important role in the process of plant growth and development. The extrinsic information is efficiently transmitted into the nucleus of the plant cell. Although receptor-like proteins (RLP) are structurally distinct from receptor-like kinases, their proteins are similar (Jose et al., 2020; Wang and Gou, 2020; Li et al., 2021).
In this study, the other four receptor genes (LOC107433386, LOC112491602, LOC107418569, and LOC107418597) are annotated as ‘receptor-like protein 6,’ ‘probable LRR receptor-like serine/threonine-protein kinase At3g47570,’ and ‘probable beta-D-xylosidase 5,’ which might play an important role in plant growth and development. Wu et al. (2017) found that leucine-rich repeat receptor-like kinases (LRR-RLKs) exist in different plants and are highly representative. LRR-RLKs have the effect of promoting cell expansion. At the same time, several genes related to cell wall biosynthesis were identified, such as beta-D-xylosidase 5, whose high enzymatic activity is likely to be related to the necessary modification of the cell wall, thereby affecting cell size and ultimately determining leaf size. (Minic et al., 2004; Chavez Montes et al., 2008). The specific roles of these genes will help to elucidate the regulatory mechanisms of jujube leaf phenotypic traits and be a focus of future research efforts.
Conclusions
A highly saturated genetic map of jujube with the most markers and the smallest average distance up to now was constructed using the whole genome resequencing method and an F1 segregation population of 140 individuals derived from a cross between ‘JMS2’ × ‘Jiaocheng 5’. A total of 8,684 markers, including 8,158 SNP and 526 InDel markers, were distributed in all the 12 linkage groups, spanning 1,713.22 cM with an average marker interval of 0.2 cM. Among them, the LG5 contained the largest number of markers (1,684 SNP and 108 InDel). Based on the genetic map and the phenotype data, a total of 31 leaf trait QTLs, including 17 major QTLs, were identified, with 4, 8, 14, and 5 QTLs contributing to leaf length, leaf width, leaf shape index, and leaf area, respectively. Six QTLs clusters were detected on LG1 (8.05 cM–9.52 cM; 13.12 cM–13.99 cM; 123.84 cM–126.09 cM), LG5 (50.58 cM–50.86 cM; 80.10 cM–81.76 cM), and LG11 (35.98 cM–48.62 cM). Eight candidate genes were identified within the QTL cluster regions. Annotation analysis showed that four genes (LOC107418196, LOC107418241, LOC107417968, and LOC112492570) in these QTLs are related to cell division and cell wall integrity. This research will provide a valuable tool for further QTL analysis, candidate gene identification, map-based gene cloning, comparative mapping, and marker-assisted selection (MAS) in jujube.
Data availability statement
The data presented in the study are deposited in the NCBI repository, accession number is PRJNA877294 (https://www.ncbi.nlm.nih.gov/bioproject/PRJNA877294).
Author contributions
FY and CW conceived and designed the experiments. YL and JB performed the experiments. FY, YL, and JB analyzed the data and wrote the manuscript. YP, JW, and ML participated in the experiments and analysis. CW, JW, and ML edited the manuscript. All authors contributed to the article and approved the submitted version.
Funding
This work was supported by the National Science Foundation of China (32060656), the Major Scientific and Technological Projects of XPCC (2017DB006), the Open Fund Project of Key Laboratory of Biological Resources Protection and Utilization of Xinjiang Production and Construction Corps in Tarim Basin (BRZD1811), and the Hebei Province Key R&D Program (20326811D). Innovation and Entrepreneurship Platform and Base Construction Project of XPCC (2019CB001).
Acknowledgments
We thank Dr. Noor Muhammad from Pakistan and Dr. Lixin Wang, who got his PhD from KIT University, Germany for their kind polishing of the manuscript.
Conflict of interest
The authors declare that the research was conducted in the absence of any commercial or financial relationships that could be construed as a potential conflict of interest.
Publisher’s note
All claims expressed in this article are solely those of the authors and do not necessarily represent those of their affiliated organizations, or those of the publisher, the editors and the reviewers. Any product that may be evaluated in this article, or claim that may be made by its manufacturer, is not guaranteed or endorsed by the publisher.
References
Bao, J. K., Wang, Y., Pan, Y. L., Lu, D. Y., Yan, F. F., Wu, C. Y. (2021). Analysis of inheritance of leaf phenotypic characters in jujube hybrid progeny. Molecular Plant Breeding, 1–17. Available at: http://kns.cnki.net/kcms/detail/46.1068.s.20211231.0928.006.html.
Broman, K. W., Wu, H., Sen, S., Churchill, G. A. (2003). R/qtl: QTL mapping in experimental crosses. Bioinformatics. 7, 889–890. doi: 10.1093/bioinformatics/btg112
Chavez Montes, R. A., Ranocha, P., Martinez, Y., Minic, Z., Jouanin, L., Marquis, M., et al. (2008). Cell wall modifications in arabidopsis plants with altered alpha-l-arabinofuranosidase activity. Plant Physiol. 147, 63–77. doi: 10.1104/pp.107.110023
Clark, M. D., Schmitz, C. A., Rosyara, U. R., Luby, J. J., Bradeen, J. M. (2014). A consensus ‘honeycrisp’ apple (Malus × domestica) genetic linkage map from three full-sib progeny populations. Tree Genetics&Genomes. 10, 627–639. doi: 10.1007/S11295-014-0709-1
Danny, A., Pjotr, P., Ritsert, C. J., Karl, W. B. (2010). R/qtl: high-throughput multiple QTL mapping. Bioinf. (Oxford England). 26, 2990–2992. doi: 10.1093/bioinformatics.btq565
Gao, Z., Zhang, H., Cao, C., Han, J., Li, H., Ren, Z. (2020). QTL mapping for cucumber fruit size and shape with populations from long and round fruited inbred lines-sciencedirect. Hortic. Plant J. 6, 132–144. doi: 10.1016/j.hpj.2020.04.004
Gardner, K. M., Brown, P., Cooke, T. F., Cann, S., Costa, F., Bustamante, C., et al. (2014). Fast and cost-effective genetic mapping in apple using next-generation sequencing. G3-Genes Genomes Genet. 4, 1681–1687. doi: 10.1534/g3.114.011023
Gonzalez, N., Vanhaeren, H., Inzé, D. (2012). Leaf size control: complex coordination of cell division and expansion. Trends Plant Science. 17, 332–340. doi: 10.1016/j.tplants.2012.02.003
Guan, P., Shen, X., Mu, Q., Wang, Y., Peng, H. (2020). Dissection and validation of a QTL cluster linked to rht-b1 locus controlling grain weight in common wheat (Triticum aestivum l.) using near-isogenic lines. Theor. Appl. Genet. 133, 2639–2653. doi: 10.1007/s00122-020-03622-z
Huang, J., Zhang, C., Xing, Z., Fei, Z., Wan, K. K., Zhong, Z., et al. (2016). The jujube genome provides insights into genome evolution and the domestication of sweetness/acidity taste in fruit trees. PloS Genet. 12, e1006433. doi: 10.1371/journal.pgen.1006433
Jia, X. Y., Pang, C. Y., Wei, H. L., Wang, H. T., Ma, Q. F., Yang, J. L., et al. (2016). High-density linkage map construction and QTL analysis for earliness-related traits in Gossypium hirsutum l. BMC Genomics 17, 909. doi: 10.1186/s12864-016-3269-y
Jose, J., Ghantasala, S., Choudhury, S. R. (2020). Arabidopsis transmembrane receptor-like kinases (rlks): a bridge between extracellular signal and intracellular regulatory machinery. Int. J. Mol. Sci. 21 (11), 4000. doi: 10.3390/ijms21114000
Khan, M. A., Zhao, Y. F., Korban, S. S. (2013). Identification of genetic loci associated with fire blight resistance in Malus through combined use of QTL and association mapping. Physiologia Plantarum. 148, 344–353. doi: 10.1111/ppl.12068
Kochevenko, A., Jiang, Y., Seiler, C., Surdonjia, K., Kollers, S., Christoph Reif, J., et al. (2018). Identification of QTL hot spots for malting quality in two elite breeding lines with distinct tolerance to abiotic stress. BMC Plant Biol. 18, 106. doi: 10.1186/s12870-018-1323-4
Kosambi, D. D. (2011). The estimation of map distances from recombination values. Ann. Hum. Genet. 12, 172–175. doi: 10.1111/j.1469-1809.1943.tb02321.x
Li, L., Li, K., Ali, A., Guo, Y. (2021). Atwakl10, a cell wall associated receptor-like kinase, negatively regulates leaf senescence in Arabidopsis thaliana. Int. J. Mol. Sci. 22 (9), 4885. doi: 10.3390/ijms22094885
Li, B. B., Lu, X. Q., Dou, J. L., Aslam, A., Lei, G., Zhao, S. J., et al. (2018). Construction of a high-density genetic map and mapping of fruit traits in watermelon (Citrullus lanatus l.) based on whole-genome resequencing. Int. J. Mol. Sci. 19 (10), 3268. doi: 10.3390/ijms19103268
Li, H., Richard, D. (2009). Fast and accurate short read alignment with burrows-wheeler transform. Bioinformatics. 25, 1754–1760. doi: 10.1093/bioinformatics/btp324
Liu, Z. C., Bao, D. E., Liu, D. L., Zhang, Y. M., Chen, X. S. (2016). Construction of a genetic linkage map and QTL analysis of fruit-related traits in an F1 red fuji × hongrou apple hybrid. Open Life Sci. 11, 487–497. doi: 10.1515/biol-2016-0063
Liu, M. J., Wang, J. R. (2019). Fruit scientific research in new China in the past 70 years: Chinese jujube. J. Fruit Science. 36, 1369–1381. doi: 10.13925/j.cnki.gsxb.Z11
Liu, M. J., Wang, J. R., Wang, L. L., Liu, P., Zhao, J., Zhao, Z. H., et al. (2020). The historical and current research progress on jujube–a superfruit for the future. Horticulture Res. 7, 119. doi: 10.1038/S41438-020-00346-5
Liu, M. J., Zhao, J., Cai, Q. L., Liu, G. C., Wang, J. R., Zhao, Z. H., et al. (2014). The complex jujube genome provides insights into fruit tree biology. Nat. Commun. 5, 5315. doi: 10.1038/ncomms6315
Lu, J. Y. (2003). Study on identification of hybrids and hereditary variation of natural pollinated Chinese jujube seedlings. [Dissertation] (Hebei Agricultural University) (Baoding in Chinese). doi: 10.7666/d.y521324
Ma, Y., Marzougui, A., Coyne, C. J., Sankaran, S., Main, D., Porter, L. D., et al. (2020). Dissecting the genetic architecture of aphanomyces root rot resistance in lentil by QTL mapping and genome-wide association study. Int. J. Mol. Sci. 6, 2129. doi: 10.3390/ijms21062129
Mccouch, S. R., Cho, Y. G., Yano, M., Paul, E., Blinstrub, M., Morishima, H., et al. (1997). Report on QTL nomenclature. Rice Genetics Newsletter 14. (Cornell University in New York) Available at: https://www.researchgate.net/publication/359392093.
Mckenna, A., Hanna, M., Banks, E., Sivachenko, A., Cibulskis, K., Kernytsky, A., et al. (2010). The genome analysis toolkit: a mapreduce framework for analyzing next-generation DNA sequencing data. Genome Res. 20, 1297–1303. doi: 10.1101/gr.107524.110
Minic, Z., Rihouey, C., Do, C. T., Lerouge, P., Jouanin, L. (2004). Purification and characterization of enzymes exhibiting b-d-xylosidase activities in stem tissues of Arabidopsis l. Plant Physiol. 135, 867–878. doi: 10.1104/pp.104.041269
Nimmakayala, P., Abburi, V. L., Bhandary, A., Abburi, L., Reddy, U. K. (2014). Use of veracode 384-plex assays for watermelon diversity analysis and integrated genetic map of watermelon with single nucleotide polymorphisms and simple sequence repeats. Mol. Breeding. 34, 537–548. doi: 10.1007/s11032-014-0056-9
Qi, J. (2006). QTL analysis for figure traits and needle traits in Chinese jujube. [Dissertation]. (Hebei Agricultural University) (Baoding in Chinese). doi: 10.7666/d.y933472
Shen, L. Y. (2005). Construction of genetic linkage map and mapping QTL for some traits in Chinese jujube (Ziziphus jujuba mill.). [Dissertation]. (Hebei Agricultural University). (Baoding in Chinese). doi: 10.7666/d.y740160
Sun, R., Chang, Y. S., Yang, F. Q., Wang, Y., Li, H., Zhao, Y. B., et al. (2015). A dense SNP genetic map constructed using restriction site-associated DNA sequencing enables detection of QTLs controlling apple fruit quality. BMC Genomics 16, 747. doi: 10.1186/s12864-015-1946-x
Wang, Z., Gou, X. P. (2020). Receptor-like protein kinases function upstream of MAPKs in regulating plant development. Int. J. Mol. Sci. 21 (20), 7638. doi: 10.3390/ijms21207638
Wang, Z. T., Zhang, Z., Tang, H., Zhang, Q., Li, X., Zhou, G. (2019a). Genetic variation in leaf characters of F1 hybrids of Chinese jujube. Scientia Horticulturae. 244, 372–378. doi: 10.1016/j.scienta.2018.09.042
Wang, Z. T., Zhang, Z., Tang, H. X., Zhang, Q., Zhou, G. F., Li, X. G. (2019). High-density genetic map construction and QTL mapping of leaf and needling traits in Ziziphus jujuba mill. Front. Plant Science. 10, 1424. doi: 10.3389/fpls.2019.01424
Wu, Z., Liang, S., Song, W., Lin, G. Z., Wang, W. G., Zhang, H. Q., et al. (2017). Functional and structural characterization of a receptor-like kinase involved in germination and cell expansion in Arabidopsis. Frotiers in Plant Science 8. doi: 10.3389/fpls.2017.01999
Wu, J., Li, L. T., Li, M., Awais, K. M., Li, X. G., Chen, H., et al. (2014). High-density genetic linkage map construction and identification of fruit-related QTLs in pear using SNP and SSR markers. J. Exp. Botany. 65, 5771–5781. doi: 10.1093/jxb/eru311
Xin, Z., Chen, J. (2012). A high throughput DNA extraction method with high yield and quality. Plant Methods 8, 26. doi: 10.1186/1746-4811-8-26
Xu, L. S. (2012). QTL mapping of fruit traits and superior genotypes selecting in Chinese jujube. (Zizyphus jujuba mill.). [Dissertation]. (Hebei Agricultural University). (Baoding in Chinese). doi: 10.7666/d.y2143668
Xu, Y., Huang, L., Ji, D., Chen, C., Zheng, H., Xie, C. (2015). Construction of a dense genetic linkage map and mapping quantitative trait loci for economic traits of a doubled haploid population of Pyropia haitanensis (bangiales, rhodophyta). BMC Plant Biol. 15, 228. doi: 10.1186/s12870-015-0604-4
Yu, M., Marzougui, A., Coyne, C. J., Sankaran, S., Main, D., Porter, L. D., et al. (2020). Dissecting the genetic architecture of aphanomyces root rot resistance in lentil by QTL mapping and genome-wide association study. Int. J. Mol. Sci. 21, 2129. doi: 10.3390/ijms21062129
Zhang, Z. D. (2016). Optimization of a high-density genetic map for Chinese jujube and QTL mapping for several important traits. [Dissertation]. (Beijing Forestry University). (Beijing in Chinese).
Zhang, L., Du, J. J., Ge, X. L., Cao, D. M., Hu, J. J. (2021). Leaf size development differences and comparative trancriptome analyses of two poplar genotypes. Genes 12 (11), 1775. doi: 10.3390/genes12111775
Zhang, Q. P., Liu, J. C., Liu, W. S., Liu, N., Zhang, Y. P., Xu, M., et al. (2022). Construction of a high-density genetic map and identification of quantitative trait loci linked to fruit quality traits in apricots using specific-locus amplified fragment sequencing. Front. Plant Sci. 13, 798700. doi: 10.3389/fpls.2022.798700
Zhang, Z., Wei, T., Zhong, Y., Li, X. G., Huang, J. (2016). Construction of a high-density genetic map of Ziziphus jujuba mill. using genotyping by sequencing technology. Tree Genet. Genomes. 12, 76. doi: 10.1007/s11295-016-1032-9
Zhang, R. P., Wu, J., Li, X. G., Awais Khan, M. (2012). SRAP and SSR genetic linkage map and identification of QTLs for fruit traits in pear (Pyrus l.). Plant Mol. Biol. Reporter. 31, 678–687. doi: 10.1007/s11105-012-0544-1
Zhang, S. W., Yu, Z. P., Qi, X. J., Wang, Z., Zheng, Y. Y., Ren, H. Y., et al. (2021a). Construction of a high-density genetic map and identification of leaf trait-related QTLs in Chinese bayberry (Myrica rubra). Front. Plant Science. 12, 675855. doi: 10.3389/fpls.2021.675855
Zhang, Z., Zhang, Y., Sun, L., Qiu, G., Sun, Y. J., Zhu, Z. C., et al. (2018). Construction of a genetic map for Citrullus lanatus based on CAPS markers and mapping of three qualitative traits. Scientia Horticulturae. 233, 532–538. doi: 10.1016/j.scienta.2017.10.029
Zhao, J., Jian, J., Liu, G., Wang, J., Lin, M., Ming, Y., et al. (2014). Rapid SNP discovery and a rad-based high-density linkage map in jujube (Ziziphus mill.). PloS One 9, e109850. doi: 10.1371/journal.pone.0109850
Zhou, S., Yang, T., Mao, Y., Liu, Y., Chen, J. (2021). The f-box protein mio1/slb1 regulates organ size and leaf movement in Medicago truncatula. J. Exp. Botany. 72, 2995–3011. doi: 10.1093/jxb/erab033
Keywords: Genetic map, Ziziphus jujuba mill, Whole-genome resequencing (WGR), Leaf traits, qtl
Citation: Yan F, Luo Y, Bao J, Pan Y, Wang J, Wu C and Liu M (2022) Construction of a highly saturated genetic map and identification of quantitative trait loci for leaf traits in jujube. Front. Plant Sci. 13:1001850. doi: 10.3389/fpls.2022.1001850
Received: 24 July 2022; Accepted: 12 September 2022;
Published: 06 October 2022.
Edited by:
Rongling Wu, The Pennsylvania State University (PSU), United StatesReviewed by:
Wenchong Chen, Zhejiang Agriculture and Forestry University, ChinaXiaoming Pang, Beijing Forestry University, China
Changdeng Yang, China National Rice Research Institute, (CAAS), China
Copyright © 2022 Yan, Luo, Bao, Pan, Wang, Wu and Liu. This is an open-access article distributed under the terms of the Creative Commons Attribution License (CC BY). The use, distribution or reproduction in other forums is permitted, provided the original author(s) and the copyright owner(s) are credited and that the original publication in this journal is cited, in accordance with accepted academic practice. No use, distribution or reproduction is permitted which does not comply with these terms.
*Correspondence: Cuiyun Wu, d2N5YnlAMTYzLmNvbQ==; Mengjun Liu, bG1qMTIzNDU2N0BhbGl5dW4uY29t
†These authors have contributed equally to this work