
94% of researchers rate our articles as excellent or good
Learn more about the work of our research integrity team to safeguard the quality of each article we publish.
Find out more
ORIGINAL RESEARCH article
Front. Plant Sci. , 08 February 2022
Sec. Plant Physiology
Volume 12 - 2021 | https://doi.org/10.3389/fpls.2021.809046
Leaves acclimate to day-to-day fluctuating levels of photosynthetic photon flux density (PPFD) by adjusting their morphological and physiological parameters. Accurate estimation of these parameters under day-to-day fluctuating PPFD conditions benefits crop growth modeling and light environment management in greenhouses, although it remains challenging. We quantified the relationships between day-to-day PPFD changes over 6 days and light acclimation parameters for cucumber seedling leaves, including leaf mass per area (LMA), chlorophyll (Chl) a/b ratio, maximum net photosynthetic rate (Pnmax), maximum rate of ribulose-1,5-bisphosphate (RuBP) carboxylase/oxygenase (Vcmax), and maximum rate of electron transport (Jmax). The last two parameters reflect the capacity of the photosynthetic partial reactions. We built linear regression models of these parameters based on average or time-weighted averages of daily PPFDs. For time-weighted averages of daily PPFDs, the influence of daily PPFD was given a specific weight. We employed three types of functions to calculate this weight, including linear, quadratic, and sigmoid derivative types. We then determined the trend of weights that estimated each parameter most accurately. Moreover, we introduced saturating functions to calibrate the average or time-weighted averages of daily PPFDs, considering that light acclimation parameters are usually saturated under high PPFDs. We found that time-weighted average PPFDs, in which recent PPFD levels had larger weights than earlier levels, better estimated LMA than average PPFDs. This suggests that recent PPFDs contribute more to LMA than earlier PPFDs. Except for the Chl a/b ratio, the average PPFDs estimated Pnmax, Vcmax, and Jmax with acceptable accuracy. In contrast, time-weighted averages of daily PPFDs did not improve the estimation accuracy of these four parameters, possibly due to their low response rates and plasticity. Calibrating functions generally improved estimation of Chl a/b ratio, Vcmax, and Jmax because of their saturating tendencies under high PPFDs. Our findings provide a reasonable approach to quantifying the extent to which the leaves acclimate to day-to-day fluctuating PPFDs, especially the extent of LMA.
The photosynthetic photon flux density (PPFD) of sunlight fluctuates at various time scales, from seconds to months. Plant leaves can sense fluctuations in PPFD and adjust their foliar properties to better fit the changing PPFD levels. This adjustment that occurs in the long term (e.g., from days to months) has been defined as light acclimation and is thought to be beneficial for leaf growth under given light environments. For example, leaves acclimated to low PPFD levels tend to show a lower leaf mass per area (LMA) and thickness (Björkman and Holmgren, 1963; Clough et al., 1979), a lower chlorophyll (Chl) a/b ratio (Boardman, 1977; Rozendaal et al., 2006), and a lower maximum net photosynthetic rate (Pnmax) (McCree and Troughton, 1966). These traits contribute to increasing light interception and absorption per leaf and photosynthesis, with the efficient use of nitrogen in the photosynthetic components (Field, 1983). Conversely, leaves acclimated to high PPFD levels tend to be thick and have a high LMA (Boardman, 1977; Wu et al., 2018), a high Chl a/b ratio (Boardman, 1977; Kitajima and Hogan, 2003), and high Pnmax (McCree and Troughton, 1966). These properties are beneficial to leaves under high PPFD levels because of a higher photosynthetic rate per leaf area and less possibility of high light damage (Szechyńska-Hebda et al., 2010; Talhouët et al., 2020). These light acclimation responses are important not only to wild species in natural habitats, but also to crops cultivated in open fields and greenhouses.
Although the morphological and physiological parameters of leaves acclimated to the aforementioned contrasting PPFDs are well known, how plants utilize previously experienced PPFD information to alter these parameters remains poorly understood. In particular, the quantitative link between PPFD changes and the extent of acclimation responses has not been fully determined. Quantifying this link would be of help not only to understand the physiological mechanism of light acclimation, but also to improve the crop growth models (e.g., Jones et al., 1991, 2003; Heuvelink, 2005; Yin and van Laar, 2005; Wu et al., 2016) to better predict growth and yield. In addition, this quantification can contribute to improving light environmental management in greenhouses. Most studies estimating the extent of light acclimation responses have been conducted in wild vegetation and open fields or greenhouses using fluctuating sunlight PPFD (Valladares et al., 2000; Dias et al., 2018; Baer et al., 2020; Deguchi and Koyama, 2020). The problem with this approach is that environmental factors other than PPFD, such as light spectrum, temperature, and wind, cannot be fully controlled. Thus, experimental reproducibility is not ensured. However, growth chamber experiments with artificial lighting can solve this problem (Vialet-Chabrand et al., 2017; Flannery et al., 2021; Wei et al., 2021). Moreover, in most cases the PPFD levels in growth chambers during the light period are set at a constant level throughout the experiment and do not fluctuate, as does those of sunlight. In our previous study (Yu et al., 2022), cucumber seedlings were grown in growth chambers, and their leaves were treated with day-to-day changing PPFDs (constant within each light period). Light was provided by white light-emitting diodes (LEDs). We evaluated the LMA, Chl a/b ratio, maximum rate of ribulose-1,5-bisphosphate carboxylase/oxygenase (Vcmax), and maximum rate of electron transport (Jmax). We found that time-weighted averages of daily PPFD estimated the extent of light acclimation responses better than the simple average PPFD. This strongly suggests that the extent of light acclimation responses can be quantitatively estimated by appropriately incorporating the characteristics of day-to-day PPFD changes.
However, there are several aspects of our previous study that required improvement. First, leaves experienced three daily PPFD levels, each lasting for 2 days. Treatments with randomly assigned PPFD levels during the light period per day would help validate our models under more distinctly day-to-day changing PPFD levels. Second, to assign an appropriate weight to each of the daily PPFD levels, we tested four types of weight functions: linear, exponential, quadratic, and saturating. All functions showed similar accuracy in estimating LMA and Chl a/b ratio. A possible reason could be that although these functions vary in their trend shapes, they are all monotonic and reach their maximum on the day before the measurement. We hypothesized that plants have “fading memories” for PPFD levels experienced over time. This assumption might be appropriate for the LMA, which is considered highly plastic (Poorter et al., 2009), and to respond quickly to PPFD changes (Noguchi et al., 2001; Zhang et al., 2017), especially for young growing leaves. Conversely, for other parameters such as Chl a/b ratio, which usually responds at a lower rate and plasticity (De la Torre and Burkey, 1990; Trouwborst et al., 2010), it is physiologically reasonable that a clear response takes several days (Turnbull et al., 1993). In this situation, the possibility that the influence of daily PPFD peaks in several days before the measurement, rather than a day before, needs to be tested.
Therefore, the purpose of this study was to estimate leaf parameters of acclimation responses using linear regression models on time-weighted averages of daily PPFDs and to determine the weight-per-day trend, which reasonably estimated these parameters when leaves were subjected to day-to-day PPFD changes. We conducted two experiments, both with 6-day PPFD treatments. In the first experiment, daily PPFD in the light period per day was randomly assigned in the range of 100–700 μmol m–2 s–1. In the second experiment, leaves were subjected to treatments in which a PPFD level different from the basal PPFD levels was assigned to only 1 day, either the fourth, fifth, or sixth day. The reason why treatments with a different PPFD on the first, second, or third day were not included was based on the assumption that the PPFD levels in the early half of the treatment period are not likely to contribute more than those in the later half. We evaluated light acclimation response parameters, including LMA, Chl a/b ratio, Pnmax, Vcmax, and Jmax. We built linear regression models of these parameters based on average or time-weighted averages of daily PPFDs. To test whether weight functions with a peak several days before the measurement could better estimate these parameters, we calculated time-weighted averages of daily PPFDs with one of the three types of weight functions: linear, quadratic, or sigmoid derivative—the last two functions can be convex-upward with a peak. Finally, considering that leaf acclimation parameters usually saturate under high PPFDs, we tested whether referring this information by calibrating average or time-weighted averages of daily PPFDs via saturating functions prior to building the estimation models further improved the accuracy.
Seeds of cucumber (Cucumis sativus L.) cultivar “Hokushin” (Takii Co., Ltd., Kyoto, Japan) were sown in plug trays filled with commercial rockwool cubes (Grodan Delta, Grodan, Roermond, Netherlands) and were grown in temperature-controlled growth chambers (MIR-553, Sanyo Electric Co., Ltd., Osaka, Japan). Phosphor-converted white LED (GSPW1651NSE-E0Y-YPW Stanley Electric Co., Ltd., Tokyo, Japan; spectral distribution of photon flux density is shown in Supplementary Figure 1) panels were placed in the growth chambers as the light source.
The environment in the growth chambers was set as follows: PPFD was measured at the level of the upper surface of the rockwool cubes, 15 cm below the LED panel, using a light quantum sensor (LI-190R, Li-Cor Inc., Lincoln, NE, United States) set at 300 μmol m–2 s–1; daily light/dark periods were 16/8 h; air temperatures were 25°C for the light period and 20°C for the dark period. Ambient air was continuously pumped into the growth chambers at a flow rate of 6 L min–1 using air pumps (APN-100R, Iwaki Co., Ltd., Tokyo, Japan) to maintain a CO2 concentration of ∼400 μmol mol–1. The relative humidity was 70% or higher throughout the day. Rockwool cubes were irrigated with 2 L of tap water in plastic cultivation trays (40 × 32 × 7.5 cm) until the seeds were germinated, and then with 2 L of commercial nutrient solution (OAT prescription A, OAT Agrio Co., Ltd., Tokyo, Japan) with an electrical conductivity of 190 mS m–1 and pH of 6.4 every 2 days. Once the seeds were germinated, the distance between the LED panels and seedling cotyledons was kept at 15 cm by adjusting the distance between the LED panels and the cultivation tray every 2 days.
The first true seedling leaves were subjected to treatments at the end of the 10th day after sowing, when they were fully unfolded and had started to expand. The distance between the LED panels and the leaves was maintained at 15 cm. The environmental conditions, other than PPFD, in the treatment period were the same as those for the seedling-raising period. For both experiments, four plants were treated from the 11th to the 16th day after sowing, and three plants were collected for measurement on the 17th day after sowing per treatment. In the first experiment, plants were subjected to 12 PPFD treatments for 6 days. The PPFD level during the light period was held constant at 100, 200, 300, 400, 500, 600, or 700 μmol m–2 s–1. One of these seven PPFD levels was randomly assigned in each light period of the 6 days of treatment. The treatment numbers and details are presented in Supplementary Table 1. Due to our limited experimental capacity, these 12 treatments were not conducted simultaneously, but were divided into two cultivation experiments. Each cultivation experiment comprised of 6 of these 12 treatments and a common treatment with a PPFD of 100 μmol m–2 s–1 (treatment CL) in all the light periods. In the two cultivation experiments, CL treatment served as the standard for data relativization. For example, the relative LMA of a treatment was calculated as the ratio of the absolute value of LMA for that treatment to that of the CL treatment.
In the second experiment, the PPFD level during the light period in 5 days of the 6-day period was held constant as the basal PPFD level, and was one of the three PPFD levels of 100, 400, and 700 μmol m–2 s–1. For each treatment, one of these three PPFD levels, which differed from the basal PPFD level, was assigned on either the fourth, fifth, or sixth day of the period. The details of the PPFD setting for all the treatments are shown in Supplementary Table 2. The environmental conditions, other than PPFD, were the same as those used in the first experiment. All treatments were evenly divided into three cultivation experiments, each of which contained six treatments in addition to the two reference treatments with basal PPFD levels per light period in all the 6 days. In the two former cultivation experiments, treatment CL served as the standard for data relativization. In the last cultivation experiment, CL was not included due to our limited experimental capacity. Reference treatment CM (with a constant PPFD of 400 μmol m–2 s–1 in the light period per day) served as the primary standard of relativization; data in this cultivation experiment were relativized as the ratio of the measured values of each treatment to that of the treatment CM, multiplied by the ratio of those of treatment CM to treatment CL in the first cultivation experiment.
The methods used to measure the LMA and Chl a/b ratio were the same as those used by Yu et al. (2022). The LMA was calculated as the ratio of leaf dry mass to leaf area (n = 3). The Chl a and b content per leaf area was determined, and the molar Chl a/b ratio was calculated according to the method of Porra et al. (1989) (n = 3).
We determined the leaf photosynthetic CO2 response curves and estimated parameters including Pnmax, Vcmax, and Jmax, according to the FvCB biochemical model of photosynthesis (Farquhar et al., 1980; Sharkey, 1985). This model demonstrates that the net photosynthetic rate is limited by a minimum of three rates: Vcmax, Jmax, or the rate of triose-phosphate utilization (TPU). We did not consider TPU parameter because the TPU limitation requires a high intercellular CO2 concentration (von Caemmerer, 2000), which was unlikely to occur in our cultivation environment. The method used to measure these parameters was similar to that of Yu et al. (2022), with some minor changes. Photosynthetic CO2 response curves of the first true leaves were measured on the day after the treatment period (the 17th day after sowing) using a portable photosynthesis measurement system (LI-6800 FP/M, LiPCor Inc.), according to the rapid A-Ci response (RACiR) method (Stinziano et al., 2017) (n = 3). In the RACiR method, the CO2 concentration in the reference chamber ([CO2]Ref) is changed continuously to determine the leaf photosynthetic CO2 response curve, a faster method than the conventional steady-state curve method. In a preliminary experiment with nine leaves, the differences in estimated values of Vcmax and Jmax via the RACiR and steady-state methods were not significantly different (paired t-test, p > 0.05, n = 9). The chamber conditions for the measurements were as follows: a gas flow rate of 600 μmol s–1, a leaf-to-air vapor pressure deficit of 1.5 kPa, a leaf temperature of 25°C, and a saturating PPFD of 1,800 μmol m–2 s–1, in which light was provided by a red and blue LED light source (3 × 3 cm, 6800- 2P, red/blue PPFD ratio of 9:1, Lie-Cor Inc.). A point-matching procedure for infrared gas analyzers (IRGAs) was conducted under [CO2]Ref at 400 μmol mol–1 before performing RACiR. Before measurement, each leaf was acclimated in [CO2]Ref at 400 μmol mol–1 and the above-mentioned chamber conditions for at least 10 min to stabilize the leaf net photosynthesis and transpiration. Subsequently, [CO2]Ref was linearly increased from 200 to 1,000 μmol mol–1 over 8 min (at a rate of 100 μmol mol–1 min–1), during which the gas exchange parameters were logged every 2 s. To eliminate the effects of systematic residual delays during the linear change of [CO2]Ref, chamber leakage and match offsets of IRGAs, and an additional CO2 response curve was acquired using the empty leaf chamber under the same chamber conditions, as shown in Supplementary Figure 2. Calibrated leaf CO2 response curves were fitted using the FvCB model. Pnmax at an ambient CO2 concentration (Ca) of 400 μmol mol–1 and at an intercellular CO2 concentration (Ci) of 400 μmol mol–1, Vcmax, and Jmax were then estimated using the R package “plantecophys” (ver. 1.4-4, Duursma, 2015) in R software (ver. 3.6.2, R Core Team). The mean of coefficient of determination (R2) for a fitting exercise was 0.99 (121 leaves).
We considered the time-weighted averages of daily PPFD (Qw), in which each daily PPFD was weighted depending on how much it contributed to the light acclimation parameters. The influence of PPFD on and before the 10th day after sowing was not considered since our previous study (Yu et al., 2022) indicated that its contributions were small enough to be negligible. Qw was then calculated as the accumulated product of the daily PPFD and its weight, divided by the accumulated weights. Thus, the function of Qw is defined as follows:
where t is the number of days after treatment began (t = 1, 2, …, 6), Q(t) is the PPFD on day t, and W(t) is the weight of PPFD on day t. On the other hand, the average PPFD (Qm) was calculated assuming W(t) was constant irrespective of t:
The function of W(t) for the linear type of Qw (Qwl), Wl(t), is defined as follows:
The functions of W(t) for the quadratic and sigmoid derivative types of Qw (Qwq and Qwsd), Wq(t), and Wsd(t) are defined as follows:
Two other types of Qw were introduced from our previous study: exponential (Qwe) and saturating type (Qws). Their W(t), We(t), and Ws(t) were calculated as follows:
We calibrated Qm and Qw via asymptotic functions. In an asymptotic function adopted from Poorter et al. (2019), the dependent variable approaches a horizontal asymptote in a saturating manner when the independent variable increases. Therefore, the calibration factors CF(Q[t]) were defined as:
The calibrated PPFD on day t (CQ[t]) was calculated as:
Thus, the calibrated Qw (CQw) and calibrated Qm (CQm) were defined as:
The three types of CQw (Qwl, Qwq, and Qwsd) were designated CQwl, CQwq, and CQwsd, respectively.
To determine the best-fit model parameters (a–r in Equations 3–8) for estimating LMA, Chl a/b ratio, Pnmax, Vcmax, or Jmax based on Qm, Qw, CQm, or CQw, we set the initial values to parameters in each weight function and calculated the Qw or CQw. Then we built the linear regression model of each estimated light acclimation parameter using the least-squares method and calculated the root mean squared error (RMSE). At last, we employed the optimization routine to find the parameters that gave the minimum RMSE.
All data were presented as means ± standard errors from three biological replicates. To unbiasedly compare regression models with different quantities of variables, we calculated the adjusted coefficient of determination of regression (2) per model using the degrees of freedom per model. The statistical significance of linear regression models was examined using the F-test (p < 0.05) in R software.
Leaf mass per area and Pnmax responded almost linearly toward constant daily PPFD levels (Figures 1A,B), whereas Chl a/b ratio, Vcmax, and Jmax clearly saturated at high constant daily PPFD levels (Figures 1C–E). Therefore, we calibrated Qm and Qw using asymptotic functions for the estimation models of the Chl a/b ratio, Vcmax, and Jmax.
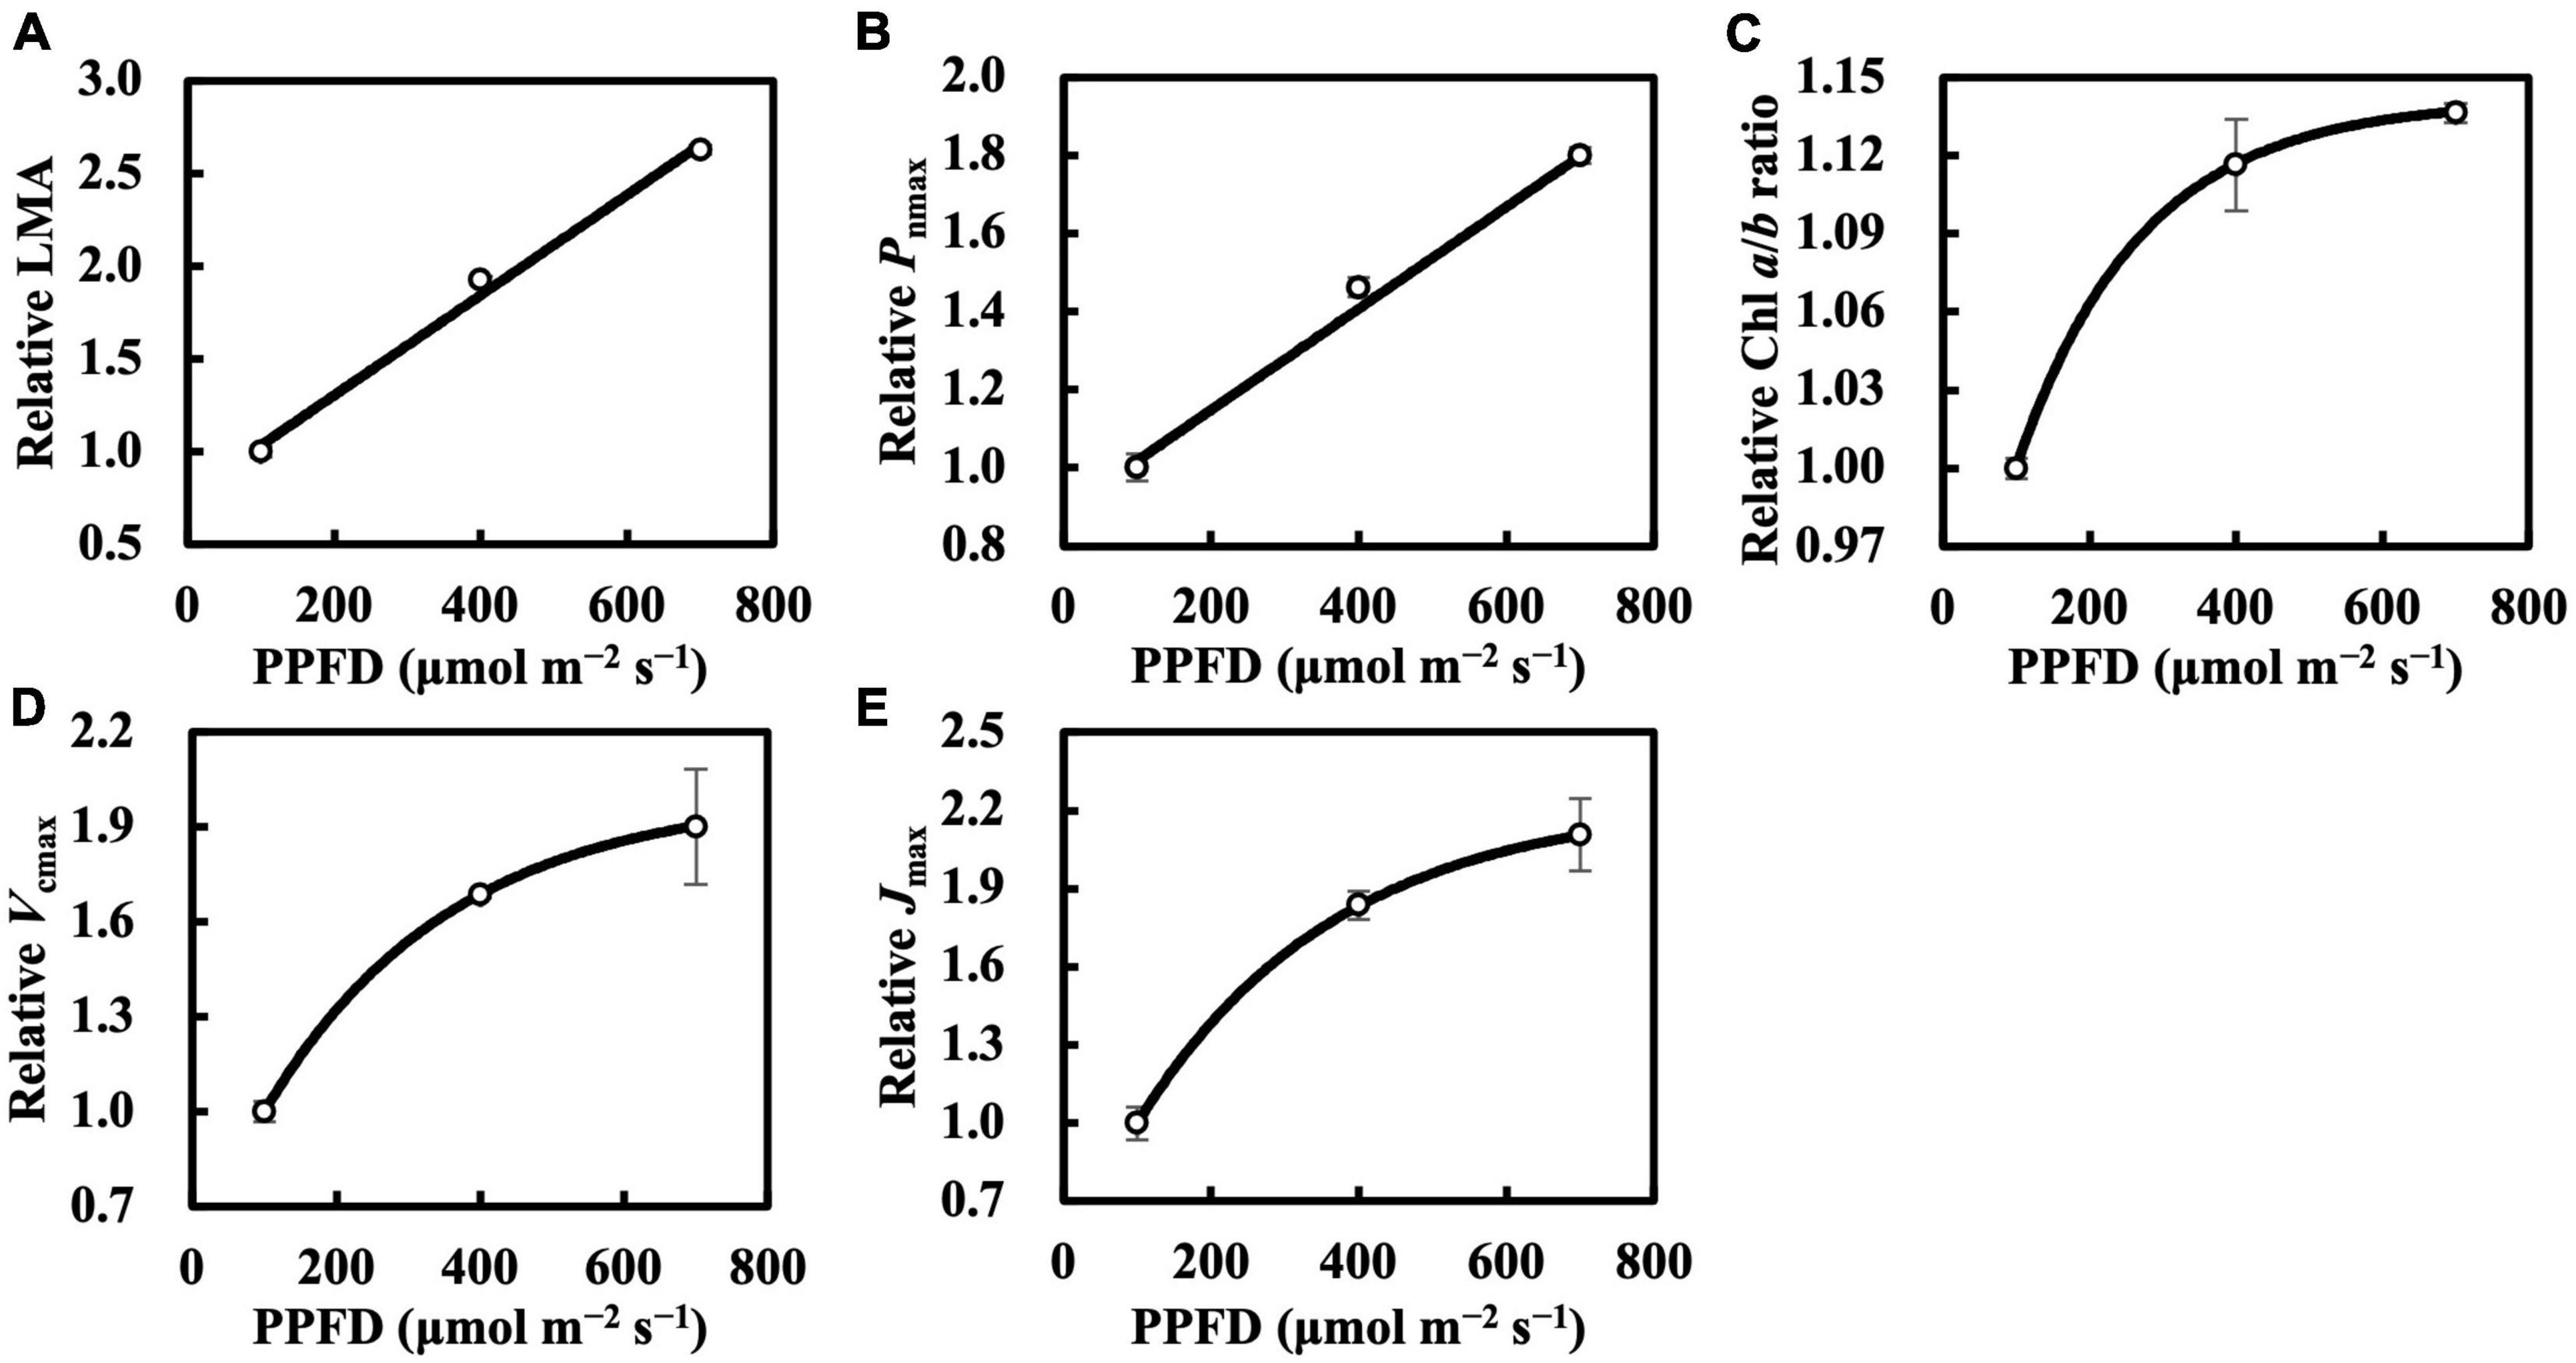
Figure 1. Relative leaf mass per area (LMA) (A), maximum net photosynthetic rate (Pnmax) at Ca of 400 μmol mol–1 (B), chlorophyll (Chl) a/b ratio (C), maximum rate of ribulose-1,5-bisphosphate carboxylase/oxygenase (Vcmax) (D), and maximum rate of electron transport (Jmax) (E) of the first true leaves of cucumber seedlings grown under constant daily photosynthetic photon flux density (PPFD) levels for 6 days. All values were means ± standard errors (n = 3) and relativized to that for 100 μmol m–2 s–1. Measured values (open circles) and estimated values (solid line) fitted with linear (A,B) or asymptotic (C–E) functions are shown. See section “Statistics” for details of asymptotic functions.
In the first experiment, the linear regression of LMA on Qm (Figure 2A) gave a 2 of 0.70 (Table 1), indicating that, to some extent, Qm can estimate the LMA. The linear regression on Qw (either Qwl, Qwq, or Qwsd, in Figures 2B–D) showed higher 2s (0.73, 0.82, and 0.77, respectively) than that on Qm. 2s (Table 1) and RMSEs (Supplementary Table 3) from the linear regression of LMA on Qwe and Qws were comparable to those of other Qw types. However, because their weight trends could be similarly fitted with quadratic or sigmoid derivative functions and not vice versa, they were omitted. The weight of daily PPFD for calculating Qwl, Qwq, and Qwsd is shown in Figures 2B–D. While the curves of weights in Qwl and Qwsd were monotonic, weights in Qwq showed a down-convex curve and had their minimum on the third day. In the second experiment, models with Qwl, Qwq, or Qwsd (Figure 3) estimated LMA with 2s higher than that with Qm (Table 1). These results show a trend approximating that of the first experiment. Time-weighted averages of daily PPFD generally estimated the LMA with higher accuracy than the average PPFD.
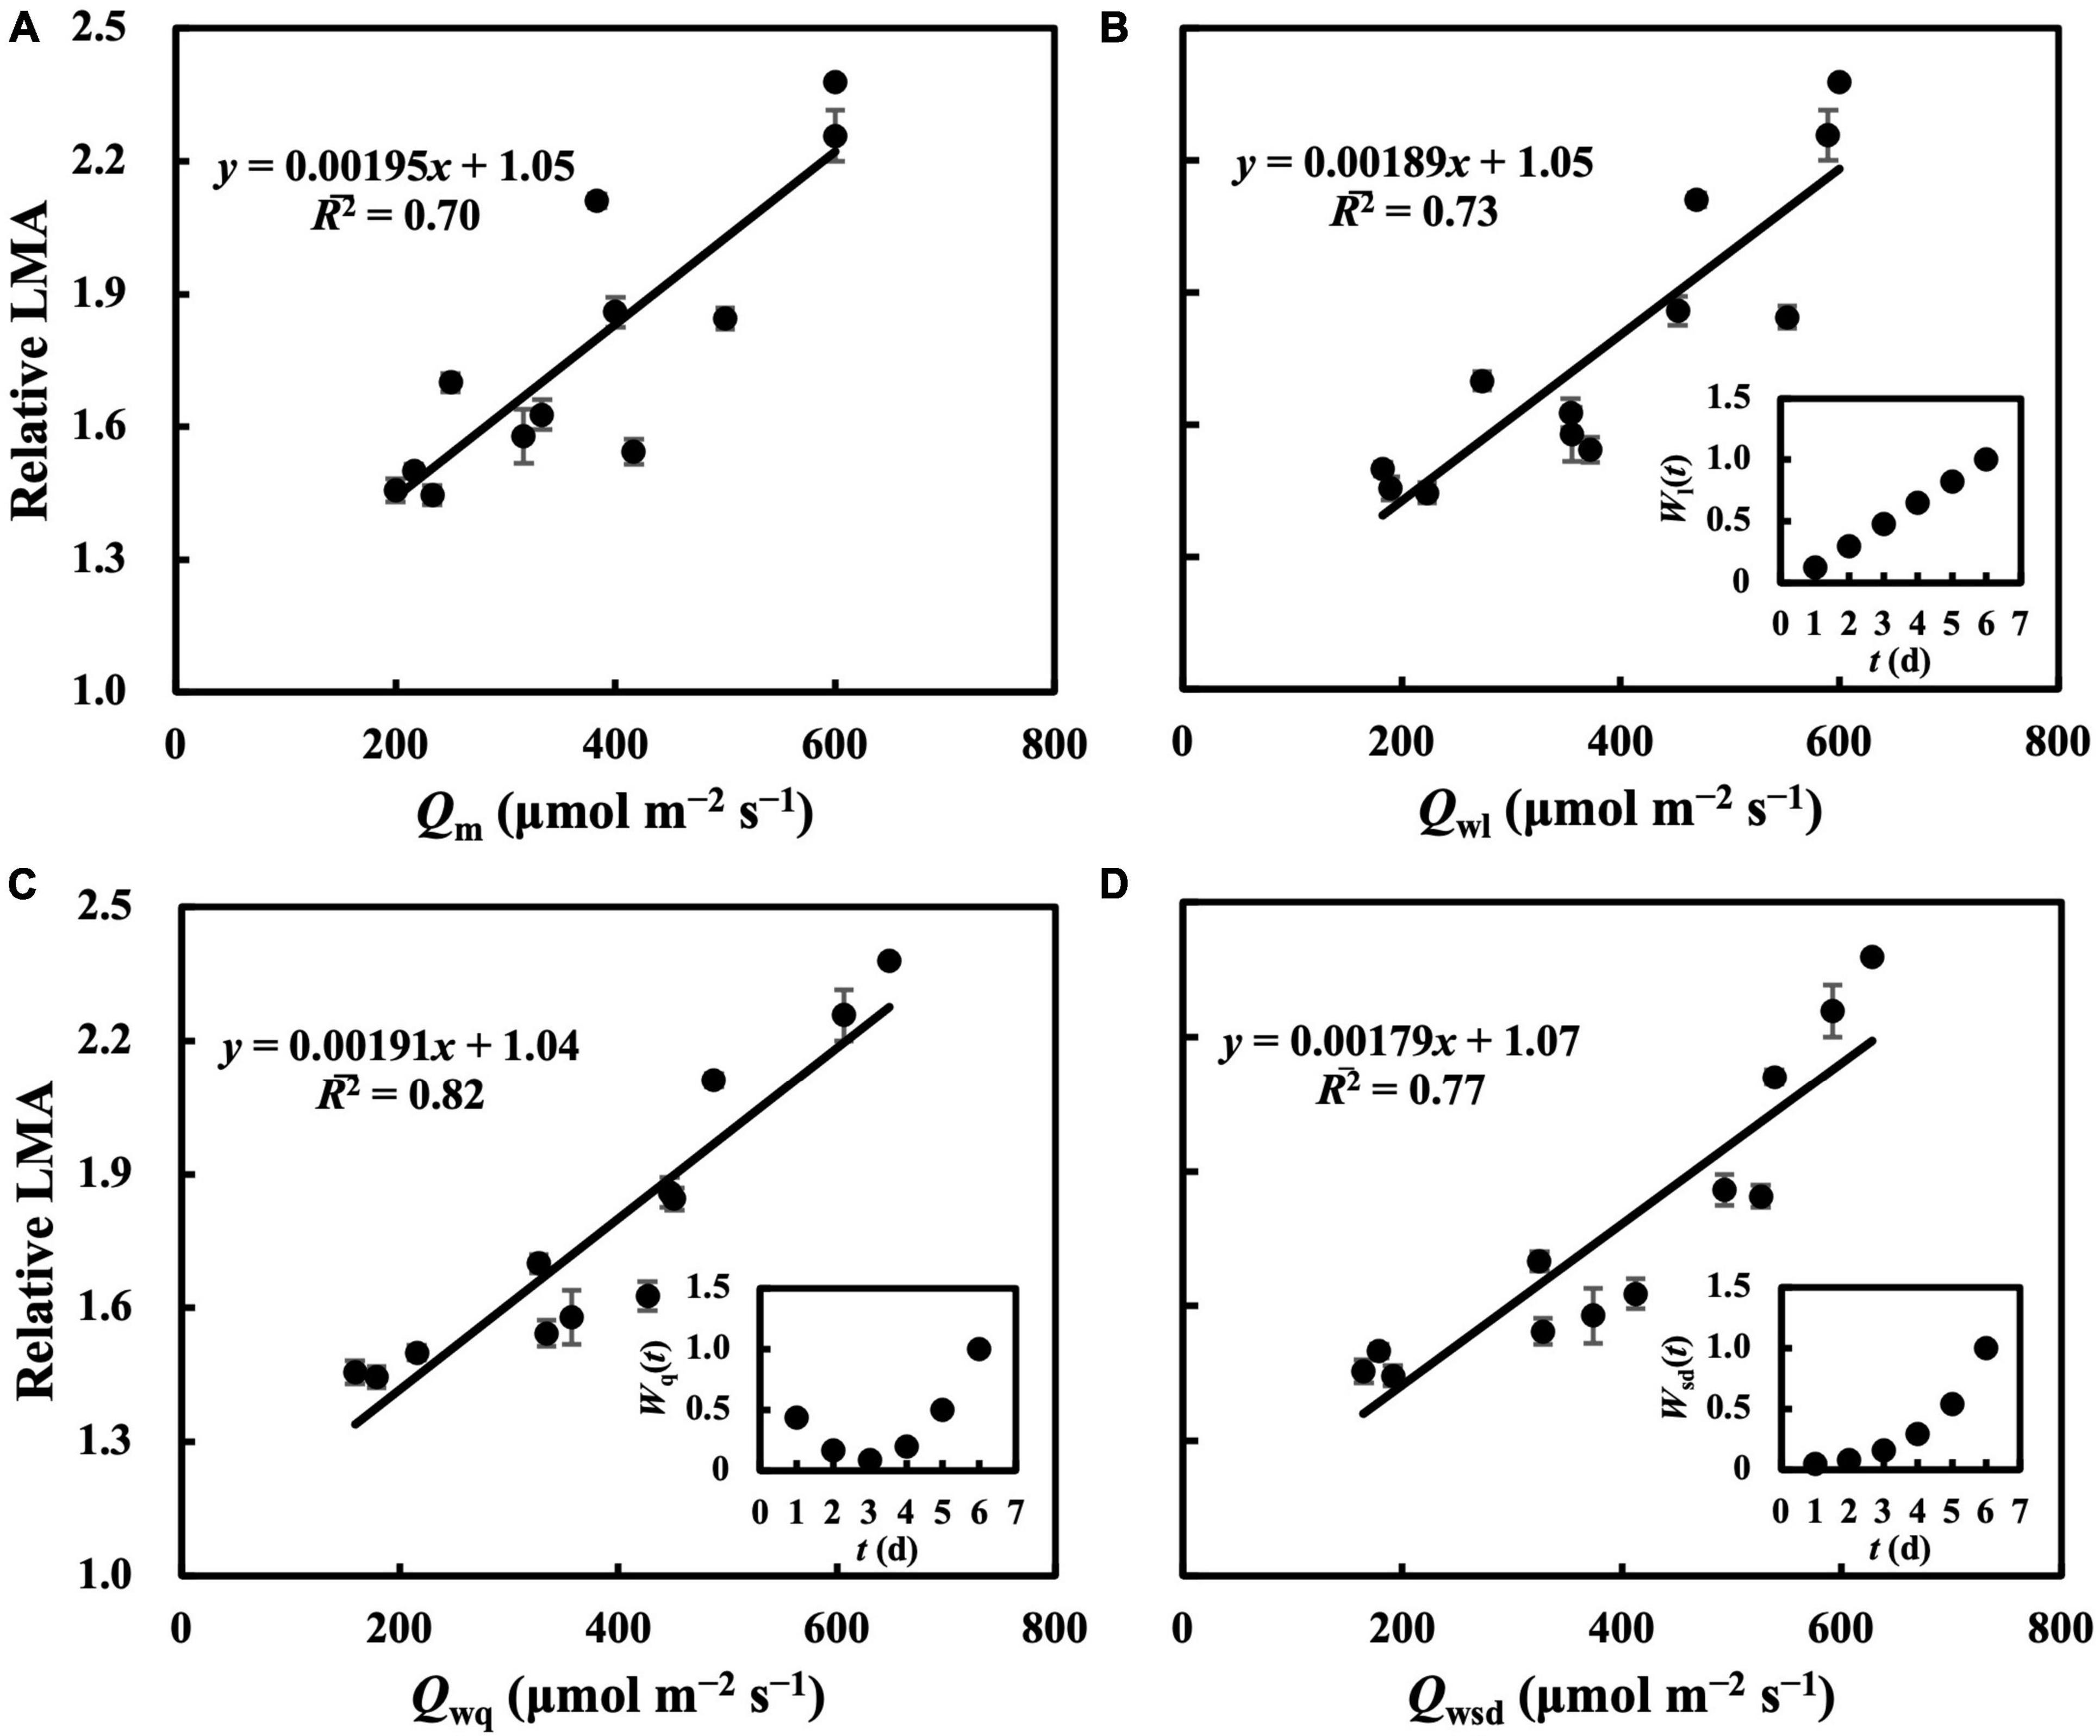
Figure 2. Linear regression of relative LMA on average PPFD (Qm) (A), time-weighted average PPFD in linear type (Qwl) (B), in quadratic type (Qwq) (C), in sigmoid derivative type (Qwsd) (D). First true leaves of cucumber seedlings were acclimated to randomly assigned PPFD treatments in the first experiment. All values were means ± standard errors (n = 3) and relativized to that for 100 μmol m–2 s–1. Regression lines, regression functions, and 2 are shown. Corresponding weights of Qwl [Wl(t)], Qwq [Wq(t)], Qwsd [Wsd(t)] in t day which achieved the minimum RMSEs of estimation of LMA are shown. See section “Statistics” for details of calculation.

Table 1. Coefficient of determination (2) from regression models of light acclimation parameters of cucumber leaves on the average of daily photosynthetic photon flux density (PPFD) (Qm), time-weighted averages of daily PPFD (Qwz), calibrated Qm (CQm y), and calibrated Qw (CQw y).
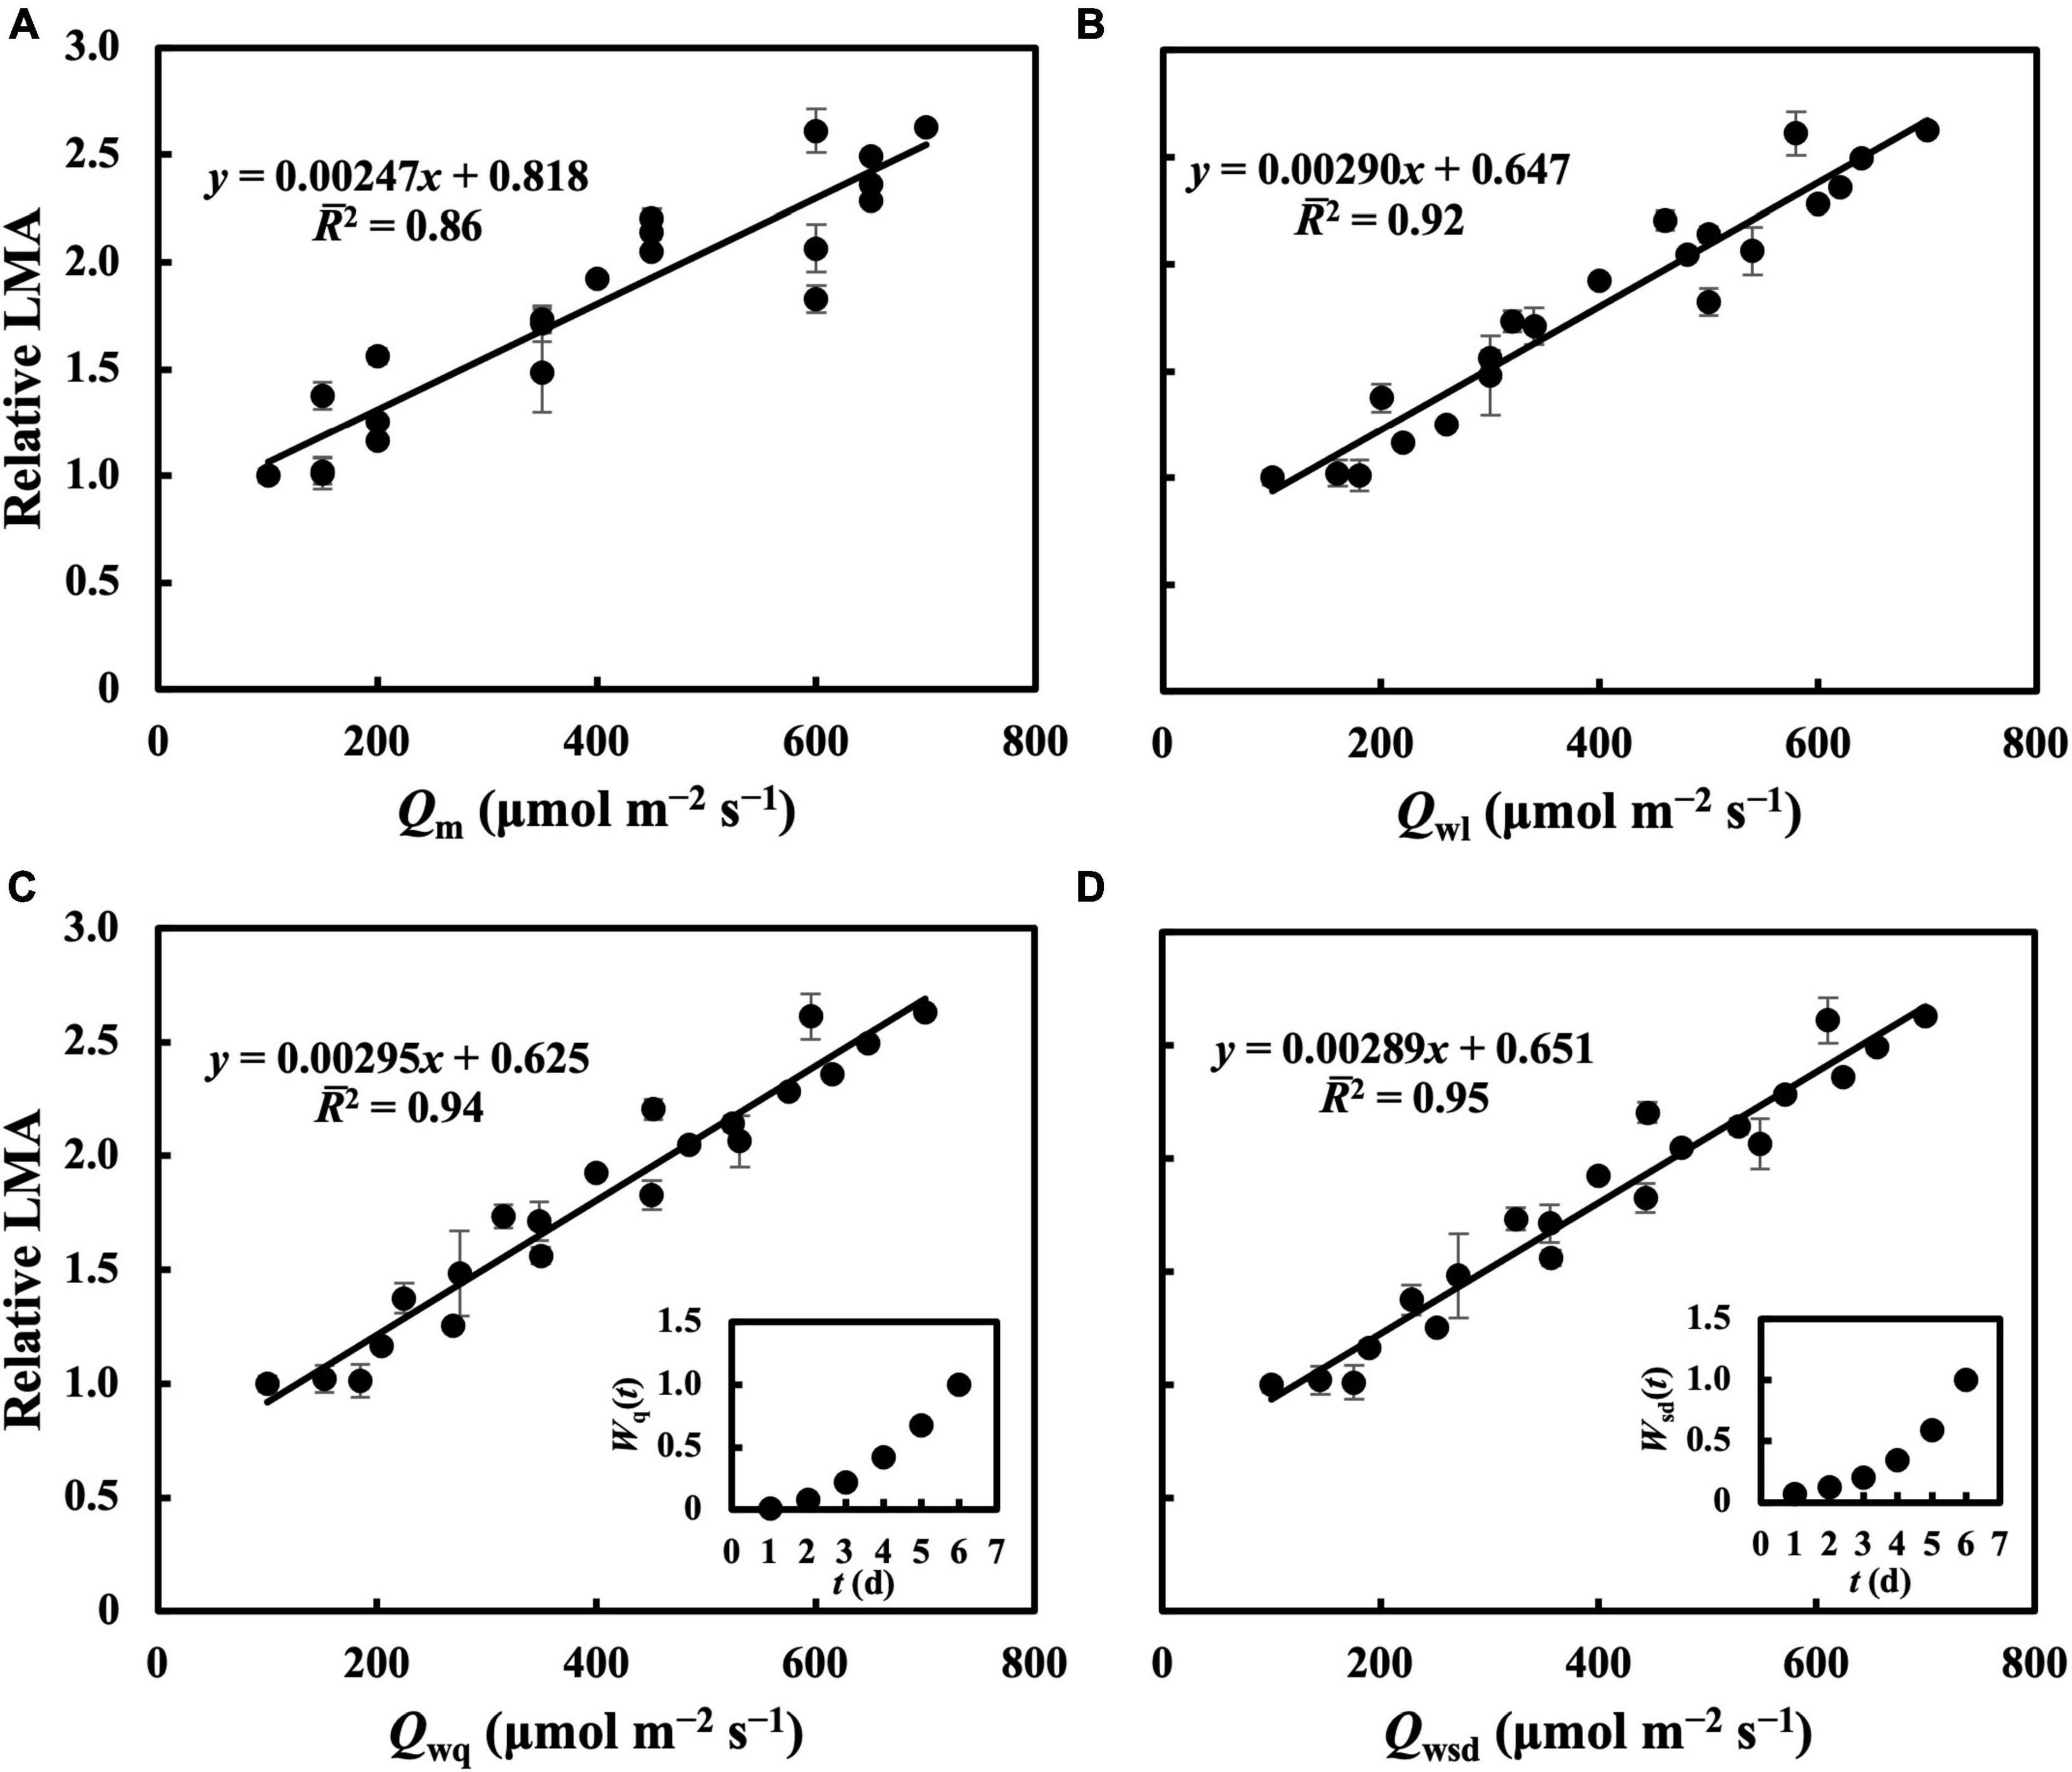
Figure 3. Linear regression of relative LMA on Qm (A), Qwl (B), Qwq (C), Qwsd (D). First true leaves of cucumber seedlings were acclimated to treatments in which 1 day had a PPFD level from basal PPFD levels in other 5 days in the second experiment. All values were means ± standard errors (n = 3) and relativized to that for 100 μmol m–2 s–1. Regression lines, regression functions, and 2 are shown. Corresponding weights of Qwq [Wq(t)], Qwsd [Wsd(t)] in t day which achieved the minimum RMSEs of estimation of LMA are shown.
In the first experiment, the linear regression of the Chl a/b ratio on Qm, Qwl, and Qwsd was not statistically significant (p > 0.05) (Figure 4A and Supplementary Figures 3A,B), indicating that they could not effectively estimate the Chl a/b ratio. Although linear regression of the Chl a/b ratio on Qwq was statistically significant (p < 0.05, Supplementary Figure 3C), the 2 (0.31) was low, implying that Qwq could not be considered appropriate for estimating the Chl a/b ratio. Linear regression of the Chl a/b ratio on CQm, CQwl, CQwsd, and CQwq was statistically insignificant. Therefore, the weight functions that we currently verified did not accurately estimate the Chl a/b ratio. In the second experiment, the linear regression of Chl a/b ratio on Qm and Qw (Figure 4B and Supplementary Figures 3D–F) had 2s of 0.74, 0.73, 0.71, and 0.71, respectively (Table 1). The models of the Chl a/b ratio on CQm, CQwl, CQwq, and CQwsd showed 2s of 0.84, 0.83, 0.82, and 0.82, respectively (Table 1). CQm estimated the Chl a/b ratio with high accuracy, and none of the CQw further improved this estimation.
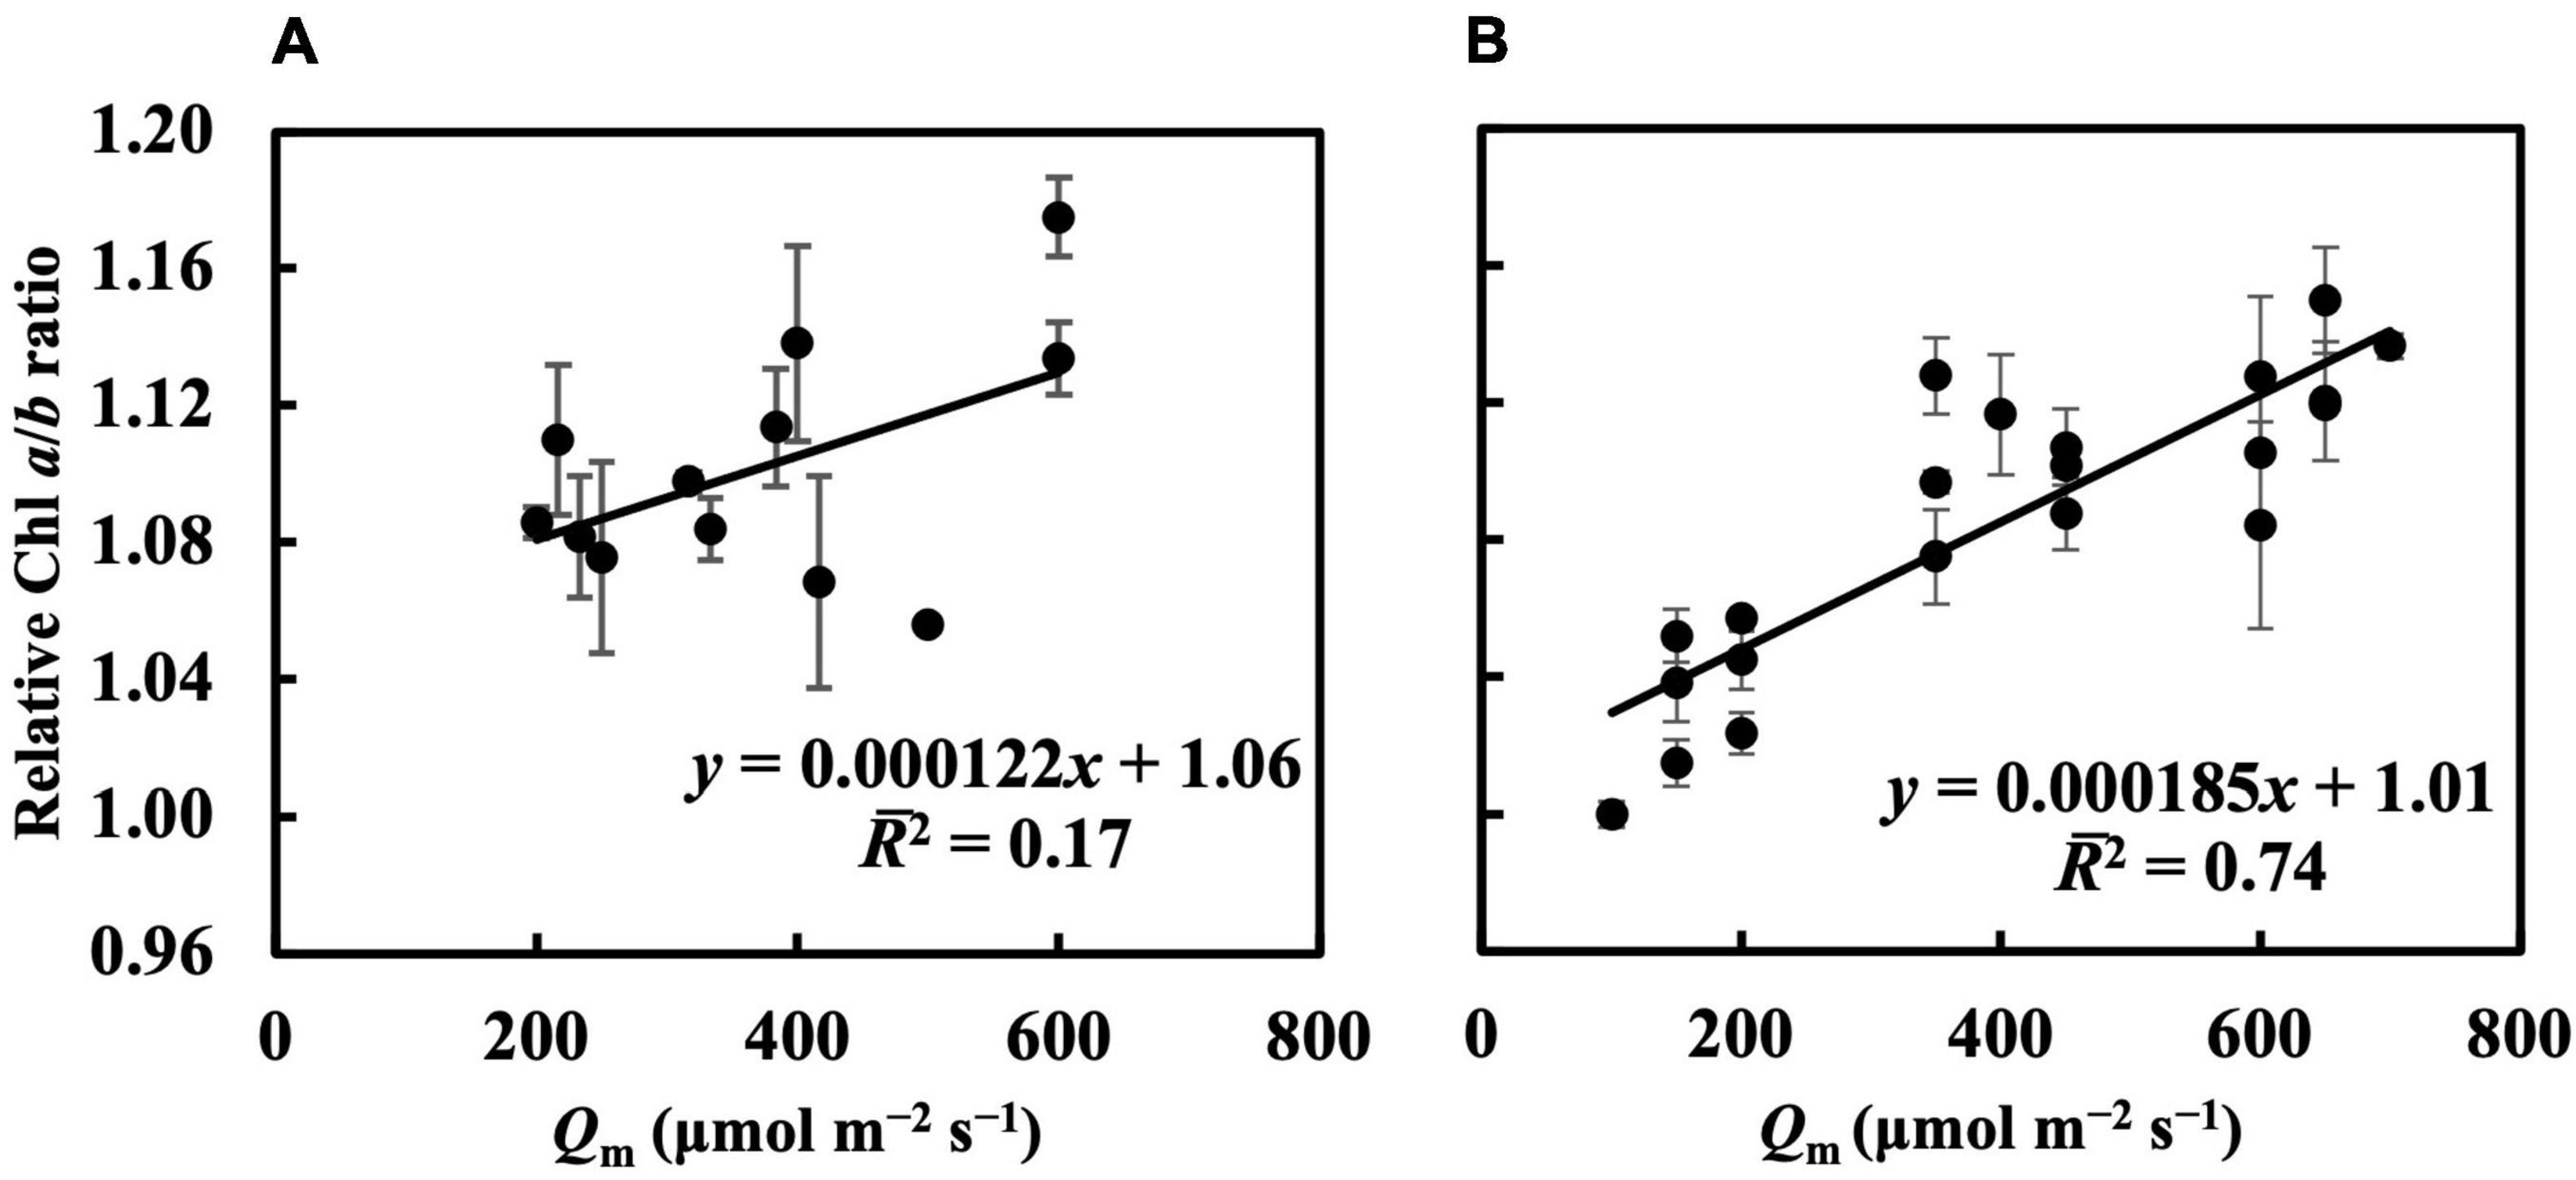
Figure 4. Linear regression of relative Chl a/b ratio on Qm in the first (A) and second (B) experiment (see section “Treatments” for the details of treatment setting in each experiment). All values were means ± standard errors (n = 3) and relativized to that for 100 μmol m–2 s–1. Regression lines, regression functions, and 2 are shown.
In the first experiment, the linear regression of Pnmax, Vcmax, and Jmax on Qm (Figures 5A–C) had 2s of 0.65, 0.74, and 0.77, respectively (Table 1). Estimating Pnmax using Qwl, Qwq, or Qwsd (Supplementary Figures 4A–C) gave similar 2s (Table 1). The estimation of Vcmax (Supplementary Figure 5) and Jmax (Supplementary Figure 6) showed results similar to those of Pnmax, indicating that Qm estimated these photosynthetic parameters with accuracy similar to that of Qw. CQm, CQwl, CQwq, and CQwsd estimated Vcmax and Jmax with higher 2s than their uncalibrated counterparts (Table 1). In the second experiment, Qm estimated Pnmax, Vcmax, and Jmax (Figures 5D–F) with 2s of 0.81, 0.76, and 0.67, respectively (Table 1). Again, Qwl, Qwq, or Qwsd estimated Pnmax (Supplementary Figure 4), Vcmax (Supplementary Figure 7), and Jmax (Supplementary Figure 8) with similar accuracy (Table 1). CQm, CQwl, CQwq, and CQwsd estimated Vcmax and Jmax with higher 2s than their uncalibrated counterparts (Table 1). These results were consistent with those of the first experiment.
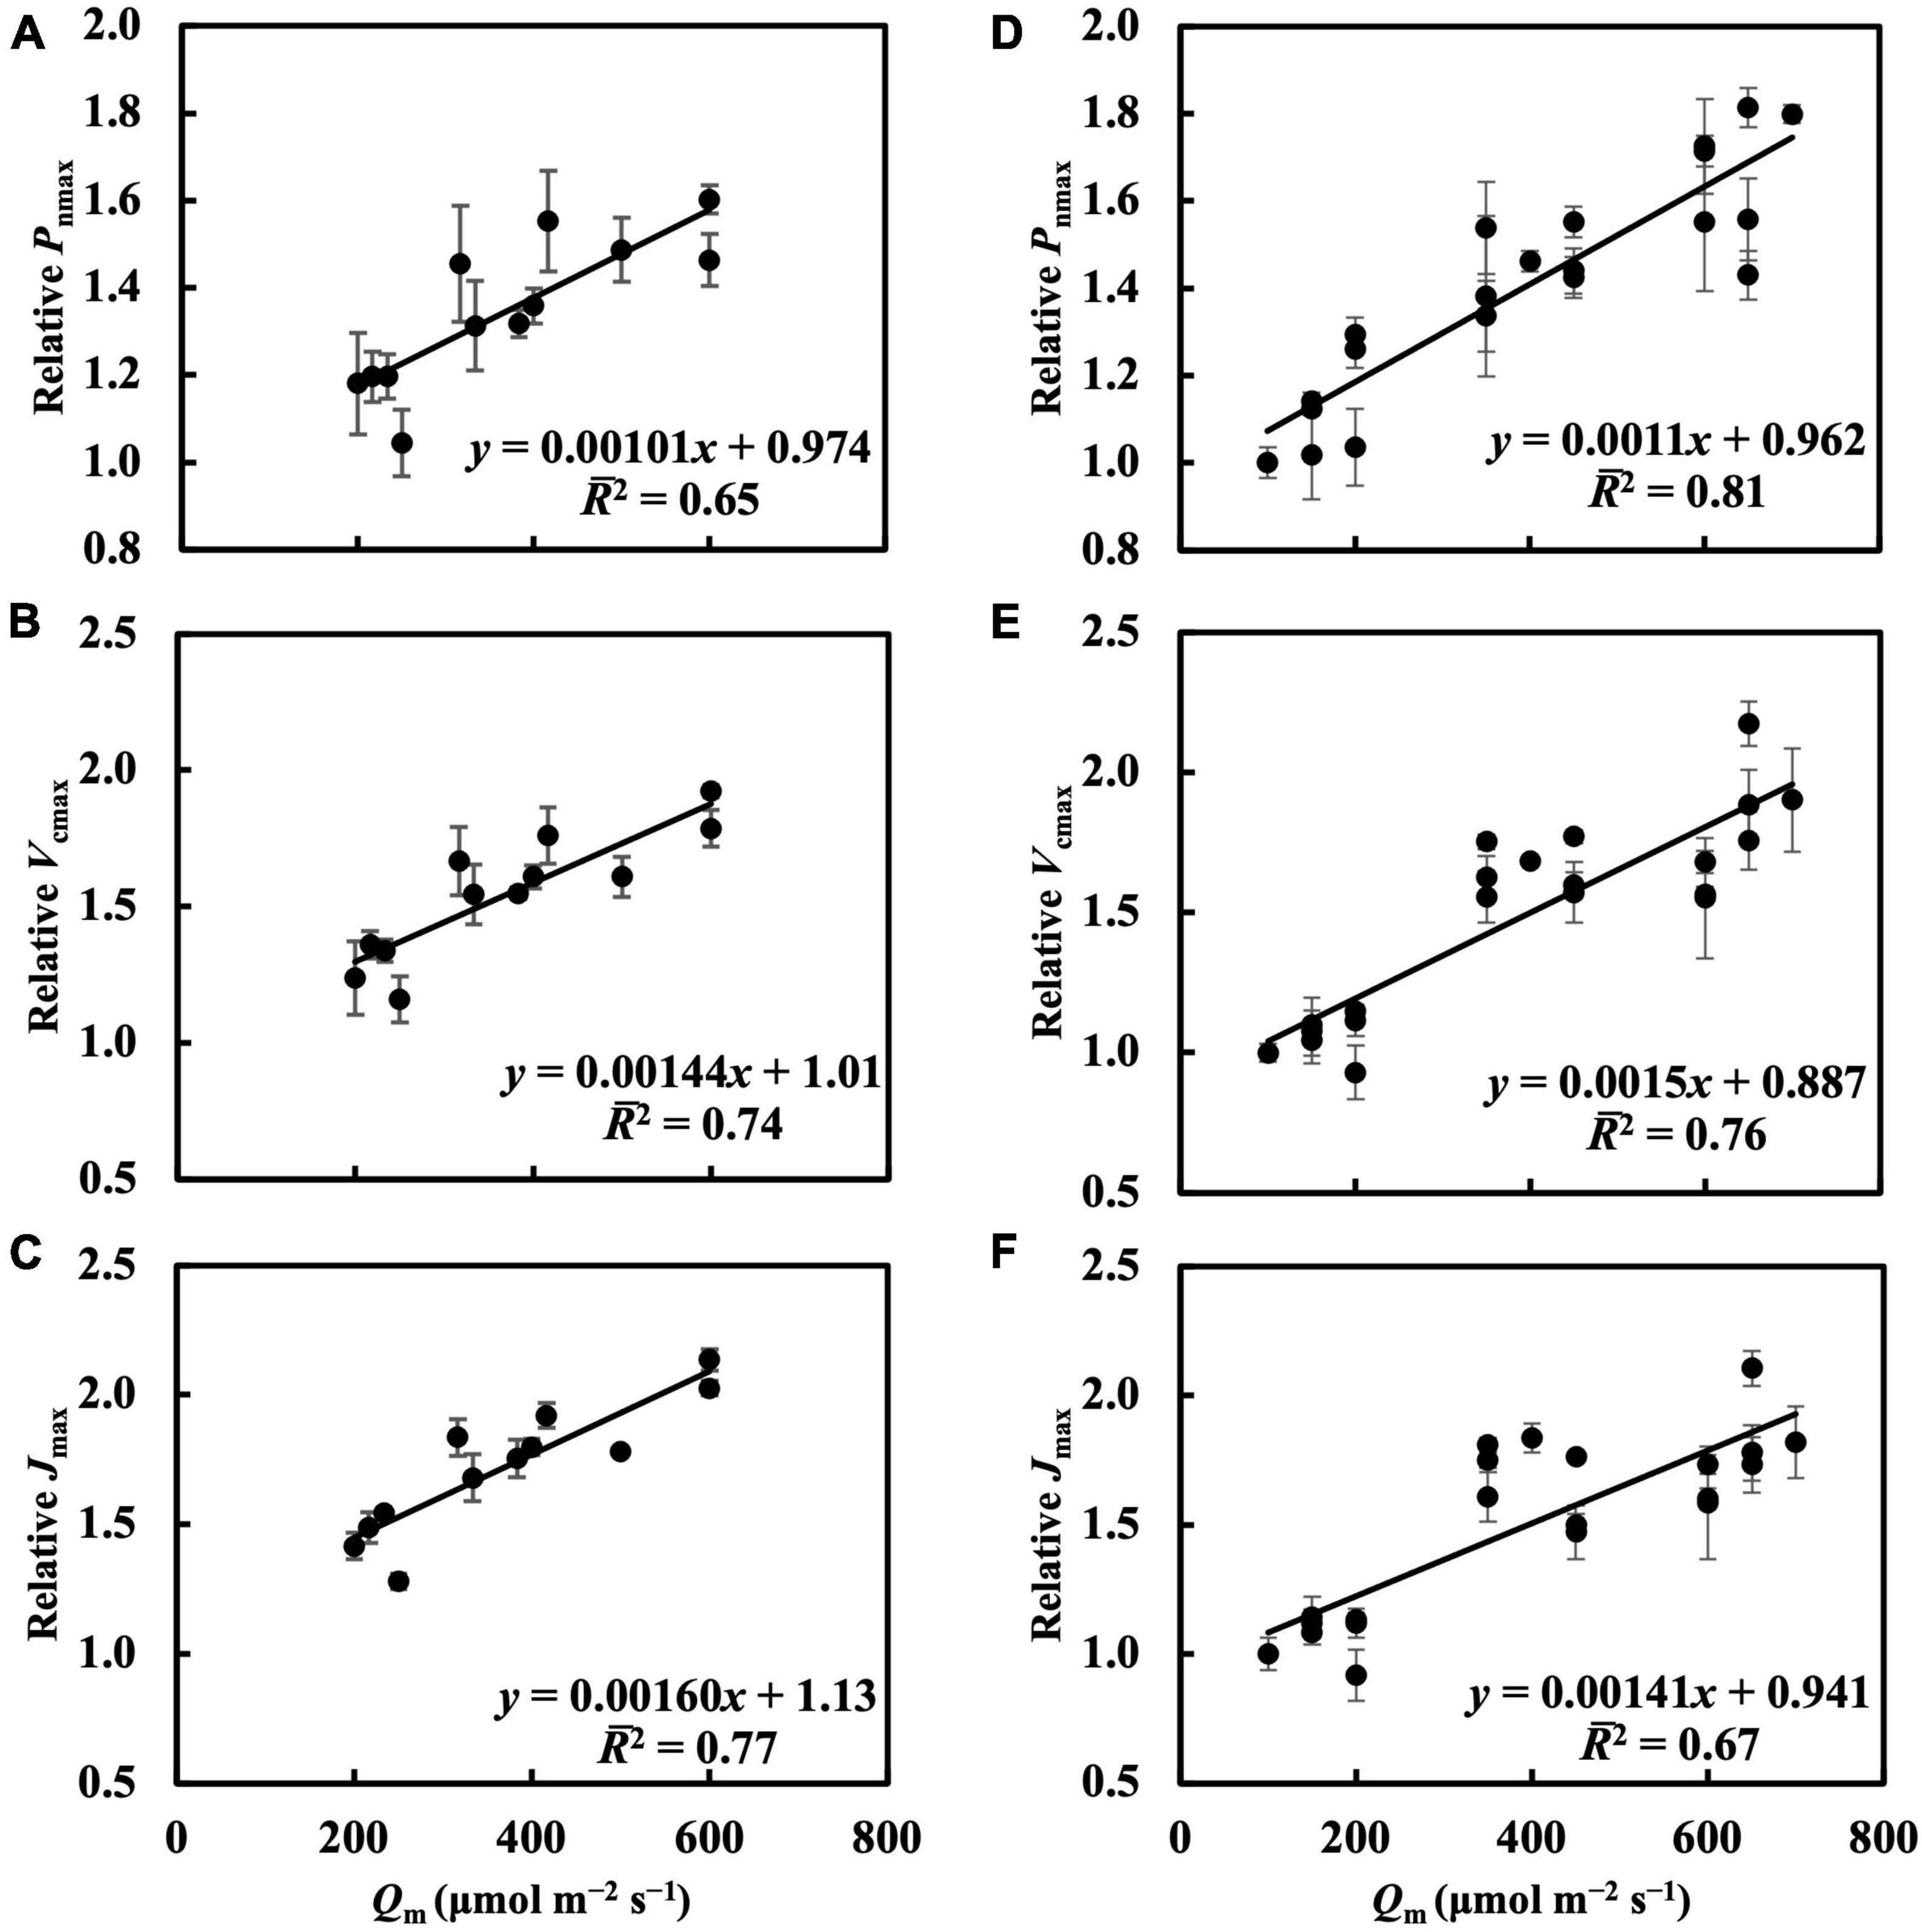
Figure 5. Linear regression of relative Pnmax, Vcmax, and Jmax on Qm in the first experiment (A–C) and in the second experiment (D–F). See section “Treatments” for the details of treatment setting in each experiment. All values were means ± standard errors (n = 3) and relativized to that for 100 μmol m–2 s–1. Regression lines, regression functions, and 2 are shown.
For leaves acclimated to constant daily PPFD, LMA responded almost linearly to daily PPFD levels (Figure 1A). This is evidence of a high plasticity and response rate, consistent with studies by Strauss-Debenedetti and Bazzaz (1991), Chazdon and Kaufmann (1993), and Poorter et al. (2019). In our first experiment, Qw, including Qwl, Qwq, and Qwsd, estimated LMA with a higher accuracy than Qm (Figure 2), with similar findings obtained in our second experiment. All Qw were calculated with larger weights on recent PPFD levels and smaller weights on earlier levels, except Qwq, in the first experiment, in which the minimum weight occurred on the third day of the 6-day period. However, since the 2s of models on all types of Qw were comparable, this exception should be ignored. These results are generally consistent with our previous study. Results of LMA in the second experiment (Figure 6) allowed us to test the effect of changing the daily PPFD for 1 day in the 6-day period. Accept treatment M–4H in Figure 6C, all treatments showed a common pattern that the LMA was altered the most compared to the control when the changes of daily PPFD levels occurred on the 6th day and vice versa. These results demonstrated that recent PPFD levels contributed more to LMA than the earlier levels.
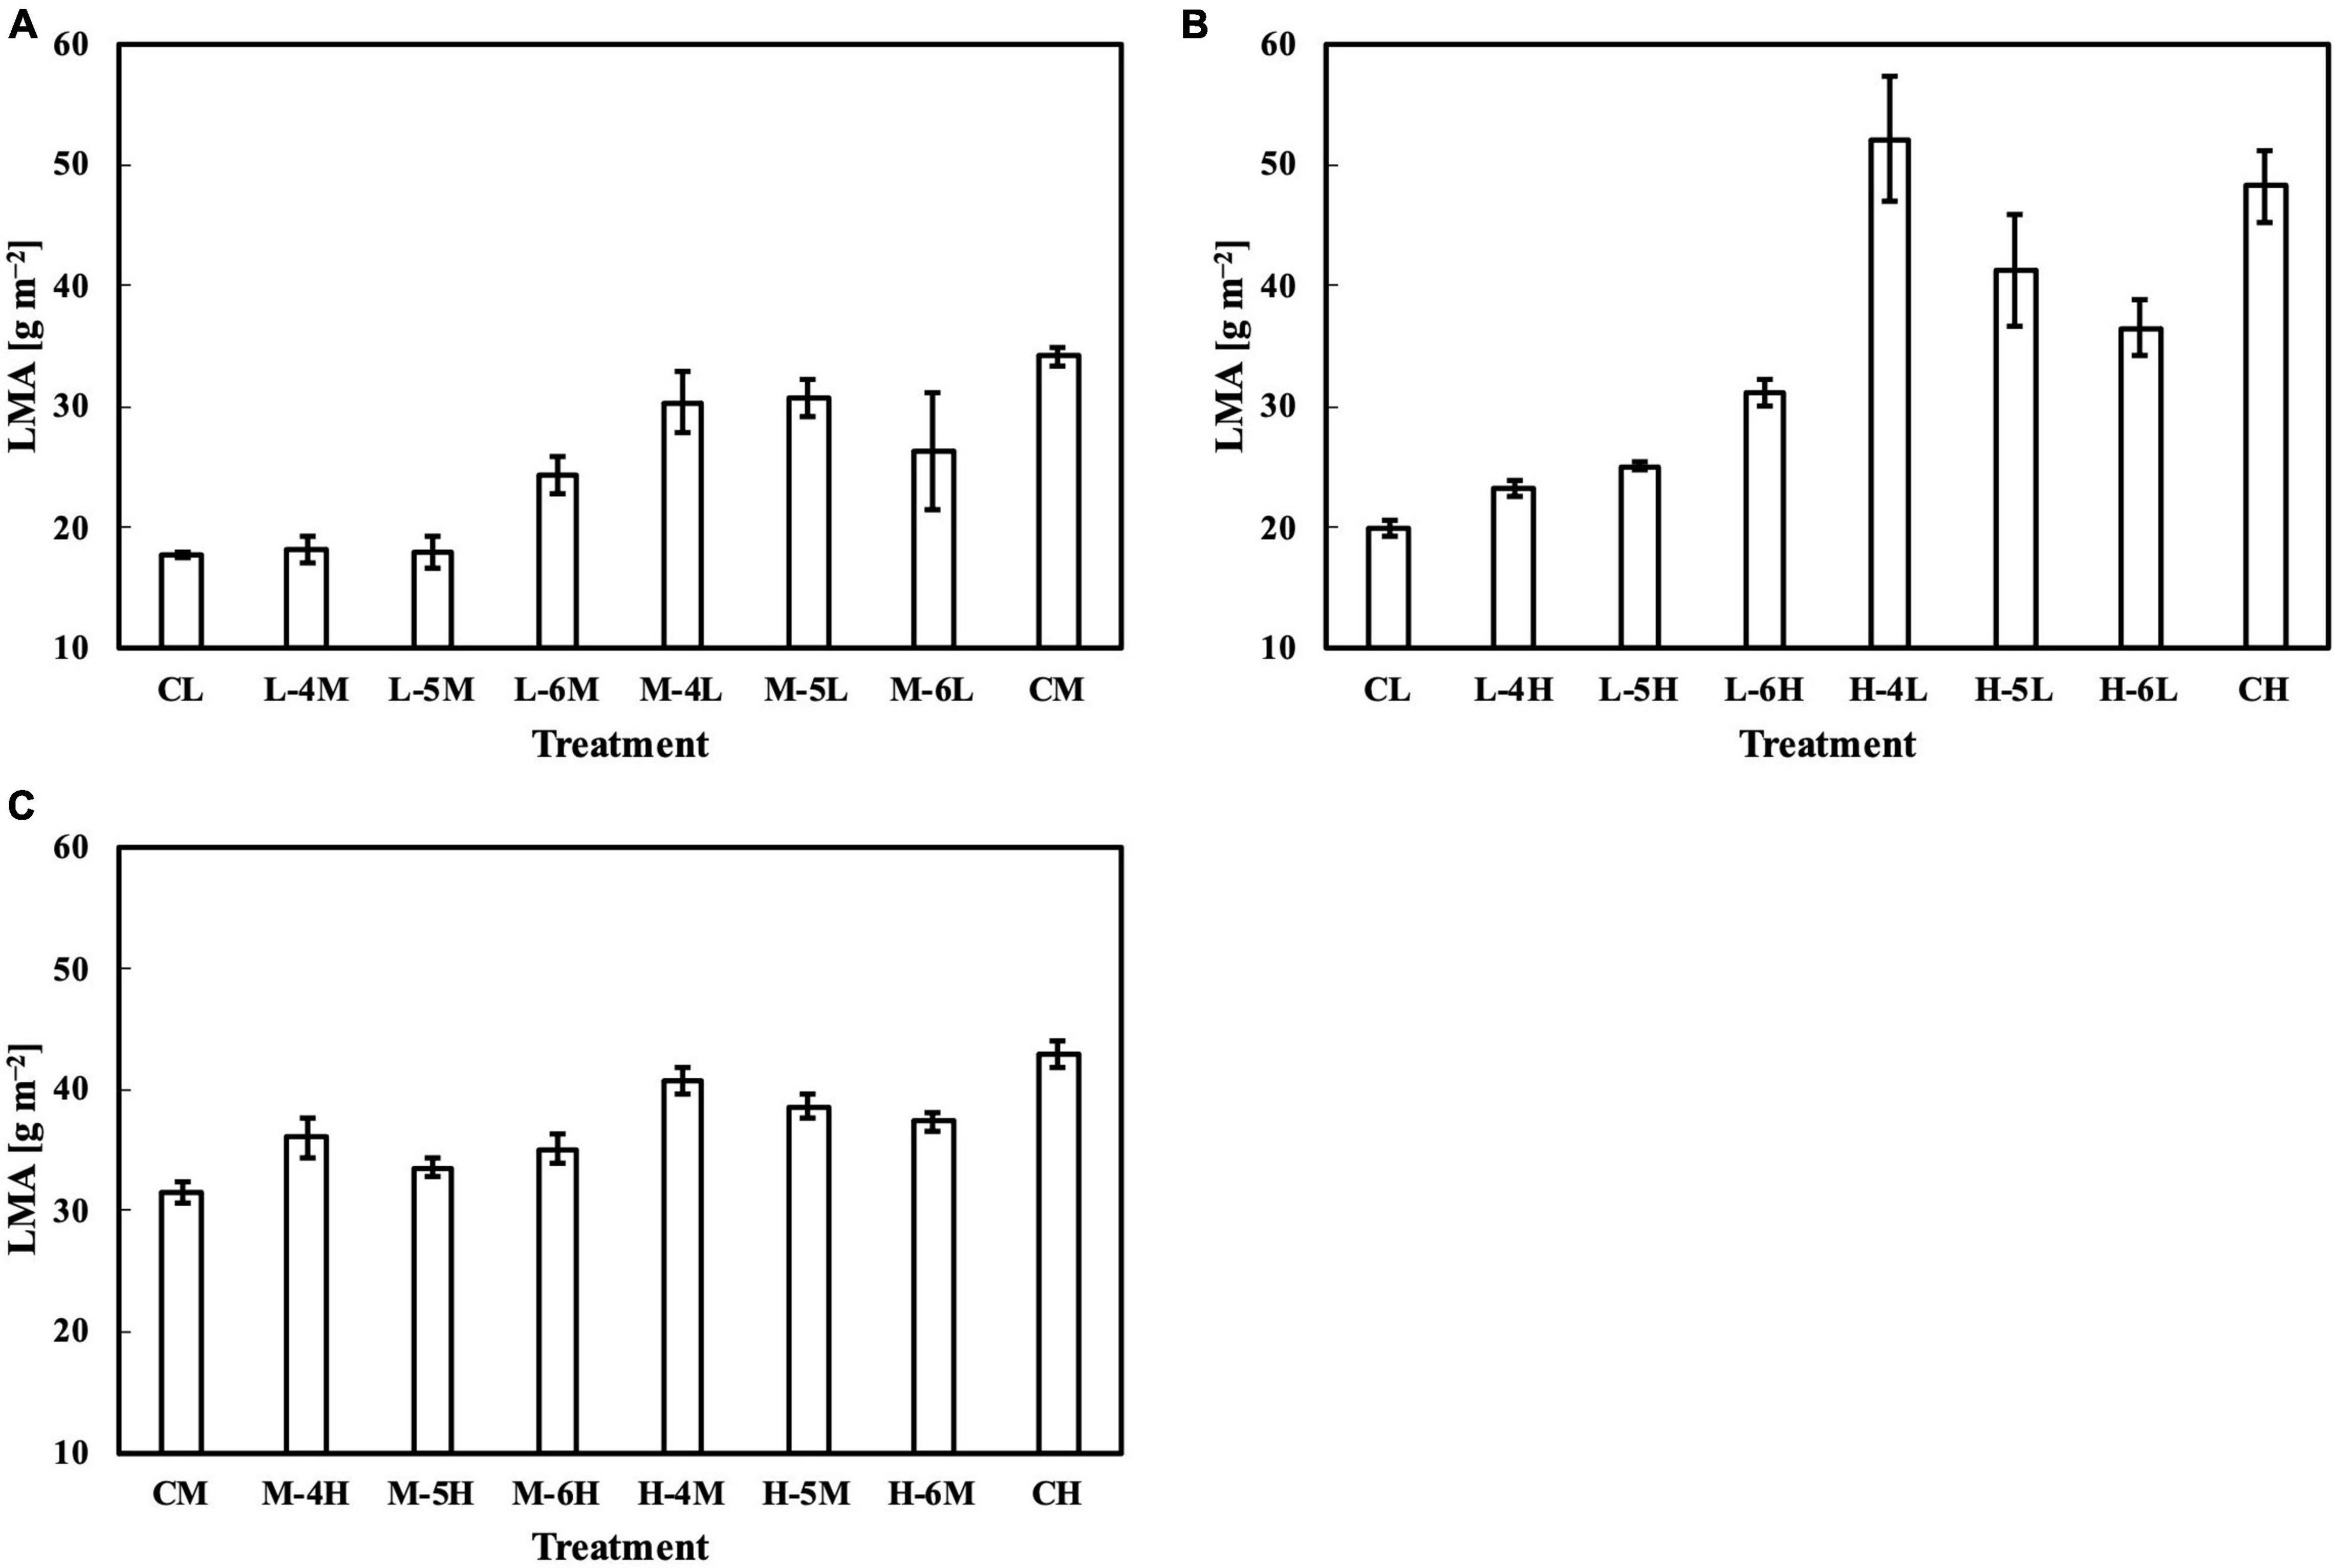
Figure 6. LMA of leaves subjected to a PPFD for 1 day different from the basal PPFD in the other days. CL and CM: treatments with a constant PPFD of 100 and 400 μmol m–2 s–1, respectively. The experiment was divided into three groups (A–C) and conducted separately due to limited experimental capacity. Values were means ± standard errors (n = 3). L–4M: treatment with a PPFD of 400 μmol m–2 s–1 in the fourth day of treatment period and a basal PPFD of 100 μmol m–2 s–1 in the other 5 days. See Supplementary Table 2 for details of treatments.
Poorter et al. (2009, 2019) reviewed the literature and found that the LMA was determined by the daily light integral (DLI) or the average PPFD in a period. These reviews were based on Chabot et al. (1979) and Niinemets et al. (2004). The study by Chabot et al. (1979) on young leaves of Fragaria virginiana revealed that LMA was determined by the average PPFD over 9 days rather than the peak PPFD per day. However, no day-to-day changes were included in the PPFD regime in the study. On the other hand, Niinemets et al. (2004) found that LMA was highly correlated with the average PPFD for mature leaves of two shade plants when grown under sunlight. Although the LMA could generally be estimated by the simple average PPFD with good accuracy, our results provided the first clear evidence that the time-weighted averages of daily PPFD further improved the estimation of LMA for leaves under day-to-day changing PPFDs.
The results of the Chl a/b ratio, Pnmax, Vcmax, and Jmax showed that Qw with the weight functions we tested was inferior in estimating these parameters when compared with Lm. Although CQm could not effectively estimate Chl a/b ratio in the first experiment, it did estimate the Chl a/b ratio in the second experiment and Pnmax, Vcmax, and Jmax in both experiments with acceptable 2s. These results suggest that daily PPFD on any day during treatment has an equal influence on these parameters. The generally lower accuracy of estimating these parameters than estimating LMA could be due to their lower response rates and plasticity to day-to-day PPFD changes, especially when daily PPFD changes distinctly. This is supported by Grassi and Bagnaresi (2001) and Poorter et al. (2019), whose coefficients of determination (R2) for estimating the Chl a/b ratio using average PPFD (both R2 = 0.43) were much lower than those for LMA (R2 = 0.74 and 0.68, respectively). Contrary to our expectations, models with weights that reach their maximum several days before the measurement did not improve the estimation of the Chl a/b ratio, Pnmax, Vcmax, and Jmax, indicating that leaves likely failed to effectively respond to the interval (1 day) and/or magnitude (up to 600 μmol m–2 s–1) of PPFD changes, especially in the first experiment. Athanasiou et al. (2010) found that a 1-or-2-days elevation of daily PPFD levels from 100 to 400 μmol m–2 s–1 did not trigger a significant increase in Pnmax of Arabidopsis. This could explain why our previous study, in which the interval of PPFD changes was 2 days, showed a clearly stronger influence of the recent PPFD on the Chl a/b ratio, Vcmax, and Jmax than the earlier PPFD. Retkute et al. (2015) predicted that the characteristics (duration, magnitude, etc.) of fluctuating light strongly influenced leaf acclimation responses. Our findings strongly suggest that the extent of acclimation responses is affected by the characteristics of day-to-day PPFD changes.
Meanwhile, the results of the second experiment implied that the responses of the Chl a/b ratio (Figure 7) and photosynthetic parameters (Figures 8–10) might be non-reciprocal when leaves were transferred from high to low PPFDs or vice versa. For instance, treatment M–6L had a lower Jmax than treatments M–4L and M–5L (Figure 10A), suggesting that Jmax was influenced by PPFD 1 day before measurement. However, no obvious difference was observed between the Jmax of treatments L–4M, L–5M, and L–6M (Figure 10A), indicating a difference in light acclimation response rates in opposite directions. Although no common pattern could be observed from the comparison among all the treatments, incorporating this non-reciprocal response to day-to-day PPFD changes could improve the estimation, which should be examined in future research.
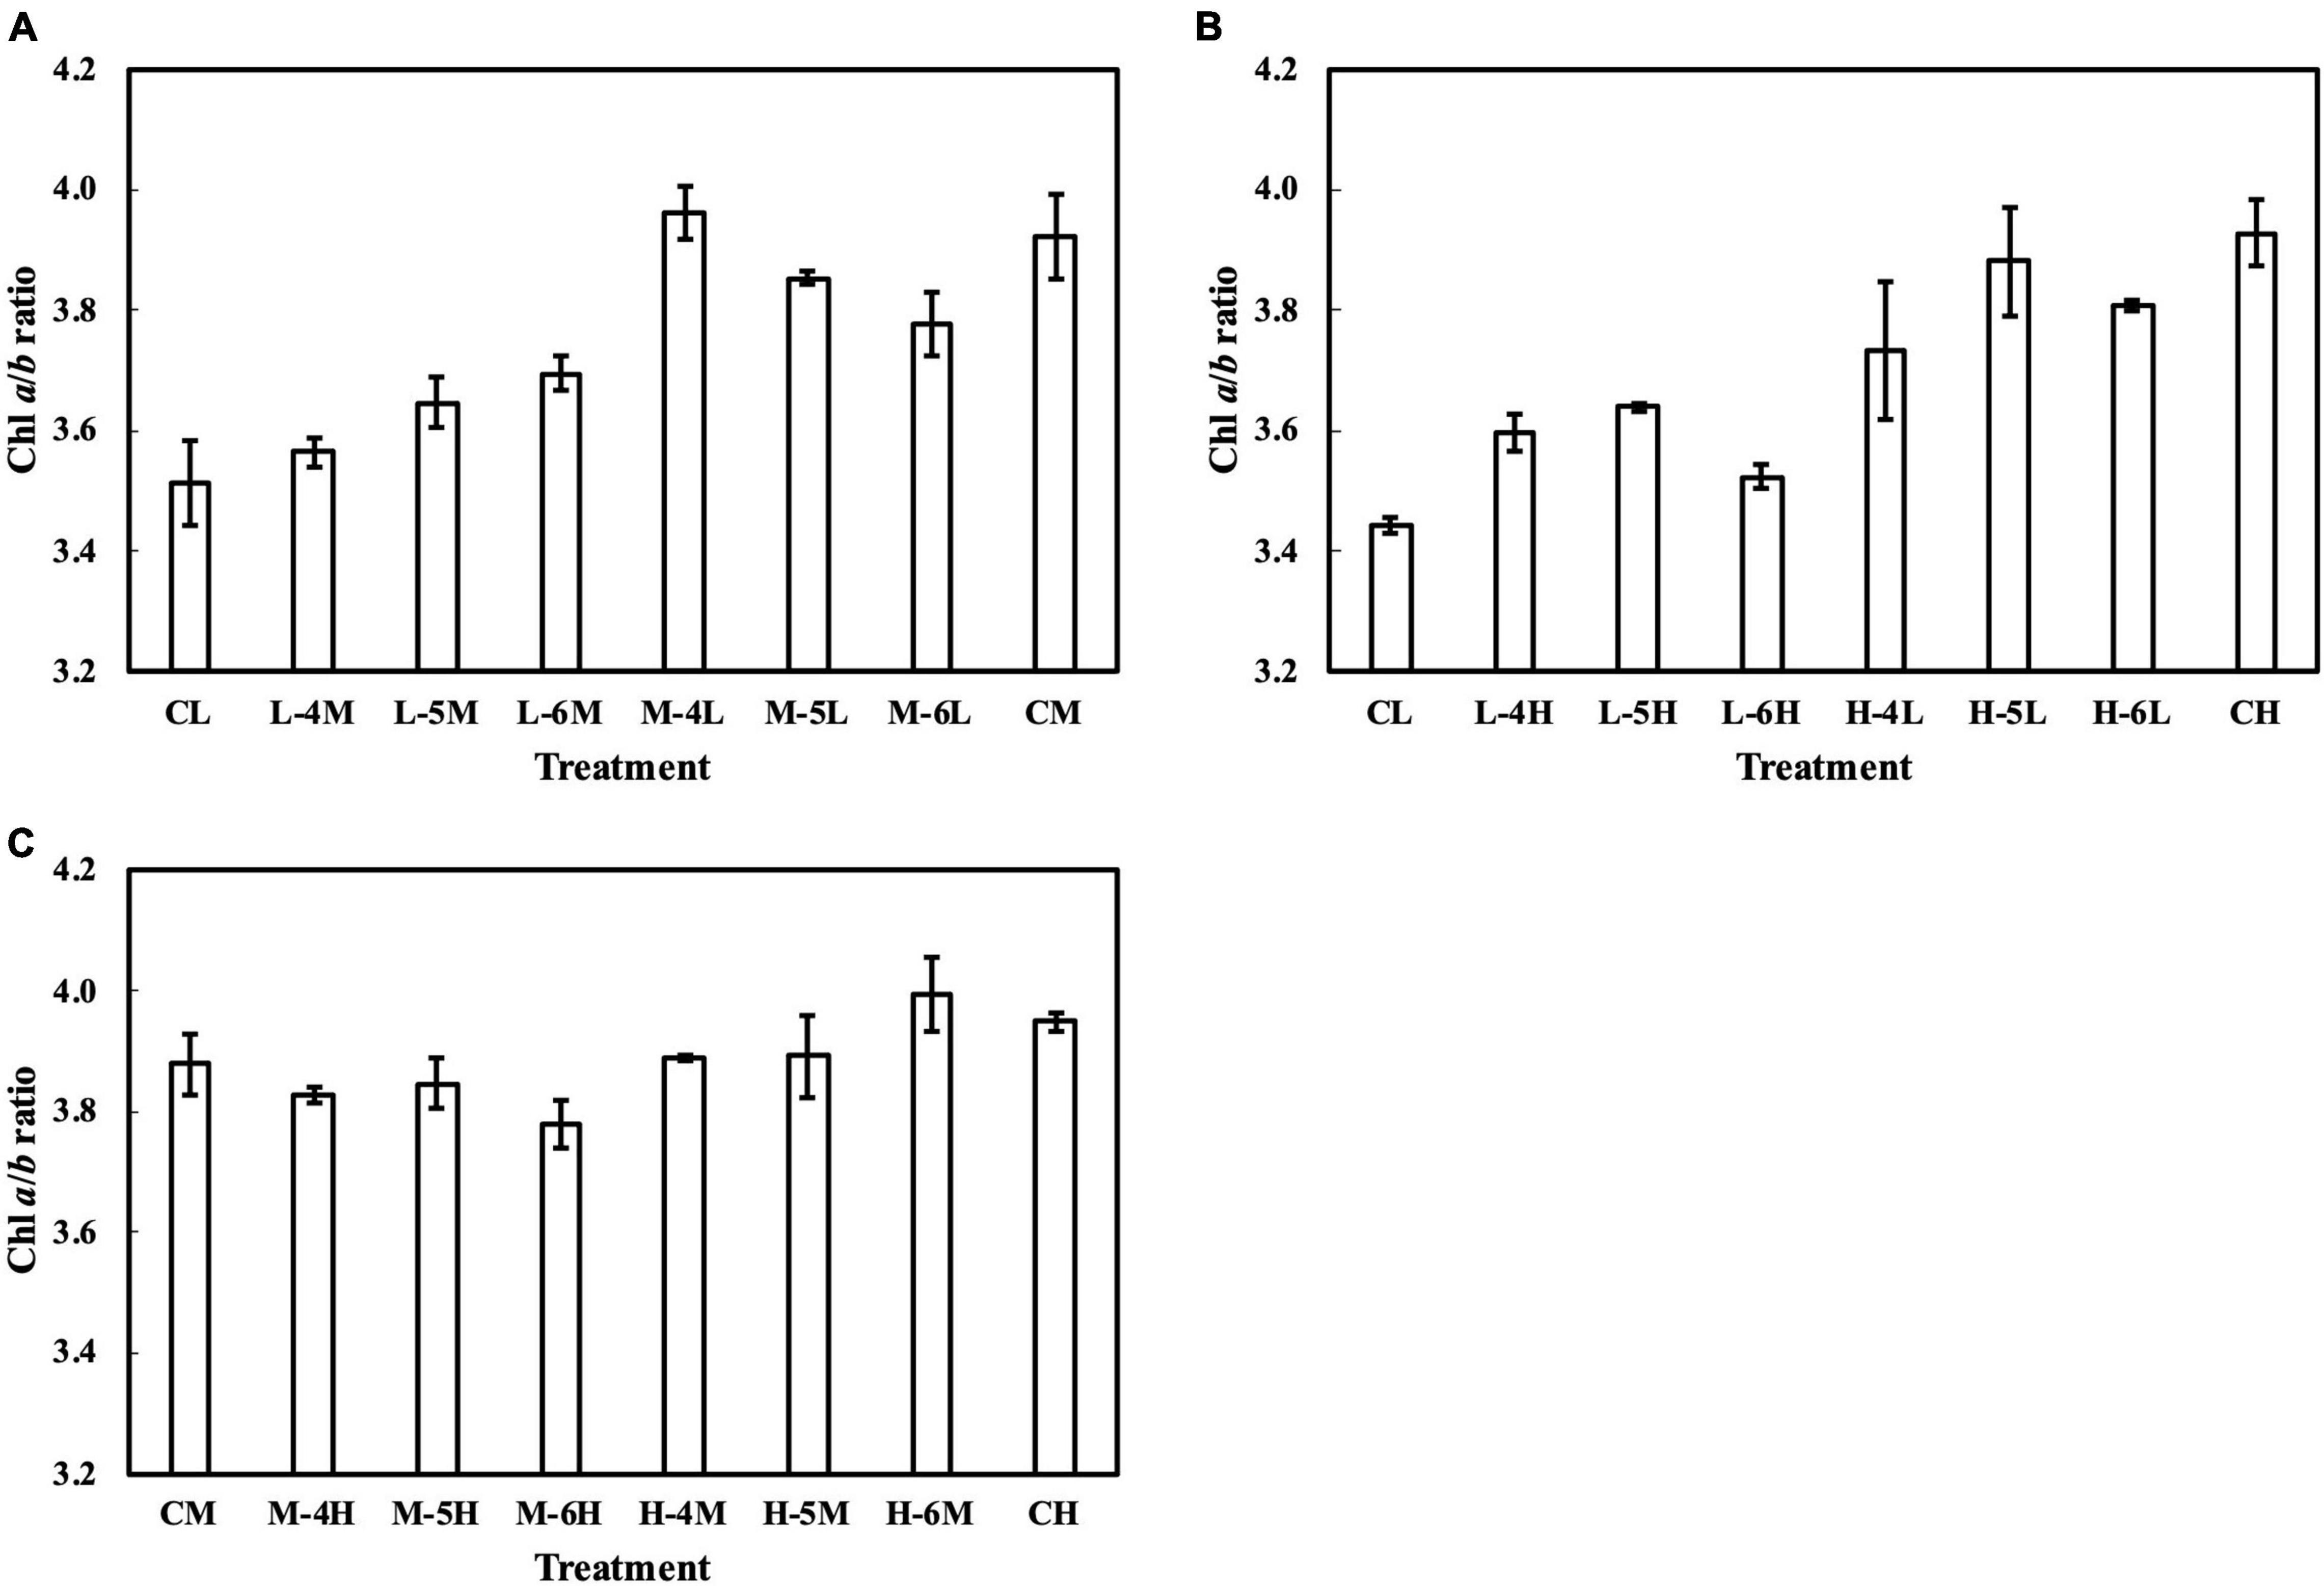
Figure 7. Chl a/b ratio of leaves subjected to a PPFD for 1 day different from the basal PPFD in the other days. CL and CM: treatments with a constant PPFD of 100 and 400 μmol m–2 s–1, respectively. The experiment was divided into three groups (A–C) and conducted separately due to limited experimental capacity. Values were means ± standard errors (n = 3). L–4M: treatment with a PPFD of 400 μmol m–2 s–1 in the fourth day of treatment period and a basal PPFD of 100 μmol m–2 s–1 in the other 5 days. See Supplementary Table 2 for details of treatments.
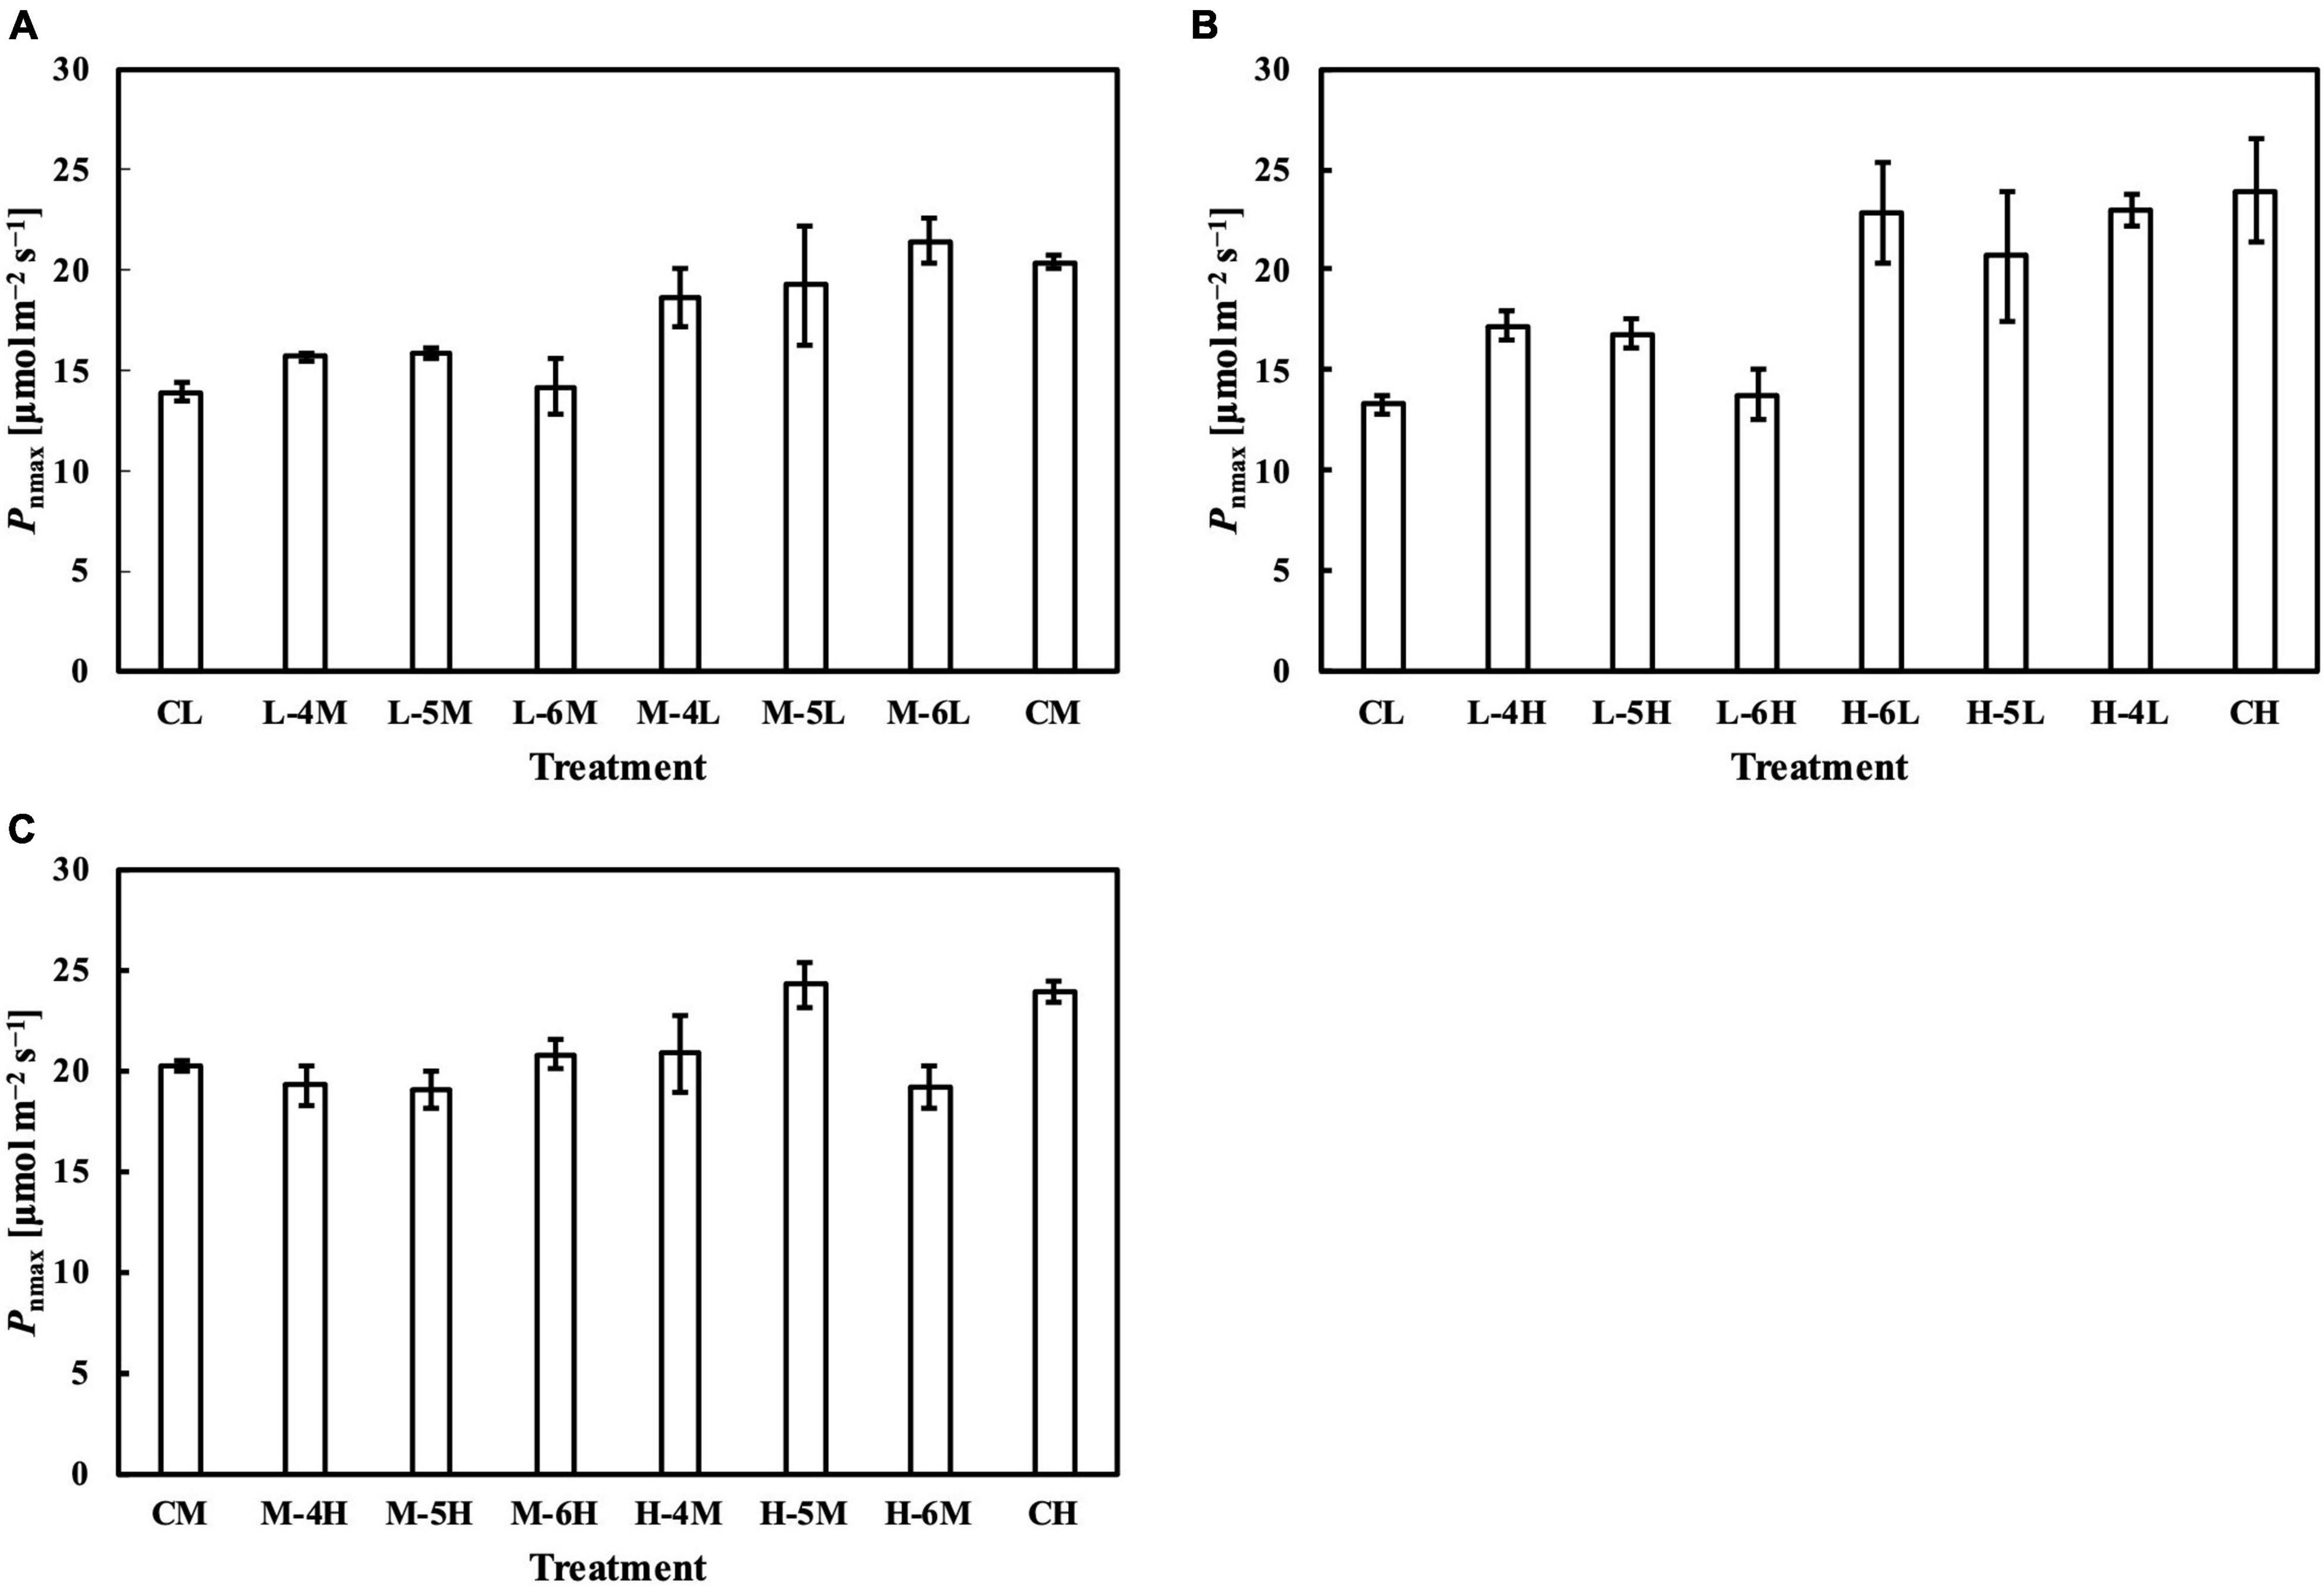
Figure 8. Pnmax of leaves subjected to a PPFD for 1 day different from the basal PPFD in the other days. Pnmax was measured at ambient CO2 concentration (Ca) of 400 μmol mol–1 and saturating PPFD of 1,800 μmol–1 m–2 s–1. CL and CM: treatments with a constant PPFD of 100 and 400 μmol m–2 s–1, respectively. The experiment was divided into three groups (A–C) and conducted separately due to limited experimental capacity. Values were means ± standard errors (n = 3). L–4M: treatment with a PPFD of 400 μmol m–2 s–1 in the fourth day of treatment period and a basal PPFD of 100 μmol m–2 s–1 in the other 5 days. See Supplementary Table 2 for details of treatments.
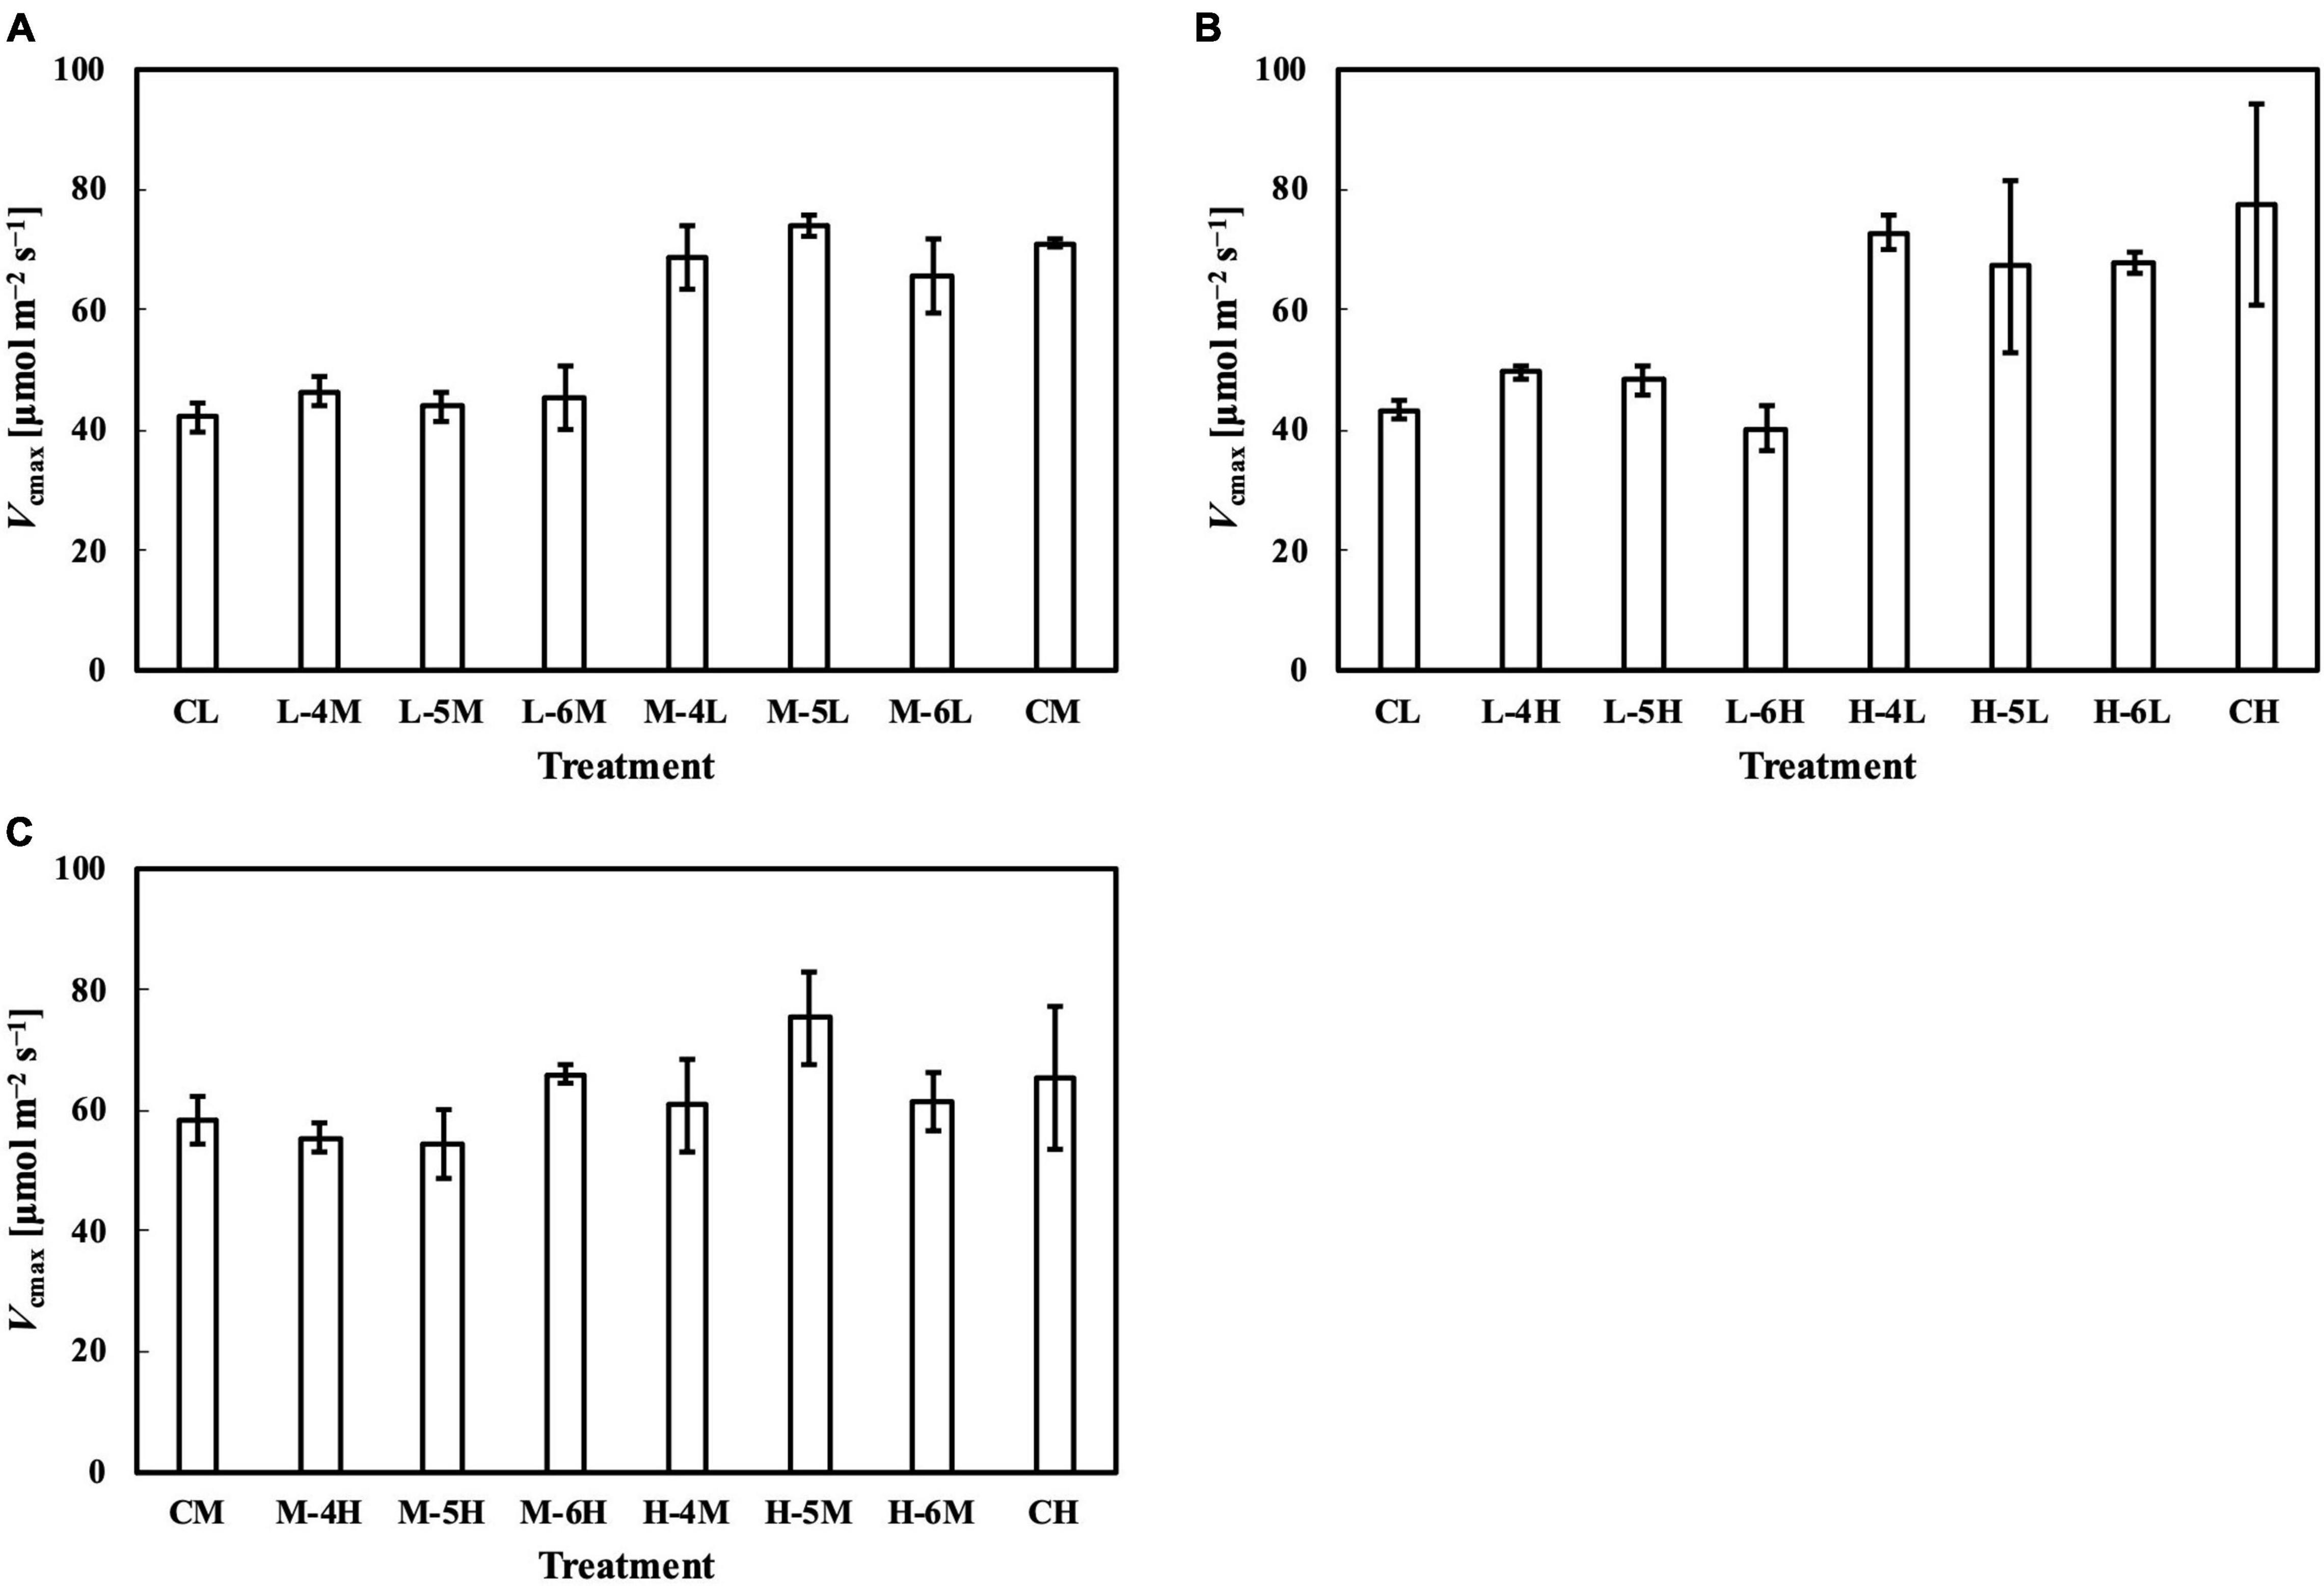
Figure 9. Vcmax of leaves subjected to a PPFD for 1 day different from the basal PPFD in the other days. CL and CM: treatments with a constant PPFD of 100 and 400 μmol m–2 s–1, respectively. The experiment was divided into three groups (A–C) and conducted separately due to limited experimental capacity. Values were means ± standard errors (n = 3). L–4M: treatment with a PPFD of 400 μmol m–2 s–1 in the fourth day of treatment period and a basal PPFD of 100 μmol m–2 s–1 in the other 5 days. See Supplementary Table 2 for details of treatments.
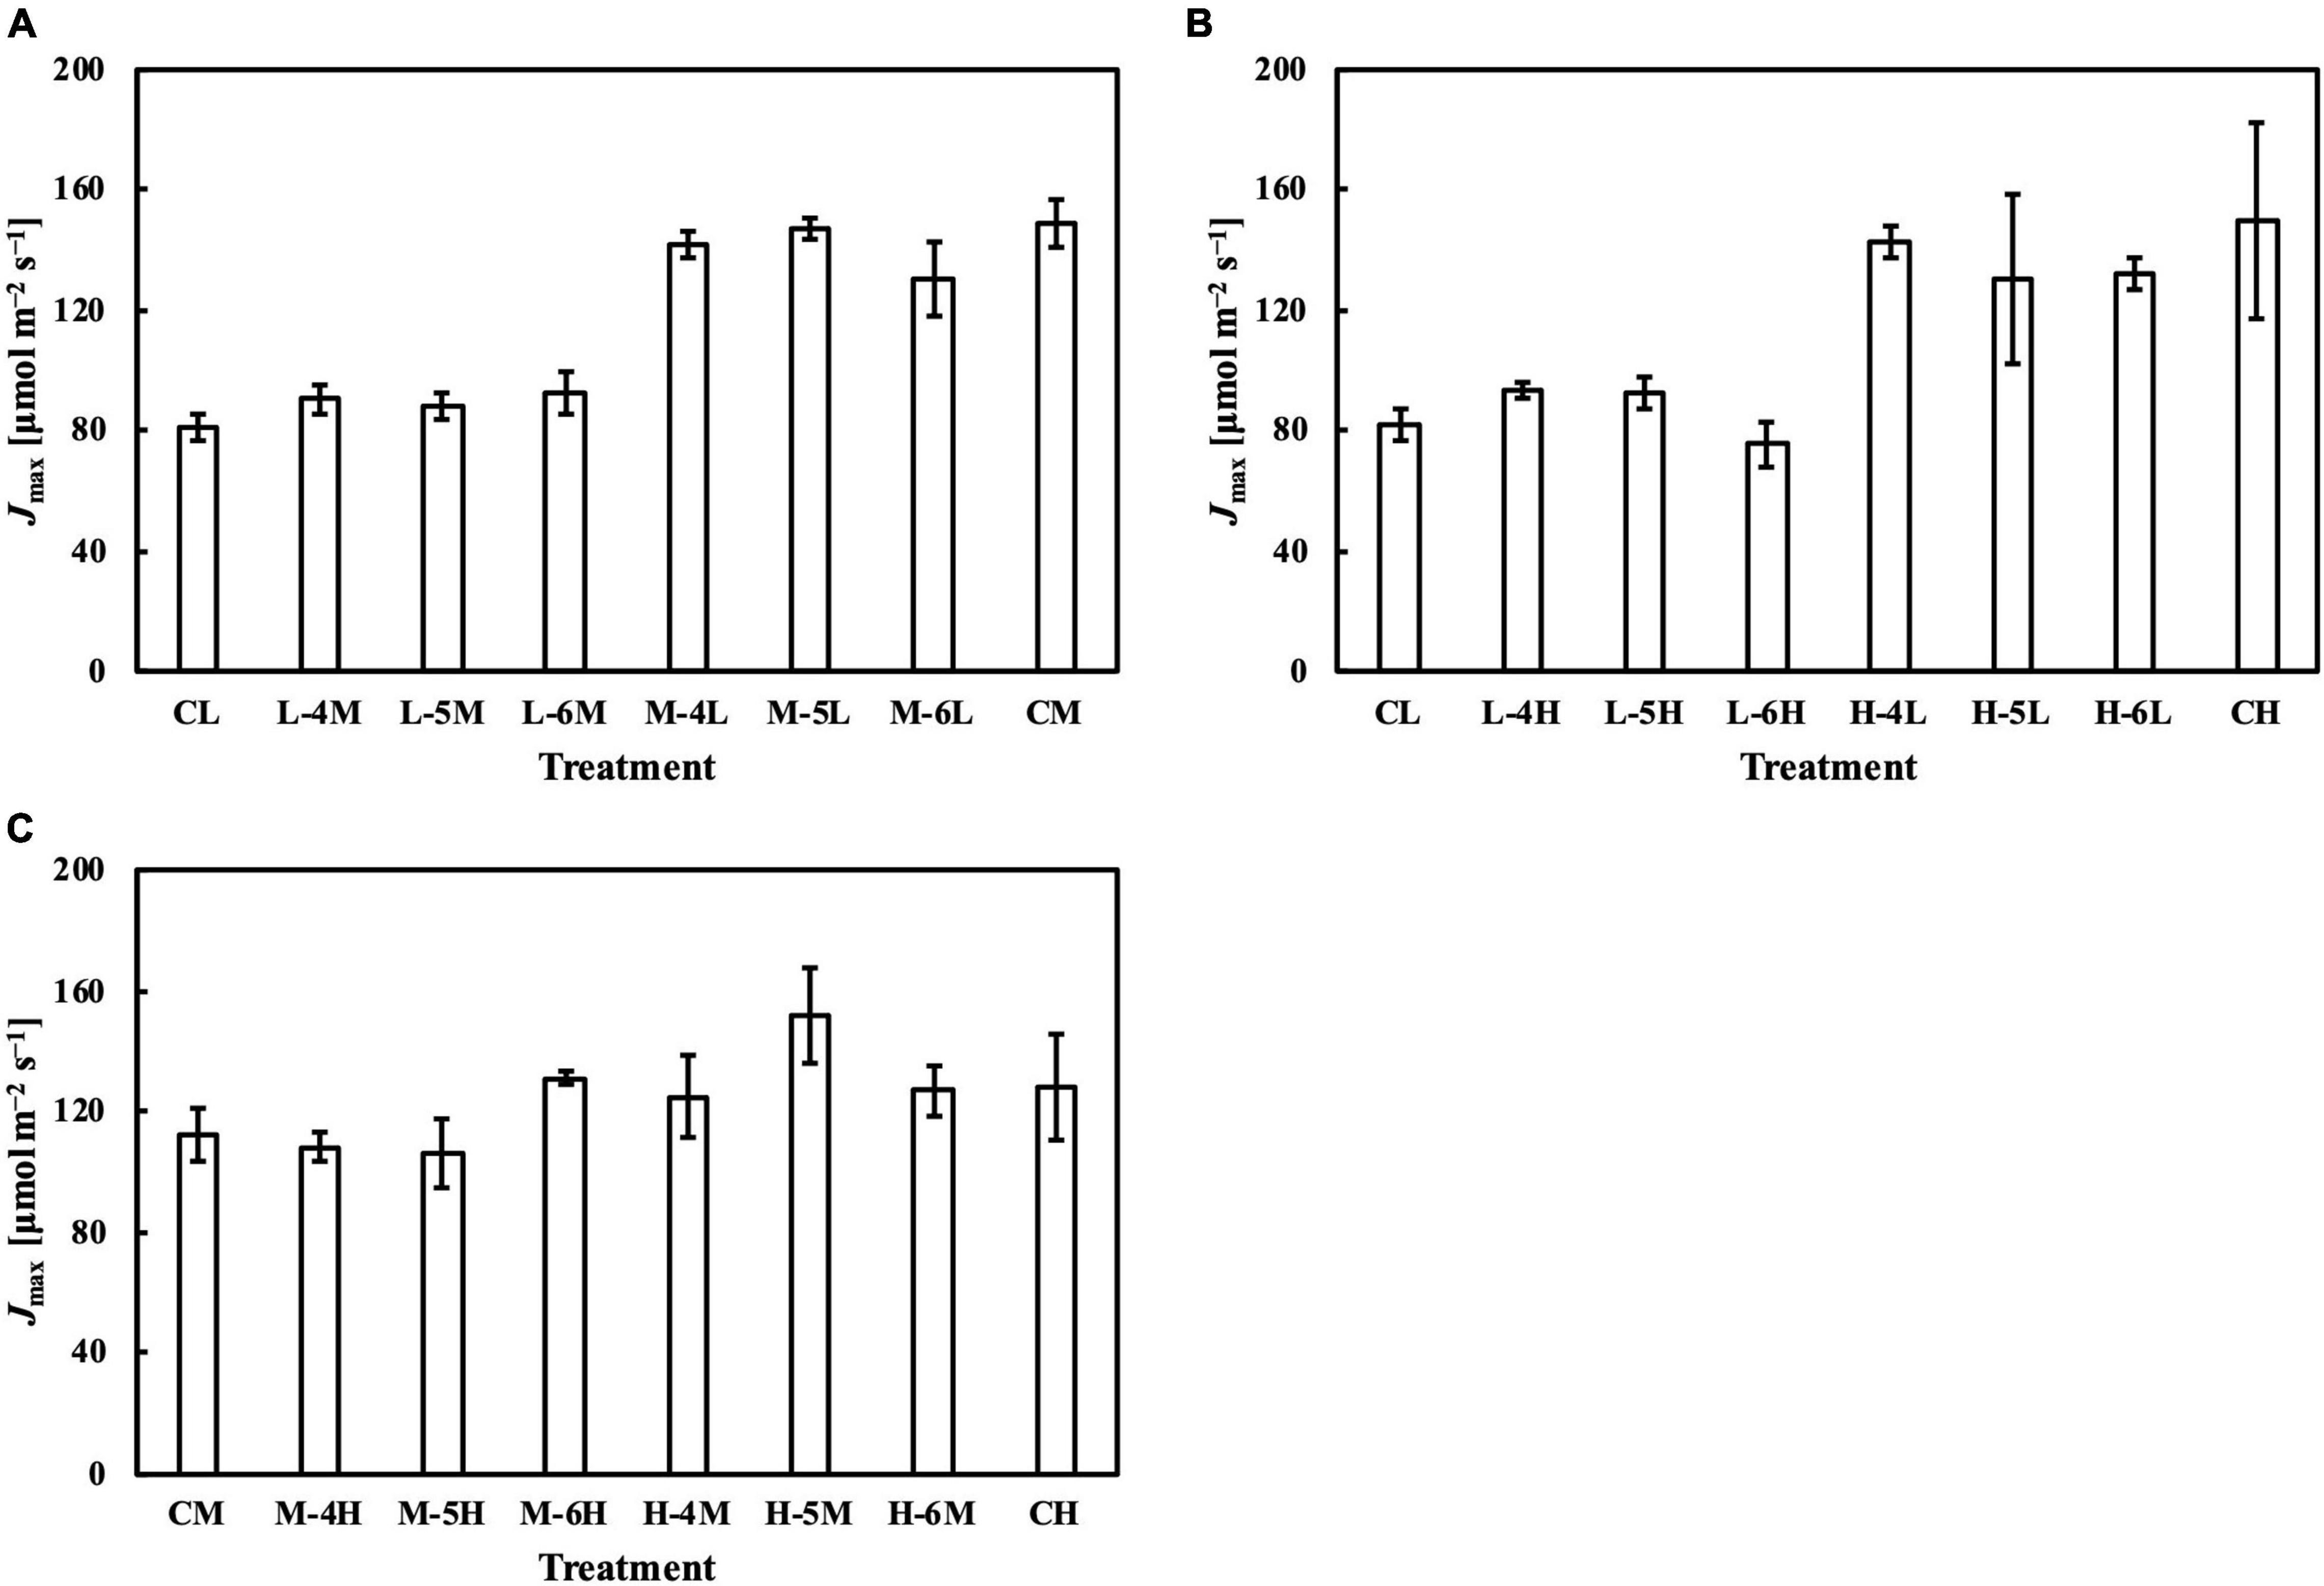
Figure 10. Jmax of leaves subjected to a PPFD for 1 day different from the basal PPFD in the other days. CL and CM: treatments with a constant PPFD of 100 and 400 μmol m–2 s–1, respectively. The experiment was divided into three groups (A–C) and conducted separately due to limited experimental capacity. Values were means ± standard errors (n = 3). L–4M: treatment with a PPFD of 400 μmol m–2 s–1 in the fourth day of treatment period and a basal PPFD of 100 μmol m–2 s–1 in the other 5 days. See Supplementary Table 2 for details of treatments.
The photosynthetic capacity parameters varied in their responses to constant PPFD levels, where Pnmax at a Ca of 400 μmol mol–1 almost responded linearly toward PPFD levels (Figure 1B), and Vcmax and Jmax were clearly saturated when PPFD levels increased (Figures 1D,E). These results suggest the existence of limiting factors for photosynthesis other than Vcmax and Jmax, supported, on the other hand, by the comparison in which Vcmax and Jmax estimation shows higher accuracy than that of Pnmax. On the other hand, when we evaluated Pnmax at a Ci of 400 μmol mol–1, it exhibited a clearer saturating response to PPFD levels (Figure 11). This strongly implies that leaf CO2 diffusion characteristics might be involved in light acclimation responses, such as stomatal properties (Mendes et al., 2001; Campany et al., 2016; Baer et al., 2020; Gjindali et al., 2021). Furthermore, a study by Björkman and Holmgren (1963) showed that leaves acclimated from high to low light for a week did not significantly differ in stomatal intensity or size compared with leaves acclimated in reverse. Thus, the limitation of stomatal properties for leaves acclimated to changing PPFD levels is indicated as reversible, rather than structurally irreversible.
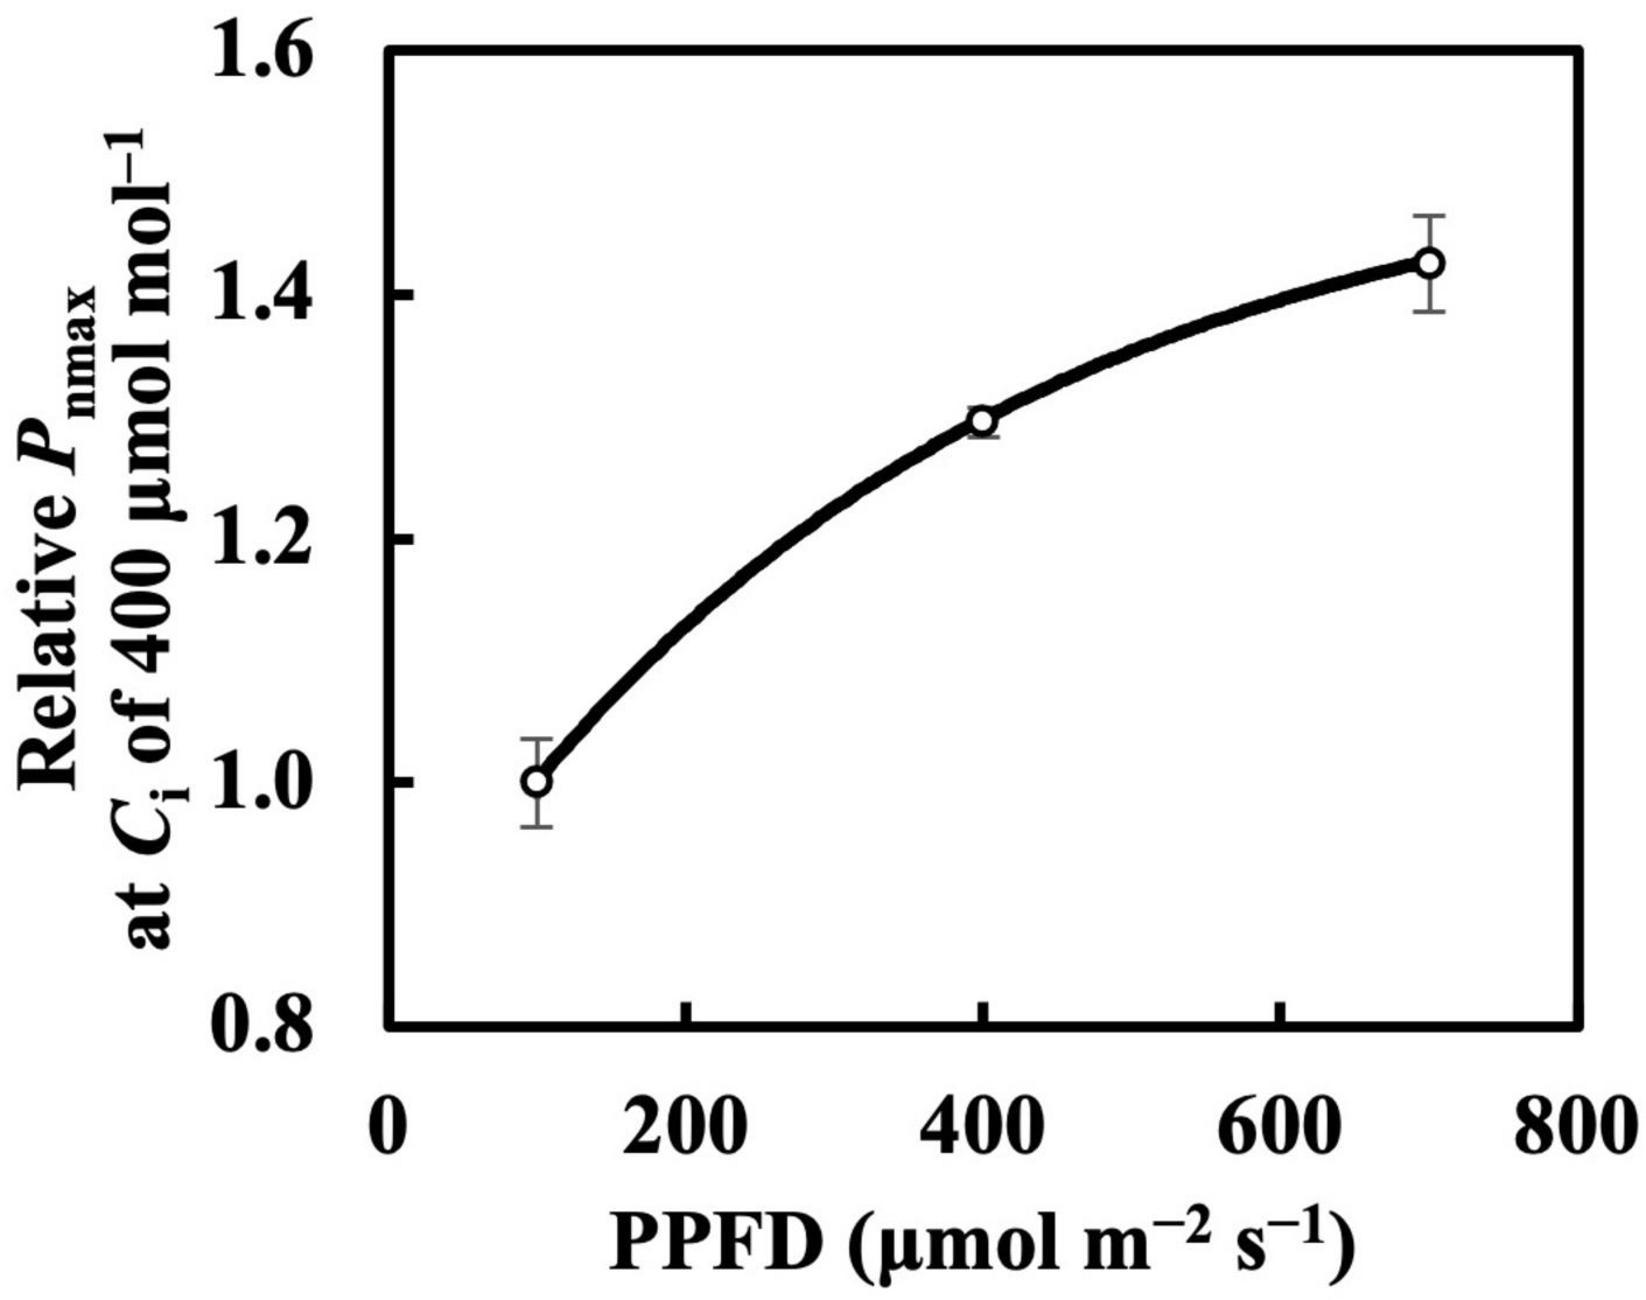
Figure 11. Relative Pnmax at intercellular CO2 concentration (Ci) of 400 μmol mol–1 in first true leaves of cucumber grown under constant daily PPFD levels for 6 days. All values were means ± standard errors (n = 3) and relativized to that for 100 μmol m–2 s–1. Measured values (open circles) and estimated values (solid line) fitted with asymptotic functions are shown.
Daily PPFD levels might contribute equally to Pnmax, Vcmax, and Jmax, which is inconsistent with our assumption that recent PPFD levels have a larger influence on these parameters than do earlier levels. Since treatments in which 1 day in the earlier half of the 6-day period had a different PPFD from the basal level, in the other days they were not tested yet, and this meant that experiment with these treatments is needed to complete our study. Conversely, research by Luo and Keenan (2020) on the estimation of Pnmax showed that the variation in Pnmax under sunlight was better explained by the average PPFDs over the past 7 days than those over the past 10 or 15 days. Thus, the appropriate time for calculating Qm requires further investigation.
The time-weighted averages of daily PPFD estimated the LMA more accurately than the simple average PPFD, indicating that recent PPFD levels contribute more to LMA than earlier levels. Conversely, daily PPFD did not show noticeable differences in its influences on the Chl a/b ratio, Pnmax, Vcmax, and Jmax, implying that the average daily PPFD could generally estimate these parameters. The characteristics of day-to-day changes in daily PPFD were found to affect the responses of acclimation parameters. The model which appropriately incorporates the characteristics of day-to-day PPFD changes should outperform the widely used model based on an average daily PPFD in terms of estimating the LMA. Thus, our study demonstrates a reasonable approach to quantifying the extent to which leaf properties acclimate to day-to-day PPFD changes.
The original contributions presented in the study are included in the article/Supplementary Material, further inquiries can be directed to the corresponding author/s.
LY designed the study, conducted the experiments, analyzed the data, and wrote the manuscript. KF and RM designed the study and critically revised the manuscript. All authors contributed to the article and approved the submitted version.
This work was financially supported in part by the JSPS KAKENHI (Grant No. 19K22343). LY was supported by the China Scholarship Council for the study at the University of Tokyo.
The authors declare that the research was conducted in the absence of any commercial or financial relationships that could be construed as a potential conflict of interest.
All claims expressed in this article are solely those of the authors and do not necessarily represent those of their affiliated organizations, or those of the publisher, the editors and the reviewers. Any product that may be evaluated in this article, or claim that may be made by its manufacturer, is not guaranteed or endorsed by the publisher.
The Supplementary Material for this article can be found online at: https://www.frontiersin.org/articles/10.3389/fpls.2021.809046/full#supplementary-material
Ca, ambient CO2 concentration; Chl, chlorophyll; Ci, intercellular CO2 concentration; CQm, calibrated average PPFD; CQwl, calibrated time-weighted average PPFD with linear weight function; CQwq, calibrated time-weighted average PPFD with quadratic weight function; CQwsd, calibrated time-weighted average PPFD with derivative of sigmoid weight function; IF, forward current; IRGAs, infrared gas analyzers; Jmax, maximum rate of electron transport; LED, light-emitting diode; LMA, leaf mass per area; Pn, net photosynthetic rate; Pnmax, maximum Pn at Ca of 400 μ mol mol–1 and saturating PPFD of 1,800 μ mol m–2 s–1; PPFD, photosynthetic photon flux density; Qm, average PPFD; Qw, time-weighted average PPFD; Qwl, time-weighted average PPFD with linear weight function; Qwq, time-weighted average PPFD with quadratic weight function; Qwsd, time-weighted average PPFD with derivative of sigmoid weight function; R2, coefficient of determination; 2, adjusted coefficient of determination; RMSE, root mean squared error; TPU, rate of triose-phosphate utilization; Vcmax, maximum rate of carboxylation capacity of ribulose-1,5-bisphosphate carboxylase/oxygenase.
Athanasiou, K., Dyson, B. C., Webster, R. E., and Johnson, G. N. (2010). Dynamic acclimation of photosynthesis increases plant fitness in changing environments. Plant Physiol. 152, 366–373. doi: 10.1104/pp.109.149351
Baer, A., Wheeler, J. K., and Pittermann, J. (2020). Limited hydraulic adjustments drive the acclimation response of Pteridium aquilinum to variable light. Ann. Bot. 125, 691–700. doi: 10.1093/aob/mcaa006
Björkman, O., and Holmgren, P. (1963). Adaptability of the photosynthetic apparatus to light intensity in ecotypes from exposed and shaded habitats. Physiol. Plant. 16, 889–914. doi: 10.1111/j.1399-3054.1963.tb08366.x
Boardman, N. K. (1977). Comparative photosynthesis of sun and shade plants. Annu. Rev. Plant Physiol. 28, 355–377. doi: 10.1146/annurev.pp.28.060177.002035
Campany, C. E., Tjoelker, M. G., von Caemmerer, S., and Duursma, R. A. (2016). Coupled response of stomatal and mesophyll conductance to light enhances photosynthesis of shade leaves under sunflecks. Plant Cell Environ. 39, 2762–2773. doi: 10.1111/pce.12841
Chabot, B. F., Jurik, T. W., and Chabot, J. F. (1979). Influence of instantaneous and integrated light-flux density on leaf anatomy and photosynthesis. Am. J. Bot. 66, 940–945. doi: 10.1002/j.1537-2197.1979.tb06304.x
Chazdon, R. L., and Kaufmann, S. (1993). Plasticity of leaf anatomy of two rain forest shrubs in relation to photosynthetic light acclimation. Funct. Ecol. 7, 385–394. doi: 10.2307/2390025
Clough, J. M., Teeri, J. A., and Alberte, R. S. (1979). Photosynthetic adaptation of Solanum dulcamara L. to sun and shade environments – I. A comparison of sun and shade populations. Oecologia 38, 13–21. doi: 10.1007/BF00347820
De la Torre, W. R., and Burkey, K. O. (1990). Acclimation of barley to changes in light intensity: chlorophyll organization. Photosynth. Res. 24, 117–125. doi: 10.1007/BF00032592
Deguchi, R., and Koyama, K. (2020). Photosynthetic and morphological acclimation to high and low light environments in Petasites japonicus subsp. giganteus. Forests 11:1365. doi: 10.3390/f11121365
Dias, A. N., Siqueira-Silva, A. I., Souza, J. P., Kuki, K. N., and Pereira, E. G. (2018). Acclimation responses of macaw palm seedlings to contrasting light environments. Sci. Rep. 8:15300. doi: 10.1038/s41598-018-33553-1
Duursma, R. A. (2015). Plantecophys - an R package for analysing and modelling leaf gas exchange data. PLoS One 10:e0143346. doi: 10.1371/journal.pone.0143346
Farquhar, G. D., von Caemmerer, S., and Berry, J. A. (1980). A biochemical model of photosynthetic CO2 assimilation in leaves of C3 species. Planta 149, 78–90. doi: 10.1007/BF00386231
Field, C. (1983). Allocating leaf nitrogen for the maximization of carbon gain: leaf age as a control on the allocation program. Oecologia 56, 341–347. doi: 10.1007/BF00379710
Flannery, S. E., Hepworth, C., Wood, W. H. J., Pastorelli, F., Hunter, C. N., Dickman, M. J., et al. (2021). Developmental acclimation of the thylakoid proteome to light intensity in Arabidopsis. Plant J. 105, 223–244. doi: 10.1111/tpj.15053
Gjindali, A., Herrmann, H. A., Schwartz, J.-M., Johnson, G. N., and Calzadilla, P. I. (2021). A holistic approach to study photosynthetic acclimation responses of plants to fluctuating light. Front. Plant Sci. 12:668512. doi: 10.3389/FPLS.2021.668512
Grassi, G., and Bagnaresi, U. (2001). Foliar morphological and physiological plasticity in Picea abies and Abies alba saplings along a natural light gradient. Tree Physiol. 21, 959–967. doi: 10.1093/treephys/21.12-13.959
Jones, J. W., Dayan, E., Allen, L. H., Van Keulen, H., and Challa, H. (1991). Dynamic tomato growth and yield model (TOMGRO). Trans. Am. Soc. Agric. Eng. 34, 663–672. doi: 10.13031/2013.31715
Jones, J. W., Hoogenboom, G., Porter, C. H., Boote, K. J., Batchelor, W. D., Hunt, L. A., et al. (2003). The DSSAT cropping system model. Eur. J. Agron. 18, 235–265. doi: 10.1016/S1161-0301(02)00107-7
Kitajima, K., and Hogan, K. P. (2003). Increases of chlorophyll a/b ratios during acclimation of tropical woody seedlings to nitrogen limitation and high light. Plant Cell Environ. 26, 857–865. doi: 10.1046/j.1365-3040.2003.01017.x
Luo, X., and Keenan, T. F. (2020). Global evidence for the acclimation of ecosystem photosynthesis to light. Nat. Ecol. Evol. 4, 1351–1357. doi: 10.1038/s41559-020-1258-7
McCree, K. J., and Troughton, J. H. (1966). Prediction of growth rate at different light levels from measured photosynthesis and respiration rates. Plant Physiol. 41, 559–566. doi: 10.1104/pp.41.4.559
Mendes, M. M., Gazarini, L. C., and Rodrigues, M. L. (2001). Acclimation of Myrtus communis to contrasting Mediterranean light environments — effects on structure and chemical composition of foliage and plant water relations. Environ. Exp. Bot. 45, 165–178. doi: 10.1016/S0098-8472(01)00073-9
Niinemets, U., Kull, O., and Tenhunen, J. D. (2004). Within-canopy variation in the rate of development of photosynthetic capacity is proportional to integrated quantum flux density in temperate deciduous trees. Plant Cell Environ. 27, 293–313. doi: 10.1111/j.1365-3040.2003.01143.x
Noguchi, K., Nakajima, N., and Terashima, I. (2001). Acclimation of leaf respiratory properties in Alocasia odora following reciprocal transfers of plants between high- and low-light environments. Plant Cell Environ. 24, 831–839. doi: 10.1046/j.1365-3040.2001.00728.x
Poorter, H., Niinemets, Ü, Ntagkas, N., Siebenkäs, A., Mäenpää, M., Matsubara, S., et al. (2019). A meta-analysis of plant responses to light intensity for 70 traits ranging from molecules to whole plant performance. New Phytol. 223, 1073–1105. doi: 10.1111/nph.15754
Poorter, H., Niinemets, Ü, Poorter, L., Wright, I. J., and Villar, R. (2009). Causes and consequences of variation in leaf mass per area (LMA): a meta-analysis. New Phytol. 182, 565–588. doi: 10.1111/j.1469-8137.2009.02830.x
Porra, R. J., Thompson, W. A., and Kriedemann, P. E. (1989). Determination of accurate extinction coefficients and simultaneous equations for assaying chlorophylls a and b extracted with four different solvents: verification of the concentration of chlorophyll standards by atomic absorption spectrosco. Biochim. Biophys. Acta Bioenerg. 975, 384–394. doi: 10.1016/S0005-2728(89)80347-0
Retkute, R., Smith-Unna, S. E., Smith, R. W., Burgess, A. J., Jensen, O. E., Johnson, G. N., et al. (2015). Exploiting heterogeneous environments: does photosynthetic acclimation optimize carbon gain in fluctuating light? J. Exp. Bot. 66, 2437–2447. doi: 10.1093/jxb/erv055
Rozendaal, D. M. A., Hurtado, V. H., and Poorter, L. (2006). Plasticity in leaf traits of 38 tropical tree species in response to light; relationships with light demand and adult stature. Funct. Ecol. 20, 207–216. doi: 10.1111/j.1365-2435.2006.01105.x
Sharkey, T. D. (1985). Photosynthesis in intact leaves of C3 plants: Physics, physiology and rate limitations. Bot. Rev. 51, 53–105. doi: 10.1007/BF02861058
Stinziano, J. R., Morgan, P. B., Lynch, D. J., Saathoff, A. J., McDermitt, D. K., and Hanson, D. T. (2017). The rapid A-Ci response: photosynthesis in the phenomic era. Plant. Cell Environ. 40, 1256–1262. doi: 10.1111/pce.12911
Strauss-Debenedetti, S., and Bazzaz, F. A. (1991). Plasticity and acclimation to light in tropical Moraceae of different sucessional positions. Oecologia 87, 377–387. doi: 10.1007/BF00634595
Szechyńska-Hebda, M., Kruk, J., Górecka, M., Karpińska, B., and Karpiński, S. (2010). Evidence for light wavelength-specific photoelectrophysiological signaling and memory of excess light episodes in Arabidopsis. Plant Cell 22, 2201–2218. doi: 10.1105/TPC.109.069302
Talhouët, A., Meyer, S., Baudin, X., and Streb, P. (2020). Dynamic acclimation to sunlight in an alpine plant, Soldanella alpina L. Physiol. Plant. 168, 563–575. doi: 10.1111/ppl.12982
Trouwborst, G., Oosterkamp, J., Hogewoning, S. W., Harbinson, J., and van Ieperen, W. (2010). The responses of light interception, photosynthesis and fruit yield of cucumber to LED-lighting within the canopy. Physiol. Plant. 138, 289–300. doi: 10.1111/J.1399-3054.2009.01333.X
Turnbull, M. H., Doley, D., and Yates, D. J. (1993). The dynamics of photosynthetic acclimation to changes in light quanlity and quality in three Australian rainforest tree species. Oecologia 94, 218–228. doi: 10.1007/BF00341320
Valladares, F., Wright, S. J., Lasso, E., Kitajima, K., and Pearcy, R. W. (2000). Plastic phenotypic response to light of 16 congeneric shrubs from a panamanian rainforest. Ecology 81, 1925–1936.
Vialet-Chabrand, S., Matthews, J. S. A., Simkin, A. J., Raines, C. A., and Lawson, T. (2017). Importance of fluctuations in light on plant photosynthetic acclimation. Plant Physiol. 173, 2163–2179. doi: 10.1104/pp.16.01767
Wei, Z., Duan, F., Sun, X., Song, X., and Zhou, W. (2021). Leaf photosynthetic and anatomical insights into mechanisms of acclimation in rice in response to long-term fluctuating light. Plant. Cell Environ. 44, 747–761. doi: 10.1111/pce.13954
Wu, A., Song, Y., van Oosterom, E. J., and Hammer, G. L. (2016). Connecting biochemical photosynthesis models with crop models to support crop improvement. Front. Plant Sci. 7:1518. doi: 10.3389/fpls.2016.01518
Wu, J. W., Su, Y., Wang, J. H., He, Q., Qiu, Q., Ma, J. W., et al. (2018). Morphological and physiological acclimation of Catalpa bungei plantlets to different light conditions. Photosynthetica 56, 537–548. doi: 10.1007/s11099-017-0706-3
Yin, X., and van Laar, H. H. (2005). Crop Systems Dynamics: An Ecophysiological Simulation Model for Genotype-by-Environment Interactions. Wageningen: Wageningen Academic Publishers.
Yu, L., Fujiwara, K., and Matsuda, R. (2022). Recent levels of daily photosynthetic photon flux density have a larger influence on light acclimation responses of cucumber leaves than earlier levels. Hortic. Environ. Biotechnol. 63, doi: 10.1007/s13580-021-00375-6
Keywords: chlorophyll a/b ratio, photosynthetic capacity, regression model, leaf mass per area, photosynthetic photon flux density, light emitting diode
Citation: Yu L, Fujiwara K and Matsuda R (2022) Estimating Light Acclimation Parameters of Cucumber Leaves Using Time-Weighted Averages of Daily Photosynthetic Photon Flux Density. Front. Plant Sci. 12:809046. doi: 10.3389/fpls.2021.809046
Received: 04 November 2021; Accepted: 31 December 2021;
Published: 08 February 2022.
Edited by:
Naoki Hirotsu, Toyo University, JapanReviewed by:
Elias Kaiser, Wageningen University and Research, NetherlandsCopyright © 2022 Yu, Fujiwara and Matsuda. This is an open-access article distributed under the terms of the Creative Commons Attribution License (CC BY). The use, distribution or reproduction in other forums is permitted, provided the original author(s) and the copyright owner(s) are credited and that the original publication in this journal is cited, in accordance with accepted academic practice. No use, distribution or reproduction is permitted which does not comply with these terms.
*Correspondence: Liyao Yu, eXVsaXlhby1nc2Fsc0BnLmVjYy51LXRva3lvLmFjLmpw; Ryo Matsuda, YW1hdHN1ZGFAbWFpbC5lY2MudS10b2t5by5hYy5qcA==
Disclaimer: All claims expressed in this article are solely those of the authors and do not necessarily represent those of their affiliated organizations, or those of the publisher, the editors and the reviewers. Any product that may be evaluated in this article or claim that may be made by its manufacturer is not guaranteed or endorsed by the publisher.
Research integrity at Frontiers

Learn more about the work of our research integrity team to safeguard the quality of each article we publish.