
95% of researchers rate our articles as excellent or good
Learn more about the work of our research integrity team to safeguard the quality of each article we publish.
Find out more
ORIGINAL RESEARCH article
Front. Plant Sci. , 21 January 2022
Sec. Plant Breeding
Volume 12 - 2021 | https://doi.org/10.3389/fpls.2021.803820
This article is part of the Research Topic Soybean Molecular Breeding and Genetics View all 25 articles
 Jiajing Wang1†
 Bo Hu1†Yuliang Jing2Xiping Hu3Yue Guo1Jiankun Chen1Yuxi Liu1Jianhui Hao1
 Wen-Xia Li1*
 Hailong Ning1*
Soybean is an important global crop for edible protein and oil, and plant height is a main breeding goal which is closely related to its plant shape and yield. In this research, a high-density genetic linkage map was constructed by 1996 SNP-bin markers on the basis of a recombinant inbred line population derived from Dongnong L13 × Henong 60. A total of 33 QTL related to plant height were identified, of which five were repeatedly detected in multiple environments. In addition, a 455-germplasm population with 63,306 SNP markers was used for multi-locus association analysis. A total of 62 plant height QTN were detected, of which 26 were detected repeatedly under multiple methods. Two candidate genes, Glyma.02G133000 and Glyma.05G240600, involving in plant height were predicted by pathway analysis in the regions identified by multiple environments and backgrounds, and validated by qRT-PCR. These results enriched the soybean plant height regulatory network and contributed to molecular selection-assisted breeding.
Soybean [Glycine max (L.) Merr.] is one of the most important crops in the world as a major source of protein and oil (Feng et al., 2021). Plant height (PH) as the main trait of soybean plant shape is related to soybean yield (Assefa et al., 2019). Low plants result in lower yields, while too high plants are prone to yield reduction due to lodging. Plant height also affects yield through other traits such as number of pods per plant and number of nodes in the main stem (Chang et al., 2018; Li M. W. et al., 2020). PH wass a complex quantitative trait which was controlled by multiple genes and influenced by environmental conditions (Lee et al., 1996).
With the objective to breeding efficiently, QTL mapping for PH were conducted by linkage and genome-wide association analysis (GWAS) analysis. Based on the bi-parent derived populations and linkage analysis (Xu et al., 2017), 238 QTLs associated with plant height had been listed on all 20 chromosomes.1 In these researches, most of the linkage maps were constructed by low-throughput molecular markers such as restriction fragment length polymorphism (RFLP), amplified fragment length polymorphism (AFLP), and simple sequence repeat (SSR) markers, which led to low marker density, large genomic region intervals for QTL localization. It was difficult to predict candidate genes and design marker-assisted selection for PH. With the continuous development of molecular markers, high-throughput and high-density single nucleotide polymorphism markers (SNPs) were used as major markers for linkage analysis for mapping QTL (Adewusi et al., 2017; Gomez-Casati et al., 2017; Zhang et al., 2019; Karikari et al., 2020; Tian et al., 2020; Salari et al., 2021; Silva et al., 2021). In order to construct effective linkage intervals to identify QTL, SNP bin maker technology were gradually used in construction of linkage map. Cao et al. (2019) constructed two linkage maps by 3,958 and 2,600 SNP bin markers for two RIL populations, and identified 8 and 12 PH QTL on chromosomes 2,5,6,7,9,10,15,16,17, and 19 explaining 1.8–50.7% of the phenotypic variation, respectively. Wang et al. (2021) constructed a high-density map containing 2225 bin markers and detected 39 PH QTLs on chromosome 5, 6, 7, 9, 10, 12, 15, 16, 18, and 20, and the phenotypic variation explanation (PVE) ranged from 1.11 to 18.99 % based on a recombinant inbred line population of soybean. The second method for detecting QTL was GWAS, which has been extensively studied through recombinant inbred lines and germplasm populations of soybean (Lü et al., 2016; Qi et al., 2020; Song et al., 2020). With the objective of overcoming the shortage of false positives (Sonah et al., 2015), combinations of linkage and association analysis were gradually used in detecting genome regions controlling quantitative traits (Zhang et al., 2019; Song et al., 2020; Li X. et al., 2021). However, few studies combining both methods have been conducted on PH of soybean.
Based on the results of linkage and GWAS, some genes controlling PH formation were gradually mined, such as GA20ox, GA2ox, GA3ox (Fernandez et al., 2009), and GmDW1 (Li et al., 2018), Glyma.01G023100, Glyma.03G207700, Glyma.12G182500, Glyma.16G137500, Glyma.20G122200, Glyma.20G122300 (Jing et al., 2019), and Glyma.11g145500,Glyma.13g139000, Glyma.13g339800 and Glyma.19g006100 (Han et al., 2021). With pleiotropism, some genes controlled simultaneously multiple traits, for example, such as genetic loci Dw3 and Ma1 (Higgins et al., 2014), PH24 (Zhang et al., 2015), and uqA07-5 (Shen et al., 2018), and genes GmTOE4a (Zhao et al., 2015), GmAP1 (Chen et al., 2020), and Dt1 (Yue et al., 2021), GmGIa and GmFPA (Han et al., 2021) control flowering time and PH in soybean. GmTFL1b determines PH and growth habit, which a candidate gene for Dt1 (Liu et al., 2010).
In this research, QTL/QTN localization of soybean plant height was performed via linkage analysis of a recombinant inbred lines and GWAS of a 455-germplasm population. In the region of QTL/QTN, candidate genes related to PH formation were predicted and initially validated by qRT-PCR. The objective of this research was to lay foundation for probing genetic basis and molecular assistant selection of PH.
Two soybean varieties with large differences in PH, Dongnong L13 obtained from a cross between Heinong 40 and Jiujiao 5640 and Henong 60 obtained from a cross between Beifeng 11 and Hobbit, were used as parents to mate cross in 2008 in Harbin, Heilongjiang Province (E 126.63°, N 45.75°). F1 was planted in Yacheng City, Hainan Province (E 109.00°, N 17.50°) in the winter of the same year. After five consecutive generations from 2010 to 2014 by planting in Harbin and Yacheng alternatively, 139 recombinant inbred lines were obtained and a population formed and were used to conduct linkage analysis. Furthermore, a 455-germplasm population, including 4 local soybean varieties, 387 domestic varieties and 44 foreign varieties, was used for GWAS. The variety name was described and published earlier by Li X. et al. (2020).
RIL6013 were planted in eight environments at three locations: Harbin (E 126.63°, N 45.75°), Keshan (E 125.64°, N 48.25°) and Shuangcheng (E 126.92°, N 45.75°). About 455 germplasm resources were planted in Harbin and Shuangyashan (E 131.16°, N 46.64°) in 2018 and 2019, respectively. The detail information for each plant environment was summarized in Supplementary Table 1. The field experiments were conducted in a randomized block in replication design (RBRD). RBRD is a randomized incomplete block design with three replicates used in each environment. With the objective to eliminate the difference of blot among large amounts of lines in a replicate (block), the replicates were divided into multiple sub-blocks which contain about 15 lines. Three ridges were contained in on blot, and the ridges were 3 m in length and 0.67 m in width. The seeds were sowed in single row on the ridges with the plant space set 0.07. The whole experiments were managed as the same as local field production. Ten plants were randomly selected from each blot to determine PH at the maturity stage. The average value of the 10 plants was used as the observation value of the plot, and finally the average value of the three blots was used for QTL and QTN mapping.
Frequency distribution histograms were drawn from the phenotypic data of PH in each environment and descriptive statistics were performed. Analysis of variance (ANOVA) and estimation of generalized heritability were also performed as Li X. et al. (2021). The statistical model for the multi-environment ANOVA for RBRD was showed as follows:
where μ is the grand average, Gi is the ith genotype effect, Ee is the eth environment effect, Ri is the jth replication effect, Bk is the kth block in jth replicate, RBjk is the interaction effect between jth replication and kth block, Bk(Gi ) is ith genotype in kth block, ERej is interaction between eth environment and jth replication, EBek is interaction between eth environment and kth block, ERBejk is interaction effect among eth environment and jth replication and kth block, EBek(Gi) is ith genotype under interaction of eth environment and kth block, and εeijk is the error effect following N(0, σ2). The broad-sense heritability in multiple environments was showed as following:
where h2 is the broad sense generalized heritability of average in over multiple environments,is the variance of genotype under block,is the variance of genotype under environment × block interaction, σ2 is the error variance, e is the number of environments, and r is the number of repetitions in each environment. Significance of each factor was tested by the general linear model method and variance were estimated using mixed method implemented by SAS 9.2 (SAS Institute, Cary, NC, United States).
DNA samples extracted by CTAB method from RIL6013 were genotyped for SNPs using a soybean SNP660K microarray at Beijing Boao Biotechnology Co., Ltd. A total of 54,836 SNPs were screened on 20 chromosomes. A total of 63,306 SNPs were screened on 20 chromosomes using a soybean SNP180K microarray for SNP genotyping of 455 DNA samples from germplasm resources at Beidahuang Kenfeng Seed Co., Ltd. The obtained SNP markers were screened according to the following criteria: minimum allele frequency for markers (MAF > 5%) and maximum deletion rate <10% for each SNP (Belamkar et al., 2016).
Here the SNP data from RIL6013 was used to identify possible crossovers via python 2.7snpbinner, and the minimum distance between crossovers is 0.2% of the chromosome length. The aggregated breakpoints generated from the crossover points were then used to create representative bins for the entire population (minimum distance of 30 kb per bin). The obtained bin markers were used to construct a high-density genetic linkage map of SNPbins using the.map function (Linkage map construction) in the software QTL IcimappingV 4.1 (Wang, 2009).
QTL IcimappingV 4.1 (Wang, 2009) software was used to locate additive QTL using two mapping methods: interval mapping (IM-ADD) and inclusive composite interval mapping (ICIM-ADD). The scan step was set to 1.00 cM and the LOD threshold was set to 2.50. The PIN value of the ICIM-ADD method was set to 0.001. The QTL were named using the method of McCouch (1997).
The population structure and LD of the germplasm resource population were described and published earlier by Li X. et al. (2020). The germplasm resource population consisted of two subpopulations containing 132 (29.01%) and 323 (70.99%) lineages, respectively (K = 2). And the physical distance of LD decay was estimated as the position where r2 dropped to half of its maximum value, the LD decay distance was estimated to be 86 kb.
Genome-wide association analysis was performed using the mrMLM.GUI package (Zhang et al., 2020), and the six methods (mrMLM (Wang et al., 2016), FASTmrMLM (Tamba and Zhang, 2018), FASTmrEMMA (Wen et al., 2019), pLARmEB (Zhang et al., 2017), ISIS EM-BLASSO (Tamba et al., 2017), and pKWmEB (Ren et al., 2018) were used to detect significant QTN. In the first stage, the critical p-value parameter was set to 0.005 for all methods except FASTmrEMMA, and the critical LOD value for significant QTN was set to 3 in the final stage. The kinship matrix used in the analysis was also calculated by the software itself.
Genomic regions repeatedly identified in multiple environments or two populations were used to predict genes involving in PH formation. Specifically, the genome region of QTL interval localized in multiple environments with a genomic region less than 300 kb and the LD decay distance of 86 kb of the QTN localized within the QTL genomic region were selected, and the genes were searched for by the Phytozome website.2 The genes expressed in the stems were then screened. Finally, candidate genes related with PH were identified by combining annotation information of genes, pathway analysis in the Kyoto Encyclopedia of Genes and Genomes (KEGG)3 and previous studies.
Two parents (Dongnong L13 and Henong 60), two varieties (HN400 and HN451) with lower PH and two varieties (HN369 and HN477) with higher PH, were selected in the RIL6013 population based on the PH phenotype data. The qRT-PCR was used to study the relative expression of candidate genes in these six varieties. These varieties were planted in Harbin in the same environment as E1. Stems were sampled at 10-day intervals starting from the R1 period when elongation is the fastest. The third node down from the top of the main stem was taken and replicated three times per plant. Total RNA was extracted using the OminiPlant RNA Kit (Dnase I) (CWBIO, Jiangsu, China). Two microgram of total RNA was extracted using the EasyScript® One-Step gDNA Removal and cDNA Synthesis SuperMix kit (TransGen Biotech, Beijing, China). The first strand cDNA was synthesized from 2μg of total RNA using the EasyScript® One-Step gDNA Removal and cDNA Synthesis SuperMix kit (TransGen Biotech, Beijing, China). Twenty microliter reaction volume was determined for qRT-PCR using the SYBR®Green doping method from Roche Light Cycle™ containing the following components: 10 μL SYBR®Green Realtime PCR Master Mix (TOYOBO, Japan), 0.8 μL of each primer (10 μM), 6.4 μL of distilled water and 2 μL of diluted cDNA. The whole reaction was run under the following conditions: pre-denaturation 95°C for 30 s; PCR40 cycles, 95°C for 5 s, 60°C for 20 s, 72°C for 15 s; solubility curve analysis 95°C 10 s, 65°C for 60 s, and 97°C for 1 s. All PCR reactions were repeated three times. Data were processed using the 2–ΔΔCt method using FBOX as the internal reference gene (Bansal et al., 2015), the primers used are shown in Supplementary Table 2.
With the objective to verify the effect of gene and develop markers for molecular assistant selection, the markers with polymorphism in the 100k bp interval of the genes were evaluated for the association with plant height in the 455-germplasm population. The significant differences of averages between allelic genotypes were determined by analysis of variance, and the probability to determine the significance was set 0.05.
Phenotypic data collected from 139 lines of RIL6013 in eight environments were analyzed. 455 germplasm resource populations in four environments were analyzed early by Wang et al. (2021). The results of descriptive statistics (Table 1) showed that the absolute values of kurtosis and skewness were less than 1 in all the eight environments of RIL6013 except E8, which was close to 1. It showed that PH distributed normally (Figure 1). The range of PH in RIL6013 contained those of parents, which indicated a transgressive segregation in the two populations. The coefficient of variation ranged from 13.10 to 22.00% for the RIL6013 population and from 18.03 to 20.31% for the 455-germplasm population, which suggested that a wide range of variation in plant height in two populations and a different genetic basis in different environments.
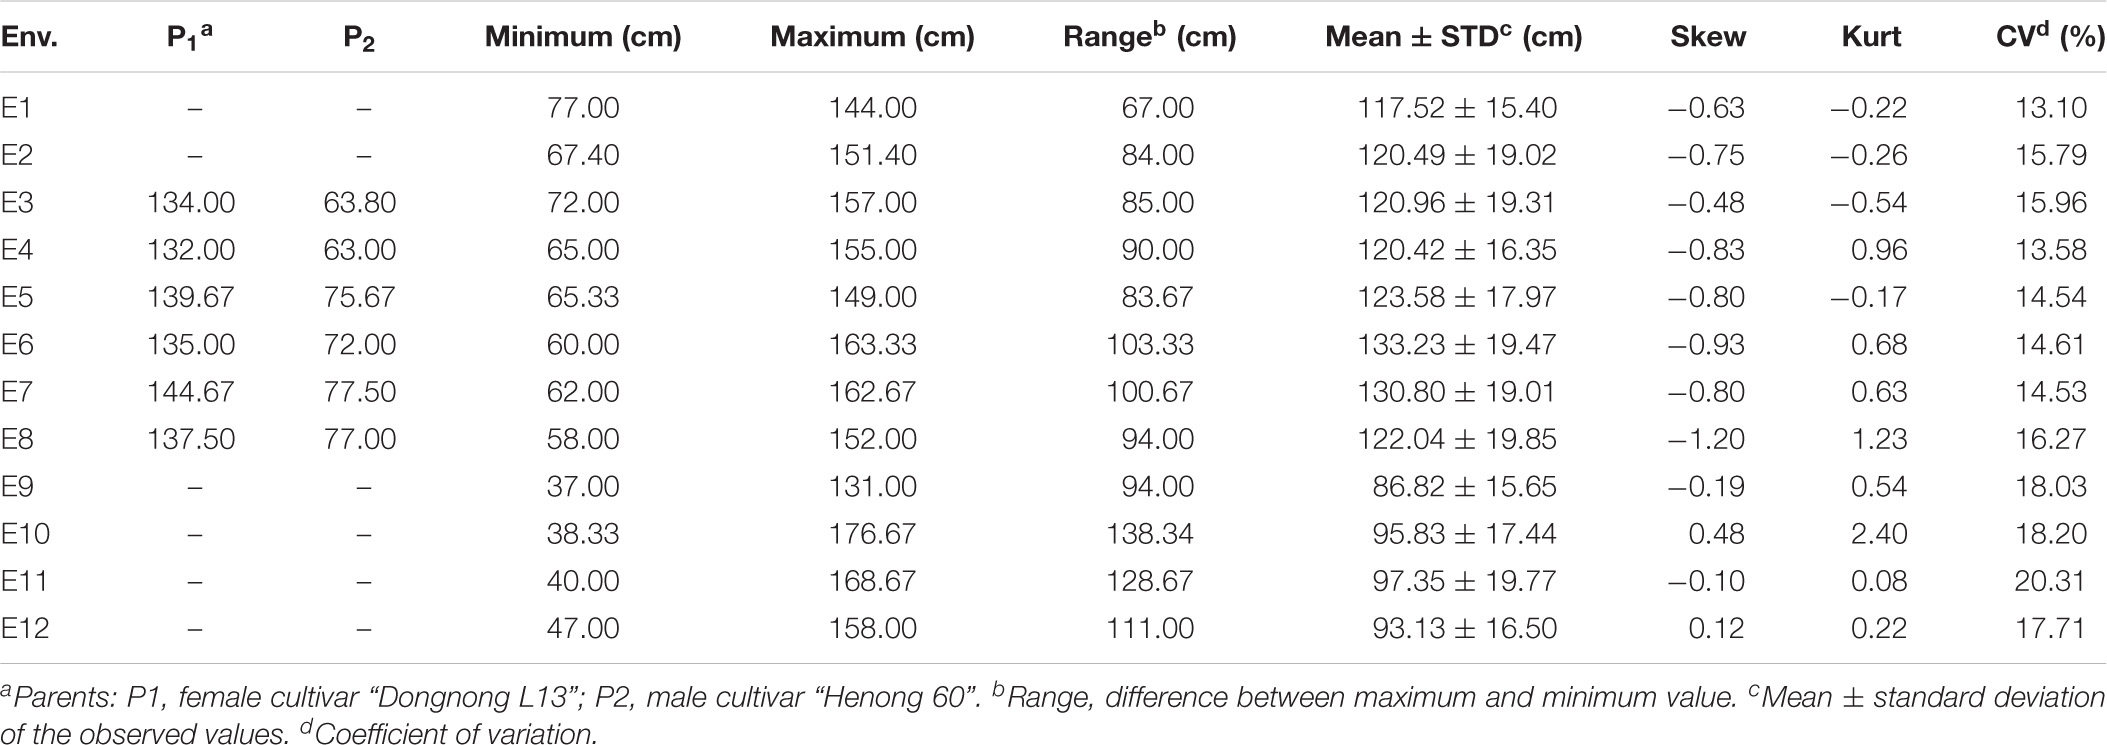
Table 1. Descriptive statistics for soybean plant height of RIL6013 population in eight environments and 455 germplasm resources in four environments.
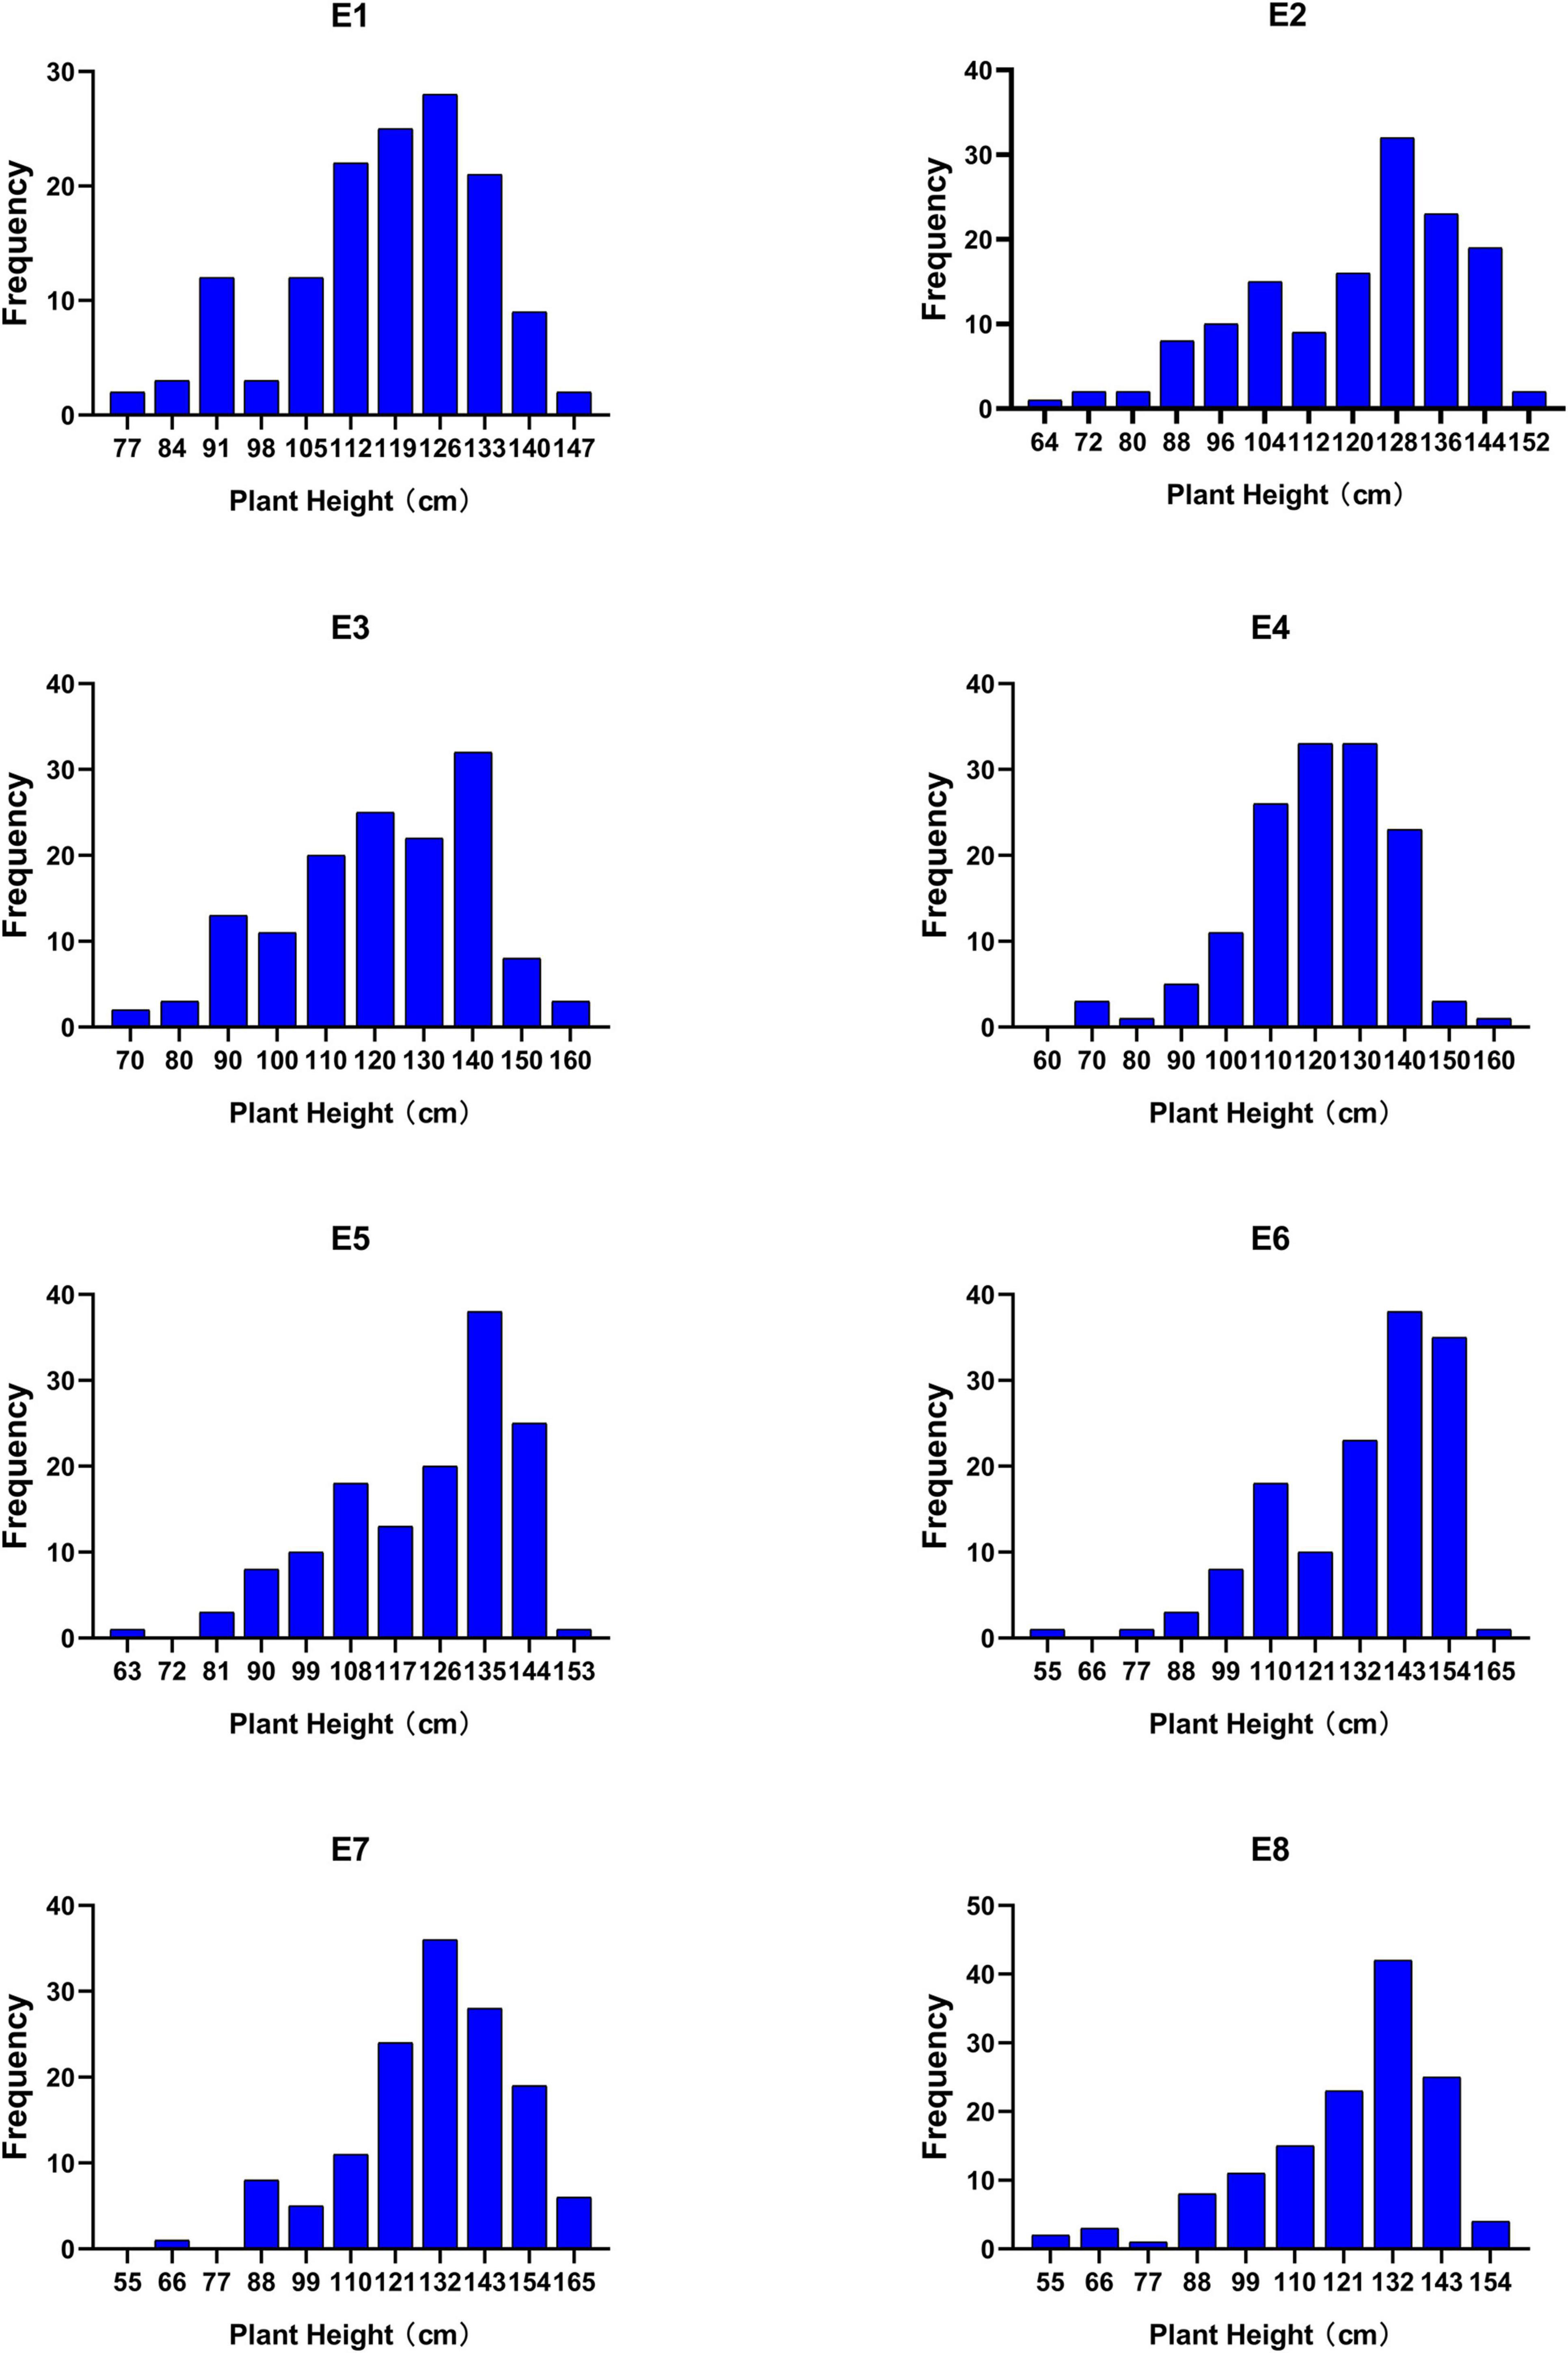
Figure 1. Frequency histograms of plant height in RIL 6013 in eight environments.
The results of ANOVA (Table 2) showed that there were highly significant differences in environment, genotype, and genotype × environment interaction effect, which indicated that PH was influenced not only by genotype and environment but also by genotype by environment interaction effect. Higher broad sense heritability (65 and 72%) was found in RIL6013 and 455 germplasm resource populations, respectively, which indicated that the variation of soybean plant height mainly come from genetic effect.
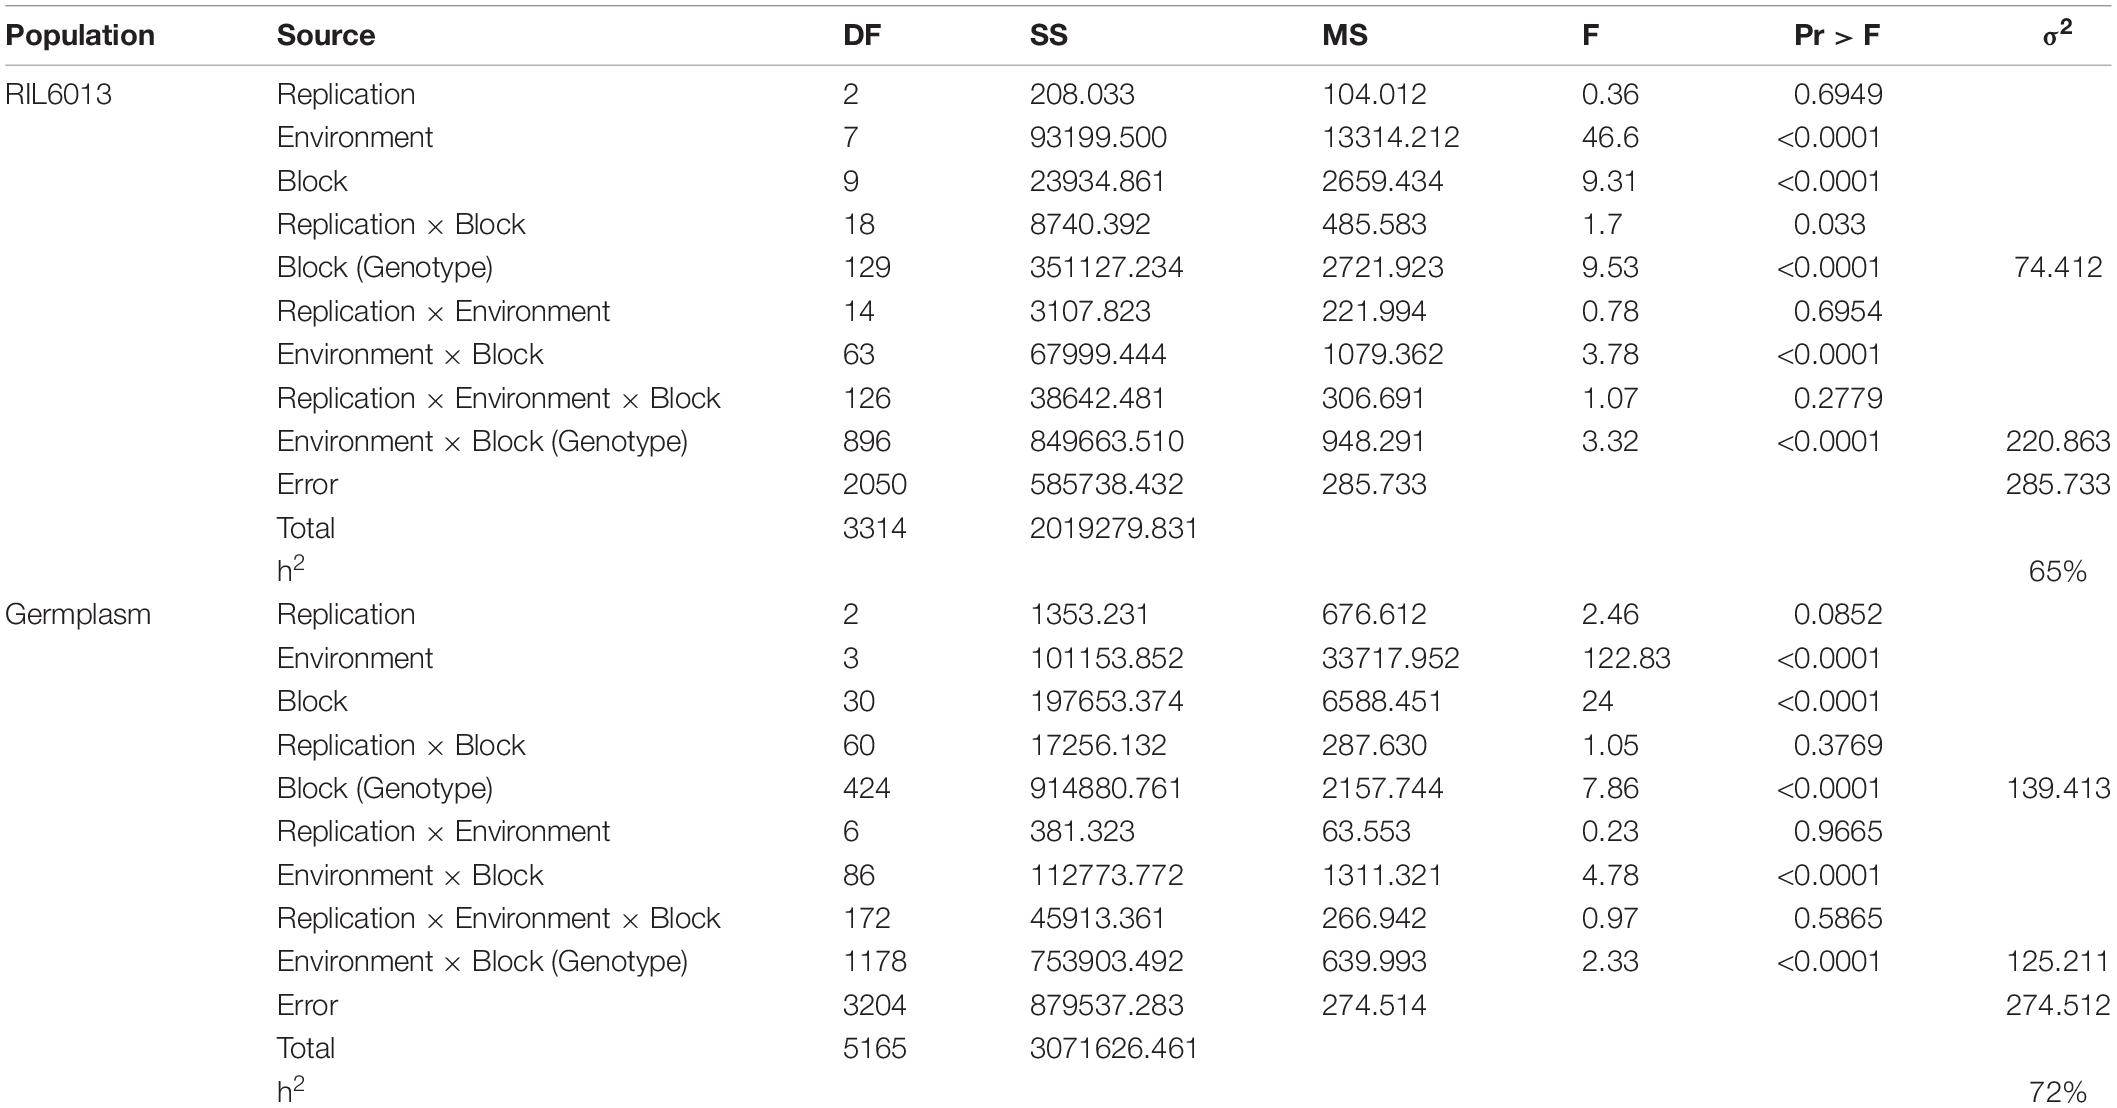
Table 2. Joint ANOVA of PH of RIL6013 population and 455 germplasm resources in multiple environment and heritablity.
A high-density SNP bin genetic linkage map covered all 20 chromosomes containing 1996 bin markers, and the total length of the map was 2874.72 cM. The number of SNP bin markers per chromosome ranged from 59 to 158, and the length of each linkage group ranged from 82.37 to 238.98 cM. The average number of markers per linkage group was 99.8, and the average distance between markers was 1.48 cM (Figure 2 and Table 3).
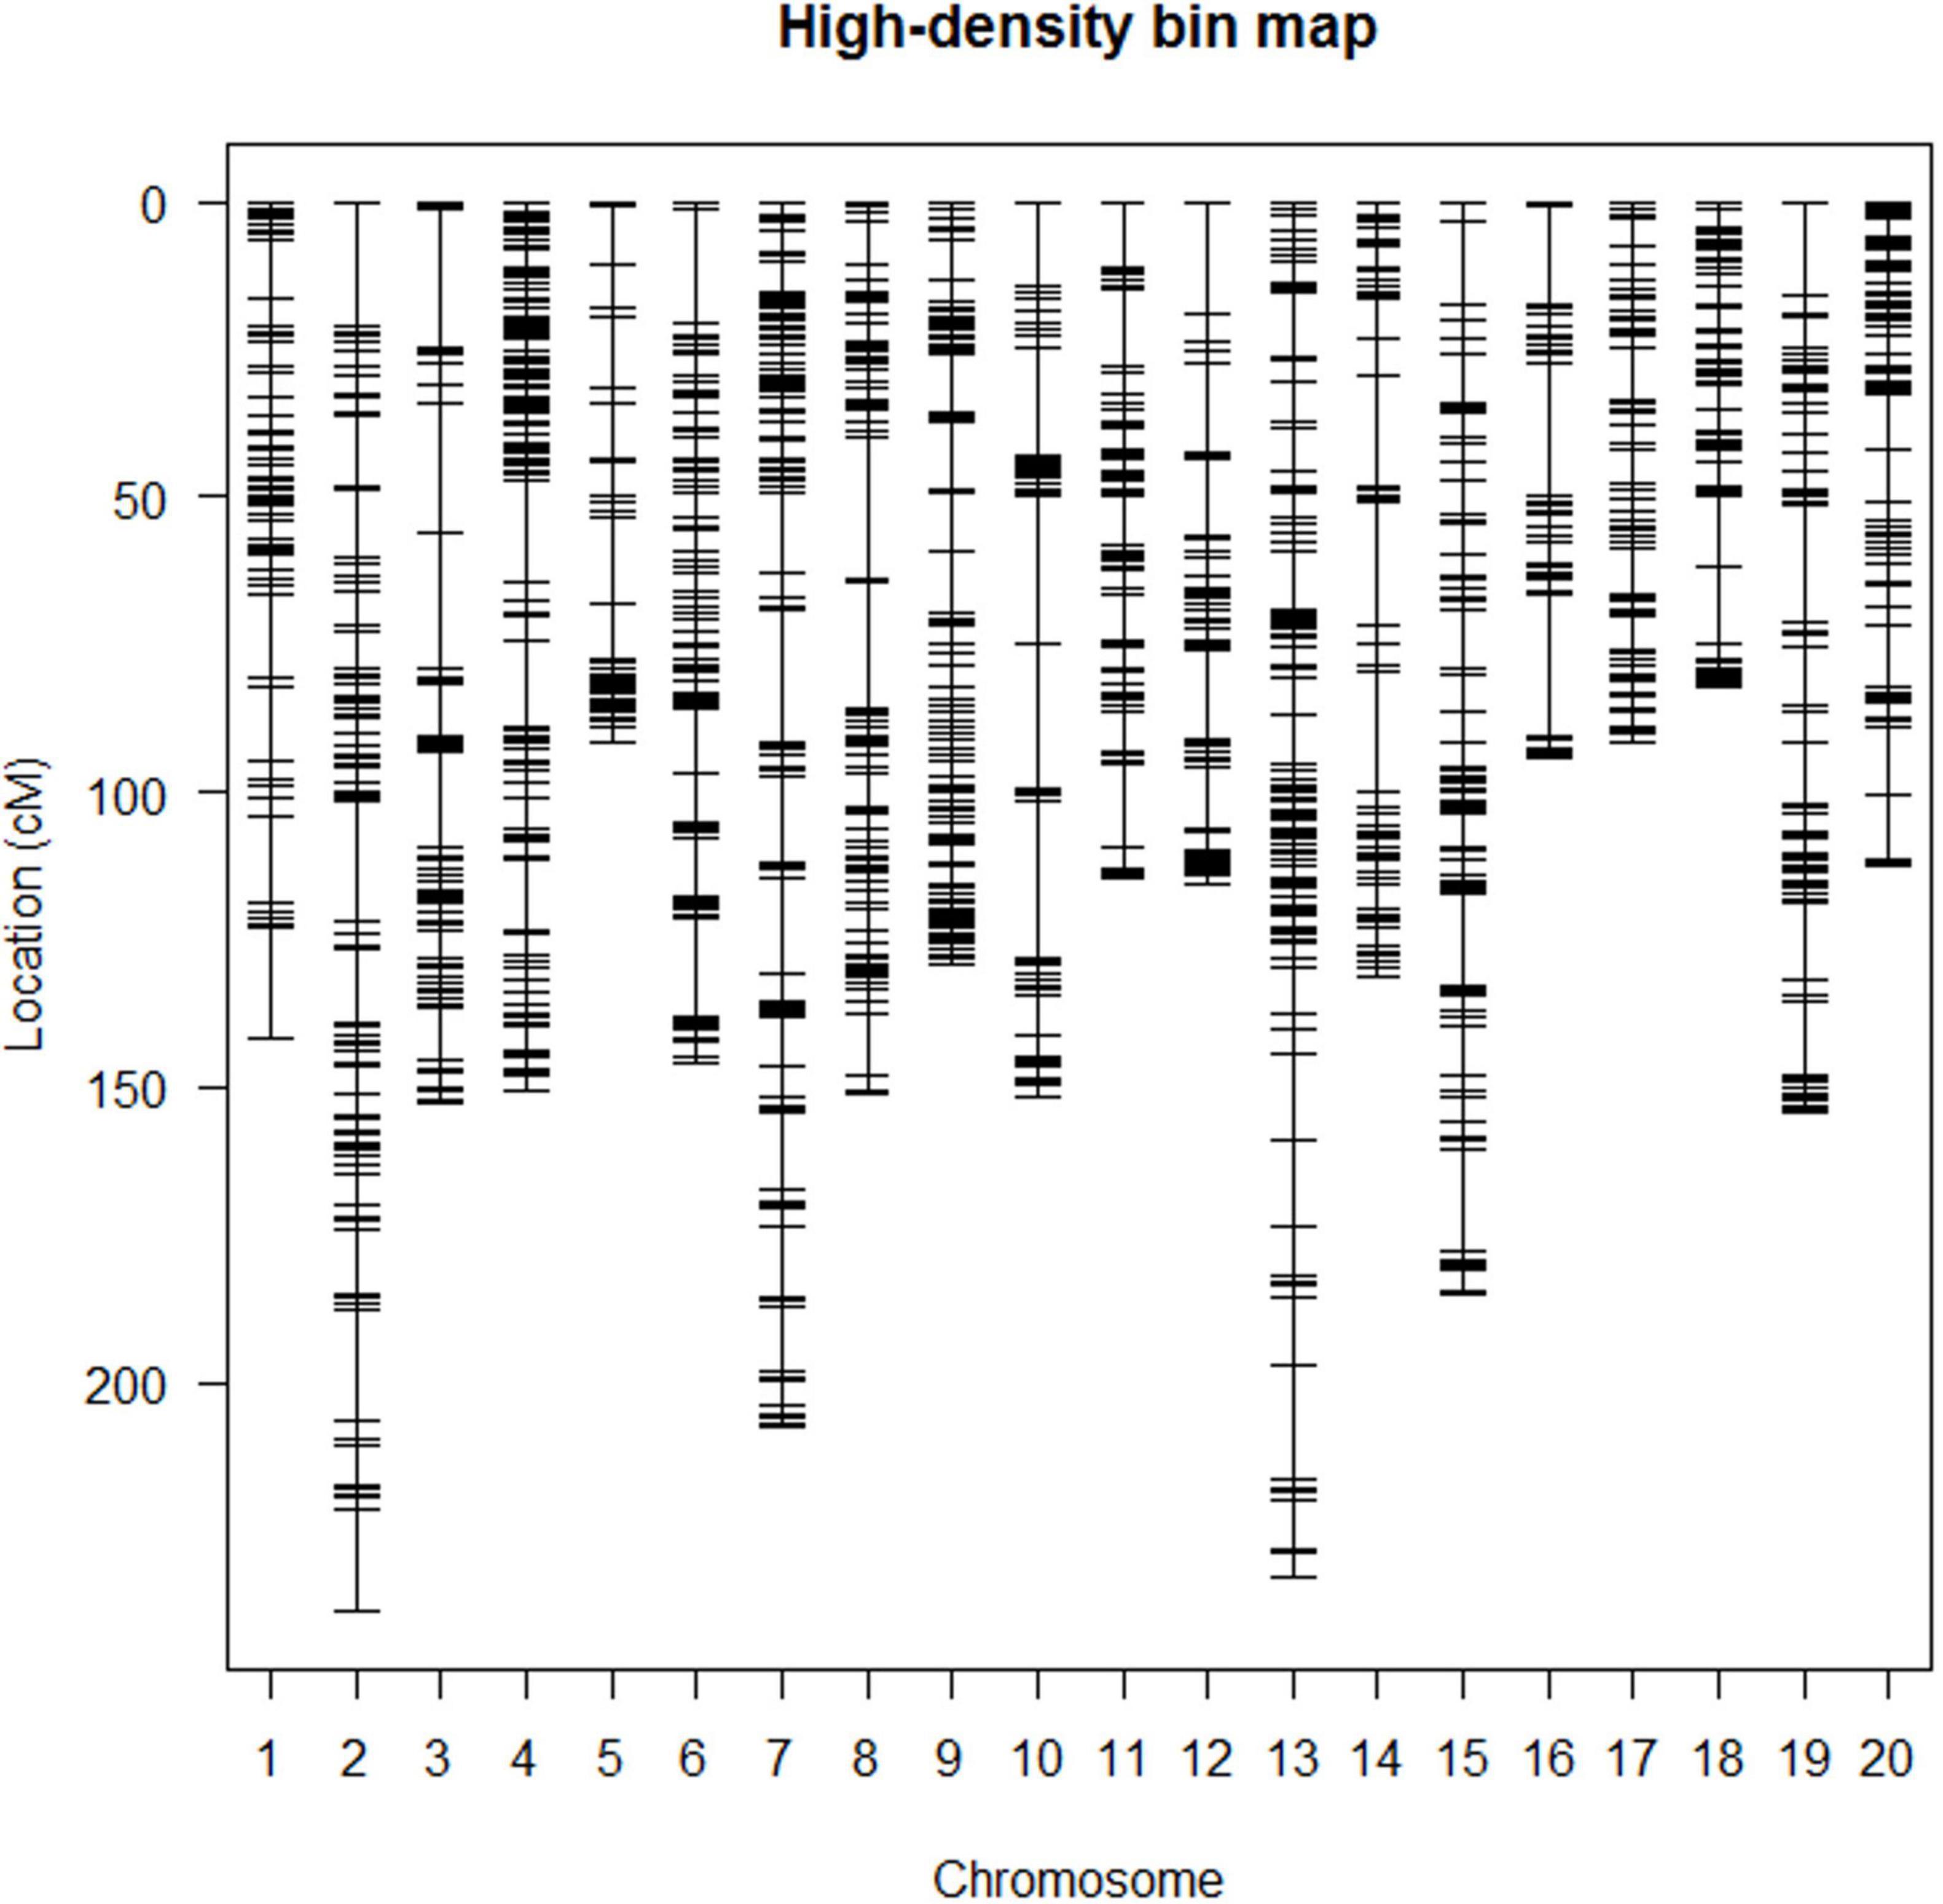
Figure 2. The high-density bin map of RIL6013.
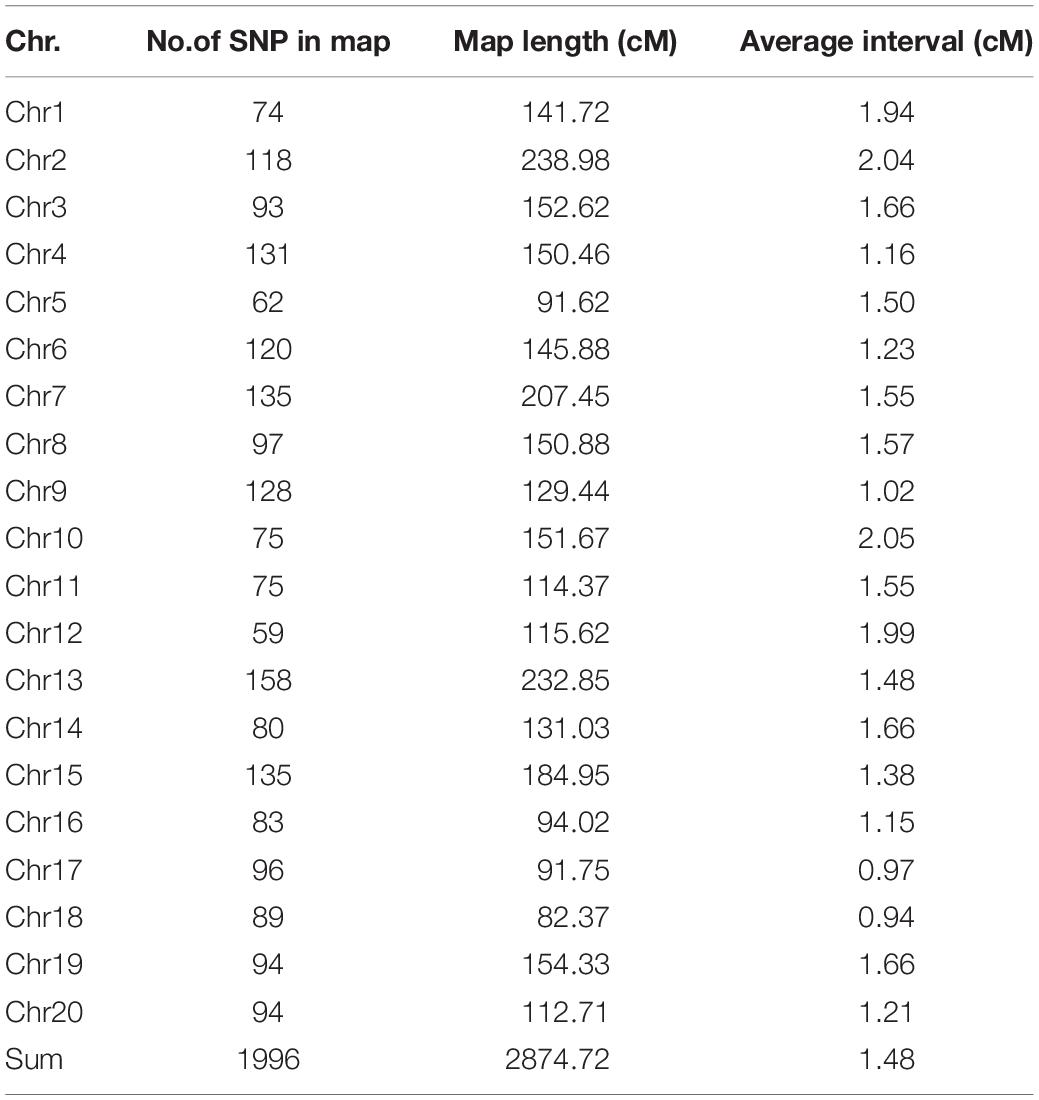
Table 3. Description of characteristics of the 20 linkage groups in the high-density map.
A total of 33 QTLs associated with plant height were localized in the RIL6013 population on 12 chromosomes of soybean using two methods IM and ICIM based on bin mapping (Figure 3 and Supplementary Table 3). The number of QTL localized on each chromosome ranged from one (Chr02, Chr04, Chr12, and Chr13) to six (Chr14), with phenotypic contributions ratio ranging from 0.55 to 13.64%. 2, 16, 6, 9, 1, 1, and 6 QTLs were localized in E2–E8, respectively. A total of three QTL (qPH-1-1, qPH-6-2, and qPH-18-4) showed phenotypic contributions ratio more than 10% and can be considered as the main effective QTL for plant height.
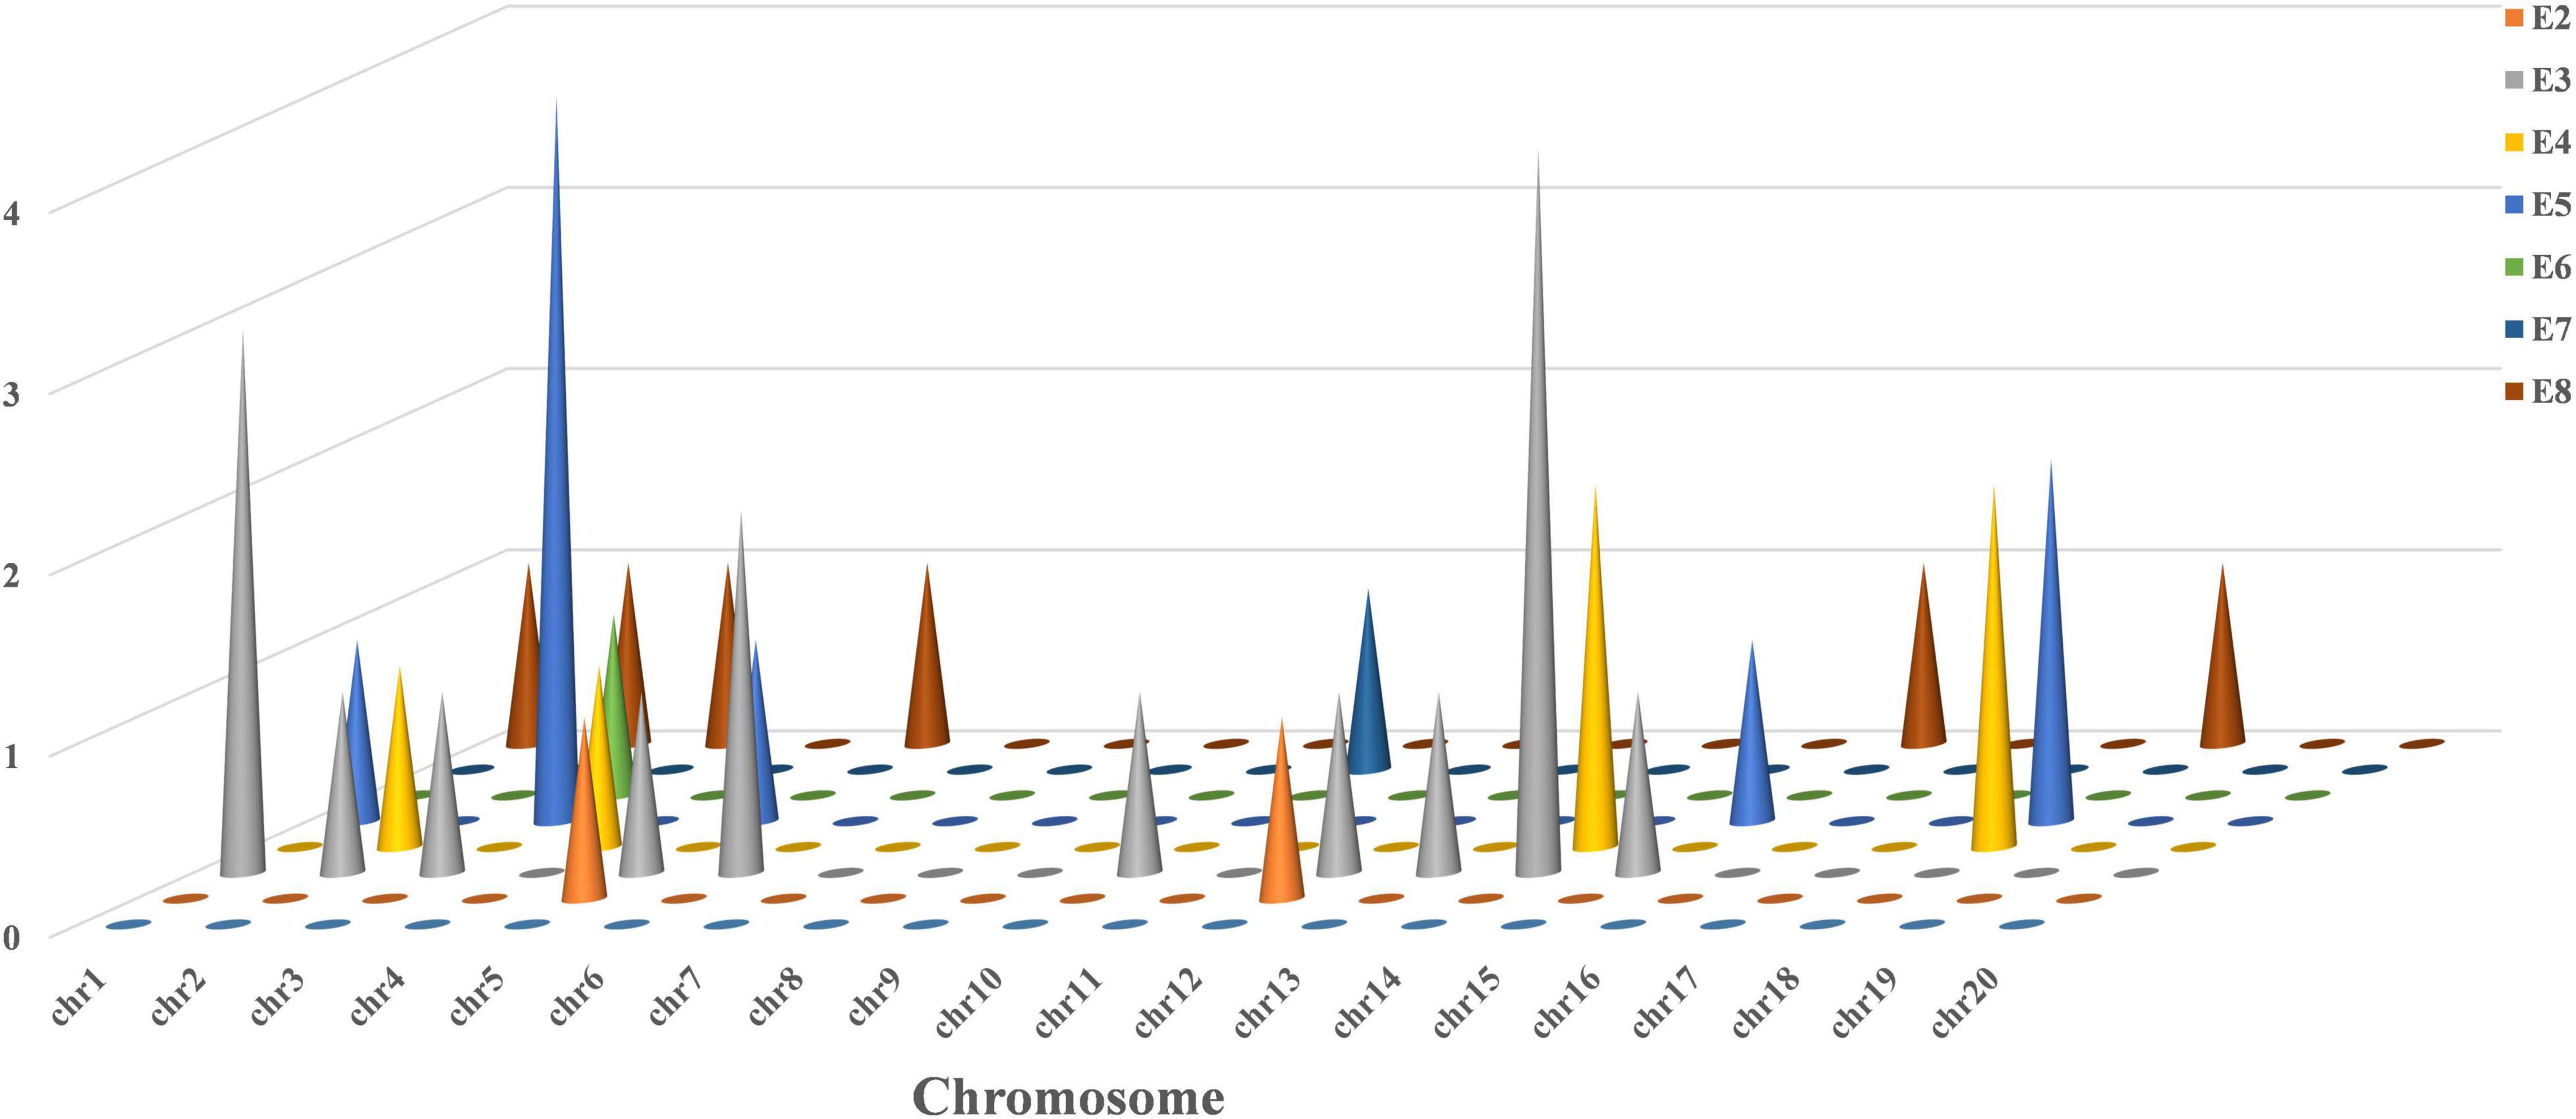
Figure 3. Frequency of QTL for plant height on 20 chromosomes in RIL 6013.
A total of five QTLs were localized in multiple environments (Table 4), and the additive effects were all positive, indicating that the parent Dongnong L13 could increase plant height via these QTL. qPH-2-1 was localized on chr02 in E3, E4, and E8 environments with LOD values of 2.87–3.09 and phenotypic contributions ratio of 1.60–6.46%. The genomic region of qPH-2-1 was shorter than 320kb, which is suitable for searching candidate genes.
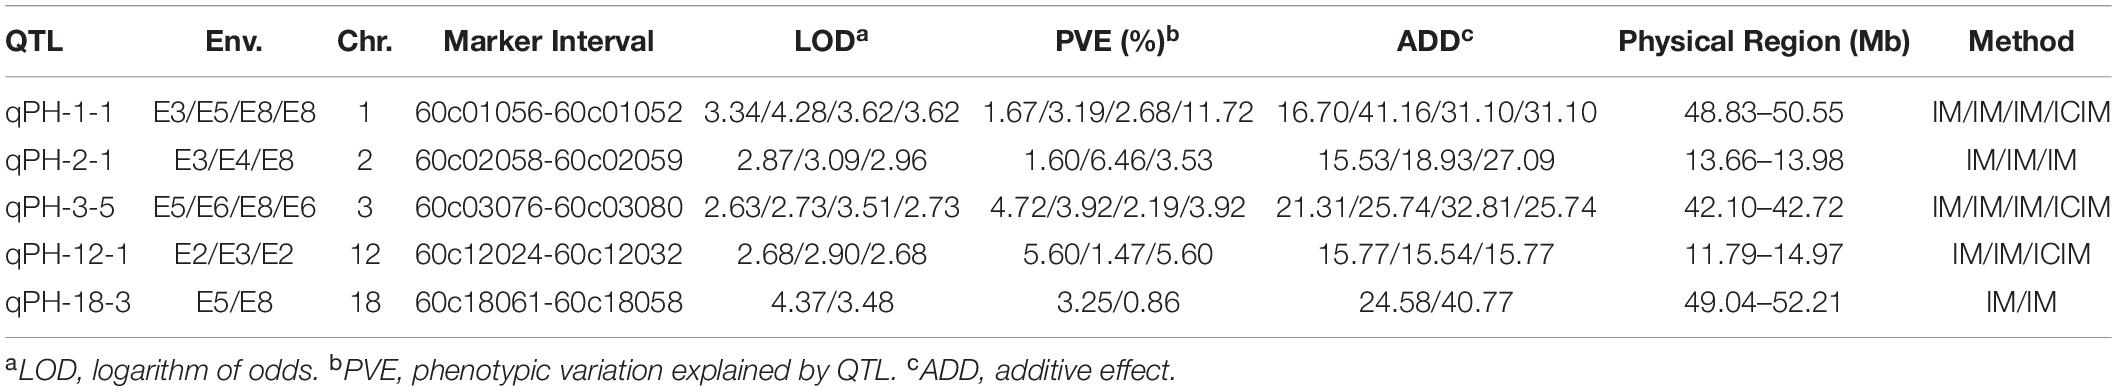
Table 4. Five QTL detected in multiple environments.
A total of 62 QTN were detected on 18 chromosomes (except for chr11 and chr20) using six multilocus methods within the mrMLM package: mrMLM, FASTmrMLM, FASTmrEMMA, pLARmEB, ISIS EM-BLASSO, and pKWmEB, respectively. LOD values ranged from 3.02 to 10.45, and the ratio of phenotypic variation explained by QTN ranged from 1.12 to 13.12%. Six methods detected 20, 10, 3, 18, 25, and 29 QTN, respectively, while 15, 23, 13, and 11 QTN were detected within E1, E2, E3, and E4, respectively.
Of all QTN, 26 detected by multiple methods were located on chromosomes 1, 2, 3, 4, 6, 7, 9, 10, 13, 14, 15, 16, and 18, respectively, with LOD values ranging from 3.04 to 10.45. The proportion of phenotypic variation explained by QTN ranged from 1.12 to 6.62%. The detected QTN effects (positive or negative) were consistent between methods (Wang et al., 2021).
The regions detected by GWAS were compared with those of the linkage analysis. The results showed that two QTN loci fell within the genomic region where the two QTLs identified in the RIL6013 population (Figure 4). Among them, AX-90484715 was located within the interval of qPH-5-4 and AX-90349538 was located within the interval of qPH-14-2. Candidate genes were searched within 43 kb flanking these two QTN loci based on LD distance.
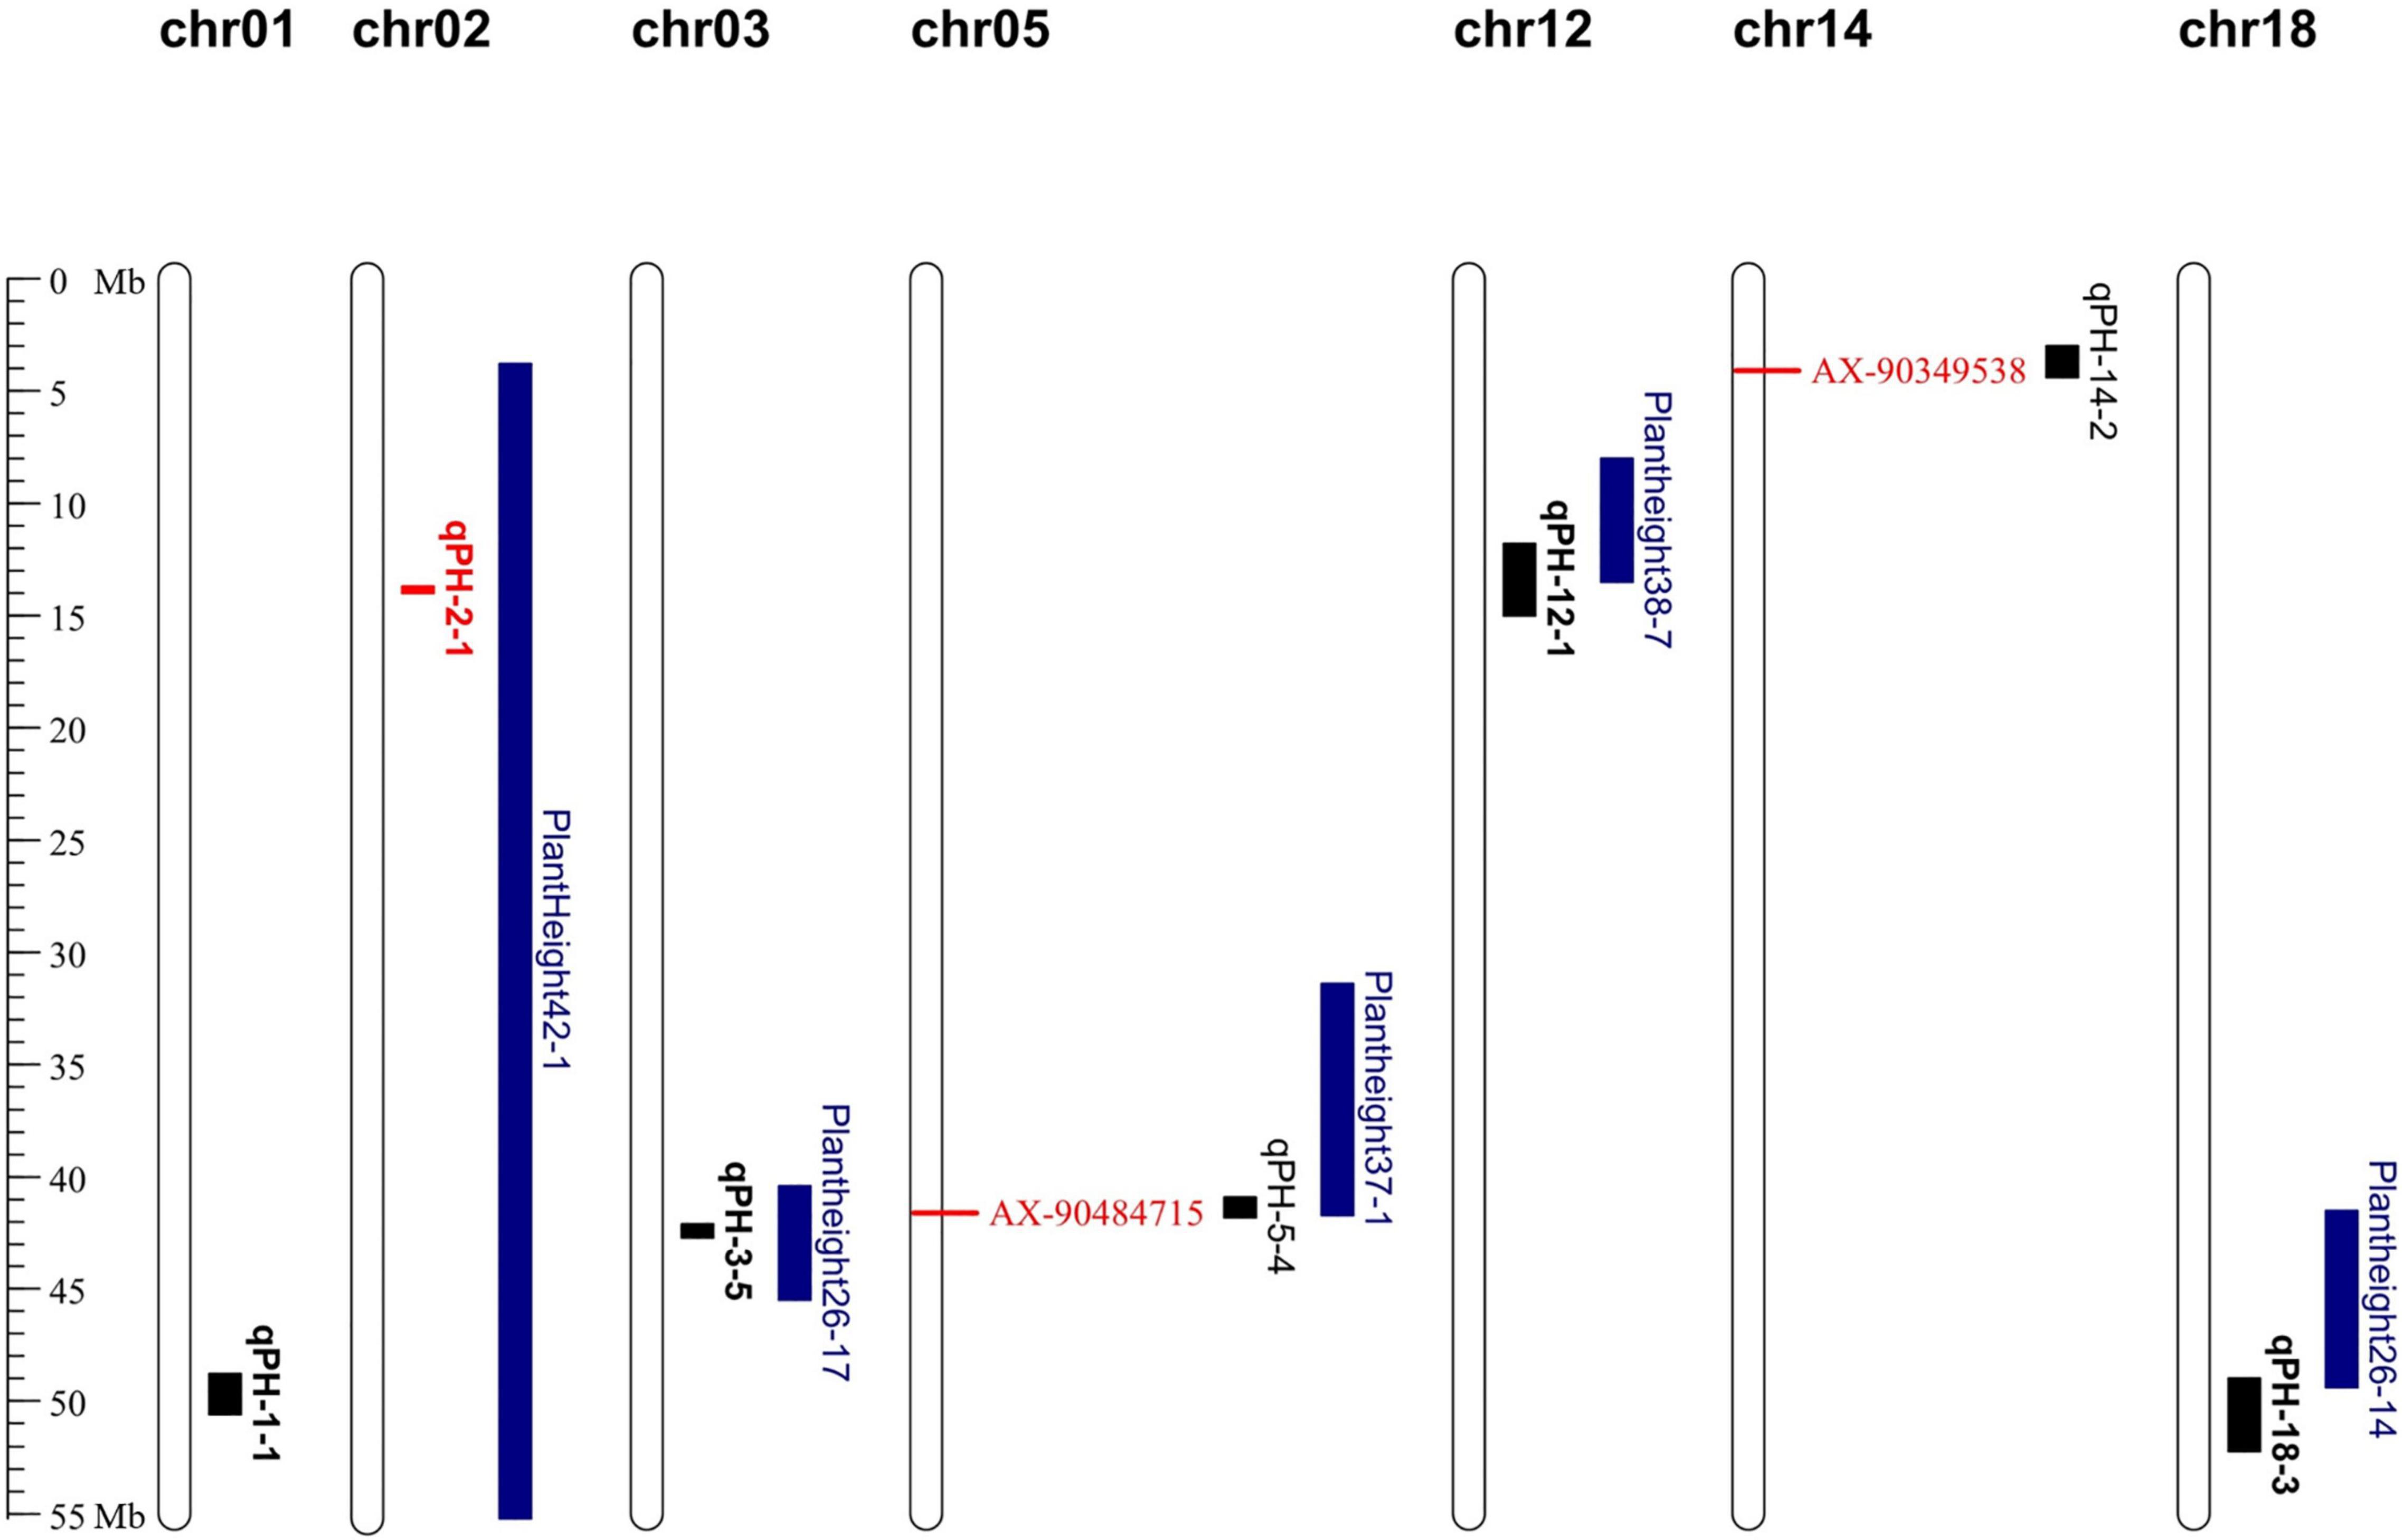
Figure 4. Distribution of QTLs and QTNs for plant height identified in RIL 6013 and the germplasm panel on genome map. Bolded black fonts represent multi-environment QTL, blue fonts represent QTLs in previous studies and red fonts represent QTLs and QTNs that are used to predict candidate genes.
Based on the above results, candidate genes were selected to search within 13.66–13.98 Mb on Chr02, 41.55-41.63Mb on Chr05 and 4.01-4.09Mb on chr14. A total of 50 candidate genes were searched, of which 46 genes were expressed in the stems. The pathway analysis on 46 genes showed that a total of 18 genes (39.1%) had annotations (Supplementary Table 4). Based on the annotation information of KEGG and metabolic function information, three potential candidate genes were predicted that may be directly or indirectly related to PH (Table 5).
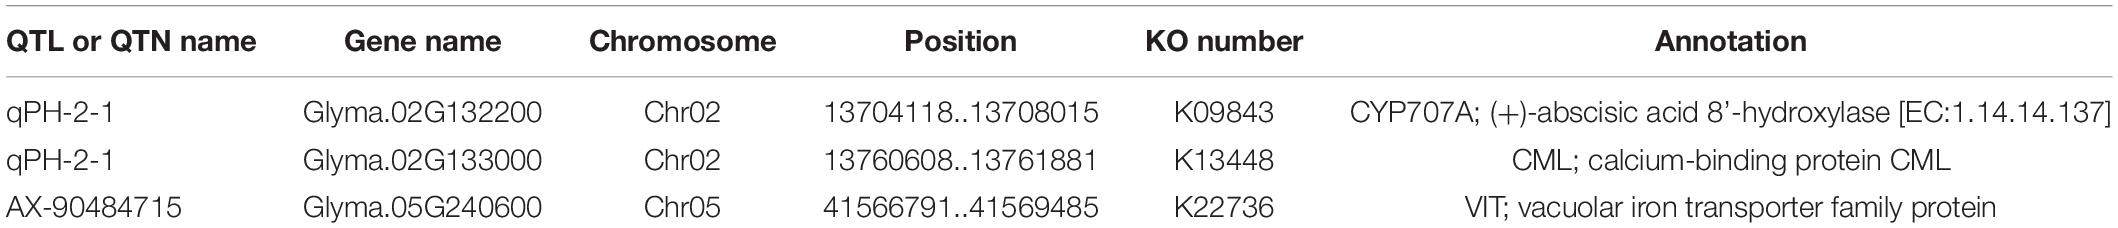
Table 5. Detailed information of three candidate genes related to plant height.
The relative expression of the three candidate genes in the two parents, HN400, HN451, HN369, and HN477, were characterized by applying qRT-PCR. The plant height of the six varieties continued to grow from R1 to day 30, with highly significant differences in plant height from day 10 after R1 (Supplementary Table 5 and Figure 5A). Relative expression amount (REA) of Glyma. 02G132200 did not differ significantly among varieties at the whole stages, which indicated Glyma. 02G132200 was not directly related to PH. It could be related to the trait from the DNA level or some other pathway. For Glyma. 02G133000, REA of the six varieties increased continuously from R1 to day 20 and started to decrease from day 20 to day 30. REA from day 10 to day 30 of HN369, HN477 and Dongnong L13 was larger significant than that of HN400, HN451 and Henong 60 (Figure 5B). The expression of Glyma. 05G240600 in the six cultivars continued to increase from R1 to day 30. REA of HN369, HN477 and Dongnong L13 were significantly higher than that of HN400, HN451 and Henong 60 from R1 to day 30 (Figure 5C).
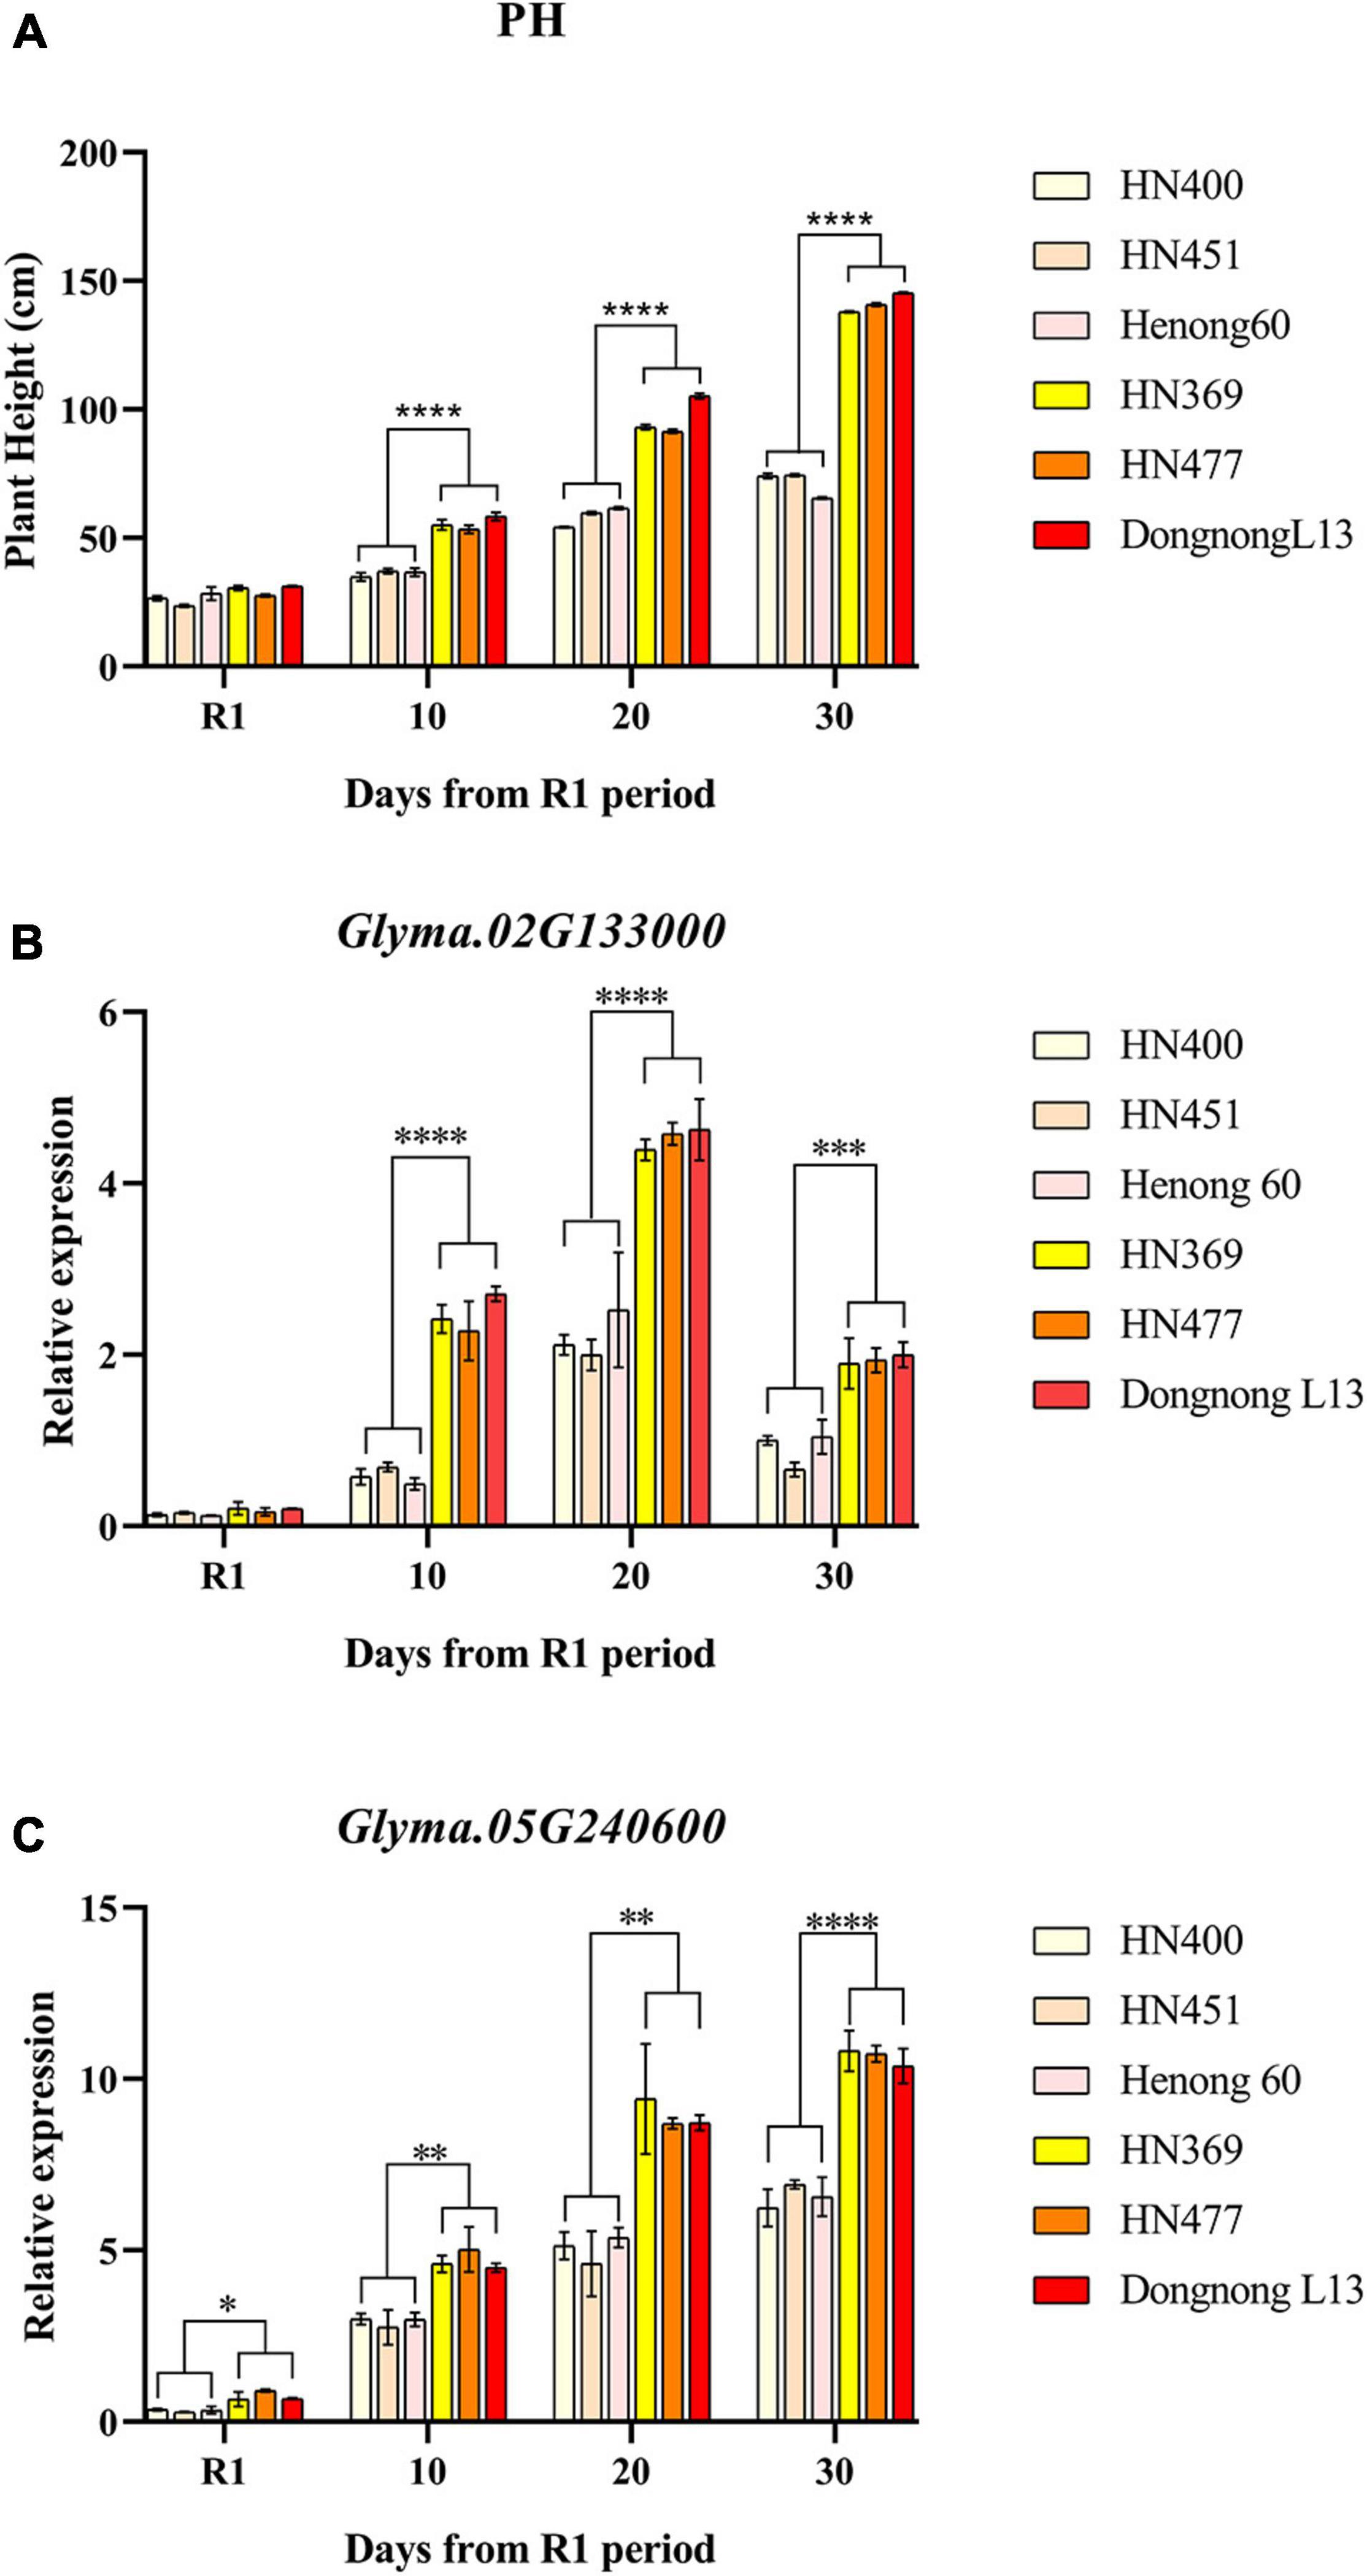
Figure 5. Plant height and relative expression patterns of candidate genes. Plant height of six varieties at different times express as (A), relative expression of Glyma.02G133000 in six varieties at different times express as (B) and relative expression of Glyma.02G133000 in six varieties at different times express as (C). *p < 0.05, **p < 0.01, ***p < 0.001, ****p < 0.0001.
From the 455-germplasm population, seven and one SNP markers associated with plant height were detected near Glyma.05G240600 and Glyma.02G133000 (Table 6), which indicated that the two genes controlling plant height. Among these markers, AX-90483488, AX-90490846, and AX-90515514 were detected in three environments, while the rest five markers were detected in only one environment. These eight markers could be used improve plant height commonly or specifically.
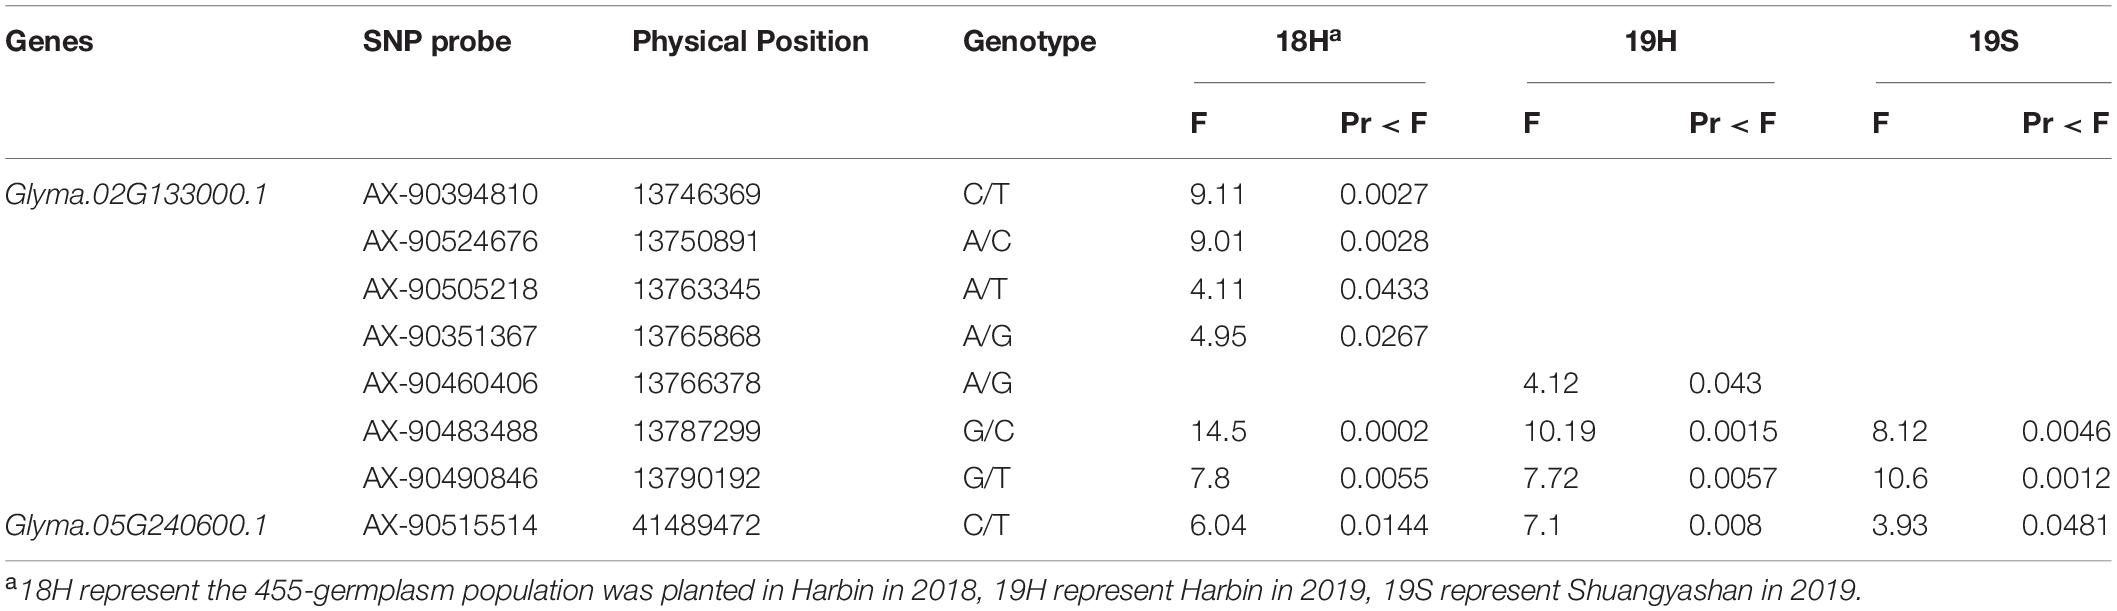
Table 6. SNPs markers associated with plant height near Glyma.02G133000 and Glyma.05G240600.1.
The small amount of RFLP, AFLP, and SSR markers used in previous studies made it difficult to ensure the accuracy of linkage analysis (Singh et al., 2016; Bhat et al., 2020), and most of the previously localized QTL were analyzed in a single environment, which is prone to false positive results (Fang et al., 2020). QTL detected repeatedly in multiple environments are more authentic than those detected in a single environment (Fulton et al., 1997). Here, a high-density genetic map containing 1,966 SNP bin markers was constructed using RIL6013 with the average distance between markers of 1.48 cM, which improved the resolution of the map and facilitated the localization of more QTL and shortened the interval of localized QTL. Phenotypic variation was enriched using an eight-environment experiment at multiple locations over multiple years. And the candidate genes were searched within the stable QTL intervals that were repeatedly localized in multiple environments. Summarizing the above measures, the accuracy of the linkage analysis was improved. For association analysis, more molecular markers could produce a higher probability of detecting functional loci (Xu et al., 2021). Multi-locus GWAS methods are effective in reducing false-positive QTNs compared to single-locus GWAS methods (Qi et al., 2020). An ideal germplasm resource population should contain rich genotypic and phenotypic data (Kaler et al., 2020). Based on the above considerations, the genotype data of 63,306 SNP markers from a natural 455-germplasm population and phenotypic data from four environments were used to conduct multi-locus GWAS analysis, which improve the accuracy of association analysis and reduce the ratio of false positives.
Here, the five QTLs located by RIL6013 repeatedly in multiple environments and the two QTNs identified by a combination of linkage and association analysis were compared with 238 QTLs associated with PH located by previous researches in the soybase database (Figure 4). The interval of qPH-2-1, which is located on chr02, was contained by the interval of Plant height 42-1 (Hu et al., 2013). The interval of qPH-3-5 on chr03 located in the interval of Plant height 26-17 (Sun et al., 2006). The interval of qPH-12-1 on chr12 had a overlapping region with the interval of Plant height 38-7 (Lee et al., 2015). The interval of qPH-18-3 on chr18 crossed the intervals of Plant height 26-13 and Plant height 26-14 (Sun et al., 2006). The genomic region of AX-90484715 on ch05 had a overlapping region with the interval of Plant height 37-1 (Yao et al., 2015). The qPH-1-1 localized on chr01 in three environments, E3, E5 and E8, was a newly identified QTL, which was more than 20 Mb away from mqPlant height-005 (Pathan et al., 2013). The AX-90349538 on chr14 was a newly identified QTN, which was more than 1.9 Mb away from Plant height 34-6 (Kim et al., 2012). In addition, compared with genes related to plant height identified in previous studies, we found that the GA20ox controlling PH formation (Fernandez et al., 2009) was only 170 kb away from AX-90464100. These results support the accuracy of this study.
Using annotation information and metabolic function information we initially predicted three candidate genes that might be associated with PH. Applying qRT-PCR technique to identify the relative expression of the three candidate genes in six varieties with significant differences in plant height, it was found that two candidate genes may be associated with plant height. Among them, Glyma.02G133000 is a calcium-binding protein gene involved in calmodulin synthesis, and calmodulin is involved in regulating leaf senescence and ABA response in Arabidopsis affecting plant growth and development (Dai et al., 2018). Glyma.05G240600 is involved in the synthesis of the vesicular iron transporter protein VIT, and iron stored in the vesicles plays a crucial role in the development of plant seedlings; if iron is deficient, it leads to stunted seedlings. Thus, it was speculated to regulate of plant height (Kim et al., 2006). The relative expression of Glyma.02G133000 and Glyma.05G240600 from R1 to day 30 was higher in the high PH varieties than in the low PH varieties, so it was speculated that Glyma.02G133000 and Glyma.05G240600 may have a positive regulatory function on plant height. However, plant height is a complex quantitative trait, and the specific regulation of plant height by these two candidate genes needs to be investigated in follow-up studies.
Here, five multi-environmental QTL and 26 multi-method QTN were detected by linkage analysis and association analysis, respectively, and two candidate genes associated with plant height were identified by pathway analysis and qRT-PCR validation. These results lay the foundation for marker-assisted selection.
The original contributions presented in the study are included in the article/Supplementary Material, further inquiries can be directed to the corresponding authors.
W-XL and HN conceived and designed the experiments. JW, BH, YJ, XH, YG, JC, YL, and JH performed the field experiments. JW and HN analyzed and interpreted the results. JW, BH, and HN drafted the manuscript. W-XL provided the laboratory conditions. All authors contributed to the manuscript revision.
This research was supported by the National Natural Science Foundation of China (32072015) to W-XL and Hundred-thousand and Million Project of Heilongjiang Province for Engineering and Technology Science’ Soybean Breeding Technology Innovation and New Cultivar Breeding (2019ZX16B01) to HN.
XH is employed by Key Laboratory of Crop Biotechnology Breeding of the Ministry of Agriculture, Beidahuang Kenfeng Seed Co., Ltd., Harbin, China.
The remaining authors declare that the research was conducted in the absence of any commercial or financial relationships that could be construed as a potential conflict of interest.
All claims expressed in this article are solely those of the authors and do not necessarily represent those of their affiliated organizations, or those of the publisher, the editors and the reviewers. Any product that may be evaluated in this article, or claim that may be made by its manufacturer, is not guaranteed or endorsed by the publisher.
The Supplementary Material for this article can be found online at: https://www.frontiersin.org/articles/10.3389/fpls.2021.803820/full#supplementary-material
Adewusi, O., Odiyi, A., and Akinyele, B. (2017). Identification of genomic region governing yield related characters in soybean, glycine max (L.) merrill using SNP Markers. J. Adv. Biol. Biotechnol. 2017, 1–9. doi: 10.9734/JABB/2017/36290
Assefa, T., Otyama, P. I., Brown, A. V., Kalberer, S. R., Kulkarni, R. S., and Cannon, S. B. (2019). Genome-wide associations and epistatic interactions for internode number, plant height, seed weight and seed yield in soybean. BMC Genomics 20:59077. doi: 10.1186/s12864-019-5907-7
Bansal, R., Mittapelly, P., Cassone, B. J., Mamidala, P., Redinbaugh, M. G., and Michel, A. (2015). Recommended reference genes for quantitative PCR analysis in soybean have variable stabilities during diverse biotic stresses. PLoS One 10:e0134890. doi: 10.1371/journal.pone.0134890
Belamkar, V., Farmer, A. D., Weeks, N. T., Kalberer, S. R., Blackmon, W. J., and Cannon, S. B. (2016). Genomics-assisted characterization of a breeding collection of Apios americana, an edible tuberous legume. Sci. Rep. 6, 1–17. doi: 10.1038/srep34908
Bhat, J. A., Deshmukh, R., Zhao, T., Patil, G., Deokar, A., Shinde, S., et al. (2020). Harnessing high-throughput phenotyping and genotyping for enhanced drought tolerance in crop plants. J. Biotechnol. 2020:10. doi: 10.1016/j.jbiotec.2020.11.010
Cao, Y., Li, S., Chen, G., Wang, Y., Bhat, J. A., Karikari, B., et al. (2019). Deciphering the genetic architecture of plant height in soybean using two RIL populations sharing a common M8206 parent. Plants 8:373. doi: 10.3390/plants8100373
Chang, F., Guo, C., Sun, F., Zhang, J., Wang, Z., Kong, J., et al. (2018). Genome-wide association studies for dynamic plant height and number of nodes on the main stem in summer sowing soybeans. Front. Plant Sci. 9:1184. doi: 10.3389/fpls.2018.01184
Chen, L., Nan, H., Kong, L., Yue, L., Yang, H., Zhao, Q., et al. (2020). Soybean AP1 homologs control flowering time and plant height. J. Integ. Plant Biol. 62, 1868–1879. doi: 10.1111/jipb.12988
Dai, C., Lee, Y., Lee, I. C., Nam, H. G., and Kwak, J. M. (2018). Calmodulin 1 regulates senescence and ABA response in Arabidopsis. Front. Plant Sci. 9:803. doi: 10.3389/fpls.2018.00803
Fang, Y., Liu, S., Dong, Q., Zhang, K., Tian, Z., Li, X., et al. (2020). Linkage analysis and multi-locus genome-wide association studies identify QTNs controlling soybean plant height. Front. Plant Sci. 11:9. doi: 10.3389/fpls.2020.00009
Feng, Y.-Y., He, J., Jin, Y., and Li, F.-M. (2021). High phosphorus acquisition and allocation strategy is associated with soybean seed yield under water-and P-Limited conditions. Agronomy 11:574. doi: 10.3390/agronomy11030574
Fernandez, M. G. S., Becraft, P. W., Yin, Y., and Lübberstedt, T. (2009). From dwarves to giants? Plant height manipulation for biomass yield. Trends Plant Sci. 14, 454–461. doi: 10.1016/j.tplants.2009.06.005
Fulton, T., Beck-Bunn, T., Emmatty, D., Eshed, Y., Lopez, J., Petiard, V., et al. (1997). QTL analysis of an advanced backcross of Lycopersicon peruvianum to the cultivated tomato and comparisons with QTLs found in other wild species. Theoret. Appl. Genet. 95, 881–894. doi: 10.1007/s001220050639
Gomez-Casati, D. F., Busi, M. V., Barchiesi, J., Peralta, D. A., Hedin, N., and Bhadauria, V. (2017). Applications of bioinformatics to plant biotechnology. Curr. Issues Mol. Biol. 27, 89–104. doi: 10.21775/cimb.027.089
Han, X., Xu, Z.-R., Zhou, L., Han, C.-Y., and Zhang, Y.-M. (2021). Identification of QTNs and their candidate genes for flowering time and plant height in soybean using multi-locus genome-wide association studies. Mol. Breed. 41, 1–16. doi: 10.1007/s11032-021-01230-3
Higgins, R., Thurber, C., Assaranurak, I., and Brown, P. (2014). Multiparental mapping of plant height and flowering time QTL in partially isogenic sorghum families. G3: Genes Genomes Genet. 4, 1593–1602. doi: 10.1534/g3.114.013318
Hu, Z., Zhang, H., Kan, G., Ma, D., Zhang, D., Shi, G., et al. (2013). Determination of the genetic architecture of seed size and shape via linkage and association analysis in soybean (Glycine max L. Merr.). Genetica 141, 247–254. doi: 10.1007/s10709-013-9723-8
Jing, Y., Zhao, X., Wang, J., Lian, M., Teng, W., Qiu, L., et al. (2019). Identification of loci and candidate genes for plant height in soybean (Glycine max) via genome-wide association study. Plant Breed. 138, 721–732. doi: 10.1111/pbr.12735
Kaler, A. S., Gillman, J. D., Beissinger, T., and Purcell, L. C. (2020). Comparing different statistical models and multiple testing corrections for association mapping in soybean and maize. Front Plant Sci. 10:1794. doi: 10.3389/fpls.2019.01794
Karikari, B., Wang, Z., Zhou, Y., Yan, W., Feng, J., and Zhao, T. (2020). Identification of quantitative trait nucleotides and candidate genes for soybean seed weight by multiple models of genome-wide association study. BMC Plant Biol. 20:2604. doi: 10.1186/s12870-020-02604-z
Kim, K.-S., Diers, B., Hyten, D., Mian, M. R., Shannon, J., and Nelson, R. (2012). Identification of positive yield QTL alleles from exotic soybean germplasm in two backcross populations. Theor. Appl. Genet. 125, 1353–1369. doi: 10.1007/s00122-012-1944-1
Kim, S. A., Punshon, T., Lanzirotti, A., Li, L., Alonso, J. M., Ecker, J. R., et al. (2006). Localization of iron in Arabidopsis seed requires the vacuolar membrane transporter VIT1. Science 314, 1295–1298. doi: 10.1126/science.1132563
Lee, S., Bailey, M., Mian, M., Shipe, E., Ashley, D., Parrott, W., et al. (1996). Identification of quantitative trait loci for plant height, lodging, and maturity in a soybean population segregating for growth habit. Theor. Appl. Genet. 92, 516–523. doi: 10.1007/BF00224553
Lee, S., Jun, T., Michel, A. P., and Mian, M. R. (2015). SNP markers linked to QTL conditioning plant height, lodging, and maturity in soybean. Euphytica 203, 521–532. doi: 10.1007/s10681-014-1252-8
Li, M. W., Wang, Z., Jiang, B., Kaga, A., Wong, F.-L., Zhang, G., et al. (2020). Impacts of genomic research on soybean improvement in East Asia. Theor. Appl. Genet. 133, 1655–1678. doi: 10.1007/s00122-019-03462-6
Li, X., Wang, P., Zhang, K., Liu, S., Qi, Z., Fang, Y., et al. (2021). Fine mapping QTL and mining genes for protein content in soybean by the combination of linkage and association analysis. Theor. Appl. Genet. 134, 1095–1122. doi: 10.1007/s00122-020-03756-0
Li, X., Zhang, K., Sun, X., Huang, S., Wang, J., Yang, C., et al. (2020). Detection of QTL and QTN and candidate genes for oil content in soybean using a combination of four-way-RIL and germplasm populations. Crop J. 8, 802–811. doi: 10.1016/j.cj.2020.07.004
Li, Z. F., Guo, Y., Ou, L., Hong, H., Wang, J., Liu, Z. X., et al. (2018). Identification of the dwarf gene GmDW1 in soybean (Glycine max L.) by combining mapping-by-sequencing and linkage analysis. Theor. Appl. Genet. 131, 1001–1016. doi: 10.1007/s00122-017-3044-8
Liu, B., Watanabe, S., Uchiyama, T., Kong, F., Kanazawa, A., Xia, Z., et al. (2010). The soybean stem growth habit gene Dt1 is an ortholog of Arabidopsis TERMINAL FLOWER1. Plant Physiol. 153, 198–210. doi: 10.1104/pp.109.150607
Lü, H.-Y., Li, H.-W., Fan, R., Li, H.-Y., Yin, J.-Y., Zhang, J.-J., et al. (2016). Genome-wide association study of dynamic developmental plant height in soybean. Can. J. Plant Sci. 97, 308–315. doi: 10.1139/cjps-2016-0152
Pathan, S., Vuong, T., Clark, K., Lee, J., Shannon, J., Roberts, C., et al. (2013). Genetic mapping and confirmation of quantitative trait loci for seed protein and oil contents and seed weight in soybean. Crop Sci. 53, 765–774. doi: 10.2135/cropsci2012.03.0153
Qi, Z., Song, J., Zhang, K., Liu, S., Tian, X., Wang, Y., et al. (2020). Identification of QTNs controlling 100-seed weight in soybean using multilocus genome-wide association studies. Front. Genet. 11:689. doi: 10.3389/fgene.2020.00689
Ren, W.-L., Wen, Y.-J., Dunwell, J. M., and Zhang, Y.-M. (2018). pKWmEB: integration of Kruskal–Wallis test with empirical Bayes under polygenic background control for multi-locus genome-wide association study. Heredity 120, 208–218. doi: 10.1038/s41437-017-0007-4
Salari, M. W., Ongom, P. O., Thapa, R., Nguyen, H. T., Vuong, T. D., and Rainey, K. M. (2021). Mapping QTL controlling soybean seed sucrose and oligosaccharides in a single family of soybean nested association mapping (SoyNAM) population. Plant Breed. 140, 110–122. doi: 10.1111/pbr.12883
Shen, Y., Xiang, Y., Xu, E., Ge, X., and Li, Z. (2018). Major co-localized QTL for plant height, branch initiation height, stem diameter, and flowering time in an alien introgression derived Brassica napus DH population. Front. Plant Sci. 9:390. doi: 10.3389/fpls.2018.00390
Silva, L. C. C., da Matta, L. B., Pereira, G. R., Bueno, R. D., Piovesan, N. D., Cardinal, A. J., et al. (2021). Association studies and QTL mapping for soybean oil content and composition. Euphytica 217, 1–18. doi: 10.1007/s10681-020-02755-y
Singh, V. K., Khan, A. W., Jaganathan, D., Thudi, M., Roorkiwal, M., Takagi, H., et al. (2016). QTL-seq for rapid identification of candidate genes for 100-seed weight and root/total plant dry weight ratio under rainfed conditions in chickpea. Plant Biotechnol. J. 14, 2110–2119. doi: 10.1111/pbi.12567
Sonah, H., O’Donoughue, L., Cober, E., Rajcan, I., and Belzile, F. (2015). Identification of loci governing eight agronomic traits using a GBS-GWAS approach and validation by QTL mapping in soya bean. Plant Biotechnol. J. 13, 211–221. doi: 10.1111/pbi.12249
Song, J., Sun, X., Zhang, K., Liu, S., Wang, J., Yang, C., et al. (2020). Identification of QTL and genes for pod number in soybean by linkage analysis and genome-wide association studies. Mol. Breed. 40, 1–14. doi: 10.1007/s11032-020-01140-w
Sun, D., Li, W., Zhang, Z., Chen, Q., Ning, H., Qiu, L., et al. (2006). Quantitative trait loci analysis for the developmental behavior of soybean (Glycinemax L. Merr.). Theor. Appl. Genet. 112, 665–673. doi: 10.1007/s00122-005-0169-y
Tamba, C. L., Ni, Y.-L., and Zhang, Y.-M. (2017). Iterative sure independence screening EM-Bayesian LASSO algorithm for multi-locus genome-wide association studies. PLoS Comp. Biol. 13:e1005357. doi: 10.1371/journal.pcbi.1005357
Tamba, C. L., and Zhang, Y.-M. (2018). A fast mrMLM algorithm for multi-locus genome-wide association studies. Biorxiv 2018:341784. doi: 10.1101/341784
Tian, X., Zhang, K., Liu, S., Sun, X., Li, X., Song, J., et al. (2020). Quantitative trait locus analysis of protein and oil content in response to planting density in soybean (Glycine max [L.] Merri.) seeds based on SNP linkage mapping. Front. Genet. 11:563. doi: 10.3389/fgene.2020.00563
Wang, J. (2009). Inclusive composite interval mapping of quantitative trait genes. Acta Agronomica Sinica 35, 239–245. doi: 10.1007/s00122-007-0663-5
Wang, J., Hu, B., Huang, S., Hu, X., Siyal, M., Yang, C., et al. (2021). SNP-bin linkage analysis and genome-wide association study of plant height in soybean. Crop. Pasture. Sci.
Wang, S.-B., Feng, J.-Y., Ren, W.-L., Huang, B., Zhou, L., Wen, Y.-J., et al. (2016). Improving power and accuracy of genome-wide association studies via a multi-locus mixed linear model methodology. Sci. Rep. 6, 1–10. doi: 10.1038/srep19444
Wen, Y.-J., Zhang, Y.-W., Zhang, J., Feng, J.-Y., Dunwell, J. M., and Zhang, Y.-M. (2019). An efficient multi-locus mixed model framework for the detection of small and linked QTLs in F2. Brief. Bioinform. 20, 1913–1924. doi: 10.1093/bib/bby058
Xu, P., Guo, Q., Meng, S., Zhang, X., Xu, Z., Guo, W., et al. (2021). Genome-wide association analysis reveals genetic variations and candidate genes associated with salt tolerance related traits in Gossypium hirsutum. BMC Genomics 22:66236. doi: 10.21203/rs.3.rs-66236/v4
Xu, Y., Li, P., Yang, Z., and Xu, C. (2017). Genetic mapping of quantitative trait loci in crops. Crop J. 5, 175–184. doi: 10.1016/j.cj.2016.06.003
Yao, D., Liu, Z., Zhang, J., Liu, S., Qu, J., Guan, S., et al. (2015). Analysis of quantitative trait loci for main plant traits in soybean. Genet. Mol. Res. 14, 6101–6109. doi: 10.4238/2015.June.8.8
Yue, L., Li, X., Fang, C., Chen, L., Yang, H., Yang, J., et al. (2021). FT5a interferes with the Dt1-AP1 feedback loop to control flowering time and shoot determinacy in soybean. J. Integ. Plant Biol. 63, 1004–1020. doi: 10.1111/jipb.13070
Zhang, J., Feng, J.-Y., Ni, Y., Wen, Y., Niu, Y., Tamba, C., et al. (2017). pLARmEB: integration of least angle regression with empirical Bayes for multilocus genome-wide association studies. Heredity 118, 517–524. doi: 10.1038/hdy.2017.8
Zhang, J., Song, Q., Cregan, P. B., Nelson, R. L., Wang, X., Wu, J., et al. (2015). Genome-wide association study for flowering time, maturity dates and plant height in early maturing soybean (Glycine max) germplasm. BMC Genomics 16:1–11. doi: 10.1186/s12864-015-1441-4
Zhang, T., Wu, T., Wang, L., Jiang, B., Zhen, C., Yuan, S., et al. (2019). A combined linkage and GWAS analysis identifies QTLs linked to soybean seed protein and oil content. Int. J. Mol. Sci. 20:5915. doi: 10.3390/ijms20235915
Zhang, Y.-W., Tamba, C. L., Wen, Y.-J., Li, P., Ren, W.-L., Ni, Y.-L., et al. (2020). mrMLM v4. 0.2: an r platform for multi-locus genome-wide association studies. Genom. Proteom. Bioinf. 18, 481–487. doi: 10.1016/j.gpb.2020.06.006
Keywords: soybean, plant height, QTL, QTN, candidate genes
Citation: Wang J, Hu B, Jing Y, Hu X, Guo Y, Chen J, Liu Y, Hao J, Li W-X and Ning H (2022) Detecting QTL and Candidate Genes for Plant Height in Soybean via Linkage Analysis and GWAS. Front. Plant Sci. 12:803820. doi: 10.3389/fpls.2021.803820
Received: 28 October 2021; Accepted: 20 December 2021;
Published: 21 January 2022.
Edited by:
Yuan-Ming Zhang, Huazhong Agricultural University, ChinaReviewed by:
Weiren Wu, Fujian Agriculture and Forestry University, ChinaCopyright © 2022 Wang, Hu, Jing, Hu, Guo, Chen, Liu, Hao, Li and Ning. This is an open-access article distributed under the terms of the Creative Commons Attribution License (CC BY). The use, distribution or reproduction in other forums is permitted, provided the original author(s) and the copyright owner(s) are credited and that the original publication in this journal is cited, in accordance with accepted academic practice. No use, distribution or reproduction is permitted which does not comply with these terms.
*Correspondence: Wen-Xia Li, bGl3ZW54aWFuZWF1QDEyNi5jb20=; Hailong Ning, bmluZ2hhaWxvbmduZWF1QDEyNi5jb20=
†These authors share first authorship
Disclaimer: All claims expressed in this article are solely those of the authors and do not necessarily represent those of their affiliated organizations, or those of the publisher, the editors and the reviewers. Any product that may be evaluated in this article or claim that may be made by its manufacturer is not guaranteed or endorsed by the publisher.
Research integrity at Frontiers
Learn more about the work of our research integrity team to safeguard the quality of each article we publish.