 Fei Li1,2
 Xiaodong Gao
 Xining Zhao
- 1College of Water Resources and Architectural Engineering, Northwest A&F University, Xianyang, China
- 2Key Laboratory of Agricultural Soil and Water Engineering in Arid and Semiarid Areas, Ministry of Education, Northwest A&F University, Xianyang, China
- 3Institute of Soil and Water Conservation, Chinese Academy of Sciences and Ministry of Water Resources, Yangling, China
- 4National Engineering Research Center of Water Saving and Irrigation Technology, Yangling, China
- 5Institute of Soil and Water Conservation, Northwest A&F University, Xianyang, China
Elevated atmospheric CO2 concentrations ([eCO2]) and soil water deficits significantly influence gas exchange in plant leaves, affecting the carbon-water cycle in terrestrial ecosystems. However, it remains unclear how the soil water deficit modulates the plant CO2 fertilization effect, especially for gas exchange and leaf-level water use efficiency (WUE). Here, we synthesized a comprehensive dataset including 554 observations from 54 individual studies and quantified the responses for leaf gas exchange induced by e[CO2] under water deficit. Moreover, we investigated the contribution of plant net photosynthesis rate (Pn) and transpiration rates (Tr) toward WUE in water deficit conditions and e[CO2] using graphical vector analysis (GVA). In summary, e[CO2] significantly increased Pn and WUE by 11.9 and 29.3% under well-watered conditions, respectively, whereas the interaction of water deficit and e[CO2] slightly decreased Pn by 8.3%. Plants grown under light in an open environment were stimulated to a greater degree compared with plants grown under a lamp in a closed environment. Meanwhile, water deficit reduced Pn by 40.5 and 37.8%, while increasing WUE by 24.5 and 21.5% under ambient CO2 concentration (a[CO2]) and e[CO2], respectively. The e[CO2]-induced stimulation of WUE was attributed to the common effect of Pn and Tr, whereas a water deficit induced increase in WUE was linked to the decrease in Tr. These results suggested that water deficit lowered the stimulation of e[CO2] induced in plants. Therefore, fumigation conditions that closely mimic field conditions and multi-factorial experiments such as water availability are needed to predict the response of plants to future climate change.
Introduction
Global atmospheric carbon dioxide concentration ([CO2]) has accelerated at an unprecedented pace of about 2.4 μmol mol–1 per year during the last decade, and presently, it is 413 ppm (IPCC, 2019; NASA, 2020). [CO2] is projected to be between 421–946 ppm by 2,100 depending on continued emission scenarios. This increase in [CO2] might be accompanied by shifting precipitation patterns and increasing extreme precipitation events (Bencze et al., 2014; Zhang et al., 2021). It is predicted that plants may be negatively affected by drought stress and yet may benefit from elevated CO2 (e[CO2]), known as the “CO2 fertilization effect.” An increase Pn and WUE are necessary for improve carbon-water cycle and plant productivity in terrestrial ecosystems. Therefore, understanding how soil water deficit affects “CO2 fertilization effect” on plant is of great significance to projecting the potential risk of climate change on global bio-environment equilibrium.
Generally, e[CO2] and drought stimulate or inhibit plant growth by changing leaf gas exchange including net photosynthesis rate (Pn), transpiration rate (Tr), stomatal conductance (Gs), and leaf-level water use efficiency (WUE), which result in a significant impact on the global cycling of carbon-water in terrestrial ecosystems (McLaughlin et al., 2007; Lawson and Blatt, 2014). Water is a key reactant required by plants for various photochemical processes including as an electron donor in photosynthesis. Stomatal closure is one of the first visible drought tolerance mechanisms employed by plants to reduce excessive water loss (Hessini et al., 2009; Li et al., 2017). Drought reduces Gs by triggering abscisic acid (ABA) production in plants (Paoletti and Grulke, 2005; Yamaguchi et al., 2019; Li S. et al., 2020). Meanwhile, Gs is regulated by guard-cell water potential (Assmann, 1999; Raschke et al., 2003). Drought stress negatively affects plant physiology, which usually results in reduced Pn, as Pn is closely associated with Gs and mesophyll conductance leading to CO2 diffusion, especially in C3 plants (Luomala et al., 2005; Haworth et al., 2013; Xu et al., 2016). Short-term water stress results in stomatal defense and increased WUE, which is associated with delayed drought (Ameye et al., 2012). Drought stress results in stomatal and non-stomatal limitations; for instance, a reduction in Pn may occur as a result of conditions favoring ribulose 1,5-bisphosphate (RuBP) oxygenation rather than carboxylation, resulting in a reduction of chlorophyll content (Farquhar and Sharkey, 1982; Ameye et al., 2012; Drake et al., 2017; Birami et al., 2020).
Atmospheric [CO2] is another pivotal factor affecting various biochemical processes of photosynthesis (Xu, 2015). Plants consume more CO2 to stimulate the carboxylation efficiency of ribulose-1,5-bisphosphate carboxylase oxygenase (Rubisco) to increase plant growth for most C3 plants while competitively reducing photorespiration and dark respiration when increasing atmosphere [CO2] (Leakey et al., 2006, 2007; Reddy et al., 2010; Robredo et al., 2010; Birami et al., 2020). However, the boost extent of photosynthesis induced by e[CO2] may be related to the plant growth environment. There are serious potential limitations in using enclosure systems when conducting experiments to explore the effect of elevated [CO2] on plants (Ainsworth, 2008). However, a study showed that the more closely fumigation conditions mimicked field conditions, the smaller was the stimulation of yield by elevated [CO2] (Ainsworth and Long, 2005). Additionally, some plants may begin to develop an adverse response to enriched CO2 environments, when beyond certain CO2 concentration limits (Cotrufo et al., 1998; Long et al., 2006; Taub et al., 2008; Xu, 2015). Meanwhile, the response of plant gas exchange to e[CO2] may be limited by other abiotic factors, such as high-temperature stress, low N/P, and low water availability (Bajji et al., 2001; Hessini et al., 2009; Zhao et al., 2016; Gorthi et al., 2019; Jiang et al., 2020). For example, high temperature can affect photosynthesis by reducing the activities of key metabolic enzymes in plants (Luomala et al., 2005); N deficiency can lead to inadequate sink strength and thus limit plant growth (Hyvönen et al., 2007); Severe drought conditions counteract e[CO2] improvements in physiological performance and yield in soybeans (Casteel et al., 2008). Additionally, in contrast to C3 plants, Pn of C4 plants may not be influenced by e[CO2] because [CO2] is not rate-limiting to photosynthesis (Zhang et al., 2021). However, under e[CO2], C4 species may have certain advantages over C3 plants regarding high WUE, especially under drought conditions (Barton et al., 2012). Studies have shown that WUE of maize and sorghum improved owing to direct or indirect stimulation of photosynthesis at e[CO2] (Allen et al., 2011; Yan et al., 2016), and other groups have reported that enhanced WUE results due to reduction in Gs and transpiration (Morison, 1985; Wu and Wang, 2000). Stomatal control is regulated by water stress, resulting in the maintenance of high plant water status at e[CO2] (Ferris and Taylor, 1994; Polley et al., 1999; Torralbo et al., 2019). However, contradictory results were found in Brassica napus regarding minimizing water loss by following the e[CO2]-induced stomatal closure (Faralli et al., 2017). Unfortunately, despite several studies on the response of plants to e[CO2], previous analyses have focused on how e[CO2] alleviates the adverse effects of drought on plant growth and physiology. Consequently, the impact of water deficit conditions in regulating the effect of e[CO2] on plants is poorly understood, particularly on photosynthesis and WUE.
Rising [CO2] levels in this century are predicted to stimulate the growth of C3 species, counteracting the negative impacts of greater drought on plant growth and crop yield (Parry et al., 2004; Bencze et al., 2014). However, a few studies have shown that the stimulation of crop yield by e[CO2] diminished to zero as drought intensified (Gray et al., 2016; Zheng et al., 2020). Conflicting results stemming from differences in experimental design have hampered the potential to draw general conclusions. In addition, as with several control experiments, many experimental tests for CO2 response have been conducted in a limited environment such as enclosed spaces and weak light intensity, which limits the inferences that can be drawn from previously published literature. These limitations highlight the need for quantitative analysis of the available experimental data to better predict and implement adaptation policies related to future climate change scenarios and limited water availability for agricultural irrigation. Here, we used meta-analysis to address three key questions: (1) To what extent does water deficit modulate the response of plant gas exchange to e[CO2]? (2) How does e[CO2] and water deficit affect leaf-level WUE, and what is the nature of the interaction between e[CO2] and water deficit? (3) Do these responses differ by plant type, photosynthetic pathway, and growing conditions? Meta-analysis was used to test the effects of water availability on plant responses to e[CO2] by hypothesizing that: the CO2 fertilization effect on photosynthesis is reduced by water deficit (H1); water deficit × e[CO2] has no effect on WUE because water availability has a greater effect on plants than that of e[CO2] (H2); the more closely the fumigation conditions mimic field conditions, the stronger the stimulation of Pn by e[CO2] (H3). Hypothesis H1 was generally consistent with previous studies on the mitigation of stress by e[CO2], while H2 and H3 have no consensus. In this study, the synthetic power of meta-analysis was combined with graphical vector analysis (GVA) to investigate the contribution of plant Pn and Tr to WUE under water deficit and e[CO2].
Materials and Methods
Literature Search and Study Selection
We used the Web of Science1 and China National Knowledge databases (CNKI2) to search for peer-reviewed papers related to water deficit × CO2 interactions in plants. Various keyword combinations were used for the search, including (drought OR water deficit OR water supply) AND (CO2 enrichment OR doubled ambient CO2 OR rising CO2 OR CO2 rise) AND (gas exchange OR plant physiology). A total of 554 observations from 54 published papers were included in this meta-analysis (Appendix and Supplementary Material).
Only experiments on e[CO2] and water deficit were included, and the few available studies simultaneously testing a third variable, such as temperature or nutrient levels, were omitted. Factorial experiments included at least two water treatments in addition to two CO2 concentration treatments. The “well-watered,” “water deficit,” “ambient [CO2]”(a[CO2]), and “elevated [CO2]” (e[CO2]) treatments followed the definition of the authors of the original experiment (Wang et al., 2015). Meanwhile, the two most common methods of water control were chosen: dry days and field water capacity (FWC). All studies included plants growing in pots. We extracted response variables for leaf gas exchange, including Pn, Gs, Tr, and instantaneous WUE, which was calculated from Pn/Tr by authors. For those studies that included only Pn and Tr data but not WUE, we supplemented the WUE values with the equation: WUE = Pn/Tr. Data were taken from tables or digitized from figures using the software GetData Graph Digitizer, 2008 (ver. 2.22, Russian Federation).
The factorial experiments included four treatments: (i) ambient CO2 (a[CO2]) + well-watered (CaWw); (ii) e[CO2] + well-watered (CeWw); (iii) a[CO2] + water deficit (CaWd); and (iv) e[CO2] + water deficit (CeWd). In our dataset, a[CO2] treatments ranged from 350 to 450 ppm, while e[CO2] ranged from 500 to 1,200 ppm. The e[CO2] treatments were grouped into seven categories: 500–550, 551–600, 601–650, 651–700, 701–750, 751–800, and >800 ppm. In addition, CO2 exposure was either in a closed environment (growth chamber, greenhouse, and glasshouse), or an open or semi-open environment; free-air CO2 enrichment (FACE) and open top chamber (OTC). Water treatments were categorized into well-watered and water deficit, with the water-deficit treatment grouped into three categories for FWC: 65–55, 54–40, and <40%. Dry days were not grouped because of the small amount of data. Additionally, several explanatory variables in our meta-analysis may affect leaf gas exchange under water deficit and e[CO2], including plant type (grass, tree, legume, shrub, or crop), source of light (lamp or solar), and photosynthetic pathways (C3 or C4) as described in the Supplementary Tables 1, 2.
Meta-Analytical Methods
We considered a[CO2] and well-watered treatments as the baseline, whereas e[CO2] and water deficit were the experimental treatments. The individual effect sizes for water and CO2 manipulation (rw and rc, respectively) were calculated as follows:
where , Ce, Ca, Ww, and Wd represented the mean, e[CO2], a[CO2], well-watered, and water-deficit treatments, respectively (Jiang et al., 2020). The water deficit × CO2 interaction term was calculated from factorial experiments as described by Lajeunesse (2011). The water deficit and e[CO2] interaction effect size, or the effect of water deficit on the e[CO2] responses was calculated as follows:
r was log-transformed to linearize this metric as follows:
Based on the additive property of variance (Curtis and Wang, 1998; Baig et al., 2015; Jiang et al., 2020), the variance of the water deficit by the CO2 interaction (v) response ratio was calculated as follows:
An overall interaction term was estimated using weighted means, with greater weighting given to experiments with greater precision. A random-effects model was selected because the between-study variance was statistically significant. A multivariate linear mixed-effects model was then used to estimate the mean and the 95% confidence interval (CI) of the log-transformed response ratios for each individual variable, weighted by the variance of individual studies described in Supplementary Tables 1, 2. Effect sizes were reported as the antilog r converted to the mean percentage change from the baseline treatment [(r − 1) × 100]. Meta-analysis and Ln(r) calculations were conducted using OpenMEE software for ecological and evolutionary meta-analysis (Wallace et al., 2017).
Graphic Vector Analysis Methodology
Graphical vector analysis was first developed to simultaneously compare the effect of experimental treatments on plant biomass, nutrient concentration, and nutrient content using an integrated graph (Haase and Rose, 1995). It is widely used because the comparison may be interpreted independently of predetermined critical levels or ratios.
In this analysis, GVA was used according to Wang et al. (2015); Couture et al. (2017), and Li Z. et al. (2020) to complement the meta-analysis of WUE. The magnitude of change in leaf-level WUE is determined by Pn and Tr. Responses of leaf-level WUE to the experimental treatment relative to the control fell into one of the following seven categories:
(1) “Steady-state” increase, where WUE is unchanged owing to the parallel increases in leaf Pn and Tr,
(2) “Steady-state” decrease, where WUE is unchanged owing to the parallel decreases in leaf Pn and Tr,
(3) “Tr” positive effect, where WUE increases because Tr decreases faster than Pn,
(4) “Tr” negative effect, where WUE decreases because Tr increases faster than Pn,
(5) “Pn” positive effect, where WUE increases because Pn increases faster than Tr,
(6) “Pn” negative effect, where WUE decreases because Pn decreases faster than Tr,
(7) Pn and Tr work together, where WUE decreases/increases, despite Pn and Tr remaining unchanged, or Pn increases and Tr decreases.
All variables were plotted to illustrate the percent change in water deficit, e[CO2], and their interactions (value at CaWd divided by those at CaWw and multiplied by 100, value at CeWw divided by those at CaWw and multiplied by 100, value at CeWd divided by those at CaWw and multiplied by 100). Tr (y-axis) was plotted against Pn (x-axis) with WUE as the diagonal axis (y-axis) in a square-shaped diagram. Plotting the Pn data and WUE data automatically positioned the points along the diagonal lines representing the z-axis value for Tr, allowing simultaneous examination of the three related variables on a two-dimensional diagram.
Results
Overview of Data Availability
The dataset was derived from 54 studies of 554 valid data points of gas exchange (Pn, Gs, Tr, and WUE) under e[CO2] and water deficit. Under e[CO2], Pn was increased by an average of 11.9 and 16.4% for well-watered and water-deficit treatments, respectively, for all plants, whereas the interaction of water deficit and e[CO2] slightly decreased Pn by 8.3%. That is, the e[CO2]-induced stimulation of Pn was reduced by the water deficit (Figures 1B,C). In contrast, water deficit reduced Pn by 40.5 and 37.8% because of a[CO2] and e[CO2] treatments, respectively, and WUE was increased by 24.5 and 21.5% (Figure 1B). The negative effects of water deficit on plant Pn were relieved at e[CO2] (Figures 1A–C).
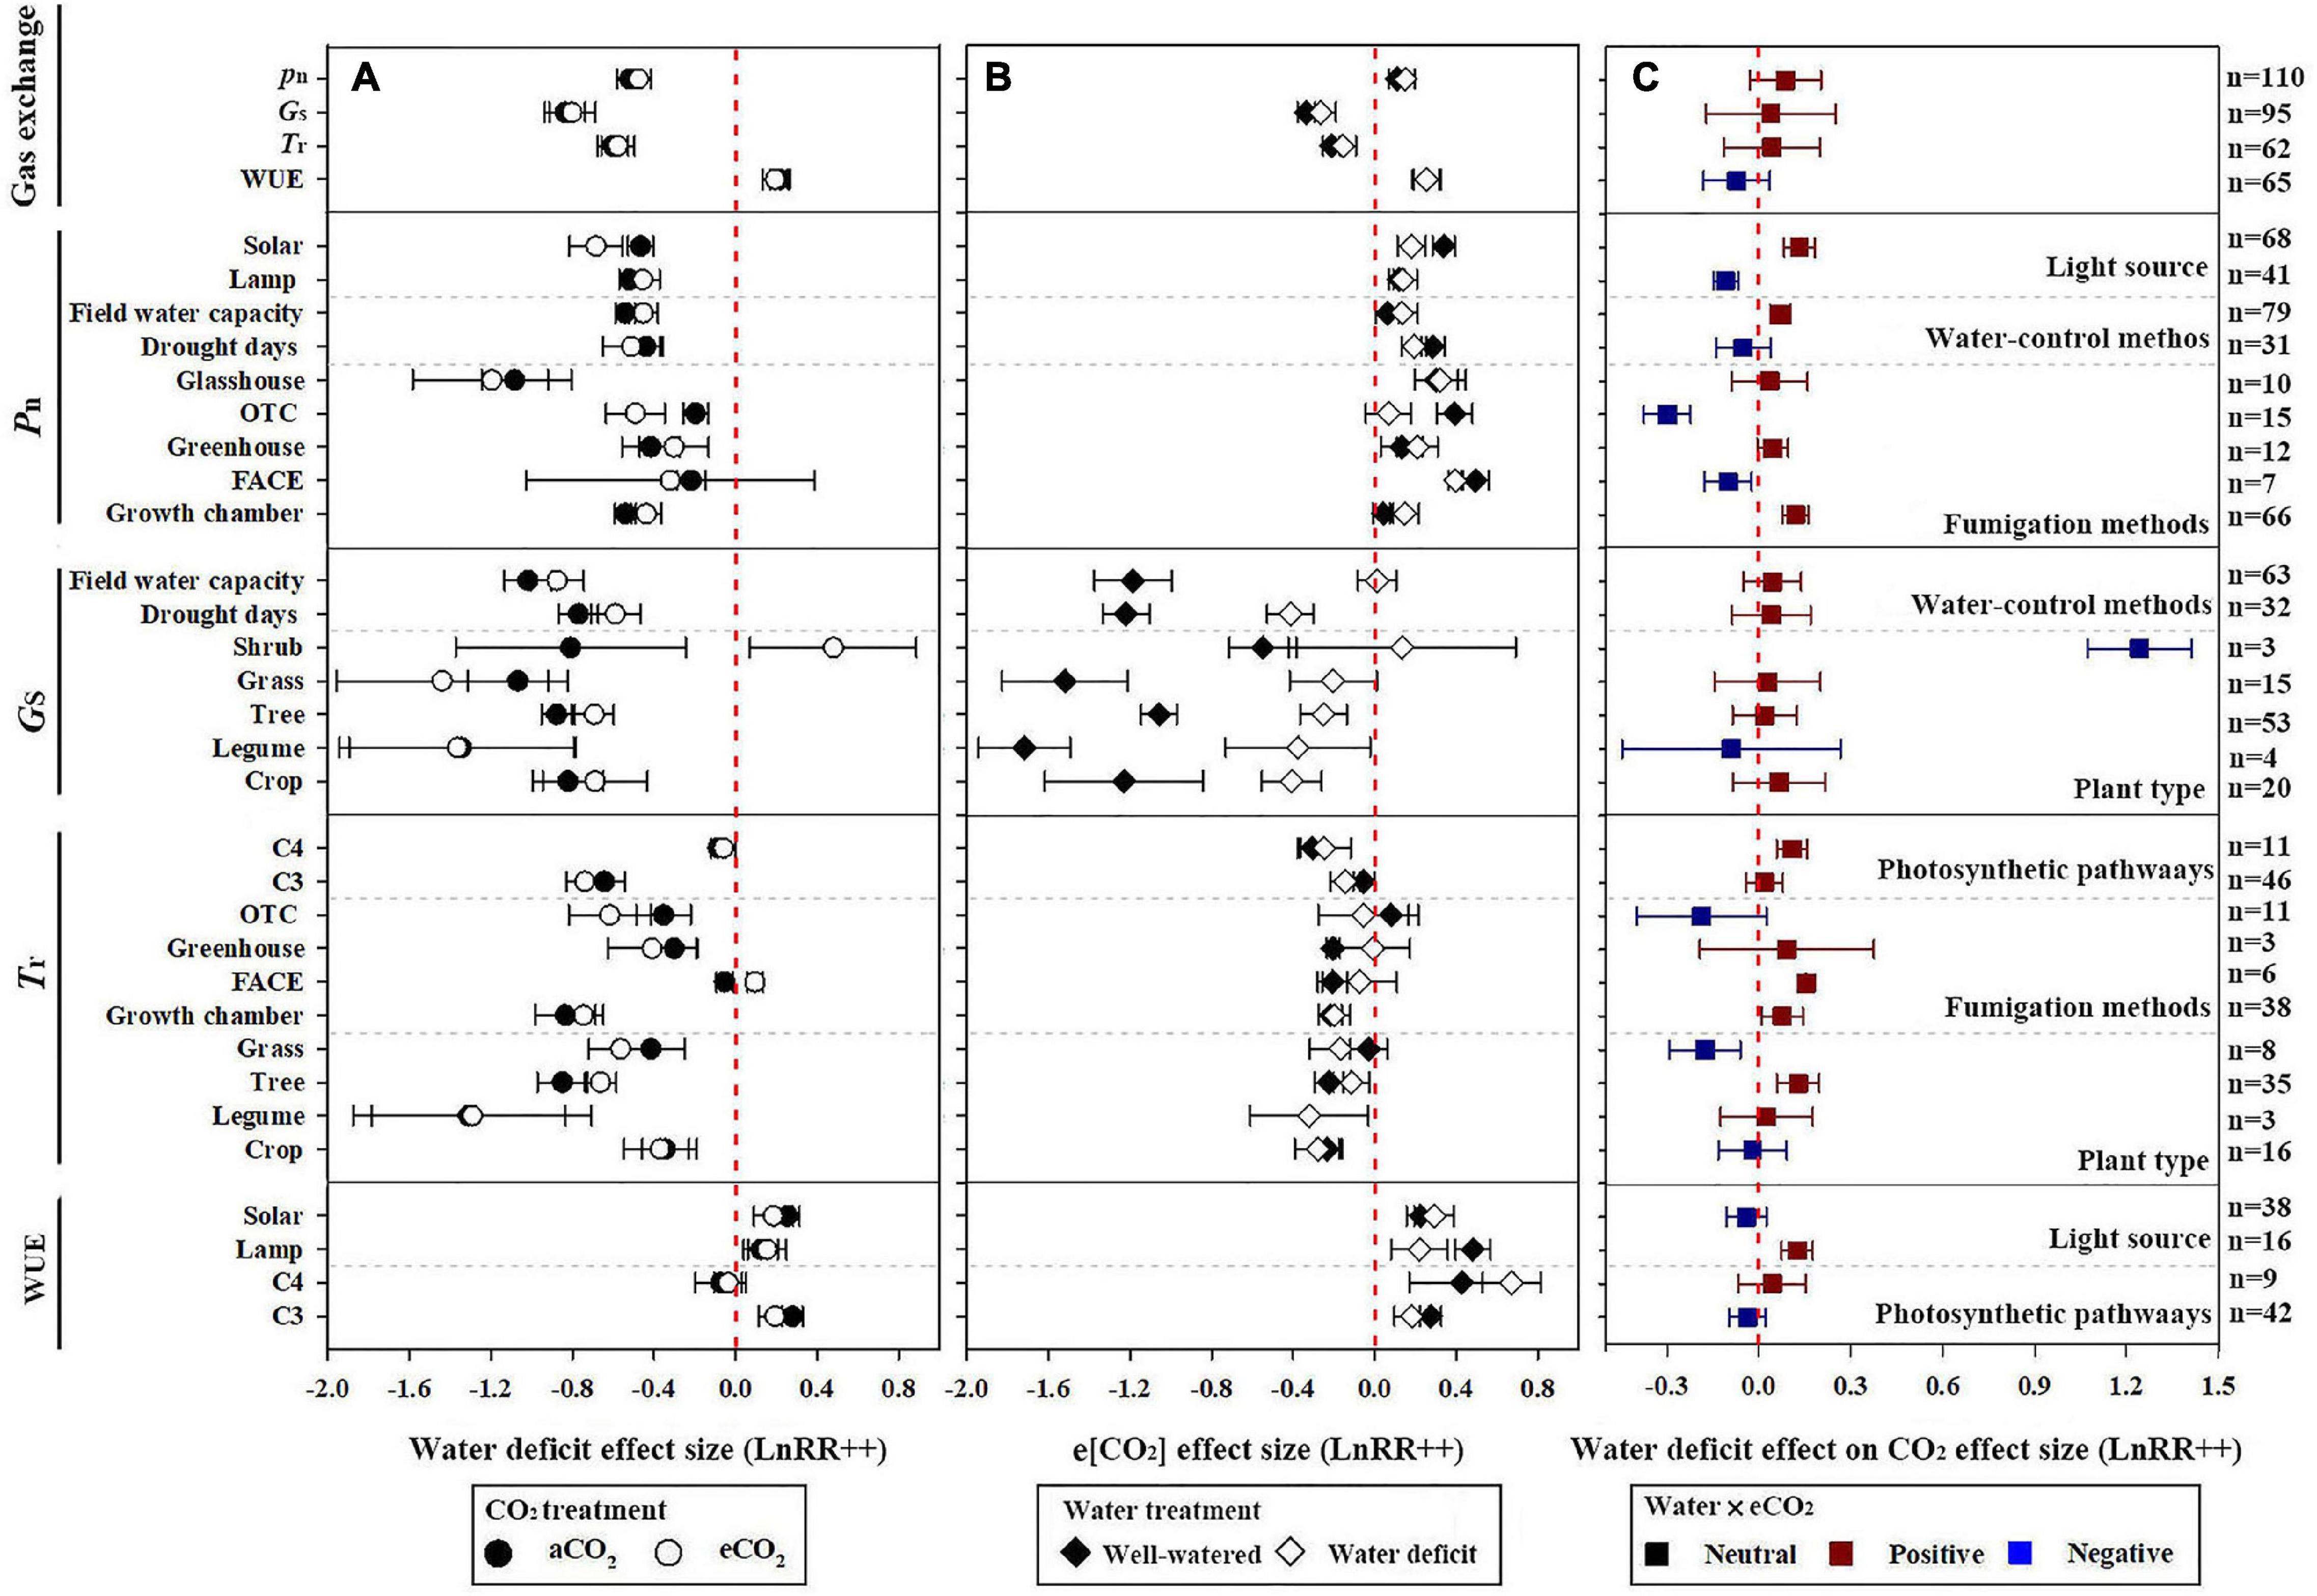
Figure 1. Effect of water deficit and elevated CO2 (e[CO2]) on plant gas exchange variables. (A) Effect of water deficit under ambient CO2 (a[CO2]), black circle, and e[CO2], white circle; (B) effect of e[CO2] under well-watered (white diamond) and water deficit (black diamond) conditions; and (C) effect of water deficit on plant response to e[CO2]: red, blue, and black boxes represent positive, negative, and statistically neutral effects, respectively. Response variables are as follows: net photosynthesis (Pn), stomatal conductance (Gs), transpiration rate (Tr), and leaf-level water use efficiency (WUE = Pn/Tr). Water-deficit and e[CO2] treatment effect on plant Pn was classified according to light source, control methods of water, and CO2 fumigation methods; Gs was classified according to plant type and control methods of water; Tr was classified according to photosynthetic pathways, plant type, and CO2 fumigation methods; and WUE was classified according to light source and photosynthetic pathways (all separated by dotted lines). Dots and error bars represent means and 95% CI, respectively, of the log-transformed response ratio estimated based on a random effect model. LnRR(++) represent weighted mean response ratios. Number of data entries for each variable is denoted as n, labeled on the right y-axis. The treatment response was significant (p < 0.05) if the CI did not intersect with the red vertical dotted line on each plot (x = 0).
In contrast to Pn, e[CO2] reduced Gs and Tr by 23.3 and 14.4% under water-deficit treatments, respectively. However, a greater e[CO2] reduction was observed in well-watered plants (28.5 and 19.1%, respectively). Similarly, water-deficit treatment reduced Gs and Tr by 56.7 and 45.2%, respectively, under e[CO2] treatment (Figures 1A,B). In comparison, WUE was increased due to the e[CO2] and water deficit. e[CO2] increased WUE by 29.3 and 28.8% under well-watered and water-deficit treatments, respectively, and water deficit increased WUE by 24.5 and 21.5%, respectively, under a[CO2] and e[CO2] treatment (Figures 1A,B). In addition, the interaction between water deficit and e[CO2] and the impact on Gs, Tr, and WUE were not statistically significant.
Net Photosynthetic Rate Responses
Pn responded to changes in water and CO2 treatments, types of light sources, and fumigation methods. The stimulation of Pn by e[CO2] was 50.7% lower under water-deficit treatments than the well-watered treatments using solar radiation (Figure 1), whereas the stimulation of CO2 on Pn under water deficit was almost the same as that under well-watered treatment using lamp radiation. Additionally, under e[CO2] conditions, water deficit decreased plant Pn by 41.8 and 35.6% when using the field capacity and drought days methods to control the water conditions, respectively. A greater increase in Pn was observed when plants were exposed to e[CO2] in a free-air CO2 enrichment system (FACE, 64.2%) than in closed glasshouses (35.3%), greenhouses (14.1%), or growth chambers (4.3%) (Figure 1B). However, the e[CO2]-induced increase in Pn was significantly reduced by water deficit compared with well-watered plants in any growing environment (Figure 1C).
The stimulatory effect of increasing [CO2] on Pn reached a maximum at 551 to 600 ppm in well-watered plants. However, the e[CO2]-induced increase in Pn was significantly reduced by water deficit (43.4%) at 551–600 ppm (Figure 2A). Very strong CO2 fertilization effects on Pn were observed when the [CO2] increased from 601 to 800 ppm, and became >800 ppm during water deficit compared with the well-watered treatment (Figure 2A). The water deficit effect size magnitudes for Pn were −0.343, −0.408, and −0.75 at 55–65%, 40–54%, and <40% soil water at a[CO2], respectively, indicating that the highest water deficit resulted in the greatest inhibition (Figure 3A).
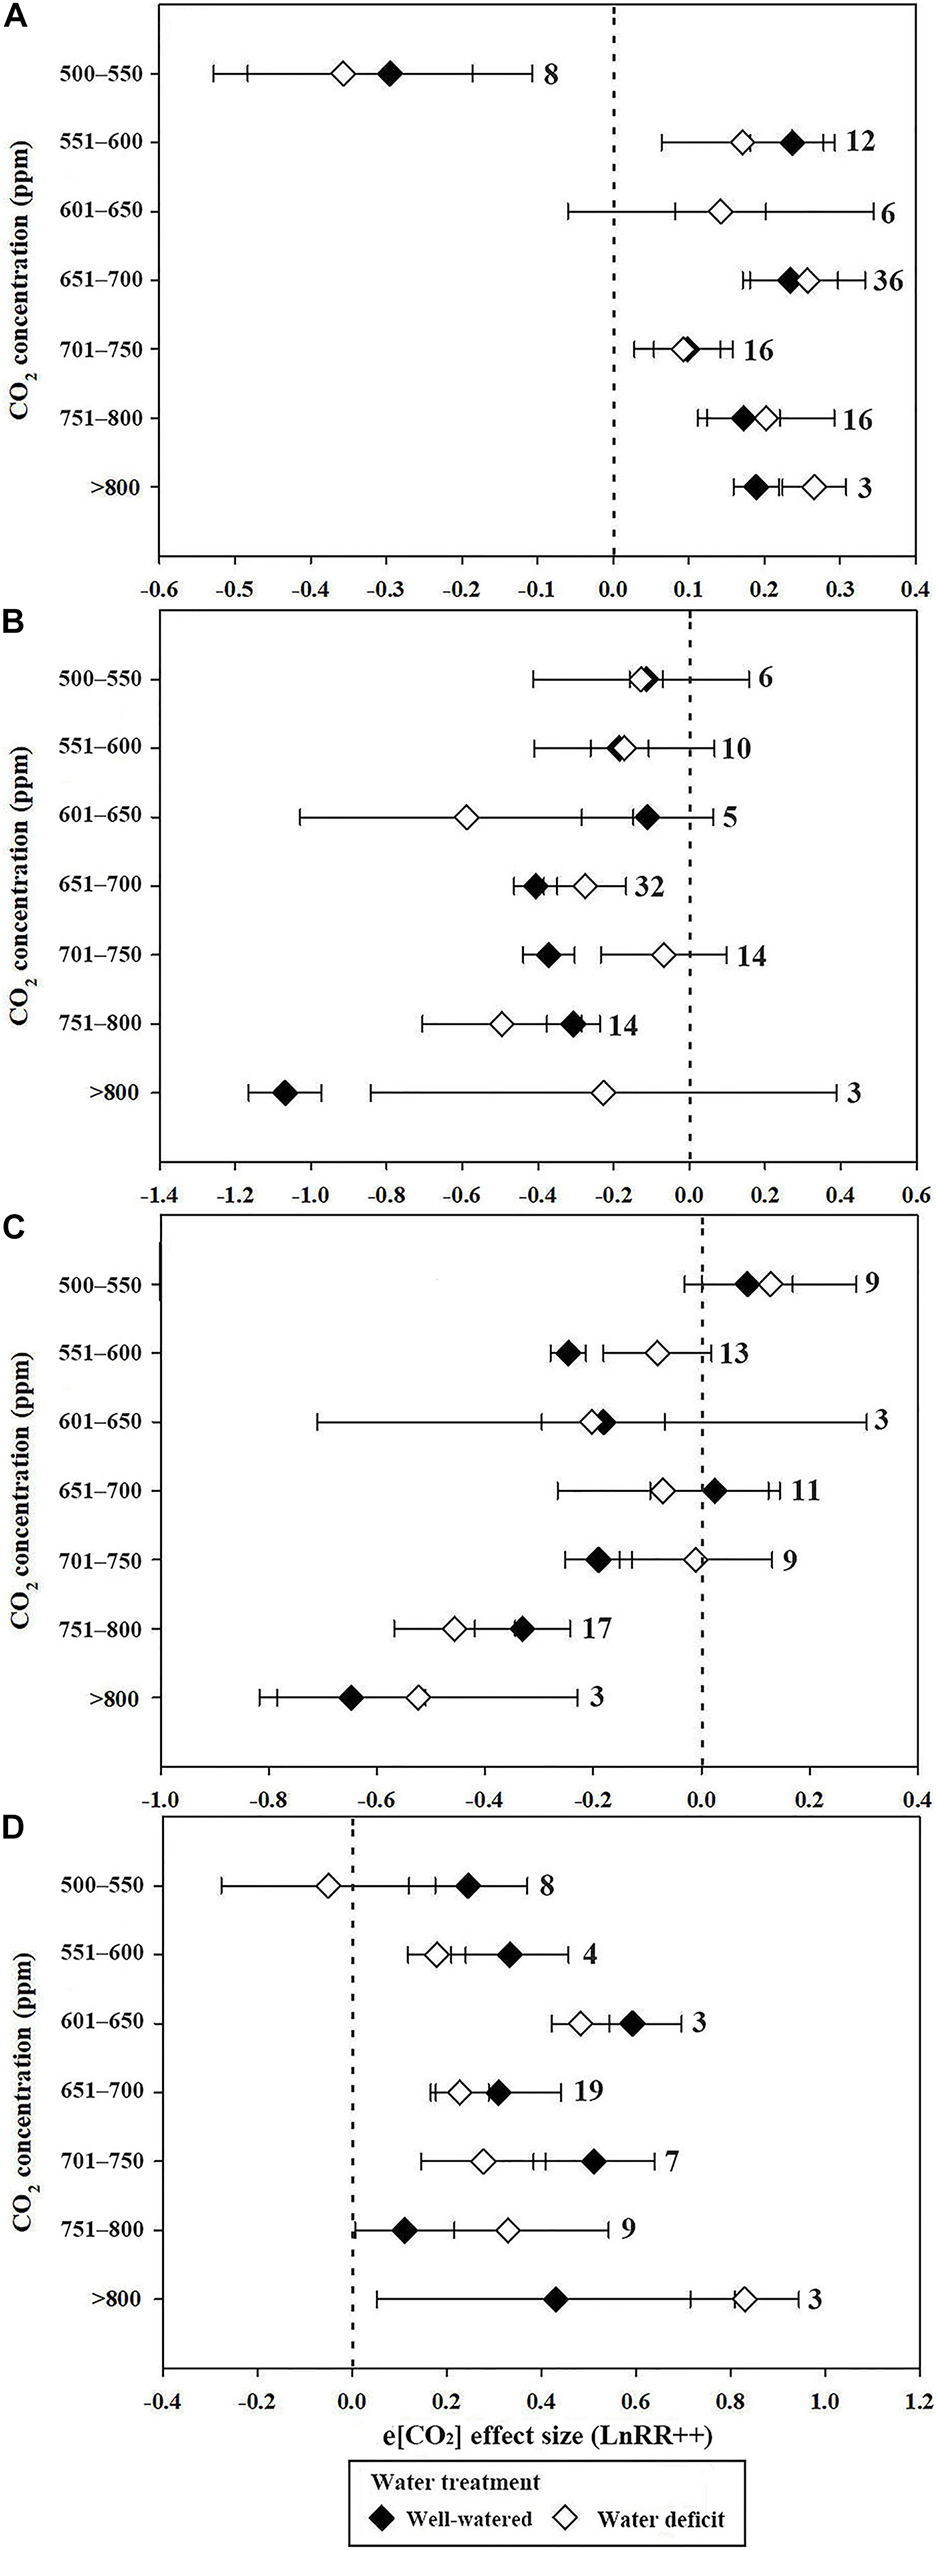
Figure 2. Mean effect sizes of e[CO2] on Pn (A), Gs (B), Tr (C), and WUE (D) under well-watered (black diamond) and water deficit (white diamond) conditions. e[CO2] treatments were divided into seven categories as stated on the y-axis.
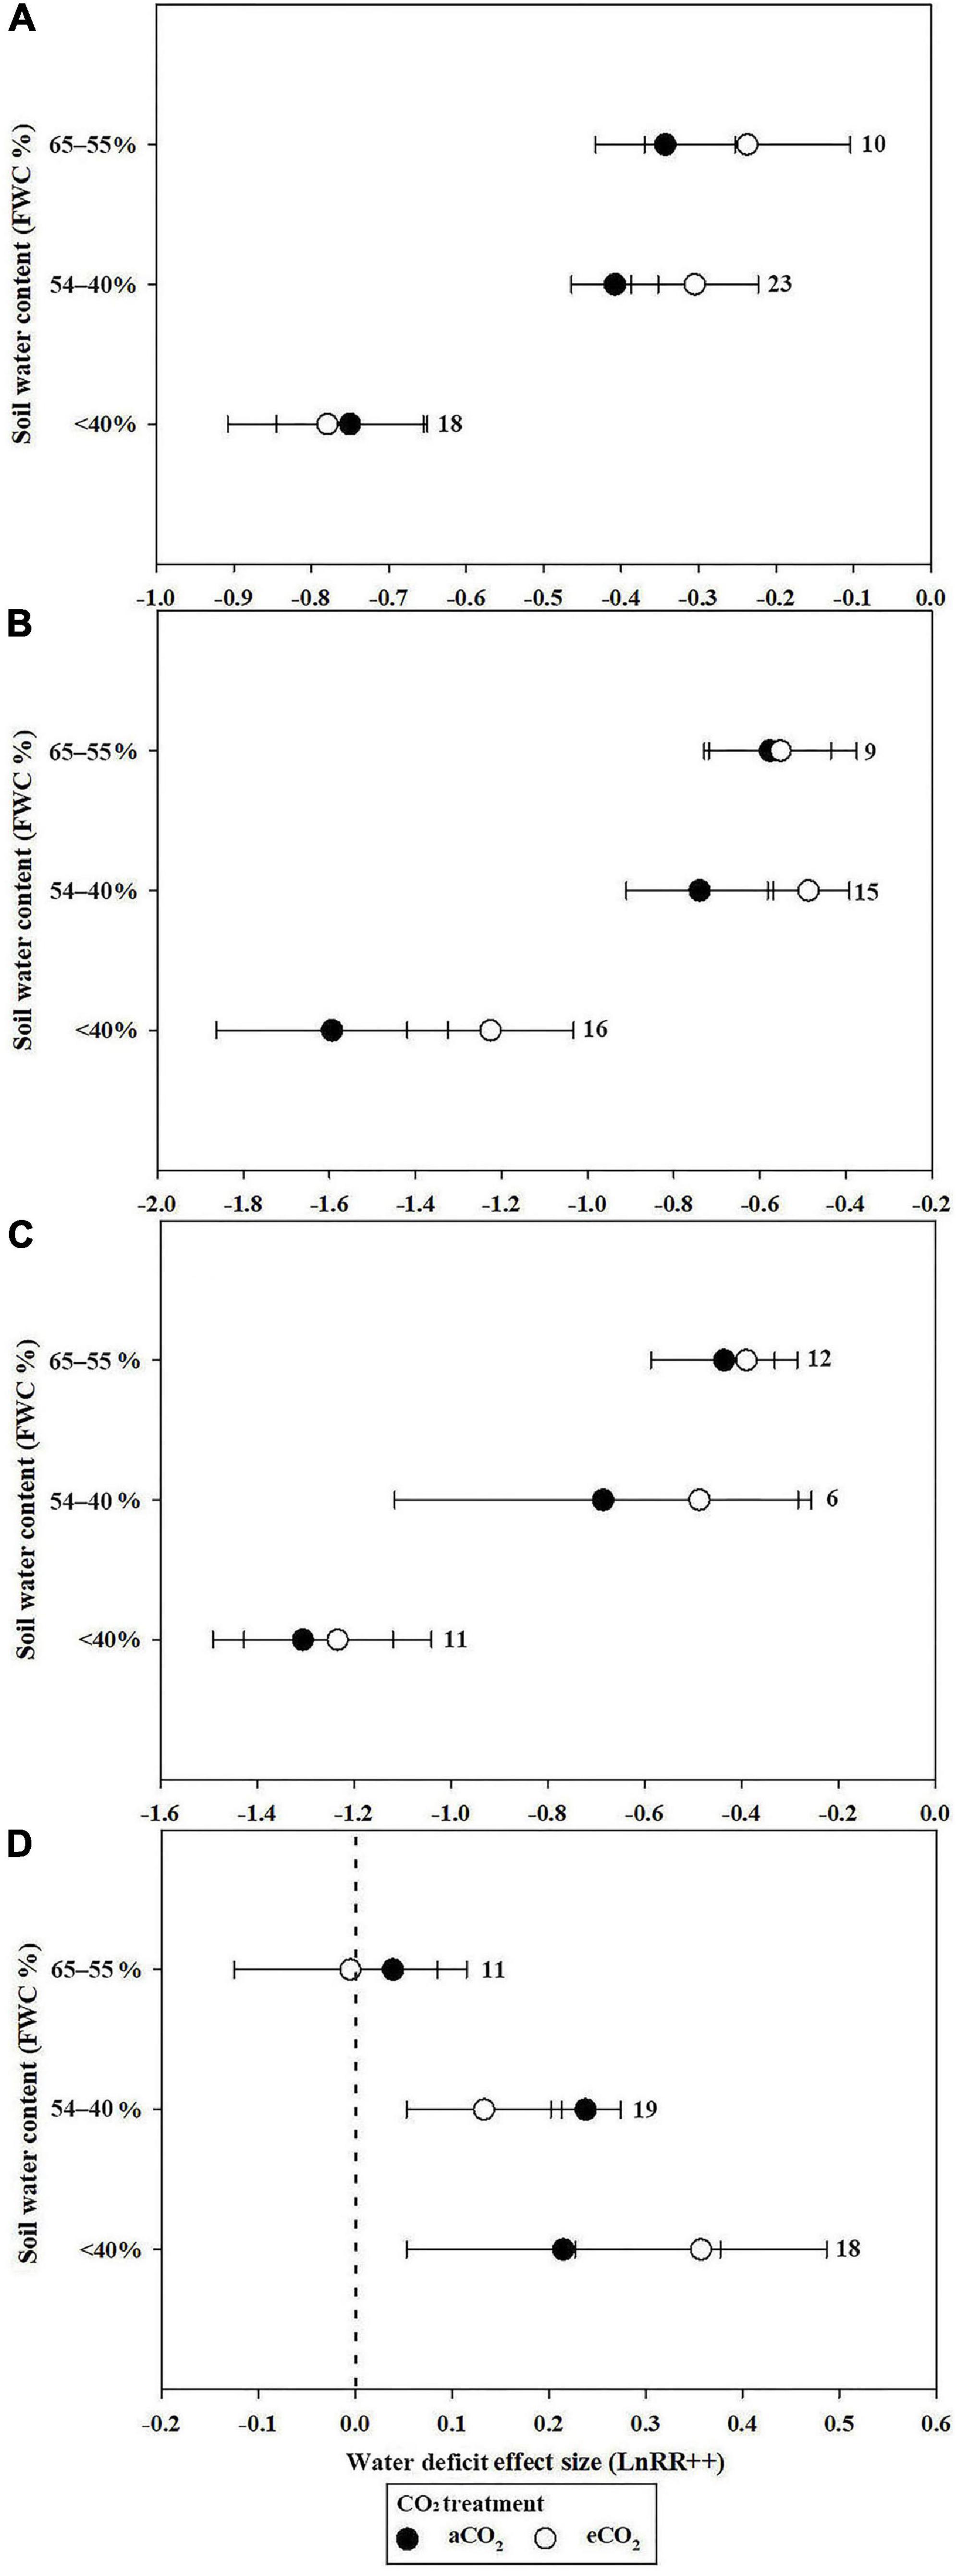
Figure 3. Mean effect sizes of water deficit on Pn (A), Gs (B), Tr (C), and WUE (D) under a[CO2] (black circles) and e[CO2] (white circles) treatment. Water-deficit treatments were based on three types of FWC: 65–55, 54–40, and <40%.
Plant Pn significantly increased by 11.2 and 21.5% when the soil water was between 65–55% and 54–40%, respectively, in conditions of e[CO2] compared to a[CO2] treatment. However, e[CO2] increased the inhibition after water-deficit treatment by 3.9% when the soil water was <40% (Figure 3A). The effect size of Pn decreased linearly with increasing drought days, with R2 values of 0.19 (Figure 4A; p = 0.0321) and 0.26 (Figure 4A; p = 0.0164) at a[CO2] and e[CO2], respectively, in a closed growing environment. However, there was no significant correlation between plant Pn response and drought days in open and semi-open environments, possibly owing to the relatively small sample size (n = 8) (Figure 4B).
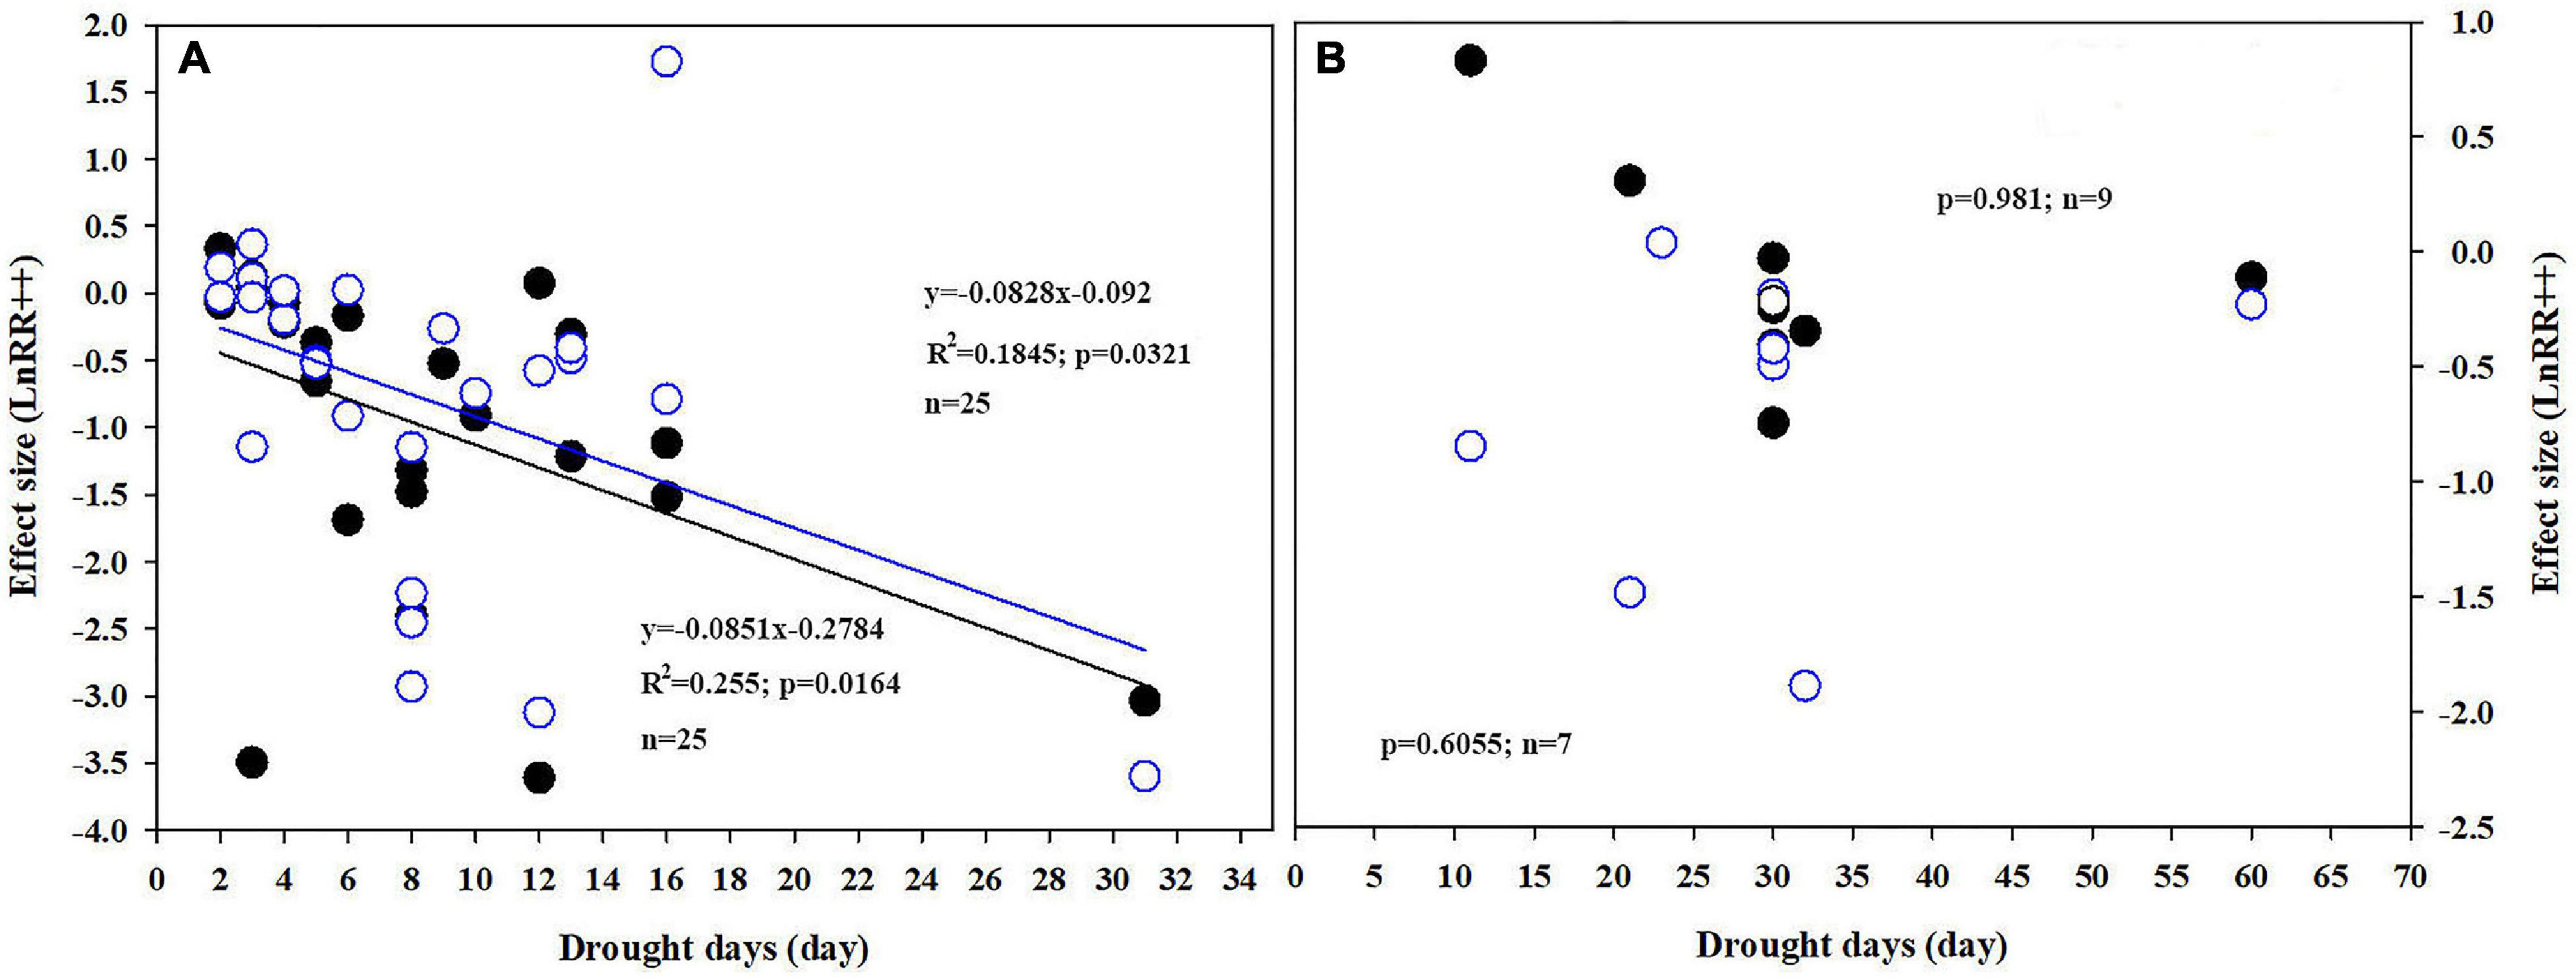
Figure 4. Correlations between drought days and response ratios of Pn under closed (A) and open/semi-open, (B) environments under a[CO2] (open circles) and e[CO2] (closed circles).
Stomatal Conductance Responses
Water-deficit treatment reduced the plant Gs for most plants except in shrubs, regardless of the CO2 treatment. Tree and crop Gs were significantly reduced by e[CO2] after water-deficit treatment by 11.1% (n = 53) and 14.5% (n = 20), respectively. Additionally, the water-deficit effect sizes of grass and legume Gs were −1.067 and −1.344 under a[CO2], which increased by 16.3 and 0.6% compared with that in e[CO2] conditions, respectively, (Figure 1). Similarly, e[CO2] reduced all plant Gs, regardless of the drought treatment, except for shrubs. The e[CO2] effect sizes of crop, legume, tree, and grass Gs were −1.229, −1.718, −1.057, and −1.519 under well-watered conditions; and −0.406, −0.376, −0.251, and −0.204 under water-deficit treatments, respectively (Figure 1). Therefore, water deficit reduced the e[CO2] response. In contrast, the effect size of shrubs was positive (0.135); however, the 95% CI included zero. The effects of the two water control methods on Gs were also not significant. The interactions of water deficit and e[CO2] on Gs were not statistically significant for plant type and control methods of water because the 95% CI included zero.
When the CO2 concentration was higher than 650 ppm (651–700, 701–750, 751–800, and >800 ppm), Gs decreases significantly in conditions of well-watered treatment (Figure 2B). Similarly, water-deficit treatment reduced Gs. The water-deficit effect size of Gs was −0.577, −0.74, and −1.594 when the FWC was 65–55, 54–40, and <40% after a[CO2] treatment, respectively. However, the water-deficit effect size of Gs was −0.552, −0.487, and −1.226 when the FWC was 65–55, 54–40, and <40% after e[CO2] treatment (Figure 3B).
Transpiration Rate Responses
Water deficit reduced the Tr of C3 plants to a greater degree than C4 plants, whereas e[CO2] reduced the Tr of C4 plants more than that of C3 plants. Meanwhile, water deficit reduced the Tr of grasses, trees, and legumes more than crops regardless CO2 concentration. Additionally, water deficit reduced the Tr by 29.7, 26, 0.52, and 56.5% in OTC, greenhouse, FACE, and growth chambers, respectively, under a[CO2] (Figure 1B). However, water deficit increased the Tr by 9.6% in FACE under e[CO2] treatment (Figure 1A). Moreover, e[CO2] reduced Tr regardless of the water condition and CO2 fumigation method except for OTC. However, the interactions of drought and e[CO2] on Tr were statistically insignificant for legumes and crop species.
The decrease in Tr for plants resulted in a much larger decrease in Tr at >750 ppm CO2 compared with 551–750 ppm CO2 (Figure 2C). However, there was no significant influence on Tr at 500–600 ppm CO2 (Figure 2C). The water deficit effect size of Tr was −0.436, −0.68, and −1.306 when FWC was 65–55, 54–40, and <40%, respectively (Figure 3C).
Leaf-Level Water Use Efficiency Responses
Graphical vector analysis showed that increased leaf-level WUE under CeWw treatment compared to the control (CaWw) may be due to the common effect of Pn and Tr (Figure 5). However, increased WUE caused by water deficit (CaWd) is attributable to the “Tr” positive effect (Figure 5). Water deficit induced a larger increase in WUE under solar grown plants compared to plants grown under a lamp, regardless of [CO2]. e[CO2]-induced stimulation of WUE was attributable to a “Pn” positive effect when grown in sunlight (Figures 6A,B). There were no significant interaction effects for C3 plants in WUE (Figures 1A–C). Water deficit increased the WUE of C3 plants by 32.8 and 21.4% in the a[CO2] and e[CO2] treatments, respectively, but it had no effect on the WUE of C4 plants. Instead, water deficit resulted in a parallel decrease in Pn and Tr of C4 plants (“steady-state” decrease) under a[CO2] (Figures 6C,D). Meanwhile, e[CO2] increased the WUE of C3 and C4 plants by 31.7 and 53.3%, respectively, in the well-watered treatments, and by 20 and 95.8%, respectively, in the water-deficit treatments.
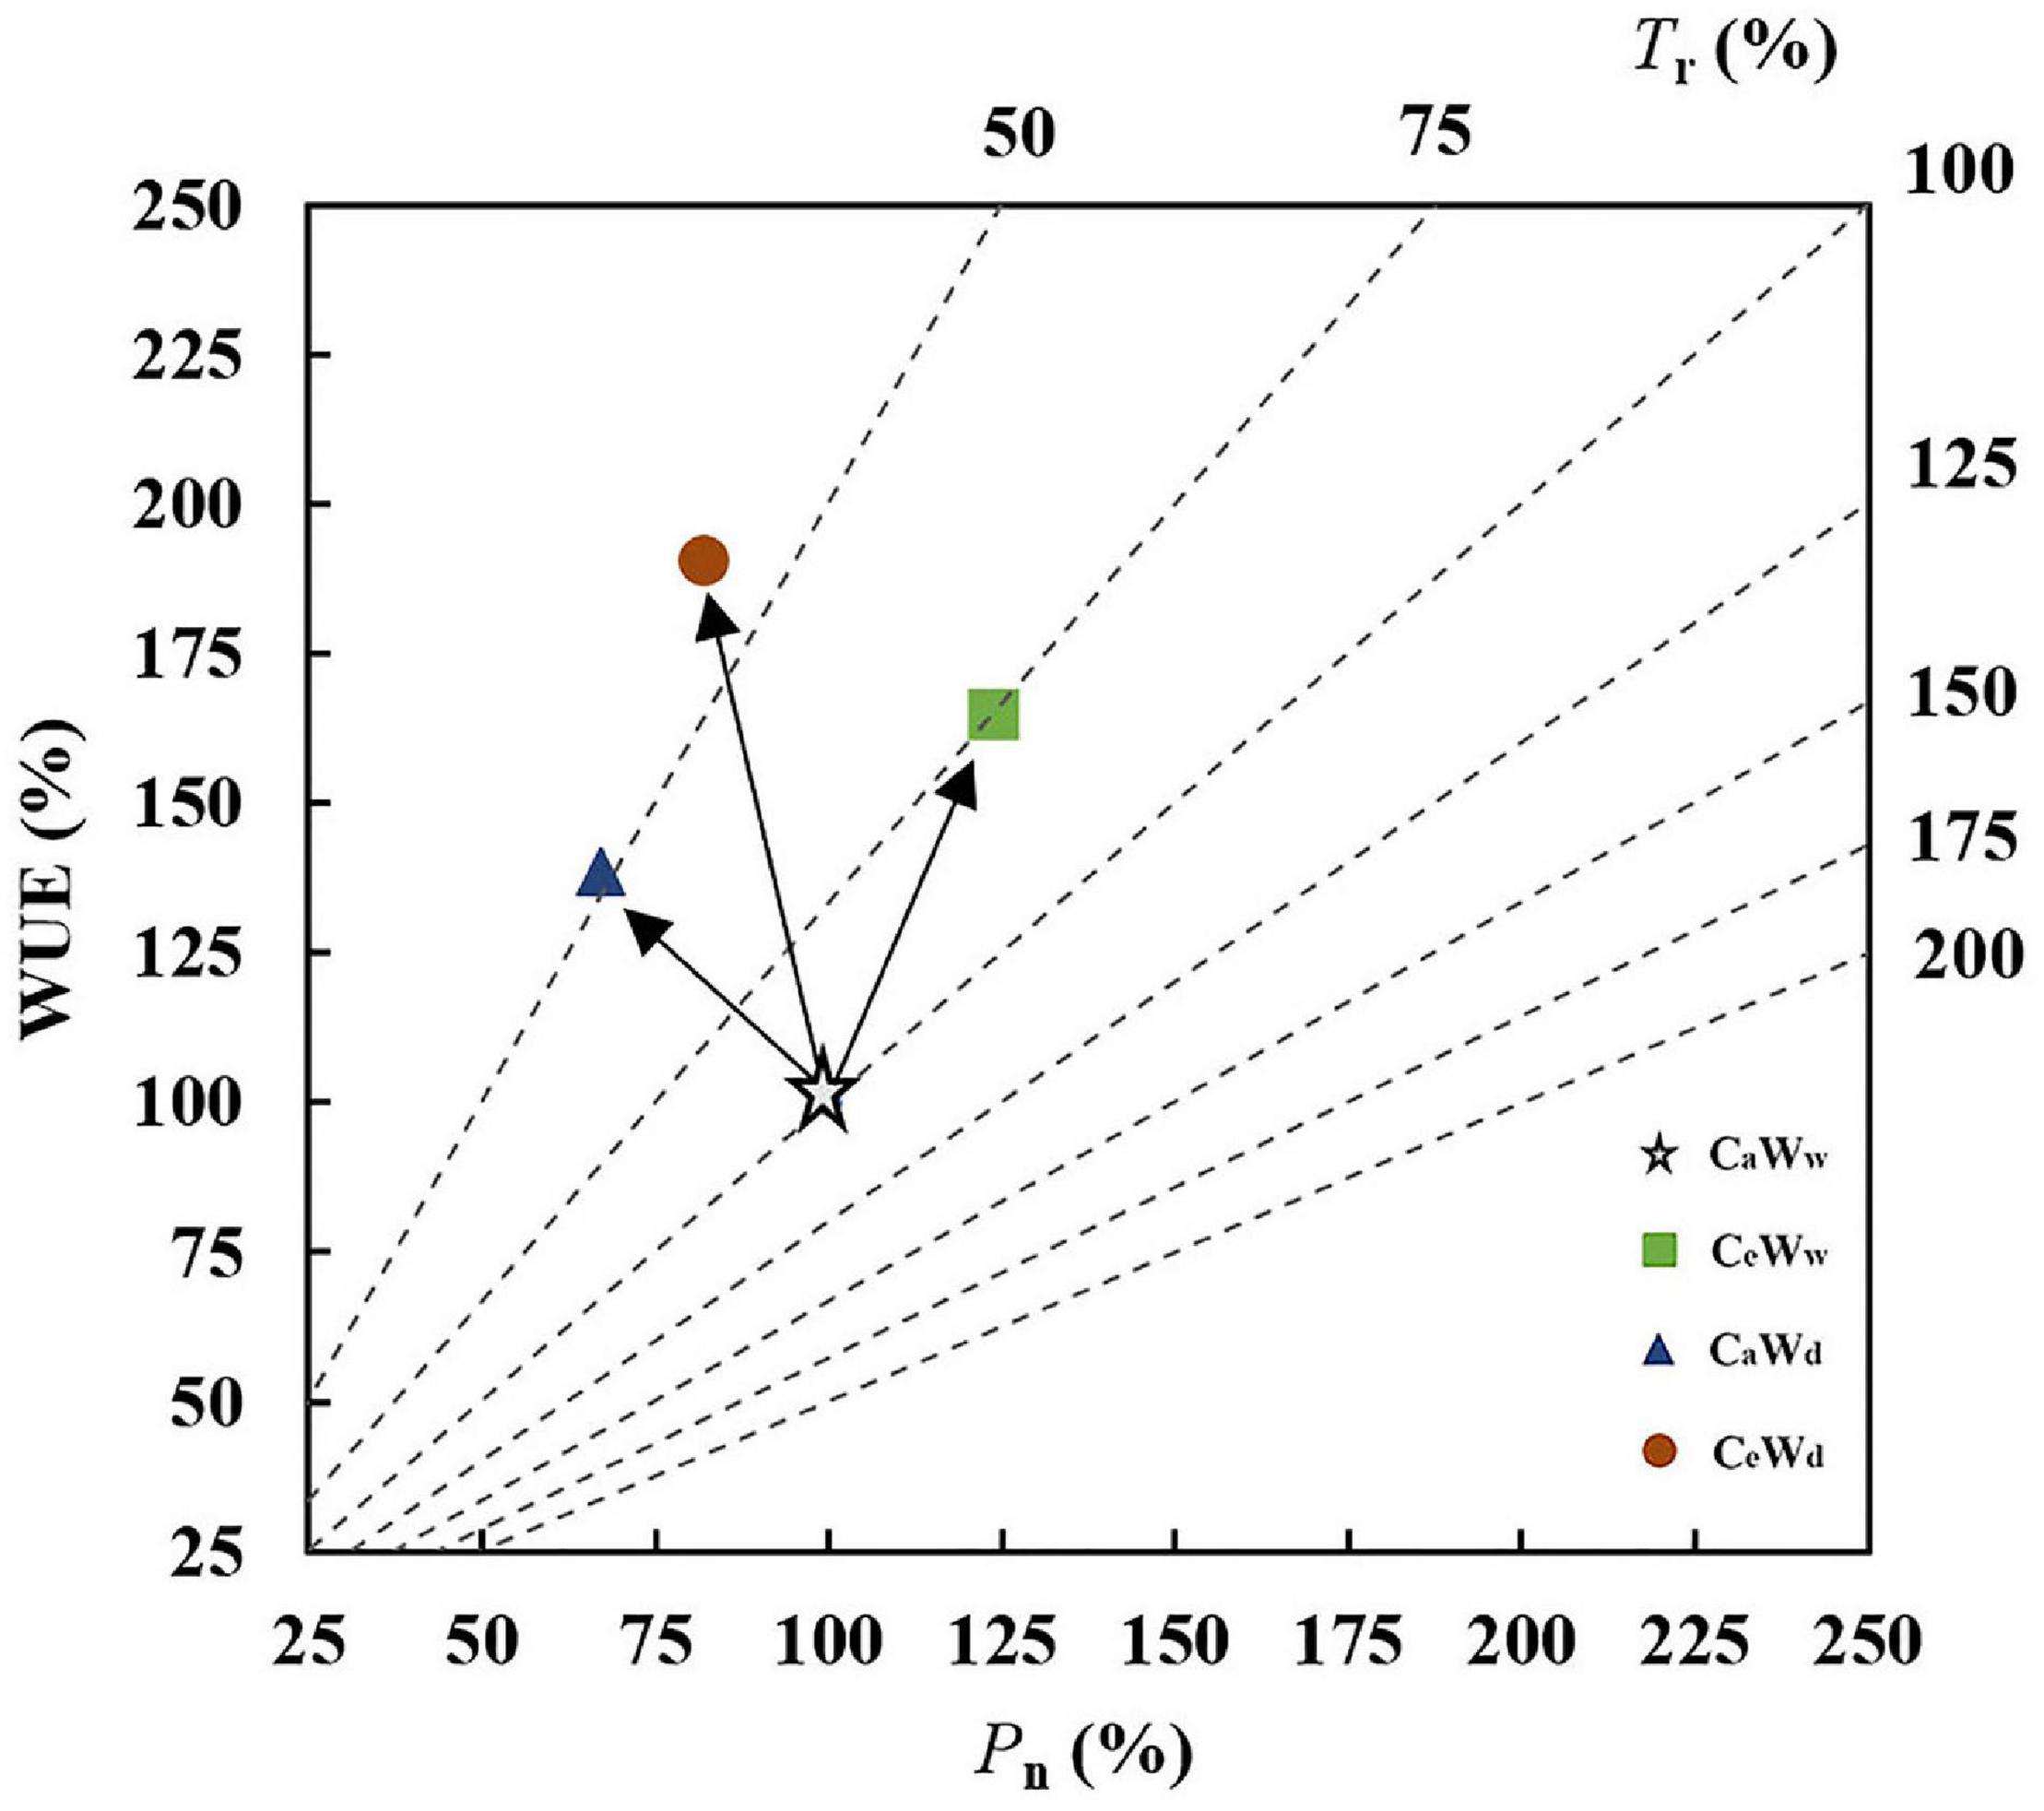
Figure 5. Graphical vector analysis (GVA) showing the effects of e[CO2] and water status on Pn, Tr, and WUE (CeWd, orange circle; CeWw, green box; CaWd, blue triangle; and CaWw, white star).
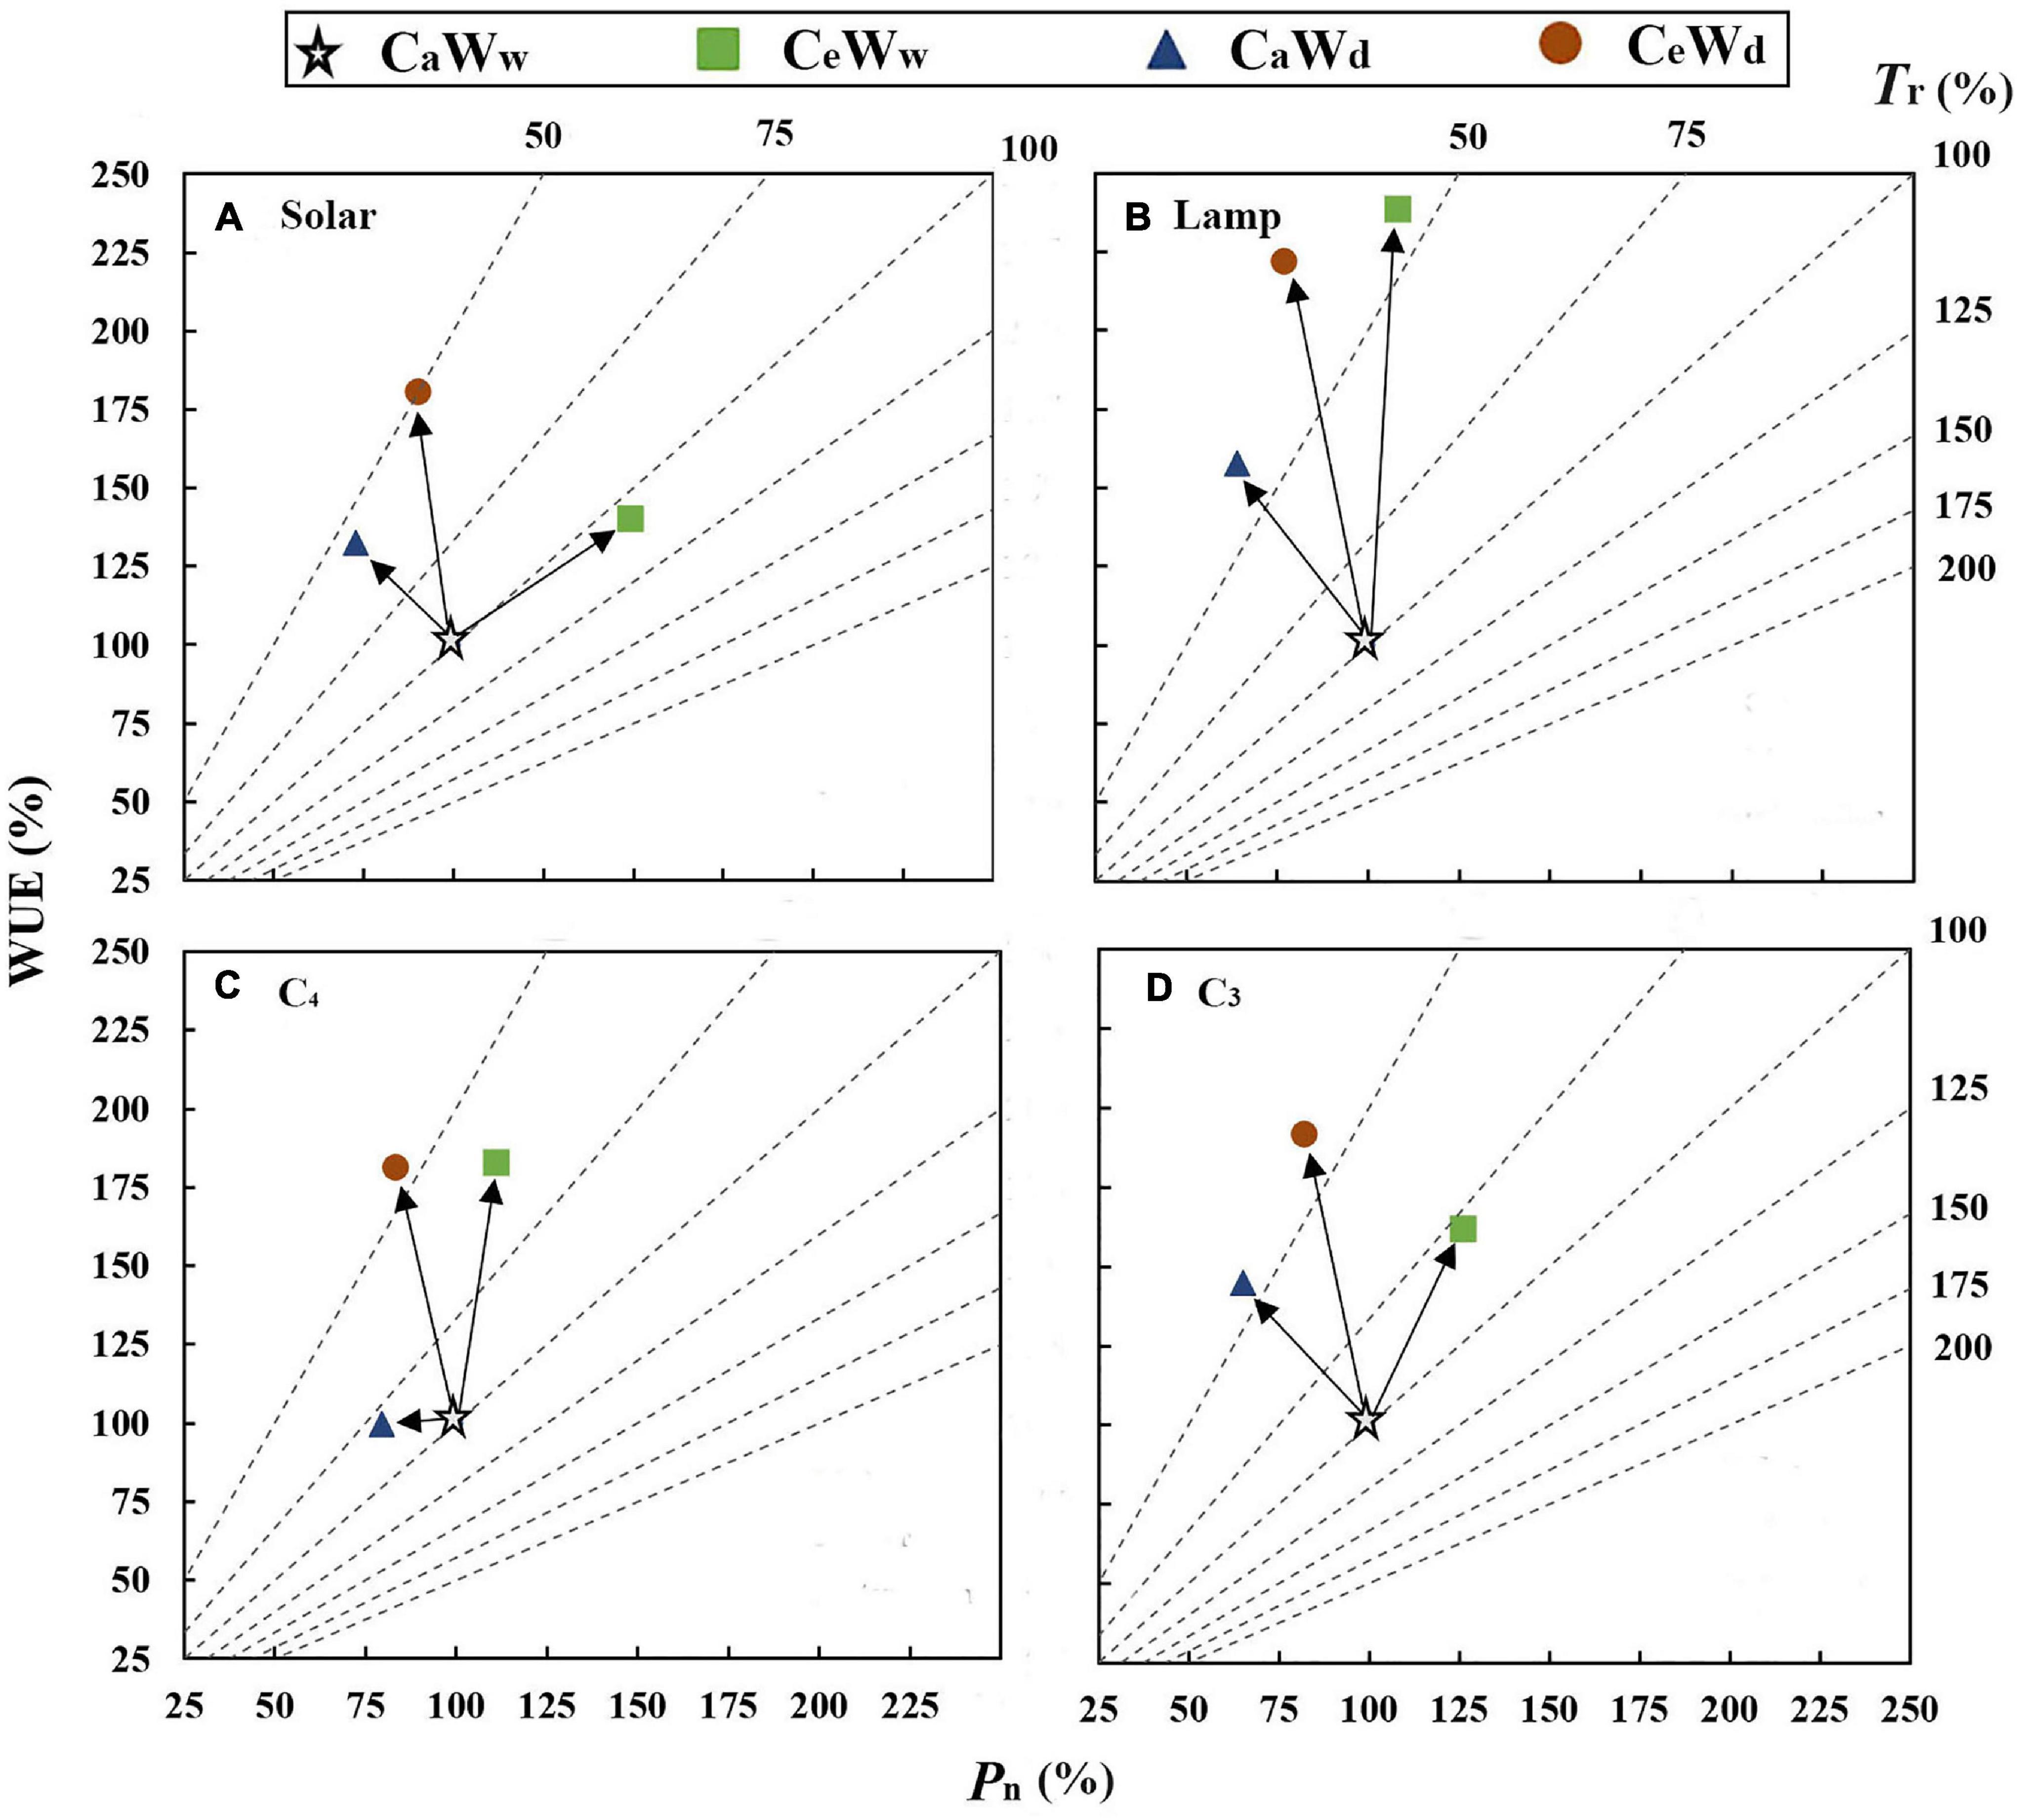
Figure 6. Graphical vector analysis showing the effects of e[CO2] and water deficit on Pn, Tr, and WUE (CeWd, orange circle; CeWw, green box; CaWd, blue triangle; and CaWw, white star). (A) Plants grown under solar radiation; (B) plants grown under lamps; (C) C4 plants; and (D) C3 plants.
Water use efficiency reached a maximum of 0.593 (81.0%) and 0.483 (62.1%) when the CO2 concentration was 601–650 ppm in water deficit and well-watered treatments, respectively. The e[CO2]-induced increases in WUE were less prominent in the water deficit treatment than in the well-watered treatment at 500–550, 551–600, 601–650, and 651–700 ppm [CO2] (0.246 vs. −0.05; 0.334 vs. 0.18; 0.593 vs. 0.483; 0.31 vs. 0.228; and 0.512 vs. 0.278, respectively) (Figure 2D). However, the e[CO2]-induced increase in WUE during water deficit treatment was 1.8 and 2.53 times greater than that of the well-watered treatments at 751–800 ppm CO2 and >800 ppm CO2, respectively (Figure 2D). The water deficit induced increase in WUE in the e[CO2] treatment was 47.1% lower than that in the a[CO2] treatment when FWC was 54–40%, whereas the increase in WUE in the e[CO2] treatment was 78.8% higher than that in the a[CO2] treatment when FWC was <40% (Figure 3D). Additionally, there was no significant change in WUE when the FWC was between 55 and 65% (Figure 3D).
Discussion
Soil Water Deficit Constrains the Positive e[CO2] Effect on Gas Exchange
It has been suggested that the positive effects of e[CO2] cannot be maintained when other environmental factors (nutrients, temperature, and availability of water) are limited (Carter et al., 2007; Elliott et al., 2014; Fernando et al., 2019). Our meta-analysis results supported our H1 hypothesis that the e[CO2]-induced stimulation of Pn was reduced by water deficit treatment (Figures 1B,C). e[CO2] leads to a delay in the onset of drought stress due to increased stomatal closure preventing water loss (Paoletti and Grulke, 2005; Yamaguchi et al., 2019; Jiménez et al., 2020). However, this delay only existed under mild drought stress because further stomatal closure leads to decreases in intercellular CO2 and reduces carbon assimilation (Figure 7). e[CO2] did not weaken the inhibition by water deficit treatment when soil water was <40% FWC (Figure 3A). This result indicates that the effect of soil water deficit is stronger than that of e[CO2] when under severe water-deficit stress. In general, water deficit negatively affected the Pn of most C3 plants due to favoring RuBP oxygenation over carboxylation. Meanwhile, water deficit induced the stomatal closure reduced Tr, thereby inhibiting the uptake of N, which was associated with reductions in the amount and/or activity of Rubisco (Figure 7). Additionally, Zheng et al. (2020) found that the regularity of stomatal distribution pattern was dramatically reduced by e[CO2] when winter wheat plants were constrained to moderate and severe stresses, implying that soil moisture conditions partly determined the response of stomatal distribution pattern to e[CO2] (Figure 7). The effect size of Pn decreased linearly with increasing drought days, regardless of [CO2], also suggesting that water stress had a greater impact on plant growth than e[CO2] when plants are under severe stress.
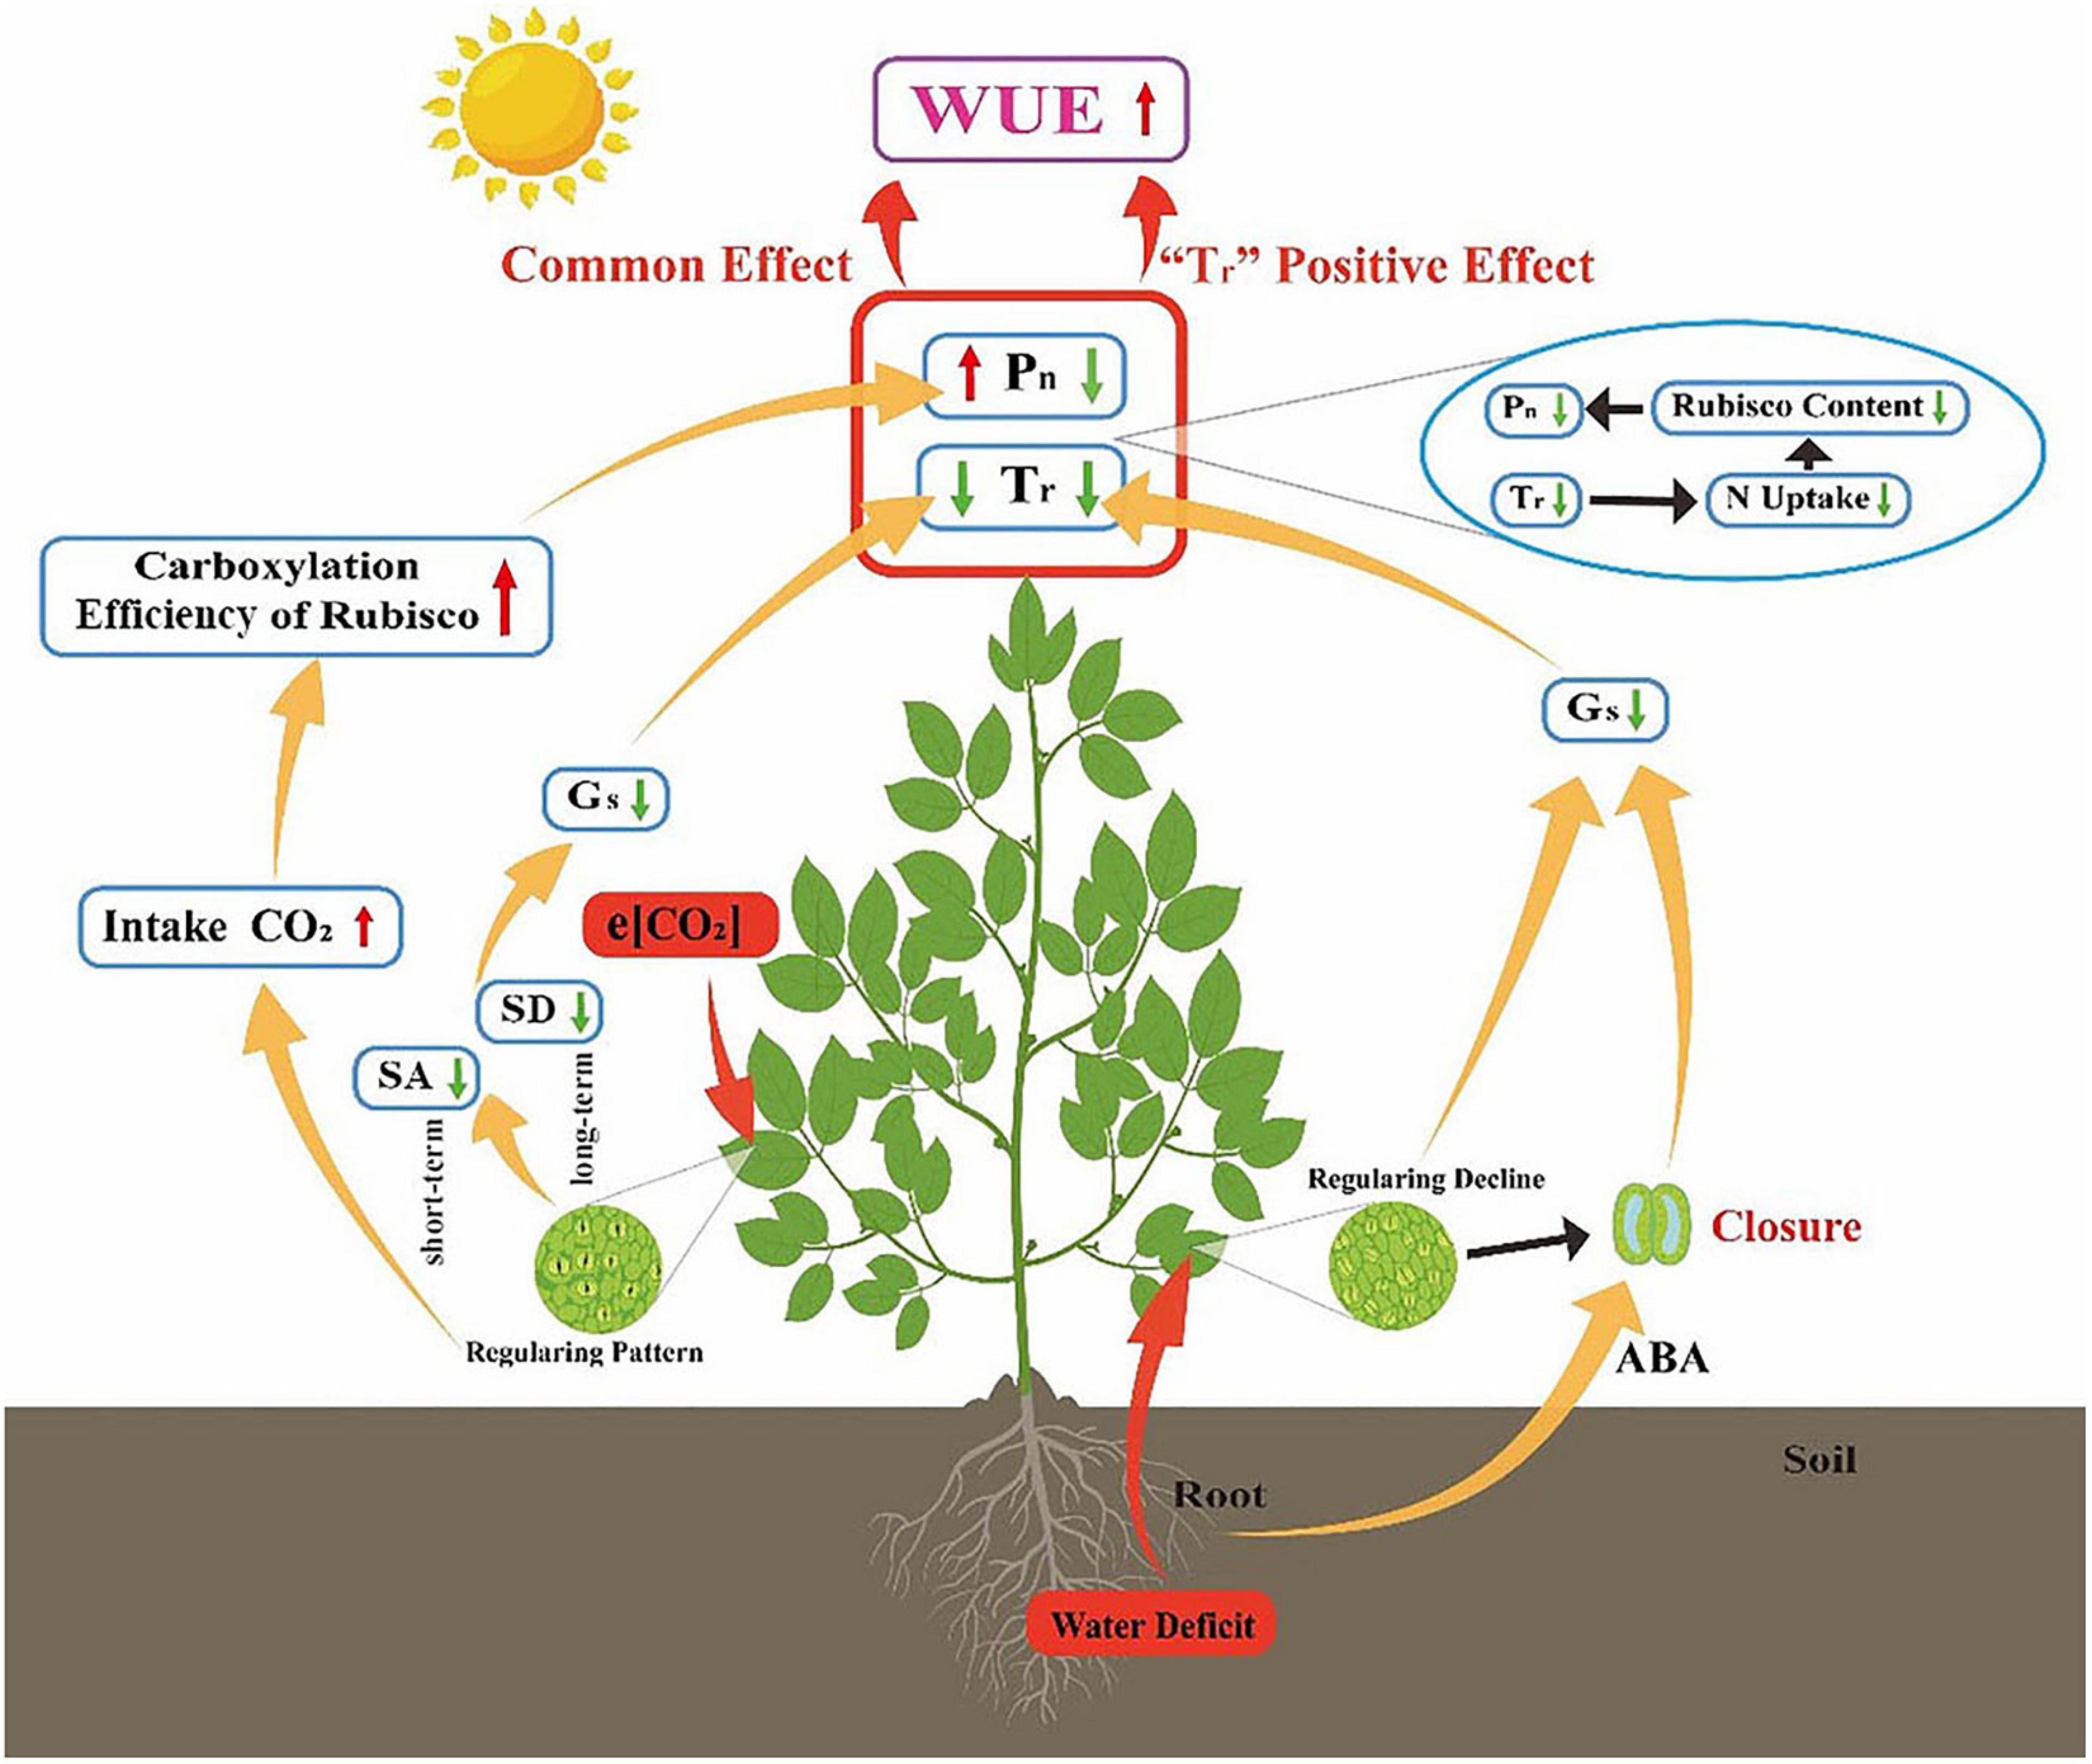
Figure 7. Possible mechanism for soil water deficit constraining the CO2 fertilization effect on gas exchange and leaf-level WUE. e[CO2] increases carboxylation efficiency of Rubisco by consuming more CO2, which boosts Pn. For short-term responses, plants reduce stomatal aperture (SA) while decreasing stomatal density (SD) for long-term response, which both can reduce Gs and Tr. Plant WUE is enhanced owing to the Pn and Tr common effect. Water stress induces abscisic acid (ABA) synthesis in the root which leads to stomatal closure and loss of regularity of stomatal distribution. Low Gs and Tr reduces N acquisition, thus inhibiting Pn. Water deficit-induced increase of WUE is mainly caused by Tr decrease rather than Pn.
Soil Water Deficit Modulated the [CO2] Effect on Leaf-Level Water Use Efficiency
Stomatal optimization theory states that stomatal opening to allow CO2 uptake inevitably comes at the expense of H2O loss (Ferris et al., 2002; Robredo et al., 2010). Therefore, climate change will affect not only the rate of carbon fixation in plants, but also water loss. Evidence was found to support our H2 hypothesis that both water deficit and e[CO2] treatment improved leaf-level WUE, but the underlying mechanisms for maintaining high water availability may be different. In general, an increased WUE is a rapid response to drought by closing stomata through root-generated xylem-born ABA (Ferris et al., 2002; Zhang et al., 2018, 2021). Conversely, e[CO2] changes stomatal aperture (SA) by increasing intercellular [CO2] for a short-term response (Xu et al., 2016; Li S. et al., 2020). Additionally, stomatal density (SD) also decreased when plants were exposed to high [CO2] for a long time (Lin et al., 2001; Zhang et al., 2019). Concurrently, an increase on Pn, driven by the improve in increase by improved regularity of stomatal spatial distribution (Xu, 2015; Zheng et al., 2020). This study showed that water deficit and e[CO2] significantly increased WUE by 24.5 and 29.3%, respectively (Figure 1A). Increases in WUE under the CaWd treatment are attributable to the “Tr” positive effect (Figure 5), whereas increases in WUE under the CeWw treatment may be due to the common effect of Pn and Tr (Figure 7). Meanwhile, water deficit increased the WUE of C3 plants by 32.8 and 21.4% in the a[CO2] and e[CO2] treatments, respectively, implying that the water deficit induced increase of WUE may also be modulated by [CO2]. In contrast, e[CO2] had a greater effect on WUE of C4 plants than C3 plants in water deficit treatment, which is consistent with previous studies (Peaarcy and Ehleringer, 1984). C4 plants have higher light energy use efficiency because photosynthesis is completed by the combination of vascular bundle sheath cells and mesophyll cells (Peaarcy and Ehleringer, 1984; Ainsworth and Long, 2005). Therefore, C4 plants have higher CO2 assimilation rates, less transpiration and water loss, and higher WUE compared with C3 plants (Peaarcy and Ehleringer, 1984; Conley et al., 2001). In addition, e[CO2]-induced stimulation of WUE is attributable to a “Pn” positive effect when growing under sunlight regardless of water concentration. Hence, higher light appears to stimulate the effect of e[CO2] on plants more efficiently than lamps.
Effects of Growing Environment and Plant Type on Plant Gas Exchange Response to e[CO2]
It is widely reported that e[CO2] stimulates Pn through the “CO2 fertilization effect” because the current CO2 concentration limits the photosynthetic ability of plants (Xu, 2015; Fitzgerald et al., 2016). Our meta-analysis demonstrated that the % increase in Pn by e[CO2] treatments depended on the fumigation method; Pn was stimulated to a greater magnitude when plants were exposed to e[CO2] in an open environment than in a closed environment, especially when compared to the growth chamber. In contrast, another meta-analysis studying the effects of e[CO2] indicated that the more closely the fumigation conditions mimicked field conditions, the smaller the stimulation of rice yield (Ainsworth, 2008). It is important to note that earlier studies were conducted at lower control [CO2] than recent studies owing to changes in atmospheric CO2. For example, earlier FACE and chamber studies were conducted at 339 and 330–360 ppm control CO2, respectively (Baker et al., 1990; Teramura et al., 1990), whereas recent control experiments used approximately 400 ppm (Zinta et al., 2014; van der Kooi et al., 2016; Zheng et al., 2020). In addition, there were differences in the light conditions used. For example, FACE and OTC rely on natural light, and some greenhouse/glasshouse studies also used natural light but were covered by transparent material at the top, whereas almost all plants growing in growth chambers used lamps as a light source. Enclosed growing environments may be limited through the downregulation of photosynthesis (Ainsworth and Long, 2005; Zhang et al., 2021). Under high light conditions, plants are generally better able to take advantage of increased [CO2] due to altered N partitioning within the photosynthetic apparatus to favor light-harvesting complexes (Yu et al., 2012; Kizildeniz et al., 2021). However, at low light levels, light-dependent reactions limit the rate of photosynthesis (Assmann, 1999; Yu et al., 2012). Our meta-analysis supported these conclusions since the Pn of plants grown under natural light was higher than that under lamps. Therefore, light levels and CO2 concentration may contribute to a smaller stimulation of Pn by e[CO2] in a closed–CO2 fumigation system.
Our results showed that e[CO2] reduced Gs, but the extent of the decrease varied according to plant type. The Gs of legumes are more sensitive to [CO2] which may be due to the decrease in total K content of legumes in high CO2 environments, and the decrease in K+ concentration increases stomatal resistance resulting in stomatal closure (Peaarcy and Ehleringer, 1984). Moreover, Gs reached a minimum when the [CO2] was >800 ppm, while the Pn did not decrease, implying that Gs was not the cause of Pn variation (Figure 1B). However, this result contradicts previous conclusions stating that changing photosynthesis and Gs is evidence of stomatal control over photosynthesis (Lawson and Blatt, 2014; Xu et al., 2016). It is possible that the decreased Gs may be the result rather than the cause of decreased photosynthesis. This may be related to e[CO2], resulting in an increase in the concentration of ions and organic molecules; thus, guard cells swell to balance the water potential inside and outside the cell, reducing stomatal openness. Nevertheless, it should be noted that this study did not compare the long-term and short-term fumigation time of plants with high CO2 concentration mainly due to the limited data and small sample size in previous literatures. Therefore, further studies with long-term multi-factor experiments are needed to fully understand the mechanisms and processes governing the interactions between e[CO2] and water deficit on many plant types for comparing the “long-term” and “short-term” effects of e[CO2] on plants under future climate change.
Conclusion
Our meta-analysis demonstrated that e[CO2] generally augmented Pn, but the magnitude of the increase varied depending on the CO2 fumigation method and light conditions. The greatest increases occurred when plants were exposed to e[CO2] in an open environment under natural light. Previous projections based on the results of earlier e[CO2] experiments may underestimate the “CO2 fertilization effect” in future global terrestrial ecosystems, because the CO2 fertilization effect on plant Pn may be limited by the enclosed experimental methods and low light. Our results also indicated that both water deficit and e[CO2] improved leaf-level WUE. However, e[CO2]-induced stimulation of WUE is attributable to the Pn and Tr common effect, whereas water deficit induced increases of WUE are attributable to the “Tr” positive effect. Additionally, water deficit may result in a greater impact on the Pn and WUE than e[CO2], that is, the “CO2 fertilization effect” may be modulated by soil water conditions under future climate change. Therefore, fumigation conditions that more closely mimic field conditions and multi-factorial experiments such as water availability, high temperature, low N/P, and elevated O3 are needed to predict the response of plants to future climate change.
Data Availability Statement
The datasets presented in this study can be found in online repositories. The names of the repository/repositories and accession number(s) can be found in the article/Supplementary Material.
Author Contributions
FL, XG, and XZ designed the study. FL and DG performed the literature collection and data extraction. FL performed data analysis and wrote the initial manuscript with additional input from XG and XZ. All authors edited and approved this version of the manuscript.
Funding
This work was jointly supported by the National Natural Science Foundation of China (42125705), the Cyrus Tang Foundation, Shaanxi Key Research and Development Program (2020ZDLNY07-04), and the “111” project (Grant No. B12007).
Conflict of Interest
The authors declare that the research was conducted in the absence of any commercial or financial relationships that could be construed as a potential conflict of interest.
Publisher’s Note
All claims expressed in this article are solely those of the authors and do not necessarily represent those of their affiliated organizations, or those of the publisher, the editors and the reviewers. Any product that may be evaluated in this article, or claim that may be made by its manufacturer, is not guaranteed or endorsed by the publisher.
Supplementary Material
The Supplementary Material for this article can be found online at: https://www.frontiersin.org/articles/10.3389/fpls.2021.775477/full#supplementary-material
Footnotes
References
Ainsworth, E. A. (2008). Rice production in a changing climate: a meta-analysis of responses to elevated carbon dioxide and elevated ozone concentration. Glob. Chang. Biol. 14, 1642–1650. doi: 10.1111/j.1365-2486.2008.01594.x
Ainsworth, E. A., and Long, S. P. (2005). What have we learned from 15 years of free-air CO2 enrichment (FACE)? A meta-analytic review of the responses of photosynthesis, canopy. New Phytol. 165, 351–371. doi: 10.1111/j.1469-8137.2004.01224.x
Allen, L. H., Kakani, V. G., Vu, J. C. V., and Boote, K. J. (2011). Elevated CO2 increases water use efficiency by sustaining photosynthesis of water-limited maize and sorghum. J. Plant Physiol. 168, 1909–1918. doi: 10.1016/j.jplph.2011.05.005
Ameye, M., Wertin, T. M., Bauweraerts, I., McGuire, M. A., Teskey, R. O., and Steppe, K. (2012). The effect of induced heat waves on Pinus taeda and Quercus rubra seedlings in ambient and elevated CO2 atmospheres. New Phytol. 196, 448–461. doi: 10.1111/j.1469-8137.2012.04267.x
Assmann, S. M. (1999). The cellular basis of guard cell sensing of rising CO2. Plant Cell Environ. 22, 629–637. doi: 10.1046/j.1365-3040.1999.00408.x
Baig, S., Medlyn, B. E., Mercado, L. M., and Zaehle, S. (2015). Does the growth response of woody plants to elevated CO2 increase with temperature? A model-oriented meta-analysis. Glob. Chang. Biol. 21, 4303–4319. doi: 10.1111/gcb.12962
Bajji, M., Lutts, S., and Kinet, J. M. (2001). Water deficit effects on solute contribution to osmotic adjustment as a function of leaf ageing in three durum wheat (Triticum durum Desf.) cultivars performing differently in arid conditions. Plant Sci. 160, 669–681. doi: 10.1016/s0168-9452(00)00443-x
Baker, J. T., Allen, L. H., and Boote, K. J. (1990). Growth and yield responses of rice to carbon-dioxide concentration. J. Agr. Sci. 115, 313–320. doi: 10.1017/S002185960007572
Barton, C. M., Duursma, R. A., Medlyn, B. E., Ellsworth, D. S., Eamus, D., Tissue, D. T., et al. (2012). Effects of elevated atmospheric [CO2] on instantaneous transpiration efficiency at leaf and canopy scales in Eucalyptus saligna. Glob. Chang. Biol. 18, 585–595. doi: 10.1111/j.1365-2486.2011.02526.x
Bencze, S., Bamberger, Z., Janda, T., Balla, K., Varga, B., Bedo, Z., et al. (2014). Physiological response of wheat varieties to elevated atmospheric CO2 and low water supply levels. Photosynthetica 52, 71–82. doi: 10.1007/s11099-014-0008-y
Birami, B., Naegele, T., Gattmann, M., Preisler, Y., Gast, A., Arneth, A., et al. (2020). Hot drought reduces the effects of elevated CO2 on tree water-use efficiency and carbon metabolism. New Phytol. 226, 1607–1621. doi: 10.1111/nph.16471
Carter, T. R., Jones, R. N., and Lu, X. (2007). “New assessment methods and the characterisation of future conditions,” in Climate Change 2007: Impacts, Adaptation and Vulnerability. Contribution of Working Group II to the Fourth Assessment Report of the Intergovernmental Panel on Climate Change eds M. L. Parry, O. F. Canziani, J. P. Palutikof, P. J. van der Linden, and C. E. Hanson (Cambridge: IPCC, Cambridge University Press), 133–171.
Casteel, C. L., O’Neill, B. F., Zavala, J. A., Bilgin, D. D., Berenbaum, M. R., and DeLucia, E. H. (2008). Transcriptional profiling reveals elevated CO2 and elevated O3 alter resistance of soybean (Glycine max) to Japanese beetles (Popillia japonica). Plant Cell Environ. 31, 419–434. doi: 10.1111/j.1365-3040.2008.01782.x
Conley, M. M., Kimball, B. A., Brooks, T. J., Pinter, P. J. Jr., Hunsaker, D. J., Wall, G. W., et al. (2001). CO2 enrichment increases water-use efficiency in sorghum. New. Phytol. 151, 407–412. doi: 10.1046/j.1469-8137.2001.00184.x
Cotrufo, M. F., Ineson, P., and Scott, A. (1998). Elevated CO2 reduces the nitrogen concentration of plant tissues. Glob. Chang. Biol. 4, 43–54. doi: 10.1046/j.1365-2486.1998.00101.x
Couture, J. J., Meehan, T. D., Rubert-Nason, K. F., and Lindroth, R. L. (2017). Effects of elevated atmospheric carbon dioxide and tropospheric ozone on phytochemical composition of trembling aspen (Populus tremuloides) and paper birch (Betula papyrifera). J. Chem. Ecol. 43, 26–38. doi: 10.1007/s10886-016-0798-4
Curtis, P. S., and Wang, X. Z. (1998). A meta-analysis of elevated CO2 effects on woody plant mass, form, and physiology. Oecologia 113, 299–313. doi: 10.1007/s004420050381
Drake, J. E., Power, S. A., and Duursma, R. A. (2017). Stomatal and non-stomatal limitations of photosynthesis for four tree species under drought: a comparison of model formulations. Agric. For. Meteorol. 247, 454–466. doi: 10.1016/j.agrformet.2017.08.026
Elliott, J., Deryng, D., Mueller, C., Frieler, K., Konzmann, M., Gerten, D., et al. (2014). Constraints and potentials of future irrigation water availability on agricultural production under climate change. Proc. Natl. Acad. Sci. U.S.A. 111, 3239–3244. doi: 10.1073/pnas.1222474110
Farquhar, G. D., and Sharkey, T. D. (1982). Stomatal conductance and photosynthesis. Annu. Rev. Plant Biol. 33, 317–345. doi: 10.1146/annurev.pp.33.060182.001533
Faralli, M., Grove, I. G., Hare, M. C., Kettlewell, P. S., and Fiorani, F. (2017). Rising CO2 from historical concentrations enhances the physiological performance of Brassica napus seedlings under optimal water supply but not under reduced water availability. Plant Cell Environ. 40, 317–325. doi: 10.1111/pce.12868
Fernando, N., Florentine, S. K., Naiker, M., Panozzo, J., and Chauhan, B. S. (2019). Annual ryegrass (Lolium rigidum Gaud) competition altered wheat grain quality: a study under elevated atmospheric CO2 levels and drought conditions. Food Chem. 276, 285–290. doi: 10.1016/j.foodchem.2018.09.145
Ferris, R., Long, L., Bunn, S. M., Robinson, K. M., Bradshaw, H. D., Rae, A. M., et al. (2002). Leaf stomatal and epidermal cell development: identification of putative quantitative trait loci in relation to elevated carbon dioxide concentration in poplar. Tree Physiol. 22, 633–640. doi: 10.1093/treephys/22.9.633
Ferris, R., and Taylor, G. (1994). Stomatal characteristics of four native herbs following exposure to elevated CO2. Ann. Bot. 73, 447–453. doi: 10.1006/anbo.1994.1055
Fitzgerald, G. J., Tausz, M., O’Leary, G., Mollah, M. R., Tausz-Posch, S., Seneweera, S., et al. (2016). Elevated atmospheric [CO2] can dramatically increase wheat yields in semi-arid environments and buffer against heat waves. Glob. Change Biol. 22, 2269–2284. doi: 10.1111/gcb.13263
Gorthi, A., Volenec, J. J., and Welp, L. R. (2019). Stomatal response in soybean during drought improves leaf-scale and field-scale water use efficiencies. Agric. For. Meteorol. 27:107629. doi: 10.1016/j.agrformet.2019.107629
Gray, S. B., Dermody, O., Klein, S. P., Locke, A. M., McGrath, J. M., Paul, R. E., et al. (2016). Intensifying drought eliminates the expected benefits of elevated carbon dioxide for soybean. Nat. Plants 2:16132. doi: 10.1038/nplants.2016.132
Haase, D. L., and Rose, R. (1995). Vector analysis and its use for interpreting plant nutrient shifts in response to silvicultural treatments. For. Sci. 41, 54–66. doi: 10.1093/forestscience/41.1.54
Haworth, M., Elliott-Kingston, C., and McElwain, J. C. (2013). Coordination of physiological and morphological responses of stomata to elevated CO2 in vascular plants. Oecologia 171, 71–82. doi: 10.1007/s00442-012-2406-9
Hessini, K., Pablo Martinez, J., Gandour, M., Albouchi, A., Soltani, A., and Abdelly, C. (2009). Effect of water stress on growth, osmotic adjustment, cell wall elasticity and water-use efficiency in Spartina alterniflora. Environ. Exp. Bot. 67, 312–319. doi: 10.1016/j.envexpbot.2009.06.010
Hyvönen, R., Agren, G. I., Linder, S., Persson, T., Cotrufo, M. F., Ekblad, A., et al. (2007). The likely impact of elevated CO2, nitrogen deposition, increased temperature and management on carbon sequestration in temperate and boreal forest ecosystems: a literature review. New Phytol. 173, 463–480. doi: 10.1111/j.1469-8137.2007.01967.x
IPCC (2019). “Summary for Policymakers,” in Climate Change and Land: An IPCC Special Report on Climate Change, Desertifcation, Land Degradation, Sustainable Land Management, Food Security, and Greenhouse Gas Fuxes in Terrestrial Ecosystems, eds P. R. Shukla, J. Skea, E. Calvo Buendia, V. Masson-Delmotte, H. O. Pörtner, D. C. Roberts, et al. (Geneva: IPCC).
Jiang, M., Caldararu, S., Zhang, H., Fleischer, K., Crous, K. Y., Yang, J., et al. (2020). Low phosphorus supply constrains plant responses to elevated CO2: a meta-analysis. Glob. Chang. Biol. 26, 5856–5873. doi: 10.1111/gcb.15277
Jiménez, S., Fattahi, M., Bedis, K., Nasrolahpour-moghadam, S., Irigoyen, J. J., and Gogorcena, Y. (2020). Interactional effects of climate change factors on the water status, photosynthetic rate, and metabolic regulation in peach. Front. Plant sci. 11:43. doi: 10.3389/fpls.2020.00043
Kizildeniz, T., Pascual, I., Irigoyen, J. J., and Morales, F. (2021). Future CO2, warming and water deficit impact white and red Tempranillo grapevine: photosynthetic acclimation to elevated CO2 and biomass allocation. Physiol. Plant 172, 1779–1794. doi: 10.1111/ppl.13388
Lajeunesse, M. J. (2011). On the meta-analysis of response ratios for studies with correlated and multi-group designs. Ecology 92, 2049–2055. doi: 10.1890/11-0423.1
Lawson, T., and Blatt, M. R. (2014). Stomatal size, speed, and responsiveness impact on photosynthesis and water use efficiency. Plant Physiol. 164, 1556–1570. doi: 10.1104/pp.114.237107
Leakey, A., Xu, F., Gillespie, K., Ainsworth, E., Long, S., and Ort, D. (2007). Physiological, biochemical and molecular analysis of the coordinated up-regulation of photosynthetic, respiratory and biosynthetic metabolism in soybean leaves under free-air CO2 enrichment. Photosynthesis Res. 91, 246–247.
Leakey, A. D. B., Uribelarrea, M., Ainsworth, E. A., Naidu, S. L., Rogers, A., Ort, D. R., et al. (2006). Photosynthesis, productivity, and yield of maize are not affected by open-air elevation of CO2 concentration in the absence of drought. Plant Physiol. 140, 779–790. doi: 10.1104/pp.105.073957
Li, S., Li, X., Wei, Z., and Liu, F. (2020). ABA-mediated modulation of elevated CO2 on stomatal response to drought. Curr. Opin. Plant Biol. 56, 174–180. doi: 10.1016/j.pbi.2019.12.002
Li, Y., Li, H., Li, Y., and Zhang, S. (2017). Improving water-use efficiency by decreasing stomatal conductance and transpiration rate to maintain higher ear photosynthetic rate in drought-resistant wheat. Crop J. 5, 231–239. doi: 10.1016/j.cj.2017.01.001
Li, Z., Yang, J., Shang, B., Xu, Y., Couture, J. J., Yuan, X., et al. (2020). Water stress rather than N addition mitigates impacts of elevated O3 on foliar chemical profiles in poplar saplings. Sci. Total Environ. 707:135935. doi: 10.1016/j.scitotenv.2019.135935
Lin, J. X., Jach, M. E., and Ceulemans, R. (2001). Stomatal density and needle anatomy of Scots pine (Pinus sylvestris) are affected by elevated CO2. New Phytol. 150, 665–674. doi: 10.1046/j.1469-8137.2001.00124.x
Long, S. P., Ainsworth, E. A., Leakey, A. D. B., Noesberger, J., and Ort, D. R. (2006). Food for thought: lower-than-expected crop yield stimulation with rising CO2 concentrations. Science 312, 1918–1921. doi: 10.1126/science.1114722
Luomala, E. M., Laitinen, K., Sutinen, S., Kellomaki, S., and Vapaavuori, E. (2005). Stomatal density, anatomy and nutrient concentrations of Scots pine needles are affected by elevated CO2 and temperature. Plant Cell Environ. 28, 733–749. doi: 10.1111/j.1365-3040.2005.01319.x
McLaughlin, S. B., Nosal, M., Wullschleger, S. D., and Sun, G. (2007). Interactive effects of ozone and climate on tree growth and water use in a southern Appalachian forest in the USA. New Phytol. 174, 109–124. doi: 10.1111/j.1469-8137.2007.02018.x
Morison, J. I. L. (1985). Sensitivity of stomata and water use efficiency to high CO2. Plant Cell Environ. 8, 467–474. doi: 10.1111/j.1365-3040.1985.tb01682.x
NASA (2020). Global Climate Change: Vital Signs of the Planet. Available online at: https://climate.nasa.gov/413ppmquotes (accessed May 4, 2020).
Paoletti, E., and Grulke, N. E. (2005). Does living in elevated CO2 ameliorate tree response to ozone? A review on stomatal responses. Environ. Pollut. 137, 483–493. doi: 10.1016/j.envpol.2005.01.035
Parry, M. L., Rosenzweig, C., Iglesias, A., Livermore, M., and Fischer, G. (2004). Effects of climate change on global food production under SRES emissions and socioeconomic scenarios. Glob. Environ. Chang. 14, 53–67. doi: 10.1016/j.gloenvcha.2003.10.008
Peaarcy, R. W., and Ehleringer, J. (1984). Comparative ecophysiology of C3 and C4 plants. Plant Cell Environ. 7, 1–13. doi: 10.1111/j.1365-3040.1984.tb01194.x
Polley, H. W., Tischler, C. R., Johnson, H. B., and Pennington, R. E. (1999). Growth, water relations, and survival of drought-exposed seedlings from six maternal families of honey mesquite (Prosopis glandulosa): responses to CO2 enrichment. Tree Physiol. 19, 359–366. doi: 10.1093/treephys/19.6.359
Raschke, K., Shabahang, M., and Wolf, R. (2003). The slow and the quick anion conductance in whole guard cells: their voltage-dependent alternation, and the modulation of their activities by abscisic acid and CO2. Planta 217, 639–650. doi: 10.1007/s00425-003-1033-4
Reddy, A. R., Rasineni, G. K., and Raghavendra, A. S. (2010). The impact of global elevated CO2 concentration on photosynthesis and plant productivity. Curr. Sci. 99, 46–57. doi: 10.1371/journal.pone.0011405
Robredo, A., Perez-Lopez, U., Lacuesta, M., Mena-Petite, A., and Munoz-Rueda, A. (2010). Influence of water stress on photosynthetic characteristics in barley plants under ambient and elevated CO2 concentrations. Biol. Plant. 54, 285–292. doi: 10.1007/s10535-010-0050-y
Taub, D. R., Miller, B., and Allen, H. (2008). Effects of elevated CO2 on the protein concentration of food crops: a meta-analysis. Glob. Chang. Biol. 14, 565–575. doi: 10.1111/j.1365-2486.2007.01511.x
Teramura, A. H., Sullivan, J. H., and Ziska, L. H. (1990). Interaction of elevated ultraviolet-B radiation and CO2 on productivity and photosynthetic characteristics in wheat, rice, and soybean. Plant Physiol. 94, 470–475. doi: 10.1104/pp.94.2.470
Torralbo, F., Gonzalez-Moro, M. B., Baroja-Fernandez, E., Aranjuelo, I., and Gonzalez-Murua, C. (2019). Differential regulation of stomatal conductance as a strategy to cope with ammonium fertilizer under ambient versus elevated CO2. Front. Plant Sci. 10:597. doi: 10.3389/fpls.2019.00597
van der Kooi, C. J., Reich, M., Loew, M., De Kok, L. J., and Tausz, M. (2016). Growth and yield stimulation under elevated CO2 and drought: a meta-analysis on crops. Environ. Exp. Bot. 122, 150–157. doi: 10.1016/j.envexpbot.2015.10.004
Wallace, B. C., Lajeunesse, M. J., Dietz, G., Dahabreh, I. J., Trikalinos, T. A., Schmid, C. H., et al. (2017). OpenMEE: intuitive, open-source software for meta-analysis in ecology and evolutionary biology. Methods Ecol. Evol. 8, 941–947. doi: 10.1111/2041-210X.12708
Wang, X., Taub, D. R., and Jablonski, L. M. (2015). Reproductive allocation in plants as affected by elevated carbon dioxide and other environmental changes: a synthesis using meta-analysis and graphical vector analysis. Oecologia 177, 1075–1087. doi: 10.1007/s00442-014-3191-4
Wu, D. X., and Wang, G. X. (2000). Interaction of CO2 enrichment and drought on growth, water use, and yield of broad bean (Vicia faba). Environ. Exp. Bot. 43, 131–139. doi: 10.1016/s0098-8472(99)00053-2
Xu, M. (2015). The optimal atmospheric CO2 concentration for the growth of winter wheat (Triticum aestivum). J. Plant Physiol. 184, 89–97. doi: 10.1016/j.jplph.2015.07.003
Xu, Z., Jiang, Y., Jia, B., and Zhou, G. (2016). Elevated CO2 response of stomata and its dependence on environmental factors. Front. Plant Sci. 7:657. doi: 10.3389/fpls.2016.00657
Yamaguchi, M., Kinose, Y., Matsumura, H., and Izuta, T. (2019). Evaluation of O3 effects on cumulative photosynthetic CO2 uptake in seedlings of four Japanese deciduous broad leaved forest tree species based on stomatal O3 uptake. Forests 10:556. doi: 10.3390/f10070556
Yan, W., Zhong, Y., and Shangguan, Z. (2016). A meta-analysis of leaf gas exchange and water status responses to drought. Sci. Rep. 6:20917. doi: 10.1038/srep20917
Yu, J., Chen, L., Xu, M., and Huang, B. (2012). Effects of elevated CO2 on physiological responses of tall fescue to elevated temperature, drought stress, and the combined stresses. Crop Sci. 52, 1848–1858. doi: 10.2135/cropsci2012.01.0030
Zhao, M. L., Wang, L. H., Sun, X. M., Li, Y., and Li, L. (2016). Accumulation and distribution dynamics of soluble carbohydrate in Helianthus tuberosus under drought stress. Plant Dis. Pests 7, 36–40.
Zhang, D. S., Li, A., Lam, S. K., Li, P., Zong, Y. Z., Gao, Z. Q., et al. (2021). Increased carbon uptake under elevated CO2 concentration enhances water-use efficiency of C4 broomcorn millet under drought. Agr. Water Manag. 245:106631. doi: 10.1016/j.agwat.2020.106631
Zhang, J., Jiang, H., Song, X., Jin, J., and Zhang, X. (2018). The responses of plant leaf CO2/H2O exchange and water use efficiency to drought: a meta-analysis. Sustainability 10:551. doi: 10.3390/su10020551
Zhang, H., Pan, C., Gu, S., Ma, Q., Zhang, Y., Li, X., et al. (2019). Stomatal movements are involved in elevated CO2-mitigated high temperature stress in tomato. Physiol. Plant 165, 569–583. doi: 10.1111/ppl.12752
Zheng, Y., He, C., Guo, L., Hao, L., Cheng, D., Li, F., et al. (2020). Soil water status triggers CO2 fertilization effect on the growth of winter wheat (Triticum aestivum). Agric. For. Meteorol. 291:108097. doi: 10.1016/j.agrformet.2020.108097
Zinta, G., AbdElgawad, H., Domagalska, M. A., Vergauwen, L., Knapen, D., Nijs, I., et al. (2014). Physiological, biochemical, and genome-wide transcriptional analysis reveals that elevated CO2 mitigates the impact of combined heat wave and drought stress in Arabidopsis Thaliana at multiple organizational levels. Glob. Chang. Biol. 20, 3670–3685. doi: 10.1111/gcb.12626
Keywords: CO2 fertilization effect, water deficit, leaf gas exchange, meta-analysis, graphical vector analysis
Citation: Li F, Guo D, Gao X and Zhao X (2021) Water Deficit Modulates the CO2 Fertilization Effect on Plant Gas Exchange and Leaf-Level Water Use Efficiency: A Meta-Analysis. Front. Plant Sci. 12:775477. doi: 10.3389/fpls.2021.775477
Received: 14 September 2021; Accepted: 01 November 2021;
Published: 29 November 2021.
Edited by:
Keshav Dahal, Fredericton Research and Development Centre, Agriculture and Agri-Food Canada, CanadaReviewed by:
Antonio Lucineudo Freire, Federal University of Campina Grande, BrazilLuca Vitale, Institute for Agricultural and Forest Systems in the Mediterranean, National Research Council of Italy (CNR), Italy
Copyright © 2021 Li, Guo, Gao and Zhao. This is an open-access article distributed under the terms of the Creative Commons Attribution License (CC BY). The use, distribution or reproduction in other forums is permitted, provided the original author(s) and the copyright owner(s) are credited and that the original publication in this journal is cited, in accordance with accepted academic practice. No use, distribution or reproduction is permitted which does not comply with these terms.
*Correspondence: Xiaodong Gao, Z2FvX3hpYW9kb25nQG53YWZ1LmVkdS5jbg==; Xining Zhao, enhuQG53YWZ1LmVkdS5jbg==