
94% of researchers rate our articles as excellent or good
Learn more about the work of our research integrity team to safeguard the quality of each article we publish.
Find out more
ORIGINAL RESEARCH article
Front. Plant Sci. , 11 November 2021
Sec. Plant Pathogen Interactions
Volume 12 - 2021 | https://doi.org/10.3389/fpls.2021.756330
 Xiaojie Wang1,2†
 Yawei Li1†Yuanyuan Liu1Dongle Zhang1Min Ni1Bing Jia1Wei Heng1
 Zemin Fang2Li-wu Zhu1
 Pu Liu1*
Kiwifruit bacterial canker caused by Pseudomonas syringae pv. actinidiae (Psa), is an important disease of kiwifruit (Actinidia Lind.). Plant hormones may induce various secondary metabolites to resist pathogens via modulation of hormone-responsive transcription factors (TFs), as reported in past studies. In this study, we showed that JA accumulated in the susceptible cultivar Actinidia chinensis ‘Hongyang’ but decreased in the resistant cultivar of A. chinensis var. deliciosa ‘Jinkui’ in response to Psa. Integrated transcriptomic and proteomic analyses were carried out using the resistant cultivar ‘Jinkui’. A total of 5,045 differentially expressed genes (DEGs) and 1,681 differentially expressed proteins (DEPs) were identified after Psa infection. Two pathways, ‘plant hormone signal transduction’ and ‘phenylpropanoid biosynthesis,’ were activated at the protein and transcript levels. In addition, a total of 27 R2R3-MYB transcription factors (TFs) were involved in the response to Psa of ‘Jinkui,’ including the R2R3-MYB TF subgroup 4 gene AcMYB16, which was downregulated in ‘Jinkui’ but upregulated in ‘Hongyang.’ The promoter region of AcMYB16 has a MeJA responsiveness cis-acting regulatory element (CRE). Transient expression of the AcMYB16 gene in the leaves of ‘Jinkui’ induced Psa infection. Together, these data suggest that AcMYB16 acts as a repressor to regulate the response of kiwifruit to Psa infection. Our work will help to unravel the processes of kiwifruit resistance to pathogens and will facilitate the development of varieties with resistance against bacterial pathogens.
Kiwifruit of the genus Actinidia Lind. is an economically important fresh fruit worldwide because of its rich nutritional value. Kiwifruit is a recently domesticated fruit crop with a short history of breeding, and its production is threatened by several emerging plant pathogens. Kiwifruit bacterial canker (KBC), caused by Pseudomonas syringae pv. actinidiae (Psa), has already become an economic threat to the kiwifruit industry worldwide (Tahir et al., 2019; Li et al., 2021). Many efforts have been made to uncover the population structure of Psa, and at least five types of populations, including biovars 1, 2, 3, 5, and 6, have been defined based on their virulence, toxin production, and host range, of which biovar 3 is responsible for the global pandemic (He et al., 2019). Most of the globally cultivated cultivars of kiwifruit, including Actinidia chinensis var. chinensis, Actinidia chinensis var. deliciosa, as well as accessions from Actinidia arguta and Actinidia kolomikta, are natural hosts of Psa (Tahir et al., 2019). Many cultivars of A. chinensis var. chinensis, including ‘Hongyang,’ ‘Hort16A,’ and ‘Jintao’, are considered more susceptible to biovar 3 than A. chinensis var. deliciosa, including ‘Jinkui’ and ‘Xuxiang’ (Li et al., 2020; Wang et al., 2020).
It has been reported that methyl jasmonate (MeJA), salicylic acid (SA), and abscisic acid (ABA) induce distinct biochemical and genetic responses during Psa colonization (Silva et al., 2021). These important plant hormones induce various secondary metabolites via modulation of hormone-responsive transcription factors (TFs) (Zhang et al., 2018). Transcriptional regulation of defense-related genes in plants is a crucial step in activating defense responses (Buscaill and Rivas, 2014). Among them, transcription factors play central roles in the regulation of transcription by forming a regulatory network in plants (Buscaill and Rivas, 2014). As a large TF gene family, MYB TFs are the most abundant and functional in plants and have attracted increasing attention due to their roles in plant development, metabolism and stress responses (Li et al., 2019). MYB proteins contain a highly conserved MYB DNA-binding domain (DBD) that comprises 1–4 imperfect MYB repeats. Each repeat covers 50–55 that fold into three α-helices, the second and third of which form a helix-turn-helix structure (Li et al., 2019; Jiang and Rao, 2020). Depending on the number of MYB domain repeats, this TF family can be divided into four categories, including 1R-, R2R3-, 3R-, and 4R-MYB proteins (Dubos et al., 2010). R2R3-MYBs are the most common type of MYB factor in land plants and have been classified into 23–90 subgroups in different studies (Li et al., 2019). Most MYB genes are positive regulators of transcription. For example, several MYB TFs act as positive regulators of pathogen defense. In Arabidopsis thaliana, AtMYB30 is a positive regulator of the pathogen-induced hypersensitive response (Vailleau et al., 2002; Dubos et al., 2010); AtMYB44 positively modulates resistance to the bacterial pathogen P. syringae. pv. tomato DC3000 (Zou et al., 2013). In apple, MdMYB73 confers increased resistance to the fungal pathogen Botryosphaeria dothidea (Gu et al., 2021). In sweet cherry, overexpression of PacMYBA enhances resistance to DC3000 (Cui et al., 2018). Arabidopsis MYB96-mediated ABA signals enhance plant disease resistance by inducing SA biosynthesis (Seo and Park, 2010). In addition to positive regulation of plant disease resistance, negative regulation of R2R3-MYB has also been reported. For example, 22 MYBs to date have been reported as repressors to inhibit lignin and general phenylpropanoid synthesis in herbaceous and woody plants (Ma and Constabel, 2019). In A. thaliana, three MYB repressors regulating lignin or sinapate ester biosynthesis have been characterized, including AtMYB3, AtMYB4, and AtMYB32 (Ma and Constabel, 2019). Within the MYB phylogeny, most MYB repressors belong to subgroup 4 of the R2R3-MYBs, which can be further separated into a general phenylpropanoid and lignin group and a flavonoid group (Yoshida et al., 2015). The subgroup 4 MYB TFs FtMYB12, FtMYB14, FtMYB15 and FtMYB16 in R2R3-MYB directly repress rutin biosynthesis in Fagopyrum tataricum (Ma and Constabel, 2019). Lignin is a major end product of the phenylpropanoid pathway and a key component of secondary cell walls and wood and plays important roles in mechanical strength and resistance to pathogens (Yoon et al., 2015). The phenylpropanoid pathway also produces resistance-related secondary metabolites, such as polyphenols and flavonoids (Yoon et al., 2015).
There are abundant MYB TF genes in the kiwifruit genome, and a total of 155 putative R2R3-type MYB TFs were identified from the kiwifruit genome sequence (Yu et al., 2019). Some of them, including MYB7, MYB10, MYB110 and AcMYB123, have been reported for their role in the regulation of anthocyanin and proanthocyanin biosynthesis (Ampomah-Dwamena et al., 2019; Wang et al., 2019; Peng et al., 2020). Recently, it has also been reported that several MYB genes in kiwifruit are related to abiotic stress in plants (Wei et al., 2020). However, the response of the MYB genes in kiwifruit to Psa is not clear. Our study preliminarily elucidates the response of R2R3-MYB TF subgroup 4 gene AcMYB16 in kiwifruit to Psa infection.
One-year-old potted seedings A. chinensis var. deliciosa cultivar ‘Jinkui’ and the pandemic Psa strain JF8 (CCTCC AB2018305) were used to study the responses of kiwifruit to Psa. Strain JF8 was originally isolated from A. chinensis var. chinensis cultivar ‘Jinfeng’ and has been characterized as belonging to biovar 3 (He et al., 2019). Plants were maintained in an aseptic room with 95% relative humidity, natural light and no further fertilization after being received from the nursery. For inoculation, the Psa strain was streaked on nutrient-sucrose agar (NSA) and incubated at 25°C for 48 h. Ten microliters of a bacterial suspension (1–2 × 10⁷ cfu/mL) prepared in sterile 0.85% w/v NaCl was inoculated in the plants chosen for investigation. The bacterial suspension was sprayed onto trees in their entirety. In parallel, control plants were treated in the same way with sterile 0.85% w/v NaCl solution. The inoculated and control plants were randomly distributed in the room at 15 ± 3°C. Leaves were sampled from the infected and control plants for further analyses after inoculation for 1 and 10 days. Each sample consisted of the leaves of one tree. Each group used three biological copies of trees.
One-gram leaf samples of A. chinensis var. deliciosa ‘Jinkui’ and A. chinensis var. chinensis ‘Hongyang’ at 1 day postinoculation (dpi) and 10 dpi of Psa were individually frozen and thoroughly ground into powder and extracted using isopropanol/hydrochloric acid buffer. After the addition of 20 mL of dichloromethane, vortexing and sonication for 10 min, the sample was centrifuged at 13,000 × g for 5 min. The substratum organic phase was dried with nitrogen and dissolved in 400 μl of methanol (with 0.1% formic acid) for LC-MS analysis. A poroshell 120 SB-C18 (2.1 × 150, 2.7 μm) was used with the following gradient elution program (solution A, methanol with 0.1% formic acid, and solution B, 0.1% formic acid): 0–2 min, 20% A; 4 min, 50% A; 10 min, 80% A; and 15 min, 20% A. Identification was carried out by comparing the references ABA, SA, and JA. The results are presented as mg/g FW. Three biological replicates were performed for each group.
One gram of A. chinensis var. deliciosa leaves at 1 dpi of Psa were thoroughly ground into powder in liquid nitrogen and extracted using ice-cold lysis buffer (7 M urea, 2 M thiourea, 4% CHAPS, 40 mM Tris-HCl, pH 8.5) containing 1 mM PMSF and 2 mM EDTA (final concentration). After 5 min, 10 mM DTT (final concentration) was added to the samples. The suspension was sonicated at 200 W for 15 min and then centrifuged at 4°C and 30,000 × g for 15 min. The supernatant was mixed well with a 5× volume of chilled acetone containing 10% (v/v) TCA and incubated at −20°C overnight. After centrifugation at 4°C and 30,000 × g, the supernatant was discarded. The precipitate was washed with chilled acetone three times. The pellet was air-dried and dissolved in lysis buffer (7 M urea, 2 M thiourea, 4% NP40, 20 mM Tris-HCl, pH 8.0–8.5). The suspension was sonicated at 200 W for 15 min and centrifuged at 4°C and 30,000 × g for 15 min. The supernatant was transferred to another tube. To reduce disulfide bonds in proteins of the supernatant, 10 mM DTT (final concentration) was added and incubated at 56°C for 1 h. Subsequently, 55 mM IAM (final concentration) was added to block the cysteines and incubated for 1 h in the darkroom. The supernatant was mixed well with a 5× volume of chilled acetone for 2 h at −20°C to precipitate proteins. After centrifugation at 4°C and 30,000 × g, the supernatant was discarded. The pellet was air-dried for 5 min and dissolved in 500 μL of 0.5 M Tetraethylammonium bromide (Applied Biosystems, Milan, Italy) and sonicated at 200 W for 15 min. Finally, samples were centrifuged at 4°C and 30,000 × g for 15 min. The supernatant was transferred to a new tube and quantified. The proteins in the supernatant were stored at −80°C until further analysis.
Protein solutions (100 μg) were diluted 4-times with 100 mM tetraethylammonium bromide, after which proteins were digested with Trypsin Gold (Promega, Madison, WI, United States) at 37°C (30:1, protein: trypsin) for 16-h. After trypsin digestion, peptides were dried by vacuum centrifugation. Peptides were reconstituted in 0.5 M TEAB and processed according to the manufacture’s protocol for 8-plex iTRAQ reagent (Applied Biosystems). Briefly, one unit of iTRAQ reagent was thawed and reconstituted in 24 μL isopropanol. Two leaves samples were labeled with iTRAQ tags 119 and 121, respectively. The peptides were labeled with the isobaric tags, incubated at room temperature for 2-h. The labeled peptide mixtures were then pooled and dried by vacuum centrifugation.
Peptides were separated using a Shimadzu LC-20AB HPLC Pump system coupled with a high-pH RP column. The iTRAQ-labeled peptide mixtures were reconstituted with 4 mL Buffer A (25 mM NaH2PO4 in 25% ACN, pH 2.7) and loaded onto a 4.6 × 250 mm Ultremex SCX column containing 5-μm particles (Phenomenex). The peptides were eluted at a flow rate of 1 mL/min with a gradient of buffer A for 10 min, 5-60% buffer B (25 mM NaH2PO4, 1 M KCl in 25% ACN, pH 2.7) for 27 min, 60–100% buffer B for 1 min. The system was then maintained at 100% buffer B for 1 min before equilibrating with buffer A for 10 min prior to the next injection. Elution was monitored by measuring the absorbance at 214 nm, and fractions were collected every 1 min. The eluted peptides were pooled into 20 fractions, desalted with a Strata X C18 column (Phenomenex) and vacuum-dried. IQuant software was used to quantify ITRAQ data (Wen et al., 2014).
Each fraction was re-suspended in buffer A (5% ACN, 0.1% FA) and centrifuged at 20,000 g for 10 min, the final concentration of peptide was about 0.5 μg/μL on average. 10 μL supernatant was loaded on a LC-20AD nanoHPLC (Shimadzu, Kyoto, Japan) by the autosampler onto a 2 cm C18 trap column. Then, the peptides were eluted onto a 10 cm analytical C18 column (inner diameter 75 μm) packed in-house. The samples were loaded at 8 μL/min for 4 min, then the 35 min gradient was run at 300 nL/min starting from 2 to 35% B (95% ACN, 0.1% FA), followed by 5 min linear gradient to 60%, then, followed by 2 min linear gradient to 80%, and maintenance at 80% B for 4 min, and finally return to 5% in 1 min.
Data acquisition was performed with a Triple TOF 5600 System (AB SCIEX, Concord, ON, Canada) fitted with a Nanospray III source (AB SCIEX, Concord, ON, Canada) and a pulled quartz tip as the emitter (New Objectives, Woburn, MA, United States). Data was acquired using an ion spray voltage of 2.5 kV, curtain gas of 30 psi, nebulizer gas of 15 psi, and an interface heater temperature of 150°C. The MS was operated with a RP of greater than or equal to 30,000 FWHM for TOF MS scans. For IDA, survey scans were acquired in 250 ms and as many as 30 product ion scans were collected if exceeding a threshold of 120 counts per second (counts/s) and with a 2+ to 5+ charge-state. Total cycle time was fixed to 3.3 s. Q2 transmission window was 100 Da for 100%. Four time bins were summed for each scan at a pulser frequency value of 11 kHz through monitoring of the 40 GHz multichannel TDC detector with four-anode channel detect ion. A sweeping collision energy setting of 35 ± 5 eV coupled with iTRAQ adjust rolling collision energy was applied to all precursor ions for collision-induced dissociation. Dynamic exclusion was set for 1/2 of peak width (15 s), and then the precursor was refreshed off the exclusion list.
Raw data files acquired from the Orbitrap were converted into MGF files using Proteome. Discoverer 1.2 (PD 1.2, Thermo) and the MGF file were searched. Proteins were identified and quantified using the Mascot 2.3.02 search engine (Matrix Science, London, United Kingdom) against Kiwifruit Genome Database (KGD) (Yue et al., 2020). The identified peptide sequences were then assembled into a set of accurately identified proteins based on the “simple principle”. To quantify proteins, peptides were automatically selected by calculating the reporter peak area using the default parameters of the Mascot software package. The resulting data set was auto-bias corrected, and the variations resulting from the unequal mixing of samples with different labels were eliminated. The Differentially abundant proteins (DAPs) between the P. syringae. pv. actinidiae-infected and CK samples were defined. To minimize the protein-level false-positive rates, a protein FDR of 1%, which was based on an established “picked” protein FDR strategy (Liu et al., 2018), was estimated after proteins were tentatively identified (protein-level FDR ≤ 0.01). All proteome data were deposited in the ProteomeXchange database under the accession PXD014787.
Total RNA was extracted from the leaves of A. chinensis var. deliciosa cultivar ‘Jinkui’ for subsequent RNA-Seq analysis. RNA was extracted from three biological replicates of frozen samples (100 mg) using the RNAprep Pure Plant Kit (Tiangen Biotech, Beijing, China). RNA quality was evaluated by a NanoPhotometer® spectrophotometer (NanoDrop Technologies, Wilmington, DE, United States). RNA with an RNA integrity number > 8 according to the 2100 Bioanalyzer (Agilent, United States) was used to prepare cDNA libraries with the RNA Library Prep Kit (Illumina, San Diego, CA, United States). The resulting libraries were sequenced on a HiSeq 2000 platform (Illumina) to generate 100-bp paired-end reads. All RNA-Seq data were deposited in the National Center for Biotechnology Information (NCBI) database under the accession SRR16071936, SRR16071935, SRR16071934, SRR16071933, SRR16071932, and SRR16071931.
The sequenced data were filtered by removing adaptor sequences, empty reads, reads with more than 5% unknown nucleotides, low-quality sequences (base quality ≤ 20), or sequences with >10% Ns using SOAPnuke (version 1.5.2). Clean reads were mapped to the reference genome sequence using HISAT (version 0.1.6-beta). The reads were assembled into transcripts and compared with the reference gene of kiwifruit ‘Red 5’ (Liu et al., 2018) using Cufflinks. Gene expression was quantified using RSEM (RNA-Seq by Expectation Maximization, version 1.2.12). The data were normalized as fragments per kilobase of transcript per million fragments mapped (FPKM). The differences in transcript abundance between two genotypes were calculated based on the ratio of FPKM values. The FDR control method was used to identify the threshold of the P-value using Cuffdiff (included in the cufflinks package). Only transcripts with P ≤ 0.001 and |log2 (PT/CK)| > 1 were further analyzed. Cluster analysis of gene expression patterns was performed by Genesis based on the K-means method1. Gene ontology (GO) analysis was applied to predict gene function and to calculate the functional category distribution frequency. Principal component analysis (PCA) was performed using R tools 2.12.0 (Stacklies et al., 2007).
Functional annotations of the DAPs or DEGs were conducted using the Blast2GO program and the non-redundant protein database (NR; NCBI). Functional classification was performed based on the KEGG2 and COG databases3. P ≤ 0.05 was used to confirm the significance of the GO, KEGG pathway and MapMan analysis results.
Total RNA was reverse transcribed into first-strand cDNA using the M-MLV first strand kit (Invitrogen, United States) according to the manufacturer’s instructions. Twelve genes were chosen for confirmation by qRT-PCR with SYBR®GREEN Master Mix (Toyobo, Osaka, Japan). Primers for the chosen genes were designed with Primer Express software (Applied Biosystems, United States) and are presented in Supplementary Table 1. A qRT-PCR assay for gene expression analysis was performed on a Roche 480 Real-time PCR System (Roche Molecular Systems, Belleville, United States) using the ACTB gene as an endogenous control. Briefly, the primers for the target gene and ACTB were diluted in SYBR Mix, and 10 μL of the reaction mix was added to each well. The reactions were performed with an initial incubation at 50°C for 2 min and at 95°C for 1 min followed by 40 cycles of 95°C for 15 s, 60°C for 20 s and 72°C for 10 s. The levels of gene expression were analyzed with a LightCycler® 480. Zero-template controls were included for each primer pair. Each PCR was carried out in triplicate, and the data are presented as the means ± SD. To assess the correlation between different platforms, Pearson correlations were calculated in SPSS 16.0 to compare the mRNA expression levels measured by RNA-Seq and qPCR.
The upstream 2-kb genomic DNA sequences of Psa-responsive AccR2R3-MYBs were submitted to the Plant CARE database4 to identify the cis-elements. A protein sequence similarity search was performed using BlastP. Multiple sequence alignment of MYB sequences was performed using Clustal Omega 8 (Sievers et al., 2011) and GeneDoc (Version 2.6.0.2) (Nicholas and Nicholas, 1997; Kumar et al., 2016). The phylogenetic trees were constructed using the MEGA 7 program (Sievers et al., 2011) based on the neighbor-joining method with 1000 bootstrap replicates.
Sequences of AcMYB16 were PCR amplified from cDNA of the A. chinensis var. deliciosa cultivar ‘Jinkui’ and cloned into vector pCAMBIA1300. Gene-specific primers (AcMYB16-F, 5′-GAGAACACGGGGGACTCTAGAATGGGGAGATCACCGAG-3′; AcMYB16-R, 5′-GCCCTTGCTCACCATGGATCCCATTTC TGGAAAATCTTTCAG-3′) were used for AcMYB3R amplification, with underlined nucleotides as restriction enzyme cutting sites. The overexpression vector pCAMBIA1300 driving the expression of the candidate gene was transformed into Agrobacterium tumefaciens strain GV3101 by electroporation (Peng et al., 2019). Leaves of ‘Hongyang’ were infiltrated with a mixture of Psa and empty vector and or a mixture of Psa and Agrobacterium (1:1) and kept under the same growth conditions. Leaves were photographed and harvested at 14 days after infiltration. Leaves at the junction of disinfected spots (100 mg) were surface-disinfected via immersion in 75% alcohol for 1 min and 15% sodium hypochlorite solution for 1 min and rinsed five times with sterile water. The samples were ground by adding 300 μL of sterile water and diluted to 10–3. Each sample was repeated three times in KB medium and cultured at 20°C for 2 days. The number of Psa was observed and recorded by electron microscopy.
All statistical analyses in this study were conducted using the Statistical Program SPSS 13.0 for Windows (SPSS Inc., Chicago, IL, United States). Analysis of variance (ANOVA) was performed, and Duncan’s multiple range test was used for mean separation. The statistical significance in this experiment was all applied at the level P < 0.05.
Abscisic acid, SA, and JA hormones were determined at different time points (0, 1, and 10 days) after Psa inoculation in two kiwifruit cultivars. The results showed that ABA and SA were increased in both cultivars after Psa inoculation at different times, but JA accumulated in ‘Hongyang’ and decreased in ‘Jingkui’ (Figure 1) at 1 dpi. The JA content of Jingkui recovered to the level before Psa inoculation at 10 dpi. This result suggests that the two varieties may have different response pathways to Psa.
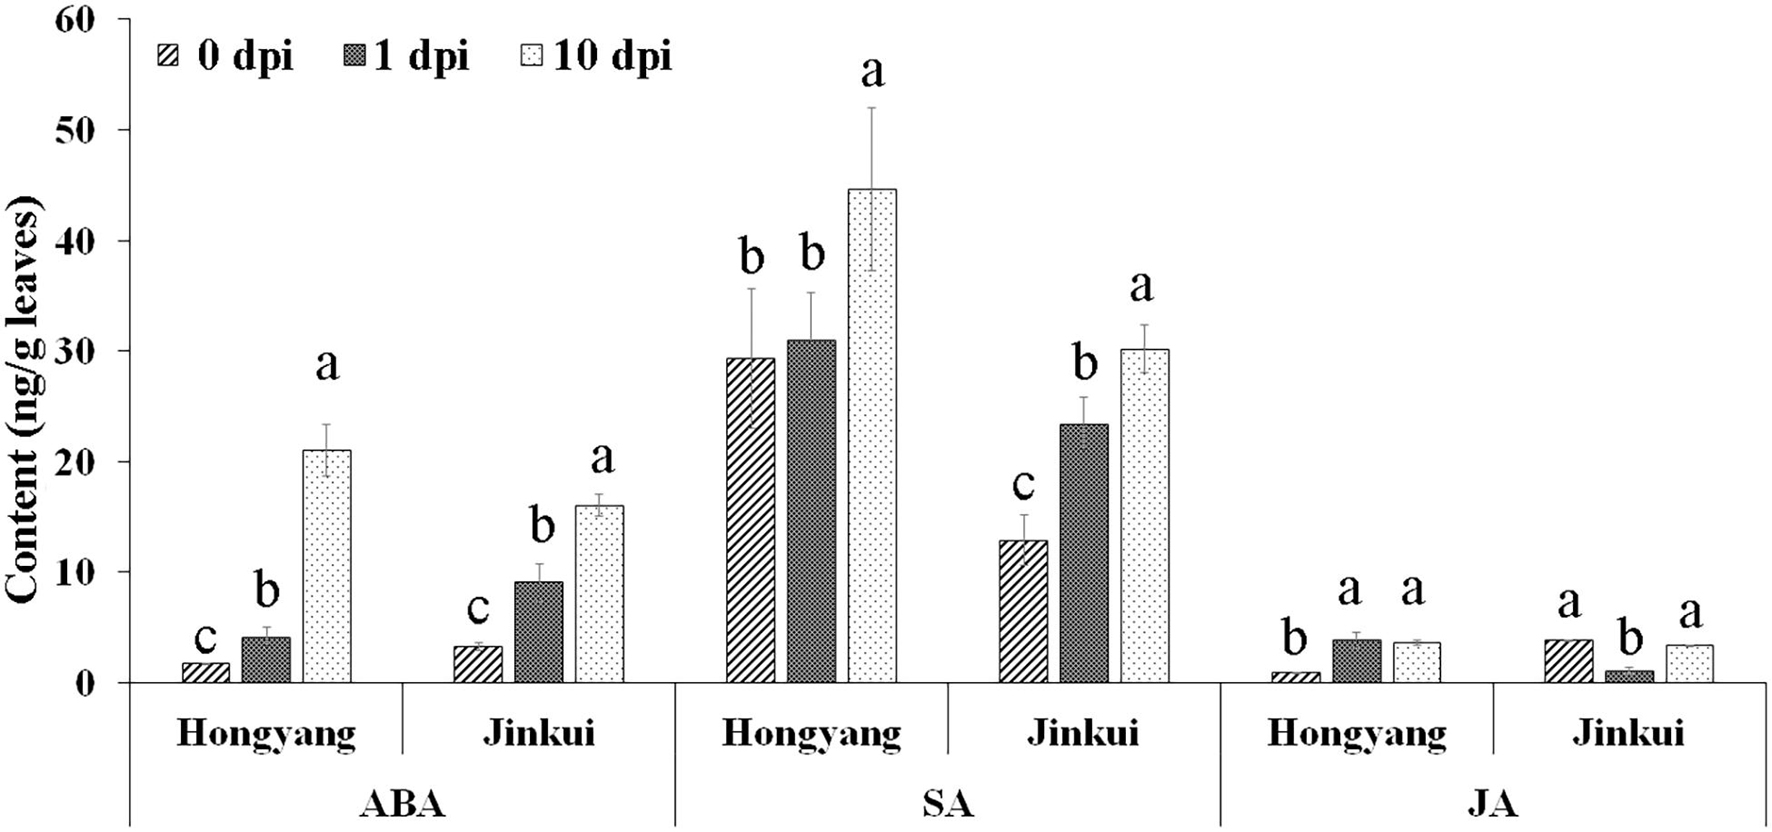
Figure 1. Hormone concentration analysis of abscisic acid (ABA), salicylic acid (SA), and jasmonic acid (JA) at 0, 1, and 10 dpi of Psa in ‘Jinkui’ and ‘Hongyang’ leaves. Values are the means ± SE (n = 3). Different letters indicate significant differences at a p-value < 0.05.
To reveal the global picture of gene responses to KBC, P. syringae. pv. actinidiae strain JF8 was used to treat the resistant A. chinensis var. deliciosa cultivar ‘Jinkui,’ and a transcriptomic analysis was performed. The RNA-Seq generated an average of 11.47 Gigabytes (GB) of clean data (Q30 > 95.96%). A total of 91,120,152–126,564,610 clean reads were obtained. Approximately 62.54% of reads mapped to the kiwifruit reference genome A. chinensis var. chinensis ‘Red 5’ (Wei et al., 2020). In total, 5045 differentially expressed genes (DEGs, |log2 fold change| > 1, P < 0.05) were identified, including 1,538 upregulated and 3,507 downregulated genes (Supplementary Table 2). Among them, twelve random DEGs were chosen for qRT-PCR (quantitative real-time PCR) verification. Correlations between the expression patterns of these genes in RNA-Seq and qRT-PCR were evaluated using SPSS 16.0. As shown in Supplementary Figure 1, a high correlation was obtained between the two methods, with a correlation coefficient of R2 = 0.9353.
Protein profile analysis produced 33,995 peptide spectra from the kiwifruit leaf libraries, resulting in 8,067 proteins (Supplementary Table 3). PCA revealed observed variability differences between the treatment and control groups (Supplementary Figure 2). By comparing the multiple changes in expression between the treatment and control groups, correlation analysis was performed at the transcriptome and proteome levels. Correlations were revealed between mRNAs and their coding proteins (R = 0.687, Supplementary Figure 3).
Gene ontology functional classification and KEGG pathway enrichment analysis were performed on those DEGs. According to the GO functional analysis, 49 GO terms were significantly enriched, especially “cellular process,” “metabolic process,” “membrane,” “cell,” “binding,” and “catalytic activity” (Supplementary Figure 4A). These enriched functional processes were correlated with the symptoms of BCK, including dark brown spots surrounded by yellowish halos on leaves as well as the presence of dark red exudates on canes and trunks. Following KEGG enrichment analysis, “plant–pathogen interaction,” “ABC transporters,” “phenylpropanoid biosynthesis,” “plant hormone signal transduction,” “glycosphingolipid biosynthesis – lacto and neolacto series,” “alpha-linolenic acid metabolism,” “starch and sucrose metabolism,” and “biosynthesis of secondary metabolites” were enriched for the most significant pathways (Supplementary Figure 4B).
In these interesting pathways, the number of DEPs was significantly smaller than that of DEGs. According to the GO functional analysis, 51 GO terms were significantly enriched, including “catalytic activity,” “binding,” “cell,” “cellular process,” and “metabolic process” (Supplementary Figure 5A). Most genes were differentially expressed in the transcriptome analysis, but there was no significant difference in protein level. Only two DEP pathways, “plant hormone signal transduction” and, “phenylpropanoid biosynthesis,” had statistical significance consistent with the DEGs (Figure 2, Supplementary Table 4, and Supplementary Figure 5B).
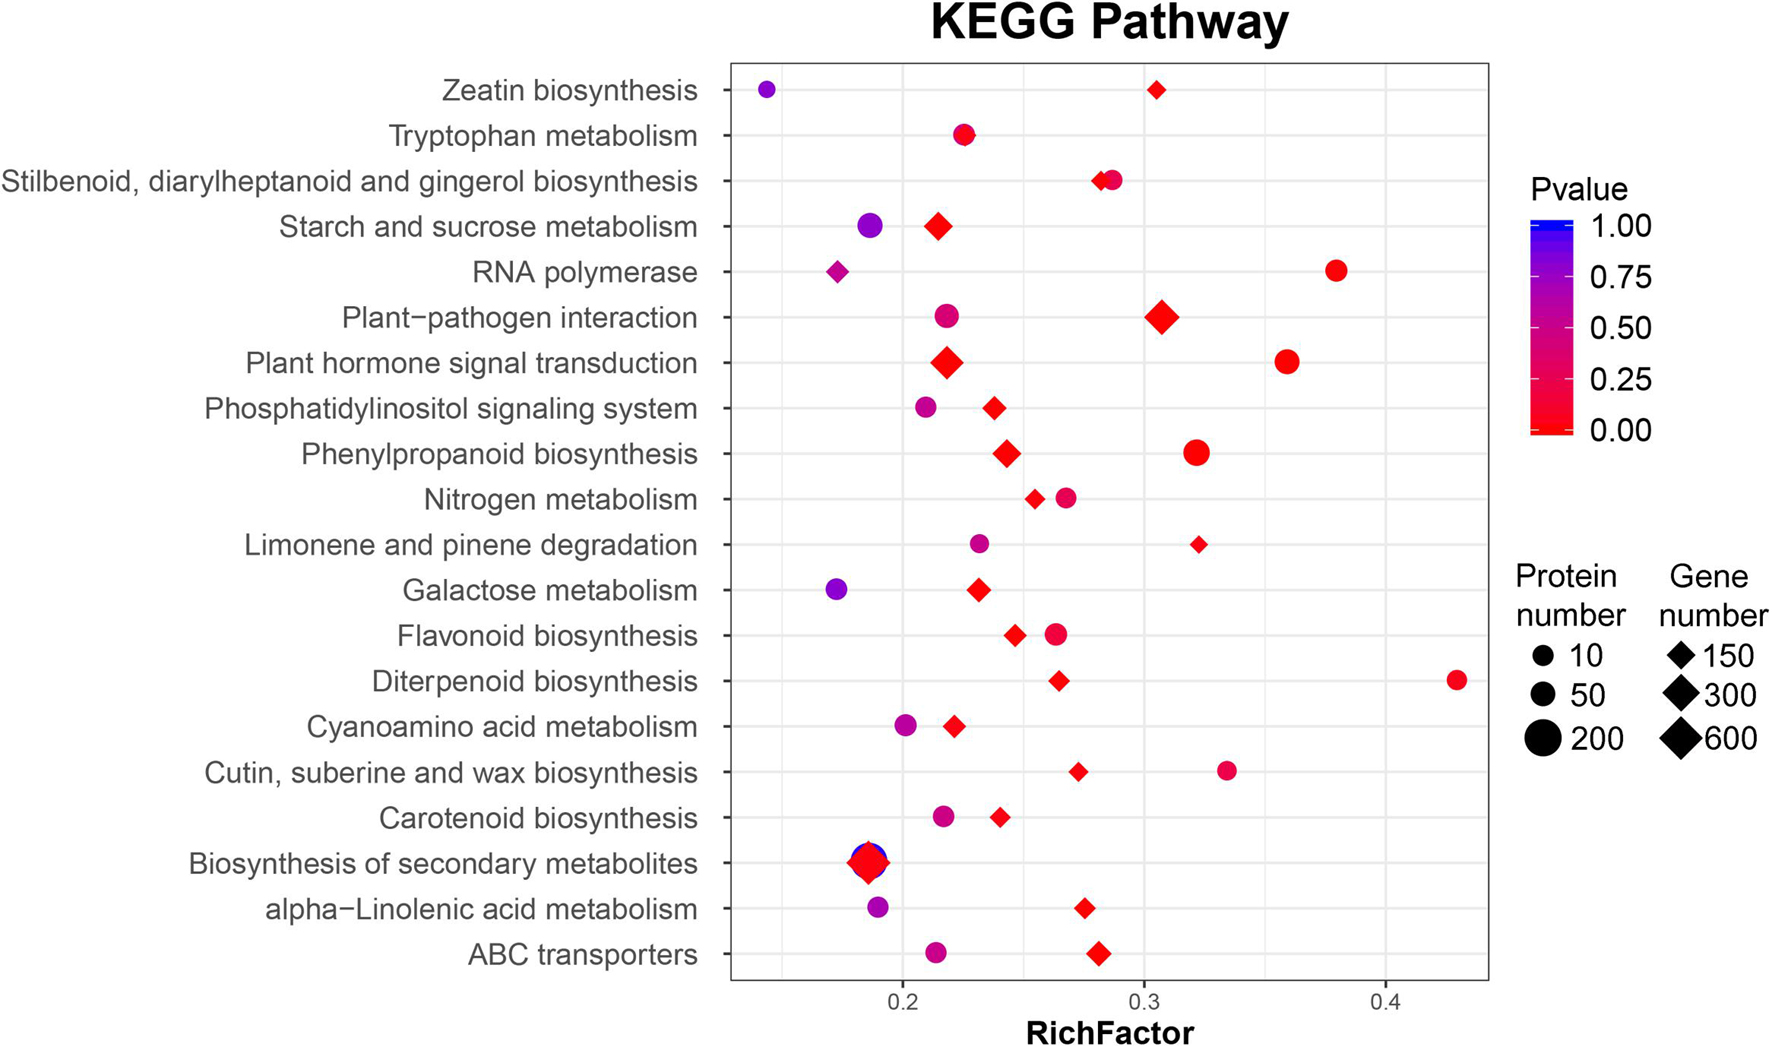
Figure 2. Bubble diagrams of the KEGG enrichment of differentially expressed genes (DEGs) and proteins (DAPs) of ‘Jinkui’ leaves at 1 dpi of Psa.
Phytohormone networks consisting of SA, JA, and ethylene signaling are required for plant pathogen-associated molecular pattern (PAMP)-triggered immunity (PTI) and effector-triggered immunity (ETI). After Psa inoculation, 34 proteins and 263 genes were enriched with the pathway “plant hormone signal transduction” by KEGG analysis (Supplementary Table 4). These included numerous proteins/transcripts involved in ABA, SA, and JA (Figure 3).
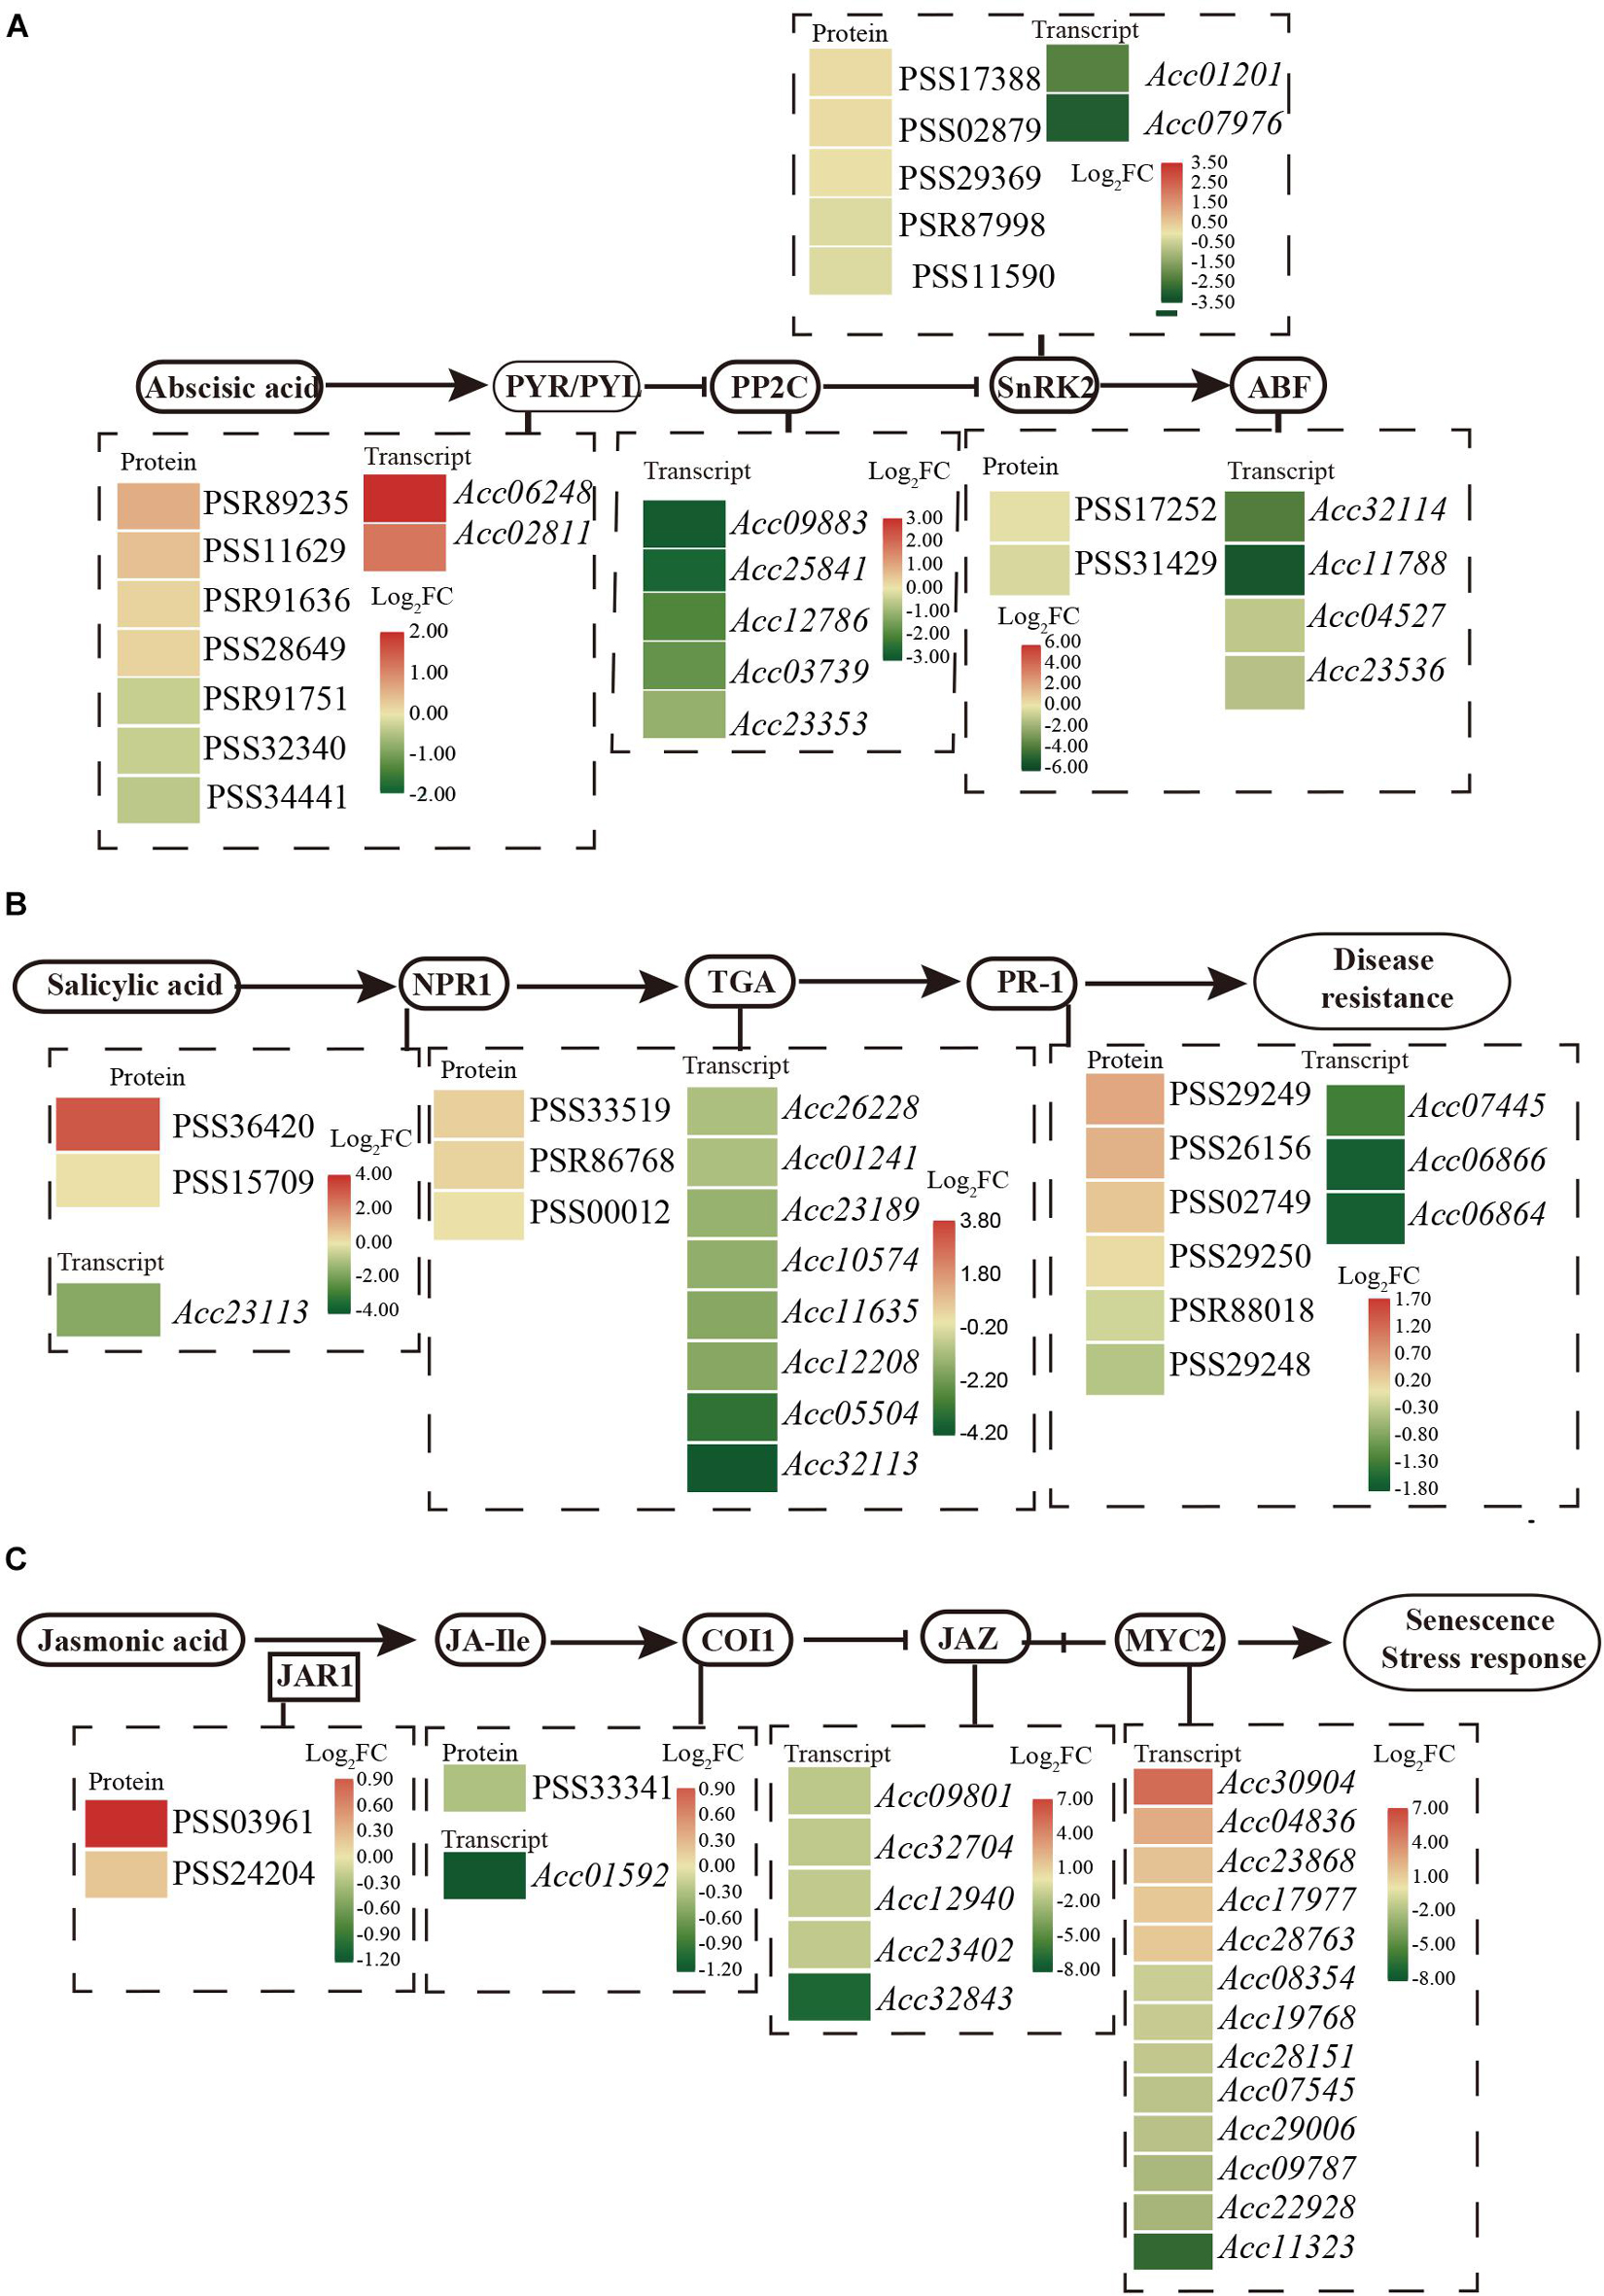
Figure 3. Schematic of the transcriptome and proteome revealed the regulation of ABA (A), SA (B), and JA (C) in the plant hormone signal transduction pathway at 1 dpi of Psa in ‘Jinkui’ leaves.
Abscisic acid perception and signal transduction depend on its binding to receptors of the pyrabactin resistance1/PYR1-like/regulatory components, the subsequent inhibition of clade A type 2C protein phosphatases (PP2Cs), and the phosphorylation of ion channels and transcription factors by protein kinases of the SnRK2 family. A total of 13 genes and 14 proteins were detected for the ABA signaling response to Psa infection. Two PYR/PYL (Pyrabactin Resistance1/PYR-Like) genes (Acc06248 and Acc02811) were found to be significantly upregulated, and four proteins had also accumulated. Correspondingly, five genes encoding PP2C (protein phosphatase 2C, Acc09883, Acc25841, Acc12786, Acc03739, and Acc23353), a negative regulator of ABA signal transduction, were downregulated at the transcript level. Moreover, the expression levels of two genes that encoded SnRK2 (serine/threonine-protein kinase SRK2, Acc01201 and Acc07976) were downregulated, and four genes that encoded ABF (ABA responsive element binding factor, Acc32114, Acc11788, Acc04527, and Acc23536) were also downregulated by Psa infection (Figure 3A). These results are consistent with ABA accumulation in ‘Jinkui’ leaves after Psa inoculation.
The NPR-1 (non-expressor of PR gene) and PR1 (pathogenesis-related protein-1) genes, which are used as markers for SA-mediated disease resistance, accumulated at the protein level but were downregulated at the transcript level. Eight annotated genes encoding the TGA transcription factor were all downregulated, but three proteins accumulated, which exerted their activity by binding to the core cis-elements (TGACGs) of target genes, including PR-1 and NPR1 (Figure 3B). Our results showed that proteins in the SA-related pathways of ‘Jinkui’ accumulated after Psa inoculation. This is consistent with the accumulation of SA in ‘Jinkui’ leaves, indicating that SA has a positive response to Psa.
For JA, two proteins of jasmonic acid-amino synthetase (JAR1, EC: 6.3.2.52) were upregulated, but coronatine-insensitive protein 1 (COI1) was downregulated at the transcript and protein levels, indicating that JA-isoleucine (JA-Ile) may be cumulative. Five jasmonate ZIM domain-containing protein (JAZ) genes and eight transcription factor MYC2 genes were downregulated, and five transcription factor MYC2 genes were upregulated at the transcript level. Among them, the genes Acc30904 (log2FC = 5.30) and Acc04836 (log2FC = 2.5) may be important positive regulation genes in the ‘Jinkui’ response to Psa infection (Figure 3C).
Phenylpropanoids usually perform their function by inducible antimicrobial compounds, as well as signal molecules such as SA, in plant-microbe interactions. In total, 149 genes and 49 proteins were enriched that participate in multiple branches of the phenylpropanoid pathway (Supplementary Table 4). Six major enzymes related to the phenylpropanoid biosynthesis pathway were mainly promoted at the protein level (Figure 4). The first common step of phenylpropanoid biosynthesis is catalyzed by the enzyme EC: 4.3.1.24 (phenylalanine ammonia-lyase, PAL). Although two genes encoding PAL showed downregulated expression at the transcript level, three proteins were promoted. One gene and two proteins of the enzyme EC: 1.14.14.91 (trans-cinnamate 4-monooxygenase, CA4H), and one gene and five proteins of the enzyme EC: 1.2.1.44 (cinnamoyl-CoA reductase) were upregulated and promoted. The PSR95216 protein of the enzyme EC: 6.2.1.12 (4-coumarate-CoA ligase, 4CL) and the PSS09538 protein of the enzyme (peroxidase, POD) were highly expressed (log2FC = 9999) after Psa inoculation. The results may suggest that phenolic compound accumulation and lignin content increased in the phenylpropanoid biosynthesis pathway after Psa inoculation in ‘Jinkui.’ Lignin is a major end product of phenylpropanoid pathway and is involved in plant disease resistance.
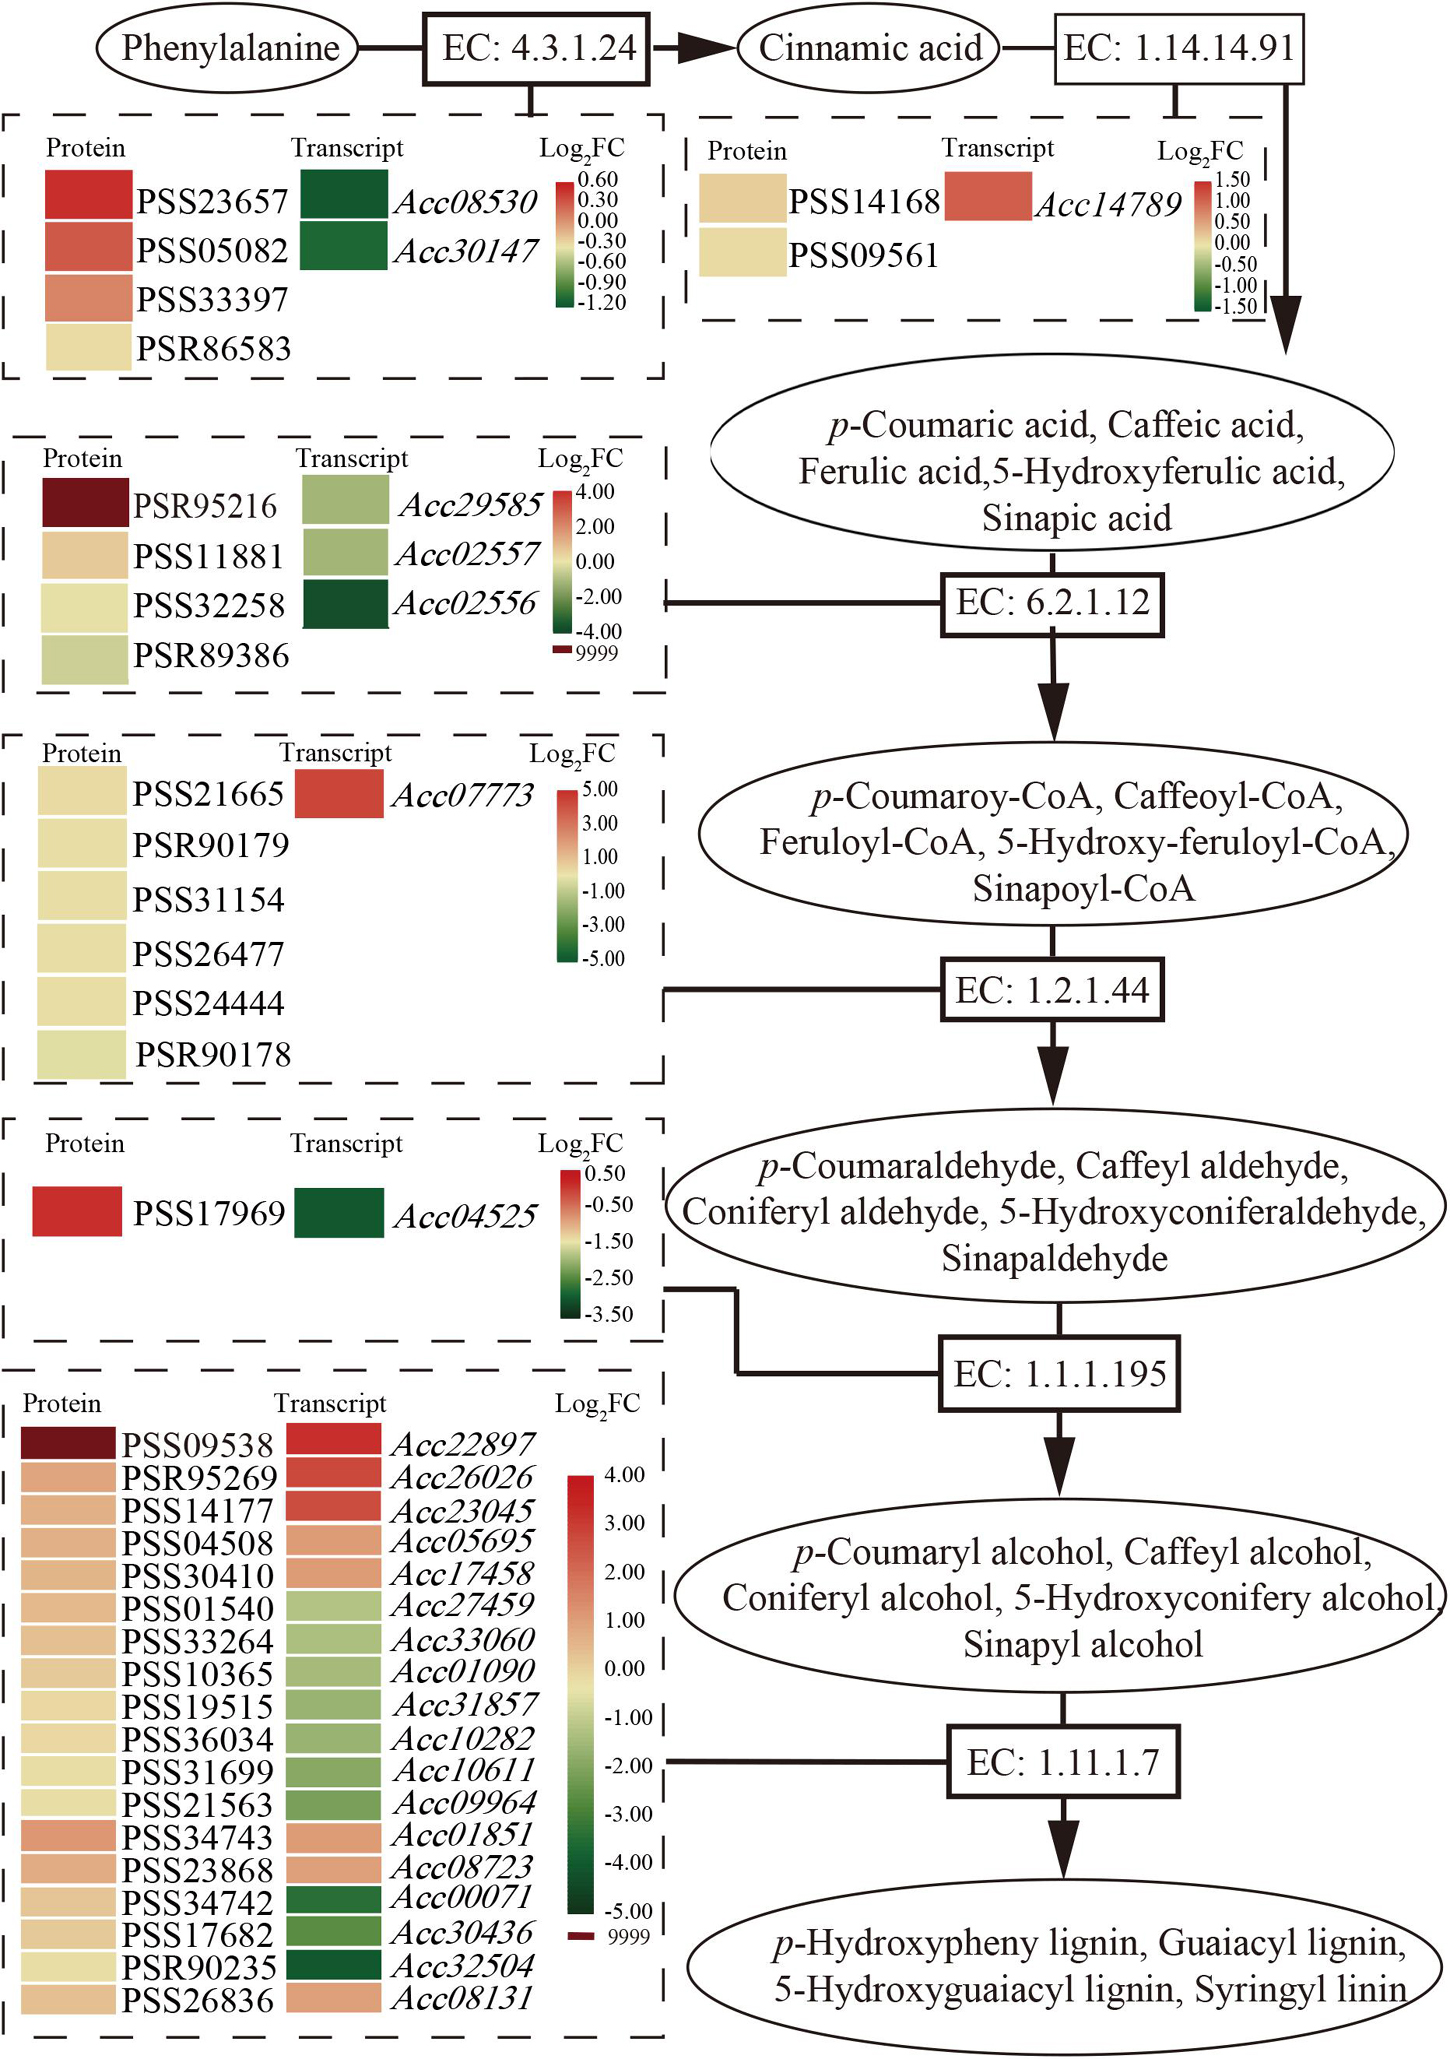
Figure 4. Schematic of the transcriptome and proteome revealing the regulation of phenylpropanoid biosynthesis at 1 dpi of Psa in ‘Jinkui’ leaves.
After Psa inoculation, 27 of the R2R3-MYB TFs in A. chinensis var. deliciosa ‘Jinkui’ were differentially expressed, 12 of which were upregulated and 15 of which were downregulated. These 27 genes were analyzed by qRT-PCR in A. chinensis var. chinensis ‘Hongyang’, 16 of them were significantly changed, 6 of them were upregulated and 10 of them were downregulated (Figure 5). To establish the “regulation–expression” cue of these candidate AccR2R3-MYBs, the cis-acting regulatory elements (CREs) located 2,000 bp upstream of the 27 genes were identified using the PlantCARE database. The distribution of CREs involved in responsiveness and development is shown in Figure 5. The hormone-related CREs mainly included “Abscisic acid responsiveness,” “Auxin responsiveness,” “MeJA responsiveness,” “Gibberellin responsiveness,” and “Salicylic acid responsiveness.” Among the 27 genes, the most special gene of AcMYB16 (Acc19042) was downregulated (log2-fold change = −7.9) in A. chinensis var. deliciosa ‘Jinkui’ and upregulated (log2-fold change = 6.1) in A. chinensis var. chinensis ‘Hongyang’ in response to Psa. The promoter region of AcMYB16 have five light responsiveness CREs and one MYB binding site involved in drought-inducibility CRE, suggesting that this gene may be involved in light and drought response. Interestingly, there is also one MeJA responsiveness CRE in the promoter region of AcMYB16, indicating that AcMYB16 might be a susceptible gene involved in Psa infection in kiwifruit by responding to JA. We hypothesized that AcMYB16 might be a negative R2R3-MYB TF gene in response to Psa related to JA.
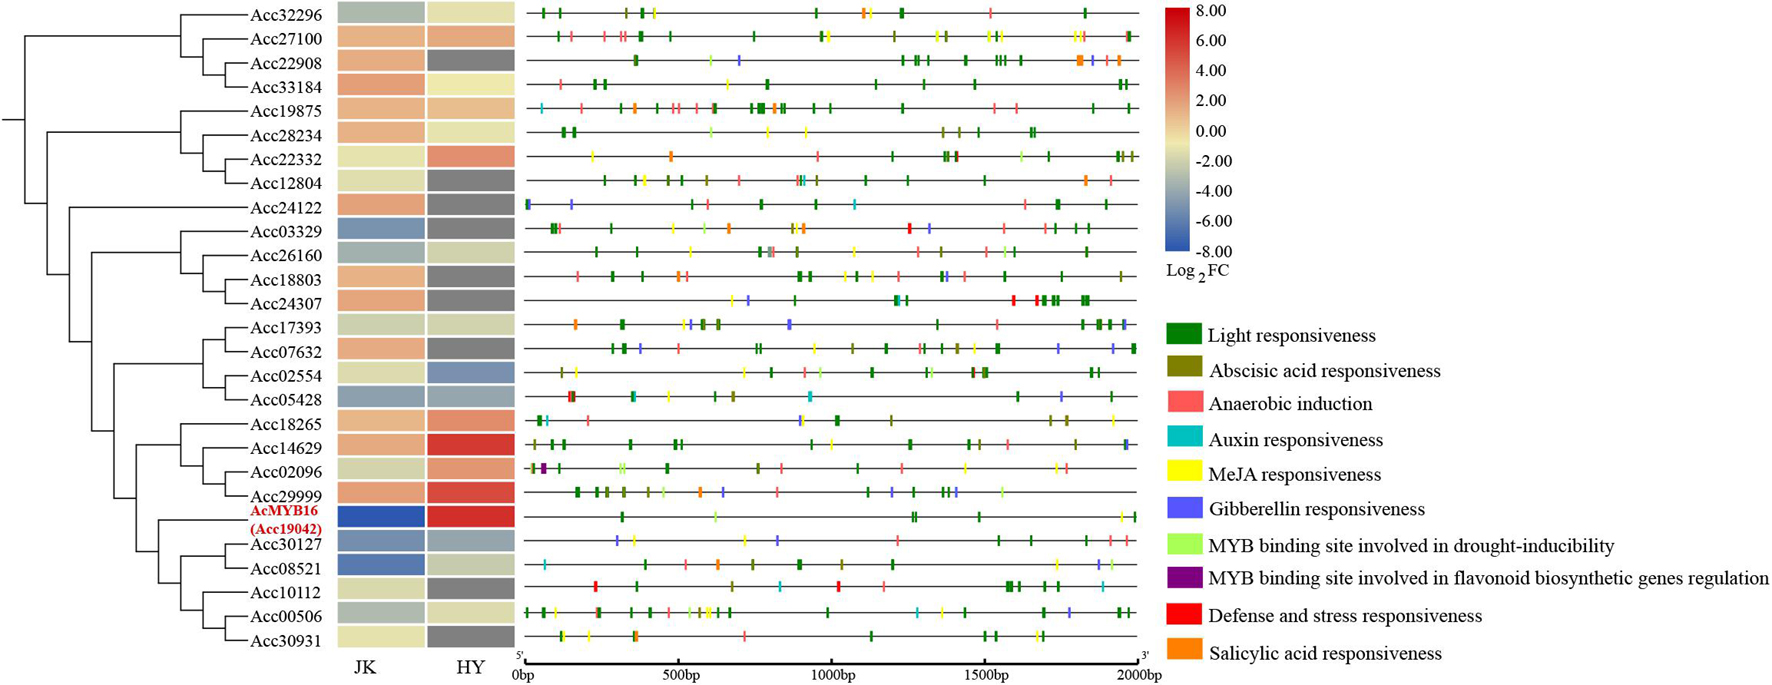
Figure 5. Distribution of cis-acting regulatory elements (CREs) involved in the responsiveness of the promoters of 27 candidate R2R3-MYBs.
The protein sequences of AcMYB16 shared the highest identity (70.34%) with AtMYB16 (AT5G15310) in the A. thaliana genome. After clustering AcMYB16 with 8 subgroup 4 TFs from A. thaliana (Zhang et al., 2018), F. tataricum (Zhang et al., 2018), and Chrysanthemum morifolium (Zhu et al., 2013), a phylogenetic tree was constructed that confirmed AcMYB16 classified into subgroup 4 of the R2R3-MYB TFs (Supplementary Figure 6). The results show that AcMYB16 may be a MYB16 protein. Comparison of amino acid sequences between AcMYB16 and MYB subgroup 4 proteins revealed that they share highly conserved R2R3 domains in the N-terminal regions but are more divergent at the C-terminal ends (Supplementary Figure 7). These typical motifs of MYB subgroup 4, including C2 and C4 motifs (Zhu et al., 2013), were not detected at the C-terminus of AcMYB16. In addition, compared with FtMYB 16 and FtMYB 13, EAR motif and SID domain related to response JA are not conserved in AcMYB16 (Zhou et al., 2017; Zhang et al., 2018). These results suggest that AcMYB16 is a novel MYB16 protein.
Transient expression of the AcMYB16 gene in the leaves of ‘Hongyang’ induced Psa infection (Figure 6A). ‘Hongyang’ leaves with transient expression of the AcMYB16 gene were more susceptible to disease. The bacterial concentration of leaves with AcMYB16 transient expression inoculated with Psa was twice as high as that of the vector control leaves inoculated with Psa only (Figure 6B). The results indicate that AcMYB16 is a gene capable of inducing Psa infection in leaves.
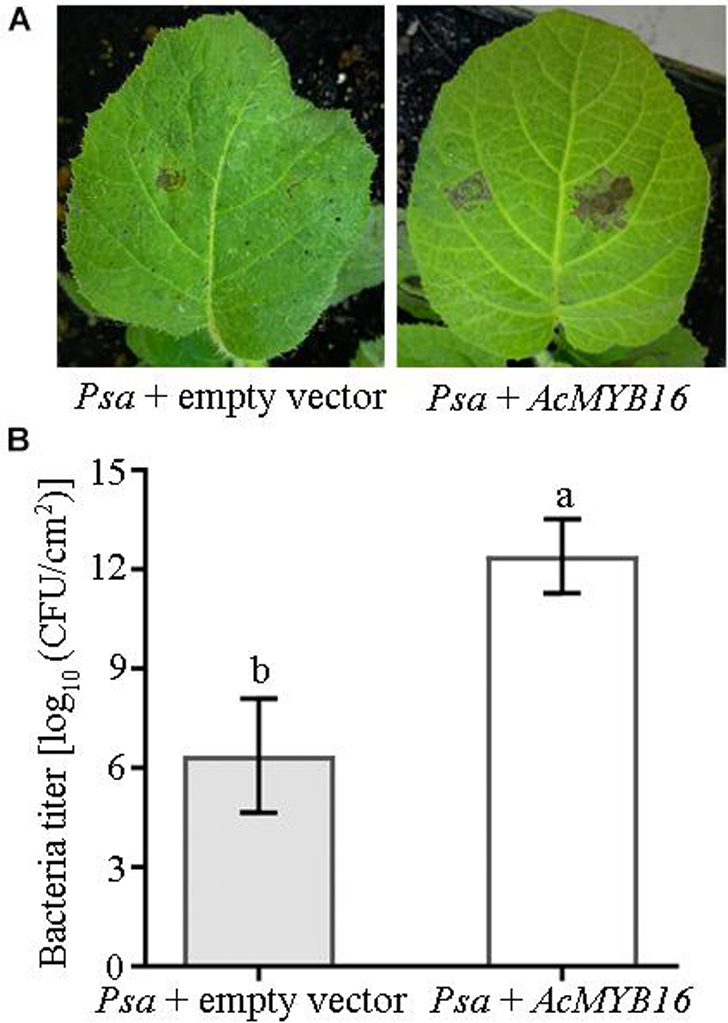
Figure 6. Transient expression of AcMYB16 in ‘Jinkui’ leaves induced Psa infection (A) and enhanced plant sensitivity to Psa (B).
In plants, SA, ABA, and JA and signaling pathways are critical for plant resistance against P. syringae (Flors et al., 2018). In this study, SA and ABA were significantly increased after Psa inoculation in A. chinensis var. deliciosa ‘Jinkui’ (Figure 1) with the accumulation of related proteins (Figure 3) after inoculation with Psa. The change of SA and ABA content in A. chinensis var. chinensis ‘Hongyang’ was consistent with that in ‘Jinkui.’ The accumulation of SA is central to the full manifestation of PTI and ETI at and near infection sites (Flors et al., 2018; Klessig et al., 2018). In previous studies, proteomic and transcriptomic analyses were performed to analyze the defense response of kiwifruit to P. syringae. pv. actinidiae infection (Wang et al., 2018). It has been demonstrated that elicitors of the SA pathway limit disease severity in both A. chinensis var. chinensis and deliciosa. The genes PR1, PR8, ICS, and PAL were elicited after infection by P. syringae. pv. actinidiae in A. chinensis var. deliciosa. Comparison of the transcriptomes of A. chinensis var. chinensis, A. arguta and Actinidia eriantha led to the suggestion that resistance to P. syringae. pv. actinidiae was related to the expression of a number of long non-coding RNAs that act in concert with coding genes (Wang et al., 2017). In Arabidopsis, the phytohormones ABA and JA mediate suppression of MAP kinases (MAPKs) (Mine et al., 2017), which are exploited by DC3000 via production of T3SS effectors, such as AvrPtoB, AvrB, HopAM1, and HopX1, as well as the phytotoxin coronatine (Geng et al., 2012). In this study, JA showed different changes in the two varieties of ‘Jinkui’ and ‘Hongyang’ after inoculation with Psa (Figure 1). JA is an important plant hormone that induces the biosynthesis of various secondary metabolites, such as phenylpropanoid and flavonoids, via the modulation of JA-responsive TFs (Geng et al., 2012). A number of MYB TFs have been found to interact with members of the jasmonate ZIM domain protein family (Zhang et al., 2018).
MYB TFs are widely distributed in higher plants, are the most abundant and powerful transcription factors in the transcription factor family, and play a central role in plant defense resistance, but their functions in the kiwifruit defense response to Psa infection remain incompletely understood (Zhang et al., 2018). A total of 155 putative R2R3-MYB TFs were identified from the A. chinensis ‘Red 5’ genome sequence (Yue et al., 2020), 27 of which were involved in the response to Psa. The R2R3-MYB TF gene AcMYB16 was downregulated in the resistant cultivar A. chinensis var. deliciosa ‘Jinkui’ but upregulated in the susceptible cultivar A. chinensis var. Chinensis ‘Hongyang’ in response to Psa at 1 dpi. Analysis of the promoter region of AcMYB16 found that this gene has a MeJA-responsive CRE. Hormone assays also showed that JA accumulated in ‘Hongyang’ and decreased in ‘Jingkui’ at 1 dpi of Psa (Figure 1). The results showed that AcMYB16 acts as a negative regulatory gene in response to JA in kiwifruit infected with Psa. Furthermore, protein sequence analysis results showed that AcMYB16 is a protein classified into subgroup 4 of the R2R3-MYB TFs.
In Arabidopsis, several R2R3-MYB TFs, such as AtMYB4, AtMYB7, and AtMYB32, belong to subgroup 4, which act as transcriptional repressors owing to the EAR motif (Dubos et al., 2010). JA signaling results in the activation of TFs, which regulate gene expression through specific binding to cis-acting elements in the promoters of target genes (Zhou and Memelink, 2016). In F. tataricum, JA-responsive FtMYB16 specifically acts as a phenylpropanoid biosynthesis repressor, dependent on the EAR motif, while FtMYB13 acts as a repressor, dependent on the conserved Asp residues (FtMYB13D285N) of the SID domain (Zhou et al., 2017; Zhang et al., 2018). In Populus, MYB189 is a transcriptional repressor, and the amino acid GDDYGNHGMIKKE at the C-terminal end is required for its repressive activity (Zhang et al., 2018; Jiao et al., 2019). However, in this study, sequence alignment showed that AcMYB16 does not have any of these conditions (Figure 7).
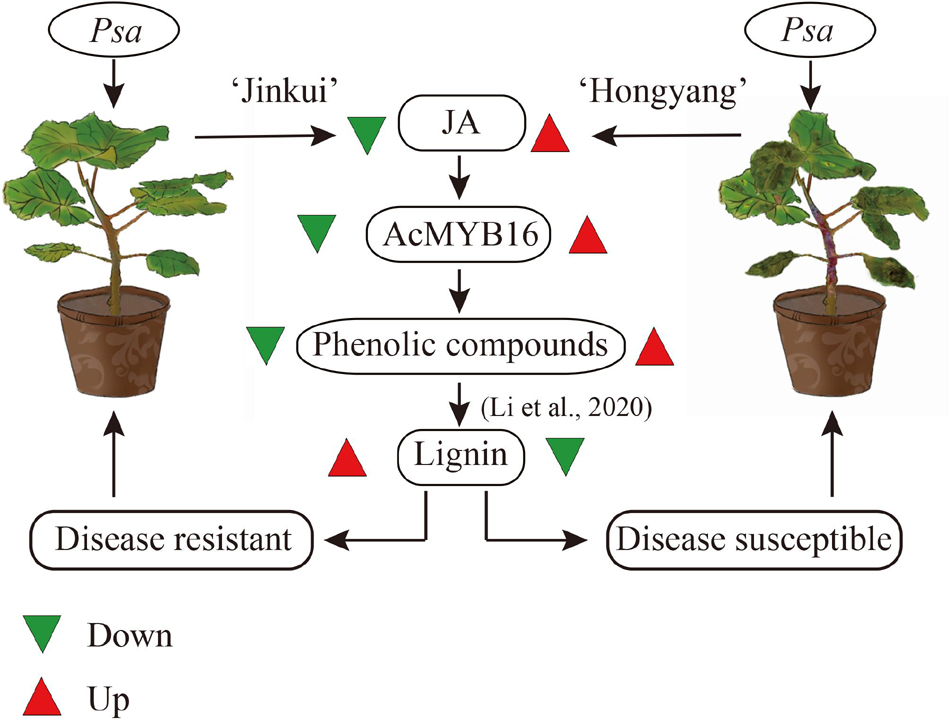
Figure 7. Possible scheme for metabolism following Psa attack in ‘Jinkui’ and ‘Hongyang’ leaves.
As one of the model plant pathogens, previous studies of DC3000 in Arabidopsis and tomato showed its capacity for immunity suppression and JA manipulation (Xin et al., 2018). The woody-infecting pathogen has evolved a system enabling the breakdown of woody tissue of plant trees (Nowell et al., 2016; Xin et al., 2018). In plants, physical defense by the cell wall is one of the most powerful mechanisms used by plants to defend themselves against pathogens. The cell wall is a recalcitrant network of polysaccharides, including cellulose, hemicellulose (such as xyloglucan and arabinoxylan), lignin and pectin. Upon pathogen attack, plants often deposit callose-rich cell wall appositions (i.e., papillae) at sites of attempted pathogen penetration, accumulate phenolic compounds and various toxins in the wall and synthesize lignin-like polymers to reinforce the wall (Zhao and Dixon, 2014). In our study, a total of 149 genes and 49 proteins were enriched that participate in multiple branches of the phenylpropanoid pathway after Psa inoculation (Supplementary Table 4). These data showed that suppression of cell wall synthesis is crucial for Psa infection. However, our previous study showed that most of the phenolic compounds were reduced in ‘Jinkui’ but increased in ‘Hongyang’ after Psa inoculation, while lignin changed in the opposite direction (Li et al., 2020), indicating that phenolic compounds were negatively related to kiwifruit Psa resistance, and lignin was positively related to kiwifruit Psa resistance. It has been reported that various MYB transcription factor genes, including a large class of plant transcription factors, directly or indirectly regulate the expression of lignin biosynthesis genes in many plant species (Kim et al., 2020). For example, the biosynthesis of syringyl lignin is dependent on MYB103 in Arabidopsis stems (Öhman et al., 2013). Heterologous expression of AtMYB61 in Oryza sativa increased lignin content mainly by enriching syringyl units as well as p-coumarate and tricin moieties in the lignin (Koshiba et al., 2017). MYB156 and MYB189 act as repressors of lignin in Populus tomentosa (Koshiba et al., 2017; Yang et al., 2017). Overexpression of PtoMYB156 in P. tomentosa repressed phenylpropanoid biosynthetic genes, leading to reductions in the amounts of total phenolics and lignin. In contrast, knockout of PtoMYB156 in poplar resulted in the ectopic deposition of lignin (Yang et al., 2017). In ‘Jinkui,’ phenolic compounds did not accumulate, although there was a significant accumulation of proteins related to phenolic synthesis. The accumulation of proteins associated with lignin synthesis and the increase in lignin content suggest that phenolic substances may be used to synthesize lignin to resist Psa accompanied by downregulation of the R2R3-MYB TF subgroup 4 gene AcMYB16. However, in ‘Hongyang’, the accumulation of phenolic compounds led to the proliferation of bacteria and a decrease in lignin (Li et al., 2020) accompanied by upregulation of the TF gene AcMYB16, which made ‘Hongyang’ vulnerable (Figure 7).
In this study, we showed that SA, ABA and JA were involved in the response to Psa in the resistant cultivar A. chinensis var. deliciosa ‘Jinkui’ and in the susceptible cultivar A. chinensis var. chinensis ‘Hongyang.’ JA accumulated in ‘Hongyang’ and decreased in ‘Jingkui.’ We further determined the responses of the resistant cultivar ‘Jinkui’ at the gene and protein levels, which indicated that Psa infection activates “plant hormone signal transduction” and “phenylpropanoid biosynthesis.” In addition, a total of 27 R2R3-MYB TFs were involved in the response to Psa of ‘Jinkui,’ including the R2R3-MYB TF subgroup 4 gene AcMYB16, which was downregulated in the resistant cultivar ‘Jinkui’ but upregulated in ‘Hongyang’ at 1 dpi. The promoter region of AcMYB16 has a MeJA-responsive CRE. Transient expression revealed that AcMYB16 could increase Psa infection in kiwifruit leaves. Our results showed that AcMYB16 acts as a repressor gene to regulate the biosynthesis of lignin in response to JA in kiwifruit infected with Psa.
The datasets presented in this study can be found in online repositories. The names of the repository/repositories and accession number(s) can be found below: Proteomic data was deposited in ProteomeXchange under accession no: PXD014787; Sequencing data was deposited in NCBI SRA BioProject under accession no: PRJNA766305.
XW and YaL designed and performed the whole experiments and wrote the manuscript. YuL, DZ, MN, and BJ performed data analysis. WH and ZF provided scientific suggestion. PL and L-wZ supervised. All authors contributed to the article and approved the submitted version.
This work was funded by the National Natural Science Foundation of China (32072548), the Anhui Provincial Natural Science Foundation (2008085MC78), and the Key Research and Development Program of Anhui Province of China (grants 1804a07020105 and 201904f06020035).
The authors declare that the research was conducted in the absence of any commercial or financial relationships that could be construed as a potential conflict of interest.
All claims expressed in this article are solely those of the authors and do not necessarily represent those of their affiliated organizations, or those of the publisher, the editors and the reviewers. Any product that may be evaluated in this article, or claim that may be made by its manufacturer, is not guaranteed or endorsed by the publisher.
We thank the reviewers whose comments and suggestions helped to improve the manuscript.
The Supplementary Material for this article can be found online at: https://www.frontiersin.org/articles/10.3389/fpls.2021.756330/full#supplementary-material
4CL, 4-coumarate-CoA ligase; ABA, abscisic acid; CA4H, trans-cinnamate 4-monooxygenase; DBD, DNA-binding domain; DAPs, differentially abundant proteins; Dpi, day postinoculation; COI1, coronatine-insensitive protein 1; CREs, cis-acting regulatory elements; JA, jasmonic acid; JA-Ile, JA-isoleucine; JAR1, jasmonic acid-amino synthetase; JAZ, jasmonate ZIM domain-containing protein; KGD, kiwifruit Genome Database; KBC, kiwifruit bacterial canker; MAPKs, MAP kinases; MeJA, methyl jasmonate; NSA, nutrient-sucrose agar; MAPKs, MAP kinases; POD, peroxidase; Psa, Pseudomonas syringae pv. actinidiae; SA, salicylic acid; TFs, transcription factors.
Ampomah-Dwamena, C., Thrimawithana, A. H., Dejnoprat, S., Lewis, D., Espley, R. V., and Allan, A. C. (2019). A kiwifruit (Actinidia deliciosa) R2R3-MYB transcription factor modulates chlorophyll and carotenoid accumulation. New Phytol. 221, 309–325. doi: 10.1111/nph.15362
Buscaill, P., and Rivas, S. (2014). Transcriptional control of plant defence responses. Curr. Opin. Plant Biol. 20, 35–46. doi: 10.1016/j.pbi.2014.04.004
Cui, J., Jiang, N., Zhou, X., Hou, X., Yang, G., Meng, J., et al. (2018). Tomato MYB49 enhances resistance to Phytophthora infestans and tolerance to water deficit and salt stress. Planta 248, 1487–1503. doi: 10.1007/s00425-018-2987-6
Dubos, C., Stracke, R., Grotewold, E., Weisshaar, B., Martin, C., and Lepiniec, L. (2010). MYB transcription factors in Arabidopsis. Trends Plant Sci. 15, 573–581. doi: 10.1016/j.tplants.2010.06.005
Flors, V., Ton, J., van Doorn, R., Jakab, G., García-Agustín, P., and Mauch-Mani, B. (2018). Interplay between JA, SA and ABA signalling during basal and induced resistance against Pseudomonas syringae and Alternaria brassicicola. Plant J. 54, 81–92. doi: 10.1111/j.1365-313X.2007.03397.x
Geng, X., Cheng, J., Gangadharan, A., and Mackey, D. (2012). The coronatine toxin of Pseudomonas syringae is a multifunctional suppressor of Arabidopsis defense. Plant Cell 24, 4763–4774. doi: 10.1105/tpc.112.105312
Gu, K. D., Zhang, Q. Y., Yu, J. Q., Wang, J. H., Zhang, F. J., Wang, C. K., et al. (2021). R2R3-MYB transcription factor MdMYB73 confers increased resistance to the fungal pathogen Botryosphaeria dothidea in apples via the salicylic acid pathway. J. Agric. Food Chem. 69, 447–458. doi: 10.21203/rs.3.rs-107830/v1
He, R., Liu, P., Jia, B., Xue, S., Wang, X., Hu, J., et al. (2019). Genetic diversity of Pseudomonas syringae pv. actinidiae strains from different geographic regions in China. Phytopathology 109, 347–357. doi: 10.1094/PHYTO-06-18-0188-R
Jiang, C. K., and Rao, G. Y. (2020). Insights into the diversification and evolution of R2R3-MYB transcription factors in plants. Plant Physiol. 183, 637–655. doi: 10.1104/pp.19.01082
Jiao, B., Zhao, X., Lu, W., Guo, L., and Luo, K. (2019). The R2R3 MYB transcription factor MYB189 negatively regulates secondary cell wall biosynthesis in Populus. Tree Physiol. 39, 1187–1200. doi: 10.1093/treephys/tpz040
Kim, S. H., Lam, P. Y., Lee, M. H., Jeon, H. S., Tobimatsu, Y., and Park, O. K. (2020). The Arabidopsis R2R3 MYB transcription factor MYB15 is a key regulator of lignin biosynthesis in effector-triggered immunity. Front. Plant Sci. 11:583153. doi: 10.3389/fpls.2020.583153
Klessig, D. F., Choi, H. W., and Dempsey, D. A. (2018). Systemic acquired resistance and salicylic acid: past, present, and future. Mol. Plant Microbe Interact. 31, 871–888. doi: 10.1094/MPMI-03-18-0067-CR
Koshiba, T., Yamamoto, N., Tobimatsu, Y., Yamamura, M., Suzuki, S., Hattori, T., et al. (2017). MYB-mediated upregulation of lignin biosynthesis in Oryza sativa towards biomass refinery. Plant Biotechnol. 34, 7–15. doi: 10.5511/plantbiotechnology.16.1201a
Kumar, S., Stecher, G., and Tamura, K. (2016). MEGA7: molecular evolutionary genetics analysis version 7.0 for bigger datasets. Mol. Biol. Evol. 33, 1870–1874. doi: 10.1093/molbev/msw054
Li, J., Han, G., Sun, C., and Sui, N. (2019). Research advances of MYB transcription factors in plant stress resistance and breeding. Plant Signal. Behav. 14:1613131. doi: 10.1080/15592324.2019.1613131
Li, Y., Wang, X., Zeng, Y., and Liu, P. (2020). Metabolic profiling reveals local and systemic responses of kiwifruit to Pseudomonas syringae pv. actinidiae. Plant Direct 4:e00297. doi: 10.1002/pld3.297
Li, Y., Zhu, Q., Zhi, T., Fan, R., Xie, T., Zhao, Z., et al. (2021). Genetic causes of non-pathogenic Pseudomonas syringae pv. actinidiae isolates in kiwifruit orchards. Front. Microbiol. 12:650099. doi: 10.3389/fmicb.2021.650099
Liu, J., Sui, Y., Chen, H., Liu, Y., and Liu, Y. (2018). Proteomic analysis of kiwifruit in response to the postharvest pathogen, Botrytis cinerea. Front. Plant Sci. 9:158. doi: 10.3389/fpls.2018.00158
Ma, D., and Constabel, C. P. (2019). MYB repressors as regulators of phenylpropanoid metabolism in plants. Trends Plant Sci. 24, 275–289. doi: 10.1016/j.tplants.2018.12.003
Mine, A., Berens, M. L., Nobori, T., Anver, S., Fukumoto, K., Winkelmüller, T. M., et al. (2017). Pathogen exploitation of an abscisic acid- and jasmonate-inducible MAPK phosphatase and its interception by Arabidopsis immunity. Proc. Natl. Acad. Sci. U.S.A. 114, 7456–7461. doi: 10.1073/pnas.1702613114
Nicholas, K. B., and Nicholas, H. B. (1997). GeneDoc: A Tool for Editing and Annotating Multiple Sequence Alignments. Pittsburgh, PA: Pittsburgh Supercomputing Center’s National Resource for Biomedical Supercomputing.
Nowell, R. W., Laue, B. E., Sharp, P. M., and Green, S. (2016). Comparative genomics reveals genes significantly associated with woody hosts in the plant pathogen Pseudomonas syringae. Mol. Plant Pathol. 17, 1409–1424. doi: 10.1111/mpp.12423
Öhman, D., Demedts, B., Kumar, M., Gerber, L., Gorzsás, A., Goeminne, G., et al. (2013). MYB103 is required for FERULATE-5-HYDROXYLASE expression and syringyl lignin biosynthesis in Arabidopsis stems. Plant J. 73, 63–76. doi: 10.1111/tpj.12018
Peng, Y., Lin-Wang, K., Cooney, J. M., Wang, T., Espley, R. V., and Allan, A. C. (2019). Differential regulation of the anthocyanin profile in purple kiwifruit (Actinidia species). Hortic. Res. 6:3. doi: 10.1038/s41438-018-0076-4
Peng, Y., Thrimawithana, A. H., Cooney, J. M., Jensen, D. J., Espley, R. V., and Allan, A. C. (2020). The proanthocyanin-related transcription factors MYBC1 and WRKY44 regulate branch points in the kiwifruit anthocyanin pathway. Sci. Rep. 10:14161. doi: 10.1038/s41598-020-70977-0
Seo, P. J., and Park, C. M. (2010). MYB96-mediated abscisic acid signals induce pathogen resistance response by promoting salicylic acid biosynthesis in Arabidopsis. New Phytol. 186, 471–483. doi: 10.1111/j.1469-8137.2010.03183.x
Sievers, F., Wilm, A., Dineen, D., Gibson, T. J., Karplus, K., Li, W., et al. (2011). Fast, scalable generation of high-quality protein multiple sequence alignments using clustal omega. Mol. Syst. Biol. 7, 539–539. doi: 10.1038/msb.2011.75
Silva, M. N., Vasconcelos, M. W., Pinto, V., Balestra, G. M., and Carvalho, S. M. P. (2021). Role of methyl jasmonate and salicylic acid in kiwifruit plants further submitted to Psa infection: biochemical and genetic responses. Plant Physiol. Biochem. 162, 258-266. doi: 10.1016/j.plaphy.2021.02.045
Stacklies, W., Redestig, H., Scholz, M., Walther, D., and Selbig, J. (2007). pcaMethods–a bioconductor package providing PCA methods for incomplete data. Bioinformatics 23, 1164–1167. doi: 10.1093/bioinformatics/btm069
Tahir, J., Hoyte, S., Bassett, H., Brendolise, C., Chatterjee, A., Templeton, k., et al. (2019). Multiple quantitative trait loci contribute to resistance to bacterial canker incited by Pseudomonas syringae pv. actinidiae in kiwifruit (Actinidia chinensis). Hortic. Res. 6:101. doi: 10.1038/s41438-019-0184-9
Vailleau, F., Daniel, X., Tronchet, M., Montillet, J. L., Triantaphylidès, C., and Roby, D. A. (2002). R2R3-MYB gene. Proc. Natl. Acad. Sci. U.S.A. 99, 10179–10184. doi: 10.1073/pnas.152047199
Wang, F. M., Mo, Q. H., Ye, K. Y., Gong, H. J., Qi, B. B., Liu, P. P., et al. (2020). Evaluation of the wild Actinidia germplasm for resistance to Pseudomonas syringae pv. actinidiae. Plant Pathol. 69, 979–989. doi: 10.1111/ppa.13184
Wang, L., Tang, W., Hu, Y., Zhang, Y., Sun, J., Guo, X., et al. (2019). A MYB/bHLH complex regulates tissue-specific anthocyanin biosynthesis in the inner pericarp of red-centered kiwifruit Actinidia chinensis cv. ‘Hongyang’. Plant J. 99, 359–378. doi: 10.1111/tpj.14330
Wang, T., Wang, G., Jia, Z. H., Pan, D. L., Zhang, J. Y., and Guo, Z. R. (2018). Transcriptome analysis of kiwifruit in response to Pseudomonas syringae pv. actinidiae infection. Int. J. Mol. Sci. 19:373. doi: 10.3390/ijms19020373
Wang, Z., Liu, Y., Li, L., Li, D., Zhang, Q., Guo, Y., et al. (2017). Whole transcriptome sequencing of Pseudomonas syringae pv. actinidiae- infected kiwifruit plants reveals species-specific interaction between long non-coding RNA and coding genes. Sci. Rep. 7:4910. doi: 10.1038/s41598-017-05377-y
Wei, X., Mao, L., Wei, X., Xia, M., and Xu, C. (2020). MYB41. Hortic. Res. 7:86. doi: 10.1038/s41438-020-0309-1
Wen, B., Zhou, R., Qiang, F., Wang, Q., and Liu, S. (2014). Iquant: an automated pipeline for quantitative proteomics based upon isobaric tags. Proteomics 14, 2280-2285.
Xin, X. F., Kvitko, B., and He, S. Y. (2018). Pseudomonas syringae: what it takes to be a pathogen. Nat. Rev. Microbiol. 16, 316–328. doi: 10.1038/nrmicro.2018.17
Yang, L., Zhao, X., Ran, L., Li, C., Fan, D., and Luo, K. (2017). PtoMYB156 is involved in negative regulation of phenylpropanoid metabolism and secondary cell wall biosynthesis during wood formation in poplar. Sci. Rep. 7:41209. doi: 10.1038/srep41209
Yoon, J., Choi, H., and An, G. (2015). Roles of lignin biosynthesis and regulatory genes in plant development. J. Integr. Plant Biol. 57, 902–912. doi: 10.1111/jipb.12422
Yoshida, K., Ma, D., and Constabel, C. P. (2015). The MYB182 protein down-regulates proanthocyanidin and anthocyanin biosynthesis in poplar by repressing both structural and regulatory flavonoid genes. Plant Physiol. 167, 693–710. doi: 10.1104/pp.114.253674
Yu, M., Man, Y., and Wang, Y. (2019). Light- and temperature-induced expression of an R2R3-MYB gene regulates anthocyanin biosynthesis in red-fleshed kiwifruit. Int. J. Mol. Sci. 20:5228. doi: 10.3390/ijms20205228
Yue, J., Liu, J., Tang, W., Wu, Y. Q., Tang, X., Li, W., et al. (2020). Kiwifruit genome database (KGD): a comprehensive resource for kiwifruit genomics. Hortic. Res. 7:117.
Zhang, K., Logacheva, M. D., Meng, Y., Hu, J., Wan, D., Li, L. J., et al. (2018). Jasmonate-responsive MYB factors spatially repress rutin biosynthesis in Fagopyrum tataricum. J. Exp. Bot. 69, 1955–1966. doi: 10.1093/jxb/ery032
Zhao, Q., and Dixon, R. A. (2014). Altering the cell wall and its impact on plant disease: from forage to bioenergy. Annu. Rev. Phytopathol. 52, 69–91. doi: 10.1146/annurev-phyto-082712-102237
Zhou, M., and Memelink, J. (2016). Jasmonate-responsive transcription factors regulating plant secondary metabolism. Biotechnol. Adv. 34, 441–449. doi: 10.1016/j.biotechadv.2016.02.004
Zhou, M., Sun, Z., Ding, M., Logacheva, M. D., Kreft, I., Wang, D., et al. (2017). FtSAD2 and FtJAZ1 regulate activity of the FtMYB11 transcription repressor of the phenylpropanoid pathway in Fagopyrum tataricum. New Phytol. 216, 814–828. doi: 10.1111/nph.14692
Zhu, L., Shan, H., Chen, S., Jiang, J., Gu, C., Zhou, G., et al. (2013). The heterologous expression of the chrysanthemum R2R3-MYB transcription factor cmmyb1 alters lignin composition and represses flavonoid synthesis in Arabidopsis thaliana. PLoS One 8:e65680. doi: 10.1371/journal.pone.0065680
Keywords: Actinidia chinensis var. deliciosa, bacterial canker, proteome, transcriptome, MYB TFs
Citation: Wang X, Li Y, Liu Y, Zhang D, Ni M, Jia B, Heng W, Fang Z, Zhu L-w and Liu P (2021) Transcriptomic and Proteomic Profiling Reveal the Key Role of AcMYB16 in the Response of Pseudomonas syringae pv. actinidiae in Kiwifruit. Front. Plant Sci. 12:756330. doi: 10.3389/fpls.2021.756330
Received: 10 August 2021; Accepted: 08 October 2021;
Published: 11 November 2021.
Edited by:
Gianfranco Romanazzi, Marche Polytechnic University, ItalyReviewed by:
Oriana Flores, Pontificia Universidad Católica de Valparaíso, ChileCopyright © 2021 Wang, Li, Liu, Zhang, Ni, Jia, Heng, Fang, Zhu and Liu. This is an open-access article distributed under the terms of the Creative Commons Attribution License (CC BY). The use, distribution or reproduction in other forums is permitted, provided the original author(s) and the copyright owner(s) are credited and that the original publication in this journal is cited, in accordance with accepted academic practice. No use, distribution or reproduction is permitted which does not comply with these terms.
*Correspondence: Pu Liu, cHVsaXVAYWhhdS5lZHUuY24=
†These authors have contributed equally to this work and share first authorship
Disclaimer: All claims expressed in this article are solely those of the authors and do not necessarily represent those of their affiliated organizations, or those of the publisher, the editors and the reviewers. Any product that may be evaluated in this article or claim that may be made by its manufacturer is not guaranteed or endorsed by the publisher.
Research integrity at Frontiers
Learn more about the work of our research integrity team to safeguard the quality of each article we publish.