 Pil Joong Chung1,2†‡Gajendra P. Singh2†Chung-Hao Huang1,2†Sayuj Koyyappurath1,2
 Jun Sung Seo1‡Hui-Zhu Mao1Piyarut Diloknawarit1
 Rajeev J. Ram2,3*
 Rajani Sarojam1,2*
 Nam-Hai Chua1,2*
- 1Temasek Life Science Laboratory, National University of Singapore, Singapore, Singapore
- 2Disruptive and Sustainable Technologies for Agricultural Precision, Singapore-MIT Alliance for Research and Technology, Singapore, Singapore
- 3Research Laboratory of Electronics, Massachusetts Institute of Technology, Cambridge, MA, United States
We have developed a rapid Raman spectroscopy-based method for the detection and quantification of early innate immunity responses in Arabidopsis and Choy Sum plants. Arabidopsis plants challenged with flg22 and elf18 elicitors could be differentiated from mock-treated plants by their Raman spectral fingerprints. From the difference Raman spectrum and the value of p at each Raman shift, we derived the Elicitor Response Index (ERI) as a quantitative measure of the response whereby a higher ERI value indicates a more significant elicitor-induced immune response. Among various Raman spectral bands contributing toward the ERI value, the most significant changes were observed in those associated with carotenoids and proteins. To validate these results, we investigated several characterized Arabidopsis pattern-triggered immunity (PTI) mutants. Compared to wild type (WT), positive regulatory mutants had ERI values close to zero, whereas negative regulatory mutants at early time points had higher ERI values. Similar to elicitor treatments, we derived an analogous Infection Response Index (IRI) as a quantitative measure to detect the early PTI response in Arabidopsis and Choy Sum plants infected with bacterial pathogens. The Raman spectral bands contributing toward a high IRI value were largely identical to the ERI Raman spectral bands. Raman spectroscopy is a convenient tool for rapid screening for Arabidopsis PTI mutants and may be suitable for the noninvasive and early diagnosis of pathogen-infected crop plants.
Introduction
Global food supply and security have been challenged by water scarcity and climate change, and the situation is further exacerbated by the projected increase in the world's population to about 10 billion by 2050 (Misra, 2014). The expected increase in food demand requires a corresponding increase in crop productivity and disruptive improvements in agricultural production systems. Crop productivity in the field is compromised by abiotic stresses as well as biotic stresses, and the potential agricultural yield losses caused by plant pathogens are about 16% globally (Oerke, 2006).
Several strategies have been implemented to mitigate the degradation of crop yield caused by plant diseases. The generation of pathogen-resistant plants by transgenic means (Dong and Ronald, 2019; van Esse et al., 2020) and the use of agrochemicals to confer disease resistance (Zhou and Wang, 2018) have met with limited success. In the field, rapid detection of pathogen-infected plants is an important first step in plant disease management. The early detection of infected plants would allow their rapid and selective removal, thus greatly reducing pathogen load and the opportunity for further disease spreading. A visual inspection of disease symptoms and the grading of their disease severity turn out to be a classical method of identifying infected plants. However, most disease symptoms usually manifest only at relatively later stages of infection when the pathogen load is already quite high. Therefore, over the last two decades, plant disease diagnosis has shifted from a visual inspection of symptom-based disease phenotype to molecular-based diagnostic procedures (Fang and Ramasamy, 2015; Martinelli et al., 2015). Nevertheless, these molecular methods suffer from several drawbacks such as a dependency on the availability of pathogen-specific gene sequences or antibodies. Their implementation requires time and is not amenable to on-site field application.
To obviate the drawbacks of molecular methods, several groups have explored the use of Raman spectroscopy for a rapid diagnosis of plant diseases (Yeturu et al., 2016; Egging et al., 2018; Farber and Kurouski, 2018; Farber et al., 2019, 2020a,b; Mandrile et al., 2019; Sanchez et al., 2020b). A Raman spectrum records the molecular vibrations of cellular metabolites without the use of a label or reagents. Differences in the Raman spectra of a diseased sample vs. that of the control sample are fingerprints, which reflect changes in cellular metabolites following pathogen infection. The acquisition of a Raman spectrum usually takes less than a minute and using a hand-held device, such a recording can be directly done on field crops (Gupta et al., 2020).
Raman spectroscopy-based detection and identification of bacterial, fungal, and viral diseases in plants have been reported (Yeturu et al., 2016; Farber and Kurouski, 2018; Farber et al., 2019; Mandrile et al., 2019; Sanchez et al., 2020b,c; Payne and Kurouski, 2021). Meanwhile, Raman fingerprints vary depending on the disease symptoms and the pathogens involved, in most cases, the Raman spectra collected from the diseased leaves primarily show changes in peak intensities corresponding to vibrational bands originating from carotenoids, pectin, phenylpropanoids, cellulose, and proteins. In most cases, irrespective of the responsible pathogen, a decrease in carotenoid (vibrational bands around 1,523 and 1,541 cm−1) was consistently seen in the symptomatic compared to the asymptomatic tissue. Using Raman spectroscopy, Rys et al. (2014) reported an increase in carotenoid bands during Obuda pepper virus infection at 48 h post-infiltration (hpi); however, the measurement by traditional spectrophotometric methods did not show significant changes in total carotenoid content. This discrepancy was attributed to a qualitative rather than quantitative change in total carotenoids or to the ability of Raman spectroscopy to detect different sets of carotenoids in comparison to the spectrophotometric method.
We have previously used Raman spectroscopy to identify Arabidopsis plants suffering from the early stages of nitrogen deficiency (Huang et al., 2020). In rice, a hand-held Raman spectrometer showed an accurate presymptomatic diagnosis of N, P, and K deficiencies, as well as a medium and high salinity stresses, with a hydroponic condition (Sanchez et al., 2020a). We seek to extend this noninvasive method for the diagnosis of plants that exhibit early host responses to pathogen infection.
Plants have evolved a multilayer defense system to combat pathogens (Li and Staiger, 2018). The first layer of the plant immune system involves pathogen perception by the recognition of conserved pathogen-associated molecular patterns (PAMPs) by pattern recognition receptors (PRRs) present on the plant cell surface. These plasma membrane-localized PRRs are mainly found as receptor kinases or receptor-like proteins and, upon binding of the PRRs, initiate signaling of an innate immune pathway referred to as PAMP-triggered immunity (PTI) (Ausubel, 2005; Abdul Malik et al., 2020). PAMP-triggered immunity (PTI) causes rapid plant defense responses, including calcium ion flux, reactive oxygen species (ROS) burst, the activation of the MAPK cascades, the expression of defense-related genes, and callose deposition (Jones and Dangl, 2006; Luna et al., 2011; Bigeard et al., 2015). Two of the most studied PRRs are flagellin-sensing 2 (FLS2), which senses a conserved 22-amino acid sequence of flagellin (flg22), and elongation factor Tu (EF-Tu) receptor (EFR), which recognizes a conserved 18-amino acid peptide (elf18) of the EF-Tu (Zipfel et al., 2004, 2006; Chinchilla et al., 2006). The signaling mechanisms of these two PRRs have been well studied, and the key components have been identified (Sun et al., 2013; Yu et al., 2017; Peng et al., 2018; Saijo et al., 2018; Wang et al., 2018).
To see if we can employ Raman spectroscopy to detect early changes in cellular metabolites following pathogen–plant interaction, we used the elicitors flg22 and elf18 to trigger PTI in Arabidopsis plants. Raman spectra were taken in the leaf region proximal to the mock- or elicitor-infiltrated site, and the difference Raman spectrum revealed several peaks along with carotenoids that showed significant changes at 24 hpi. To quantify the early PTI response using Raman spectroscopy, an Elicitor Response Index (ERI) was developed whereby a higher ERI value indicates a more significant elicitor-induced immune response. Investigations of several PTI-related mutants produced the expected results, substantiating the reliability and reproducibility of this method. This approach was further validated by using pathogen studies in Arabidopsis and the vegetable crop, Choy Sum (Brassica rapa v.parachinenesis). We suggest that the noninvasive optical method described in this study can be used to identify the early infection of Arabidopsis and field crops.
Materials and Methods
Plant Growth and Elicitor/Pathogen Infiltration
Arabidopsis thaliana (Col-0) wild type (WT) and mutants including fls2 (salk_062054), efr-2 (salk_068675), bak1 (salk_116202), bik1 (salk_005291), rbohd (salk_083046), pub12/13 (Zhou et al., 2018), and pub25/26 (Wang et al., 2018) were used. Ten-day-old seedlings grown on soil were transferred to a growth room at 70% humidity and 21°C with a 10-h-light/14-h-dark photoperiod (short-day condition). Light intensity was 100 μmol/m2s−1. Five- to six-week-old plants with about 17–18 leaves were used. Flg22 contains the 22-amino acid sequence QRLSTGSRINSAKDDAAGLQIA corresponding to a conserved motif of the amino terminus of flagellin from Pseudomonas species. Elf18 contains the sequence AcSKEKFERTKPHVNVGTIG corresponding to the conserved N-terminal 18-amino acid peptide of the bacterial protein EF-Tu. These peptides (Axil Scientific Pte Ltd., Singapore Science Park II, Singapore) were dissolved in sterile H2O to a concentration of 5 mM, and aliquots of 100 μM stock solution were stored at −20°C. 3-hydroxydecanoic acid (Sigma, St. Louis, MO, USA, H3648) (Kutschera et al., 2019) was dissolved in ethanol to a concentration of 5 mM, and Chitin, GlcNacβ1-4[GlcNacβ1-4GlcNAc]5GlcNAc (ELICITYL, Crolles, France, GLU437) was dissolved in water to a concentration of 5 mM. Aliquots of 100 μM stock solutions were stored at −20°C.
An overnight culture of Pseudomonas syringae pv. Tomato DC3000 (Pst DC3000) (Rufián et al., 2019) was suspended in 10 mM MgCl2 to approximately 5 × 10⁵ cfu/ml (OD600 = 0.001). About 50 μl of either the bacterial suspension or 10 mM MgCl2 (mock) was infiltrated on the abaxial side of Arabidopsis leaf by a needleless syringe. Commercial Choy Sum (B. rapa v. parachinensis) seeds were grown in growth chambers at 25°C under a 16-h-ligh/8-h-dark photoperiod with 75% humidity. Two-week-old Choy Sum plants were inoculated with the Xanthomonas campestris py. campestris (Xcc) isolate (ATCC33913). The Xcc strain was grown in yeast extract, glucose, and calcium carbonate (YGC) medium at 28°C. Harvested bacterial cells were resuspended in YGC medium to 1 × 10⁸ cfu/ml. Using a needleless syringe, the abaxial side of the fourth leaf of each plant was inoculated with 200 μl of Xcc suspension on both sides of the central leaf vein near the leaf margins. The leaves of separate plants inoculated with 200 μl of sterile media served as the mock control.
Custom-Built Raman Spectroscopy System and Spectral Data Analysis
The Raman spectroscopy system with an 830 nm excitation wavelength was previously described (Huang et al., 2020). The Raman shift axis was calibrated using a polystyrene sample (Creely et al., 2005), and the Raman spectra were recorded in the range of 400–1,700 cm−1. The 830 nm excitation wavelength has the advantage of deeper penetration depth and generating a comparatively lower fluorescence background signal from the leaf tissue, resulting in spectra with a higher signal-to-noise ratio (SNR). The preprocessing of the Raman spectra consisted of cosmic ray removal and smoothing with the Savitzky–Golay filter function (MATLAB, Inc., Natick, MA, USA) with the fifth-order polynomial and frame length of 11. The Raman spectra presented in this study were obtained after removing any residual fluorescence background using a polynomial subtraction method with nonnegative constraints (Lieber and Mahadevan-Jansen, 2003).
For Arabidopsis, two plants from each independent biological sample were investigated (Huang et al., 2020). The seventh or eighth leaf of 5–6-week-old plants was used for infiltrations (Figure 1). At the designated time after infiltrations, leaf discs (6 mm diameter) were excised with a puncher from the regions proximal to the infiltrated sites (Figure 2A). Two leaf discs were obtained from each elicitor-treated leaf, one from the left and the other from the right side of the central leaf vein. A total of four leaf discs were analyzed for each genotype per experiment. The leaf discs were placed with a drop of water between a fused silica slide of thickness 0.5 mm and a fused silica coverslip, which was 100 μm thick. Three locations were measured in each leaf disc, with five Raman spectra acquired per location and an exposure time of 10 s per spectrum. Thus, an average Raman spectrum of an independent biological sample was obtained from the mean of a total of 60 Raman spectra. The experiments were repeated with three to four independent biological samples.
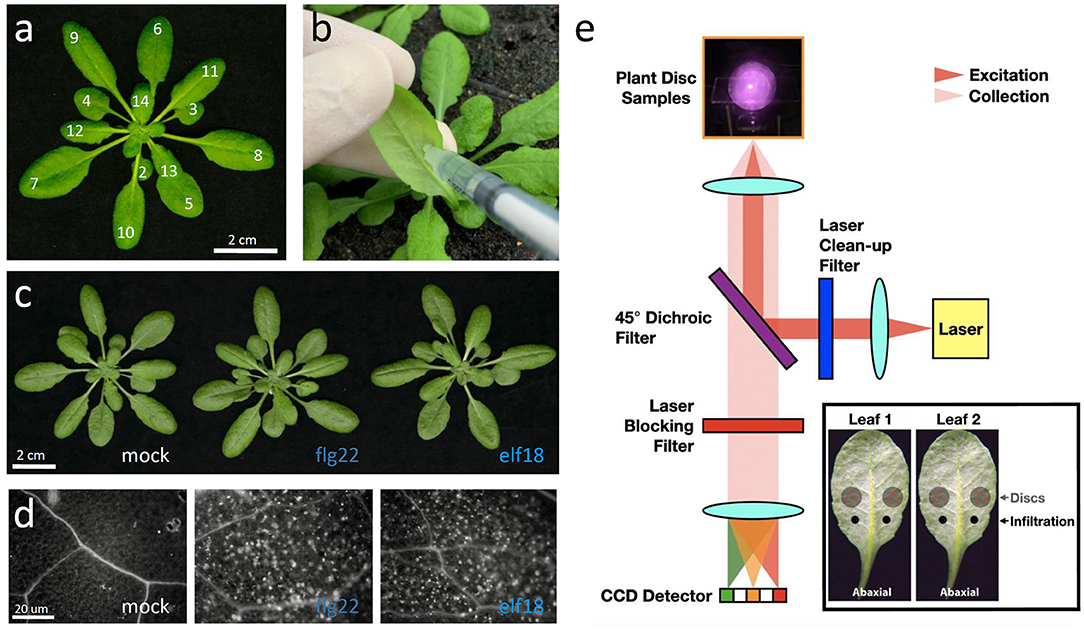
Figure 1. Experimental procedures for the Raman spectroscopic analysis of elicitor-treated plants. (a) A 5-week-old Arabidopsis thaliana plant with leaves numbered according to the developmental stage. Leaf 1 is the first true leaf that started to emerge after the cotyledons. Scale bar = 2 cm. (b) The abaxial (bottom) side of the leaf to be syringe-infiltrated. Leaf was inoculated by infiltration with a blunt syringe. (c) Images of plants 24 h post-infiltration (hpi). Scale bar = 2 cm. (d) Images of callose deposits in aniline-blue-stained leaves that were previously infiltrated with mock (H2O), 1 μM flg22 or elf18 for 24 h. Scale bar = 20 μm. (e) Schematic of a custom-built NIR Raman spectroscopy used to detect secondary metabolites in plants. An insert shows the infiltrated sites and the leaf discs taken from the proximal region (PR) of the sites for analysis.
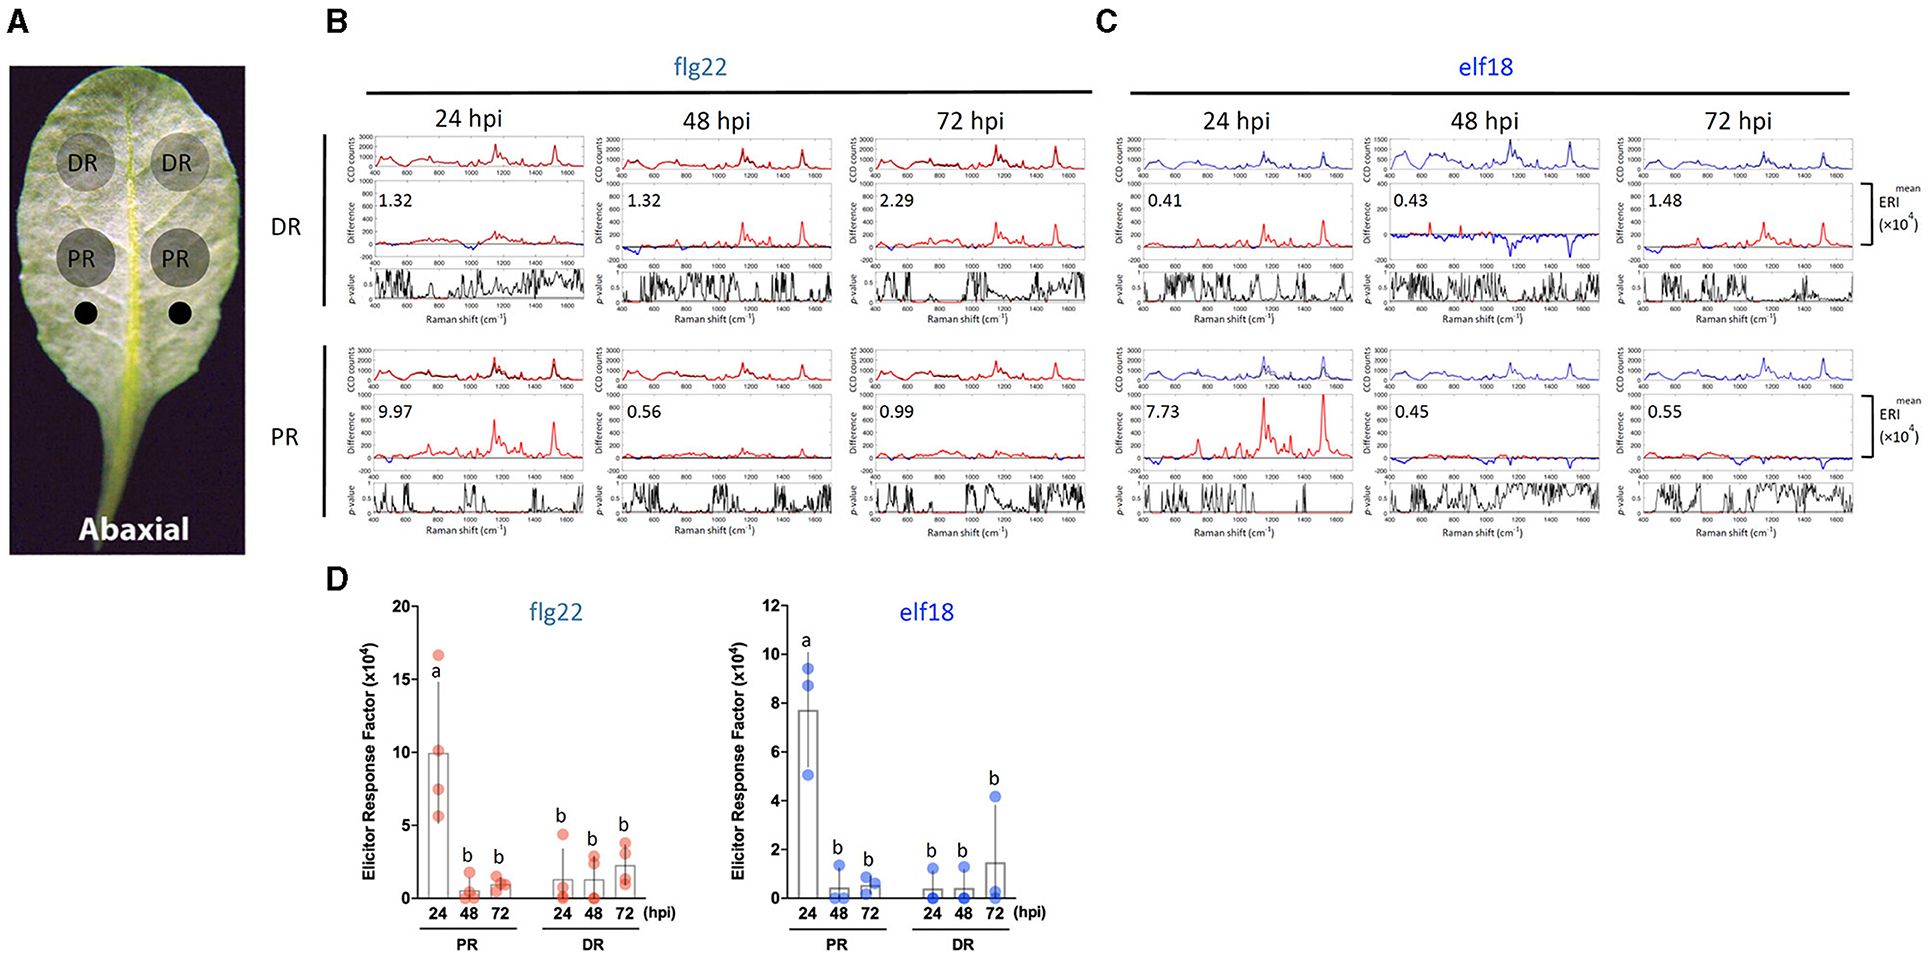
Figure 2. Effects of sample location and elicitor treatment time on changes in Raman spectra. (A) The abaxial (bottom) side of a leaf is to be infiltrated with an elicitor. Elicitor (1 μM) was infiltrated with a needleless syringe at two locations (indicated as two small circles) nearest to the petiole. Leaf samples were taken from the PR and DR at 24, 48, and 72 hpi and analyzed by Raman spectroscopy. (B,C) A group of three panels was shown for either the DR or PR sample. Upper panel: mean spectra of control (black) and elicitor-treated samples (red, flg22 and blue, elf18). Middle panel: Difference spectrum between the mean spectrum of the elicitor-treated sample vs. that of the mock-treated sample. Red indicates that the difference is a positive value, whereas blue indicates a negative value. The number inside the panel indicates the average Elicitor Response Index (ERI, ×104) value obtained from four (B) or three (C) independent experiments. Lower panel: t-test was used to evaluate statistically significant differences between elicitor-infiltrated and H2O-infiltrated (mock) samples and the results were expressed as p-values. Red indicates p < 0.05. (D) Changes in ERI after the time of infiltration. Left, flg22 (red spots), n = 4 independent biological samples; Right, elf18 (blue spots), n = 3 independent biological samples. PR, proximal region; DR, distal region. The results represent the average values of three to four independent biological experiments with SD. Bars with different letters above are significantly different according to Fisher's least significant difference test (p < 0.05).
For Raman spectral acquisitions in Choy Sum, the two leaf discs from a single leaf were excised from the proximal regions (PRs) of the infiltrated site at 24 and 48 h after infiltration. Three locations were measured in each leaf disc, with five Raman spectra acquired per location and an exposure time of 10 s per spectrum. Thus, an average Raman spectrum of one independent biological sample for each time point was obtained from the mean of a total of 30 Raman spectra. Three biological replicates for each time point were performed for both Xcc and mock infiltration.
RNA Extraction and Gene Expression Analysis by Reverse Transcription-Quantitative PCR
After mock or elicitor treatments, the leaf samples were collected at time periods indicated in each experiment (0.5, 1, 3, 6, and 24 h) and immediately frozen in liquid nitrogen. Total RNA was extracted from the entire infiltrated leaf using the RNeasy plant mini kit (74104; Qiagen, Hilden, Germany) with DNase I (79254; Qiagen, Hilden, Germany) treatment. About 1 μg of RNA was used for complementary DNA (cDNA) synthesis, and reverse transcription-quantitative PCRs (RT-qPCRs) were performed as described (Park et al., 2018) on the following genes. Immune response genes—WRKY53 (At4g23810), early senescence WRKY networking regulator; WRKY29 (At4g23550); WRKY30 (At5g24110); ZAT12 (At5g59820), ZINC FINGER OF ARABIDOPSIS THALIANA12; PR1 (At2g14610), PATHOGENESIS-RELATED GENE1; PDF1.2 (At5g44420), PLANT DEFENSIN; MPK3 (At3g45640), Mitogen-activated Protein Kinase3; SAND (At2g28390), MONENSIN SENSITIVITY1 (MON1) a zinc finger protein, PMR4 (At4g03550), PAD3 (At3g26830), MPK3 (At3g45640), and MYB51 (At1g18570). Tryptophan-metabolism related genes. MYB122 (At1g74080), MYB51 (At1g18570), MYB34 (At5g60890), CYP79B2 (At4g39950), CYP79B3 (At2g22330), CYP83B1 (At4g31500), CYP71A13 (At2g30770), CYP71B15/pad3 (At3g26830) Carotenoid biosynthetic genes-PSY, phytoene synthase (At5g17230); PDS, phytoene desaturase (At4g14210); Z-ISO, z-carotene isomerase (At1g10830); ZDS, z-carotene desaturase (At3g04870); CRTISO, carotenoid isomerase (At1g06820); εLCY, Lycopene ε-cyclase (LUT2, At5g57030); βLCY, Lycopene β-cyclase (At3g10230); CYP97A3, (LUT5, At1g31800); CYP97C1, (LUT1, At3g53130); CYP97B3, (At4g15110); BCH1, β-carotene hydroxylase 1 (At4g25700); BCH2, β-carotene hydroxylase 2 (At5g52570); CCS, COPPER CHAPERONE FOR SOD1(At1g12520); ZEP, Zeaxanthin epoxidase (ABA1, At5g67030); NPQ, NON-PHOTOCHEMICAL QUENCHING1 (At1g08550), NXS, neoxanthin synthase (ABA4, At1g67080); NCED3, 9-cis-epoxycarotenoid dioxygenase (At3g14440); ABA2, ABA DEFICIENT 2 (At1g52340); AAO3, ABSCISIC ALDEHYDE OXIDASE3 (At2g27150); CCD1, carotenoid cleavage dioxygenase1 (At3g63520); CCD4, At4g19170; CCD7, At2g44990; CCD8, At4g32810; D27, β-carotene isomerase (At1g64680); CYP711A, (At2g26170). The expression of the Arabidopsis Act2 (At3g18780) was used as an internal control. Primer pairs for RT-qPCR were designed using Primer-BLAST (https://www.ncbi.nlm.nih.gov/tools/primer-blast/index.cgi) or manually by eye. All RT-qPCR primers are listed in Supplementary Table 1.
Elicitor-Induced Callose Deposition
The callose assay was performed as described by Ton et al. (2005). Callose-mediated fluorescence was visualized using a DAPI filter set (an excitation filter 365 nm; a dichroic mirror 395 nm; and an emission filter 397 nm) of an Axio Imager M2 microscope (Zeiss, Oberkochen, Germany). Images collected with a photometric CoolSNAP HQ2 camera system (Roper Scientific Germany, Planegg, Germany) were acquired by an x100 lens using the MetaMorph software (Version 7.7.0.0; Molecular Devices, Sunnyvale, CA, USA). Callose foci within the frame of a single image (magnification ×100; 5,655 μm2 per region) were quantified using the ImageJ software (http://rsb.info.nih.gov/ij/, Schneider et al., 2012). For each experiment, the number of callose deposits was measured in two plants with about four to five leaf regions surveyed per plant. This provided about 8–10 data points per experiment. The experiment was repeated with three independent biological samples. For Choy Sum, callose deposition was visualized in three independent biological samples at 24 and 48 hpi.
Total Carotenoid Extraction for Spectrophotometric Analysis
Total carotenoids were extracted and analyzed as described with minor modifications (Sumanta et al., 2014). Briefly, 30 mg of the fresh leaf sample was homogenized in a tissue homogenizer with 600 μl of methanol solvent. After centrifugation at 10,000 × g for 15 min at 4°C, 0.1 ml of the supernatant was mixed with 0.9 ml of methanol. The mixture was analyzed for photosynthetic pigment content by a spectrophotometer (TECAN, Männedorf, Switzerland, The spark multimode microplate reader) according to Sumanta et al. (2014). For each experiment, the quantification of total carotenoids was measured in three to five infiltrated plants per experiment. The quantification of carotenoids was expressed as the mean value of 15–20 different leaf extracts in four replicated experiments.
Results
Flg22 and elf18 Elicit Robust PTI Response
We used flg22 and elf18 to induce plant innate immunity responses without related pathogenic symptoms (Bektas and Eulgem, 2015). To reduce variability between biological samples, Arabidopsis WT (Col-0) and mutant plants were grown under short-day conditions for about 5–6 weeks with about 17–18 leaves (Farmer et al., 2013; Kurenda et al., 2019) (Figure 1a). The abaxial side of leaf seventh or eighth was infiltrated with a needleless syringe containing (50 μl) water, 1.0 μM flg22, or 1.0 μM elf18 (Figure 1b). At 24 hours post-infiltration (hpi), no pathological symptoms were seen at the infiltration sites in response to the PAMP nor the slight wounding caused by the syringe infiltration (Figure 1c). However, compared to mock infiltration, the infiltration of either induced the expression of PTI-specific marker genes but with different kinetics (Supplementary Figure 1). Some early responsive genes (WRKY30, MPK3, MYB51, CYP79B2, etc.) showed increased expression as early as 3 hpi, whereas the expression of other genes (PR1, PDF1.2, ZAT12, and MYB122) increased only at 6 hpi. The expression of most activated genes returned to basal levels by 24 h (Supplementary Figure 1) although several genes (PR1, WRYK29, and WRKY53) still maintained high expression levels at this time point. One day after infiltration, callose deposition in the elicitor-infiltrated leaf was more significantly induced than that in the mock-infiltrated control leaf (Figure 1d), which was consistent with the increased expression of genes related to callose synthesis (Supplementary Figure 1). The gene expression results and the callose deposition data together confirmed that, under our experimental conditions, both flg22 and elf18 induced a rapid and robust innate immunity response in the infiltrated leaves.
Analysis of the PTI Response by Raman Spectroscopy: Development of ERI
We used a custom-built near IR excitation Raman instrument (Figure 1e) to measure the Raman spectra from mock- or elicitor-infiltrated leaf samples (Figure 2). To quantify the PTI response using Raman spectroscopy, we developed an ERI as described as follows (Supplementary Figure 2):
Step 1: After preprocessing, as described in the section “Materials and methods,” the mean of 60 Raman spectra from each individual biological sample was obtained in the Raman shift spectral range of 400–1,700 cm−1.
Step 2: The difference of the mean spectra, as obtained in Step 1, between elicitor-treated and mock control-treated samples were subsequently derived to highlight the different Raman spectral regions with positive values.
Step 3: A p-value plot was obtained using a t-test to evaluate the statistical significance of the difference Raman spectra obtained in Step 2. The p-value of < 0.05 was noted in the difference Raman spectral regions. The p-value plot was corrected by including an estimation of the positive false discovery rate (pFDR) and applying the multiple-hypothesis testing principle.
Step 4: The area under the curve of the difference Raman spectral region, which has a positive value and also represents the corrected p-value of < 0.05 of Step 3, is defined as the ERI, which we used to measure the level of PTI response. A higher ERI value indicated a higher level of the elicitor-induced immune response.
Step 5: All the positive spectral regions contributing toward ERI were tabulated.
Effects of Elicitor Concentration on PTI Response Measured by Raman Spectroscopy
Because a robust induction of PTI marker genes was seen with 1 μM flg22 or elf18 (Seo et al., 2019), we use this elicitor concentration to perform a time-course experiment on leaf regions PR or distal (DR) from the infiltrated sites (Figures 2A–C). For flg22, the highest Raman shift spectrum and a high ERI value were obtained at PR 24 hpi. The ERI value decreased to almost zero at 48 and 72 hpi (Figures 2B,D). Low ERI values were obtained in DR, which gradually increased with time at 48–72 hpi indicating signal transmission from PR to DR. For elf18, Raman shift signals were also detected at 24 hpi in PR with high ERI values, which decreased to almost zero at 48–72 hpi. A lower ERI value was seen in DR (Figures 2C,D). Based on these results, for subsequent experiments, we chose to analyze the Raman spectra at PR 24 hpi with an elicitor concentration of 1.0 μM.
Raman Spectral Analysis of PAMP-Signaling Mutants Defective in Positive or Negative Regulatory Function
To confirm that the Raman spectra changes obtained by the elicitors were indeed caused by PTI signaling, we first analyzed the Raman spectra of a well-characterized mutant of the PTI pathway. Arabidopsis plants possess two PAMP receptors. The FLS2 receptor specifically recognizes flg22, whereas the EFR receptor is specific for elf18 (Chinchilla et al., 2006; Zipfel et al., 2006). Figure 3 shows the response of WT plants to both flg22 and elf18 with similar ERI values. By contrast, the fls2 mutant was refractory to flg22 but remained responsive to elf18, and similarly, the efr-2 mutant responded to flg22 but not to elf18 (Figure 3). These results confirmed that the immune response is specific to the elicitor used. We also measured the Raman spectra of mutants, including bak1, bik1, and rbohd, that are blocked in the PAMP signal transduction downstream of receptor activation (Figure 3). Previous publications have reported that the following mutants of the PAMP-signaling pathway, fls2, efr-2, bak1, bik1, and rbohd, have significantly reduced callose deposition after elicitor treatment (Lu et al., 2009; Zhang et al., 2010; Jaillais et al., 2011; Belkhadir et al., 2012; Daudi et al., 2012; Chaudhary et al., 2014; Smith et al., 2014). Callose deposition patterns and expression changes of marker genes of these mutants confirmed these previous results and verified their positive regulatory role in PTI response (Supplementary Figures 3, 4A). All these mutants did not show any significant changes in Raman spectra after elicitor treatment and hence had low ERI values (< 1 × 10⁴) (Figure 3).
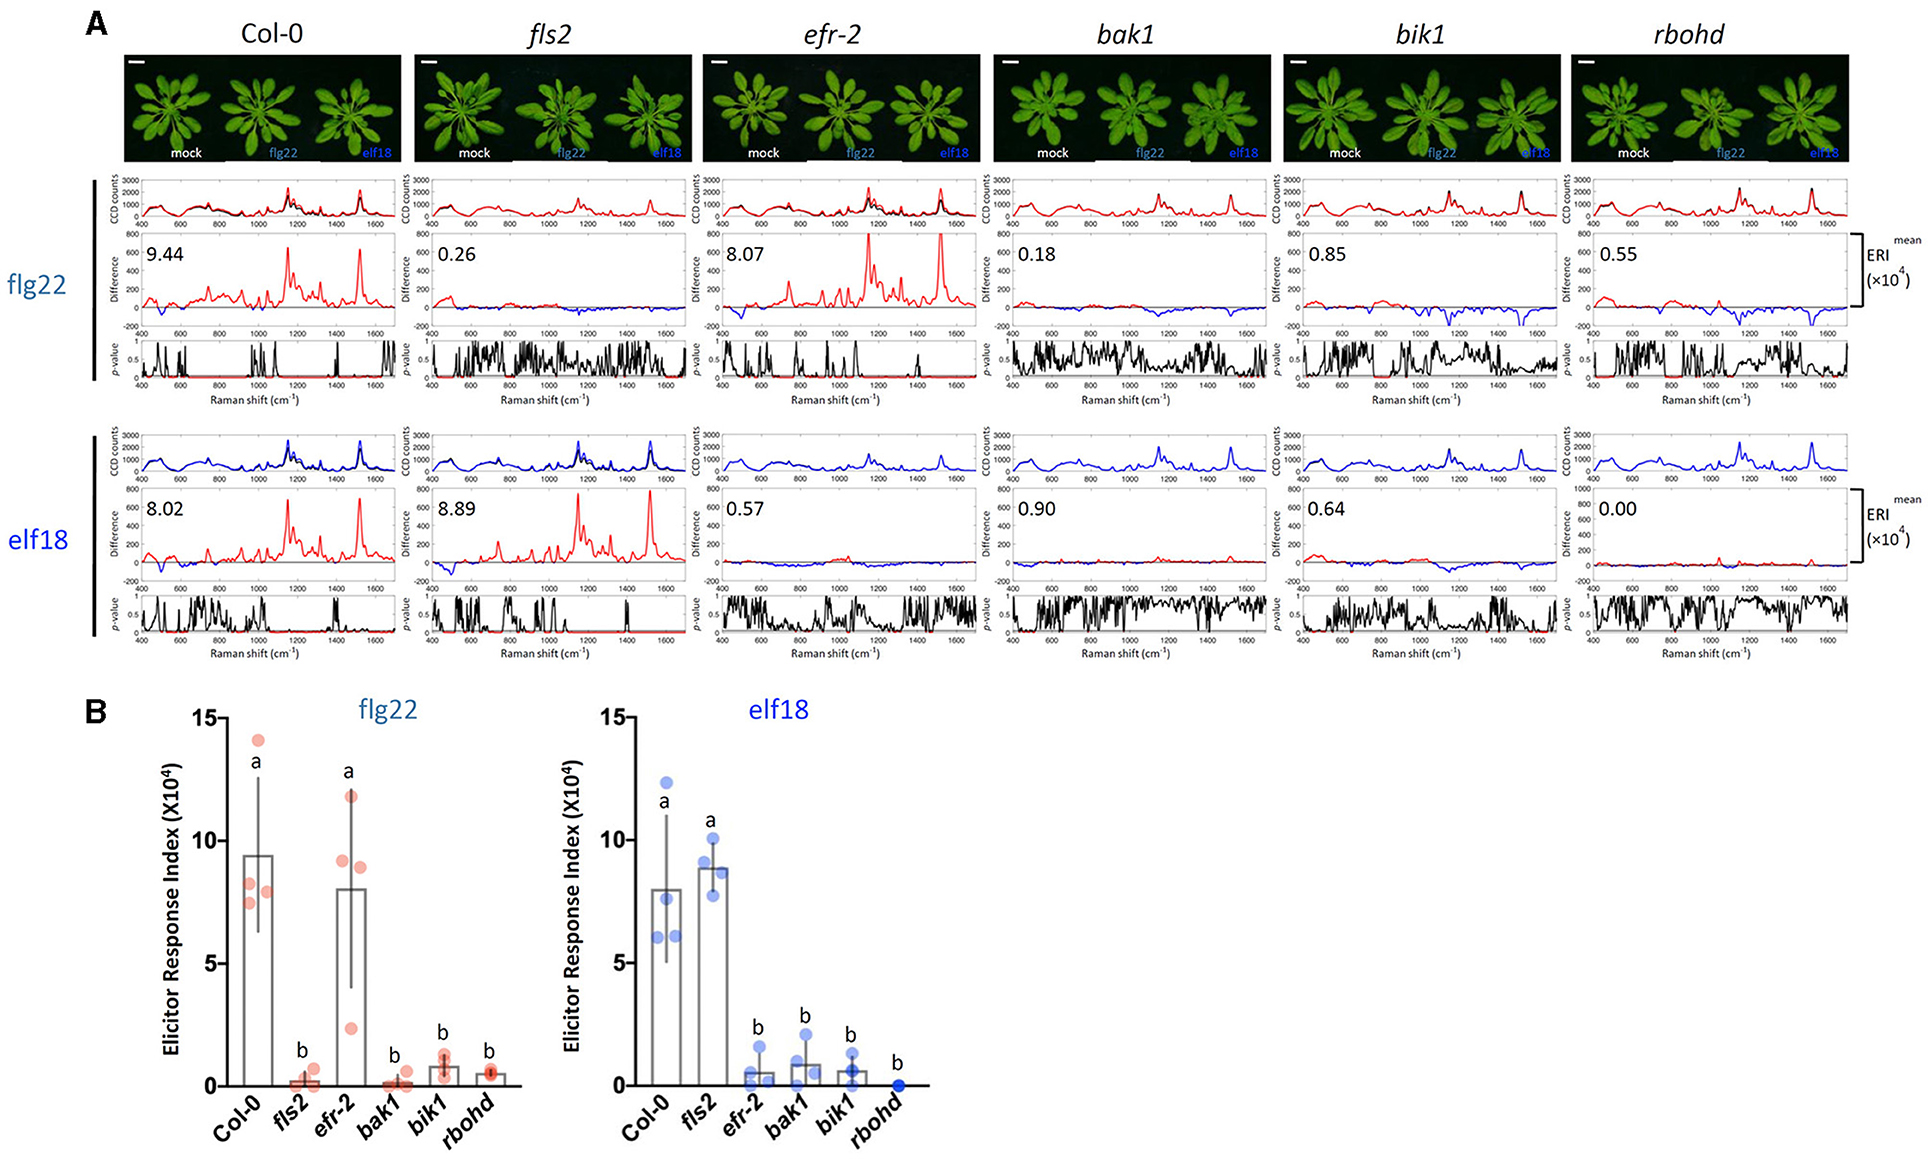
Figure 3. Raman spectroscopic analysis of wild type (WT) and mutant plants. (A) Raman spectra of WT Col-0 and mutant plants (fls2, efr-2, bak1, bik1, and rbohd) at 24 h after flg22 and elf18 treatment and mock control. Top panel: Images of plants 24 hpi. For each elicitor experiment (flg22, red and elf18, blue), a group of three panels was shown. Scale bar = 2 cm. Upper panel: a mean plot of all 60 spectra, taken from control (black) or elicitor-treated samples (red); Middle panel: the difference spectrum between the mean spectrum of the elicitor-infiltrated sample and that of the H2O-infiltrated (mock) sample. Red indicates that the difference is a positive value, whereas blue indicates a negative value. The number inside the panel indicates the average ERI (×104) value obtained from four independent experiments. Lower panel: t-test was used to evaluate statistically significant differences between elicitor-infiltrated and H2O-infiltrated (mock) samples and the results were expressed as p-values. Red indicates p < 0.05. Plants: Col-0, WT A. thaliana; fls2, FLAGELLIN-SENSING2 (At5g46330); efr-2, EF-Tu receptor (At5g20480); bak1, BRASSINOSTEROID INSENSITIVE-ASSOCIATED KINASE1 (At4g33430); bik1, BOTRYTIS-INDUCED KINASE1 (At2g39660); and rbohd, NADPH/respiratory burst oxidase protein D (At5g47910). (B) ERI of WT and mutants treated with either flg22 or elf18. The results show average ERI values along with SD. Bars with different letters above are significantly different according to Fisher's least significant difference test (p < 0.05). Left: flg22 (red spots); Right, elf18 (blue spots). n = 4 independent replicates.
Following the activation of the PAMP receptor, the PTI-signaling pathway is fine-tuned by downregulation to prevent excessive or prolonged activations that would be deleterious to the host plants. One common mechanism of signaling desensitization is by the polyubiquitin-mediated proteolysis of signaling components, and several such components have been identified. The FLS2 receptor itself is known to be poly-ubiquitinated by PUB12/13 (Lu et al., 2011; Zhou et al., 2015), and the coactivator BIK1 is similarly modified by PUB25/26 (Wang et al., 2018). Therefore, both PUB12/13 and PUB25/26 are the negative regulators of the PTI response, and the mutants that are deficient in these E3 ligases should display hyperresponsiveness to elicitors. In a time-course experiment, we found that the pub mutants (pub12/13 and pub25/26) indeed showed increases in gene expression levels as early as 0.5 or 6 h after 1 μM elicitor treatment when little response was detected with WT (Supplementary Figure 4B). Based on the earlier gene expression kinetics, we decided to measure changes in Raman spectra at 10 hpi. Figure 4 shows that at 10 h after flg22 treatment, the WT ERI value was only 1.12 × 10⁴ as compared to an ERI value of 9.44 × 10⁴ at 24 hpi (Figure 3A). Similarly, in the case of elf18, the ERI value at 10 hpi was 0.63 × 10⁴ compared to 8.02 × 10⁴ at 24 hpi (Figures 4A,B for 10 h and Figures 3A,B for 24 h). These results suggest that in WT plants the PAMP signaling pathway was only slightly activated at 10 h, and full activation would require 24 hpi. By contrast, at 10 hpi of either elicitor pub12/13 displayed an ERI value about 13–21 times higher than WT values, and for pub25/26, about 6.4–13.3 times higher (Figure 4B). These results showed that the hyper-responsive nature of the pub mutants to elicitors can be confirmed by Raman spectroscopy. Interestingly, higher ERI values were found in pub12/13 targeting an FLS2 receptor compared to those of pub25/26 targeting a downstream regulator, BIK1, in the flg22/elf18 signaling pathway (Figure 4B).
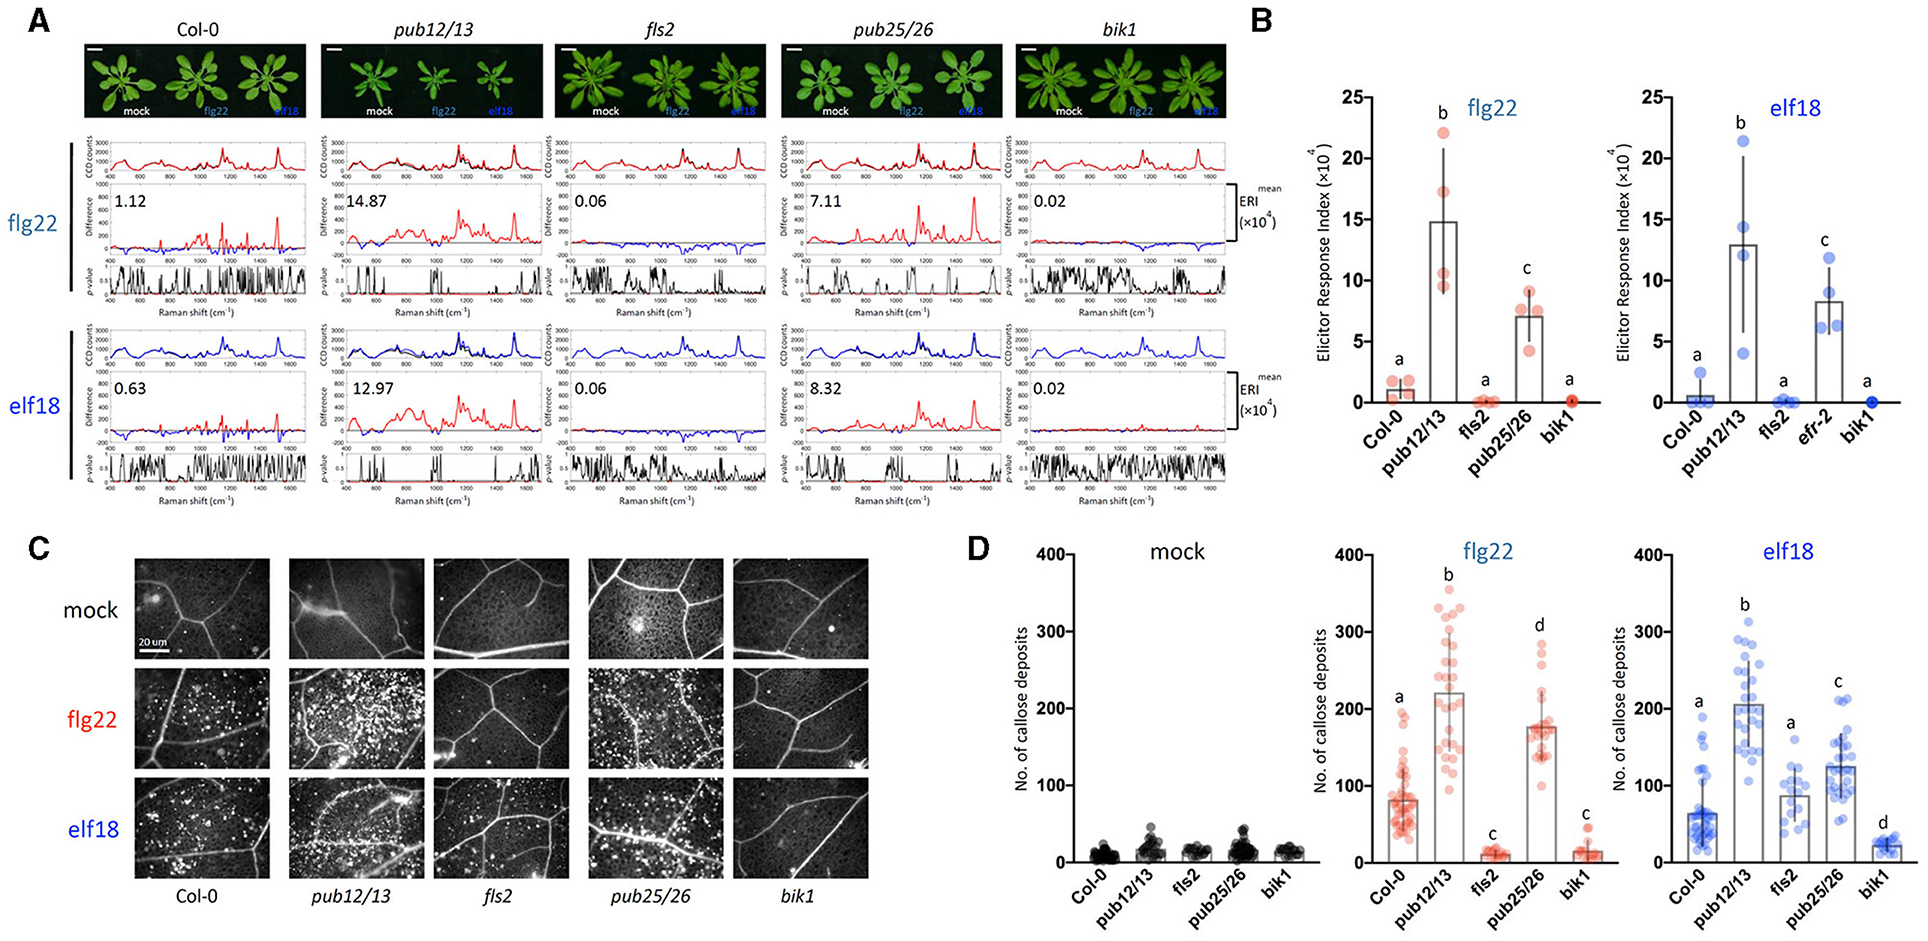
Figure 4. Raman spectroscopic analysis of WT and pub12pub13 and pub25pub26 double mutants. (A) Top panel: images of plants 10 hpi. For each elicitor experiment (flg22, red and elf18, blue), a group of three panels was shown. Raman spectra were acquired at 10 hpi with 1.0 μM flg22 (red peak) and elf18 (blue peak) treatment and mock control (black peak). Upper panel: a mean plot of all 60 spectra, taken from control (black) or the elicitor-treated samples (red, flg22 and blue, elf18); Middle panel: the difference spectrum between the mean spectrum of the elicitor-infiltrated sample and that of the H2O-infiltrated (mock) sample. Red indicates that the difference is a positive value, whereas blue indicates a negative value. The numbers inside the panel indicate average ERI values. Lower panel: a t-test was used to evaluate statistically significant differences between elicitor-infiltrated and H2O-infiltrated (mock) samples and the results were expressed as p-value. Red indicates p < 0.05. Plants: Col-0, WT A. thaliana; pub12pub13, U-box E3 ubiquitin ligase PUB12/13 (At2g28830 and At3g46510, respectively); fls2, FLAGELLIN-SENSING2 (At5g46330); pub25pub26, U-box E3 ubiquitin ligase PUB25/26 (At3g19380 and At1g49780, respectively); bik1, BOTRYTIS-INDUCED KINASE1 (At2g39660). Scale bars = 2 cm. (B) ERI of WT and mutants treated with either flg22 or elf18. The results show mean ERI values along with SD. Bars with different letters above are significantly different according to Fisher's least significant difference test (p < 0.05). Left: flg22 (red spots); Right, elf18 (blue spots). n = 4 independent biological replicates. (C) Representative images of callose deposits (bright spots) in the treated samples; Scale bars = 20 μm. (D) Quantification of callose deposits in WT (Col-0), pub12/13, fls2, pub25/26, and bik1 mutant leaves. The number of callose fluorescence spots was used to determine the number of callose deposits. Left: mock (black spots); Middle: flg22 (red spots); Right, elf18 (blue spots). The values shown are mean ± SD of 25–30 surveyed leaf regions. For each experiment, the number of callose deposits was measured in two infiltrated plants with about four to five leaf regions surveyed per plant. The value for each leaf region gives the number of callose deposits per 5,996 μm2. This gave a total of about 8–10 data points per experiment. The experiment was repeated with three independent biological samples. The graph shows an average value with n = 25–30. Bars with different letters above are significantly different according to Fisher's least significant difference test (p < 0.05).
The ERI values were evaluated based on the Raman spectrum analysis at 24 spots in 4 individual plants (2 leaf discs per plant) with 4 independent experiments giving a range of numbers between the high (>5 × 10⁴) and low (0.0–1.0 × 10⁴) level according to the PTI response (Figure 4B). These results confirmed the accuracy of the ERI indexing based on Raman spectral assay for determining PTI responses. Consistent with these analyses, the pub12/13 and pub25/26 mutant plants showed more callose deposits than WT and the two control mutants, fls2 and bik1 (Figures 4C,D).
Elucidation of Metabolic Changes Contributing Toward a High ERI Value at 24 hpi
Elicitor Response Index presents a quantitative and holistic measure of changes in the Raman spectra in elicitor-treated samples relative to mock control samples. In this case, we consider changes in the peak intensities for individual vibrational bands and consider the metabolites that give rise to these changes. For WT plants at 24 hpi, the majority of the Raman peaks that exhibit changes are common to both elicitor responses, flg22 and elf18. The difference spectra with annotated peaks are shown in Supplementary Figure 5. Table 1 summarizes the relevant vibrational bands (p < 0.05) for various elicitors, and the peak assignments are based on previously published reports. An increase in peak intensity at vibrational bands originating from carotenoids, pectin, phenylpropanoids, cellulose, lignin, and proteins is observed, which contributes toward a high ERI value seen at 24 hpi. Among these, the most prominent increase in peak intensity was associated with carotenoids. WT plants showed a significant increase in peak intensities at around 1,001, 1,151, and 1,521 cm−1 at 24 hpi for both the elicitors (Figure 5A). Peak intensities at 1,151 and 1,521 cm−1 were also increased in the case of receptor mutants treated with a heterologous elicitor (Figure 5A). These strong Raman peaks are attributed to carotenoids, and it is these molecules that exhibit the largest change in concentration. Previous reports have attributed peaks in the 1,100–1,200 and 1,400–1,600 cm−1 Raman shift regions to carotenoids (Payne and Kurouski, 2021). These peaks are due to in-phase carbon-carbon stretching vibrations of the main polyene chain with the exact Raman shift locations of these peaks being dependent on the polyene chain length. These results suggest that an early event in plant PTI response is likely an increase in carotenoid concentration, which contributes significantly toward a high ERI value. To confirm the Raman spectral results with regard to an increase in carotenoid concentration, we extracted the photosynthetic pigments (chlorophyll a, b, and carotenoids) from the treated leaves and measured changes in their content directly. The treatment of WT with elicitors produced a quantitative increase of more than 5% of total carotenoids. In the case of fls2 and efr-2 mutants, the carotenoid content was increased by 10% when challenged with heterologous elicitors (Figure 5B). The results are supported by increased expression of genes related to carotenoid biosynthesis at early time points of elicitor treatment (Supplementary Figure 6).
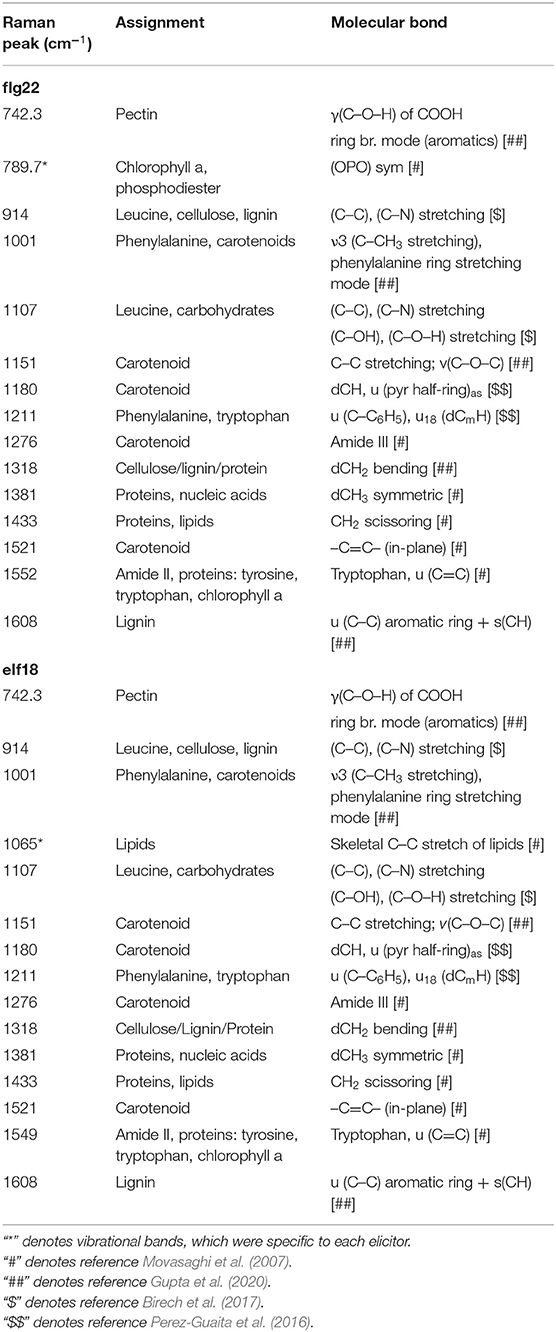
Table 1. Significant vibrational bands and their assignments that contributes to the high ERI value at 24 hrs following flg22 and elf18 treatment respectively.
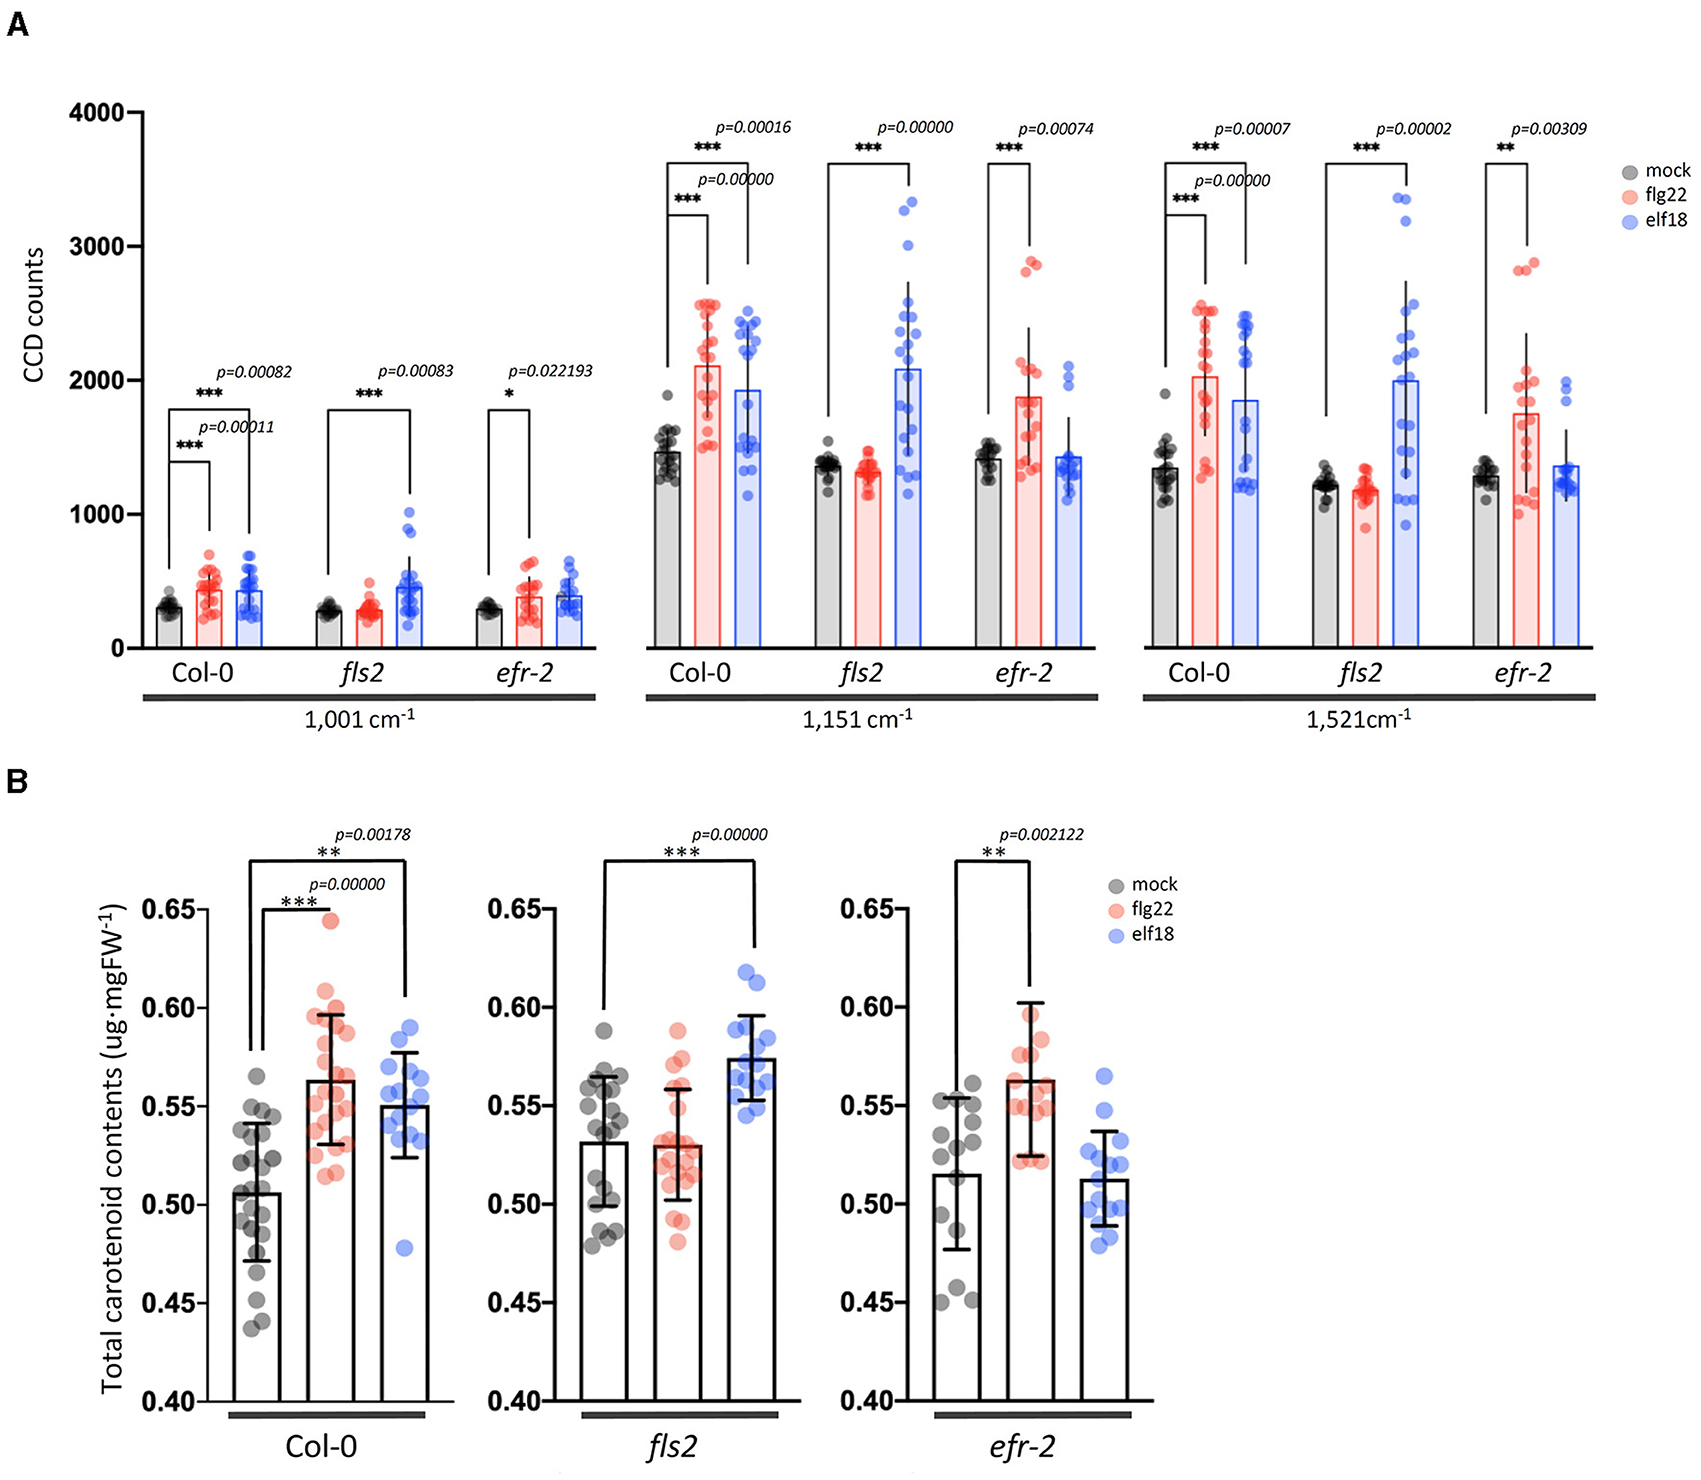
Figure 5. Changes in carotenoid levels in Arabidopsis leaf samples treated with an elicitor for 24 h. (A) Raman spectra of carotenoids from the leaves with mock and elicitor treatment for 24 h. Raman shifts at 1,001, 1,151, and 1,521 cm−1 are attributed to carotenoids. n = 3 independent biological samples. (B) Changes of total carotenoids levels in Arabidopsis leaves after treatment with mock control, flg22, and elf18 for 24 h (24 hpi). Carotenoid levels were determined as described in the “Materials and methods” section. The values shown are mean ± SD of the extracted total carotenoids. For each experiment, the quantitation of total carotenoids was measured in three to five infiltrated plants per experiment. The experiment was repeated with four independent biological samples, and this gave a total of about 15–20 data points. ** and *** significantly different from the mock control at p < 0.001 and p < 0.0001 (t-test), respectively.
Specific peaks that exhibit statistically significant changes for a particular elicitor were also observed. Only flg22 treatment in WT showed a statistically significant change in peak intensity at 789.7 cm−1. In the literature, this vibrational band region is typically associated with chlorophyll a and phosphodiester bonds (-O-P-O-) in DNA. elf18 treatment specifically resulted in changes for the Raman peak at 1,065 cm−1. This band is attributed to skeletal –C–C– stretching of lipids or C–O stretch of cell wall polysaccharides (Movasaghi et al., 2007).
The spread in Raman peak intensities that exhibited changes was further analyzed using histogram plots. It provides a better classification inference with high statistical significance. We found that the Raman shift at 1,521 cm−1 and the region between 1,549 and 1,552 cm−1 represent carotenoids and proteins (amino acid-tyrosine and tryptophan), respectively, and provide the best discriminating classification between mock and treated plants (Supplementary Figure 7). As the other two carotenoid Raman peaks (1,001 and 1,151 cm−1) are present in lower wavenumber regions where there is a significant spectral overlap from other biomolecules such as lipids and proteins, clear differentiation was not observed in these Raman peaks. The changes observed at 1,521 and between 1,549 and 1,552 cm−1 are the potential Raman spectral biomarkers, indicating a dynamic early PTI response in plants.
Raman Spectral Analysis of Pathogen-Infected Plants and Measuring the Infection Response Index
Pseudomonas syringae causes bacterial specks on Arabidopsis and induces chlorosis at later stages of infection (Whalen et al., 1991; Uppalapati et al., 2010; Luo et al., 2017). To see if Raman spectroscopy can be used to detect early Pseudomonas infection, we performed similar experiments in Arabidopsis infected with Pst DC3000. In these experiments, we estimated the Infection Response Index (IRI) using the same method as the ERI value. Similar to the elicitor study, the difference Raman spectrum between the infected and mock sample at 24 hpi exhibited high IRI values. The IRI value decreased to almost zero at 48 and 72 hpi (Figures 6A,C).
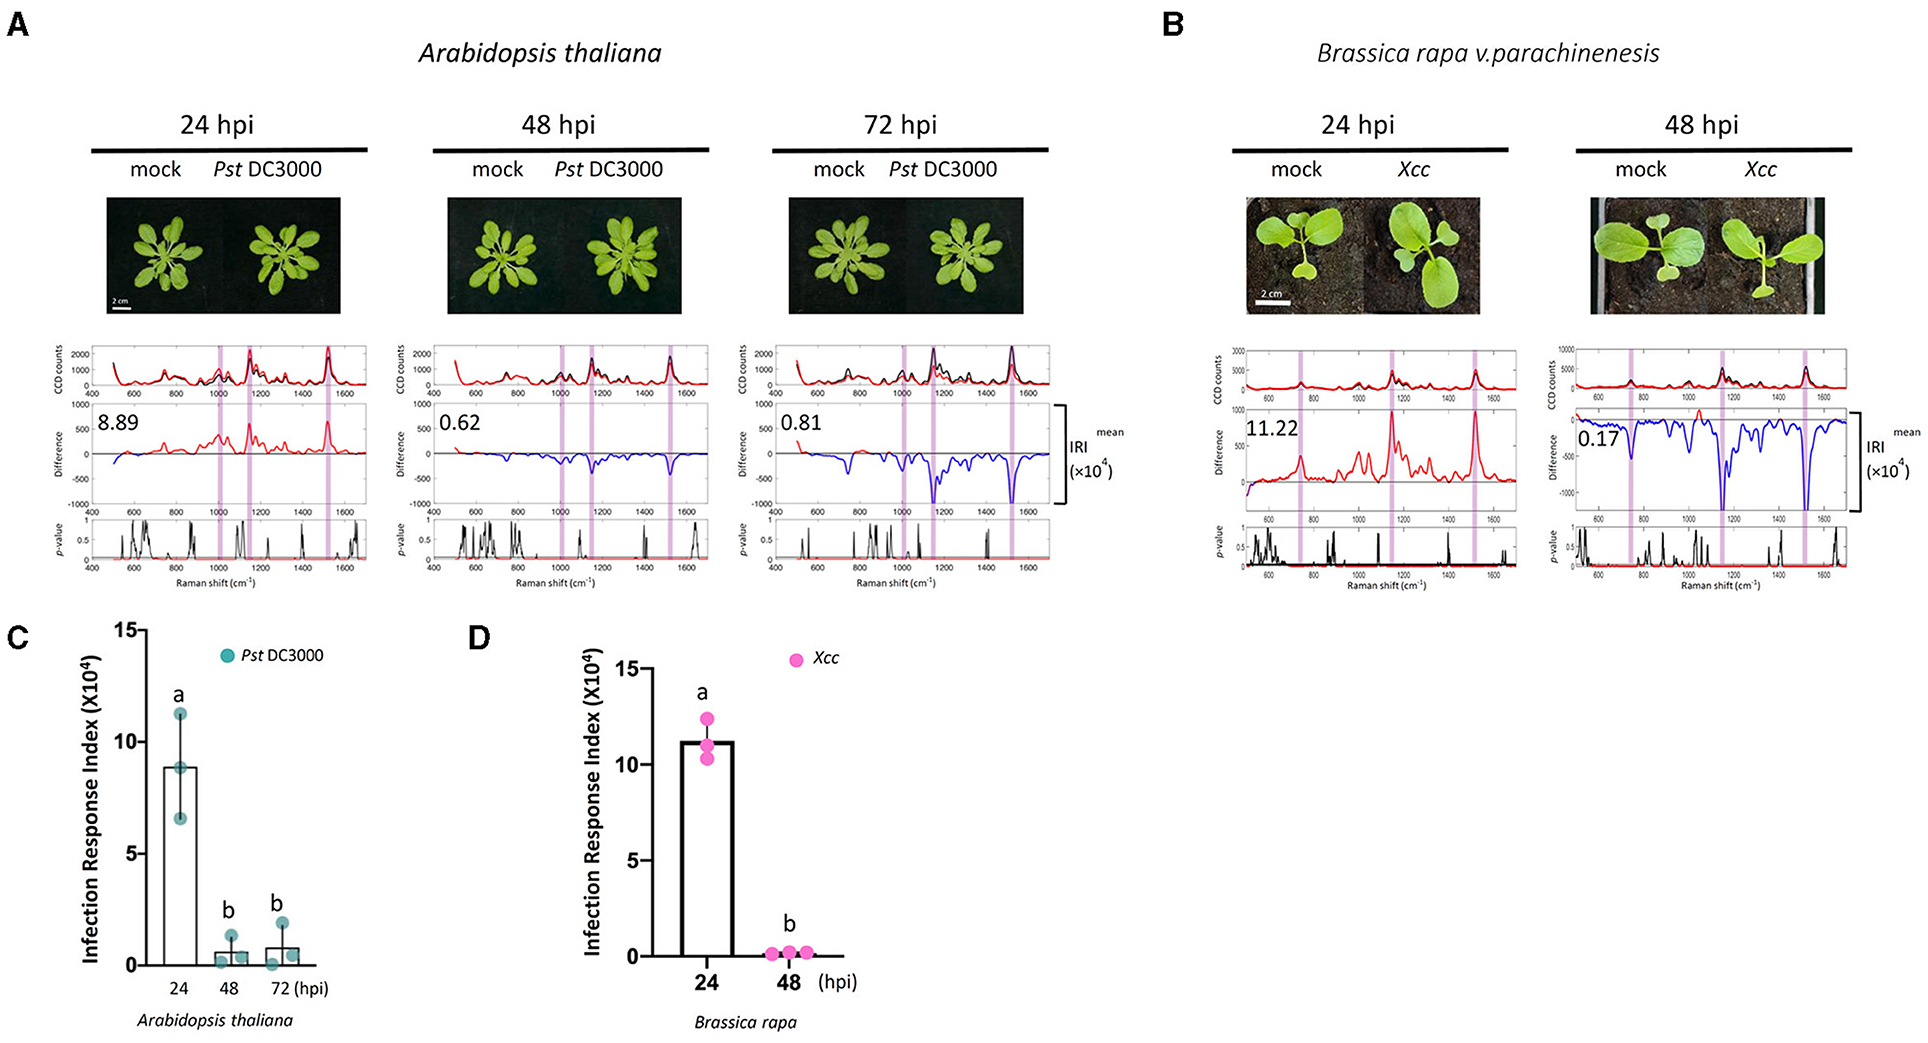
Figure 6. Raman spectra analysis of plants treated with pathogens. (A,B) Pathogens [Pseudomonas syringae pv. Tomato DC3000 (A); Xanthomonas campestris pv. Campestris (Xcc) (B)] were infiltrated with a needleless syringe into Arabidopsis and Choy Sum. Leaf samples taken from the PRs at 24, 48, and 72 hpi were analyzed by Raman spectroscopy. Upper panel: the mean spectra of control (black) and pathogen-treated samples (red). Middle panel: difference spectrum between the mean spectrum of the pathogen-treated sample vs. that of the mock-treated sample. Red indicates that the difference is a positive value, whereas blue indicates a negative value. The number inside the panel indicates the average Infection Response Index (IRI, ×104) value obtained from the three independent experiments. Lower panel: a t-test was used to evaluate statistically significant differences between pathogen- and mock-infiltrated samples and the results were expressed as p-value. Red indicates p < 0.05. (C,D) Changes in IRI after the time of infiltration. Left, P. syringae pv. Tomato DC3000 (green spots), n = 3 independent biological samples; Right, Xcc (purple spots), n = 3 independent biological samples. The results represent the average values of three independent biological experiments with SD. Bars with different letters above are significantly different according to Fisher's least significant difference test (p < 0.05).
To further validate the results observed in Arabidopsis in a crop plant, Xcc infection in Choy Sum was analyzed. Xcc causes Black rot disease, which is a serious problem in all Brassica vegetables resulting in significant yield losses. Typical external visible symptoms of Xcc infections are chlorosis and V-shaped lesions in the leaves (Meenu et al., 2013; Nuñez et al., 2018). Under our growth conditions, the characteristic visual symptoms of Xcc infection are seen within 4–5 days. Raman spectra were measured at 24 and 48 hpi from mock and Xcc infiltrated plants to detect spectral changes before the appearance of symptoms. Like Arabidopsis, the difference Raman spectrum between the infected and mock sample at 24 hpi exhibited high IRI values, which decline at 48 hpi (Figures 6B,D). Similar to the Arabidopsis elicitor experiments, callose deposition was also observed in the Xcc-infected leaves at 24 hpi (Supplementary Figure 8A).
The vibrational bands contributing toward a high IRI value in Arabidopsis and Choy Sum were largely similar and resembled the ERI spectral data (Table 2; Supplementary Figure 9). Like the elicitor treatment, the most dominant changes upon bacterial infection in Arabidopsis and Choy sum were observed around 1,001, 1,151, and 1,521 cm−1, which are attributed to carotenoids (Supplementary Figure 8B). Apart from carotenoids, increase in peak intensities at vibrational bands originating from pectin, phenylpropanoids, cellulose, nitrates, nucleic acids and proteins were the dominant contributors towards the high IRI value. A significant change at 1,253 cm−1 peak intensity was seen only in P. syringae-infected Arabidopsis, which is associated with proteins and lipids (C–N in-plane stretching), whereas Xcc-infected Choy sum showed changes at 791.8 cm−1 attributed to nucleic acid phosphodiester bond, which were not observed in Arabidopsis infection. As observed with the elicitor study, the Raman shift at 1,521 cm−1 and the region between 1,549 and 1,552 cm−1 provide the best classification between mock and infected plants.
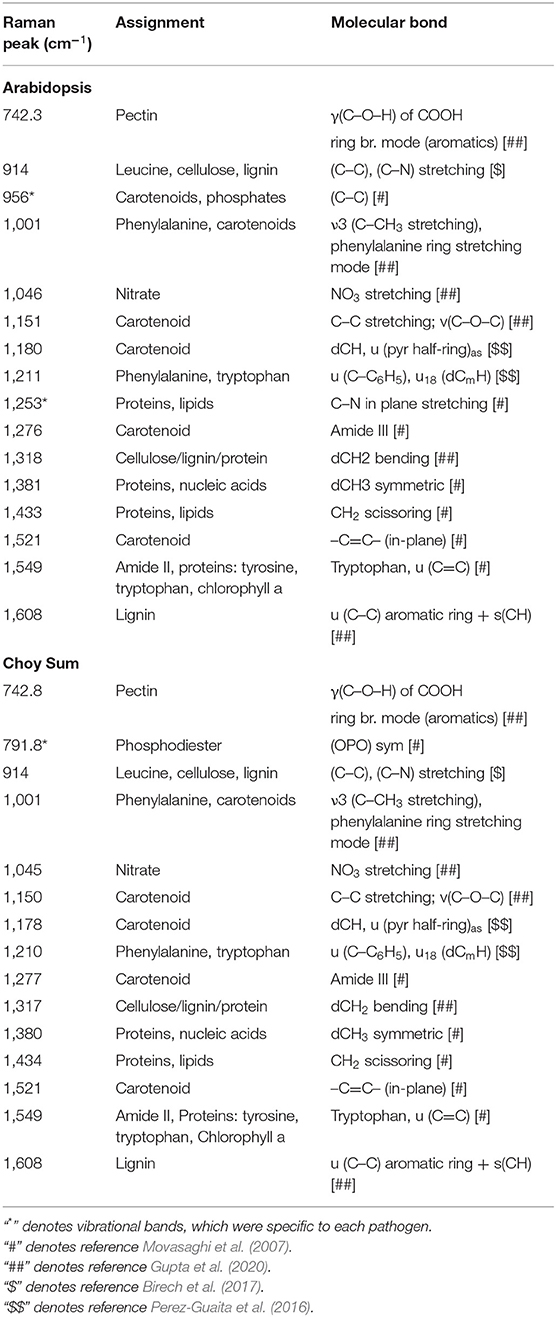
Table 2. Significant vibrational bands and their assignments that contributes to the high IRI value at 24 hrs following Pseudomonas syringae and Xcc infection in Arabidopsis and Choy Sum respectively.
Discussion
In this study, we have provided evidence that the infiltration of WT Arabidopsis leaves with an elicitor result in reproducible changes in the Raman spectra acquired from the leaf region proximal to the site of elicitor infiltration, indicating that the Raman spectral changes are associated with PTI response (Figures 1, 2).
The difference Raman spectrum between the elicitor-treated and mock-treated leaf shows clear and reproducible changes in the Raman shift from about 800 to 1,600 cm−1. These changes are remarkably similar in plants of various genotypes when a positive PTI is expected. Using statistical methods and employing a simple mathematical formula, we arrived at the ERI, which provides a quantitative measure of the degree of PTI as determined by the difference Raman spectrum (Supplementary Figure 2). Our results showed that upon the treatment with 1 μM flg22 the ERI value at 10 hpi was 1.12 × 10⁴, which increased about 8 times by 24 hpi. Similar results were obtained using elf18 (Figures 3, 4).
The physiological significance of the difference Raman spectrum and the ERI values obtained with WT plants is further strengthened by analysis with several Arabidopsis mutants that are deficient in PRRs and downstream signaling components. The mutants that are defective in the positive regulation of PTI response show low ERI values (< 1 × 10⁴), whereas the mutants that are hyperresponsive to elicitor treatment display high ERI values at an earlier time point. This indicates that the ERI values can be used as a potential measurement of an active and robust PTI response in plants.
An examination of the difference Raman spectrum obtained from elicitor/pathogen studies uncovered a significant increase in peak intensity in spectral regions as denoted in Tables 1, 2. The changes in Raman peaks contributing toward the high ERI or high IRI value at 24 h with both the elicitor and pathogens are largely identical, indicating that metabolome changes triggered by elicitors and pathogen are similar. A difference in the magnitude of the IRI factor between Arabidopsis and Choy Sum can be expected because different pathogens can trigger varied immune responses.
The most significant increase in peak intensity under all types of elicitor/pathogen treatment was observed at 1,001, 1,151, and 1,521 cm−1, which correspond to the characteristic bands attributed to carotenoids (Baranski et al., 2005; Schulz et al., 2005; Lorenz et al., 2017). These results suggest that there is a transient increase in the carotenoid upon elicitor treatment or infection. A transient carotenoid increase as an early event of PTI has not been previously reported, and its physiological significance remains unclear at this point. Recent research has shown that carotenoids are constantly being synthesized and also degraded to produce other derivatives (Beisel et al., 2010). Apocarotenoids are produced by oxidative cleavage of carotenoids either catalyzed by carotenoid cleavage dioxygenases (CCDs) or by non-enzymatic processes. New studies are unraveling the functions of apocarotenoids in plant development and stress response. Important plant apocarotenoids include phytohormones such as abscisic acid (ABA) and strigolactones and signaling metabolites like β-cyclocitral (Felemban et al., 2019). In plants, phytohormone ABA (Supplementary Figure 6) plays a role in abiotic/biotic stress response (Jia et al., 2017). A gene analysis showed that the expression levels of NCED, which encodes the rate-limiting enzyme for ABA biosynthesis, are highly elevated 3–6 hpi by either elicitor. The expression levels of various CCD genes are also found to be altered by elicitor treatment (Supplementary Figure 6). This result is consistent with the notion that the transiently increased carotenoids are subsequently fragmented and modified to produce ABA and other derivatives.
In addition to carotenoids, Raman spectral changes implicate a transient increase in metabolites like pectin, phenylpropanoids, cellulose, nitrates, lignin, nucleic acid, and proteins to be involved in early PTI response. A previous study, which evaluated metabolic changes associated with P. syringae infection in Arabidopsis at different time points, observed the changes as early as 8 hpi. The major metabolic pathways perturbed upon infection were phenylpropanoid/lignins, tryptophan/indolic glucosinolates/nicotinic acid, methionine/aliphatic glucosinolates, purine/riboflavin/folate, and urea cycle/polyamine/proline metabolic pathways. Other pathways found to be affected by infection include carotenoid metabolism, chlorophyll degradation, and nonaromatic amino acid metabolism (Ward et al., 2010). The Raman spectral analysis also indicates changes in similar metabolites upon infection in Arabidopsis. Along with carotenoids, the changes between 1,549 and 1,552 cm−1 regions were found to discriminate between the mock and infected plants with high statistical significance. This vibration band is associated with Amide II (C=N and N–H stretch): mainly proteins, tyrosine, and tryptophan (Movasaghi et al., 2007). Ward et al. (2010) in their study found that amino acids, tryptophan, and tyrosine are significantly increased in abundance by 12 hpi with P. syringae in Arabidopsis. Our study also identified the genes involved in tryptophan metabolism altered by elicitor treatment (Supplementary Figure 1). The Raman shift was observed at 1,549 and 1,552 cm−1 under elicitation, and infection probably reflects an increase in the abundance of tryptophan and tyrosine.
Several groups have used Raman spectroscopy to analyze a number of crop plants infected with bacterial, fungal, and viral pathogens, and, in most cases, a decrease in carotenoid was consistently seen; however, a decrease in carotenoid has also been observed with abiotic stresses. We too have previously detected a decrease in carotenoid contents in the leaf blades and petioles of Arabidopsis with shade avoidance syndrome (SAS) using Raman spectroscopy (Altangerel et al., 2017; Sng et al., 2020). By contrast, we found that a transient increase in carotenoids is an early event in PTI. We note that the carotenoid increase detected in our study occurs at about 10–24 h upon receptor activation before the manifestation of any disease symptoms. By contrast, in most of the previous works, the Raman spectra were taken with plants likely to be several days after pathogen infection as the tissues were already showing disease symptoms.
Plant diseases are known to be a major factor compromising crop yield worldwide (Velásquez et al., 2018; Savary et al., 2019), and the early detection of pathogen infection can greatly facilitate disease management. The use of ERI as a diagnostic Raman signature for early PTI will provide an important tool for the identification of plants with early pathogen infection and for facilitating effective disease management. The availability of a high-throughput custom-made portable or hand-held Raman spectrometer (Farber and Kurouski, 2018; Krimmer et al., 2019; Sanchez et al., 2019) would allow the Raman spectral analysis to be performed directly with field-grown crops in a noninvasive manner, and our group is currently developing such systems (Gupta et al., 2020).
Data Availability Statement
The raw data supporting the conclusions of this article will be made available by the authors, without undue reservation.
Author Contributions
PC, GS, JS, RR, RS, and N-HC designed the experiments. PC, H-ZM, PD, GS, C-HH, and SK executed the experiments. PC and GS generated scripts for analysis using the MATLAB software. All authors participated in the interpretation and discussion of results. PC, GS, RR, RS, and N-HC wrote the manuscript. All authors contributed to the article and approved the submitted version.
Funding
This research was supported by the National Research Foundation (NRF), Primer Minister's Office, Singapore under its Campus for Research Excellence and Technological Enterprise (CREATE) program. The Disruptive and Sustainable Technology for Agricultural Precision (DiSTAP) is an Interdisciplinary Research Group (IRG) of the Singapore MIT Alliance for Research and Technology Centre (SMART).
Conflict of Interest
The authors declare that the research was conducted in the absence of any commercial or financial relationships that could be construed as a potential conflict of interest.
Publisher's Note
All claims expressed in this article are solely those of the authors and do not necessarily represent those of their affiliated organizations, or those of the publisher, the editors and the reviewers. Any product that may be evaluated in this article, or claim that may be made by its manufacturer, is not guaranteed or endorsed by the publisher.
Acknowledgments
We thank Jian-Min Zhou (Chinese Academy of Sciences, Chinese) and Libo Shan (Texas A&M University, USA) for kindly providing pub25pub26 and pub12pub13 mutants. We also thank Kevin Junliang Lim (WIL@NUS, Singapore) for help in creating the ERI formula.
Supplementary Material
The Supplementary Material for this article can be found online at: https://www.frontiersin.org/articles/10.3389/fpls.2021.746586/full#supplementary-material
References
Abdul Malik, N. A., Kumar, I. S., and Nadarajah, K. (2020). Elicitor and receptor molecules: Orchestrators of plant defense and immunity. Int. J. Mol. Sci. 21:963. doi: 10.3390/ijms21030963
Altangerel, N., Ariunbold, G. O., Gorman, C., Alkahtani, M. H., Borrego, E. J., Bohlmeyer, D., et al. (2017). In vivo diagnostics of early abiotic plant stress response via Raman spectroscopy. PNAS 114, 3393–3396. doi: 10.1073/pnas.1701328114
Ausubel, F. M. (2005). Are innate immune signaling pathways in plants and animals conserved? Nat. Immunol. 6, 973–979. doi: 10.1038/ni1253
Baranski, R., Baranska, M., and Schulz, H. (2005). Changes in carotenoid content and distribution in living plant tissue can be observed and mapped in situ using NIR-FT-Raman spectroscopy. Planta 222, 448–457. doi: 10.1007/s00425-005-1566-9
Beisel, K. G., Jahnke, S., Hofmann, D., Köppchen, S., Schurr, U., and Matsubara, S. (2010). Continuous turnover of carotenes and chlorophyll a in mature leaves of Arabidopsis revealed by 14CO2 pulse-chase labeling. Plant Physiol. 152, 2188–2199. doi: 10.1104/pp.109.151647
Bektas, Y., and Eulgem, T. (2015). Synthetic plant defense elicitors. Front. Plant Sci. 5:804. doi: 10.3389/fpls.2014.00804
Belkhadir, Y., Jaillais, Y., Epple, P., Balsemão-Pires, E., Dangl, J. L., and Chory, J. (2012). Brassinosteroids modulate the efficiency of plant immune responses to microbe-associated molecular patterns. Proc. Natl. Acad. Sci. USA 109, 297–302. doi: 10.1073/pnas.1112840108
Bigeard, J., Colcombet, J., and Hirt, H. (2015). Signaling mechanisms in pattern-triggered immunity (PTI). Mol. Plant 8, 521–539. doi: 10.1016/j.molp.2014.12.022
Birech, Z., Mwangi, P. W., Bukachi, F., and Mandela, K. M. (2017). Application of Raman spectroscopy in type 2 diabetes screening in blood using leucine and isoleucine amino-acids as biomarkers and in comparative anti-diabetic drugs efficacy studies. PLoS ONE 12:e0185130. doi: 10.1371/journal.pone.0185130
Chaudhary, R., Atamian, H. S., Shen, Z., Briggs, S. P., and Kaloshian, I. (2014). GroEL from the endosymbiont Buchnera aphidicola betrays the aphid by triggering plant defense. Proc. Natl. Acad. Sci. USA. 111, 8919–8924. doi: 10.1073/pnas.1407687111
Chinchilla, D., Bauer, Z., Regenass, M., Boller, T., and Felix, G. (2006). The Arabidopsis receptor kinase FLS2 binds flg22 and determines the specificity of flagellin perception. Plant Cell 18, 465–476. doi: 10.1105/tpc.105.036574
Creely, C. M., Singh, G. P., and Petrov, D. (2005). Dual wavelength optical tweezers for confocal Raman spectroscopy. Opt. Commun. 245, 465–470. doi: 10.1016/j.optcom.2004.10.011
Daudi, A., Cheng, Z., O'Brien, J. A., Mammarella, N., Khan, S., Ausubel, F. M., et al. (2012). The apoplastic oxidative burst peroxidase in Arabidopsis is a major component of pattern-triggered immunity. Plant Cell 24, 275–287. doi: 10.1105/tpc.111.093039
Dong, O. X., and Ronald, P. C. (2019). Genetic engineering for disease in plants: Recent progress and future perspectives. Plant Physiol. 180, 26–38. doi: 10.1104/pp.18.01224
Egging, V., Nguyen, J., and Kurouski, D. (2018). Detection and identification of fungal infections in intact wheat and sorghum grain using a hand-held Raman spectrometer. Anal. Chem. 90, 8616–8621. doi: 10.1021/acs.analchem.8b01863
Fang, Y., and Ramasamy, R. P. (2015). Current and prospective methods for plant disease detection. Biosensors 4, 537–561. doi: 10.3390/bios5030537
Farber, C., Bryan, R., Paetzold, L., Rush, C., and Kurouski, D. (2020a). Non-invasive characterization of single-, double-, and triple-viral diseases of wheat with a hand-held Raman spectrometer. Front. Plant Sci. 11:01300. doi: 10.3389/fpls.2020.01300
Farber, C., and Kurouski, D. (2018). Detection and identification of plant pathogens in maize kernels with a hand-held Raman spectrometer. Anal. Chem. 90, 3009–3012. doi: 10.1021/acs.analchem.8b00222
Farber, C., Sanchez, L., Rizevsky, S., Ermolenkov, A., McCutchen, B., Cason, J., et al. (2020b). Raman spectroscopy enables non-invasive identification of peanut genotypes and value-added traits. Sci. Rep. 10:7730. doi: 10.1038/s41598-020-64730-w
Farber, C., Shires, M., Ong, K., Byrne, D., and Kurouski, D. (2019). Raman spectroscopy as an early detection tool for rose rosette infection. Planta 250, 1247–1254. doi: 10.1007/s00425-019-03216-0
Farmer, E. E., Mousavi, S., and Lenglet, A. (2013). Leaf numbering for experiments on long distance signaling in Arabidopsis. Prot. Exchange. doi: 10.1038/protex.2013.071
Felemban, A., Braguy, J., Zurbriggen, M. D., and Al-Babili, S. (2019). Apocarotenoids involved in plant development and stress response. Front. Plant Sci. doi: 10.3389/fpls.2019.01168
Gupta, S., Huang, C. H., Singh, G. P., Park, B., Chua, N. H., and Ram, R. J. (2020). Portable Raman leaf-clip sensor for rapid detection of plant stress. Sci. Rep. 10:20206. doi: 10.1038/s41598-020-76485-5
Huang, C. H., Singh, G. P., Park, S. H., Chua, N. H., Ram, R. J., and Park, B. S. (2020). Early diagnosis and management of nitrogen deficiency in plants utilizing Raman spectroscopy. Front. Plant Sci. 11:663. doi: 10.3389/fpls.2020.00663
Jaillais, Y., Belkhadir, Y., Balsemão-Pires, E., Dangl, J. L., and Chory, J. (2011). Extracellular leucine-rich repeats as a platform for receptor/coreceptor complex formation. Proc. Natl. Acad. Sci. USA. 108, 8503–8507. doi: 10.1073/pnas.1103556108
Jia, K. P., Baz, L., and Al-Babili, S. (2017). From carotenoids to strigolactones. J. Exp. Bot. 69, 2189–2204. doi: 10.1093/jxb/erx476
Jones, J. D. G., and Dangl, J. L. (2006). The plant immune system. Nature 444, 323–329. doi: 10.1038/nature05286
Krimmer, M., Farber, C., and Kurouski, D. (2019). Rapid and noninvasive typing and assessment of nutrient content of maize kernels using a handheld Raman spectrometer. ACS Omega 4, 16330–16335. doi: 10.1021/acsomega.9b01661
Kurenda, A., Nguyen, C. T., Chételat, A., Stolz, S., and Farmer, E. E. (2019). Insect-damaged Arabidopsis moves like wounded Mimosa pudica. Proc. Natl. Acad. Sci. USA. 116, 26066–26071. doi: 10.1073/pnas.1912386116
Kutschera, A., Dawid, C., Gisch, N., Schmid, C., Raasch, L., Gerster, T., et al. (2019). Bacterial medium-chain 3-hydroxy fatty acid metabolites trigger immunity in Arabidopsis plants. Science 364, 178–181. doi: 10.1126/science.aau1279
Li, J., and Staiger, C. J. (2018). Understanding cytoskeletal dynamics during the plant immune response. Annu. Rev. Phytopathol. 56, 513–533. doi: 10.1146/annurev-phyto-080516-035632
Lieber, C. A., and Mahadevan-Jansen, A. (2003). Automated method for subtraction of fluorescence from biological Raman spectra. Appl. Spectrosc. 57, 1363–1367. doi: 10.1366/000370203322554518
Lorenz, B., Wichmann, C., Stöckel, S., Rösch, P., and Popp, J. (2017). Cultivation-free Raman spectroscopic investigations of bacteria. Trends Microbiol. 25, 413–424. doi: 10.1016/j.tim.2017.01.002
Lu, D., Lin, W., Gao, X., Wu, S., Cheng, C., Avila, J., et al. (2011). Direct ubiquitination of pattern recognition receptor FLS2 attenuates plant innate immunity. Science 332, 1439–1442. doi: 10.1126/science.1204903
Lu, X., Tintor, N., Mentzel, T., Kombrink, E., Boller, T., Robatzek, S., et al. (2009). Uncoupling of sustained MAMP receptor signaling from early outputs in an Arabidopsis endoplasmic reticulum glucosidase II allele. Proc. Natl. Acad. Sci. USA. 106, 22522–22527. doi: 10.1073/pnas.0907711106
Luna, E., Pastor, V., Robert, J., Flors, V., Mauch-Mani, B., and Ton, J. (2011). Callose deposition: a multifaceted plant defense response. Mol. Plant-Microbe Int. 24, 183–193. doi: 10.1094/MPMI-07-10-0149
Luo, Q., Liu, W. W., Pan, K. D., Peng, Y. L., and Fan, J. (2017). Genetic interaction between Arabidopsis Qpm3.1 locus and bacterial effector gene hopW1-1 underlies natural variation in quantitative disease resistance to Pseudomonas infection. Front. Plant Sci. 8:695. doi: 10.3389/fpls.2017.00695
Mandrile, L., Rotunno, S., Miozzi, L., Vaira, A. M., Giovannozzi, A. M., Rossi, A. M., et al. (2019). Nondestructive Raman spectroscopy as a tool for early detection and discrimination of the infection of tomato plants by two economically important viruses. Anal. Chem. 91, 9025–9031. doi: 10.1021/acs.analchem.9b01323
Martinelli, F., Scalenghe, R., Davino, S., Panno, S., Scuderi, G., Ruisi, P., et al. (2015). Advanced methods of plant disease detection. A review. Agron. Sustain. Dev. 35, 1–25. doi: 10.1007/s13593-014-0246-1
Meenu, G., Amit, V., and Narender, B. (2013). Black rot-A devastating disease of crucifers: a review. Agric. Rev. 34, 269–278. doi: 10.5958/j.0976-0741.34.4.012
Misra, A. K. (2014). Climate change and challenges of water and food security. Int. J. Sustain. Built Environ. 3, 153–165. doi: 10.1016/j.ijsbe.2014.04.006
Movasaghi, Z., Rehman, S., and Rehman, I. U. (2007). Raman spectroscopy of biological tissues. Appl. Spectrosc. Rev. 42, 493–541. doi: 10.1080/05704920701551530
Nuñez, A. M. P., Rodríguez, G. A. A., Monteiro, F. P., Faria, A. F., Silva, J. C. P., Monteiro, A. C. A., et al. (2018). Bio-based products control black rot (Xanthomonas campestris pv. campestris) and increase the nutraceutical and antioxidant components in kale. Sci. Rep. 8, 1–11. doi: 10.1038/s41598-018-28086-6
Oerke, E. C. (2006). Crop losses to pests. J. Agric. Sci. 144, 31–43. doi: 10.1017/S0021859605005708s
Park, B. S., Yao, T., Seo, J. S., Wong, E. C. C., Mitsuda, N., Huang, C. H., et al. (2018). Arabidopsis nitrogen limitation adaptation regulates ORE1 homeostasis during senescence induced by nitrogen deficiency. Nat. Plants 4, 898–903. doi: 10.1038/s41477-018-0269-8
Payne, W. Z., and Kurouski, D. (2021). Raman-based diagnostics of biotic and abiotic stresses in plants. A review. Front Plant Sci. 11:616672. doi: 10.3389/fpls.2020.616672
Peng, Y., van Wersch, R., and Zhang, Y. (2018). Convergent and divergent signaling in PAMP-triggered immunity and effector-triggered immunity. Mol. Plant-Microbe Interac. 31, 403–409. doi: 10.1094/MPMI-06-17-0145-CR
Perez-Guaita, D., Kochan, K., Martin, M., Andrew, D., Heraud, P., Richards, J., et al. (2016). Multimodal vibrational imaging of cells. Vib. Spectrosc. 91, 46–58. doi: 10.1016/j.vibspec.2016.07.017
Rufián, J. S., Rueda-Blanco, J., Beuzón, C., and Ruiz-Albert, J. (2019). Protocol: an improved method to quantify activation of systemic acquired resistance (SAR). Plant Methods 15:16. doi: 10.1186/s13007-019-0400-5
Rys, M., Juhász, C., Surówka, E., Janeczko, A., Saja, D., Tóbiás, I., et al. (2014). Comparison of a compatible and an incompatible pepper-tobamovirus interaction by biochemical and non-invasive techniques: chlorophyll a fluorescence, isothemal calorimetry and FT0-Raman spectroscopy. Plant Physiol. Biochem. 83, 267–278. doi: 10.1016/j.plaphy.2014.08.013
Saijo, Y., Loo, E. P. L., and Yasuda, S. (2018). Pattern recognition receptors and signaling in plant–microbe interactions. Plant J. 93, 592–613. doi: 10.1111/tpj.13808
Sanchez, L., Ermolenkov, A., Biswas, S., Septiningsih, E. M., and Kurouski, D. (2020a). Raman spectroscopy enables non-invasive and confirmatory diagnostics of salinity stresses, nitrogen, phosphorus, and potassium deficiencies in rice. Front. Plant Sci. 11:573321. doi: 10.3389/fpls.2020.573321
Sanchez, L., Ermolenkov, A., Tang, X. T., Tamborindeguy, C., and Kurouski, D. (2020b). Non-invasive diagnostic of Liberibacter disease on tomatoes using a hand-held Raman spectrometer. Planta 251:64. doi: 10.1007/s00425-020-03359-5
Sanchez, L., Pant, S., Mandadi, K., and Kurouski, D. (2020c). Raman spectroscopy vs quantitative polymerase chain reaction in early stage Huanglongbing Diagnostics. Sci. Rep. 10:10101. doi: 10.1038/s41598-020-67148-6
Sanchez, L., Pant, S., Xing, Z., Mandadi, K., and Kurouski, D. (2019). Rapid and noninvasive diagnostics of huanglongbing and nutrient deficits in citrus trees with a handheld Raman spectrometer. Anal. Bioanal. Chem. 411, 3125–3133. doi: 10.1007/s00216-019-01776-4
Savary, S., Willocquet, L., Pethybridge, S. J., Esker, P., McRoberts, N., and Nelson, A. (2019). The global burden of pathogens and pests on major food crops. Nat. Ecol. Evol. 3, 430–439. doi: 10.1038/s41559-018-0793-y
Schneider, C. A., Rasband, W. S., and Eliceiri, K. W. (2012). NIH Image to ImageJ: 25 years of image analysis. Nat. Methods 9, 671–675. doi: 10.1038/nmeth.2089
Schulz, H., Baranska, M., and Baranski, R. (2005). Potential of NIR-FT-Raman spectroscopy in natural carotenoid analysis. Biopolymers 77, 212–221. doi: 10.1002/bip.20215
Seo, J. S., Diloknawarit, P., Park, B. S., and Chua, N. H. (2019). ELF18-induced long noncoding RNA1 evicts fibrillarin from mediator subunit to enhance pathogenesis-related gene1 (PR1) expression. New Phytol. 221:2067–2079. doi: 10.1111/nph.15530
Smith, J. M., Leslie, M. E., Robinson, S. J., Korasick, D. A., Zhang, T., Backues, S. K., et al. (2014). Loss of Arabidopsis thaliana dynamic-related protein 2B reveals separation of innate immune signaling pathway. PLoS Pathogens 10:e1004578. doi: 10.1371/journal.ppat.1004578
Sng, B. J. R., Singh, G. P., Van Vu, K., Chua, N. H., Ram, R. J., and Jang, I. C. (2020). Rapid metabolite response in leaf blade and petiole as a marker for shade avoidance syndrome. Plant Method 16:144. doi: 10.1186/s13007-020-00688-0
Sumanta, N., Haque, C. I., Nishika, J., and Suprakash, R. (2014). Spectrophotometric analysis of chlorophylls and carotenoids from commonly growth fern species by using various extracting solvents. Res. J. Chem. Sci. 4, 63–69. doi: 10.1055/s-0033-1340072
Sun, Y., Li, L., Macho, A. P., Han, Z., Hu, Z., Zipfel, C., et al. (2013). Structural basis for flg22-induced activation of the Arabidopsis FLS2-BAK1 immune complex. Science 342, 624–628. doi: 10.1126/science.1243825
Ton, J., Jakab, G., Toquin, V., Flors, V., Iavicoli, A., Maeder, M. N., et al. (2005). Dissecting the β-aminobutyric acid-induced priming phenomenon in Arabidopsis. Plant Cell 17, 987–999. doi: 10.1105/tpc.104.029728
Uppalapati, S. R., Ishiga, Y., Ryu, C. M., Ishiga, T., Wang, K., Noël, L. D., et al. (2010). SGT1 contributes to coronatine signaling and Pseudomonas syringae pv. tomato disease symptom development in tomato and Arabidopsis. New Phytol. 189:83–93. doi: 10.1111/j.1469-8137.2010.03470.x
van Esse, H. P., Reuber, T. L., and van der Does, D. (2020). Genetic modification to improve disease resistance in crop. New Phytol. 225, 70–86. doi: 10.1111/nph.15967
Velásquez, A., Castroverde, C. D. M., and He, S. Y. (2018). Plant and pathogen warfare under changing climate conditions. Curr. Biol. 28, 619–634. doi: 10.1016/j.cub.2018.03.054
Wang, J., Grubb, L. E., Wang, J., Liang, X., Li, L., Gao, C., et al. (2018). A regulatory module controlling homeostasis of a plant immune kinase. Mol. Cell 69, 493–504. doi: 10.1016/j.molcel.2017.12.026
Ward, J. L., Forcat, S., Beckmann, M., Bennett, M., Miller, S. J., Baker, J. M., et al. (2010). The metabolic transition during disease following infection of Arabidopsis thaliana by Pseudomonas syringae pv. tomato. Plant J. 63, 443–457. doi: 10.1111/j.1365-313X.2010.04254.x
Whalen, M. C., Innes, R. W., Bent, A. F., and Staskawicz, B. J. (1991). Identification of Pseudomonas syringae pathogens of Arabidopsis and a bacterial locus determining avirulence on both Arabidopsis and soybean. Plant Cell. 3:49–59. doi: 10.1105/tpc.3.1.49
Yeturu, S., Jentzsch, P. V., Ciobotă, V, Guerrero, R., Garrido, P., and Ramos, L. A. (2016). Handheld Raman spectroscopy for the dearly detection of plant diseases: abutilon mosaic virus infecting Abutilon Sp. Anal. Methods 8, 3450–3457. doi: 10.1039/C6AY00381H
Yu, X., Feng, B., He, P., and Shan, L. (2017). From chaos to harmony: responses and signaling upon microbial pattern recognition. Annu. Rev. Phytopathol. 55, 109–137. doi: 10.1146/annurev-phyto-080516-035649
Zhang, J., Li, W., Xiang, T., Liu, Z., Laluk, K., Ding, X., et al. (2010). Receptor-like cytoplasmic kinases integrate signaling from multiple plant immune receptors and are targeted by a Pseudomonas syringe effector. Cell Host Microbe 7, 290–301. doi: 10.1016/j.chom.2010.03.007
Zhou, J., Liu, D., Wang, P., Ma, X., Lin, W., Chen, S., et al. (2018). Regulation of Arabidopsis brassinosteroid receptor BRI1 endocytosis and degradation by plant U-box PUB12/PUB13-mediated ubiquitination. Proc. Natl. Acad. Sci. USA. 115, 1906–1915. doi: 10.1073/pnas.1712251115
Zhou, J., Lu, D., Xu, G., Finlayson, S. A., He, P., and Shan, L. (2015). The dominant negative ARM domain uncover multiple functions of PUB13 in Arabidopsis immunity, flowering, and senescence. J. Exp. Bot. 66, 3353–3366. doi: 10.1093/jxb/erv148
Zhou, M., and Wang, W. (2018). Recent advances in synthetic chemical inducers of plant immunity. Front. Plant Sci. 9:1613. doi: 10.3389/fpls.2018.01613
Zipfel, C., Kunze, G., Chinchilla, D., Caniard, A., Jones, J. D. G., Boller, T., et al. (2006). Perception of the bacterial PAMP EF-Tu by the receptor EFR restricts Agrobacterium-mediated transformation. Cell 125, 749–760. doi: 10.1016/j.cell.2006.03.037
Keywords: Arabidopsis, carotenoids, elf18, flg22, pathogen-associated molecular pattern (PAMP), Raman spectroscopy, plant innate immunity (PTI)
Citation: Chung PJ, Singh GP, Huang C-H, Koyyappurath S, Seo JS, Mao H-Z, Diloknawarit P, Ram RJ, Sarojam R and Chua N-H (2021) Rapid Detection and Quantification of Plant Innate Immunity Response Using Raman Spectroscopy. Front. Plant Sci. 12:746586. doi: 10.3389/fpls.2021.746586
Received: 24 July 2021; Accepted: 17 September 2021;
Published: 21 October 2021.
Edited by:
Agnieszka Ludwików, Adam Mickiewicz University in Poznań, PolandReviewed by:
Shunyuan Xiao, University of Maryland, United StatesAgnieszka Kiełbowicz-Matuk, Polish Academy of Sciences (PAN), Poland
Copyright © 2021 Chung, Singh, Huang, Koyyappurath, Seo, Mao, Diloknawarit, Ram, Sarojam and Chua. This is an open-access article distributed under the terms of the Creative Commons Attribution License (CC BY). The use, distribution or reproduction in other forums is permitted, provided the original author(s) and the copyright owner(s) are credited and that the original publication in this journal is cited, in accordance with accepted academic practice. No use, distribution or reproduction is permitted which does not comply with these terms.
*Correspondence: Rajeev J. Ram, cmFqZWV2QG1pdC5lZHU=; Rajani Sarojam, cmFqYW5pc0B0bGwub3JnLnNn; Nam-Hai Chua, Y2h1YUByb2NrZWZlbGxlci5lZHU=
†These authors have contributed equally to this work
‡Present address: Pil Joong Chung, CellBioDx, Seongnam-si, South Korea
Jun Sung Seo, Graduate School of International Agricultural Technology and Crop Biotechnology, Institute/GreenBio Science and Technology, Seoul National University, Pyeongchang, South Korea