 Weiling Niu
 Hui Chen1,2*
 Jianshuang Wu
- 1Hebei Key Laboratory of Environmental Change and Ecological Construction, College of Resources and Environmental Sciences, Hebei Normal University, Shijiazhuang, China
- 2Hebei Technology Innovation Center for Remote Sensing Identification of Environmental Change, College of Resources and Environmental Sciences, Hebei Normal University, Shijiazhuang, China
- 3Institute of Environment and Sustainable Development in Agriculture, Chinese Academy of Agricultural Sciences, Beijing, China
- 4Theoretical Ecology, Institute of Biology, Freie Universität Berlin, Berlin, Germany
Changing precipitation and temperature are principal drivers for nutrient cycling dynamics in drylands. Foliar isotopic carbon (C) and nitrogen (N) composition (δ13C and δ15N) are often used to describe the plant’s water use efficiency and nitrogen use strategy in plant ecology research. However, the drivers and mechanisms under differential foliar δ13C and δ15N among plant species and communities are largely unknown for arid high-elevation regions. This study collected 462 leaf samples of ten top-dominant plant species (two or three replicates per species) across 16 sites in 2005 and 2010 to measure the community-weighted means (CWMs) of foliar δ13C and δ15N, northeastern Qaidam Basin, Qinghai-Tibetan Plateau. Our results showed that the CWM of foliar δ15N was higher in 2005 than in 2010 and was lower in the warm-dry season (July and August) than the cool-wet one (June and September) in 2010. Similarly, the CWM of foliar δ13C was higher in 2005 than in 2010, but no difference between warm-dry and cool-wet seasons in 2010. C4 plants have higher δ13C and generally grow faster than C3 species under warm-wet weathers. This might be why the CWM of foliar δ13C was high, while the CWM of foliar δ15N was low in the wet sampling year (2010). The general linear mixed models revealed that soil moisture was the most critical driver for the CWM of foliar δ15N, which explained 42.1% of the variance alone. However, the total soluble salt content was the crucial factor for the CWM of foliar δ13C, being responsible for 29.7% of the variance. Growing season temperature (GST) was the second most vital factor and explained 28.0% and 21.9% of the variance in the CWMs of foliar δ15N and δ13C. Meanwhile, remarkable differences in the CWMs of foliar δ15N and δ13C were also found at the species level. Specifically, Kalidium gracile and Salsola abrotanoides have higher foliar δ15N, while Ephedra sinica and Tamarix chinensis have lower foliar δ15N than other species. The foliar δ13C of Calligonum Kozlov and H. ammodendron was the highest among the ten species. Except for the foliar δ13C of E. sinica was higher than Ceratoide latens between the two sampling years or between the cool-wet and warm-dry seasons, no significant difference in foliar δ13C was found for other species. Overall, the CWMs of foliar δ15N and δ13C dynamics were affected by soil properties, wet-dry climate change, and species identity in high-elevation deserts on the Qinghai Tibetan Plateau.
Introduction
Isotopic carbon (C) and nitrogen (N) composition (δ13C and δ15N) can provide fundamental insights into ecosystem biogeochemical cycles (Handley et al., 1999). For example, foliar δ13C can infer intrinsic water use efficiency (WUE) of C3 plants (Hultine and Marshall, 2000; Warren et al., 2001; Qiang et al., 2003) while δ15N can reveal nitrogen use efficiency (NUE) and fractionation during the N-uptake, transport, transform, and decomposition (Robinson, 2001). Therefore, both δ13C and δ15N can be used to explore how plants respond to environmental changes (Adams and Grierson, 2001; Canadell et al., 2002; Dawson et al., 2002).
The δ13C of terrestrial plant fossils is also increasingly used to reconstruct paleoclimate (Siegwolf, 2007; Werner et al., 2012) because the δ13C of plant issues has recorded a series of climate change information associated with plant growth (Wang et al., 2005; Chen et al., 2007; Wang et al., 2010; Ma et al., 2012). Therefore, the δ13C can also serve as a valuable indicator of plant physiology (Saurer et al., 1995; Loader et al., 2007; Dodd et al., 2008; Diefendorf et al., 2010). Precipitation and temperature are the essential factors for plant growth, fitness, and performance in drylands (Huxman et al., 2004; Newman et al., 2006). Plant δ13C declines with increasing mean annual precipitation (MAP), likely due to the intrinsic WUE among species (Golluscio and Oesterheld, 2007; Moreno-Gutierrez et al., 2012). For example, Song et al. (2008) reported that foliar δ13C of dominant plants could describe alpine species differentiation in response to water availability across the Tibetan Plateau. However, it is still under debates about how foliar δ13C varies with mean annual temperature (MAT). Foliar δ13C has been reported to be positively (Li et al., 2005; Wang and Schjoerring, 2012; Wang, 2018), negatively correlated with MAT (Song et al., 2008; Zhou et al., 2011), and even no clear relation between them (Li et al., 2009). However, Yang et al. (2015) found that soil properties could explain more variance in δ13C than climatic factors at high-elevation grasslands. They even found a unimodal pattern between foliar δ13C and soil organic carbon (SOC) for alpine steppes on the Tibetan Plateau. Besides, high N availability in soils could lead to high foliar δ13C, primarily due to structural changes in plant tissue under droughts (Bol et al., 2004).
Similarly, foliar and soil δ15N decreases with MAP in drylands (Handley et al., 1999; Aranibar et al., 2004), implying ecosystem N cycling might be more open (Robinson, 2001). Martinelli et al. (1999) found that foliar δ15N was higher in tropical forests than temperate ones, indicating that plant NUE may increase with increasing temperature. In addition to temperature and precipitation, soil properties are also essential in controlling ecosystem N cycling (Booth et al., 2005; Chapin et al., 2011). For example, soil moisture can promote N mineralization and nitrification by affecting microbial activity (Butterbach-Bahl and Gundersen, 2011; Chapin et al., 2011). Soil pH can affect microbial nitrification and denitrification, NH3 volatilization (Booth et al., 2005; Butterbach-Bahl and Gundersen, 2011; Chapin et al., 2011). Soil texture and mycorrhizal fungi can also significantly influence vegetation δ15N via plants’ N-uptake preference and fractionation during the N-transfer between plant and mycorrhiza (Beyschlag et al., 2009; Klaus et al., 2013). Therefore, soil properties are also expected to affect vegetation δ15N variation, especially at high-elevation drylands.
Plant δ13C and δ15N in response to changes in temperature and precipitation are species-specifically different (Robinson, 2001; Golluscio and Oesterheld, 2007; Lazaro-Nogal et al., 2013). In addition to habitat conditions, species physiological traits can also regulate the variability of foliar δ15N and δ13C (Elmore et al., 2017). For example, Gatica et al. (2017) found that the short-term interaction between environmental change and plant functional traits may override temperature to affect plant δ13C and δ15N in drylands. Current findings on the trait-regulating effects on foliar δ15N and δ13C are mainly from temperate (Garten et al., 2000; Peri et al., 2012) and tropical regions (Powers and Schlesinger, 2002) but less from alpine biomes. Hgh-elevation deserts are sensitive to climate warming and wetting (Yang et al., 2009; Lin et al., 2011; Lu et al., 2013). Warming-induced C and N losses from alpine soils can even offset C and N sequestration by vegetation, triggering positive feedback to climate warming (Tan et al., 2010; Lu et al., 2013). Therefore, a better understanding of the mechanisms governing C- and N- related processes is crucial in high-elevation ecosystems (Yang et al., 2009; Averill et al., 2014).
This study explored how climate change (warm-wet vs cool-dry) affects foliar δ13C and δ15N of alpine desert plants in the northeastern Qaidam Basin, Qinghai-Tibetan Plateau. We hypothesized that changes in precipitation and temperature affect plant δ13C and δ15N differently among species genotypes. Specifically, we aim to (1) examine the differences in foliar δ13C and δ15N under the dry-wet change; (2) explore how foliar δ13C and δ15N respond to changes in climate and soil factors; and (3) to evaluate the relative contribution of environmental factors to changes in foliar δ13C and δ15N at both plant species and community levels.
Materials and Methods
Study Area
The study area locates in the East Qaidam Basin, Qinghai-Tibetan Plateau (Figure 1), with evident differences in climate (Figure 1), soil nutrients and plant assembly (Tables 1, 2). In this study, we had 11 sites sampled in 2005 and five sites in 2010. The site elevation is between 2500 m and 3600 m (Table 1). Mean temperature and sum precipitation during the plant growing season (from May to September, GST and GSP) range from 10 to 17.4°C and from 35.9 to 224 mm, respectively (Table 1). Soil is arid and salty, with the habitat aridity index ranging from 2.1 to 30.4 mm °C–1 and soil soluble salts from 155 to 2787 EC25 μs cm–1. Vegetation is dominated by shrub and semi-shrub halophytes, resistant to drought and salinization (Table 1).
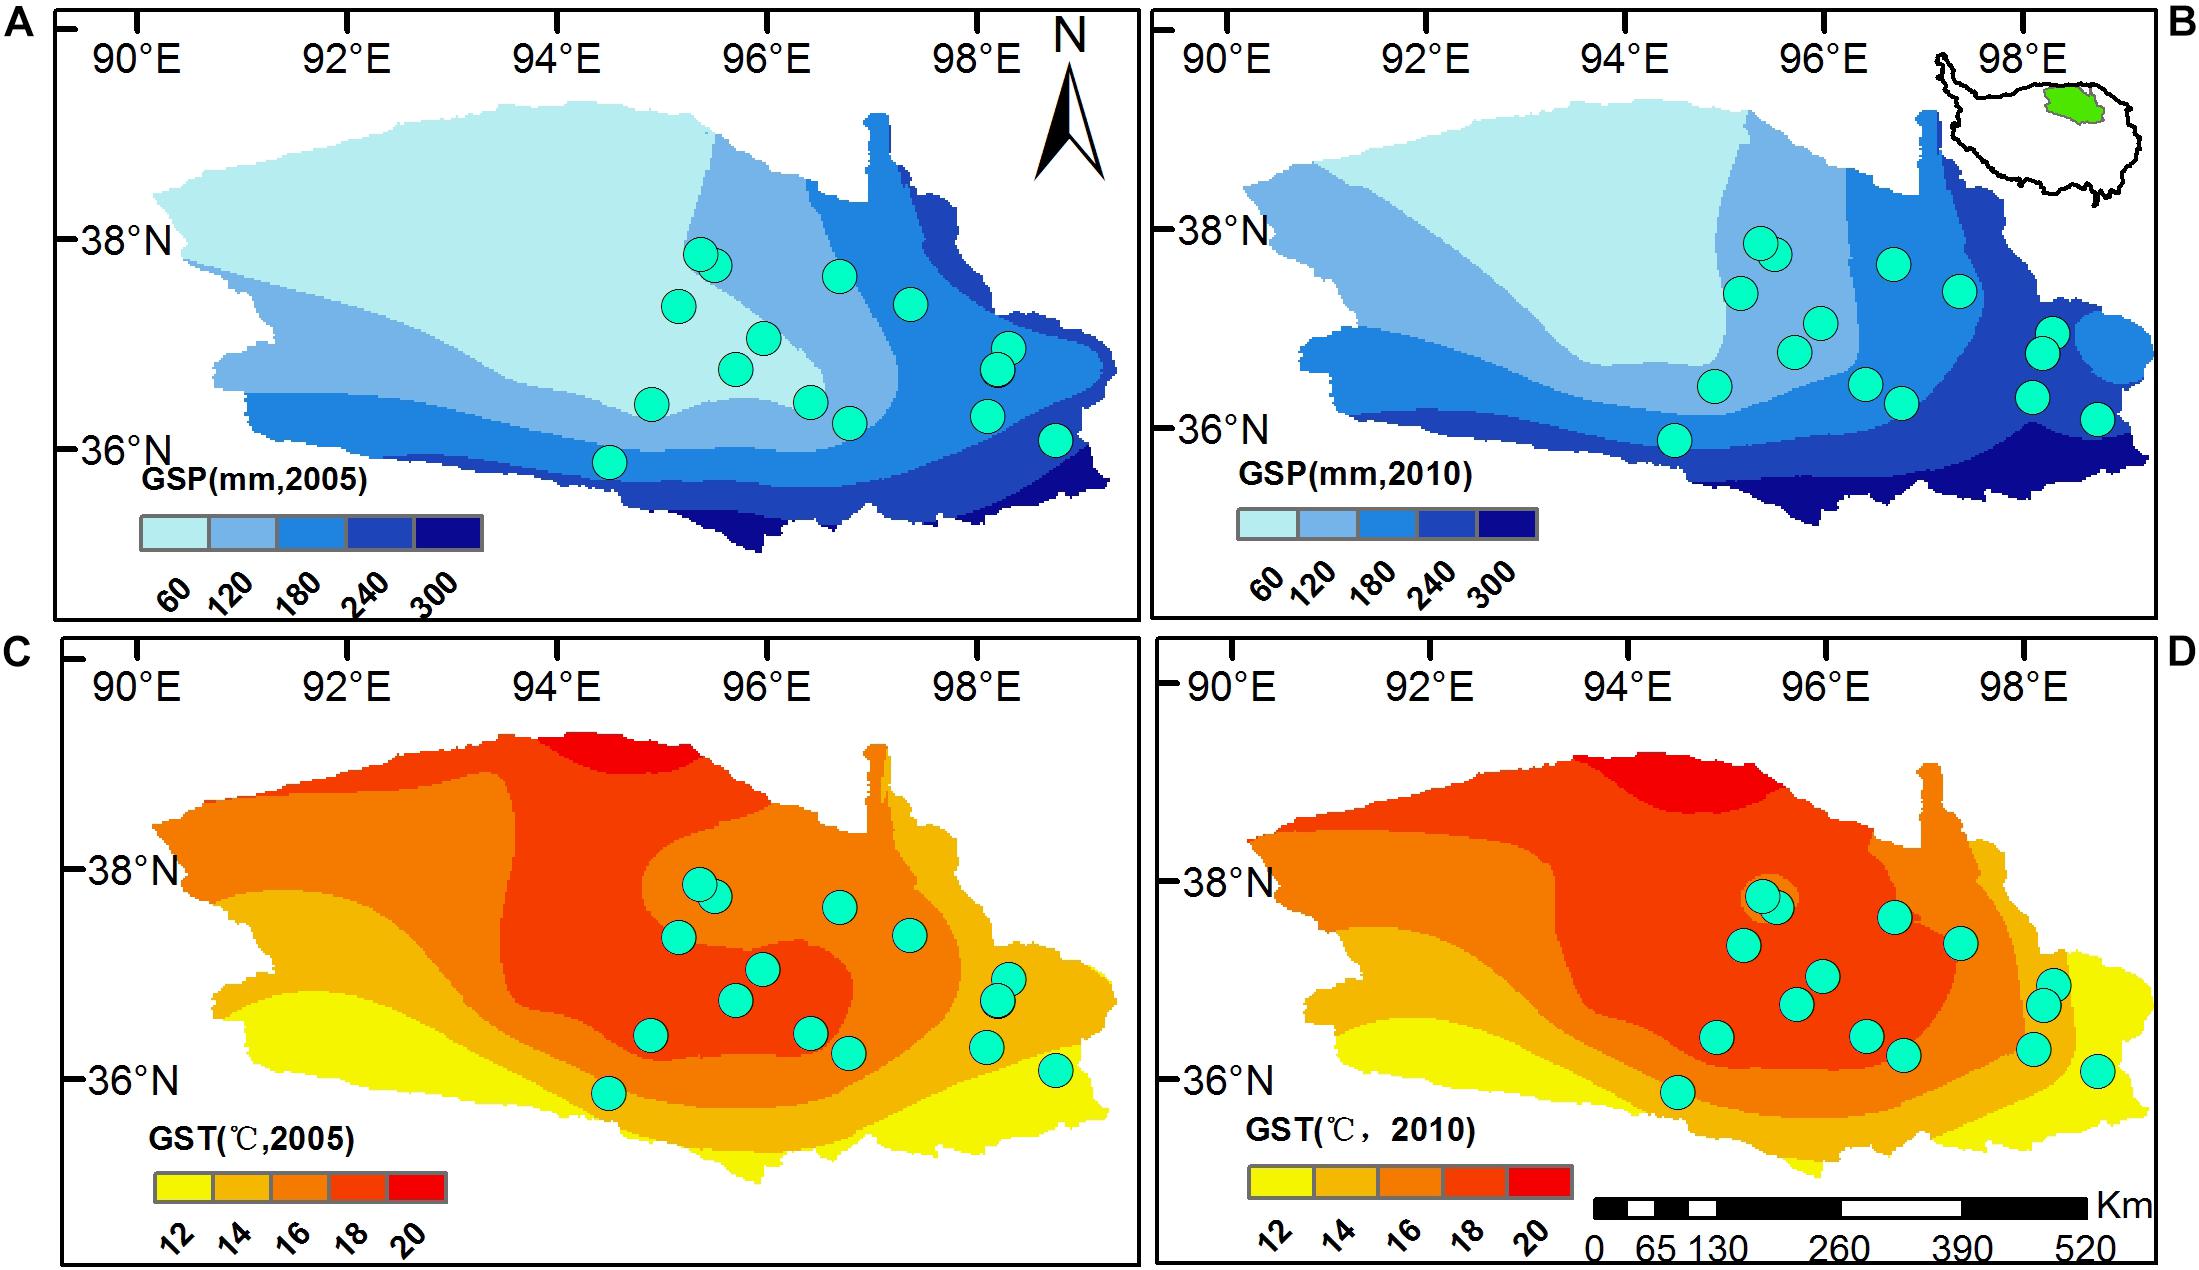
Figure 1. Locations of sampling sites in the Eastern Qaidam Basin, northeastern Qinghai-Tibetan Plateau. Raster surfaces are the sum precipitation [GSP, (A,B)] and mean temperature [GST, (C,D)] during the plant growing seasons, from May to September 2005 and 2010. Climatic surfaces were generated using ArcGIS 10.2, with daily weather records downloaded from the China Meteorological Data Service Center (CMDC, http://data.cma.cn/en). The small map embedded in (B) shows the Qaidam Basin’s location in the Qinghai-Tibetan Plateau.
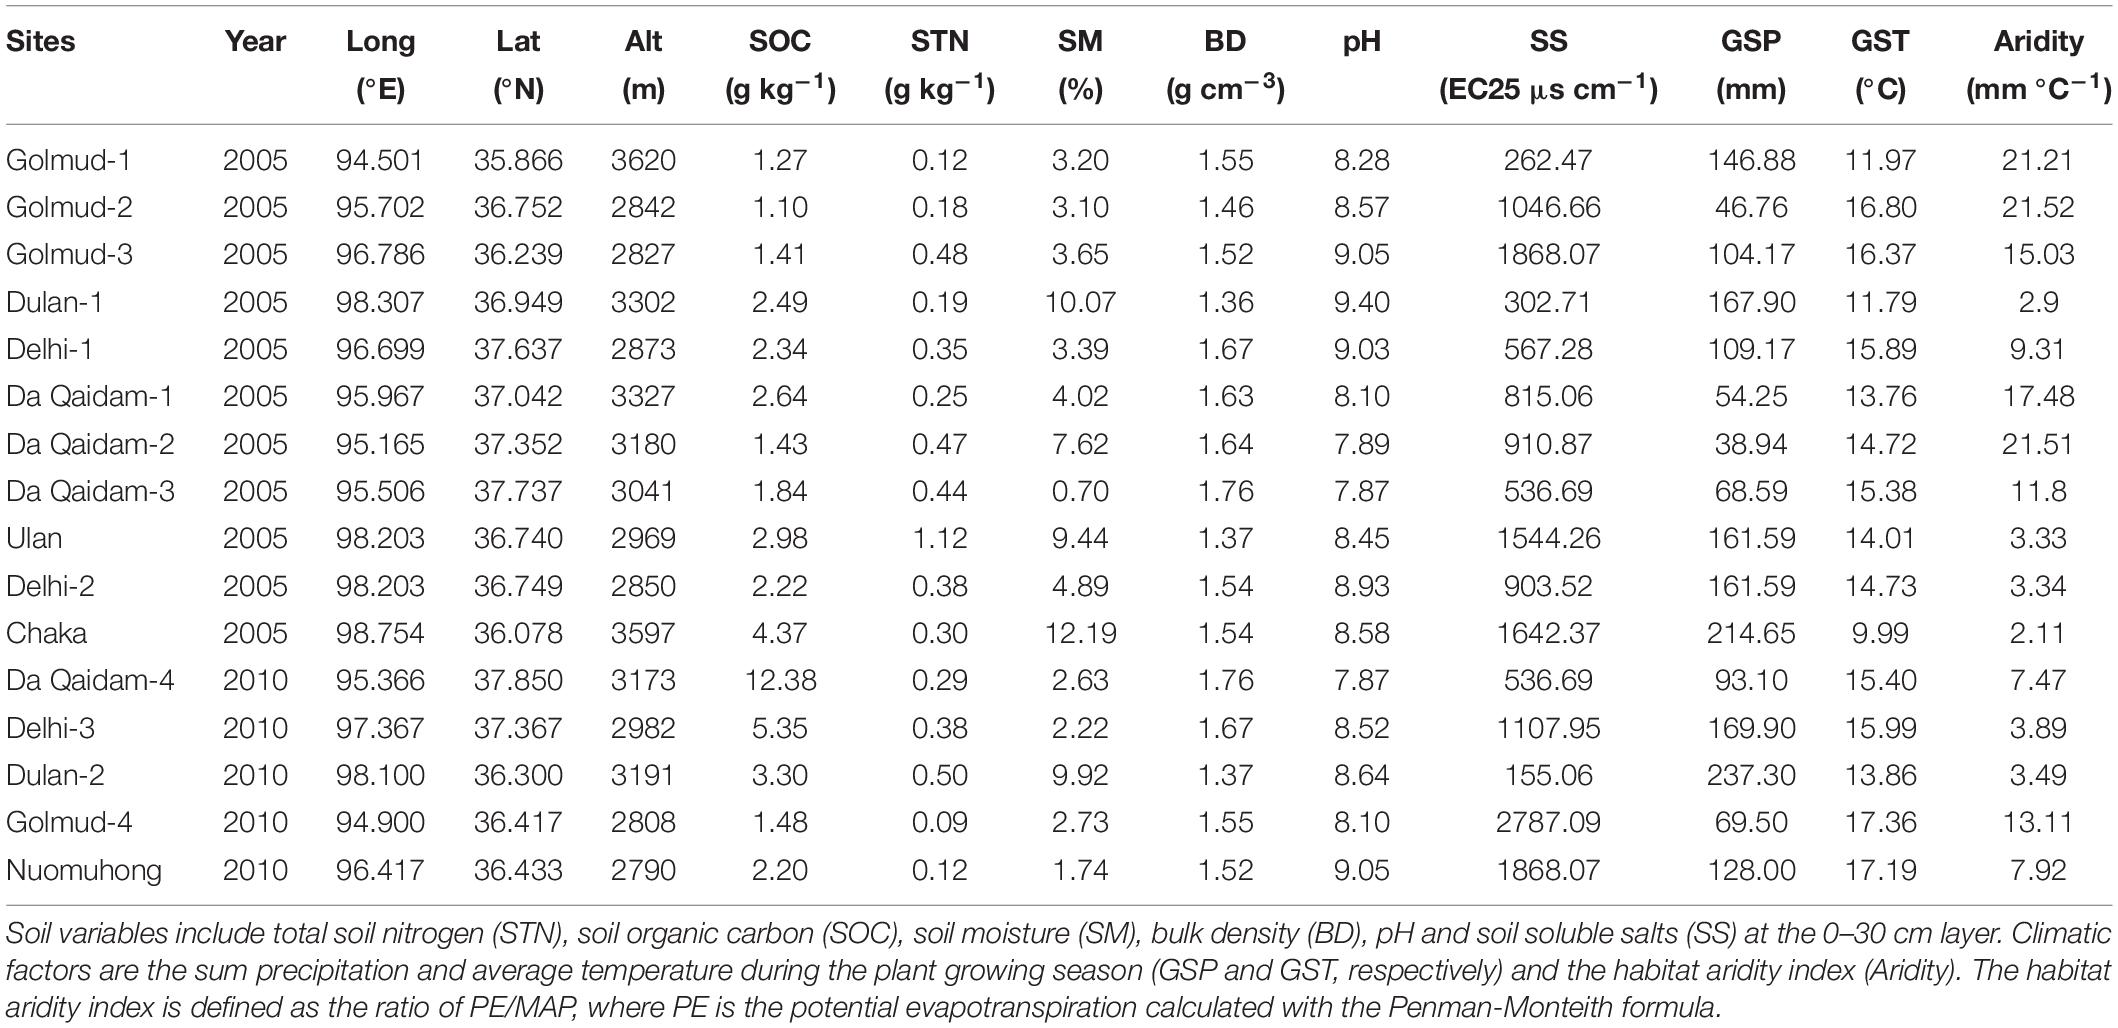
Table 1. Sampling year, site locations, soil properties, and climate regimes in the Qaidam Basin, northeastern Qinghai-Tibetan Plateau.
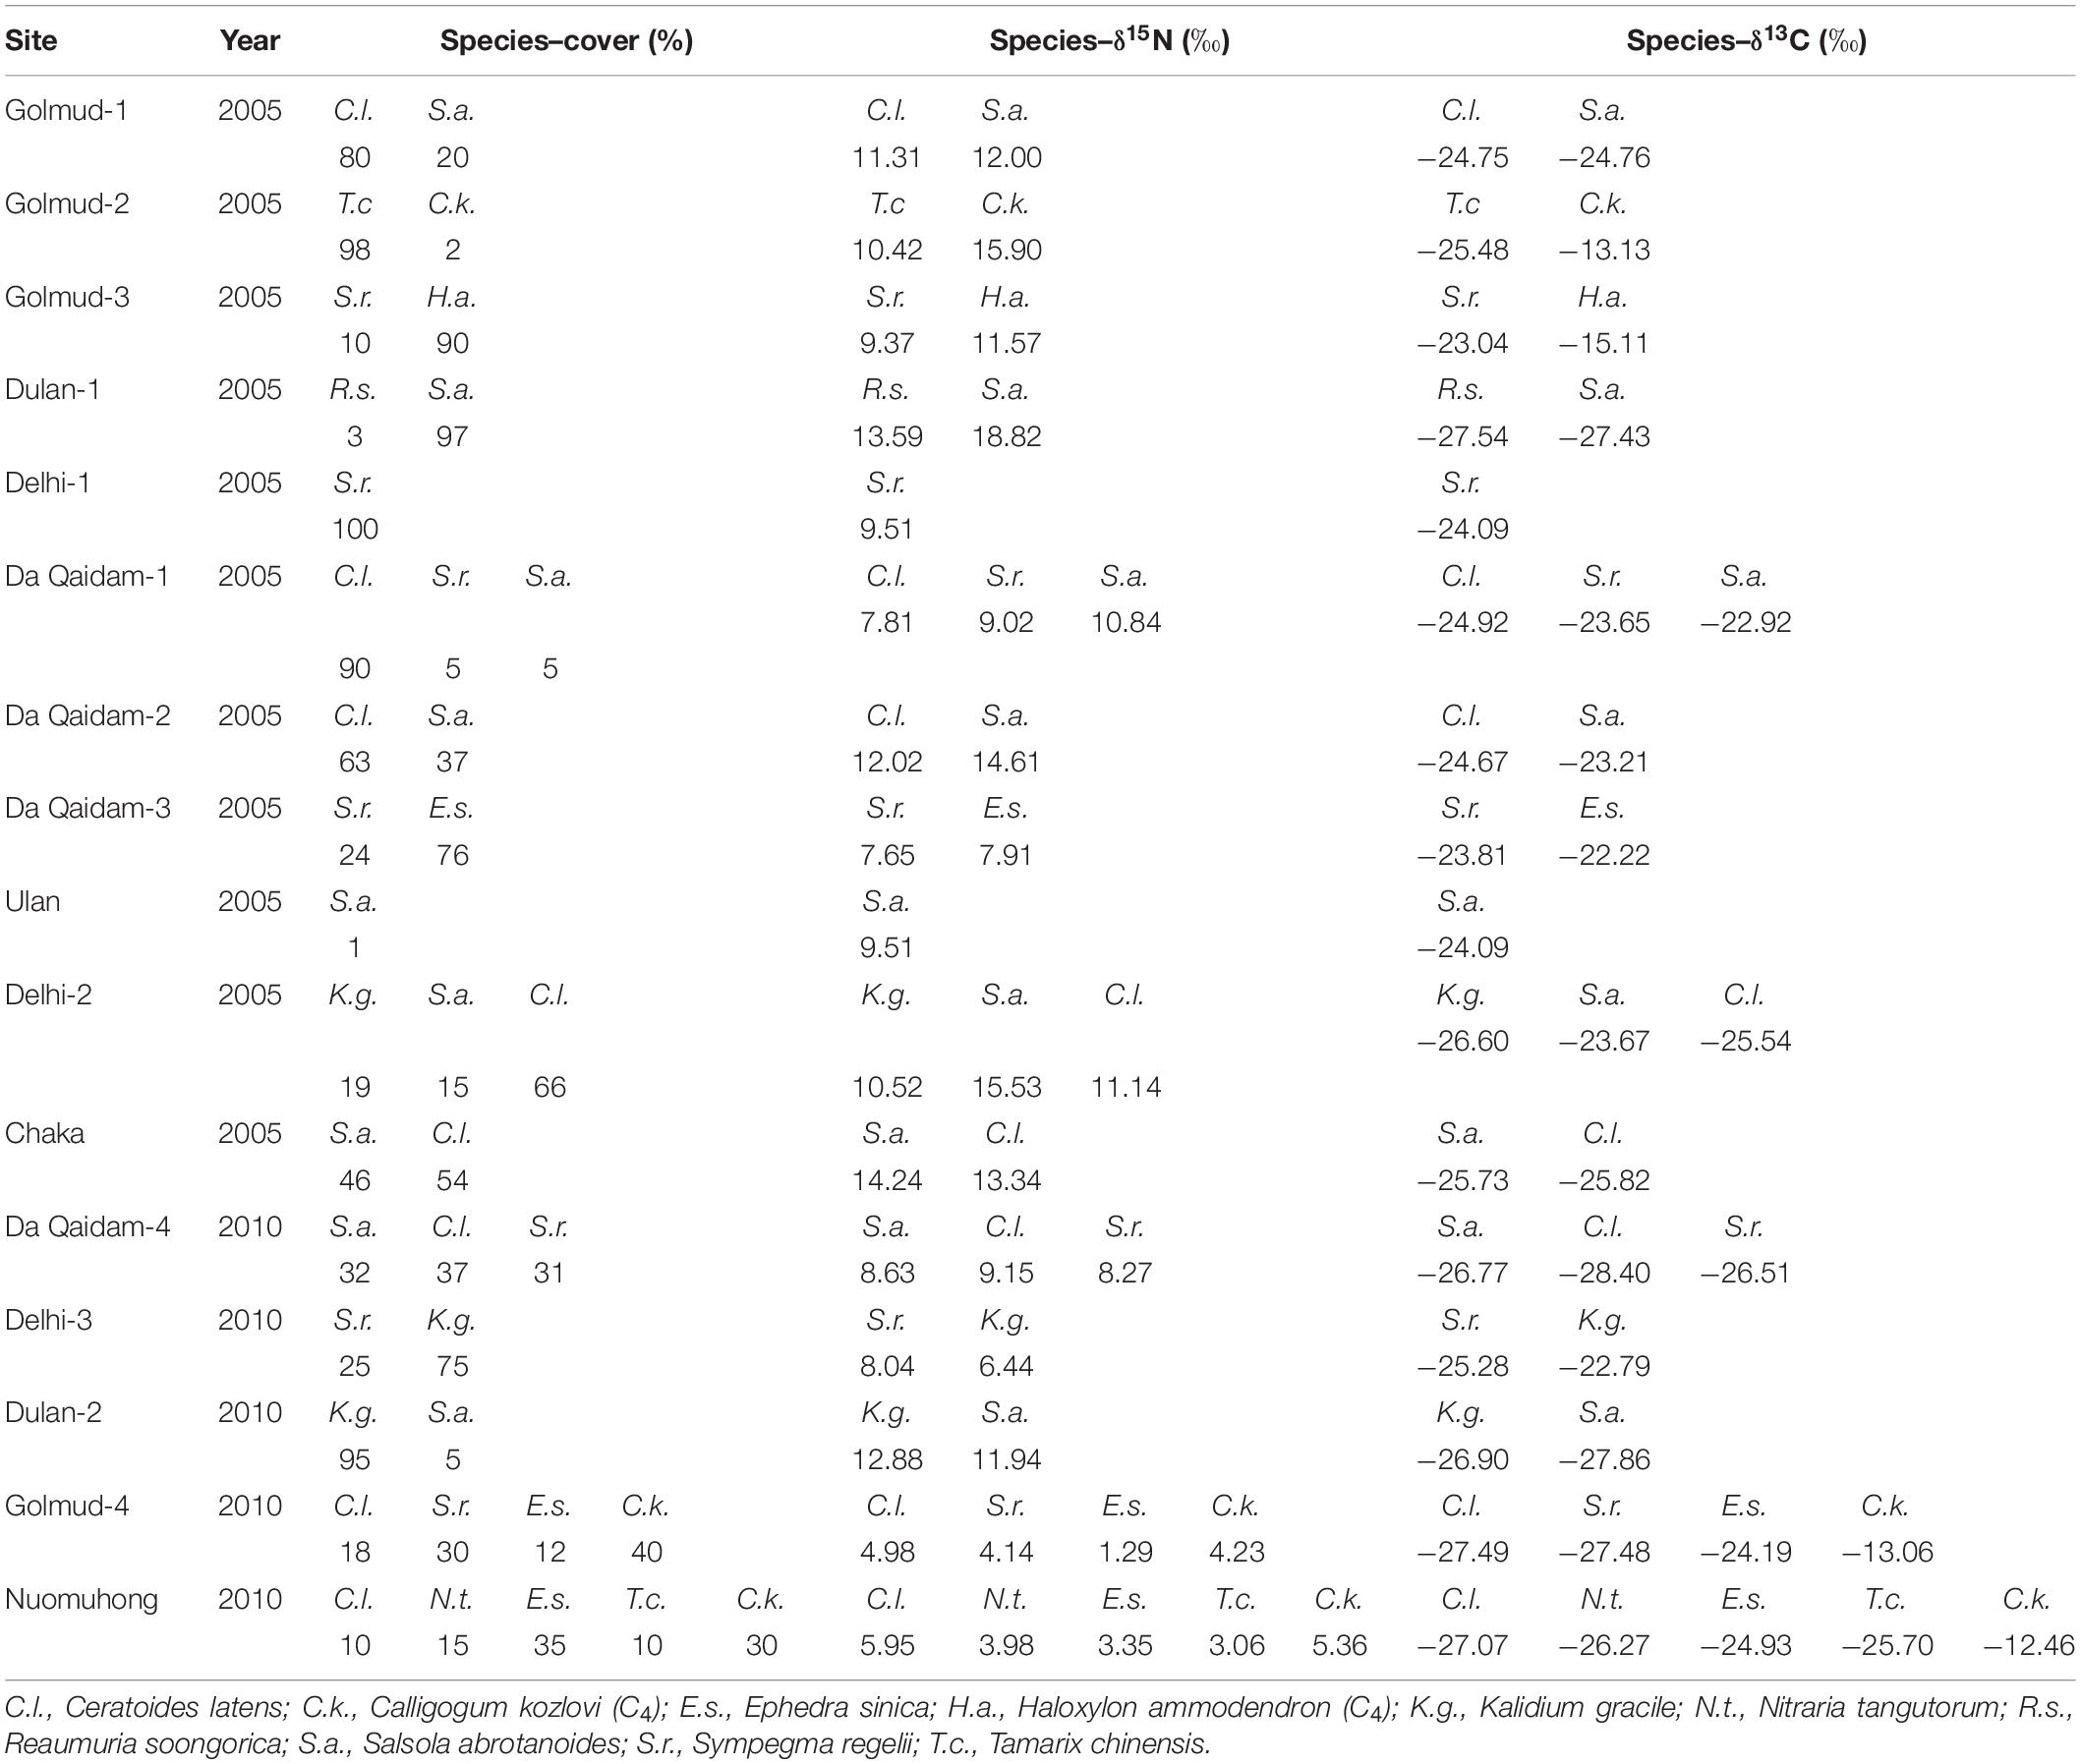
Table 2. Plant cover, nitrogen isotopic composition (δ15N, ‰) and carbon isotopic composition (δ13C, ‰) of species measured at each site.
Field Surveys in 2005 and 2010
We collected 66 leaf samples of nine dominant species from 11 sites during the peak plant growing season of 2005, from late July and early August. In 2010, 396 leaf samples of eight dominant species at five sites were collected every 2 weeks from June to September. Totally, 462 foliar samples of ten typical desert plants (see details in Table 2 and Supplementary Table 1) were used for further analysis (Figure 1).
First, we chose an open flat area at each site where soil and vegetation were homogeneous without human disturbance and livestock grazing. Five quadrats of 5 m × 5 m were randomly laid to sample short plants at each site and five quadrats of 10 m × 10 m for high ones. We took leaves from two or five dominant species at each plot. For each species, three to five leaves were collected from healthy adult individuals. Leaf samples of the same species were mixed by site, washed with deionized water, and oven-dried at 75°C for 48 h to constant weight in the lab. Finally, leaves were ground into fine powders and stored in glasswares before isotopic analysis.
Second, we collected soil samples at three depths (0–10 cm, 10–20 cm, and 20–30 cm), three soil cores per layer, at each quadrat. Fresh soil samples were first sieved through a 2.0-mm sieve to remove roots, gravels, and stones. Then, we divided each soil sample into two parts: one oven-dried for 24 h at 105°C for soil moisture measurement and the other air-dried for physical and chemical analyses. Soil moisture content was measured as the weight difference between fresh and oven-dried soils.
Chemical and Isotopic Analyses
Soil total nitrogen (STN, g kg–1) was analyzed with the Kjeldahl method of nitrogen determination and soil organic carbon (SOC, g kg–1) with the vitriol acid-potassium dichromate oxidation method. Soil pH was measured by a pH electrode in a mixture of soil and water, with a soil: water ratio of 1:2.5. The electrical conductivity or resistivity was used to measure soluble soil salts.
The natural abundance composition of 15N/14N and 13C/12C were measured with a stable isotope mass spectrometer (Finnegan Mat-253). The standard error of repeated measurements was ± 0.2‰. The 15N/14N and 13C/12C abundance ratio of samples (Rsample) was given in δ notation and expressed in parts per mil (‰) relative to the standard as follows:
where Rsample and Rstd are the ratios of 13C/12C or 15N/14N of the sample and standard, respectively. The Pee Dee Belemnite (PDB) (δ13C = 0.0112372) and atmospheric nitrogen (δ15Nair = 0) were used as international standards for stable carbon and nitrogen, respectively.
In this study, the community-weighted means (CWMs) (CWM) of foliar δ15N and δ13C were calculated for each site as follow,
where the Pij is the relative dominance (cover percent) of the species i in the site j; Tij is the mean trait value of the species i in the site j; and the CWMj is the community weighted mean of the trait at the site j. We also calculated the CWMs of foliar δ15N and δ13C with and without C4 plants to examine the C4 plants’ contribution under changing weather conditions.
Climate Data Processing
There are 19 national meteorological stations within the Qaidam Basin. Daily records of temperature and precipitation of these stations were provided by the China Meteorological Data Service Center1 for 2005 (dry) and 2010 (wet). First, we integrated the daily temperature and precipitation into the plant growing season temperature (GST) and precipitation (GSP). The Kriging interpolation was used to produce climate rasters in ArcGIS10.2, and sit elevation was used as a covariate variable to improve the interpolation accuracy. The ratio of potential evapotranspiration (PET) to MAP describes the yearly aridity index. Finally, we extracted GST, GSP, and Aridity index values for each site according to its geographical coordinates. GSP and GST in 2010 were 37.5 mm more and 0.34°C higher than those in 2005, respectively (Table 1). The precipitation and temperature in June and July were 26.28 mm more and 5.25°C lower than in August and September 2010 (Figure 2). So, we defined July and August as warm-dry months and June and September as cool-wet ones for further analysis.
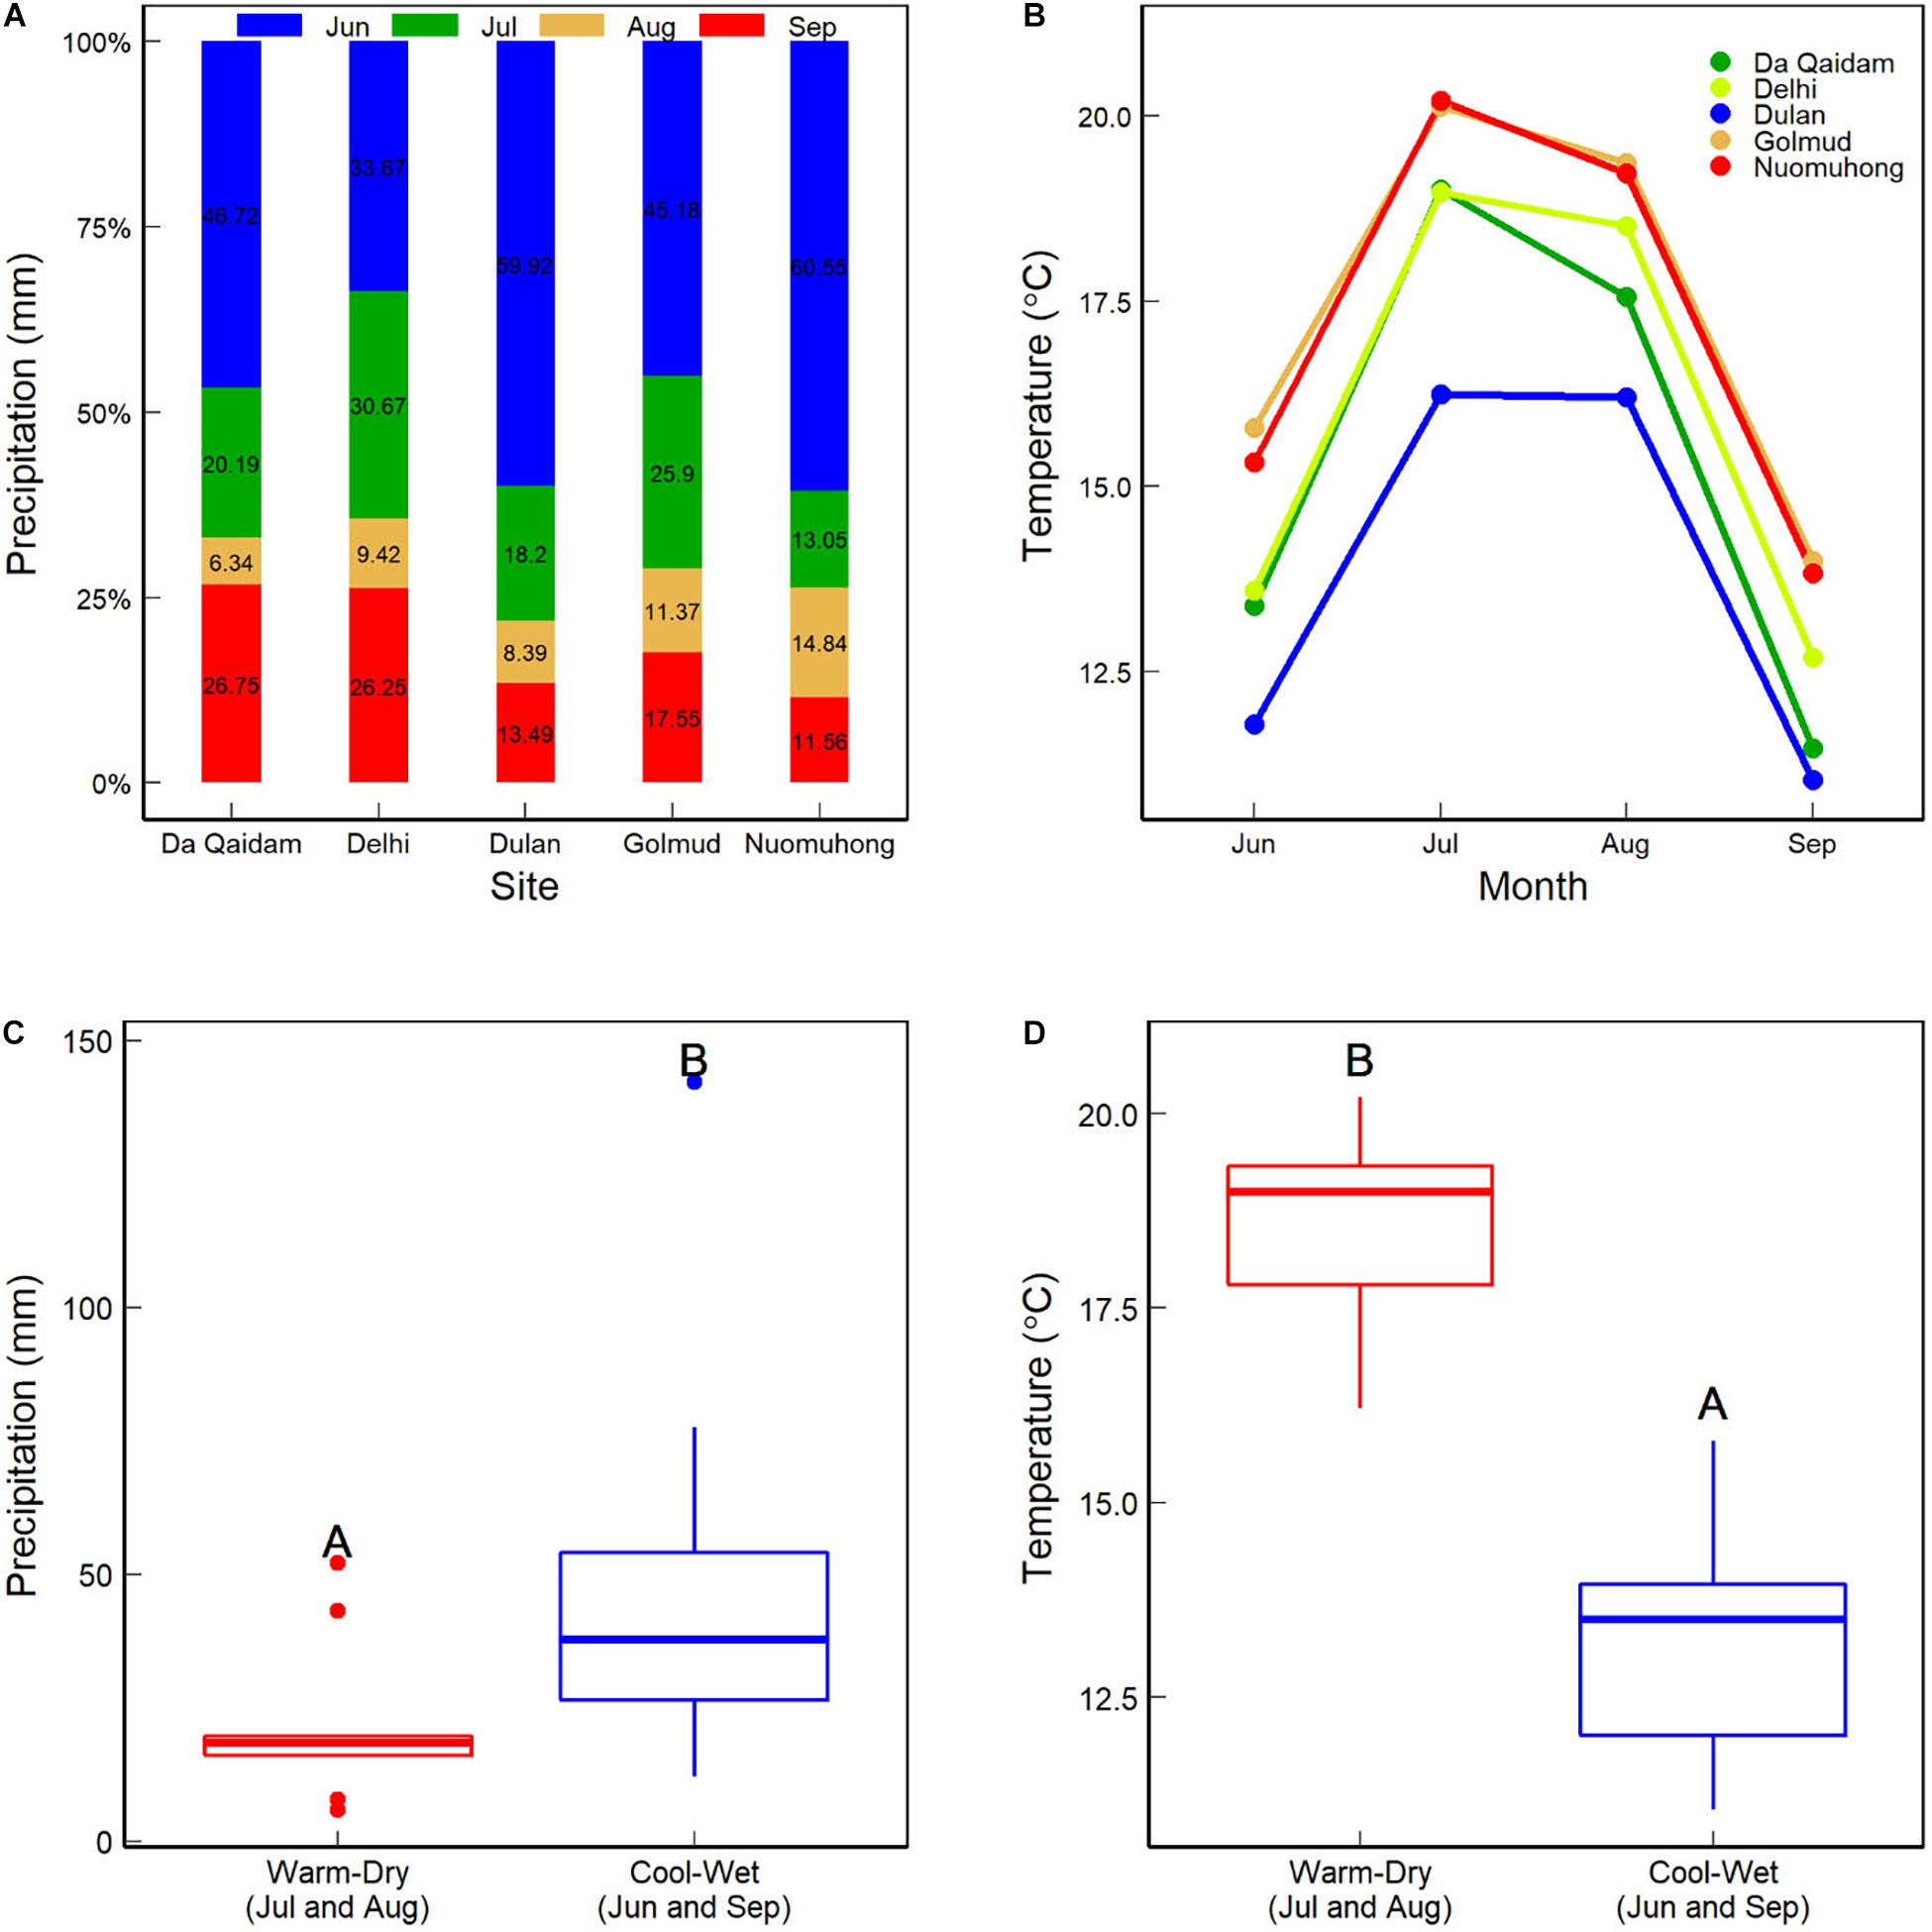
Figure 2. Precipitation (A) and air temperature (B) at each site from June to September during the plant growing season in 2010. (C,D) Show the sum precipitation and mean temperature between the warm-dry (July and August) and cool-wet (June and September) months.
Statistical Analyses
First, Two-way ANOVA was used to examine the effects of species identity and weather conditions on foliar δ15N and δ13C at the species level. Then, we examined the difference in CWMs of foliar δ15N and δ13C between 2005 and 2010, with the Kruskal-Wallis test by rank. In this step, we only considered the plant species sampled in both 2005 and 2010. Then, we examined the difference in the CWMs of foliar δ15N and δ13C between warm-dry and cool-wet months in 2010, with the Kruskal-Wallis test by rank. It is a non-parametric alternative to one-way analysis of variance (ANOVA) when the data does not meet the homogeneity assumptions of variance and normality.
Next, the CWMs of foliar δ15N and δ13C were treated as response variables while climate factors (GSP, GST, and Aridity), soil nutrients (SOC and STN) and physical properties (soil moisture, soluble soil salt, pH and bulk density) as potential predictors. Correlations between responsible and explanatory variables were examined. Bivariate regressions were used to examine how CWMs of foliar δ13C and δ15N vary along with each environmental variable. Finally, multivariate linear models were performed to investigate the main effect of climate and soil variables on the variance of foliar δ15N and δ13C at the community level. We followed a backward approach with Akaike Information Criterion (AIC) and Bayesian Information Criterion (BIC) to select the optimal models out (Rozenberg et al., 2011). The effect size (Eta squared, η2) was calculated as the proportion of the total variance explained by each factor in the most-fitted model.
All the analyses and visualizations were performed with R 4.0.2 (R Core Team, 2017).
Results
The Difference in δ15N and δ13C Between the Dry and Wet Years/Seasons
Foliar δ15N and δ13C are different among species between 2005 and 2010. For a given species, foliar δ15N and δ13C were different between 2005 and 2010 and between cool-wet and warm-dry months in 2010. Specifically, the foliar δ15N of Ceratoide latens (11.12‰ vs 7.13‰), Salsola abrotanoides (13.97‰ vs 10.28‰), Ephedra sinica (7.91‰ vs 2.32‰), Tamarix chinensis (10.42‰ vs 3.06‰) and Calligogum kozlovi (15.90‰ vs 4.79‰) in 2005 were significantly higher than those in 2010 (Figure 3A). Foliar δ15N of Kalidium gracile (9.64‰) and S. abrotanoides (10.16‰) were higher than other species. Foliar δ15N of E. sinica (2.40‰) and T. chinensis (2.13‰) were lower than other species (5.58‰) between cool-wet and warm-dry months in 2010 (Figure 3C). Neither yearly (9.46 vs 8.11‰) nor monthly (6.52 vs 6.03‰) foliar δ15N was different between C. latens and Sympegma regelii (Figures 3A,C).
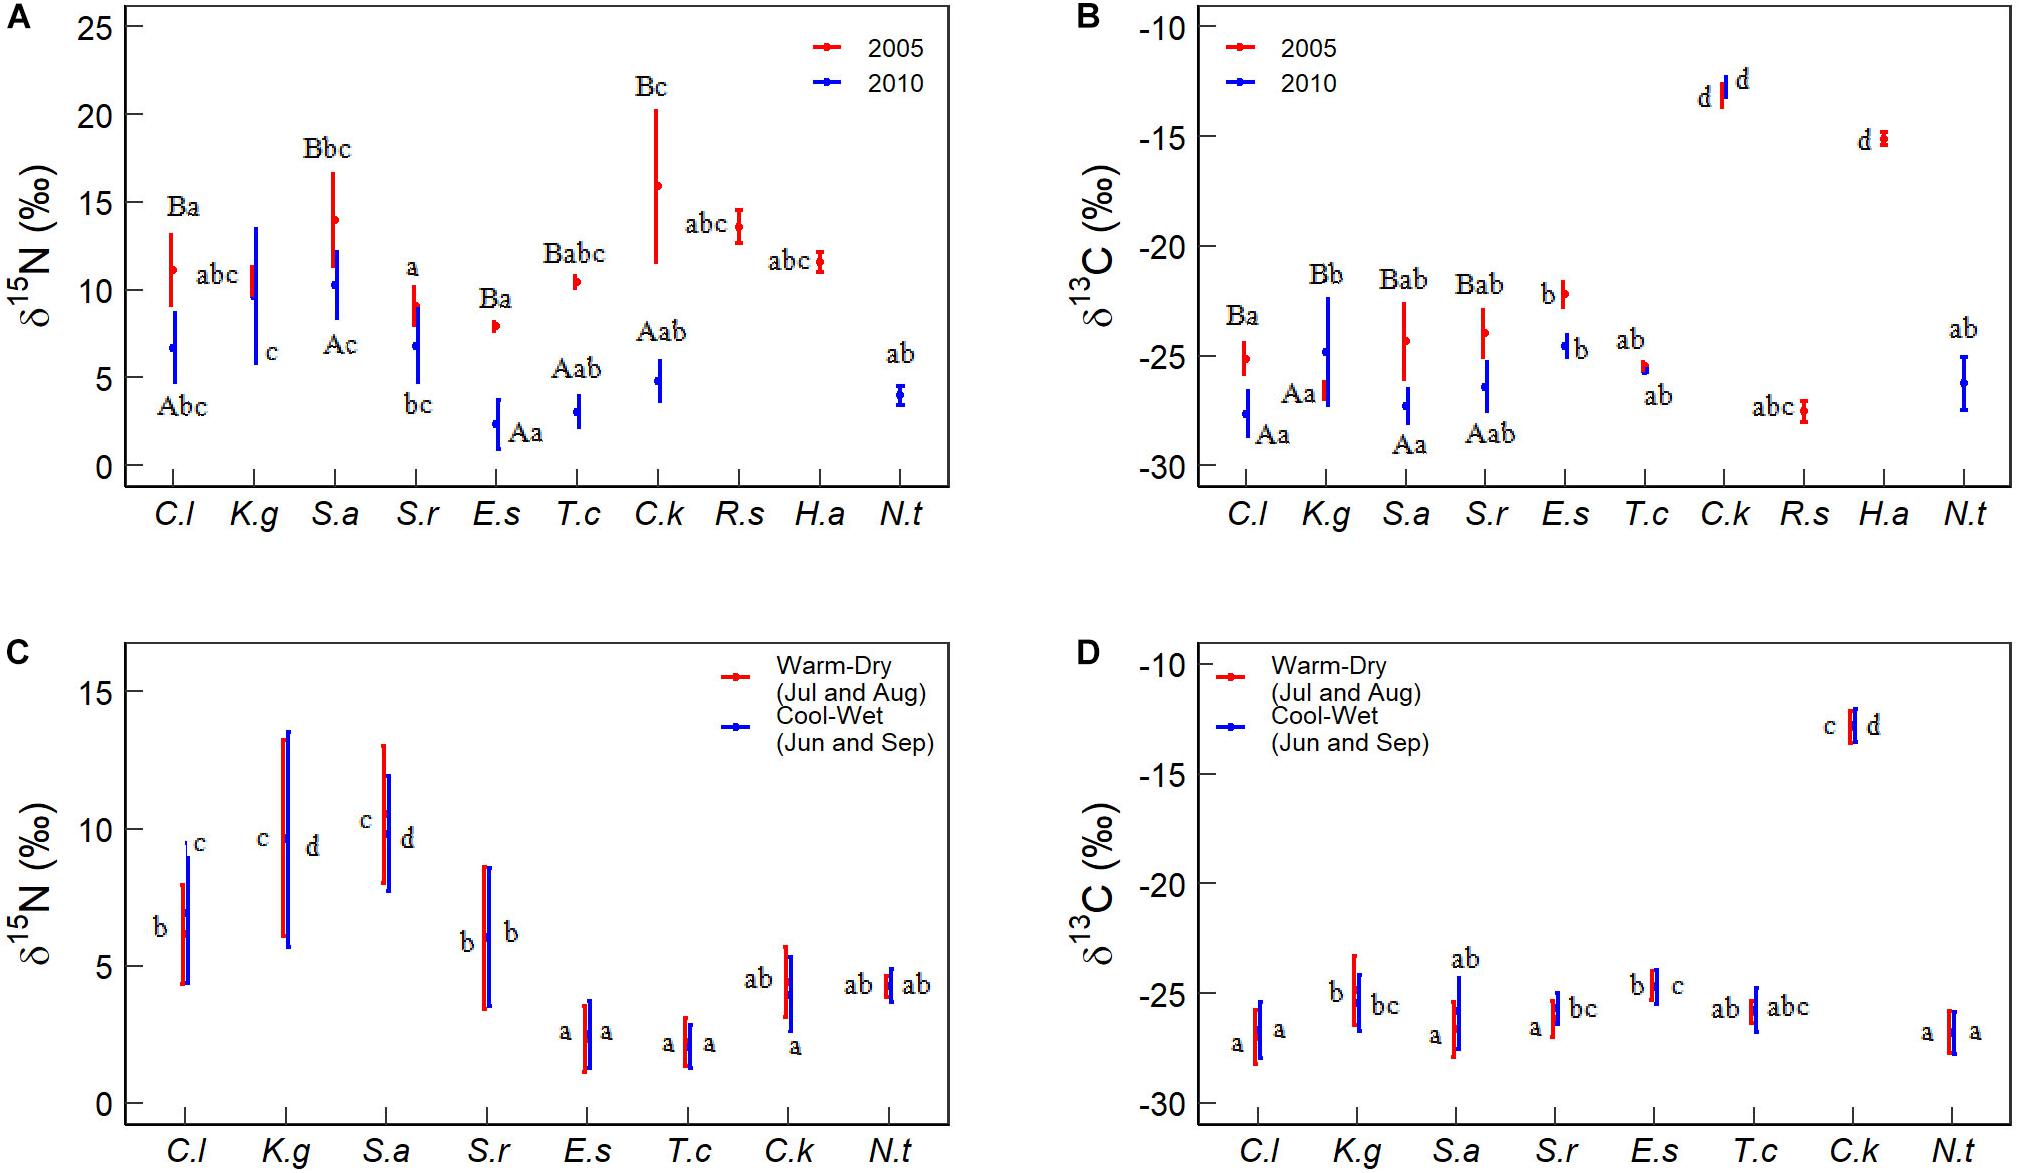
Figure 3. Comparison of foliar δ15N and δ13C among species. Different capital letters indicate significant differences between the two sampling years and between cool-wet and warm-dry months in 2010. Different lowercase letters indicate significant differences among species within a given year or months. The significance was at the P < 0.05 level. Species abbreviations were the same as Table 2.
The foliar δ13C of C. latens (−25.14 vs −27.40‰), S. abrotanoides (−24.36 vs −27.32‰), and S. regelii (−23.99 vs −26.42‰) in 2005 were greatly higher than in 2010, but K. gracile (−26.60‰ vs −24.85‰) was different. The foliar δ13C of C. kozlovi (−12.85‰) and H. ammodendron (−15.11‰) were the highest (Figures 3B,D). The foliar δ13C of E. sinica was higher than C. latens at yearly (−23.78 vs −26.08‰) and monthly (−24.70 vs −26.85‰) scales. There was no evident difference in foliar δ13C for other species (Figures 3B,D).
C4 plant (C. kozlovi) from two of the five sites had higher δ15N and cover in 2005 than in 2010 (15.90 vs 4.79‰ for foliar δ15N, and 2 vs 30–40% for cover, Table 2 and Figure 3A). Besides, the δ15N and cover values of other C4 plants were comparable to C3 ones. Consequently, the CWM of foliar δ15N in 2005 was around 12.56‰, approximately 5.3‰ higher than in 2010 (7.27‰), no matter C4 plants considered or not (Figure 4A).
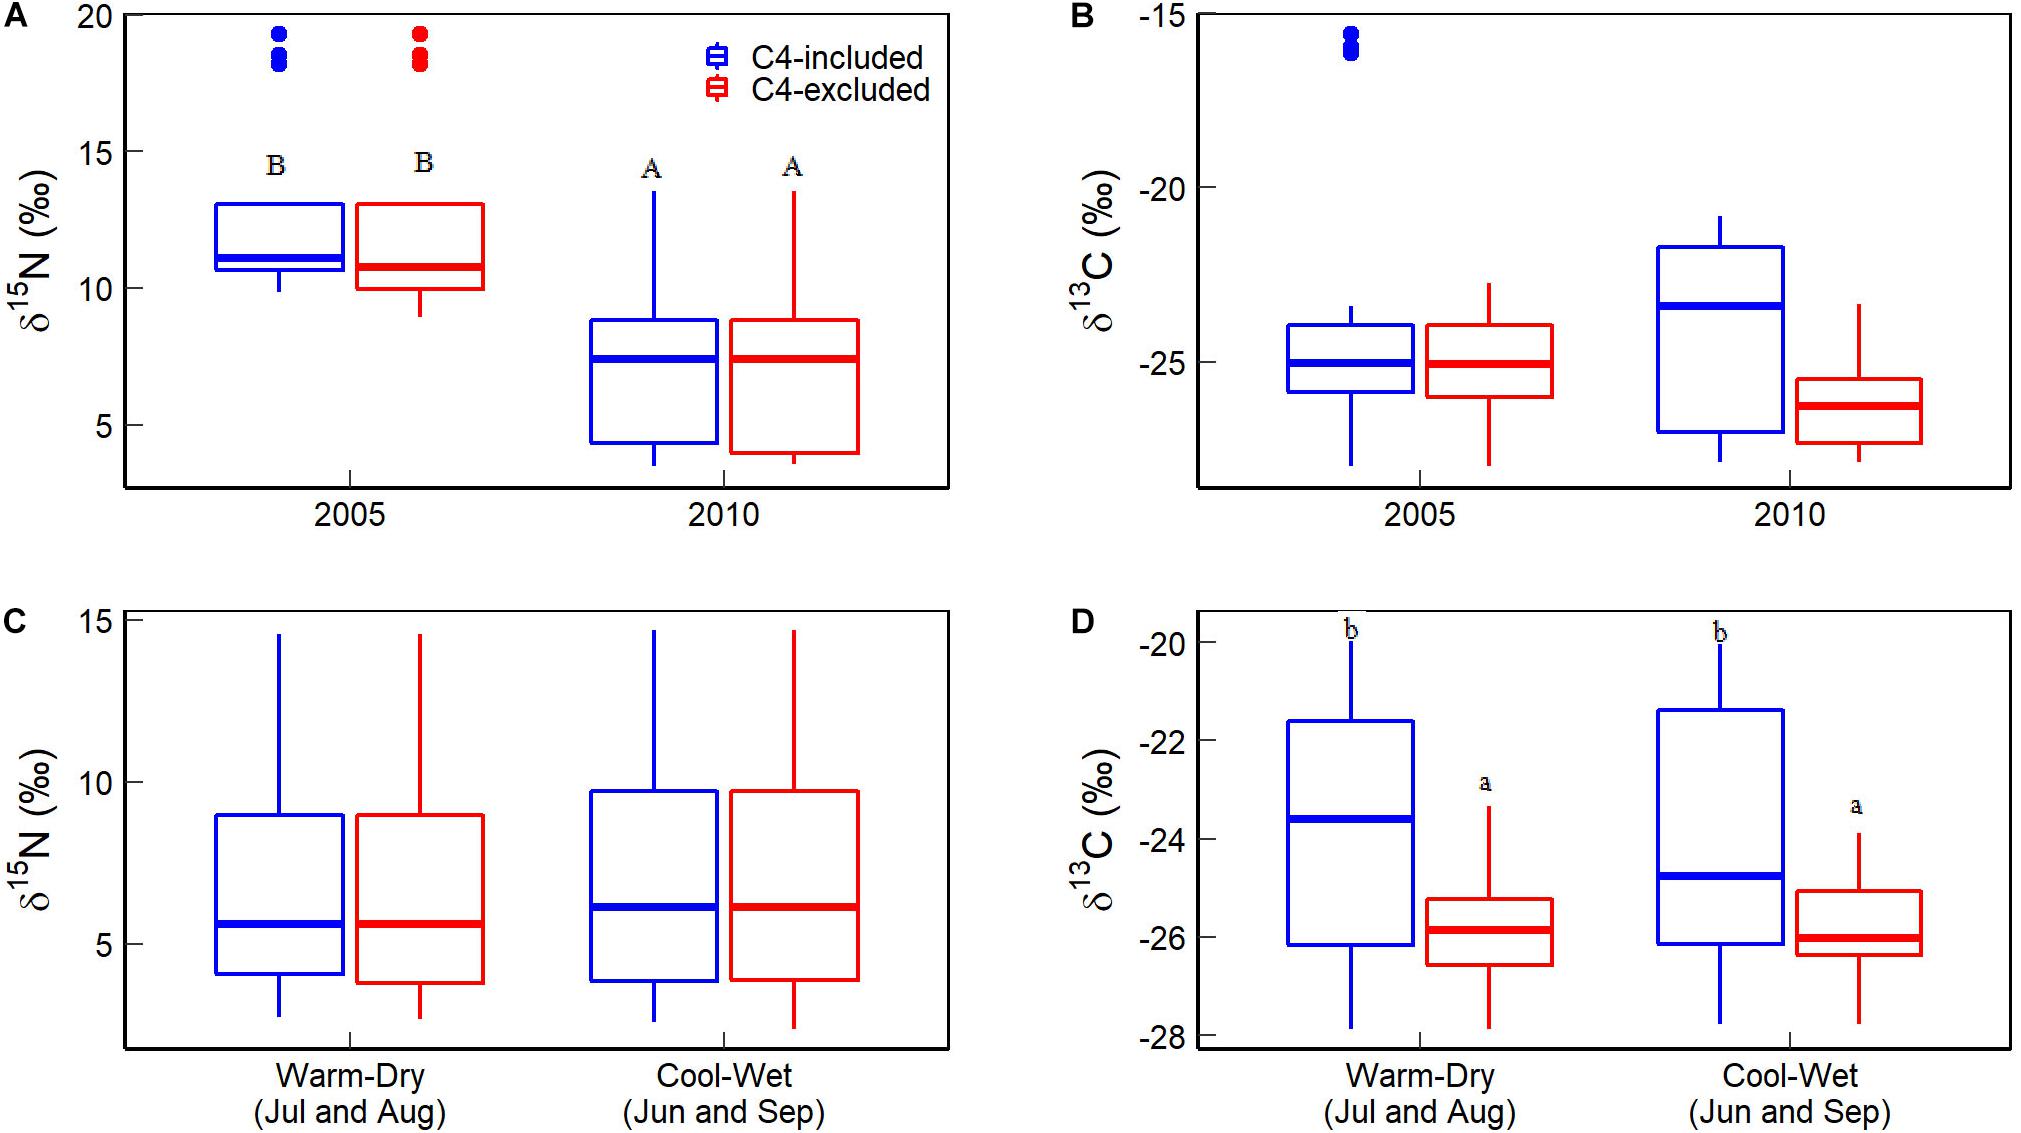
Figure 4. Comparisons of the community weighted means (CWMs) of foliar δ15N and δ13C. (A,B) Are for the difference between 2005 and 2010, while (C,D) are between cool-wet and warm-dry months in 2010). Different capital letters indicate a significant difference between different years or between cool-wet and warm-dry months. Different lowercase letters indicate a significant difference between C4 plants considered or not within a given year or months. The significance was given at the P < 0.05 level.
The foliar δ13C of C4 plants, C. kozlovi (−13.13‰) and H.ammodendron (−15.11‰) in 2005 were much higher than the seven C3 plants (ranging from −29.19 to −21.84‰). The coverage of C. kozlovi (2%) was very low (Table 2 and Figure 3B), resulting in no difference in the CWM of foliar δ13C with and without C4 plants in 2005 (Figure 4B). However, the foliar δ13C of C4 plants, C. kozlovi (−12.76‰) was much higher than C3 plants (ranging from −29.19 to −22.63‰, Table 2 and Figure 3B) in 2010. No significant difference was found in the CWM of foliar δ15N between 2005 and 2010. However, the CWM of foliar δ13C in 2010 with C4 plants was 1.89‰ higher than that without C4 plants (Figure 4B).
The CWM of foliar δ15N in the cool-wet months (7.09‰) was slightly, only 0.21‰ higher than that in the warm-dry ones (6.88‰), but not significantly (P > 0.05, Figure 4C), the same for both C3 and C4 plants at the species level. The CWM of foliar δ13C with C4 plants (cool-wet: −23.95‰, warm-dry: −23.80‰) was significantly higher than without C4 ones (cool-wet: −25.76‰, warm-cool: −25.80‰) in 2010 (P > 0.05, Figure 3D).
Foliar δ15N and δ13C Vary With Environmental Variables
The CWM of foliar δ15N was negatively correlated with δ13C (r = −0.33). The δ15N was closely linked with soil moisture, bulk density, pH, GSP, and GST, with their absolute coefficient values being higher than 0.5 (Figure 5). The CWM of foliar δ13C was closely correlated with soluble salt and GST, with absolute coefficients higher than 0.4. Meanwhile, the site aridity index was closely correlated with SOC and STN (Figure 5).
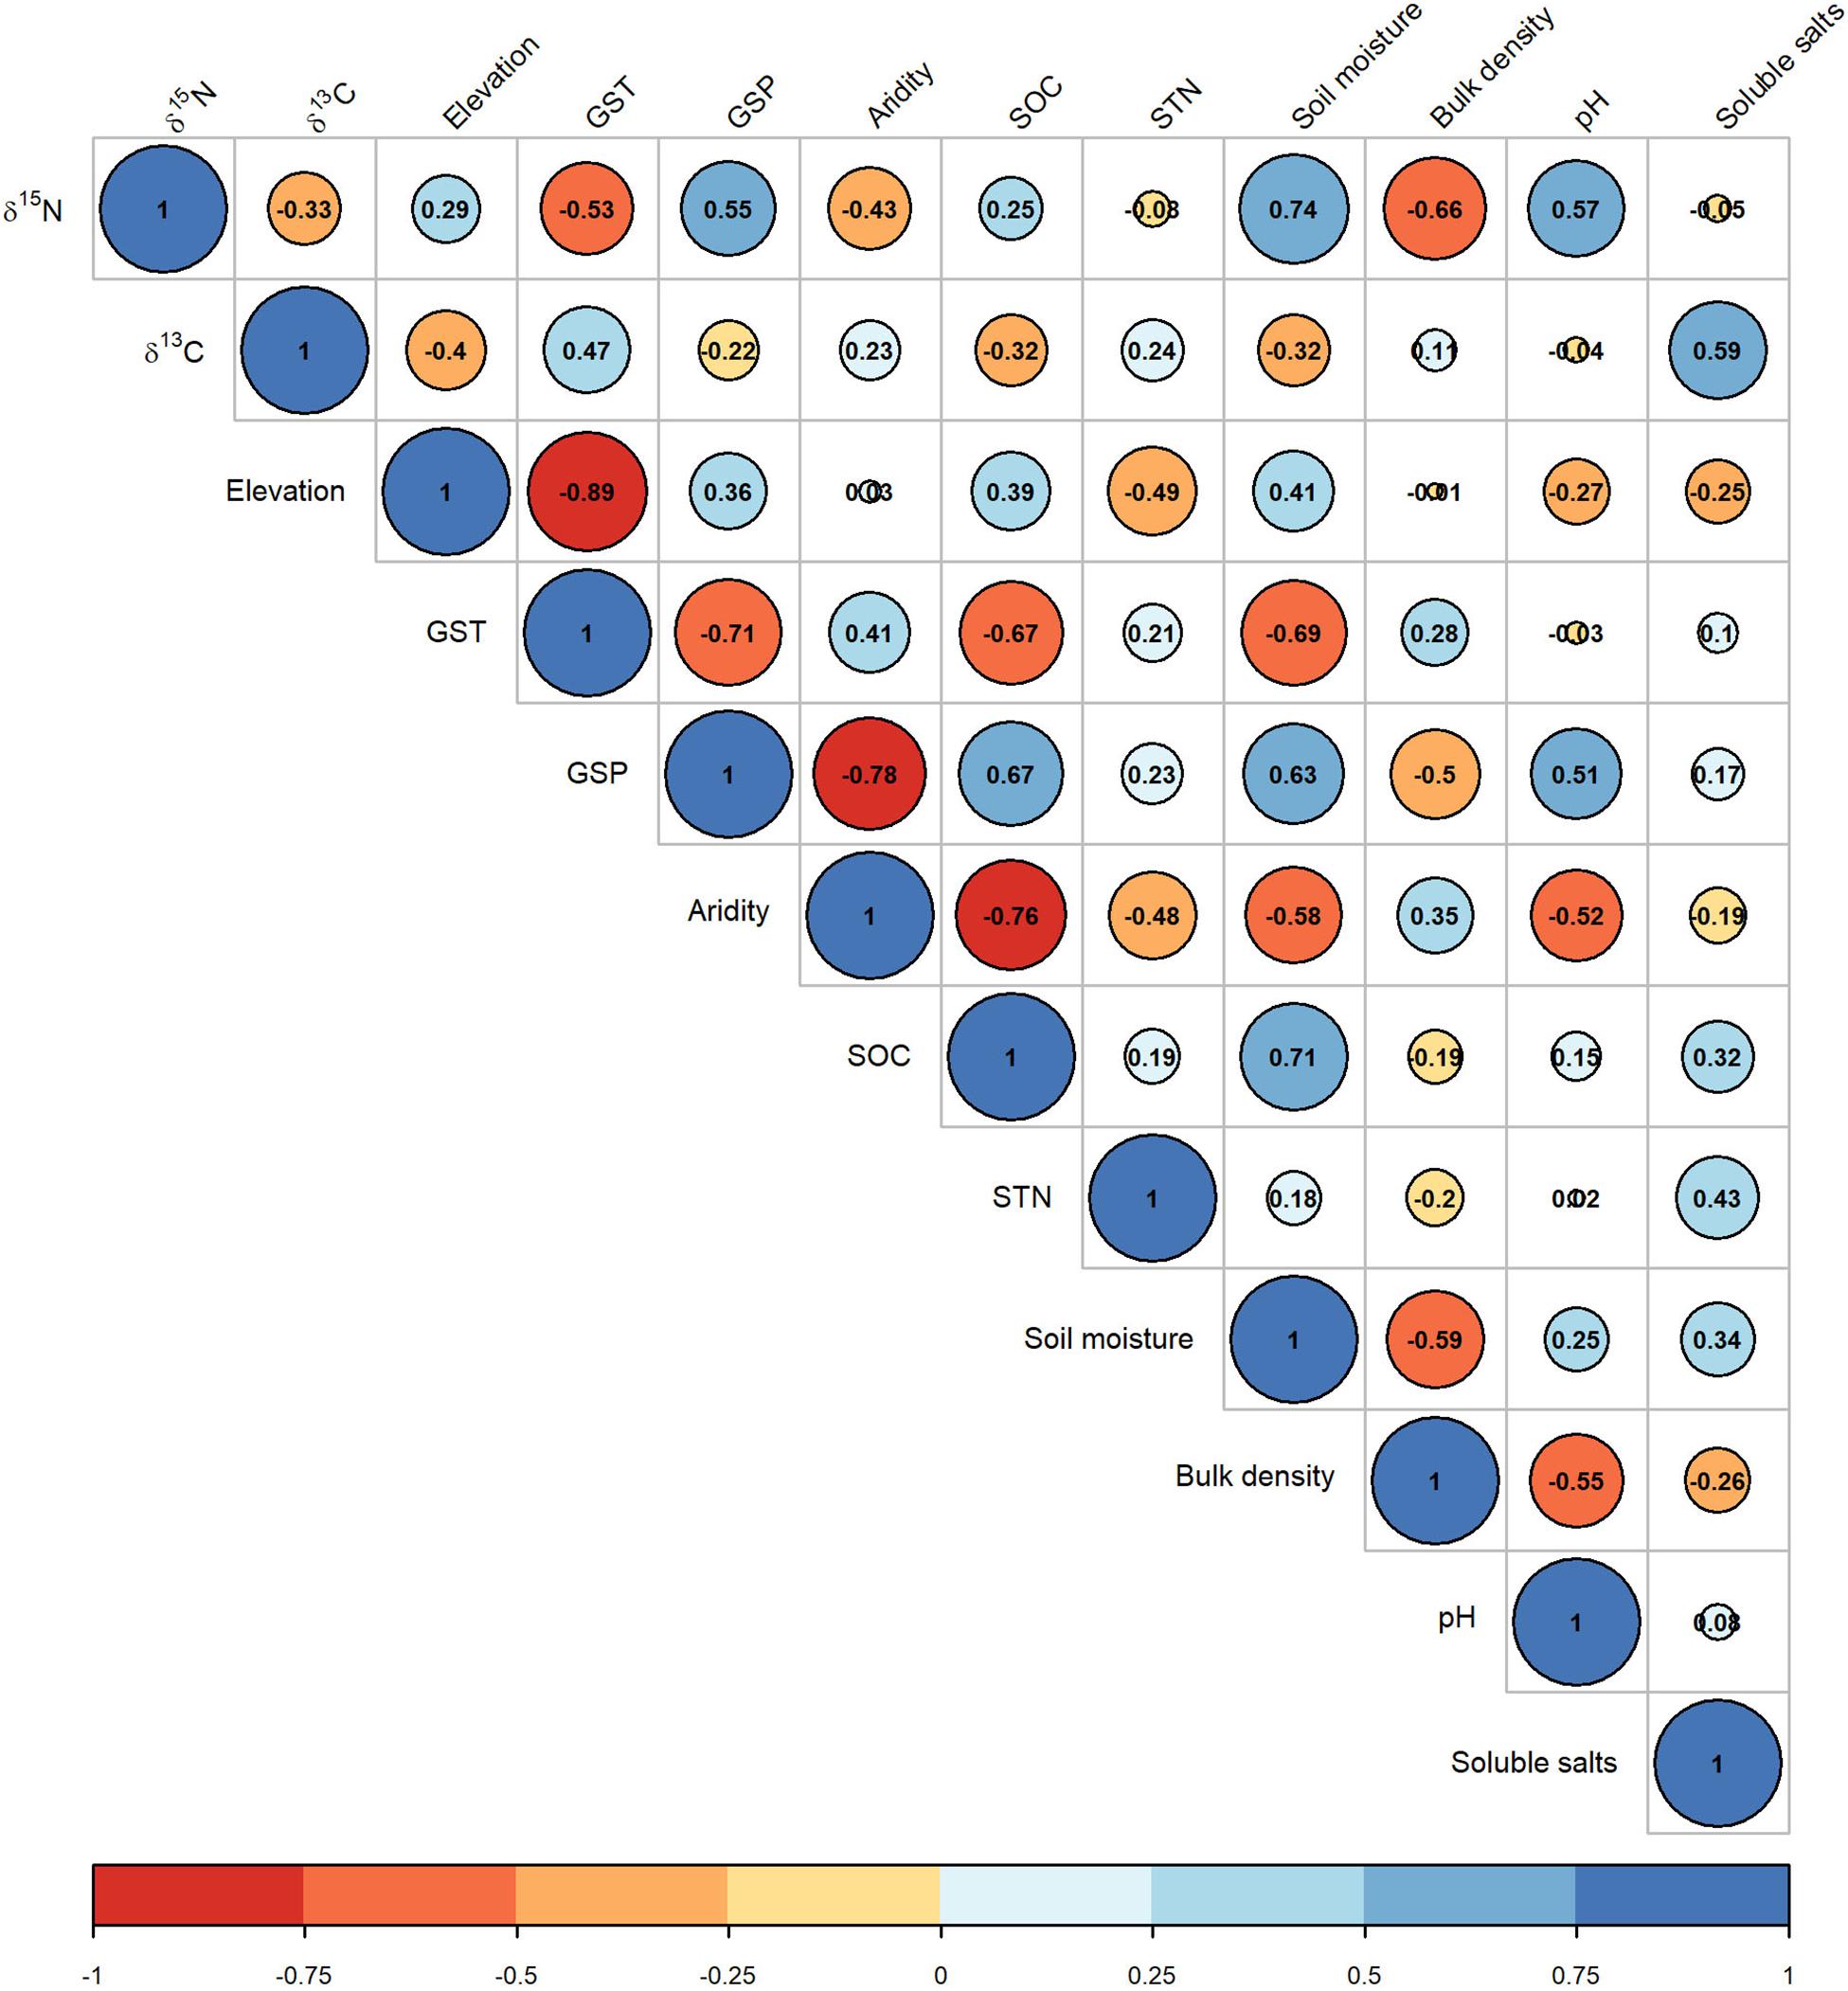
Figure 5. Correlation matrix of the community weighted means of foliar δ15N and δ13C with environmental variables. See abbreviations in Tables 1, 2.
The CWMs of foliar δ15N first decreased and increased with increasing habitat aridity index in 2005 and 2010 (Figure 6C). The CWM of foliar δ15N increases non-linearly with increasing soil pH values in 2005 (Figure 6H, red line). The CWM of foliar δ15N decreased with increasing GST (Figure 6A), soil bulk density in 2005 (Figure 6G, red line), and soil soluble salts in 2010 (Figure 6I, blue line). The CWM of foliar δ15N increased with increasing GSP (Figure 6B), STN in 2010 (Figure 6E, blue line) and soil moisture (Figure 6F). There was no significant correlation between the CWM of foliar δ15N and SOC (Figure 6D).
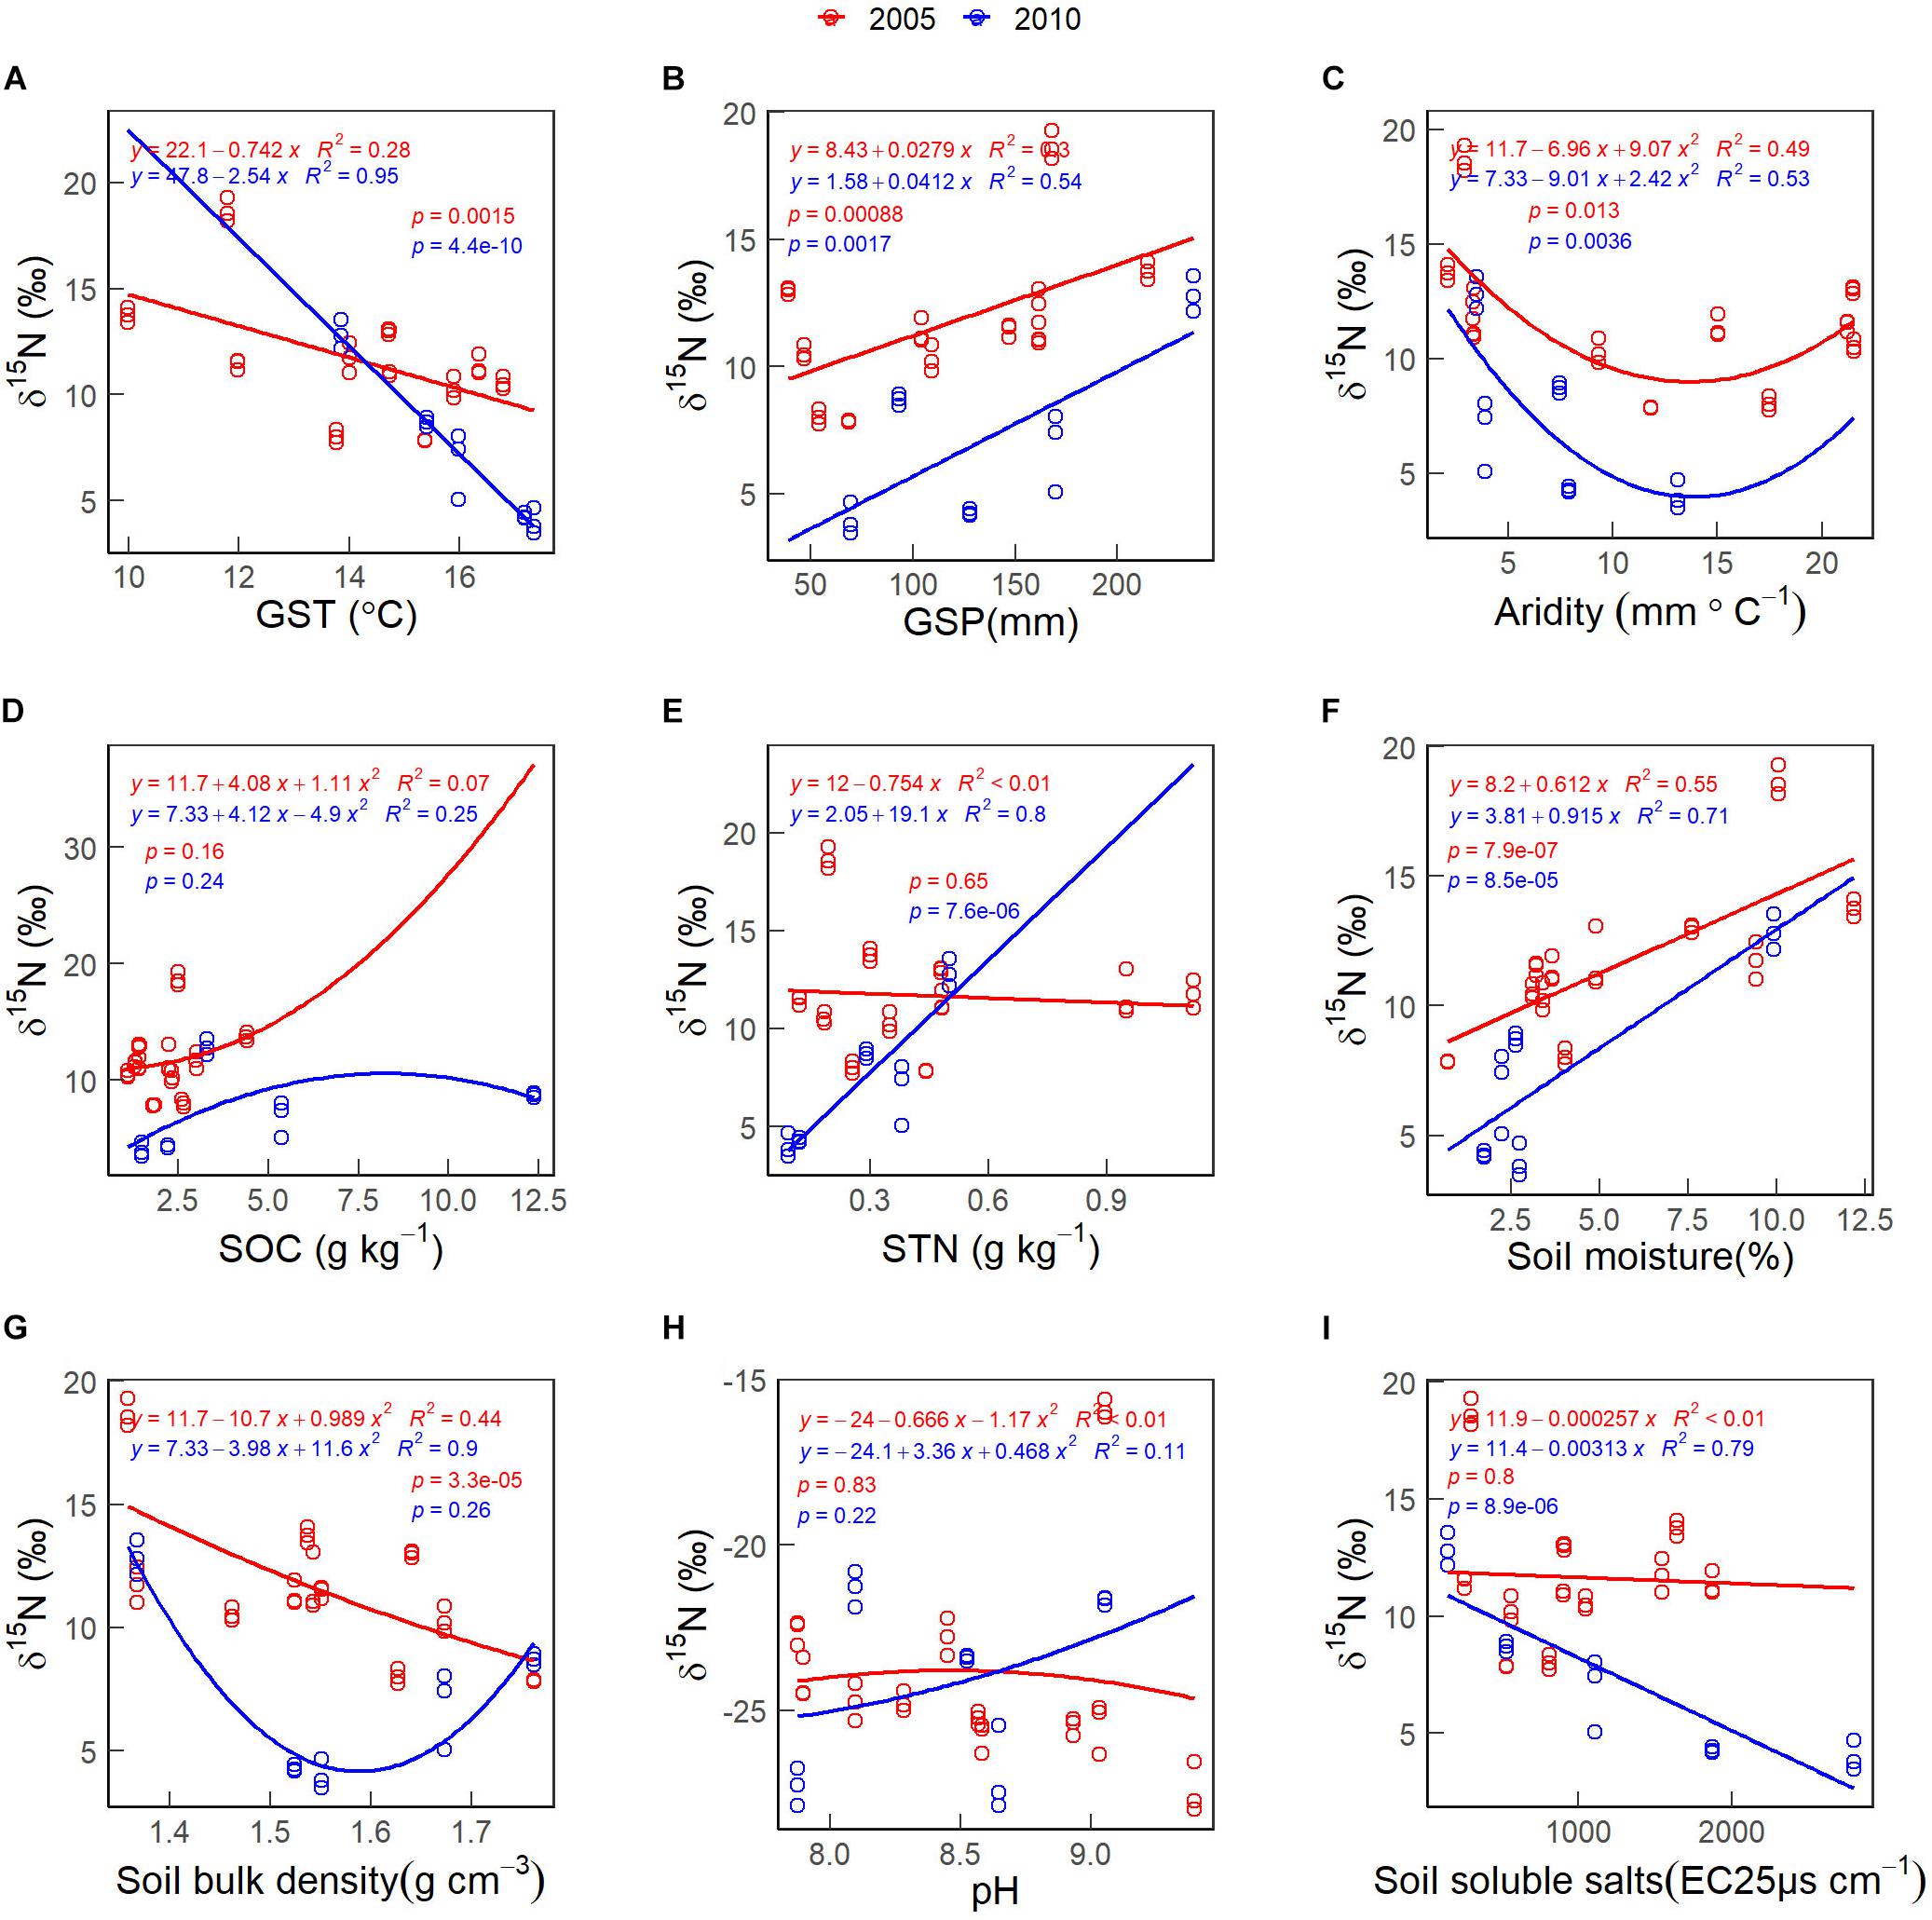
Figure 6. The patterns of the community weighted mean (CWM) of foliar δ15N along with environmental gradients, in 2005 (red lines & circles) and 2010 (blue lines & circles). (A) GST. (B) GSP. (C) Aridity. (D) SOC. (E) STN. (F) Soil moisture. (G) Soil bulk density. (H) pH. (I) Soil soluble salts. See abbreviations in Tables 1, 2.
There was no significant correlation between the CWM of foliar δ13C and GSP (Figure 7B). The CWMs of foliar δ13C first decreased and increased with increasing soil moisture in 2010 (Figure 7F). The CWM of foliar δ13C increases non-linearly with increasing soil bulk density values in 2005 (Figure 7G, red line) and habitat aridity index in 2010 (Figure 7C, blue line). The CWM of foliar δ13C decreases non-linearly with increasing SOC in 2010 (Figure 7D, blue line). The CWM of foliar δ13C decreased with increasing soil pH in 2005 (Figure 7H, red line) and STN in 2010 (Figure 7E, red line). The CWM of foliar δ13C increased with increasing GST (Figure 7A), STN in 2005 (Figure 7E, red line) and soil soluble salts in 2010 (Figure 7I, blue line).
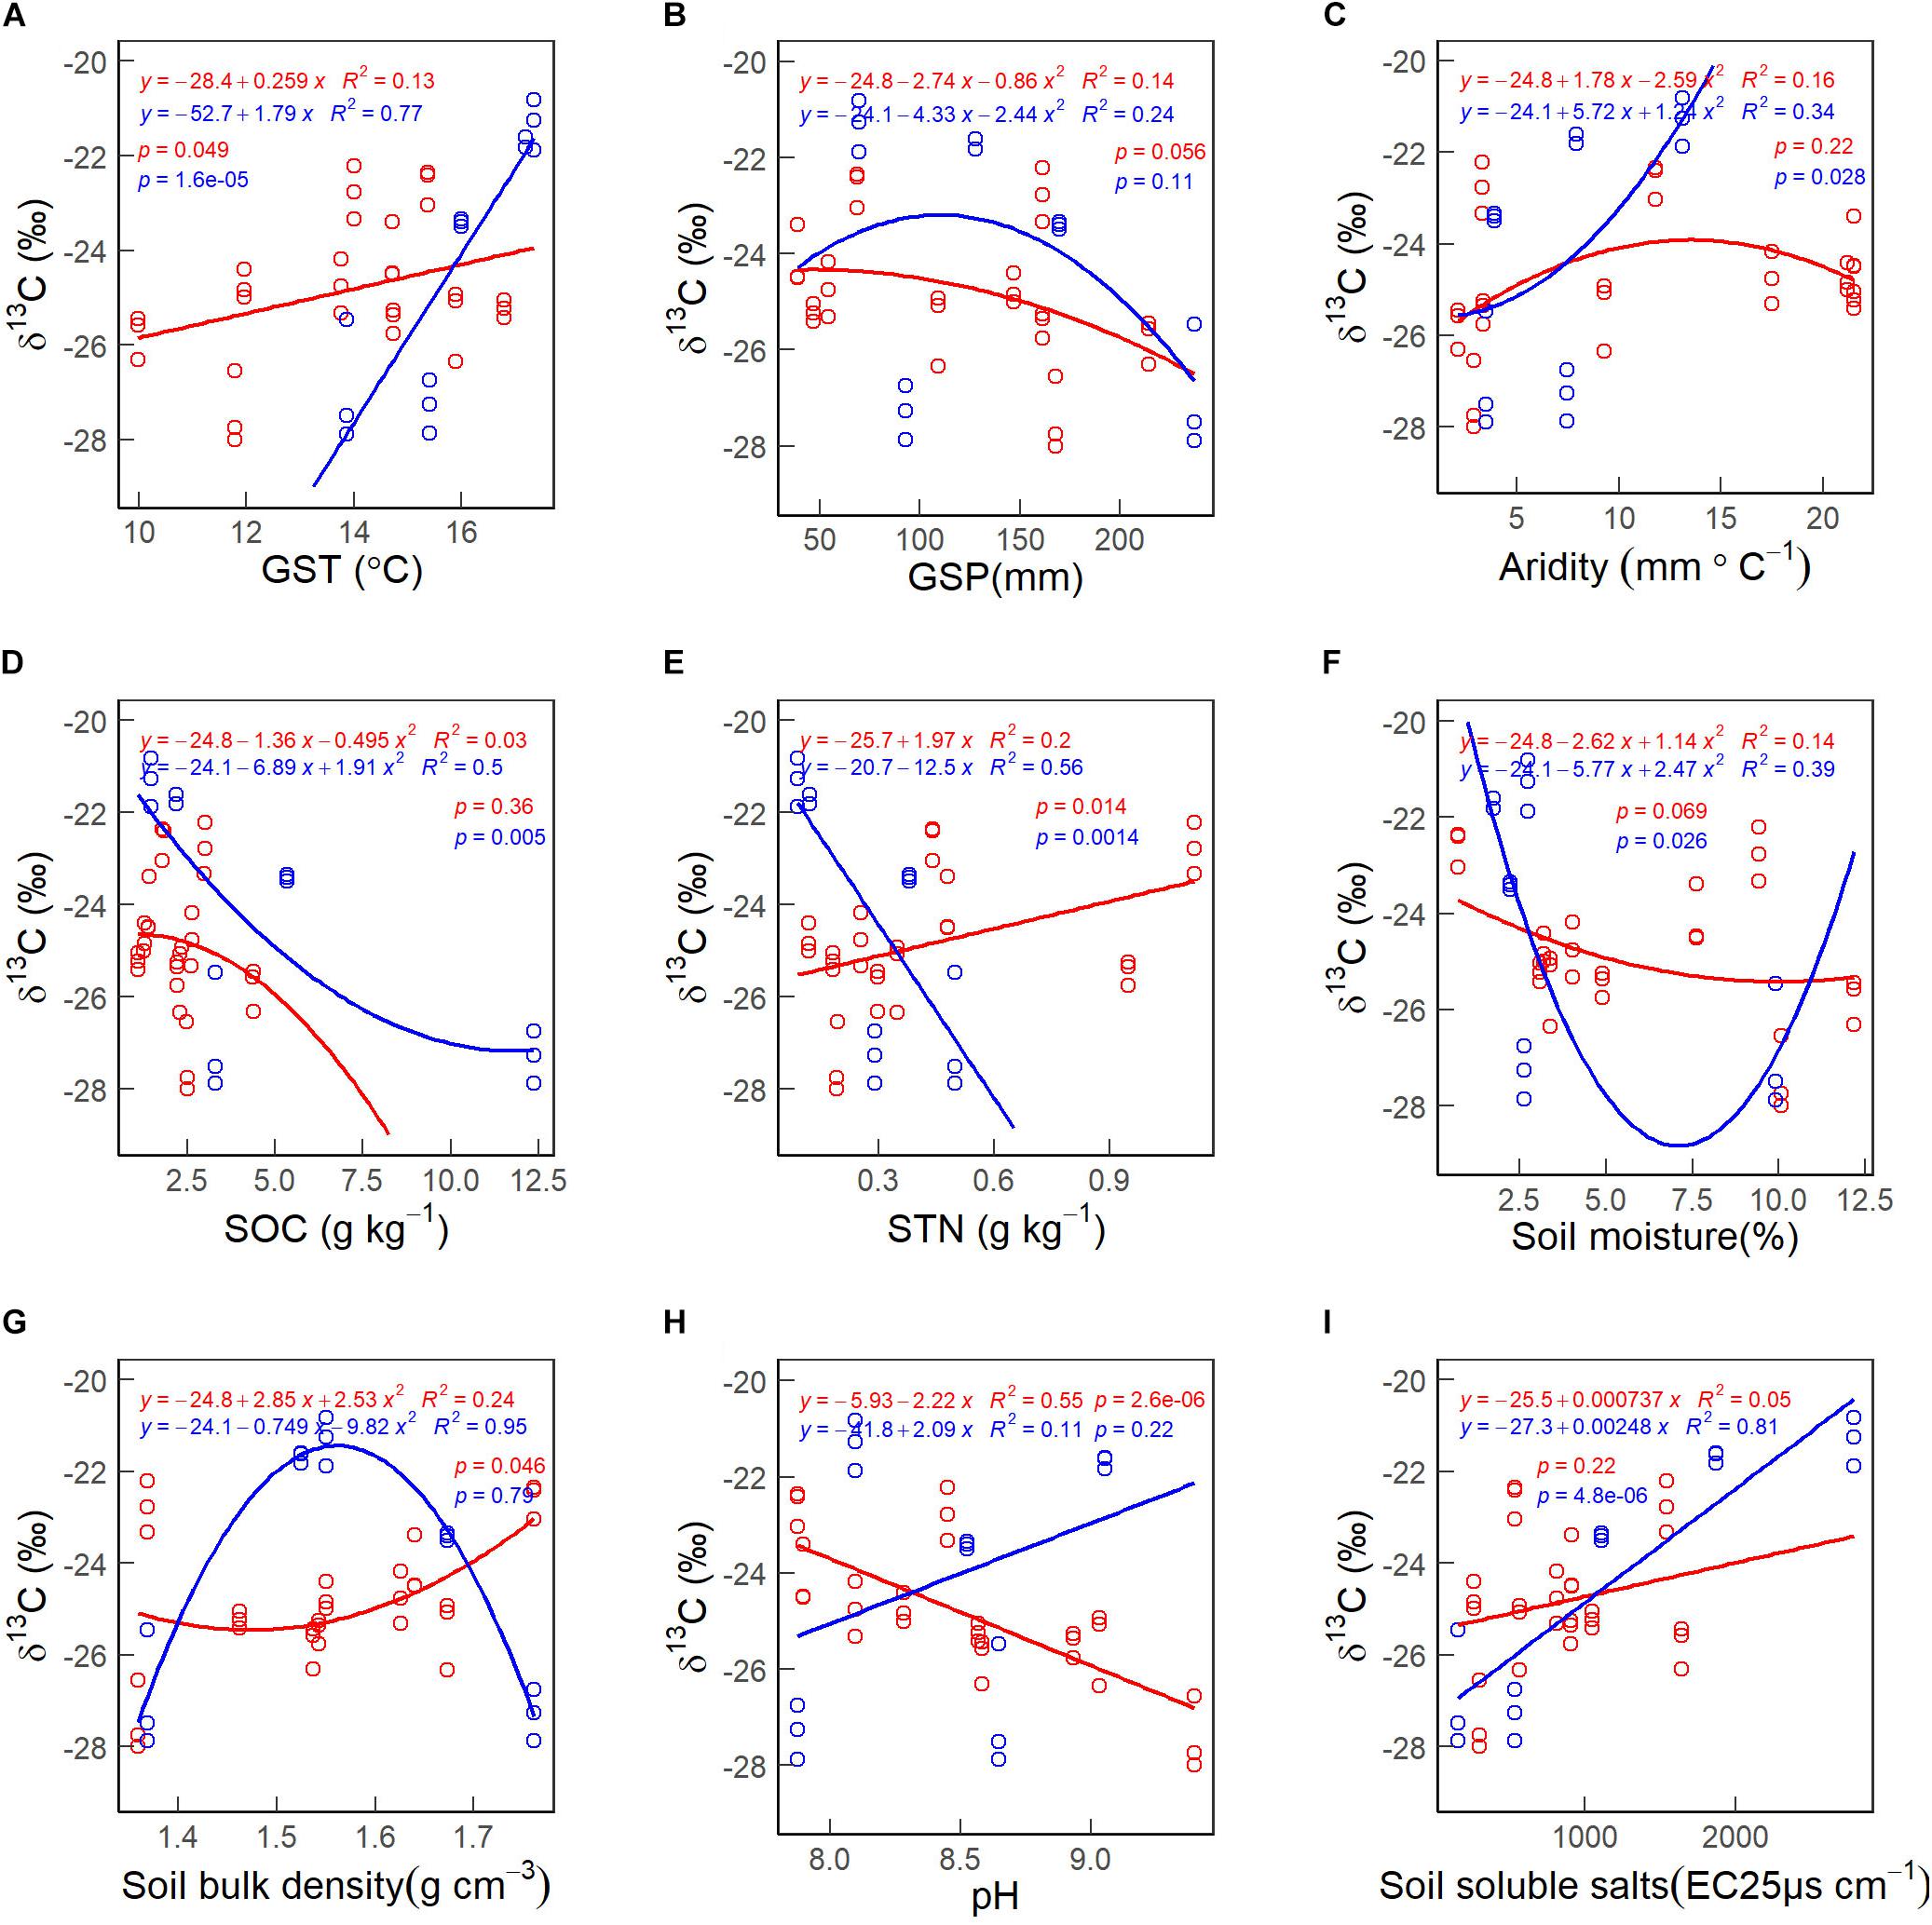
Figure 7. The patterns of the community weighted mean (CWM) of foliar δ13C along with environmental gradients, in 2005 (red lines & circles) and 2010 (blue lines & circles). (A) GST. (B) GSP. (C) Aridity. (D) SOC. (E) STN. (F) Soil moisture. (G) Soil bulk density. (H) pH. (I) Soil soluble salts. See abbreviations in Tables 1, 2.
Soil moisture alone explained 42% of the total variance of the CWM of foliar δ15N, followed by GST for 28% of the variance of the CWM of foliar δ15N within multivariate linear models (Table 3). Soluble soil salt content alone explained around 29.7% of the CWM of foliar δ13C, while GST explained 21.9% of the total variance of the CWM of foliar δ13C within the multivariate linear model (Table 3).
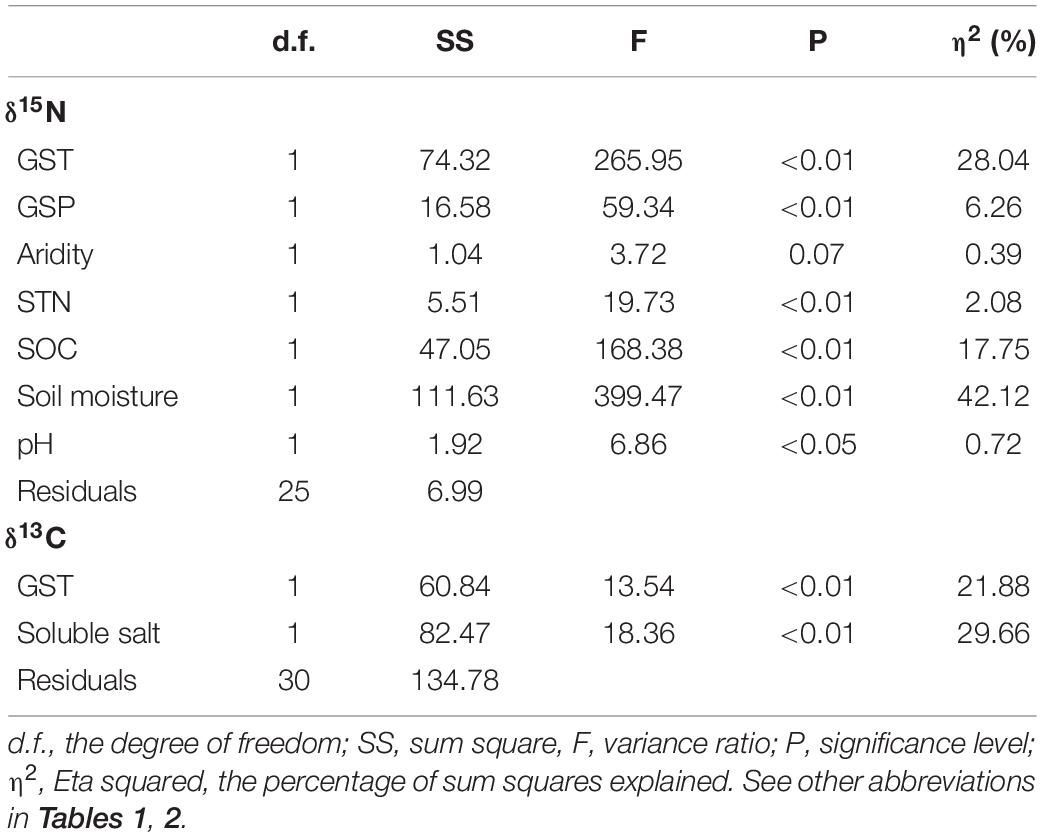
Table 3. Main effects of environmental variables on δ15N and δ13C in multivariate linear models.
Discussion
Foliar δ15N and δ13C Vary Over Time
Foliar δ15N of desert plants is sensitive to climate dry-wet changes. At the species level, there was no significant difference in foliar δ15N range between C3 (1.29–18.82‰) and C4 plants (4.23–15.90‰) (Table 2). Apart from K.gracile (10.52 vs 9.66‰) and S. regelii (9.08 vs 6.81‰), foliar δ15N of other species in 2005 was notably higher than in 2010 (Figure 3A). There was no significant difference in foliar δ15N between cool-wet and warm-dry months for other species (Figure 3C). At the community level, the CWM of foliar δ15N in 2005 was higher than in 2010 (Figure 4A). The CWM of foliar δ15N in the cool-wet months was slightly higher than in the warm-dry ones, but not significantly (P > 0.05, Figure 4C).
These findings are consistent with previous relevant research that positive δ15N (6–10%) values are common in warm/arid regions (Lajtha and Schlesinger, 1986; Schulze et al., 1991), whereas low δ15N values (−4–0%) in cold/humid sites (Vitousek et al., 1989). Climate dry-wet change might affect soil nutrient availability. Amundson et al. (2003) reported that average soil δ15N followed similar patterns as foliar δ15N. The dry-wet changes significantly influence 15N retention and release from soils. Gaseous nitrogen losses are primarily responsible for large scale variational patterns of δ15N (Pataki et al., 2008; Bai and Houlton, 2009). Gaseous N loss (volatilization) would accelerate in dry climates and slowdown in wet ones to affect soil and foliar δ15N because 14N can more quickly release than 15N from the ground (Brenner et al., 2001).
Foliar δ13C of desert plants is mainly controlled by community assembly of C3 and C4 species. C4 plants discriminate less against 13C than C3 plants, and 13C are more enriched in C4 plans (Farquhar et al., 1982; Farquhar, 1983; Farquhar and Cernusak, 2012). This might be why the CWM of foliar δ13C in wetter conditions (2010) was higher than in drier ones (2005) when C4 plants were considered (Figure 4B). This finding is in line with Ghannoum et al. (2002) that C4 plants generally grow better in humid and warm habitats and that droughts can reduce foliar δ13C remarkably in most C4 grasses. Therefore, a higher foliar δ13C in a given community than the global average of C3 plants (about −27‰) can indicate the invasion or bloom of C4 plants and more humid conditions. In short, the higher CWM of foliar δ13C, the more C4 plants or, the more humid condition.
C3 plants are reported more enriched foliar δ13C in arid habitats where plants’ water-use strategies are more conservative than humid ones. Except for the foliar δ13C of K. gracile increased by 1.76‰, other four C3 plants declined their foliar δ13C in the wetter (2010) year (Figure 3B), compared to those in 2005 (Table 2 and Figure 3B). This finding suggests that K. gracile is less drought-tolerant than the other four species and prefers to live in a relatively humid environment. This might be why the difference in the CWMs of foliar δ13C was nonsignificant between the two sampling years when C4 plants were not considered (Figure 4B, red boxes).
However, there was no difference in the CWMs of foliar δ13C between warm-dry and cool-wet months (Figure 4D). It is because foliar δ13C of the seven C3 plants was similar between the warm-dry and cool-wet months in 2010 (Figure 3D). The result was consistent with Gatica et al. (2017) that foliar δ13C in three woody species did not increase toward sites with low precipitation or at the start of the plant growing season (the dry period). This phenomenon further indicates that climate change affects community δ13C via species assembly. As a valuable tool for long-term estimates of WUE (Farquhar et al., 1989), foliar δ13C does not respond significantly to short-time humidity change. The precipitation and temperature in the cool-wet season were 26.28 mm more and 5.25°C lower than in the wet-dry months in 2010 (Figure 2). In deserts, plants have developed stable drought tolerance. Therefore, minor differences in seasonal precipitation can not cause changes in the CWMs of foliar δ13C.
Spatial Patterns of Foliar δ15N and δ13C
The water condition was the most crucial factor affecting plants nitrogen availability and controlling ecosystem N cycling. In our study, water condition (soil moisture and GSP) and GST were the vital factors influencing the CWM of foliar δ15N. On the one hand, water condition (soil moisture and GSP) explained 48.4% of the variance in the CWM of foliar δ15N (Table 3), followed by GST for 28% of the variance. The findings are partly consistent with Wu et al. (2019) that GSP was the most critical driver of δ15N variances in alpine grasslands on the northern Tibetan Plateau. Soil moisture can promote N mineralization and nitrification via microbial activity (Butterbach-Bahl and Gundersen, 2011; Chapin et al., 2011). On the other hand, edaphic factors (63%) explained the more significant variation in the CWM of foliar δ15N than climate factors (35%). The result coincides with Chapin et al. (2011) and Booth et al. (2005) that edaphic variables are critical in controlling ecosystem N cycling.
Ecosystem N losses increase with decreasing MAP and increasing MAT. That is because 15N-depleted gas can release more quickly from the ground (Amundson et al., 2003). We also found that the CWMs of foliar δ15N decreased fastly with increasing MAT (Figure 6A) and decreasing GSP (Figure 6B). The finding is consistent with Wu et al. (2019) but disagrees with Wang et al. (2014). Wang et al. (2014) found that foliar δ15N of grasses and shrubs remain stable with increasing aridity index. Such inconsistency may be due to the habitat conditions. Wang et al. (2014) conducted sampling in arid and semiarid grasslands, where the climate is not so dry as the Qaidam Basin. Besides, the species composition might be another reason why the foliar isotopic response to environmental changes differed. Specifically, Wang et al. (2014) analyzed grass and shrub genera while we only focused on dominant desert shrub species in this study.
Environmental factors also play an essential role in regulating the WUE of plant species. We found soluble soil salt content (29.7%) overrode GST (21.9%) to be the most critical driver for the CWMs of foliar δ13C (Table 3). The finding was consistent with Yang et al. (2015) that edaphic rather than climatic variables were better predictors of 13C enrichment at high altitudes. In this study, the CWMs of foliar δ13C had positively correlated with soil soluble salts and GST (Figures 7A,I), to some extent being consistent with previous studies (Brugnoli and Lauteri, 1991; Wang and Schjoerring, 2012; Wu et al., 2013; Loader and Hemming, 2016; Min et al., 2017).
In Golmud-4, GST and soil soluble salts were 1.75°C and 1870 EC25 μs cm–1 higher, GSP was 87.58 mm less, and the CWM of foliar δ13C (−21.32‰) was 3.52‰ higher than other four sites (−24.84‰) in 2010 (Tables 1, 2 and Figure 7). It could be because the higher soil salt content increases soil solution’s osmotic pressure, reduces soil water potential, and changes soil’s physical and chemical properties (Khasa et al., 2002). The increased salt stress is likely to induce stomatal closure, decrease the partial pressure of 12CO2, force stomatal to absorb more 13CO2, and finally increase δ13C value in plants (del Amor, 2013). The possible explanation for the positive δ13C-GST correlation is that water vapor pressure increases with temperature, making soil moisture and plant transpiration enhanced. Under arid conditions, plants’ stomatal conductance will decrease, resulting in decreased Ci/Ca value and an increase of δ13C when soil available moisture reduces (Morecroft and Woodward, 1996).
Conclusion
This study examined the differences in δ15N and δ13C of desert plants under climate change and disentangled climate and edaphic factors’ relative contribution to the variance in δ15N and δ13C. We further analyzed the interspecific variation in δ15N and δ13C under the weather dry-wet changes. First, foliar δ15N and δ13C was higher in relatively dry conditions compared to wet conditions. Second, foliar δ15N and δ13C primarily affected by soil factors, followed by temperature. Soil moisture was the most critical driver for foliar δ15N, which explained 42.1% of the variance alone. However, the total soluble salt content was the crucial factor in foliar δ13C, responsible for 28.7% of the variance. GST explained 28.0 and 21.9% of the variance in foliar δ15N and δ13C of desert plants in the Qaidam Basin. Besides, foliar δ15N and δ13C are also affected mainly by inter-species differences. In the future, plant functional diversity, like CWMs, can examine how desert species respond to climate change and human disturbance.
Data Availability Statement
The original contributions presented in the study are included in the article/Supplementary Material, further inquiries can be directed to the corresponding author/s.
Author Contributions
HC and JW designed the study. HC conducted field surveys. JW led the writing. WN analyzed the data and wrote the first draft under JW’s help. JW and HC revised the text thoroughly and interpreted the results. All authors contributed to this work and approved the final manuscript before submission.
Funding
This study was jointly supported by the Key Project of the Hebei Normal University (L2021Z05) and the National Natural Sciences Foundation of China (41877448 and 40971118, to HC). The Alexander von Humboldt Foundation provided JW with a 2-year scholarship from 2017 to 2019 in Germany. Since December 2019, JW is funded by the Young Talent Scientist Program of the Chinese Academy of Agricultural Sciences.
Conflict of Interest
The authors declare that the research was conducted in the absence of any commercial or financial relationships that could be construed as a potential conflict of interest.
Acknowledgments
We appreciate Waseem Hassan from Pakistan for polishing and editing the english of this manuscript.
Supplementary Material
The Supplementary Material for this article can be found online at: https://www.frontiersin.org/articles/10.3389/fpls.2021.675817/full#supplementary-material
Supplementary Table 1 | Site information of δ15N and δ13C during the growing season in 2010 in the Qaidam Basin, northeastern Qinghai-Tibetan Plateau.
Supplementary Table 2 | The full models of multivariate linear for δ15N and δ13C. d.f., the degree of freedom; SS, sum square, F, variance ratio; P, significance level; η2, Eta squared, the percentage of sum squares explained. See other abbreviations in Tables 1, 2.
Footnotes
References
Adams, M. A., and Grierson, P. F. (2001). Stable isotopes at natural abundance in terrestrial plant ecology and ecophysiology: an update. Plant Biol. 3, 299–310. doi: 10.1055/s-2001-16454
Amundson, R., Austin, A. T., Schuur, E. A. G., Yoo, K., Matzek, V., Kendall, C., et al. (2003). Global patterns of the isotopic composition of soil and plant nitrogen. Glob. Biogeochel. Cycles 17:1031. doi: 10.1029/2002gb001903
Aranibar, J. N., Otter, L., Macko, S. A., Feral, C. J. W., Epstein, H. E., Dowty, P. R., et al. (2004). Nitrogen cycling in the soil-plant system along a precipitation gradient in the Kalahari sands. Glob. Chang. Biol. 10, 359–373. doi: 10.1111/j.1365-2486.2003.00698.x
Averill, C., Turner, B. L., and Finzi, A. C. (2014). Mycorrhiza-mediated competition between plants and decomposers drives soil carbon storage. Nature 505, 543. doi: 10.1038/nature12901
Bai, E., and Houlton, B. Z. (2009). Coupled isotopic and process-based modelling of gaseous nitrogen losses from tropical rain forests. Glob. Biogeochel. Cycles 23:GB2011. doi: 10.1029/2008gb003361
Beyschlag, W., Hanisch, S., Friedrich, S., Jentsch, A., and Werner, C. (2009). 15N natural abundance during early and late succession in a middle-European dry acidic grassland. Plant Biol. 11, 713–724. doi: 10.1111/j.1438-8677.2008.00173.x
Bol, R., Moering, J., Preedy, N., and Glaser, B. (2004). Short-term sequestration of slurry-derived carbon into particle size fractions of a temperate grassland soil. Isotopes Environ. Health Stud. 40, 81–87. doi: 10.1080/10256010310001605955
Booth, M. S., Stark, J. M., and Rastetter, E. (2005). Controls on nitrogen cycling in terrestrial ecosystems: a synthetic analysis of literature data. Ecol. Monogr. 75, 139–157. doi: 10.1890/04-0988
Brenner, D. L., Amundson, R., Baisden, W. T., Kendall, C., and Harden, J. (2001). Soil N and N-15 variation with time in a California annual grassland ecosystem. Geochim. Cosmochim. Acta 65, 4171–4186. doi: 10.1016/S0016-7037(01)00699-8
Brugnoli, E., and Lauteri, M. (1991). Effects of salinity on stomatal conductance, photosynthetic capacity, and carbon isotope discrimination of salt-tolerant (Gossypium hirsutum L.) and salt-sensitive (Phaseolus vulgaris L.) C3 non-halophytes. Plant Physiol. 2, 628–635.
Butterbach-Bahl, K., and Gundersen, P. (2011). “Nitrogen processes in terrestrial ecosystems,” in The European Nitrogen Assessment, eds M. A. Sutton, C. M. Howard, J. W. Erisman, G. Billen, A. Bleeker, and P. Grennfelt (Cambridge: Cambridge University Press), 99–125. doi: 10.1017/CBO9780511976988.009
Canadell, J. G., Steffen, W. L., and White, P. S. (2002). IGBP/GCTE terrestrial transects: dynamics of terrestrial ecosystems under environmental change. J. Veg. Sci. 13, 298–300. doi: 10.1111/j.1654-1103.2002.tb02054.x
Chapin, F. S., Matson, P. A., and Mooney, H. A. (2011). Principles of Terrestrial Ecosystem Ecology. Berlin: Springer.
Chen, S., Bai, Y., Lin, G., Huang, J., and Han, X. (2007). Variations in δ13C values among major plant community types in the Xilin River Basin. Inner Mongolia China. Aust. J. Bot. 55, 48–54. doi: 10.1071/bt06053
Dawson, T. E., Mambelli, S., Plamboeck, A. H., Templer, P. H., and Tu, K. P. (2002). Stable isotopes in plant ecology. Annu. Rev. Ecol. Syst. 33, 507–559.
del Amor, F. M. (2013). Variation in the leaf δ13C is correlated with salinity tolerance under elevated CO2 concentration. J. Plant Physiol. 170, 283–290. doi: 10.1016/j.jplph.2012.10.019
Diefendorf, A. F., Mueller, K. E., Wing, S. L., Koch, P. L., and Freeman, K. H. (2010). Global patterns in leaf C-13 discrimination and implications for studies of past and future climate. Proc. Natl. Acad. Sci. U.S.A. 107, 5738–5743. doi: 10.1073/pnas.0910513107
Dodd, J. P., Patterson, W. P., Holmden, C., and Brasseur, J. M. (2008). Robotic micromilling of tree-rings: a new tool for obtaining subseasonal environmental isotope records. Chem. Geol. 252, 21–30. doi: 10.1016/j.chemgeo.2008.01.021
Elmore, A. J., Craine, J. M., Nelson, D. M., and Guinn, S. M. (2017). Continental-scale variability of foliar nitrogen and carbon isotopes in Populus balsamifera and their relationships with climate. Sci. Rep. 7:7759. doi: 10.1038/s41598-017-08156-x
Farquhar, G. D. (1983). On the nature of carbon isotope discrimination in C4 species. Funct. Plant Biol. 10, 205–226.
Farquhar, G. D., and Cernusak, L. A. (2012). Ternary effects on the gas exchange of isotopologues of carbon dioxide. Plant Cell Environ. 35, 1221–1231. doi: 10.1111/j.1365-3040.2012.02484.x
Farquhar, G. D., Ehleringer, J. R., and Hubick, K. T. (1989). Carbon isotope discrimination and photosynthesis. Annu. Rev. Plant Physiol. Plant Mol. Biol. 40, 503–537. doi: 10.1146/annurev.arplant.40.1.503
Farquhar, G. D., O’Leary, M. H., and Berry, J. A. (1982). On the relationship between carbon isotope discrimination and the intercellular carbon dioxide concentration in leaves. Funct. Plant Biol. 9, 121–137.
Garten, C. T., Cooper, L. W., Iii, W. M. P., and Hanson, P. J. (2000). Climate controls on forest soil C isotope ratios in the southern Appalachian mountains. Ecology 81, 1108–1119.
Gatica, M. G., Aranibar, J. N., and Pucheta, E. (2017). Environmental and species-specific controls on δ13C and δ15N in dominant woody plants from central-western Argentinian drylands. Austral. Ecol. 42, 533–543. doi: 10.1111/aec.12473
Ghannoum, O., Caemmerer, S. V., and Conroy, J. P. (2002). The effect of drought on plant water use efficiency of nine NAD-ME and nine NADP-ME Australian C4 grasses. Funct. Plant Biol. 29, 1337–1348. doi: 10.1071/FP02056
Golluscio, R. A., and Oesterheld, M. (2007). Water use efficiency of twenty-five co-existing Patagonian species growing under different soil water availability. Oecologia 154, 207–217. doi: 10.1007/s00442-007-0800-5
Handley, L. L., Austin, A. T., Stewart, G. R., Robinson, D., Scrimgeour, C. M., Raven, J. A., et al. (1999). The 15N natural abundance (δ15N) of ecosystem samples reflects measures of water availability. Funct. Plant Biol. 26, 185–199. doi: 10.1071/pp98146
Hultine, K. R., and Marshall, J. D. (2000). Altitude trends in conifer leaf morphology and stable carbon isotope composition. Oecologia 123, 32–40. doi: 10.1007/s004420050986
Huxman, T. E., Snyder, K. A., Tissue, D., Leffler, A. J., Ogle, K., Pockman, W. T., et al. (2004). Precipitation pulses and carbon fluxes in semiarid and arid ecosystems. Oecologia 141, 254–268. doi: 10.1007/s00442-004-1682-4
Khasa, P. D., Hambling, B., Kernaghan, G., Fung, M., and Ngimbi, E. (2002). Genetic variability in salt tolerance of selected boreal woody seedlings. Forest Ecol. Manag. 165, 257–269. doi: 10.1016/s0378-1127(01)00623-5
Klaus, V. H., Holzel, N., Prati, D., Schmitt, B., Schoning, I., Schrumpf, M., et al. (2013). Organic vs. conventional grassland management: do 15N and 13C isotopic signatures of hay and soil samples differ? PLoS One 8:e78134. doi: 10.1371/journal.pone.0078134
Lajtha, K., and Schlesinger, W. H. (1986). Plant response to variations in nitrogen availability in a desert shrubland community. Biogeochemistry 2, 29–37. doi: 10.1007/bf02186963
Lazaro-Nogal, A., Forner, A., Traveset, A., and Valladares, F. (2013). Contrasting water strategies of two Mediterranean shrubs of limited distribution: uncertain future under a drier climate. Tree Physiol. 33, 1284–1295. doi: 10.1093/treephys/tpt103
Li, H. T., Xia, J., Xiang, L., Liang, T., and Liu, Q. J. (2005). Seasonal variation of δ13C of four tree species: a biological integrator of environmental variables. J. Integr. Plant Biol. 47, 1459–1469. doi: 10.1111/j.1744-7909.2005.00184.x
Li, J. Z., Wang, G. A., Liu, X. Z., Han, J. M., Liu, M., and Liu, X. J. (2009). Variations in carbon isotope ratios of C3 plants and distribution of C4 plants along an altitudinal transect on the eastern slope of Mount Gongga. Sci. China Ser D Earth Sci. 52, 1714–1723. doi: 10.1007/s11430-009-0170-4
Lin, X. W., Zhang, Z. H., Wang, S. P., Hu, Y. G., Xu, G. P., Luo, C. Y., et al. (2011). Response of ecosystem respiration to warming and grazing during the growing seasons in the alpine meadow on the Tibetan plateau. Agric. For. Meteorol. 151, 792–802. doi: 10.1016/j.agrformet.2011.01.009
Loader, N. J., and Hemming, D. L. (2016). Spatial variation in pollen δ13C correlates with temperature and seasonal development timing. Holocene. 11, 587–592. doi: 10.1191/095968301680223530
Loader, N. J., McCarroll, D., Gagen, M., Robertson, I., and Jalkanen, R. (2007). Extracting Climatic Information From Stable Isotopes in Tree Rings, in Stable Isotopes as Indicators of Ecological Change. Amsterdam: Elsevier, 25–48.
Lu, X., Fan, J., Yan, Y., and Wang, X. (2013). Responses of soil CO2 fluxes to short-term experimental warming in alpine steppe ecosystem. Northern Tibet. PLoS One 8:e59054. doi: 10.1371/journal.pone.0059054
Ma, J. Y., Sun, W., Sun, H. L., and Wang, S. M. (2012). Stable carbon isotope characteristics of desert plants in the Junggar Basin. China. Ecol. Res. 27, 115–124. doi: 10.1007/s11284-011-0878-4
Martinelli, L. A., Piccolo, M. C., Townsend, A. R., Vitousek, P. M., Cuevas, E., McDowell, W., et al. (1999). Nitrogen stable isotopic composition of leaves and soil: tropical versus temperate forests. Biogeochemistry 46, 45–65. doi: 10.1007/bf01007573
Min, X. J., Ma, J. Y., Timurbuick, B., and Zang, Y. X. (2017). Effects of water and salinity stress on carbon and nitrogen isotopic compositions in leaves of Tamarix elongata and Haloxylon ammodendron. Arid Land Res. 34, 1109–1116. doi: 10.13866/j.azr.2017.05.20
Morecroft, M. D., and Woodward, F. I. (1996). Experiments on the causes of altitudinal differences in the leaf nutrient contents, size and δ13C of Alchemilla alpina. New Phytol. 134, 471–479. doi: 10.1111/j.1469-8137.1996.tb04364.x
Moreno-Gutierrez, C., Dawson, T. E., Nicolas, E., and Querejeta, J. I. (2012). Isotopes reveal contrasting water use strategies among coexisting plant species in a Mediterranean ecosystem. New Phytol. 196, 489–496. doi: 10.1111/j.1469-8137.2012.04276.x
Newman, B. D., Wilcox, B. P., Archer, S. R., Breshears, D. D., Dahm, C. N., Duffy, C. J., et al. (2006). Ecohydrology of water-limited environments: a scientific vision. Water Resour. Res. 42:W06302. doi: 10.1029/2005wr004141
Pataki, D. E., Billings, S. A., Naumburg, E., and Goedhart, C. M. (2008). Water sources and nitrogen relations of grasses and shrubs in phreatophytic communities of the Great Basin Desert. J. Arid Environ. 72, 1581–1593. doi: 10.1016/j.jaridenv.2008.03.011
Peri, P. L., Ladd, B., Pepper, D. A., Bonser, S. P., Laffan, S. W., and Amelung, W. (2012). Carbon (δ13C) and nitrogen (δ15N) stable isotope composition in plant and soil in Southern Patagonia’s native forests. Glob. Chang. Biol. 18, 311–321. doi: 10.1111/j.1365-2486.2011.02494.x
Powers, J. S., and Schlesinger, W. H. (2002). Geographic and vertical patterns of stable carbon isotopes in tropical rain forest soils of Costa Rica. Geoderma 109, 141–160. doi: 10.1016/s0016-7061(02)00148-9
Qiang, W.-Y., Wang, X.l, Chen, T., Feng, H.-Y., An, L.-Z., He, Y.-Q., et al. (2003). Variations of stomatal density and carbon isotope values of Picea crassifolia at different altitudes in the Qilian Mountains. Trees 17, 258–262. doi: 10.1007/s00468-002-0235-x
Robinson, D. (2001). δ15N as an integrator of the nitrogen cycle. Trends Ecol. Evol. 16, 153–162. doi: 10.1016/s0169-5347(00)02098-x
Rozenberg, G. S., Zuur, A. F., Ieno, E. N., Walker, N., Saveliev, A. A., and Smith, G. M. (2011). Mixed Effects Models and Extensions in Ecology With R, Vol. 131. Berlin: Springer Sci, 220–222.
Saurer, M., Siegenthaler, U., and Schweingruber, F. (1995). The climate-carbon isotope relationship in tree-rings and the significance of site conditions. Tellus B 47, 320–330. doi: 10.1034/j.1600-0889.47.issue3.4.x
Schulze, E. D., Gebauer, G., Ziegler, H., and Lange, O. L. (1991). Estimates of nitrogen fixation by trees on an aridity gradient in Namibia. Oecologia 88, 451–455. doi: 10.1007/BF00317592
Song, M., Duan, D., Chen, H., Hu, Q., Zhang, F., Xu, X., et al. (2008). Leaf δ13C reflects ecosystem patterns and responses of alpine plants to the environments on the Tibetan Plateau. Ecography 31, 499–508. doi: 10.1111/j.0906-7590.2008.05331.x
Tan, K., Ciais, P., Piao, S. L., Wu, X. P., Tang, Y. H., Vuichard, N., et al. (2010). Application of the ORCHIDEE global vegetation model to evaluate biomass and soil carbon stocks of Qinghai-Tibetan grasslands. Glob. Biogeochem. Cy. 24:GB1013. doi: 10.1029/2009gb003530
Vitousek, P. M., Shearer, G., and Kohl, D. H. (1989). Foliar 15N natural abundance in Hawaiian rainforest: patterns and possible mechanisms. Oecologia 78, 383–388. doi: 10.1007/BF00379113
Wang, C., Wang, X. B., Liu, D. W., Wu, H. H., Lu, X. T., Fang, Y. T., et al. (2014). Aridity threshold in controlling ecosystem nitrogen cycling in arid and semi-arid grasslands. Nat. Commu. 5:4799. doi: 10.1038/ncomms5799
Wang, G., Han, J., Zhou, L., Xiong, X., and Wu, Z. (2005). Carbon isotope ratios of plants and occurrences of C4 species under different soil moisture regimes in arid region of Northwest China. Physiol. Plantarum. 125, 74–81. doi: 10.1111/j.1399-3054.2005.00549.x
Wang, G., Zhou, L., Liu, M., Han, J., Guo, J., Faiia, A., et al. (2010). Altitudinal trends of leaf δ13C follow different patterns across a mountainous terrain in north China characterized by a temperate semi-humid climate. Rapid Commun. Mass Sp. 24, 1557–1564. doi: 10.1002/rcm.4543
Wang, L., and Schjoerring, J. K. (2012). Seasonal variation in nitrogen pools and 15N/13C natural abundances in different tissues of grassland plants. Biogeosciences 9, 1583–1595. doi: 10.5194/bg-9-1583-2012
Wang, P. P. (2018). Effects of Global Change on Physiological Characteristics of Typical Alpine Meadow Plants in Tibetan Plateau. Master Thesis. Nanjing: Nanjing University of Information Science and Technology.
Warren, C. R., McGrath, J. F., and Adams, M. A. (2001). Water availability and carbon isotope discrimination in conifers. Oecologia 127, 476–486. doi: 10.1007/s004420000609
Werner, C., Schnyder, H., Cuntz, M., Keitel, C., Zeeman, M. J., Dawson, T. E., et al. (2012). Progress and challenges in using stable isotopes to trace plant carbon and water relations across scales. Biogeosciences 9, 3083–3111. doi: 10.5194/bg-9-3083-2012
Wu, J. S., Song, M. H., Ma, W. L., Zhang, X. Z., Shen, Z. X., Tarolli, P., et al. (2019). Plant and soil’s δ15N are regulated by climate, soil nutrients, and species diversity in alpine grasslands on the northern Tibetan Plateau. Agr. Ecosyst. Environ. 281, 111–123. doi: 10.1016/j.agee.2019.05.011
Wu, J. S., Zhang, X. Z., Shen, Z. X., Shi, P. L., Xu, X. L., and Li, X. J. (2013). Grazing-exclusion effects on aboveground biomass and water-use efficiency of alpine grasslands on the Northern Tibetan Plateau. Rangeland Ecol. Manag. 66, 454–461. doi: 10.2111/Rem-D-12-00051.1
Yang, Y. H., Fang, J. Y., Smith, P., Tang, Y. H., Chen, A. P., Ji, C. J., et al. (2009). Changes in topsoil carbon stock in the Tibetan grasslands between the 1980s and 2004. Glob. Chang. Biol. 15, 2723–2729. doi: 10.1111/j.1365-2486.2009.01924.x
Yang, Y. H., Ji, C. J., Chen, L. Y., Ding, J. Z., Cheng, X. L., and Robinson, D. (2015). Edaphic rather than climatic controls over 13C enrichment between soil and vegetation in alpine grasslands on the Tibetan Plateau. Funct. Ecol. 29, 839–848. doi: 10.1111/1365-2435.12393
Keywords: carbon isotopic composition, environmental gradients, nitrogen isotopic composition, nitrogen utilization strategy, water use efficiency
Citation: Niu W, Chen H and Wu J (2021) Soil Moisture and Soluble Salt Content Dominate Changes in Foliar δ13C and δ15N of Desert Communities in the Qaidam Basin, Qinghai-Tibetan Plateau. Front. Plant Sci. 12:675817. doi: 10.3389/fpls.2021.675817
Received: 05 March 2021; Accepted: 17 June 2021;
Published: 08 July 2021.
Edited by:
Feng Cheng, University of Nevada, Reno, United StatesCopyright © 2021 Niu, Chen and Wu. This is an open-access article distributed under the terms of the Creative Commons Attribution License (CC BY). The use, distribution or reproduction in other forums is permitted, provided the original author(s) and the copyright owner(s) are credited and that the original publication in this journal is cited, in accordance with accepted academic practice. No use, distribution or reproduction is permitted which does not comply with these terms.
*Correspondence: Hui Chen, Y2hlbmh1aTcyMDEyN0BvdXRsb29rLmNvbQ==; Jianshuang Wu, d3VqaWFuc2h1YW5nQGNhYXMuY24=