
95% of researchers rate our articles as excellent or good
Learn more about the work of our research integrity team to safeguard the quality of each article we publish.
Find out more
ORIGINAL RESEARCH article
Front. Plant Sci. , 26 May 2021
Sec. Plant Breeding
Volume 12 - 2021 | https://doi.org/10.3389/fpls.2021.653270
 Pawan Kumar1
 Somveer Nimbal1*
 Rajvir Singh Sangwan1
 Neeraj Budhlakoti2
 Varsha Singh3†
 Dwijesh Chandra Mishra2
 Sagar1
 Raju Ram Choudhary1
Improving the yield of lint is the main objective for most of the cotton crop improvement programs throughout the world as it meets the demand of fiber for textile industries. In the current study, 96 genotypes of Gossypium hirsutum were used to find novel simple sequence repeat marker-based associations for lint yield contributing traits by linkage disequilibrium. Extensive phenotyping of 96 genotypes for various agronomic traits was done for two consecutive years (2018 and 2019) in early, normal, and late sown environments. Out of 168 SSR markers screened over the 96 genotypes, a total of 97 polymorphic markers containing 293 alleles were used for analysis. Three different models, i.e., mixed linear model (MLM), compressed mixed linear model (CMLM), and multiple locus mixed linear model (MLMM), were used to detect the significant marker–trait associations for six different environments separately. A total of 38 significant marker–trait associations that were common to at least two environments were considered as promising associations and detailed annotation of the significant markers has been carried out. Twenty-two marker–trait associations were found to be novel in the current study. These results will be very useful for crop improvement programs using marker-assisted cotton breeding.
Cotton is the most important fiber crop in the world and comprises 52 different species. Among these, two diploid species (2n = 2x = 26), viz. Gossypium arboreum L. and Gossypium herbaceum L., and two tetraploids (2n = 4x = 52), viz. Gossypium barbadense L. and Gossypium hirsutum L., are commercially grown and considered to be very important. G. hirsutum L. itself covers ∼95% of the global land area under production of cotton because of its wider adaptability and high lint yield. India has the largest area and production for cotton in the world though productivity (yield per hectare) is considerably lesser as compared with the rest of the world (ICAR-AICRP, 2019–2020). To cope with the increasing demand for cotton in textile industries, it is very essential to develop high-yielding cotton varieties and hybrids. In the last few decades, most of the available germplasm has been used in conventional breeding based on morphological markers for the development of cotton hybrids or varieties (Van Esbroeck and Bowman, 1998). Morphological traits classify the genotypes only on the basis of visible variations that can be affected by environmental changes as well as agronomic practices. The development of hybrids and varieties for higher lint yield with desirable fiber quality parameters is the most important objective of the cotton improvement programs all over the world. However, further enhancing cotton productivity is a challenging task for breeders due to extensive use of locally available germplasm (Tyagi et al., 2014; Zhang et al., 2020) and the high impact of environmental fluctuations on these yield contributing traits.
In plants, molecular background for traits such as yield and quality is identified by quantitative trait locus (QTL) mapping, which includes high-density molecular marker linkage map constructions in a population developed using two or limited parents (Fang et al., 2013). Usage of bi-parental population for QTL mapping covers a small portion of the genome and is a costly, tedious, and higher risk task. It is a “classical approach” and will continue to be the main tool for gene tagging in crops; however, it is very expensive (Stich et al., 2006) and has low resolution while evaluating only a few alleles simultaneously (Flint-Garcia et al., 2003). A major drawback of QTL linkage mapping is that it is deficient in fine mapping, as only a few available meiotic events are used in the mapping (Jannink and Walsh, 2002). To overcome the drawback of bi-parental QTL mapping, LD (linkage disequilibrium)-based association mapping has attained popularity among plant geneticists in the last two decades (Jannink et al., 2001). The starting point for association mapping is based on the non-random associations of alleles present at different loci or marker locus to the phenotypic trait. LD-based association mapping uses natural populations for mapping purposes and thus it is a method with high resolution. However, LD can be caused by many underlying factors such as unknown population structure and several forces, which include mutation, genetic bottlenecks, drift, founder effects, selection, and inbreeding level (particularly for plants). Characterization of LD level and patterns in a population are pre-requisite for use of LD mapping in crop plants. Discrimination between physical LD and other forces that can create LD in natural populations is important to avoid the detection of spurious associations. LD decay with respect to an increase in distance between markers is faster in outcrossing plants than inbreeding plants (Zhao et al., 2014). A population-based association study has many advantages over bi-parental traditional QTL-mapping such as (a) many alleles are evaluated simultaneously, so there are broader genetic variations available with wider background for the marker–trait association (MTA); (b) higher mapping resolution due to the number of recombination events that occurred over a long germplasm development history; and (c) the process is also time-saving and cost-effective (Hansen et al., 2001; Kraakman et al., 2004, 2006).
In cotton, the first attempt at association mapping was taken by Kantartzi and Stewart in 2008. In this study, they detected 30 markers associated with fiber-related traits based on 98 simple sequence repeat (SSR) markers using 56 G. arboreum genotypes. Afterward, a number of attempts have been made even using next-generation sequencing (NGS) to find the MTA for various agronomic traits (Cai et al., 2014; Mei et al., 2017; Dong C. et al., 2018; Ali et al., 2020; Zhang et al., 2020), fiber quality traits (Nie et al., 2016; Abdullaev et al., 2017; Ademe et al., 2017; Iqbal and Rahman, 2017; Dong C. G. et al., 2018; Huang et al., 2018), and biotic/abiotic stress tolerance (Wang et al., 2016; Zhao et al., 2016; Baytar et al., 2017; Sun et al., 2019) using molecular marker-based approach exhausting different germplasm of Gossypium sp. Though association studies based on SNP through genotyping by sequencing (GBS) and NGS are more promising and more efficient than SSR, the cost of sequencing makes this technique not readily available for researchers in undeveloped and developing countries, while easy accessibility of PCR thermo-cycler and SSR markers has kept their importance in the research field. Application of LD-based association mapping in cotton has not only accelerated MAS programs but also added to our knowledge and understanding of the complex cotton genome and its evolution. Most of the association studies in cotton were mainly focused on fiber quality and abiotic stress resistance. The present study is motivated to deciphering the various molecular marker loci associated with lint yield and its contributing traits using the association mapping approach. In the current study, we have utilized a large cotton germplasm resource from CCS HAU, Hisar, which is novel for association mapping study, to identify novel MTAs concerning lint yield contributing traits using association mapping strategy in different sown environments.
The experimental material for the present study is composed of 96 genotypes of upland cotton (G. hirsutum) selected from breeding material collected from Cotton Section, the Department of Genetics and Plant Breeding, CCS HAU, Hisar (Supplementary Table 1).
A total of 96 germplasm lines of upland cotton (G. hirsutum) were grown in a randomized block design (RBD) with two replications in early (before April 26), normal (from April 26 to May 10), and late (after May 10) sown conditions in the experimental field of Cotton Section, the Department of Genetics and Plant Breeding, CCS HAU, Hisar, during kharif season of 2018 and 2019. The agronomic practices recommended for Haryana state were followed to raise a good crop. The fertilizer dose was applied at 86 kg nitrogen, 30 kg phosphorus, and 25 kg zinc sulfate per hectare. For control of weeds, the pre-emergence herbicide, Pendimethalin, at 5 L per hectare was applied and, subsequently, weeds were managed with hoeing by kasola and mechanical intercultural hoeing with power weeder. The data were recorded on five randomly selected plants of each genotype in each replication and for different underlying lint yield contributing traits, viz. days to first flower (DF), plant height in cm (PH), number of monopods per plant (NM), number of bolls per plant (NB), boll weight in grams (BW), seed cotton yield (SCY), lint yield (LY), ginning out turn in percent (GOT), seed index (SI), and lint index (LY).
Analysis of variance popularly known as ANOVA was carried out to determine genotype, year, genotype × year, and other higher interaction terms variances for different traits of cotton using SAS version 9.4 with PROC GLM statement (SAS Institute Inc., Cary, NC, United States). The relationship between yield and other yield attributing traits was further explored by correlation analysis. To have a better understanding of how phenotypic values of traits are distributed, box plots for different traits for underlying environments were generated. This analysis was carried out using R software (R Core Team, 2019).
Genomic DNA was isolated from young leaves of 96 genotypes of cotton using standard protocol, i.e., using cetyl trimethyl ammonium-bromide (CTAB) procedure and following the approach of Saghai-Maroof et al. (1984). The quality of DNA samples was analyzed using 0.8% agarose gel electrophoresis. One hundred sixty-eight SSR markers (Supplementary Table 2) distributed over 26 linkage groups of A and D genome (of G. hirsutum) were used for molecular screening of the genotypes, out of which 97 markers showed polymorphism and the same has been further used for downstream analysis. The sequence of these primer pairs and details required for PCR (polymerase chain reaction) was obtained from the COTTONGEN resource1. The optimized PCR reaction mixture (10 μl) contained 50 ng of DNA template, 5 μl of DreamTaq Green PCR Master Mix (2×), 0.5 μM of primers, and 3 μl of nuclease-free water. PCR products were resolved by gel electrophoresis using 2.5% agarose gels (Sigma) at 4 V/cm in 1.0× TBE buffer. DNA banding patterns of 96 genotypes of cotton were observed under UV light with staining of electrophoretic gels in ethidium bromide (0.5 μg/ml). An amplified band at each position was scored as 1 for presence and 0 for absence. The size (in nucleotide base pairs) of the amplified bands was further determined based on its migration related to the standard 50-bp/100-bp DNA ladder.
Molecular weights of SSR products (in bp) were estimated and preliminary statistical analysis of the genotypes was performed using POWERMARKER V 3.25 (Liu and Muse, 2005). The total number of alleles, major allele frequency, gene diversity, and polymorphism information content (PIC) values were calculated for each marker. Furthermore, the genetic diversity of a sub-population was identified using POPULATION STRUCTURE analysis.
Analysis of the population structure of 96 upland cotton (G. hirsutum L.) genotypes was carried out using the software STRUCTURE V 2.3.4 (Pritchard et al., 2000). An admixture model was selected to estimate the number of sub-populations (i.e., K value) for studied genotypes. Initially, 10 runs for each value of K ranging from 1 to 10 were conducted with additional parameters of 10,000 burn-in length and number of replications. Finally, number of sub-populations (K value) was estimated by following the approach of Evanno et al. (2005) implemented in a web-based utility STRUCTURE HARVESTER (Earl, 2012), i.e., by plotting the distribution of ΔK, which is an ad hoc statistic based on the rate of change in the log probability of data between successive K values. The value of ΔK was calculated as a mean of absolute values of the difference between successive likelihood values of K divided by its standard deviation of L(K). The highest value obtained from the graph by plotting ΔK values most accurately detects the uppermost hierarchical level of structure. The ΔK plots for the studied genotypes were further generated using the STRUCTURE HARVESTER.
Analysis of molecular variance of a sub-population identified using POPULATION STRUCTURE analysis was assessed using GenAlex version 6.5 (Peakall and Smouse, 2006). The parameters computed in sub-populations for genetic diversity were the total number of alleles per locus (Na), number of effective alleles per locus (Ne), Shannon’s information index (I), observed gene diversity (h), and unbiased gene diversity (uh) following the protocol given by Nei and Li (1979).
Linkage disequilibrium is the non-random co-segregation of alleles at two or more loci. This non-random co-segregation could be between loci on the same chromosome or between loci on different chromosomes. The tight linkage between two alleles on the same chromosome can be translated in high LD. Therefore, LD can be measured as allele frequency correlation (r2) between the pairs of markers located on the same chromosome. TASSEL software (Bradbury et al., 2007) was used to study LD.
For Association mapping, R package Genome Association and Prediction Integrated Tool (GAPIT) (Lipka et al., 2012) was used to conduct the analysis. Here, for GWAS analysis, different association models were tested separately for the cotton germplasm panel, i.e., (1) compressed mixed linear model (CMLM), (2) multiple locus mixed linear model (MLMM), and (3) mixed linear model (MLM). As additional information, marker-based kinship matrix (K) was also generated using marker genotype information based on the VanRaden method; the same was further used to generate a clustering heat map for marker panel using GAPIT. All the additional information like population structure (Q) and kinship information (K) were used as covariates while fitting GWAS models. Separate GWAS analysis was conducted for different environments under study using different models, i.e., MLMM, CMLM, and MLM, applied separately and presented the results. Moreover, to get a better representation of MTA, we have also highlighted those markers that were found to be significantly consistent to at least two environment models. A p-value ≤ 0.01 was used as a threshold to declare significant MTA. The same was represented using Manhattan plots and quantile–quantile plots (QQ plots) between observed and expected p values of association, which revealed the fitting of the model.
The results of ANOVA are presented in Table 1 which showed the mean sum of squares due to genotypes and date of sowing (DS) was highly significant (p < 0.0001) for all studied traits except NM. Mean sum of square due to interaction of genotype × year, genotype × DS, and year × DS was found to be highly significant for DF, PH, NM, NB, SI, SCY/P, SI, and LI (Table 1). Analysis of higher interaction terms, i.e., Genotype × Year × DS was also found to be significant for most of the traits except for BW and NM. These results indicate that adequate variability was present for lint yield and its contributing traits for the material used in the study. In order to better understand the distribution of phenotypic traits over the different environments, box plots of the same have been drawn (Supplementary Figure 1). Mean values for DF were reported to be highest in the early sown environment of the year 2019 (E19) followed by normally sown environment 2019 (N19), and early and normal sown environment of 2018 (E18 and N18), while the late sown environment of both years 2018 (L18) and 2019 (L19) had reported early flowering, i.e., least DF (Supplementary Figure 1a). The highest average of PH was recorded in the early sown-2018 (E18) trial, and the minimum average plant height was observed in late sown-2019 (L19) and late sown-2018 (L18) crop (Supplementary Figure 1b). Average BW was reported highest in early sown-2018 (E18) followed by normal sown-2018 (N18) and early sown-2019 (E19). However, the least average was observed in the late sown-2019 (L19) and late sown-2018 (L18) environment (Supplementary Figure 1c). Mean values for NB were reported highest in E18 followed by N18 and E19 environments, while the lowest value of mean for NB was reported in L18 and L19 environments of both years (Supplementary Figure 1d). Average NM was reported at par in all six environments (Supplementary Figure 1e). The highest average of GOT was observed in N18, followed by N19 and E18 environments. However, the lowest average of ginning out turn was reported in E19 and L18 environments (Supplementary Figure 1f). The highest average of seed index was reported in N18 while the lowest average was recorded in the L19 environment (Supplementary Figure 1g). The highest average of SCY/P was reported in N18, followed by E18 and N19 environments. However, the lowest average of SCY/P was reported in L19 and L18 environments (Supplementary Figure 1h). The highest average of LY was observed in normal sown-2018 (N18); the lowest average of LY was reported in late sown-2019 (L19) and late sown-2018 (L18) trials. However, SI and LI had manifested similar patterns among different environments (Supplementary Figures 1i,j). The highest average of SI and LI was rerecorded in the normal (timely) sown-2018 (N18) experiment while the lowest average for both the traits was recorded in the late sown-2019 (L19) environment.
The correlation analysis for lint yield and contributing traits of cotton for different environments was also conducted, and results are shown in Figure 1. The environment-wise phenotypic correlation results showed that NB and BW had a strong and positive correlation with SCY and LY in all six environments (Figure 1). However, NM showed a positive and significant correlation with SCY and LY, only in early and normal sown environments of 2019. Boll weight showed a negative correlation with NB in all three environments of 2018, but a negative significant correlation was observed in normal and late planting environment of 2018. However, no significant correlation was observed for the same traits in 2019 in any of the sowing conditions. Ginning out turn recorded a significant positive correlation with lint yield in all the environments except the early sown environment of 2018.
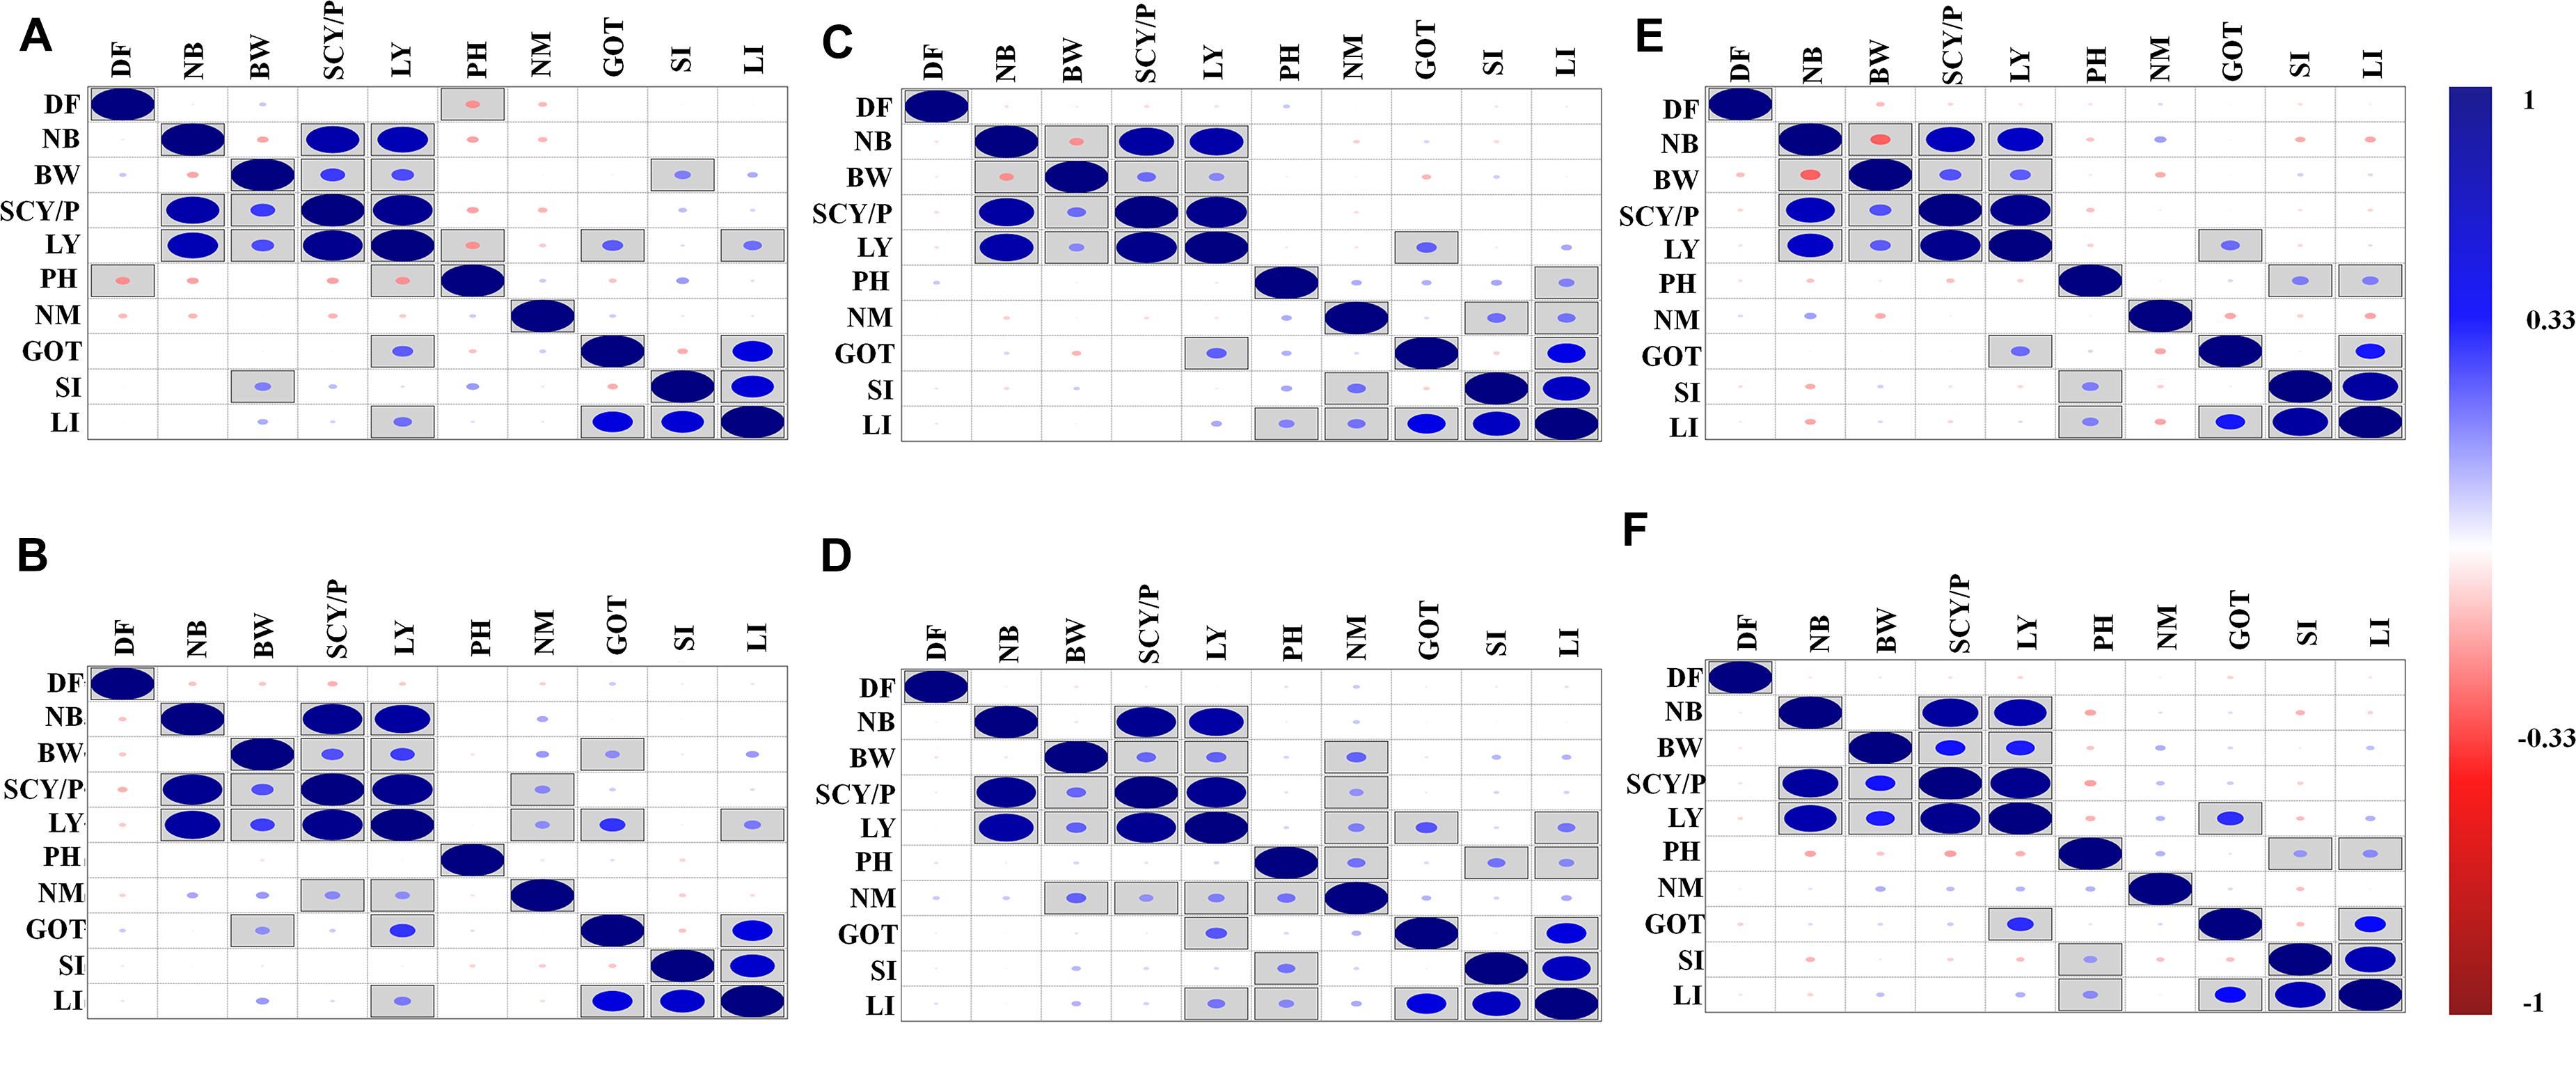
Figure 1. Phenotypic correlations of lint yield contributing traits over six different environments: (A) early sown-2018, (B) early sown-2019, (C) normal sown-2018, (D) normal sown-2019, (E) late sown-2018, and (F) late sown-2019. DF, days to flower; PH, plant height; BW, boll weight; NB, number of boll per plant; NM, number of monopods per plant; GOT, ginning out turn; SI, seed index; SCY/P, seed cotton yield per plant; LY, lint yield; LI, lint index. Here, in the figure upper diagonal and lower diagonal are the same blue and red color highlights for positive and negative correlation, respectively. Correlations significant at p < 0.05 are marked by square in the box. The size of the dots represents the strength (value) of correlation; i.e., the bigger the dots, the higher the value of correlation (toward +1 or -1 for blue and red color, respectively).
A total of 97 polymorphic markers were used for the analysis of molecular diversity. All 97 polymorphic markers were distributed on 26 chromosomes with an average of 3.73 markers per chromosome. Among these, 47 (48%) were located on the 13 chromosomes of A-genome while the remaining 50 (52%) markers were distributed over D-genome. Chromosomes A9 and D9 had maximum (six) polymorphic markers while Chromosome A7 had only one polymorphic marker.
Ninety-seven polymorphic markers contained 293 different alleles ranging from two to five alleles per marker with an average value of 3.020 alleles per marker. Out of 97 markers, 39 markers amplified three polymorphic alleles while only four markers amplified five polymorphic alleles in the studied genotypes.
Major allele frequency ranged from 0.292 (CGR5282) to 0.927 (NAU1093) with a high average value of 0.551. Gene diversity for SSRs ranged from 0.135 (NAU1093) to 0.740 (BNL1721) with an average value of 0.551. The PIC value for SSR markers ranged from 0.126 (NAU1093) to 0.693 (BNL1721), with an average value of 0.485. For better visualization, the pattern of variation of major allele frequency, gene diversity, and PIC is also represented graphically in Figure 2 and Supplementary Table 3.

Figure 2. Variation in major allele frequency, gene diversity, and PIC for 97 polymorphic markers of cotton. A list of the markers on X-axis is also given in Supplementary Table 3.
Data generated from 97 SSR markers were subjected to STRUCTURE analysis to examine the presence of sub-groups if any. A cutoff of 70% membership probability was used as a threshold value for placing a genotype into a particular cluster using the admixture model. Results of STRUCTURE analysis conceded the presence of two major sub-groups in the populations (Figures 3A,B). These sub-groups contained 32 (red cluster) and 60 (green cluster) genotypes of cotton. Four genotypes could not match the cutoff membership probability of any of the clusters and were considered as a mixture. Most of the genotypes of an individual cluster had shown 100% membership probability. Clustering of cotton genotypes by population structure had been similar to the ancestral history of the genotypes. Results of population structure are supported by a heat map plot drawn by GAPIT to depict the level of genomic similarity among the genotypes (Figure 3C).
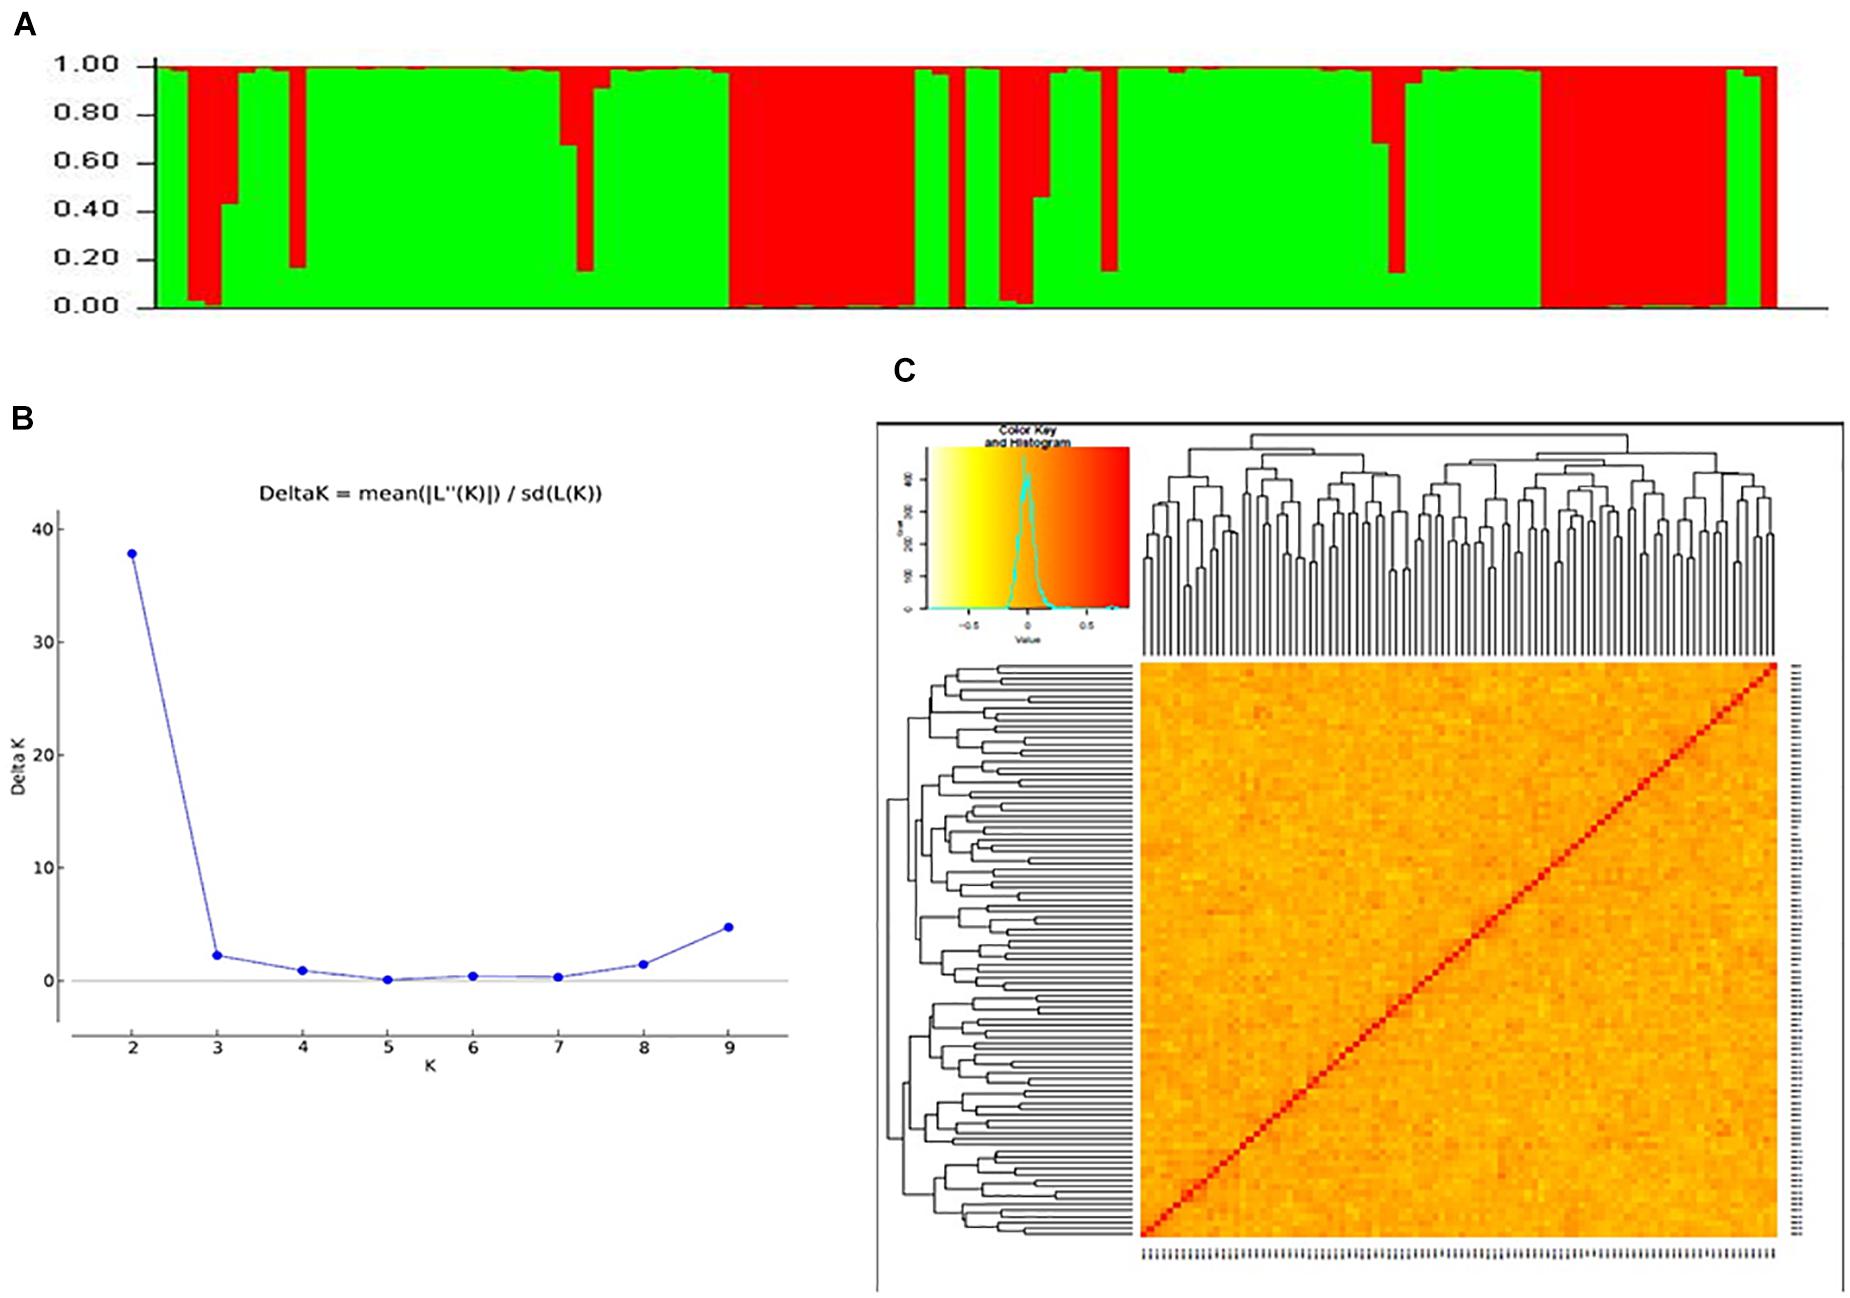
Figure 3. (A) Bar graph for population structure of cotton genotypes performed by admixture method in STRUCTURE, which grouped all accessions into two clusters. (B) Estimation of number of clusters using ΔK values for K ranging from 2 to 10. (C) Heat map plot displaying relationships of 96 cotton genotypes based on SSR markers.
AMOVA was conducted using GenAlEx (v 6.5), which revealed that difference between groups obtained from STRUCTURE analysis was around 2% of the total variation contributed by the whole germplasm. However, 98% variation was attributed to diversity between individuals within a group (Table 2). Fixation index (FST) value for the whole population (0.019) was significant at p < 0. 001. Variation among genotypes of the whole population is significantly high though pairwise FST values revealed that variation among sub-populations is comparatively lower.
In the present study, the “Na” (number of different alleles per locus) was 2.887 and 2.990 for sub-populations 1 and 2 of cotton germplasm, respectively, with an average value of 2.938. In Na, 2.406 and 2.403 were Ne (number of effective alleles per locus) in each population, respectively, with a mean value of 2.404. While NP (number of private alleles per locus) was 0.021 for sub-population 1 and 0.047 for sub-population 2 of cotton germplasm with a mean value of 0.072. The mean value of I (Shannon’s Information Index) was 0.908 and 0.909 for sub-populations 1 and 2 of cotton germplasm, respectively. Gene diversity (h) value was 0.544 for sub-population 1 while it was 0.538 for sub-population 2 with an average of 0.541 in the whole cotton germplasm. Unbiased diversity (uh) value was slightly higher for each sub-population as compared to gene diversity (h), viz. 0.562 and 0.546 for sub-population 1 and sub-population 2, respectively, with an average of 0.554 (Supplementary Table 4 and Supplementary Figure 2).
A total of 293 SSR marker-based alleles were used to calculate the extent of LD resulting in pairwise LD detection in 4656 locus pairs for the cotton genotype panel. Out of 4656 locus pairs, a total of 514 SSR marker pairs (11.04%) showed significant LD at the threshold (i.e., r2 ≥ 0.05) (Supplementary Table 5). Out of 514 SSR marker pairs, 17 were collinear, i.e., markers on the same chromosome, and 497 were inter-chromosomal. At considerably higher levels, i.e., r2 ≥ 0.1, significant LD was obtained for 151 marker pairs (3.24%). Out of these 151 marker pairs, 7 marker pairs were collinear while the remaining 144 were inter-chromosomal. LD blocks were observed as demonstrated by triangle plots for pairwise LD between SSRs (Figure 4). Sizes of intra-chromosomal LD blocks were also calculated; at r2 ≥ 0.1 in 26 chromosomes, the longest LD block (211 cM) was observed on chromosome 23 between the marker pairs BNL4053 and BNL1672. Out of seven significant collinear LD blocks, four were on chromosome 23, and the remaining three were on chromosome 9, chromosome 13, and chromosome 19.
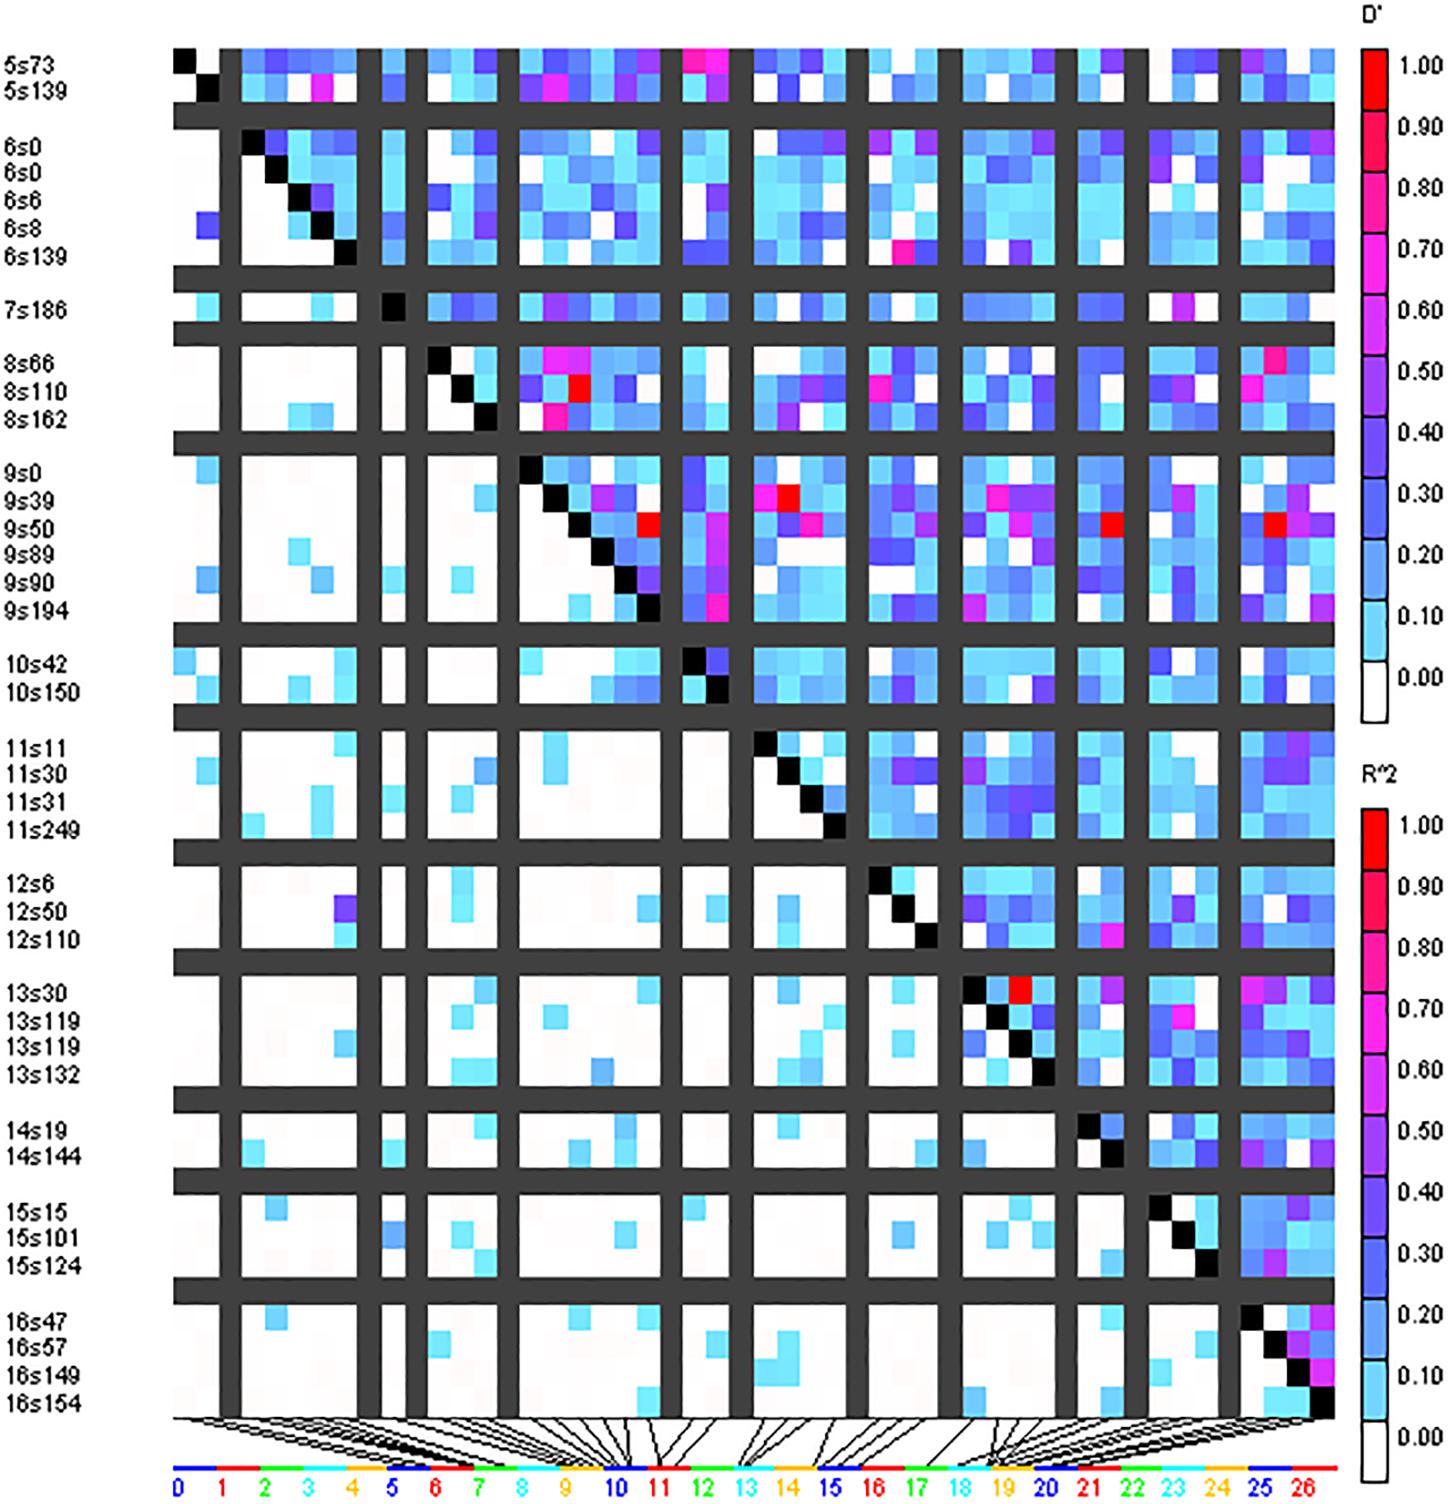
Figure 4. Triangle heat plot showing pairwise value of D’ and r2 for different locus pair over different chromosomes of cotton in the present germplasm panel.
In order to have significant MTAs, a number of approaches, viz. MLMM, CMLM, and MLM, implemented in Genomic Association and Prediction Integrated Tool (i.e., GAPIT) were used. MLMM was considered as a basic approach and it was further supported by CMLM and MLM models. Environment-wise, different significant MTAs were identified. Quantile–quantile (QQ) plots between observed and expected p values of association by MLMM model revealing the fitting of the model for all the six environments are given in Supplementary Figure S3.
In the early sown-2018 environment, a total of 32 markers were involved in 56 significant MTAs (since a single marker can be associated with multiple traits) at p < 0.01. Out of 56 significant MTAs identified, a maximum of 12 MTAs were associated with SI while a minimum of 2 MTAs were associated with NM (Supplementary Table S6). However, in the early sown-2019 environment, 24 markers were involved in 32 significant MTAs at p < 0.01. Out of 32 MTAs identified, a maximum of five associated with PH, NM, SI, and BW, while for NB and GOT, one marker each was associated, i.e., BNL3279-120 and BNL2961-241, respectively (Supplementary Table S7). Graphical representations of significant associations using Manhattan plot for early sown environments for the year 2018 and 2019 are given in Figures 5, 6, respectively.
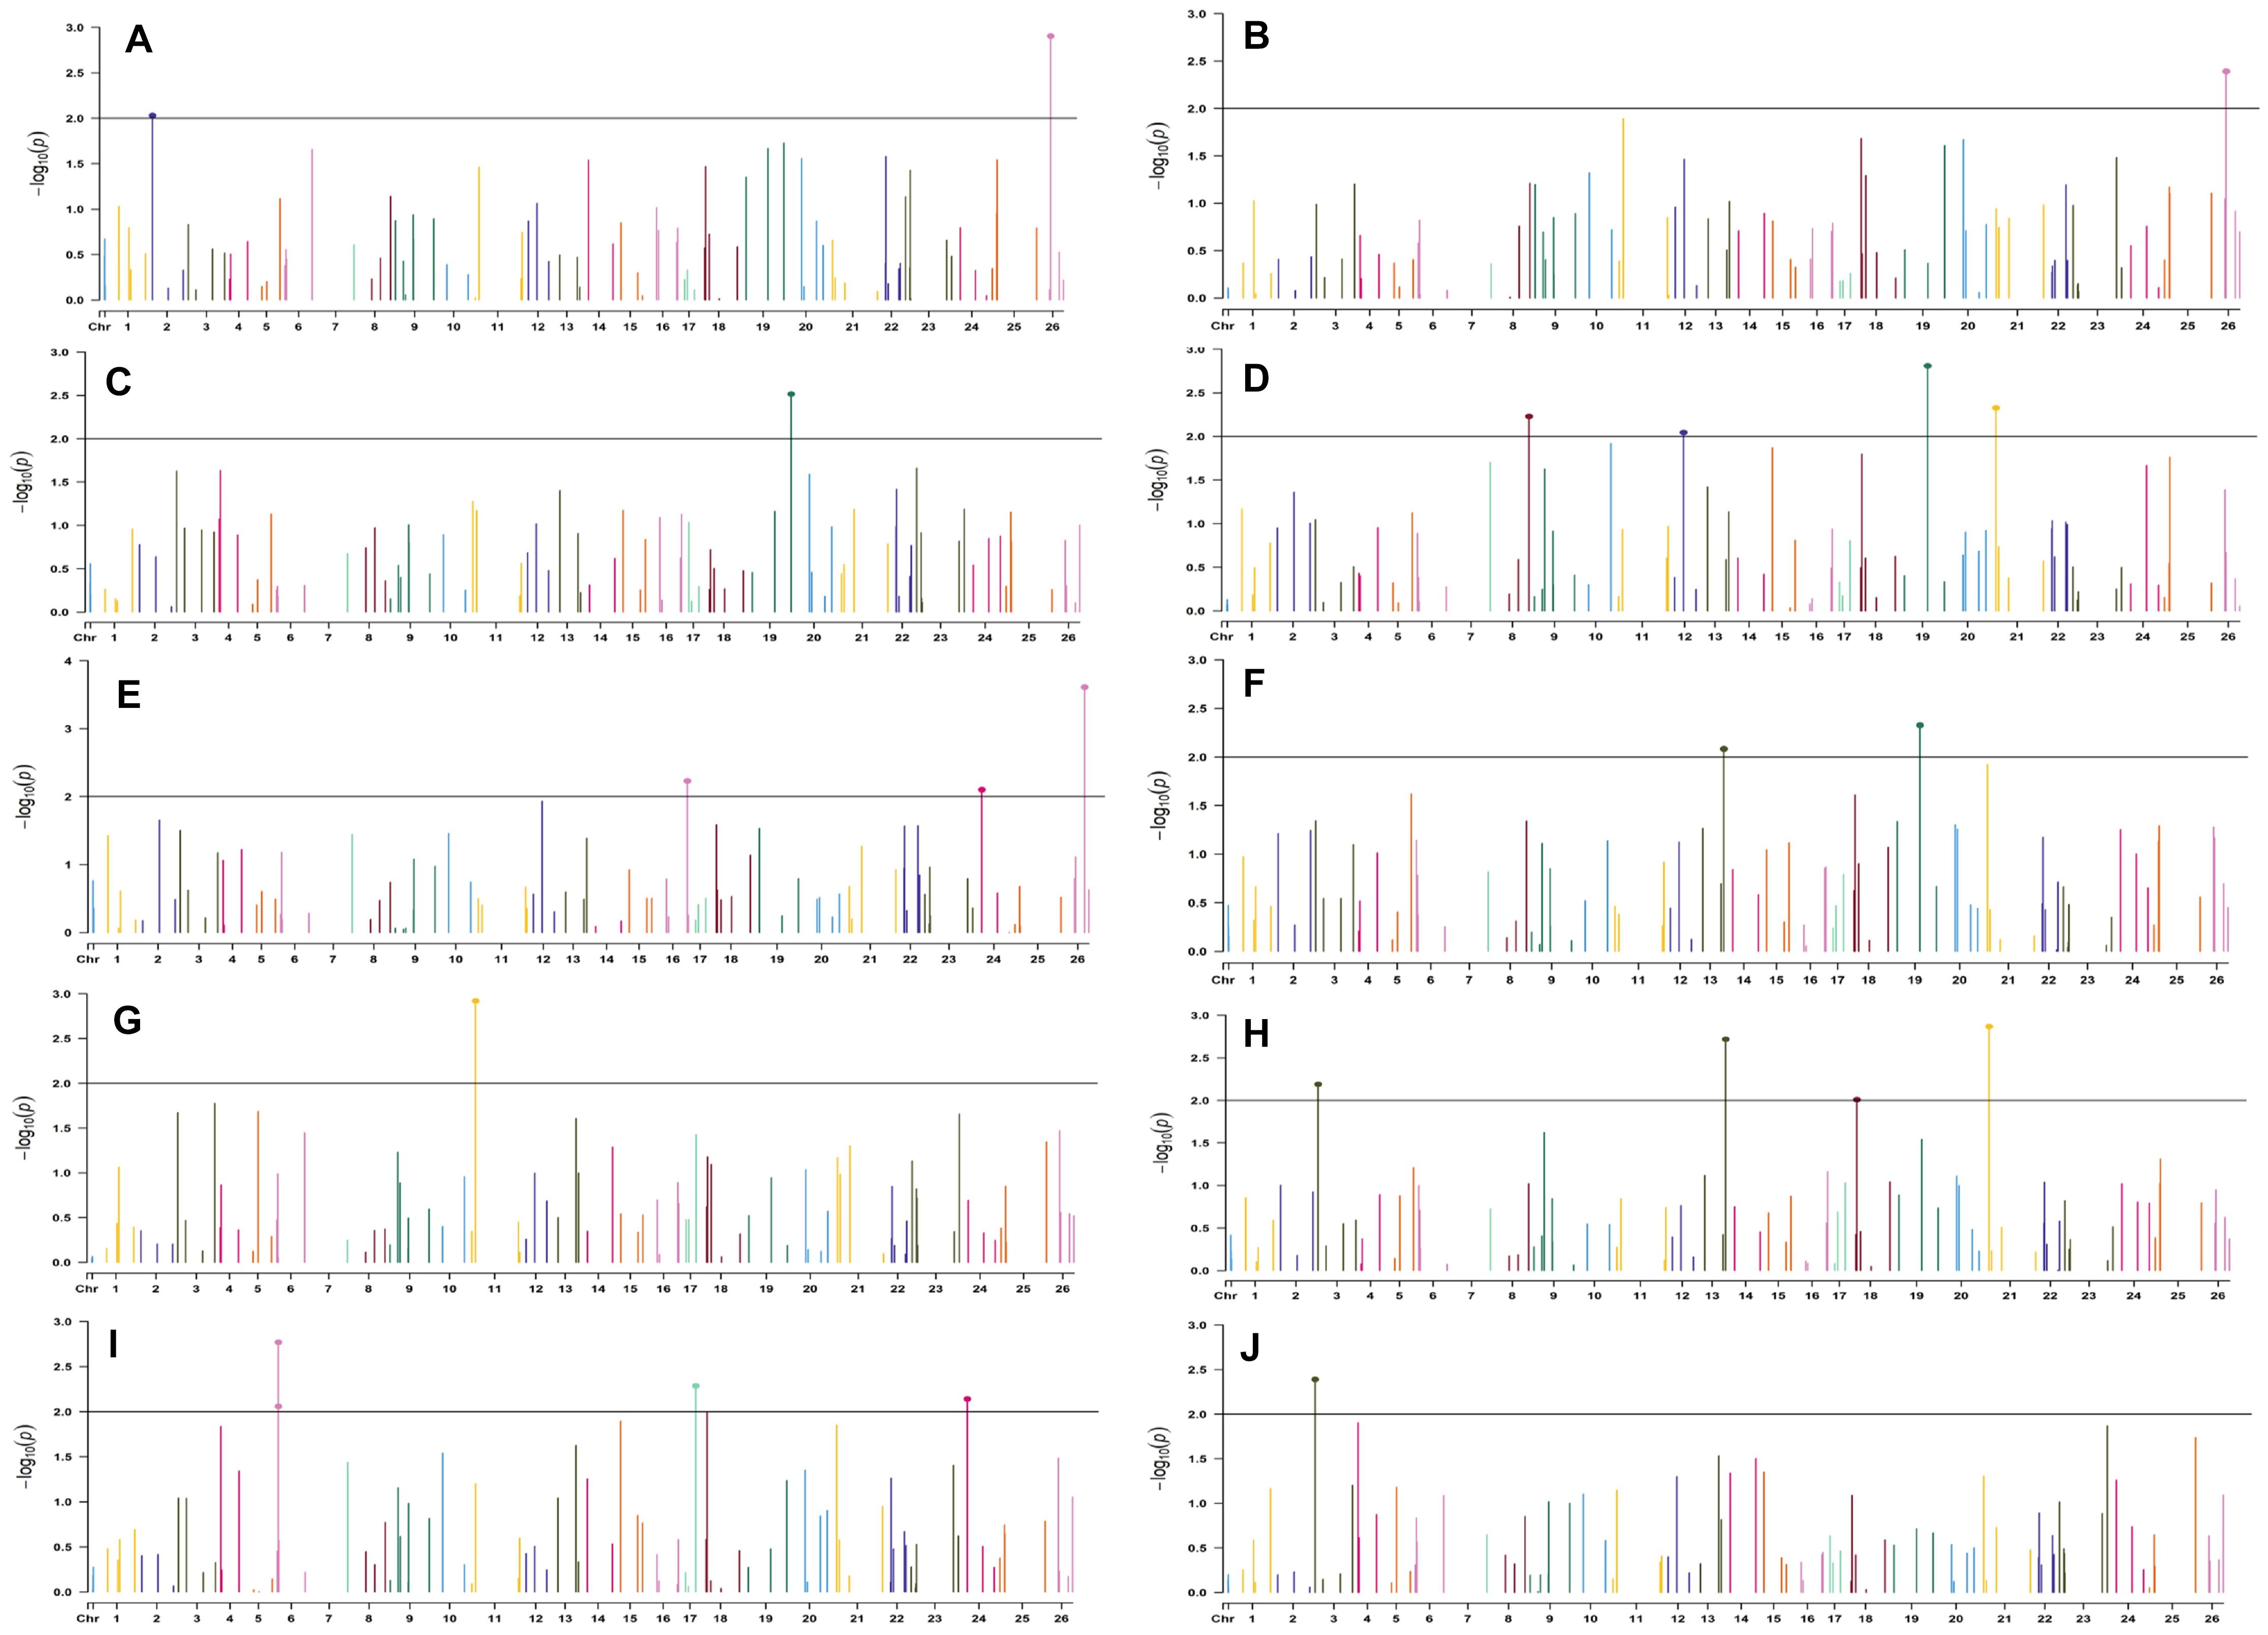
Figure 5. Manhattan plots for the early sown environment of 2018 for various traits under study by the MLMM model. Significant marker above threshold {at –log10 (p) > 2} is highlighted with bold dot head on the marker’s line. (A) Days to first flower, (B) plant height, (C) number of monopods, (D) number of bolls per plant, (E) boll weight, (F) seed cotton yield per plant, (G) ginning out turn, (H) lint yield, (I) seed index, and (J) lint index.
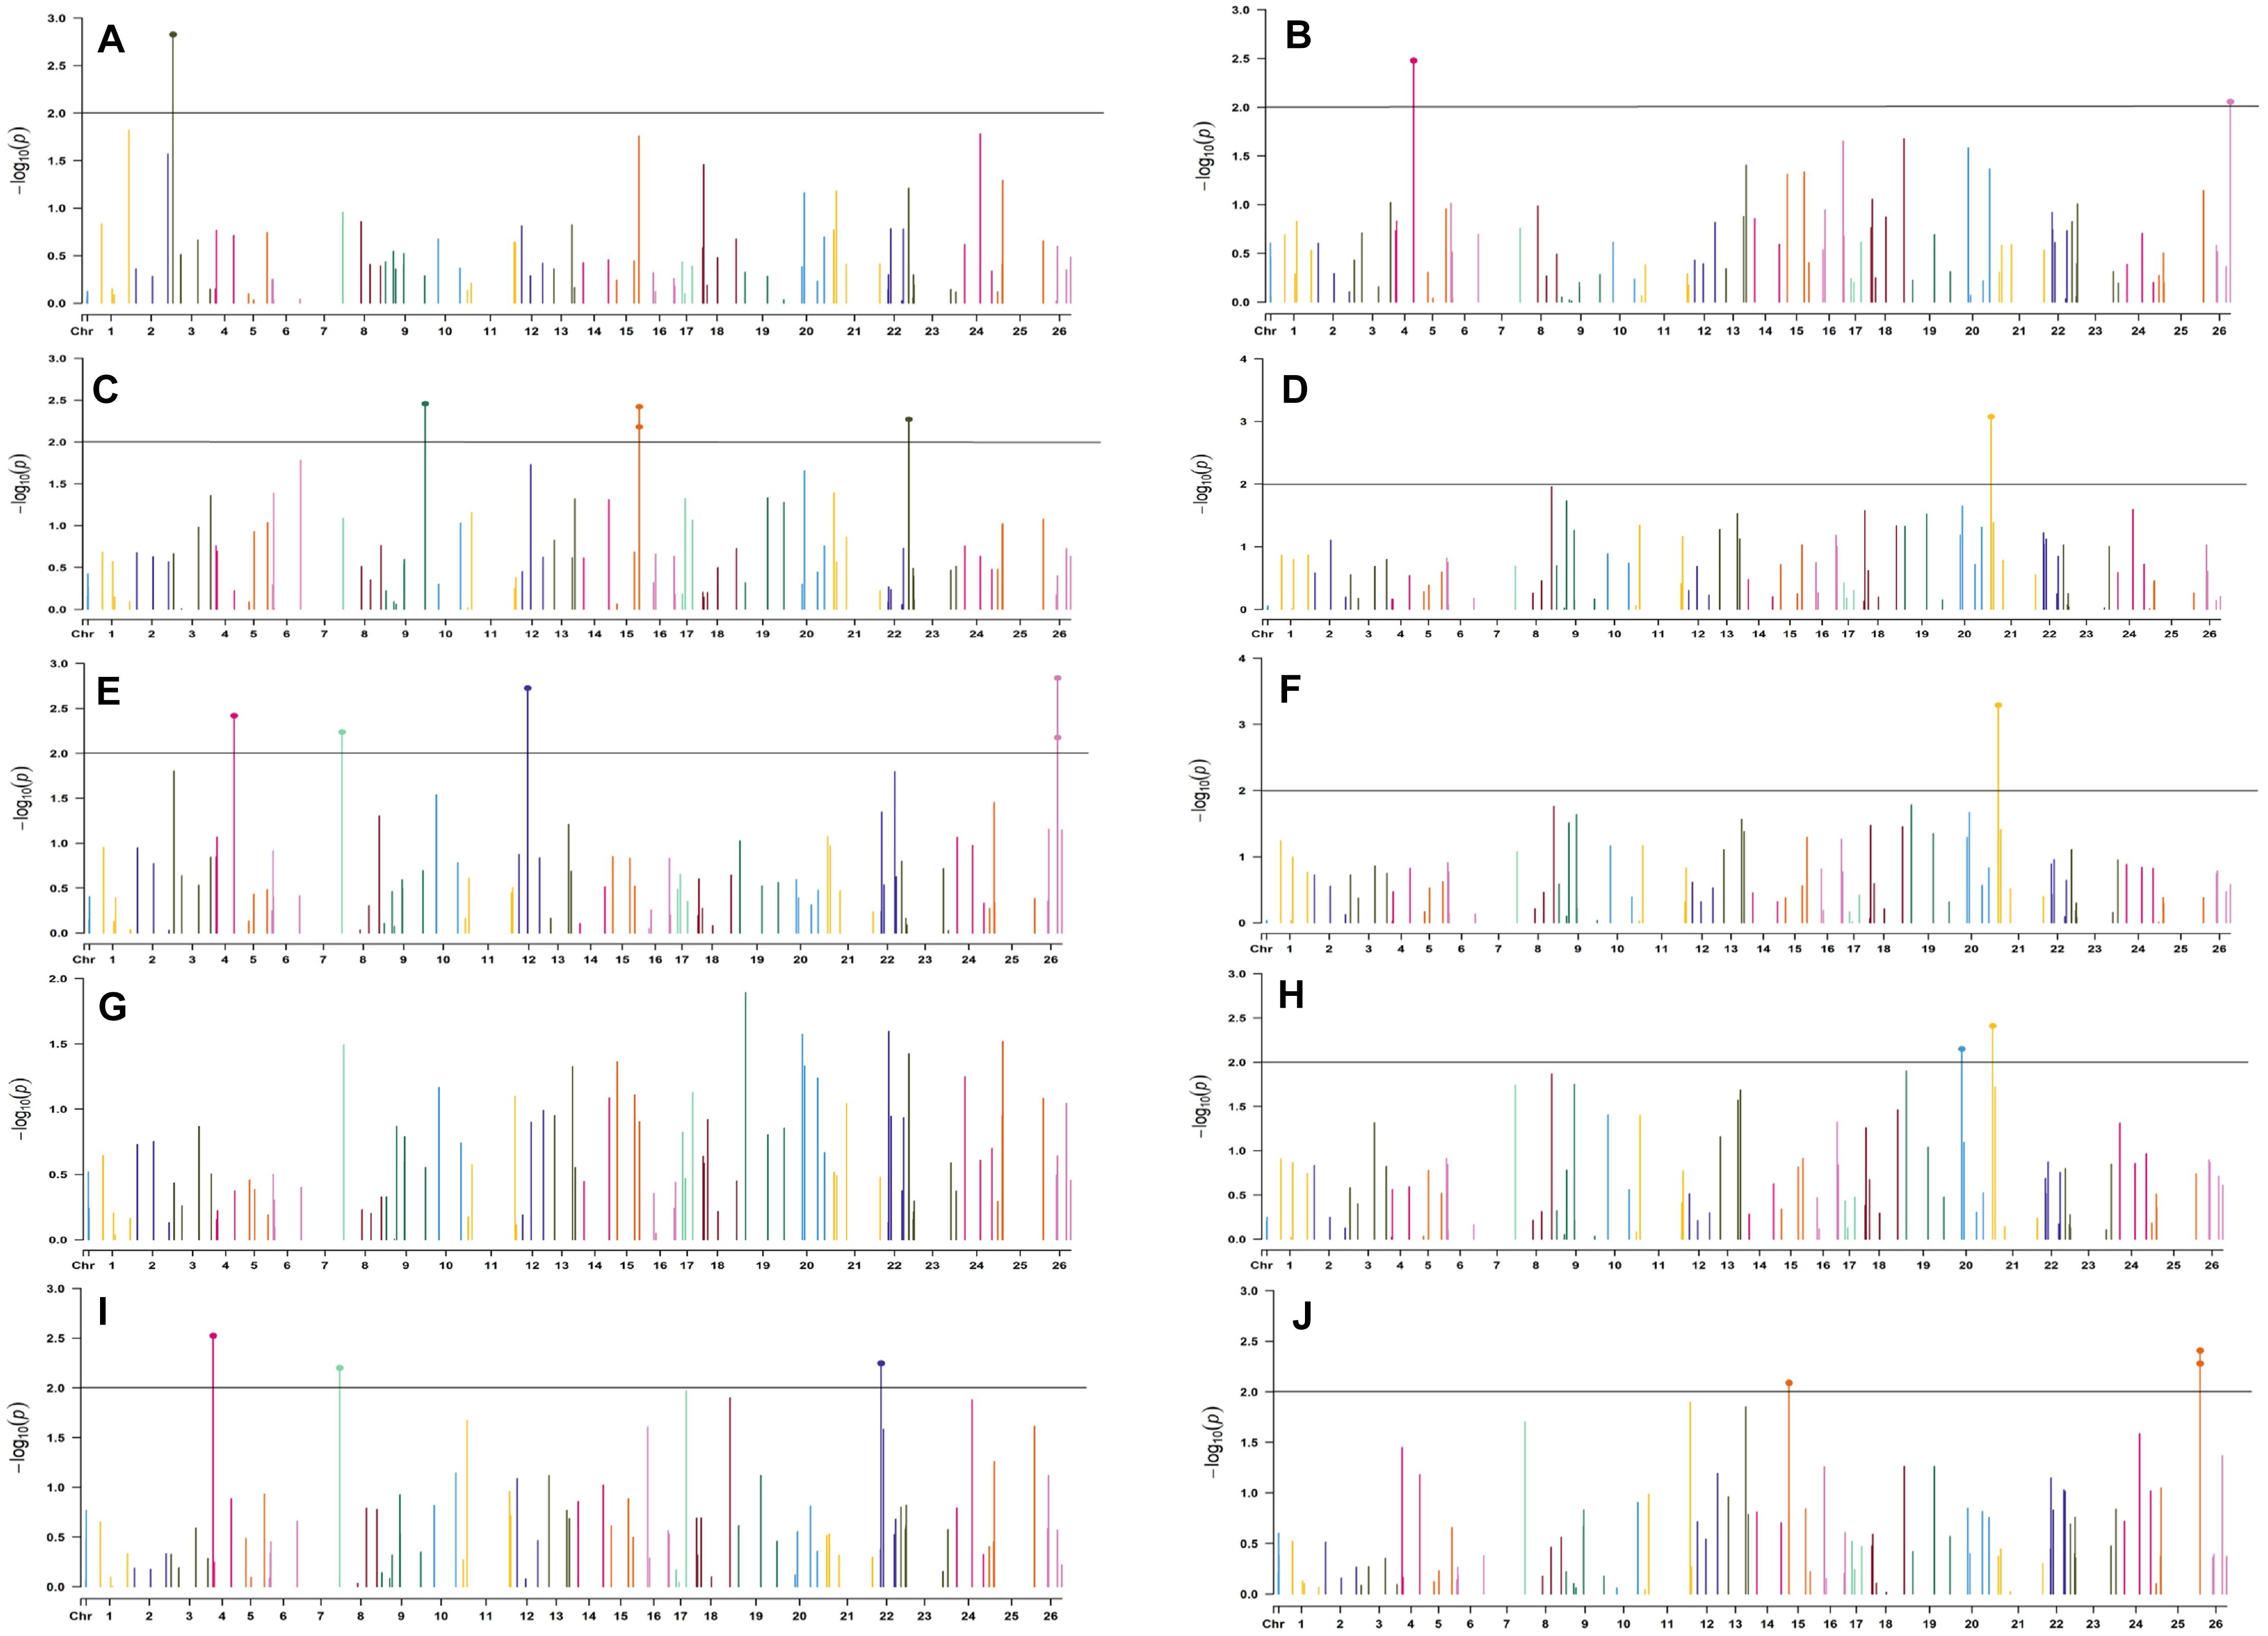
Figure 6. Manhattan plots for the early sown environment of 2019 for various traits under study by the MLMM model. Significant marker above threshold {at –log10 (p) > 2} is highlighted with bold dot head on the marker’s line. (A) Days to first flower, (B) plant height, (C) number of monopods, (D) number of bolls per plant, (E) boll weight, (F) seed cotton yield per plant, (G) ginning out turn, (H) lint yield, (I) seed index, and (J) lint index.
In the early sown-2018 environment, three markers located on chromosome 19, viz. BNL2961 (with BW and SI), CGR5732 (with NB, GOT, and SCY/P), and BNL3452 (with NB, SCY/P, and LY); two markers on chromosome 3, viz. BNL3441 (with NB, LY, and LI) and BNL3279 (NB and LY); two markers on chromosome 13, viz. BNL1551 (BW and SI) and BNL3479 (with SCY and LY); one marker on chromosome 20, viz. JESPR 220 (with GOT, SCY/P, and LY); one marker on chromosome 6, viz. BNL4108 (with SI and LI); one marker on chromosome 18, viz. BNL1721 (with NB and GOT); and one marker on chromosome 12, viz. BNL3423 (with DF, PH, GOT, and LI) were significantly associated with two or more traits. However, for early sown-2019, BNL3976 (with BW and SI) on chromosome 7, BNL3279 (NB, SCY/P, and LY) on chromosome 3, BNL4028 (NM, SCY/P, and LY) located on chromosome 9, BNL2572 (PH and BW) on chromosome 4, BNL686 (DF and NM) on chromosome 15, and CGR5452 (PH and BW) on chromosome 12 were significantly associated to more than one trait. Seven markers, i.e., BNL1605, BNL3279, BNL448, BNL3280, BNL296, BNL 3441, and BNL4108, were common in both years for the early sown environments.
For normal sown environments of both years (2018 and 2019), 24 and 30 markers were involved in 46 and 49 significant MTAs, respectively, at p < 0.01 (Supplementary Tables 8, 9). Out of 46 identified significant MTAs in the normal sown environment of 2018, a maximum of 11 were associated with SCY/P while a single marker was significantly associated with PH; however, no significant MTA was found to be associated with BW at p < 0.01 in this environment. For normal sown-2019, out of 49 significant MTAs, a maximum of nine were associated with NM and a minimum of two each were associated with DF, NB, and LI. Graphical representation of significant MTAs using Manhattan plot for normal sown environments for the year 2018 and 2019 are given in Figures 7, 8, respectively.
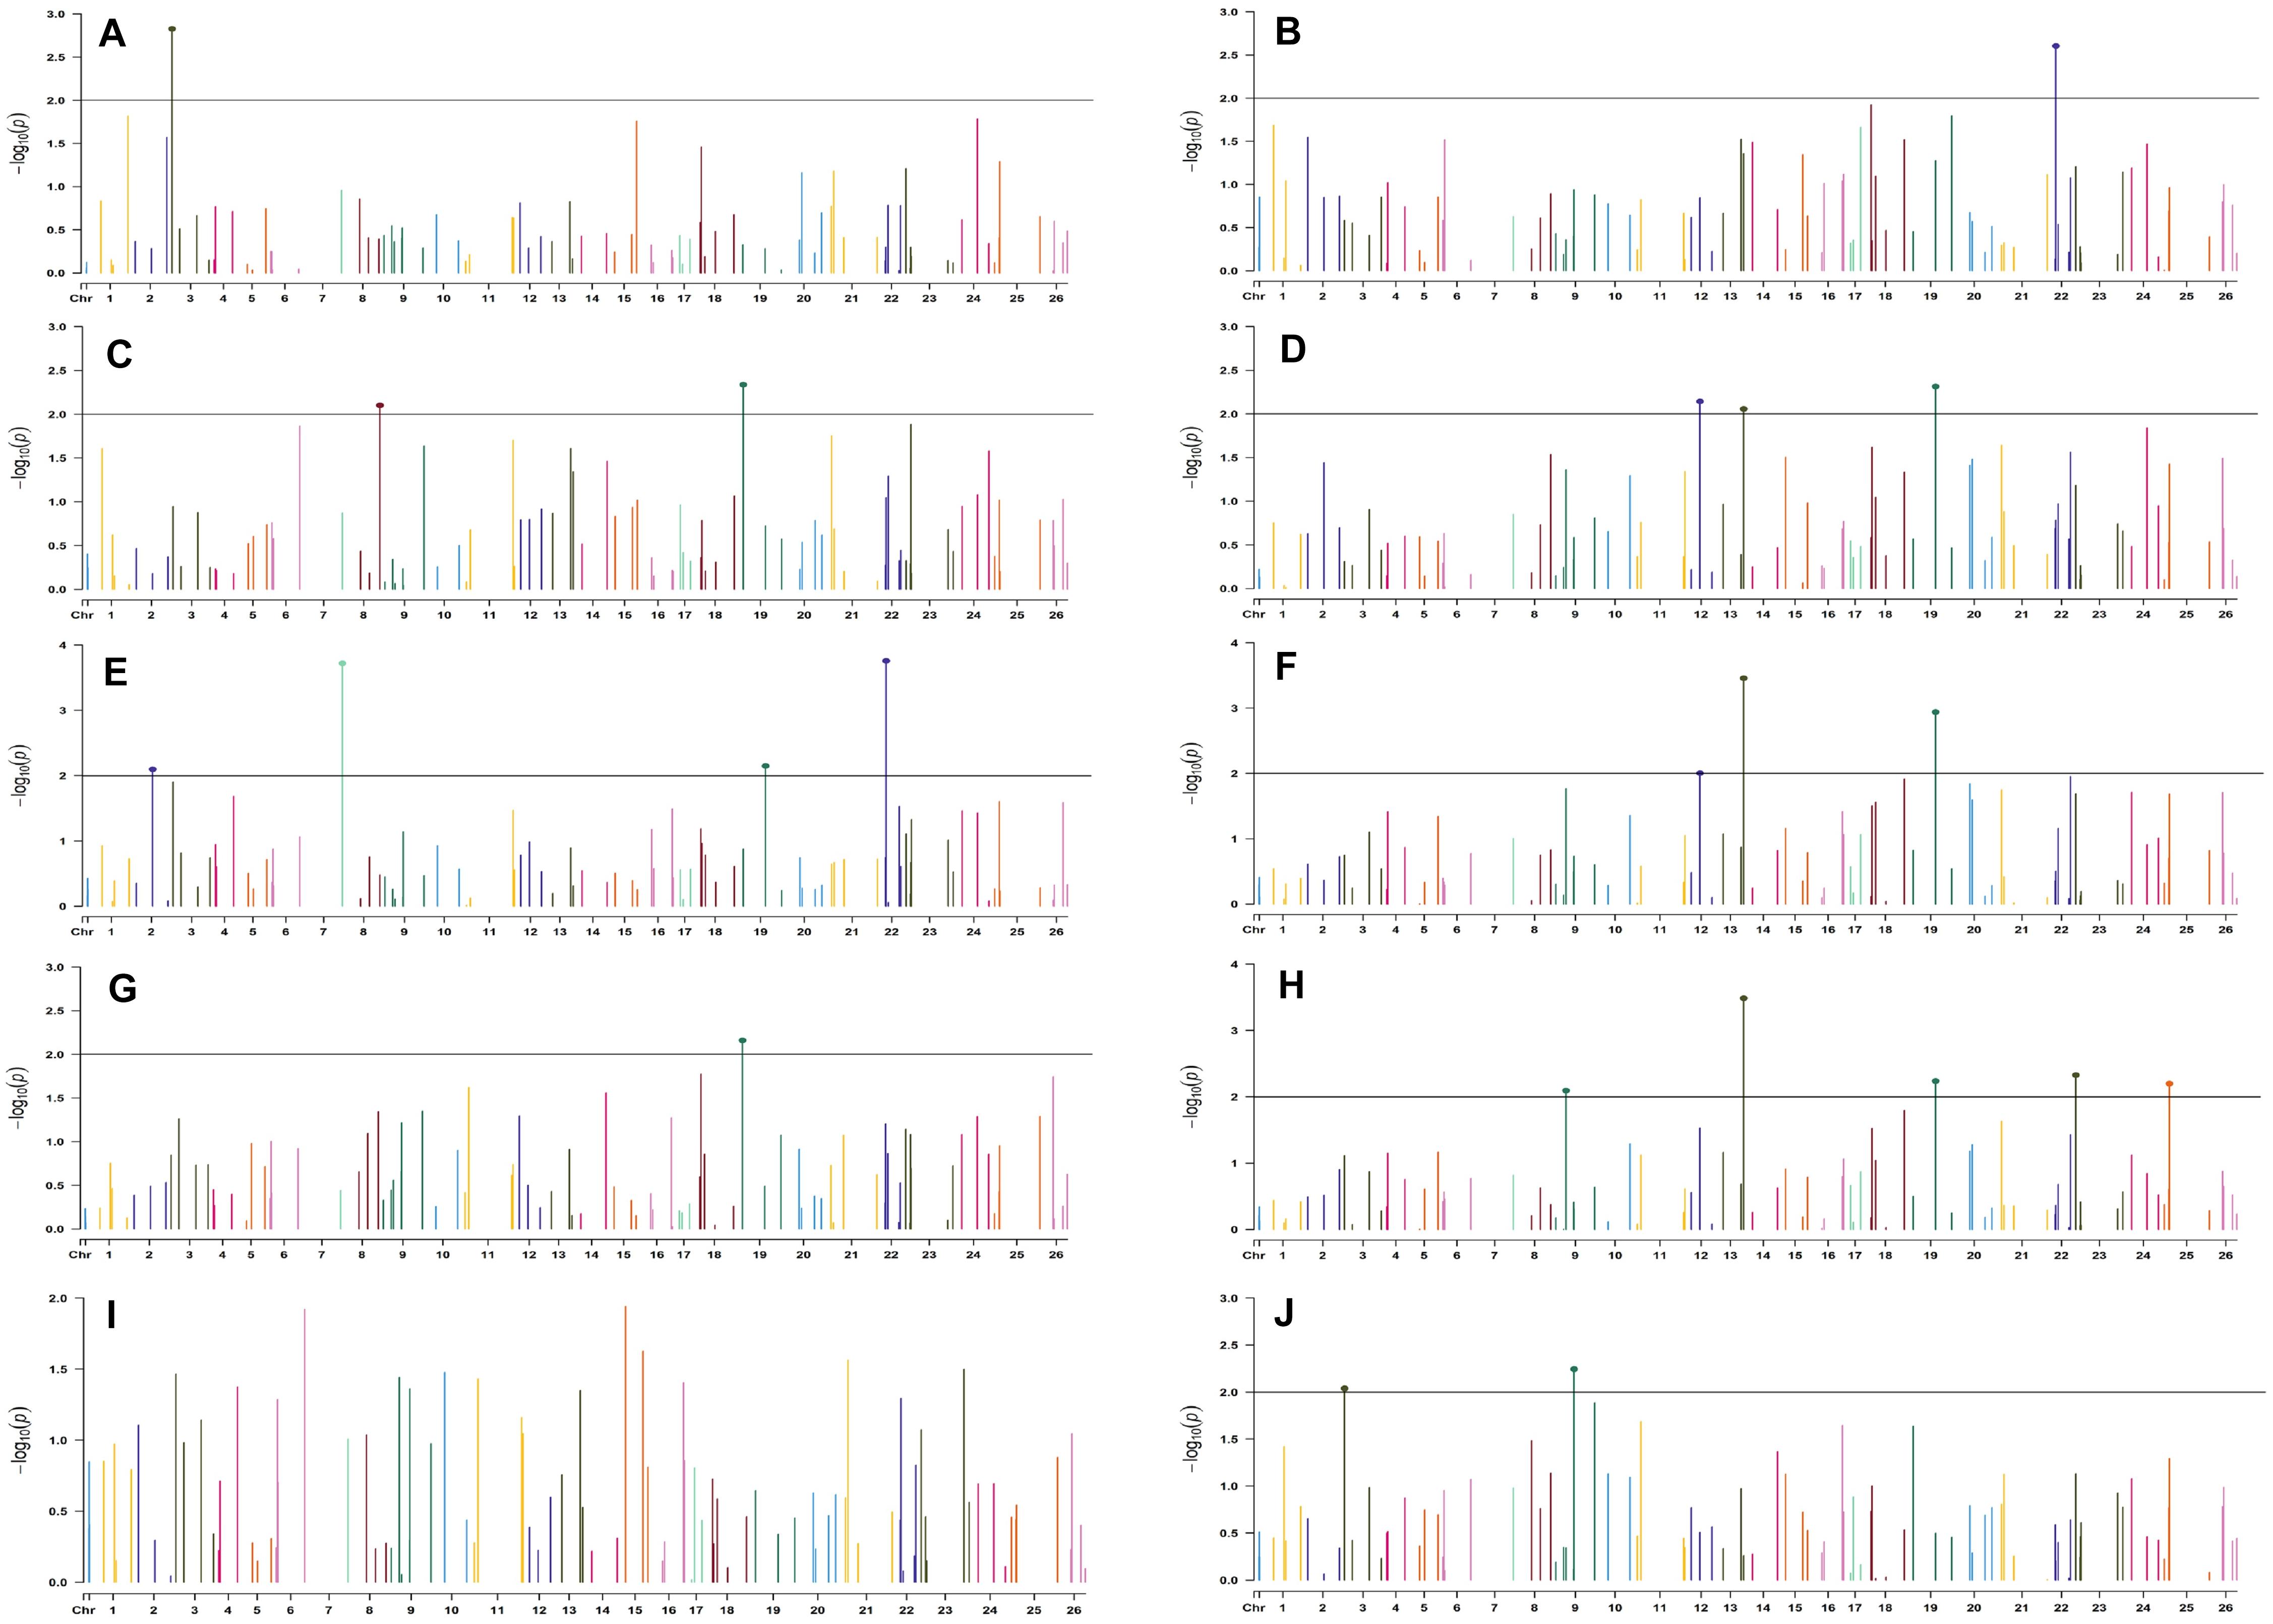
Figure 7. Manhattan plots for the normal sown environment of 2018 for various traits under study by the MLMM model. Significant marker above threshold {at –log10 (p) > 2} is highlighted with bold dot head on the marker’s line. (A) Days to first flower, (B) plant height, (C) number of monopods, (D) number of bolls per plant, (E) boll weight, (F) seed cotton yield per plant, (G) ginning out turn, (H) lint yield, (I) seed index, and (J) lint index.
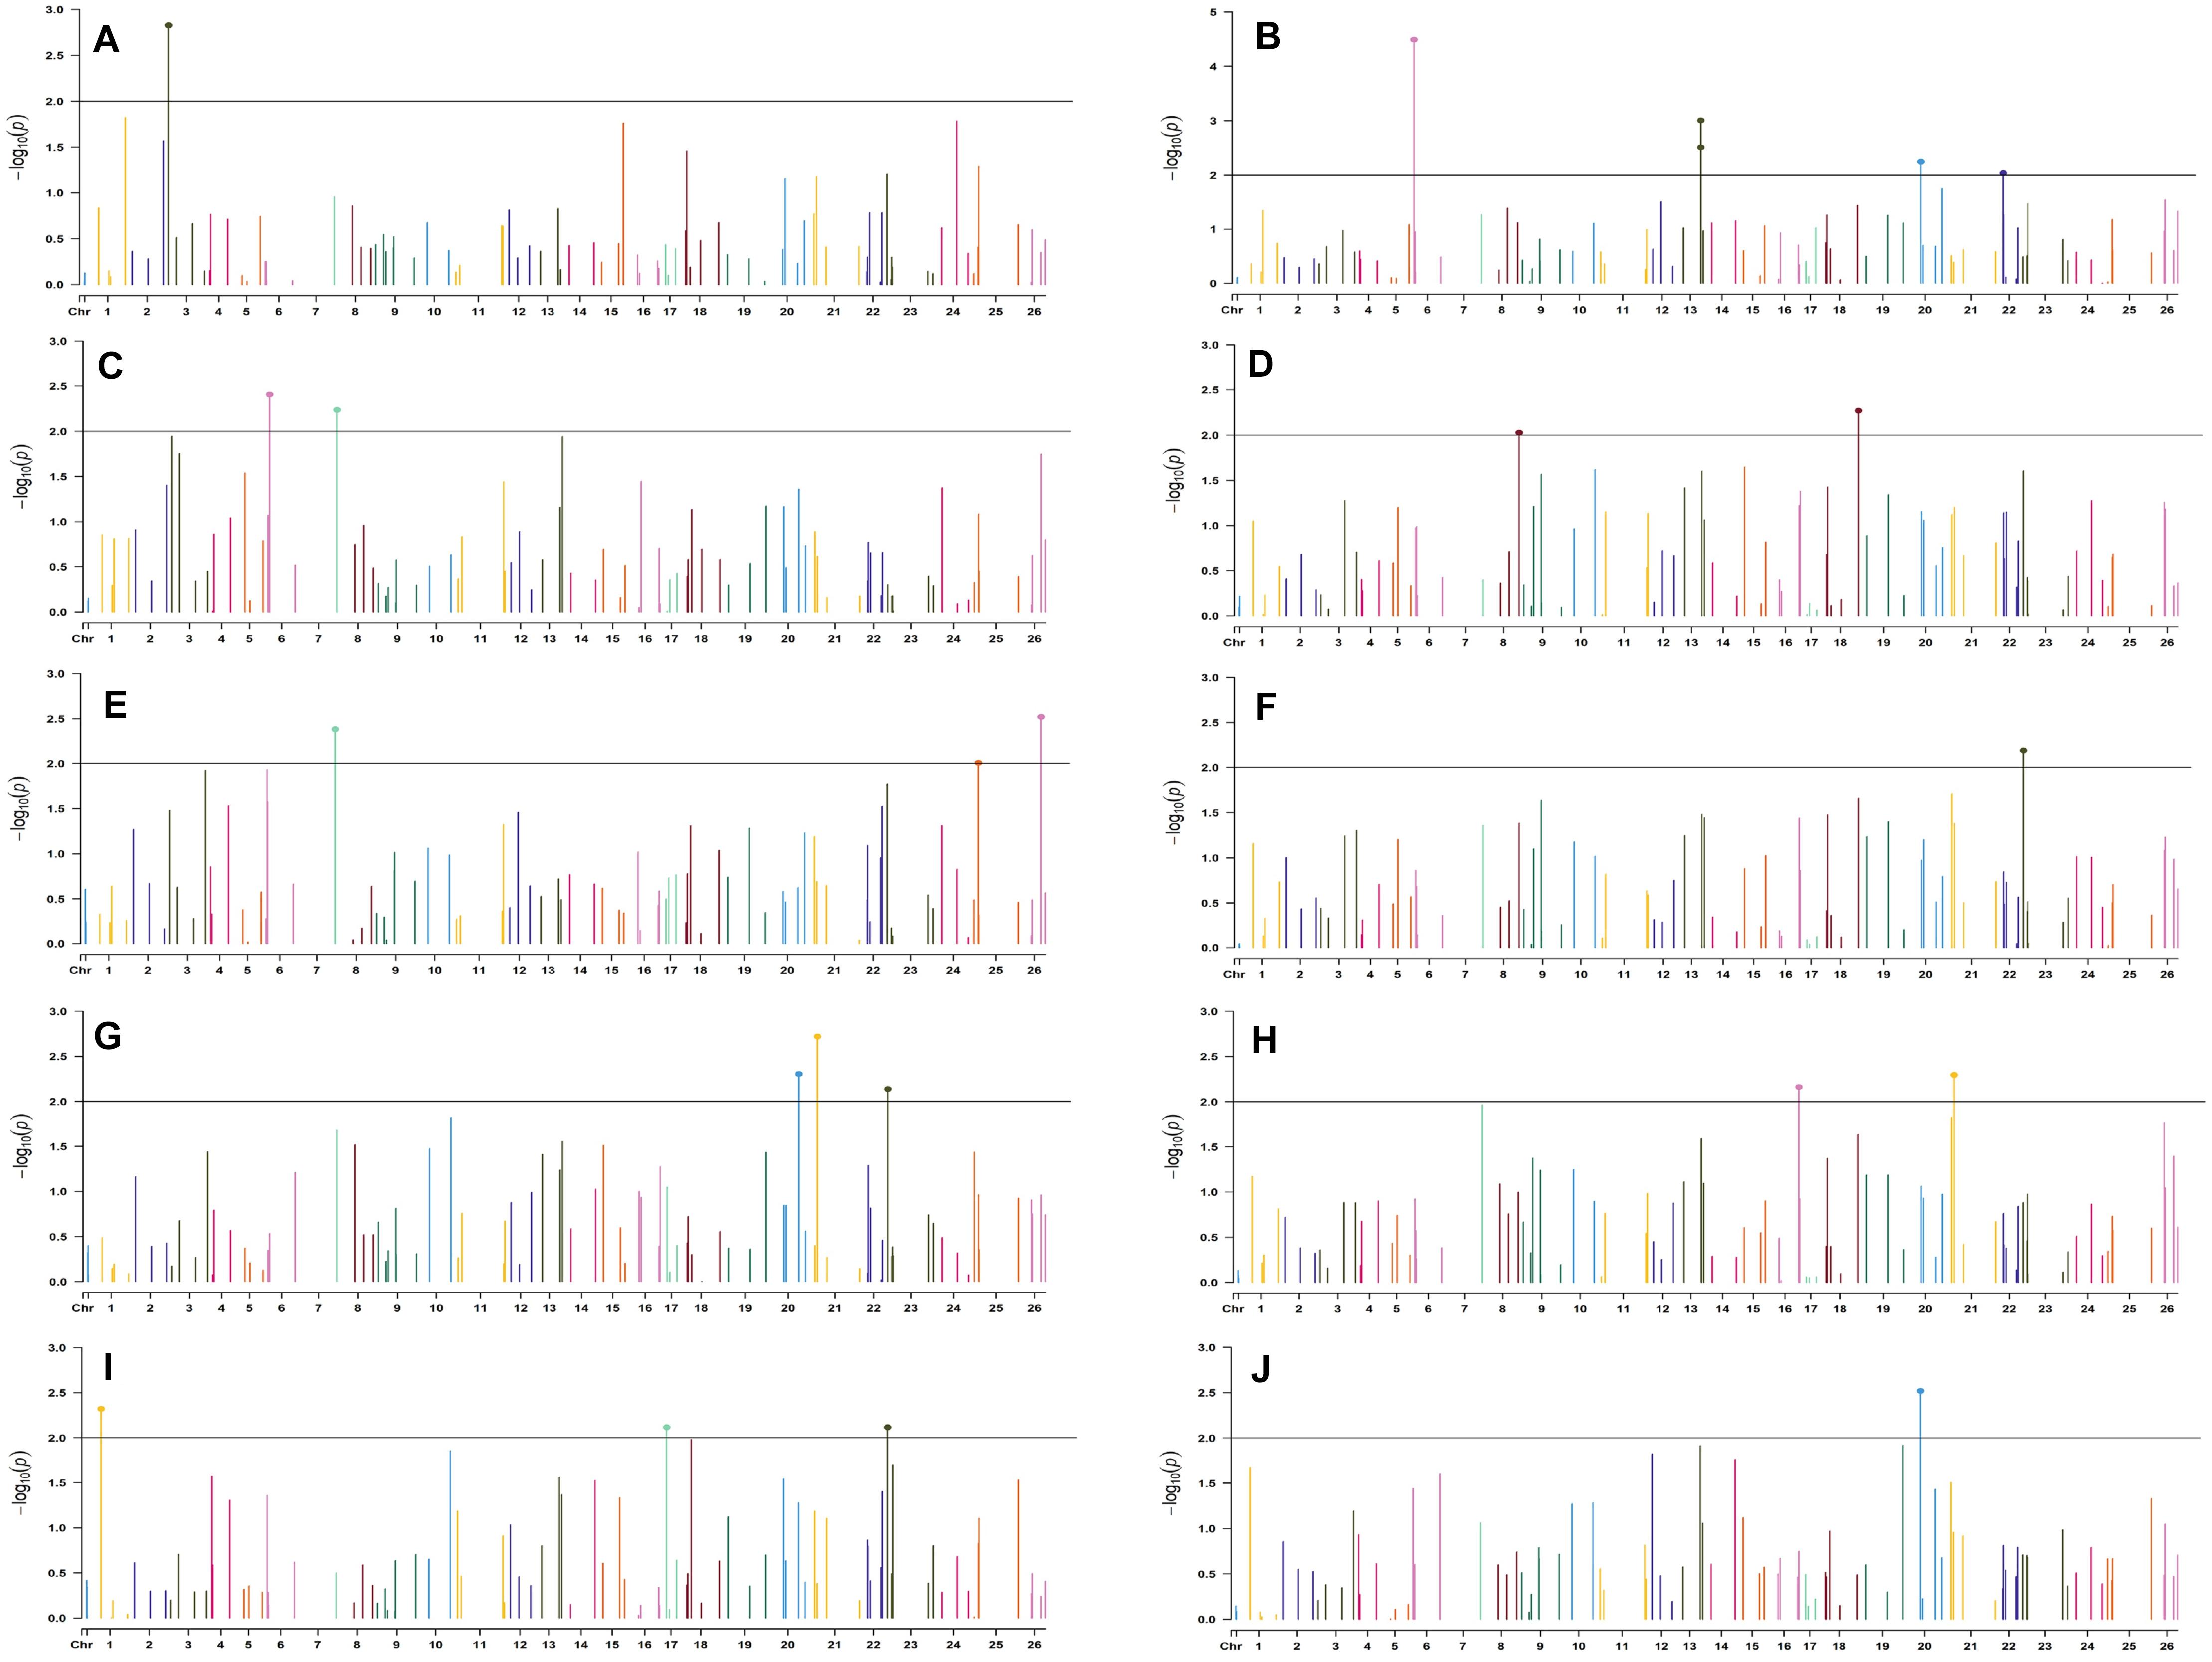
Figure 8. Manhattan plots for the normal sown environment of 2019 for various traits under study by the MLMM model. Significant marker above threshold {at –log10 (p) > 2} is highlighted with bold dot head on the marker’s line. (A) Days to first flower, (B) plant height, (C) number of monopods, (D) number of bolls per plant, (E) boll weight, (F) seed cotton yield per plant, (G) ginning out turn, (H) lint yield, (I) seed index, and (J) lint index.
For the normal sown-2018 environment, two markers located on chromosome 19, viz. BNL3452 (with NM and GOT) and CGR5732 (with NB, SI, SCY/P, and LY); two markers on chromosome 12, viz. CGR5452 (with NB and SCY/P) and BNL3423 (with GOT and LI); two on chromosome 18, viz. BNL1721 (with NB, SCY/P, and LY) and BNL2544 (SI and LI); one marker on chromosome 10, i.e., CGR5565 (with GOT, SI, and LI); BNL3479 on chromosome 13 (NB and SCY/P); one marker on chromosome 20, viz. JESPR 220 (with SCY/P and LY); one marker on chromosome 3, viz. BNL3441 (with DF and LI); one marker on chromosome 15, viz. BNL686 (with DF and LY); and one on chromosome 6, viz. NAU2355 (with SCY and LY) were significantly associated with two or more traits. However, in the normal sown-2019 environment, BNL3976 located on chromosome 7 (with BW and NM), BNL686 (with DF, GOT, SI, and SCY/P) on chromosome 15, BNL1066 (with GOT and LY) on chromosome 3, BNL3994 (with PH and LI) on chromosome 20, BNL3085 (with NM and SCY) on chromosome 1, and BNL1551 (with NM and LY) on chromosome 13 were significantly associated with more than one trait. Nine markers, i.e., BNL3479, BNL3976, BNL3257, BNL2921, JESPR220, CGR5732, BNL3441, BNL686, and BNL3482, were common in the normal sown environment for both years.
For late sown-2018 and 2019 environments, 34 and 26 markers were involved in 53 and 48 significant MTAs, respectively, at p < 0.01 (Supplementary Tables 10, 11). Out of 53 significant MTAs in the late sown environment of 2018, a maximum of 12 significant MTAs were identified for SI, and a minimum of 2 MTAs were identified for DF and LY. In the late sown-2019 environment, out of 48 significant MTAs, a maximum of 8 significant MTAs were identified for BW and SCY/P but a minimum of 2 for DF. Graphical representations of significant MTAs using Manhattan plot for late sown environments for the year 2018 and 2019 are given in Figures 9, 10, respectively.
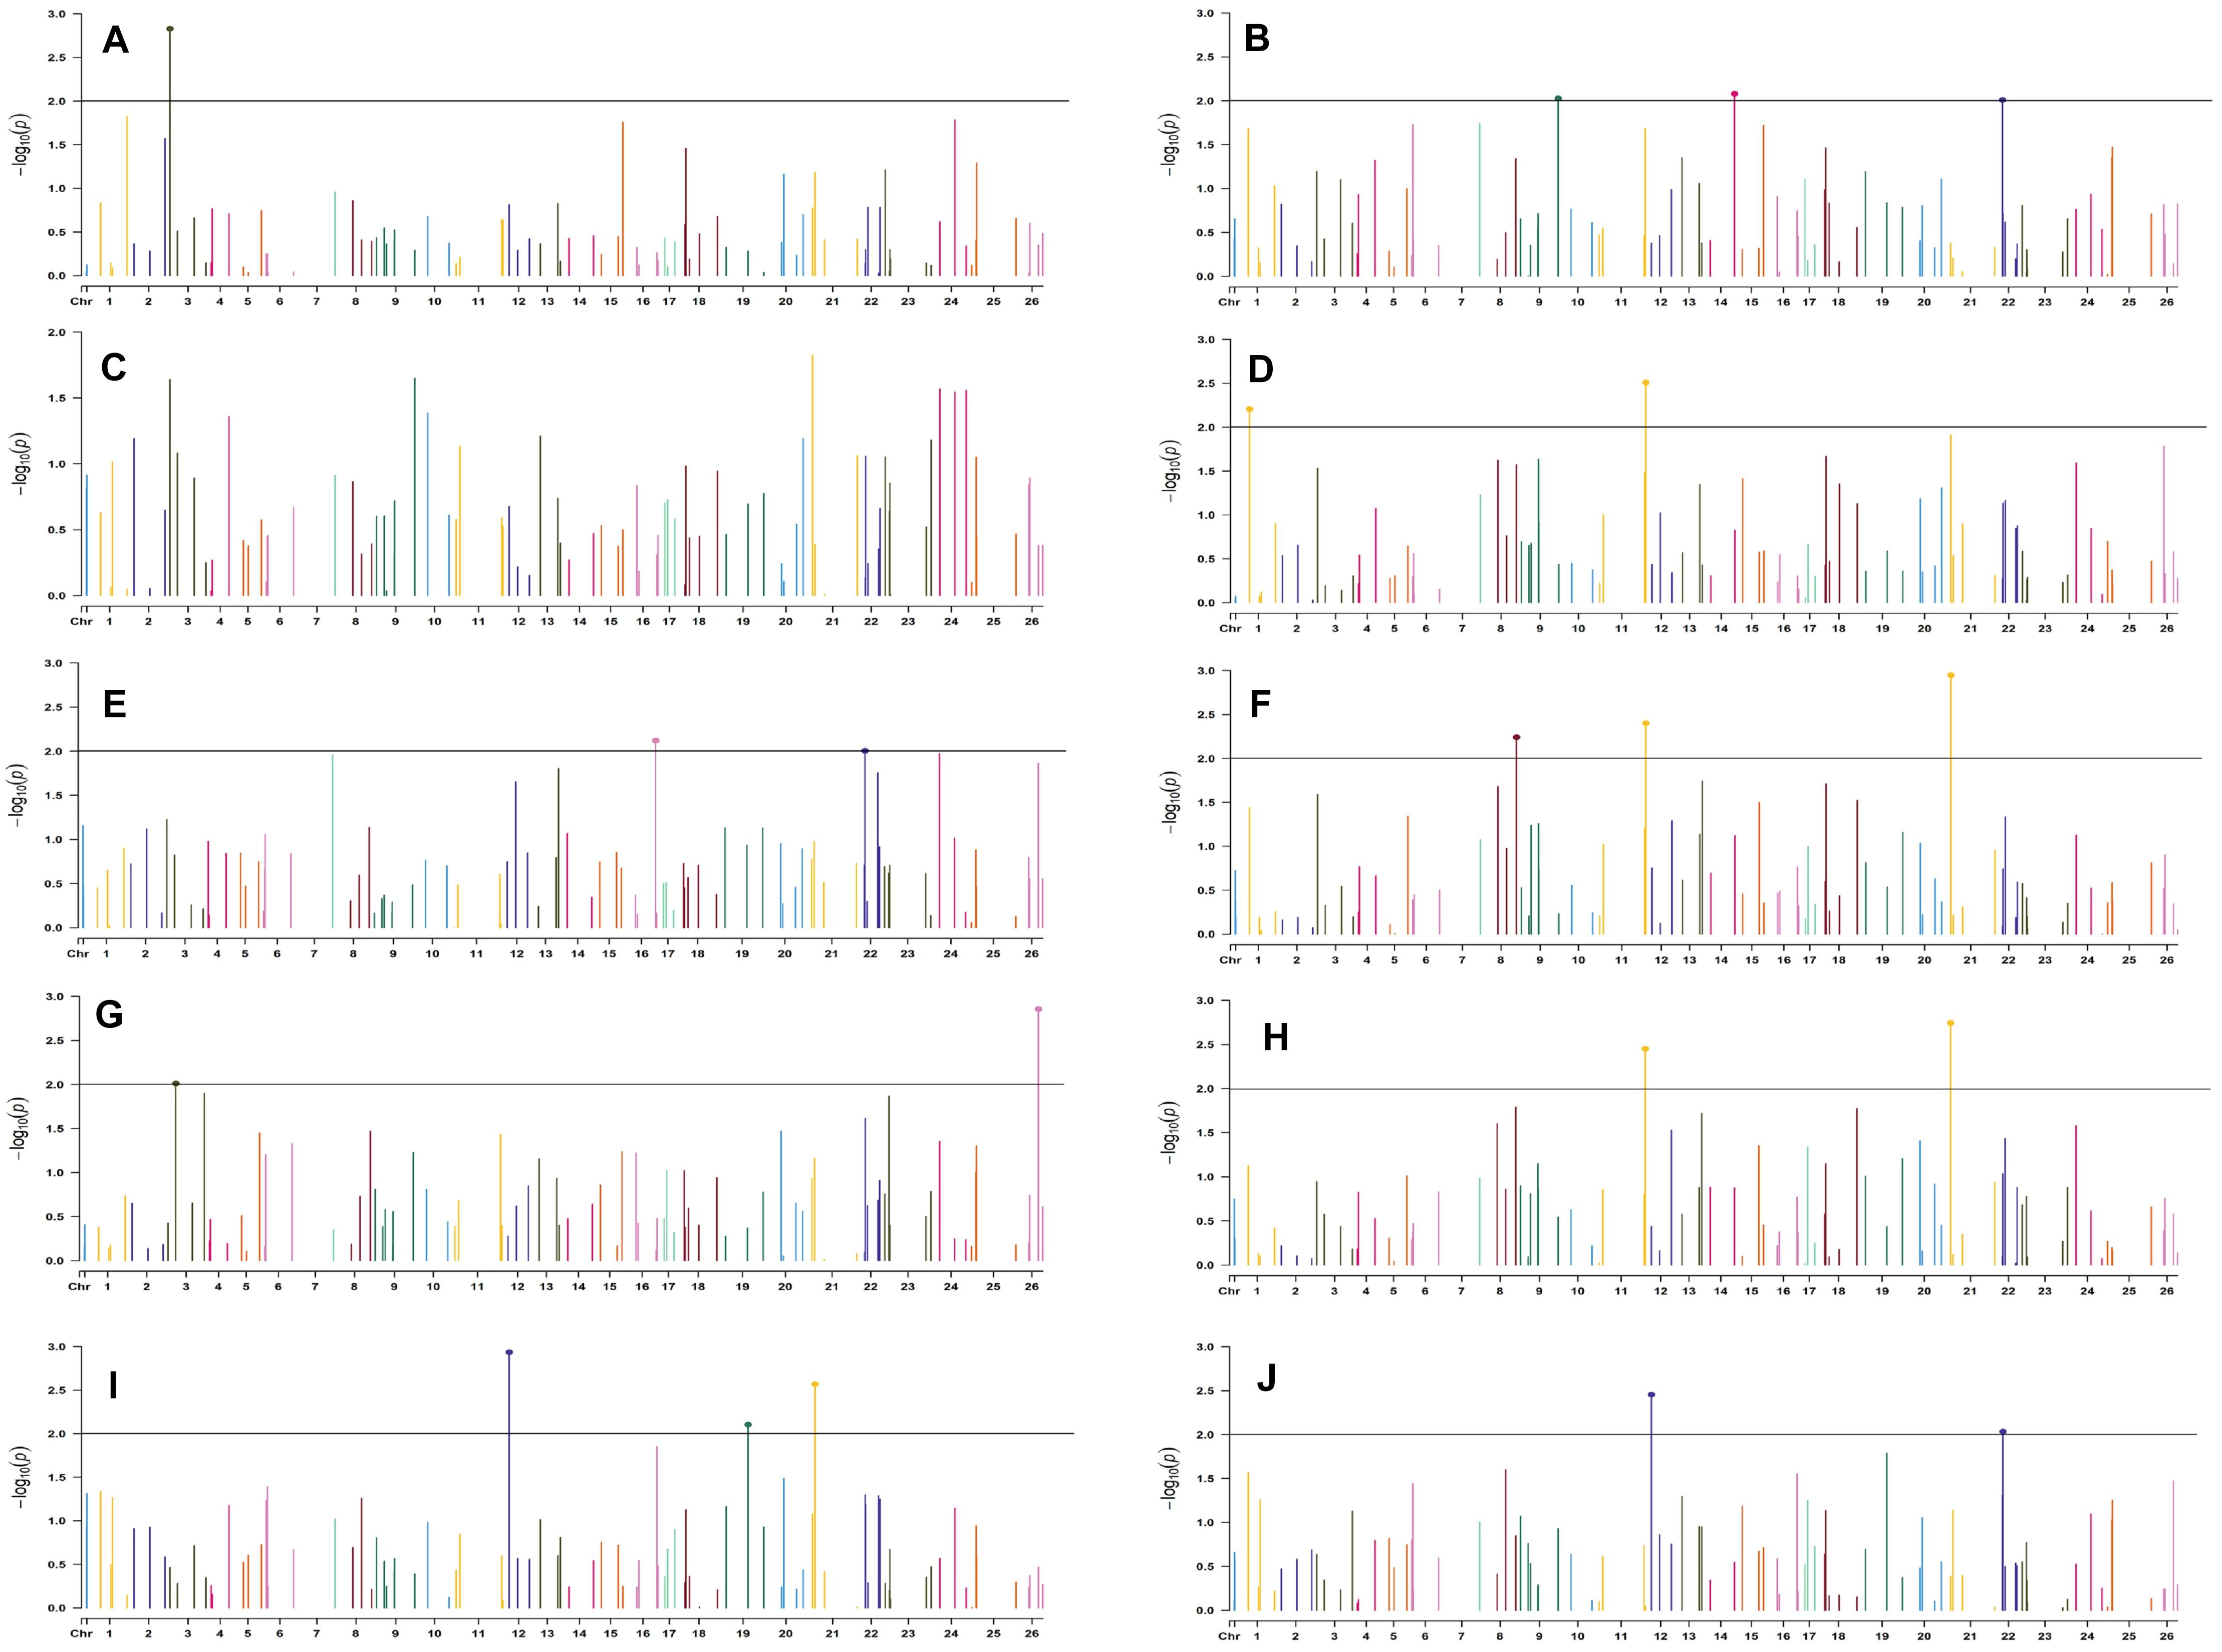
Figure 9. Manhattan plots for the late sown environment of 2018 for various traits under study by the MLMM model. Significant marker above threshold {at –log10 (p) > 2} is highlighted with bold dot head on the marker’s line. (A) Days to first flower, (B) plant height, (C) number of monopods, (D) number of bolls per plant, (E) boll weight, (F) seed cotton yield per plant, (G) ginning out turn, (H) lint yield, (I) seed index, and (J) lint index.
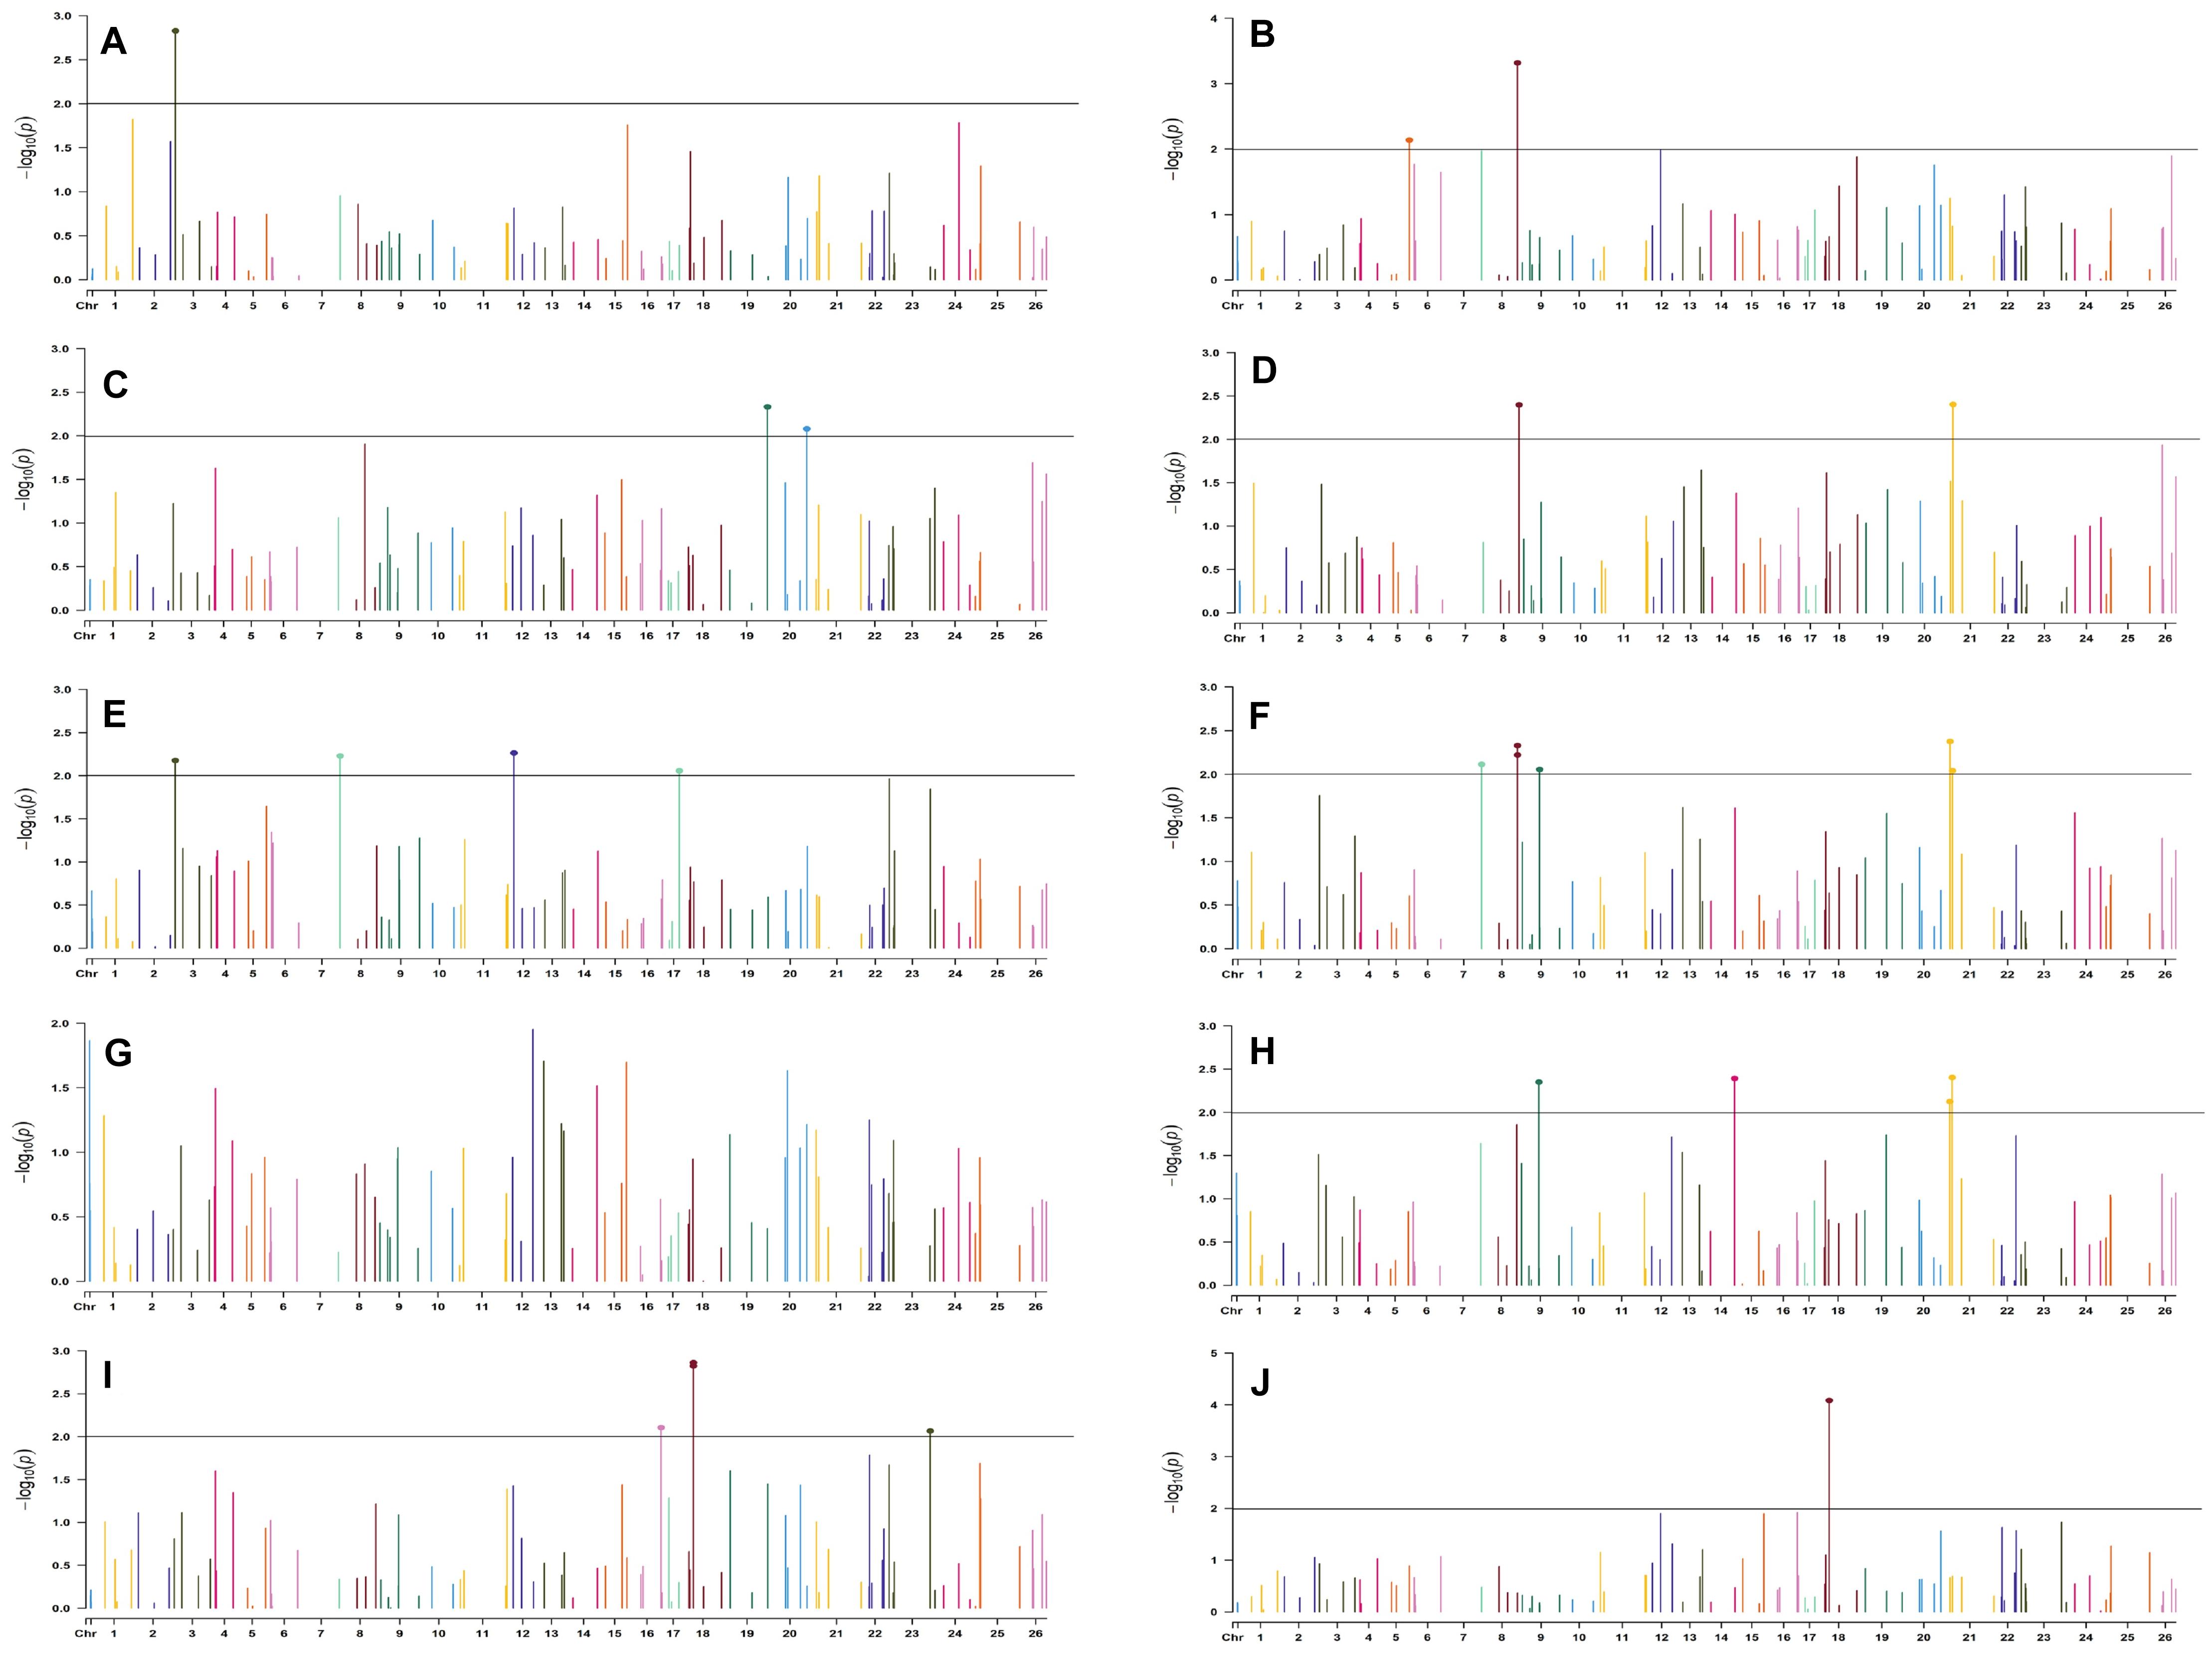
Figure 10. Manhattan plots for the late sown environment of 2019 for various traits under study by the MLMM model. Significant marker above threshold {at –log10 (p) > 2} is highlighted with bold dot head on the marker’s line. (A) Days to first flower, (B) plant height, (C) number of monopods, (D) number of bolls per plant, (E) boll weight, (F) seed cotton yield per plant, (G) ginning out turn, (H) lint yield, (I) seed index, and (J) lint index.
In the late sown-2018 environment, markers BNL3261 (with GOT, SI, and LI) and CGR5452 (with PH and NM) on chromosome 12, BNL3452 (NB and SI) mapped on chromosome 19, BNL1681 (NB, SI, SCY/P, and LY) on chromosome 1, BNL4108 (NM, SI, and LI) on chromosome 6, BNL448 (with BW and LI) on chromosome 20, BNL3279 (with SCY and LY) on chromosome 3, CGR5161(with NM and LI) on chromosome 8, BNL3099 (PH and SCY) on chromosome 9, and BNL2590 (SI and LI) on chromosome 15 were significantly associated with two or more traits. However, in the late sown-2019 environment, BNL1066 (with NB, SCY/P, and LI), BNL3441 (with DF, PH, and BW), and BNL3279 (with SCY/P and LI) on chromosome 3; BNL2847 (with SCY and LY) and BNL3099 (with GOT and LY) on chromosome 9; BNL686 (with DF, SI, and LI) on chromosome 15; BNL4035 (with SI and LI) on chromosome 18; BNL3482 (with NM and LI) on chromosome 20; BNL3257 (with PH, NB, and SCY/P) on chromosome 8; BNL3368 (with NB, SCY/P, and LY) on chromosome 26; and BNL3976 (associated to BW, SI, and SCY/P) located on chromosome 7 were significantly associated with more than one trait. Fifteen markers, viz. BN448, BNL4035, BNL3261, BNL3998, BNL1066, BNL3257, BNL1551, BNL2590, BNL3279, BNL3441, BNL3502, BNL3976, BNL4035, BNL686, and BNL3099, were found to be common in the late sown environment of both the years.
To find out MTAs with high confidence, we have identified some markers comparing the results of all six environments and MTAs, which were common to at least two environments and were reported as promising MTAs. Twenty-five markers were found to be involved in 38 significant MTAs at p < 0.01, which were common to at least two environments (Table 3). Nine markers, viz. CGR5732 (NB, SI, and SCY/P) on chromosome 19, BNL3976 (BW and SI) on chromosome 7, BNL3257 (NB and SCY/P) on chromosome 8, BNL4108 (SI and LI) on chromosome 6, BNL3479 (SCY and LY) on chromosome 13, JESPR220 (SCY and LY) on chromosome 20, BNL1721 (NB and LY) on chromosome 18, BNL3423 (GOT and LI) on chromosome 12, and BNL3279 (NB, SCY, and LY) on chromosome 3 were significantly associated with more than one trait at p < 0.01.
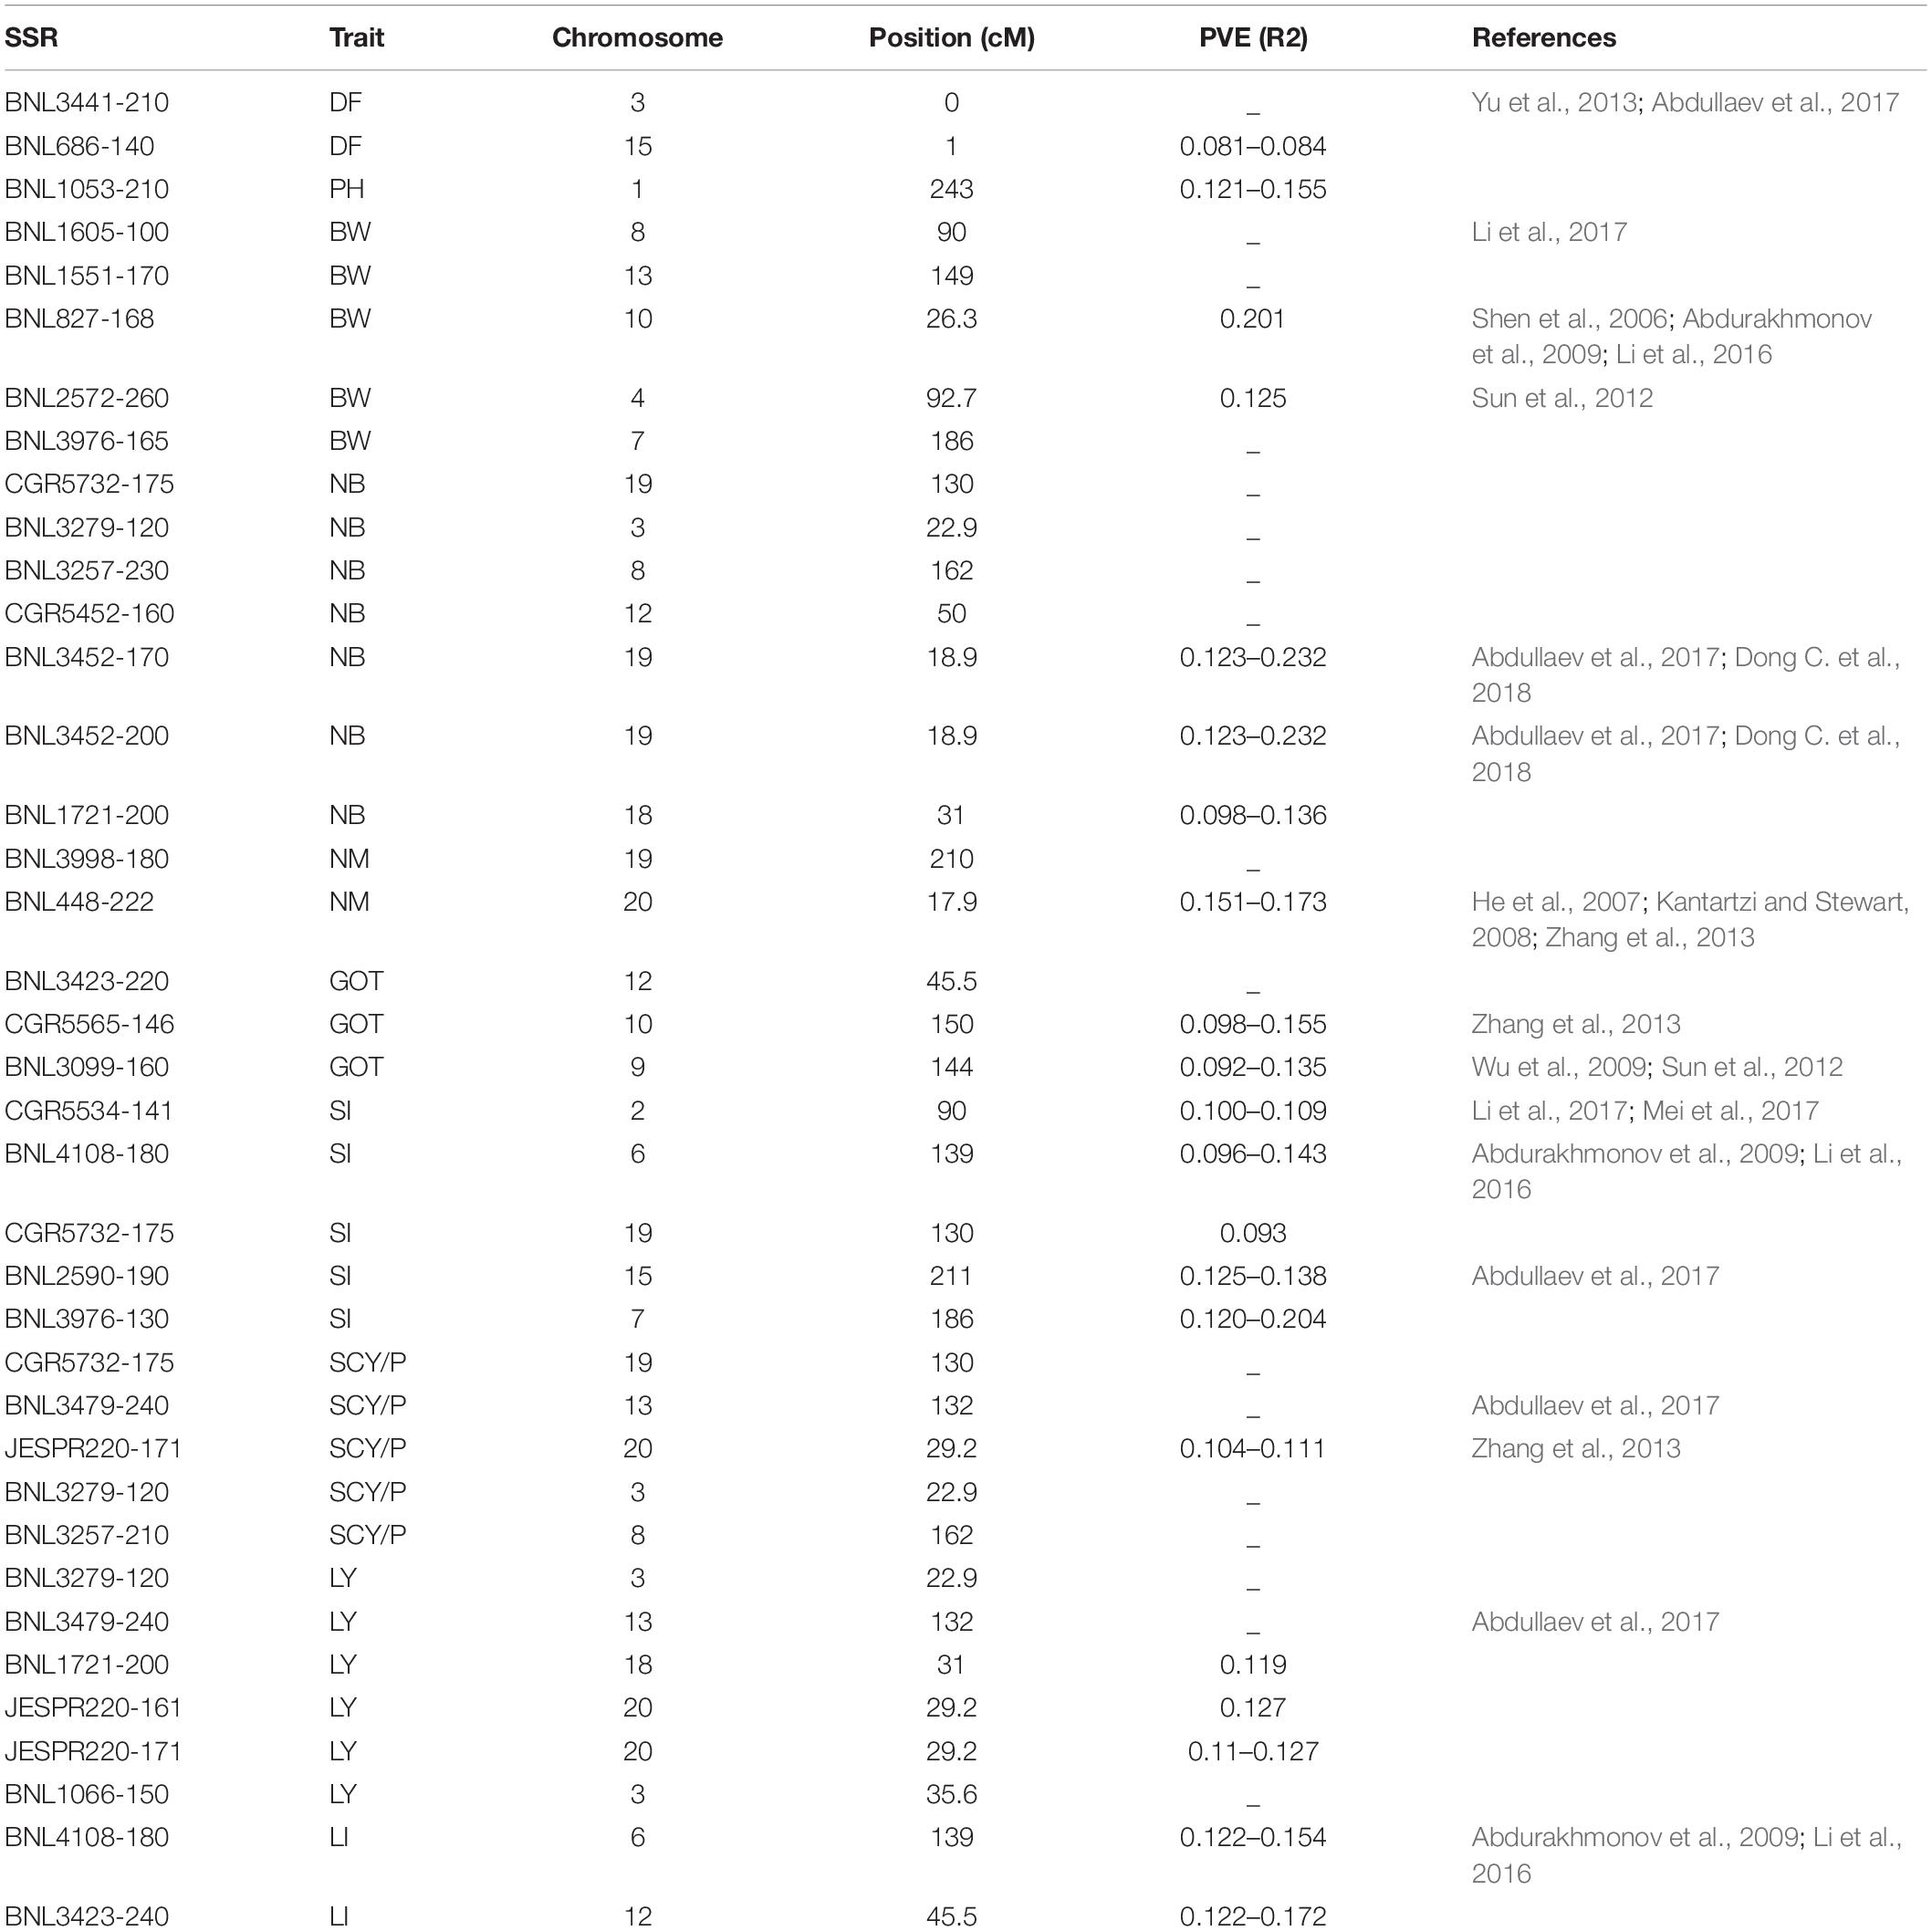
Table 3. List of significant marker–trait associations which were common to at least two environments.
Out of 38 high confidence markers, 22 MTAs were identified as novel. A number of markers significantly associated with lint yield and its contributing traits have shown linkage or pleiotropic effect in the present study (Table 4).
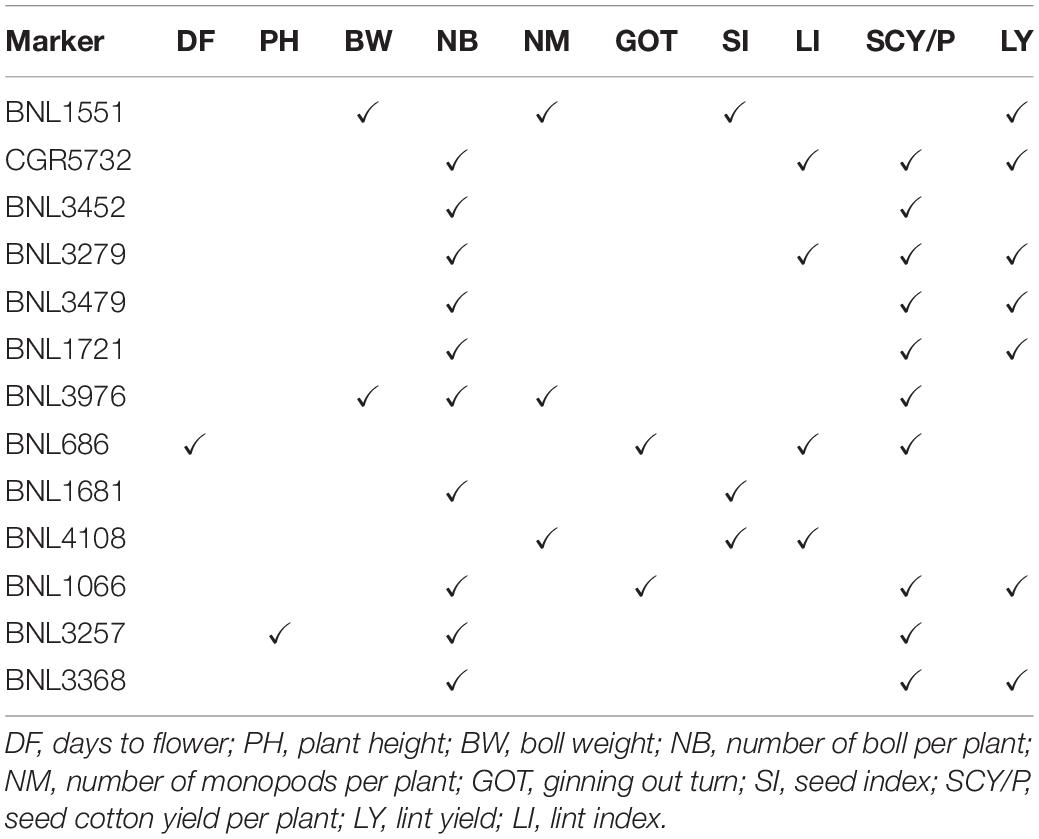
Table 4. List of markers having linkage and pleiotropic effect (i.e., significantly associated to two or more traits).
Significant MTAs linked to various traits were further analyzed by identifying the genes and their functions. Moreover, locations of the associated genes were identified using the reference genome of G. hirsutum available at COTTONGEN resource (see footnote 1). It showed that out of 25 markers identified (Table 3), 10 markers could be properly annotated with underlying candidate genes and their functions (Table 5).
The selection of a highly diverse germplasm or genotype panel is the key requirement for the success of any association mapping study. Statistical analysis (ANOVA) of seed cotton yield and its contributing traits in the present study showed that significant variation was present between genotypes and the date of sowing had also affected the performance of genotypes. Except for NM, all other traits had varied significantly in different sowing environments. It further suggests that a suitable genotype panel has been selected for the study. Buttar et al. (2010) also reported that NM, sympods, and plant height could not vary significantly in different sowing environments. Zhao et al. (2012) and Jamro et al. (2017) also reported similar type of results. It showed that the performance and productivity of upland cotton can be higher when the crop is sown on or before the normal sowing time (before May 10). Variation for means and range of LY and its contributing traits in the same sowing environments of 2 years was at par as compared with different sowing environments of the same year. A similar pattern of variation has been reported in previous studies for upland cotton (Bozbek et al., 2006; Khan et al., 2017). Estimation of phenotypic correlation among the recorded traits showed that seed cotton yield has a significant and highly positive correlation with BW and NB irrespective of the environment. So, the selection for these two traits in yield improvement program will increase the lint yield. Similar patterns of correlation were reported in previous studies by Ul-Allah et al. (2017), Kumar et al. (2019), and Mahdi and Emam (2020). Results of ANOVA, the performance of genotypes in all six environments, and correlation among the quantitative traits gave the assurance to proceed further with the present panel of genotypes for the association mapping.
The PIC value for 97 polymorphic SSR markers ranged from 0.126 (NAU1093) to 0.693 (BNL1721), with an average value of 0.485, which was higher as reported by Ersoz et al. (2007), Kalivas et al. (2011), Wang et al. (2011), Zhao et al. (2014), Qin et al. (2015), and Nie et al. (2016). Range (0.126–0.693) and average (0.485) of PIC showed that the panel of markers used in the present study was sufficient to explore the genetic variation among the genotypes of the present study. PIC value was in agreement with the results of Tu et al. (2014) (0.46), Wang et al. (2016) (0.47), and Dong C. G. et al. (2018) (0.48). All 97 polymorphic markers were distributed over 26 chromosomes with an average of 3.73 markers per chromosome. Markers were equally distributed on both of the genomes (A and D) of tetraploid G. hirsutum. A total of 47 (i.e., 48%) and 50 (i.e., 52%) SSR markers were located over all the 13 chromosomes of A- and D-genome each, respectively. A total of 293 different alleles were amplified by the present panel of SSRs, ranging from 2 to 5 alleles per marker with an average value of 3.020 alleles per marker, which is lower than as reported by Abdullaev et al. (2017) and Baytar et al. (2017). The results for the number of alleles for markers depend on the panel of germplasm, but these are also highly affected even by the methods used for screening of results like PAGE, AGE, MAZE, micro-capillary, etc. Results of the present study were in accordance with Fang et al. (2013); Jia et al. (2014), and Zhao et al. (2014). This diversity is highly useful for plant breeders while selecting the genotypes for varietal or hybrid development. Genotypes that were highly diverse at the molecular level too will give a more heterotic effect in their F1 hybrids. Results are in accordance with previous reports as genotypes or lines from different origins showed higher genetic distance as compared with genotypes of origin (Fang et al., 2013; Mei et al., 2013; Nie et al., 2016; Kaur et al., 2017). Though the panel of genotypes in the current study is limited to Indian origin only, still it has enough diversity to proceed further.
AMOVA showed that higher variation is present among the genotypes as compared to between the groups. A similar fashion of variation was reported in previous studies as, for example, higher variation within the genotypes of a group was reported by Abdurakhmonov et al. (2008) (96.7%), Zhao et al. (2015) (86%), Nie et al. (2016) (96%), Tyagi et al. (2014) (65.8%), Jena et al. (2012) (70.8%), and Kaur et al. (2017) (66.7%). AMOVA and other genetic diversity analyses showed that genotypes used in the present study are diverse and could be used in the cotton development program.
By using the results obtained from STRUCTURE analysis, the maximum likelihood value of ΔK was recorded for K = 2 followed by K = 9 and K = 3. So, the genotypes were grouped into two sub-groups. The reason for a smaller number of significant clusters might be the same geographical origin of most of the genotypes in the present study and close ancestral history. Mei et al. (2013); Cai et al. (2014), and Song et al. (2019) reported the highest likelihood score at ΔK = 2 and obtained clusters with large germplasms grouping into two clusters, while Jena et al. (2012), Tyagi et al. (2014), Badigannavar and Myers (2015), Kaur et al. (2017), and Seyoum et al. (2018) reported likelihood score at K = 3 or more and clustered the genotype panels accordingly.
Significant linkage was obtained for 151 marker pairs (3.24%) at r2 ≥ 0.1 and for 514 markers pairs (11.04%) at r2 ≥ 0.05, which were similar to results as reported in previous studies by Cai et al. (2014), Li et al. (2016), Iqbal and Rahman (2017). The collinear LD was concentrated on chromosomes 9, 13, and 23. The presence of larger LD blocks in triangle plots for pairwise LD might be due to selection pressure on the genotypes or varieties in breeding programs for specific desirable traits. In north Indian regions, the extent of cross-pollination in cotton is much lesser, which possibly may have reduced the frequency of recombination.
Association between seed cotton yield traits and SSR markers was estimated by three different models, which are MLMM, CMLM, and MLM, so that the model that best fits the results of association mapping could be identified. The strategy of using two or more different models for detection of favorable MTAs in cotton has been practiced previously in several studies (Badigannavar and Myers, 2015; Wang et al., 2016; Abdullaev et al., 2017; Baytar et al., 2017; Sethi et al., 2017), and comparative results of those models were considered. Confirmation of MTAs with different models over the different environmental conditions gave more confidence in the results and reduces the chances of false association. The results of LD for 97 SSRs were motivation to proceed to association mapping as, previously, Cai et al. (2014) conducted the association mapping using 99 polymorphic SSR markers in G. hirsutum and Abdullaev et al. (2017) conducted the same association mapping analysis in G. barbadense using 108 polymorphic SSR markers. Recently, several other association studies were also conducted using a low number of markers and genotypes in the cotton. Badigannavar and Myers (2015) used 64 polymorphic primer combinations to detect association for seed quality traits in 75 upland cotton germplasm, Iqbal and Rahman (2017) used 95 polymorphic SSRs to detect the association for fiber quality traits in upland cotton, and Ali et al. (2020) used 22 markers to detect association for yield contributing traits in 28 genotypes of upland cotton.
Thirty-eight significant MTAs for lint yield and its contributing traits (which were common to at least two environments) were considered promising MTAs. Out of these 38 MTAs, 16 were in agreement with previous studies, either for the same or for different traits of cotton. A total of 22 MTAs identified in the present study were found to be novel. Fifteen markers had also shown linkage or pleiotropic effect in this study. Among 38 promising markers, CGR5732 showed significant association with number of bolls per plant, seed index, and seed cotton yield per plant. BNL3257 was reported to be significantly associated with number of bolls per plant and seed cotton yield per plant. BNL3976 was found to be significantly associated with boll weight and seed index. BNL3279 showed significant association with number of bolls per plant, seed cotton yield per plant, and lint yield. BNL3423 showed significant association with ginning out turn and lint index and JESPR220 with seed cotton yield per plant and lint yield. Out of these four markers, BNL3279 had been reported to be associated with fiber quality traits in previous studies by Abdullaev et al. (2017) and Dong C. G. et al. (2018). Markers associated with fiber quality in previous studies were found to be associated with seed cotton yield contributing traits in the present study. It had shown that SSR markers used for seed cotton yield contributing traits could also be helping in fiber quality trait improvement simultaneously. In earlier studies (Iqbal and Rahman, 2017; Zhang et al., 2020), it has been reported that SSR markers associated with boll weight, number of bolls per plant, and ginning out turn were also significantly associated with fiber quality traits.
A number of markers significantly associated with lint yield and its contributing traits have shown linkage and pleiotropic effect in the present study. These markers could be used in other studies too for the screening of lint- and fiber-related traits. SSR markers have shown similar linkage and pleiotropic effect in previous studies of Abdullaev et al. (2017), Iqbal and Rahman (2017), and Zhang et al. (2020). Use of these markers showing linkage and pleiotropic effect in cotton will be very helpful in the screening of progenies in crop improvement programs specific to yield and other yield attributing traits.
Marker BNL3279 associated with traits like NB and SCY/P was found to be linked to gene Gh_A11G2619, which produces Glyceraldehyde/Erythrose phosphate dehydrogenase family (Zhang et al., 2015) and helps in fruit development in plants. BNL3479 associated with NB and SCY/P was found to be linked to gene Gh_D13G1262, which produces Glycosyltransferase family 10 (fucosyltransferase) and helps in cell wall biosynthesis (Hansen et al., 2012). BNL3998 associated with traits like NM and GOT was found to be linked to gene Gh_D05G1102, which synthesizes serine-threonine/tyrosine-protein kinase catalytic domain. Marker BNL1551 associated with BW, NM, and SI was found to be linked to gene Gh_D11G262 synthesizing XRN 5′-3′ exonuclease N-terminus (Zinc finger CCHC-type profile), which is a multifunction protein (Kastenmayer and Green, 2000). Marker CGR5565 associated to GOT and SI was found to be linked to gene Gh_A10G0216, which produces a domain family that is part of the cupin metalloenzyme superfamily and which has been reported to be involved in the growth and development of plants (Dunwell et al., 2004). Marker BNL3423 associated with GOT was found to be associated with Gene Gh_A12G2146, which produces proteins of Lin-54 family required for cell cycle progress (Schmit et al., 2009). Results of annotation showed that markers found in MTAs and linked to functional genes need fine mapping and further research for more authenticity in the results and further use of these markers in the crop improvement programs.
LD-based association mapping was conducted in 96 genotypes of upland cotton with 97 polymorphic markers. Extensive phenotyping of studied genotypes in different sown environments for two consecutive years showed that significant variation was available among the genotypes for lint yield and its attributing traits. Based on molecular variation detected by 97 polymorphic markers, all genotypes were significantly divided into two clusters. Association mapping done by the three most appropriate methods detected the number of markers associated with different traits of the study. Out of 38 promising MTAs identified in the present study, 22 SSR alleles were considered as novel while the remaining marker alleles were in agreement with previous studies. Annotation of the markers with functional genes showed that the outcome of the present study will help in the genetic improvement of lint yield in crop improvement programs.
The raw data supporting the conclusions of this article will be made available by the authors, without undue reservation.
PK conducted the research and wrote the manuscript. SN and RS supervised the research and reviewed the manuscript. NB and DM analyzed the data and reviewed the manuscript. VS, Sagar, and RC assisted in wet lab work and gave their suggestions in the manuscript. All the authors contributed to the article and approved the submitted version.
The authors declare that the research was conducted in the absence of any commercial or financial relationships that could be construed as a potential conflict of interest.
The authors gratefully acknowledge Dr. Shiwani Mandhania (Assistant Biochemist), Dr. Mukesh Kumar (Assistant Professor), Department of Genetics and Plant Breeding, and Dr. Rakesh Poonia (Assistant Scientist), Department of Plant Pathology, for their assistance and help to conduct the molecular work in their laboratories.
The Supplementary Material for this article can be found online at: https://www.frontiersin.org/articles/10.3389/fpls.2021.653270/full#supplementary-material
Abdullaev, A. A., Salakhutdinov, I. B., Egamberdiev, S. S., Khurshut, E. E., Rizaeva, S. M., Ulloa, M., et al. (2017). Genetic diversity, linkage disequilibrium and association mapping analyses of Gossypium barbadense L. germplasm. PLoS One 12:e0188125. doi: 10.1371/journal.pone.0188125
Abdurakhmonov, I. Y., Kohel, R. J., Yu, J. Z., Pepper, A. E., Abdullaev, A. A., Kushanov, F. N., et al. (2008). Molecular diversity and association mapping of fiber quality traits in exotic G. hirsutum L. germplasm. Genomics 92, 478–487. doi: 10.1016/j.ygeno.2008.07.013
Abdurakhmonov, I. Y., Kohel, R. J., Yu, J. Z., Pepper, A. E., Abdullaev, A. A., Kushanov, F. N., et al. (2009). Linkage disequilibrium based association mapping of fiber quality traits in G. hirsutum L. variety germplasm. Genetica 136, 401–417. doi: 10.1007/s10709-008-9337-8
Ademe, M. S., He, S., Pan, Z., Sun, J., Wang, Q., Qin, H., et al. (2017). Association mapping analysis of fiber yield and quality traits in Upland cotton (Gossypium hirsutum L.). Mol. Genet. Genomics. 292, 1267–1280. doi: 10.1007/s00438-017-1346-9
Ali, I., Khan, N. U., Gul, S., Khan, S. U., Tahir, I., Bibi, Z., et al. (2020). Association mapping of QTLs with yield and lint traits in elite upland cotton germplasm. Int. J. Agric. Biol. 24, 17–28. doi: 10.17957/IJAB/15.1403
Badigannavar, A., and Myers, G. O. (2015). Genetic diversity, population structure and marker trait associations for seed quality traits in cotton (Gossypium hirsutum). J. Genet. 94, 87–94. doi: 10.1007/s12041-015-0489-x
Baytar, A. A., Erdogan, O., Frary, A., Frary, A., and Doganlar, S. (2017). Molecular diversity and identification of alleles for Verticillium wilt resistance in elite cotton (Gossypium hirsutum L.) germplasm. Euphytica 213:31. doi: 10.1007/s10681-016-1787-y
Bozbek, T., Sezener, V., and Unay, A. (2006). The effect of sowing date and plant density on cotton yield. J. Agron. 5, 122–125. doi: 10.3923/ja.2006.122.125
Bradbury, P. J., Zhang, Z., Kroon, D. E., Casstevens, T. M., Ramdoss, Y., and Buckler, E. S. (2007). TASSEL: software for association mapping of complex traits in diverse samples. Bioinformatics 23, 2633–2635. doi: 10.1093/bioinformatics/btm308
Buttar, G. S., Paramjit, S., and Parminder, K. (2010). Influence of date of sowing on the performance of American cotton (Gossypium hirsutum L.) genotypes under semi-arid region of Punjab. J. Cotton Res. 24, 56–58.
Cai, C., Ye, W., Zhang, T., and Guo, W. (2014). Association analysis of fiber quality traits and exploration of elite alleles in Upland cotton cultivars/genotypes (Gossypium hirsutum L.). J. Integr. Plant Biol. 56, 51–62. doi: 10.1111/jipb.12124
Dong, C., Wang, J., Chen, Q., Yu, Y., and Li, B. (2018). Detection of favorable alleles for yield and yield components by association mapping in upland cotton. Genes & genomics 40, 725–734. doi: 10.1007/s13258-018-0678-0
Dong, C. G., Wang, J., Yu, Y., Li, B. C., and Chen, Q. J. (2018). Association mapping and favourable QTL alleles for fibre quality traits in Upland cotton (Gossypium hirsutum L.). J. Genet. 97, 1–12. doi: 10.1007/s12041-017-0878-4
Dunwell, J. M., Purvis, A., and Khuri, S. (2004). Cupins: the most functionally diverse protein superfamily? Phytochemistry 65, 7–17. doi: 10.1016/j.phytochem.2003.08.016
Earl, D. A. (2012). STRUCTURE HARVESTER: a website and program for visualizing STRUCTURE output and implementing the Evanno method. Conserv. Genet. Resour. 4, 359–361. doi: 10.1007/s12686-011-9548-7
Ersoz, E. S., Yu, J., and Buckler, E. S. (2007). Applications of Linkage Disequilibrium and Association Mapping in Crop Plants. Genomics-Assisted Crop Improvement. Dordrecht: Springer, 97–119.
Evanno, G., Regnaut, S., and Goudet, J. (2005). Detecting the number of clusters of individuals using the software STRUCTURE: a simulation study. Mol. Ecol. 14, 2611–2620. doi: 10.1111/j.1365-294X.2005.02553.x
Fang, D. D., Hinze, L. L., Percy, R. G., Li, P., Deng, D., and Thyssen, G. (2013). A microsatellite-based genome-wide analysis of genetic diversity and linkage disequilibrium in Upland cotton (Gossypium hirsutum L.) cultivars from major cotton-growing countries. Euphytica 191, 391–401. doi: 10.1007/s10681-013-0886-2
Flint-Garcia, S. A., Thornsberry, J. M., and Buckler, E. S. IV (2003). Structure of linkage disequilibrium in plants. Annu. Rev. Plant Biol. 54, 357–374. doi: 10.1146/annurev.arplant.54.031902.134907
Hansen, M., Kraft, T., Ganestam, S., SAeLL, T., and Nilsson, N. O. (2001). Linkage disequilibrium mapping of the bolting gene in sea beet using AFLP markers. Genet. Res. 77, 61–66. doi: 10.1017/S0016672300004857
Hansen, S. F., Harholt, J., Oikawa, A., and Scheller, H. V. (2012). Plant glycosyltransferases beyond CAZy: a perspective on DUF families. Front. Plant Sci. 3:59. doi: 10.3389/fpls.2012.00059
He, D. H., Lin, Z. X., Zhang, X. L., Nie, Y. C., Guo, X. P., Zhang, Y. X., et al. (2007). QTL mapping for economic traits based on a dense genetic map of cotton with PCR-based markers using the interspecific cross of Gossypium hirsutum× Gossypium barbadense. Euphytica 153, 181–197. doi: 10.1007/s10681-006-9254-9
Huang, C., Shen, C., Wen, T., Gao, B., Zhu, D., Li, X., et al. (2018). SSR-based association mapping of fiber quality in upland cotton using an eight-way MAGIC population. Mol. Genet. Genom. 293, 793–805. doi: 10.1007/s00438-018-1419-4
ICAR-AICRP (2019–2020). ICAR-AICRP (Cotton) Annual Report, ICAR – All India Coordinated Research Project on Cotton, Coimbatore, Tamil Nadu, India - 641 003. Available online at: http://www.aiccip.cicr.org.in (accessed April 23, 2020).
Iqbal, M. A., and Rahman, M. U. (2017). Identification of marker-trait associations for lint traits in cotton. Front. Plant Sci. 8:86. doi: 10.3389/fpls.2017.00086
Jamro, S. A., Ali, M. U., Buriro, M., Ahmad, M. I., Jamro, G. M., Khan, A., et al. (2017). Impact of various sowing dates on growth and yield parameters of different cotton varieties. J. Appl. Environ. Biol. Sci. 7, 135–143.
Jannink, J. L., and Walsh, B. (2002). “Association mapping in plant populations,” in Quantitative Genetics, Genomics and Plant Breeding, ed. M. S. Kang (Oxford: CAB International), 59–68. doi: 10.1079/9780851996011.0059
Jannink, J. L., Bink, M. C., and Jansen, R. C. (2001). Using complex plant pedigrees to map valuable genes. Trends Plant Sci. 6, 337–342. doi: 10.1016/S1360-1385(01)02017-9
Jena, S. N., Srivastava, A., Singh, U. M., Roy, S., Banerjee, N., Rai, K. M., et al. (2012). Analysis of genetic diversity, population structure and linkage disequilibrium in elite cotton (Gossypium L.) germplasm in India. Crop Pasture Sci. 62, 859–875. doi: 10.1071/CP11161
Jia, Y. H., Sun, J. L., Wang, X. W., Zhou, Z. L., Pan, Z. E., He, S. P., et al. (2014). Molecular diversity and association analysis of drought and salt tolerance in Gossypium hirsutum L. germplasm. J. Integr. Agric. 13, 1845–1853. doi: 10.1016/S2095-3119(13)60668-1
Kalivas, A., Xanthopoulos, F., Kehagia, O., and Tsaftaris, A. S. (2011). Agronomic characterization, genetic diversity and association analysis of cotton cultivars using simple sequence repeat molecular markers. Genet. Mol. Res. 10, 208–217. doi: 10.4238/vol10-1gmr998
Kantartzi, S. K., and Stewart, J. M. (2008). Association analysis of fibre traits in Gossypium arboreum genotypes. Plant Breed. 127, 173–179. doi: 10.1111/j.1439-0523.2008.01490.x
Kastenmayer, J. P., and Green, P. J. (2000). Novel features of the XRN-family in Arabidopsis: evidence that AtXRN4, one of several orthologs of nuclear Xrn2p/Rat1p, functions in the cytoplasm. Proc. Natl. Acad. Sci. U.S.A. 97, 13985–13990. doi: 10.1073/pnas.97.25.13985
Kaur, B., Tyagi, P., and Kuraparthy, V. (2017). Genetic diversity and population structure in the landrace genotypes of Gossypium hirsutum. Crop Sci. 57, 2457–2470. doi: 10.2135/cropsci2016.12.0999
Khan, A., Najeeb, U., Wang, L., Tan, D. K. Y., Yang, G., Munsif, F., et al. (2017). Planting density and sowing date strongly influence growth and lint yield of cotton crops. Field Crops Res. 209, 129–135. doi: 10.1016/j.fcr.2017.04.019
Kraakman, A. T. W., Martinez, F., Mussiraliev, B., Van Eeuwijk, F. A., and Niks, R. E. (2006). Linkage disequilibrium mapping of morphological, resistance, and other agronomically relevant traits in modern spring barley cultivars. Mol. Breed. 17, 41–58. doi: 10.1007/s11032-005-1119-8
Kraakman, A. T., Niks, R. E., Van den Berg, P. M., Stam, P., and Van Eeuwijk, F. A. (2004). Linkage disequilibrium mapping of yield and yield stability in modern spring barley cultivars. Genetics 168, 435–446. doi: 10.1534/genetics.104.026831
Kumar, C. P. S., Prasad, V., Rajan, R. E. B., Joshi, J. L., and Thirugnanakumar, S. (2019). Studies on correlation and path-coefficient analysis for seed cotton yield and its contributing traits in cotton (Gossypium hirsutum l.). Plant Arch. 19, 683–686.
Li, C. Q., Ai, N. J., Zhu, Y. J., Wang, Y. Q., Chen, X. D., Li, F., et al. (2016). Association mapping and favourable allele exploration for plant architecture traits in upland cotton (Gossypium hirsutum L.) accessions. J. Agri. Sci. 154:567. doi: 10.1017/S0021859615000428
Li, C. Q., Song, L., Zhu, Y. J., Zhai, Y. J., and Wang, Q. L. (2017). Genetic diversity assessment of upland cotton variety resources in china based on phenotype traits and molecular markers. Crop Sci. 57, 290–301. doi: 10.2135/cropsci2016.03.0200
Lipka, A. E., Tian, F., Wang, Q., Peiffer, J., Li, M., Bradbury, P. J., et al. (2012). GAPIT: genome association and prediction integrated tool. Bioinformatics 28, 2397–2399. doi: 10.1093/bioinformatics/bts444
Liu, K., and Muse, S. V. (2005). PowerMarker: an integrated analysis environment for genetic marker analysis. Bioinformatics 21, 2128–2129. doi: 10.1093/bioinformatics/bti282
Mahdi, A. H. A., and Emam, S. M. (2020). Correlation and path coefficient analysis of some earliness measures in egyptian cotton. J. Plant Prod. 11, 407–501. doi: 10.21608/JPP.2020.102754
Mei, H., Zhu, X., and Zhang, T. (2013). Favorable QTL alleles for yield and its components identified by association mapping in Chinese Upland cotton cultivars. PLoS One 8:e82193. doi: 10.1371/journal.pone.0082193
Mei, Y., Yu, J., Xue, A., Fan, S., Song, M., Pang, C., et al. (2017). Dissecting genetic network of fruit branch traits in upland cotton by association mapping using SSR markers. PLoS One 12:e0162815. doi: 10.1371/journal.pone.0162815
Nei, M., and Li, W. H. (1979). Mathematical model for studying genetic variation in terms of restriction endonucleases. PNAS 76, 5269–5273. doi: 10.1073/pnas.76.10.5269
Nie, X., Huang, C., You, C., Li, W., Zhao, W., Shen, C., et al. (2016). Genome-wide SSR-based association mapping for fiber quality in nation-wide upland cotton inbreed cultivars in China. BMC Genom. 17:2662. doi: 10.1186/s12864-016-2662-x
Peakall, R. O. D., and Smouse, P. E. (2006). GENALEX 6: genetic analysis in Excel. Population genetic software for teaching and research. Mol. Ecol. Notes 6, 288–295. doi: 10.1111/j.1471-8286.2005.01155.x
Pritchard, J. K., Stephens, M., Rosenberg, N. A., and Donnelly, P. (2000). Association mapping in structured populations. Am. J. Hum. Genet. 67, 170–181. doi: 10.1086/302959
Qin, H., Chen, M., Yi, X., Bie, S., Zhang, C., Zhang, Y., et al. (2015). Identification of associated SSR markers for yield component and fiber quality traits based on frame map and upland cotton collections. PLoS One 10:e0118073. doi: 10.1371/journal.pone.0118073
R Core Team (2019). R: A Language and Environment for Statistical Computing. Vienna: R Foundation for Statistical Computing.
Saghai-Maroof, M. A., Soliman, K. M., Jorgensen, R. A., and Allard, R. W. L. (1984). Ribosomal DNA spacer-length polymorphisms in barley: mendelian inheritance, chromosomal location, and population dynamics. Proc. Natl. Acad. Sci. U.S.A. 81, 8014–8018. doi: 10.1073/pnas.81.24.8014
Schmit, F., Cremer, S., and Gaubatz, S. (2009). LIN54 is an essential core subunit of the DREAM/LINC complex that binds to the cdc2 promoter in a sequence−specific manner. FEBS J. 276, 5703–5716. doi: 10.1111/j.1742-4658.2009.07261.x
Sethi, K., Siwach, P., and Verma, S. K. (2017). Linkage disequilibrium and association mapping of fibre quality traits in elite Asiatic cotton (Gossypium arboreum) germplasm populations. Czech J. Genet. Plant Breed. 53, 159–167. doi: 10.17221/142/2016-CJGPB
Seyoum, M., Du, X. M., He, S. P., Jia, Y. H., Pan, Z., and Sun, J. L. (2018). Analysis of genetic diversity and population structure in upland cotton (Gossypium hirsutum L.) germplasm using simple sequence repeats. J. Genet. 97, 513–522. doi: 10.1007/s12041-018-0943-7
Shen, X., Zhang, T., Guo, W., Zhu, X., and Zhang, X. (2006). Mapping fiber and yield QTLs with main, epistatic, and QTL× environment interaction effects in recombinant inbred lines of upland cotton. Crop Sci. 46, 61–66. doi: 10.2135/cropsci2005.0056
Song, C., Li, W., Pei, X., Liu, Y., Ren, Z., He, K., et al. (2019). Dissection of the genetic variation and candidate genes of lint percentage by a genome-wide association study in upland cotton. Theor. Appl. Genet. 132, 1991–2002. doi: 10.1007/s00122-019-03333-0
Stich, B., Maurer, H. P., Melchinger, A. E., Frisch, M., Heckenberger, M., van der Voort, J. R., et al. (2006). Comparison of linkage disequilibrium in elite European maize inbred lines using AFLP and SSR markers. Mol. Breed. 17, 217–226. doi: 10.1007/s11032-005-5296-2
Sun, F. D., Zhang, J. H., Wang, S. F., Gong, W. K., Shi, Y. Z., Liu, A. Y., et al. (2012). QTL mapping for fiber quality traits across multiple generations and environments in upland cotton. Mol. Breed. 30, 569–582. doi: 10.1007/s11032-011-9645-z
Sun, H., Meng, M., Yan, Z., Lin, Z., Nie, X., and Yang, X. (2019). Genome-wide association mapping of stress-tolerance traits in cotton. Crop J. 7, 77–88. doi: 10.1016/j.cj.2018.11.002
Tu, J. L., Zhang, M. J., Wang, X. Q., Zhang, X., and Lin, Z. (2014). Genetic dissection of upland cotton (Gossypium hirsutum) cultivars developed in Hubei Province by mapped SSRs. Genet. Mol. Res. 13:90. doi: 10.4238/2014
Tyagi, P., Gore, M. A., Bowman, D. T., Campbell, B. T., Udall, J. A., and Kuraparthy, V. (2014). Genetic diversity and population structure in the US Upland cotton (Gossypium hirsutum L.). Theor. Appl. Genet. 127, 283–295. doi: 10.1007/s00122-013-2217-3
Ul-Allah, S., Iqbal, M., Naeem, M., and Zahid, W. (2017). Genetic dissection of association among within-boll yield components and their relationship with seed cotton yield in F3 populations of Gossypium hirsutum L. Plant Genet. Resour. 15, 157–164. doi: 10.1017/S1479262115000489
Van Esbroeck, G., and Bowman, D. T. (1998). Cotton germplasm diversity and its importance to cultivar development. J. Cotton Sci. 2, 121–129.
Wang, X. Q., Feng, C. H., Lin, Z. X., and Zhang, X. L. (2011). Genetic diversity of sea-island cotton (Gossypium barbadense) revealed by mapped SSRs. Genet. Mol. Res. 10, 3620–3631. doi: 10.4238/2011
Wang, Y. Y., Zhou, Z. L., Wang, X. X., Cai, X. Y., Li, X. N., Wang, C. Y., et al. (2016). Genome-wide association mapping of glyphosate-resistance in Gossypium hirsutum races. Euphytica 209, 209–221. doi: 10.1007/s10681-016-1663-9
Wu, J., Gutierrez, O. A., Jenkins, J. N., McCarty, J. C., and Zhu, J. (2009). Quantitative analysis and QTL mapping for agronomic and fiber traits in an RI population of upland cotton. Euphytica 165, 231–245. doi: 10.1007/s10681-008-9748-8
Yu, J., Zhang, K., Li, S., Yu, S., Zhai, H., Wu, M., et al. (2013). Mapping quantitative trait loci for lint yield and fiber quality across environments in a Gossypium hirsutum× Gossypium barbadense backcross inbred line population. Theor. Appl. Genet. 126, 275–287. doi: 10.1007/s00122-012-1980-x
Zhang, T. T., Zhang, N. Y., Li, W., Zhou, X. J., Pei, X. Y., Liu, Y. G., et al. (2020). Genetic structure, gene flow pattern, and association analysis of superior germplasm resources in domesticated Upland Cotton (Gossypium hirsutum L.). Plant Divers 42, 189–197. doi: 10.1016/j.pld.2020.03.001
Zhang, T., Hu, Y., Jiang, W., Fang, L., Guan, X., Chen, J., et al. (2015). Sequencing of allotetraploid cotton (Gossypium hirsutum L. acc. TM-1) provides a resource for fiber improvement. Nat. Biotechnol. 33, 531–537. doi: 10.1038/nbt.3207
Zhang, T., Qian, N., Zhu, X., Chen, H., Wang, S., Mei, H., et al. (2013). Variations and transmission of QTL alleles for yield and fiber qualities in upland cotton cultivars developed in China. PLoS One 8:e57220. doi: 10.1371/journal.pone.0057220
Zhao, W., Wang, Y., Shu, H., Li, J., and Zhou, Z. (2012). Sowing date and boll position affected boll weight, fiber quality and fiber physiological parameters in two cotton (Gossypium hirsutum L.) cultivars. Afr. J. Agric. Res. 7, 6073–6081. doi: 10.5897/AJAR12.025
Zhao, Y. L., Wang, H. M., Shao, B. X., Chen, W., Guo, Z. J., Gong, H. Y., et al. (2016). SSR-based association mapping of salt tolerance in cotton (Gossypium hirsutum L.). Genet. Mol. Res. 15:15027370. doi: 10.4238/gmr.15027370
Zhao, Y., Wang, H., Chen, W., and Li, Y. (2014). Genetic structure, linkage disequilibrium and association mapping of Verticillium wilt resistance in elite cotton (Gossypium hirsutum L.) germplasm population. PLoS One 9:e86308. doi: 10.1371/journal.pone.0086308
Keywords: association mapping, Gossypium hirsutum, lint yield, linkage disequilibrium, SSR, CMLM, MLMM
Citation: Kumar P, Nimbal S, Sangwan RS, Budhlakoti N, Singh V, Mishra DC, Sagar and Choudhary RR (2021) Identification of Novel Marker–Trait Associations for Lint Yield Contributing Traits in Upland Cotton (Gossypium hirsutum L.) Using SSRs. Front. Plant Sci. 12:653270. doi: 10.3389/fpls.2021.653270
Received: 14 January 2021; Accepted: 16 April 2021;
Published: 26 May 2021.
Edited by:
Soren K. Rasmussen, University of Copenhagen, DenmarkReviewed by:
Muhammad Saeed, Government College University Faisalabad, PakistanCopyright © 2021 Kumar, Nimbal, Sangwan, Budhlakoti, Singh, Mishra, Sagar and Choudhary. This is an open-access article distributed under the terms of the Creative Commons Attribution License (CC BY). The use, distribution or reproduction in other forums is permitted, provided the original author(s) and the copyright owner(s) are credited and that the original publication in this journal is cited, in accordance with accepted academic practice. No use, distribution or reproduction is permitted which does not comply with these terms.
*Correspondence: Somveer Nimbal, c25pbWJhbEBoYXUuYWMuaW4=
†Present address: Varsha Singh, Department of Plant and Soil Sciences, Mississippi State University, Starkville, MS, United States
Disclaimer: All claims expressed in this article are solely those of the authors and do not necessarily represent those of their affiliated organizations, or those of the publisher, the editors and the reviewers. Any product that may be evaluated in this article or claim that may be made by its manufacturer is not guaranteed or endorsed by the publisher.
Research integrity at Frontiers

Learn more about the work of our research integrity team to safeguard the quality of each article we publish.